Headlines
|
|
Wall Street analysts were concerned, now they're panicking:
Wall Street analysts spent the last week busy with downgrades. They were heavy downgraders of both price targets and earnings estimates among companies in the S&P 500. The 5-day sum of net revisions plunged to one of the lowest levels since 2010.
|
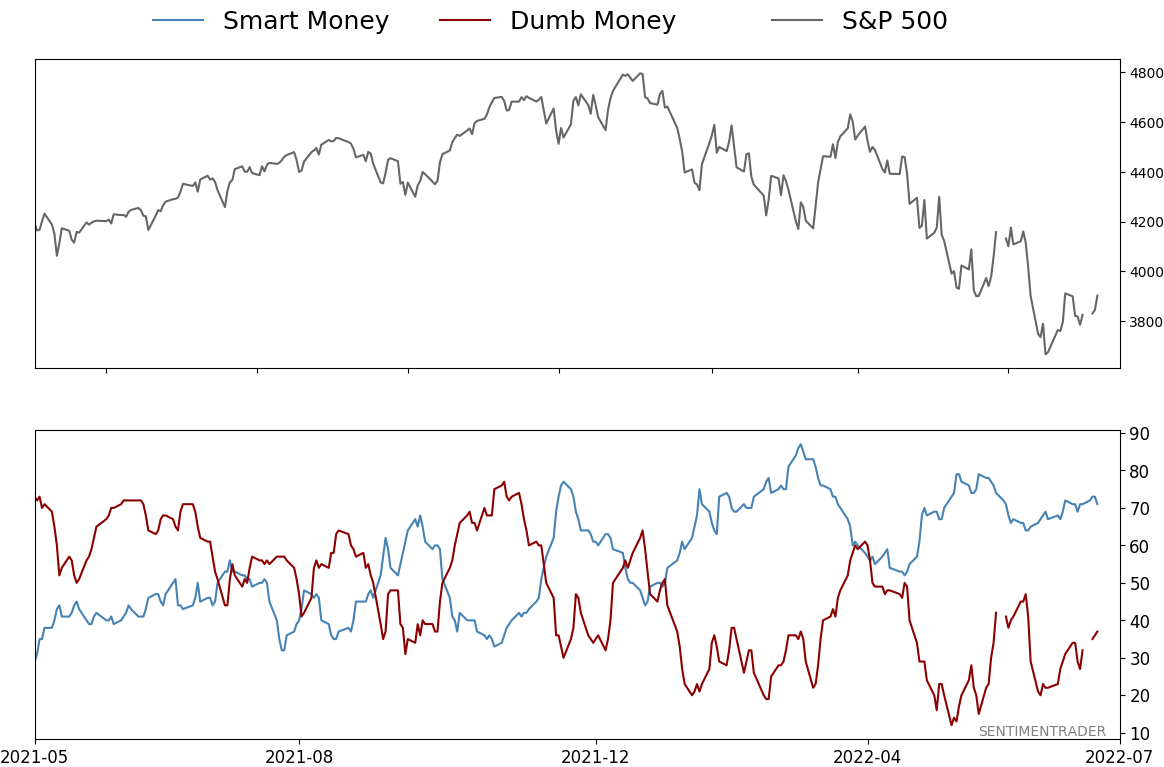
Smart / Dumb Money Confidence
|
Smart Money Confidence: 71%
Dumb Money Confidence: 38%
|
|
Risk Levels
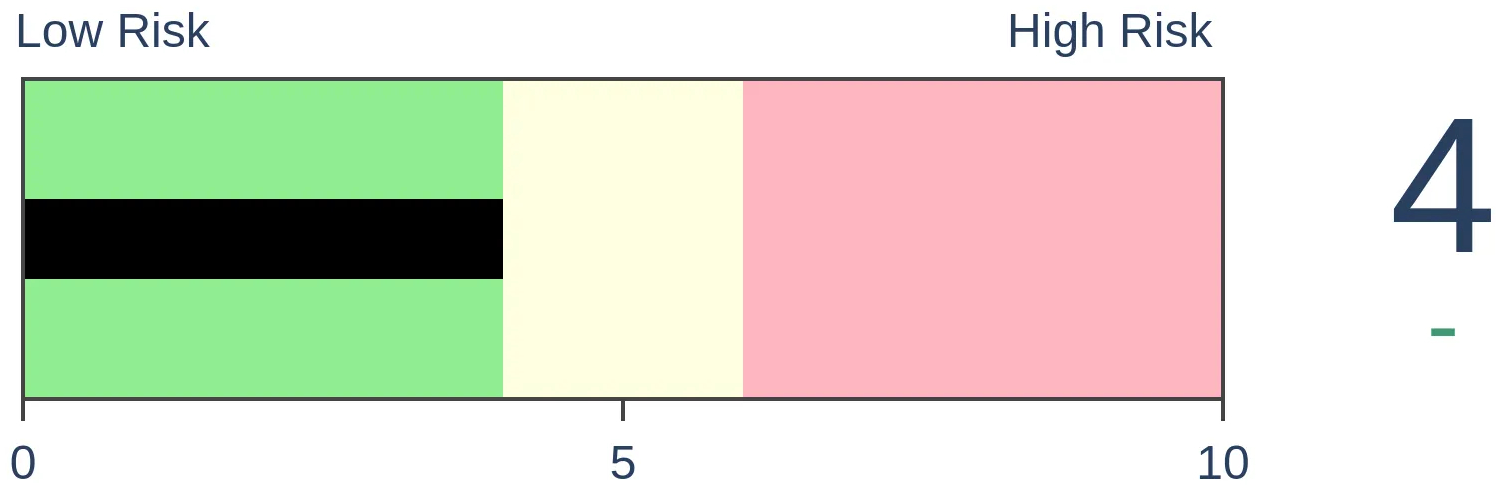
Stocks Short-Term
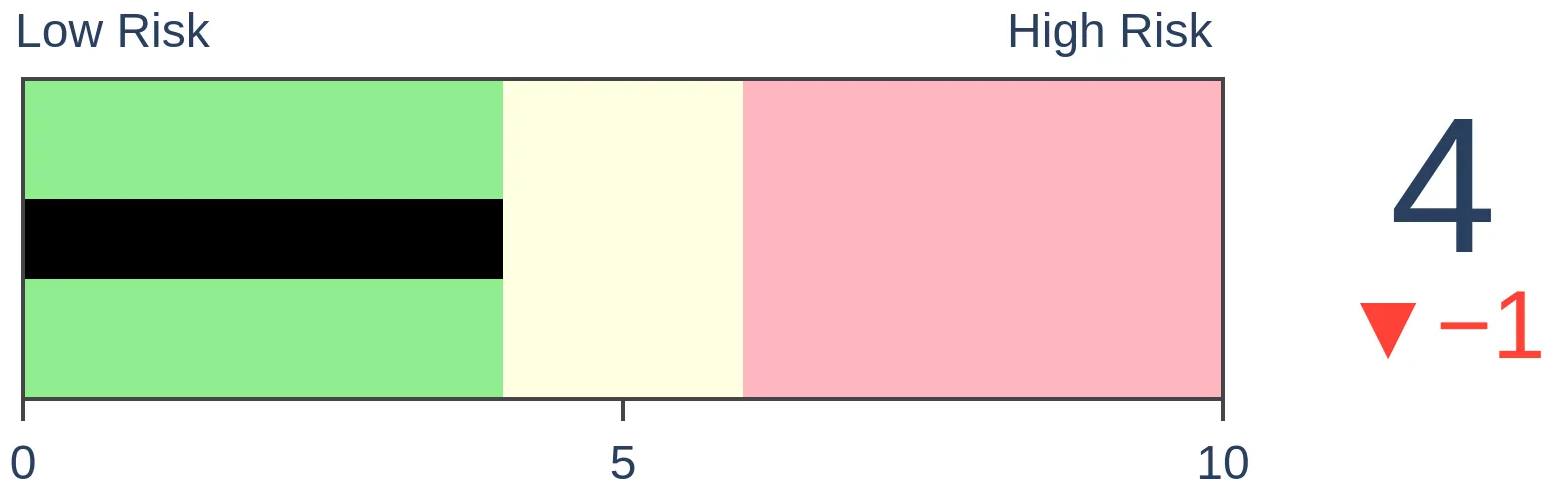
|
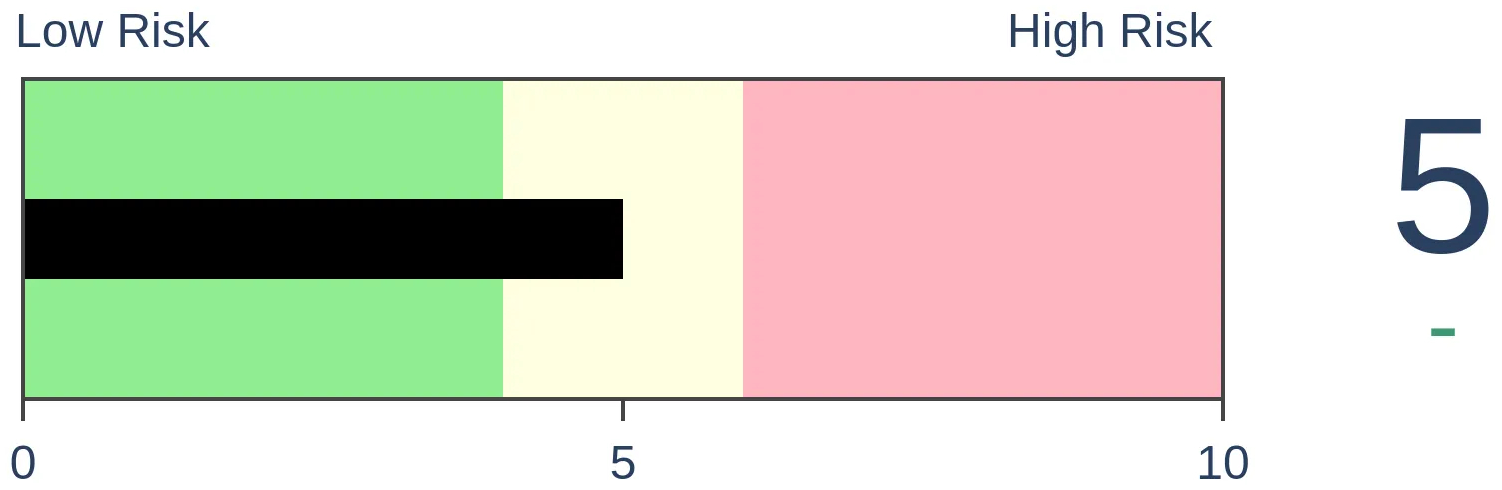
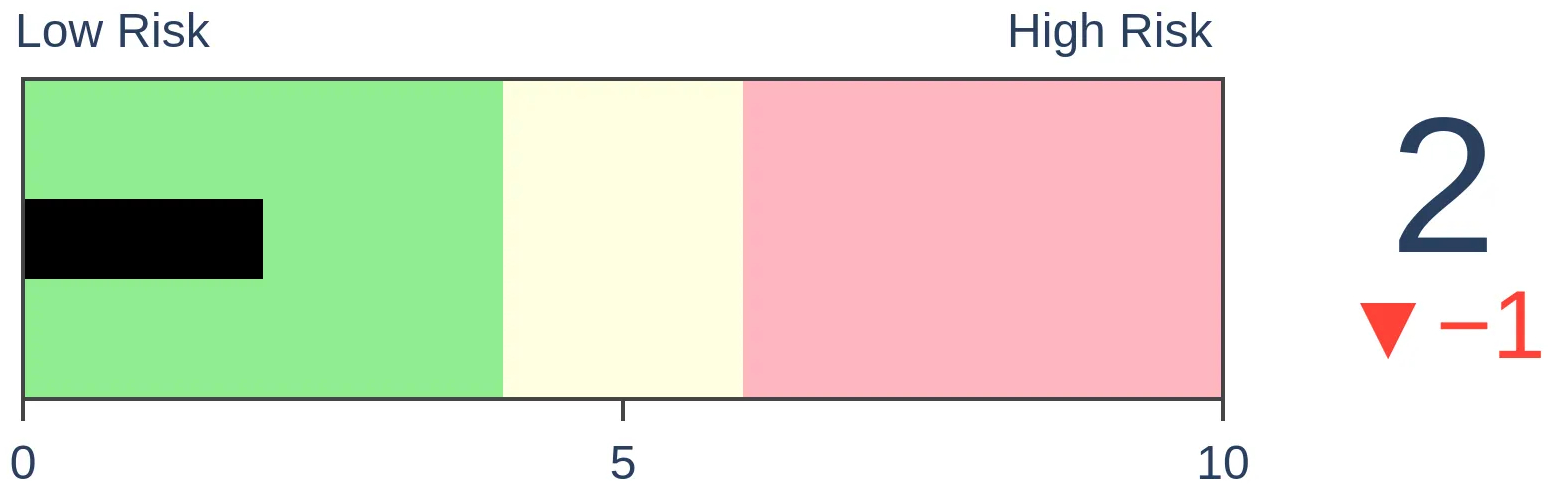
Stocks Medium-Term

|
|
Bonds
|
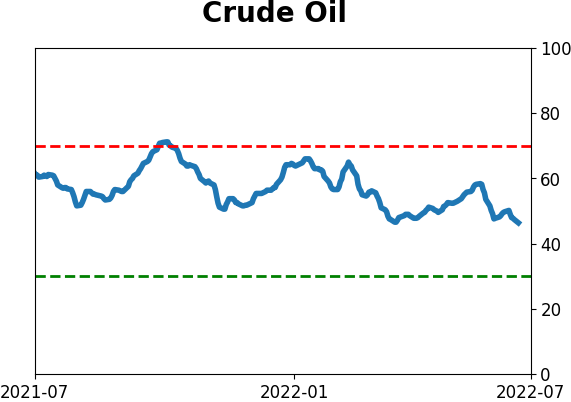
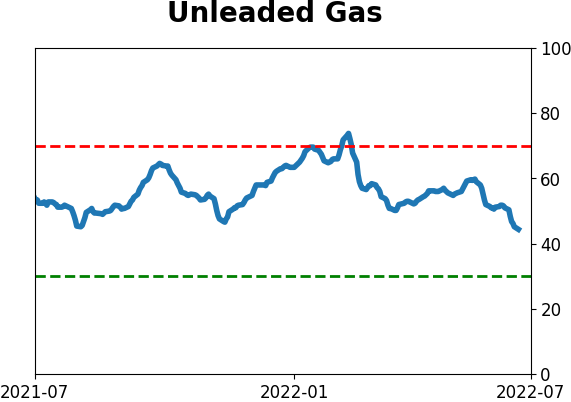
Crude Oil
|
|
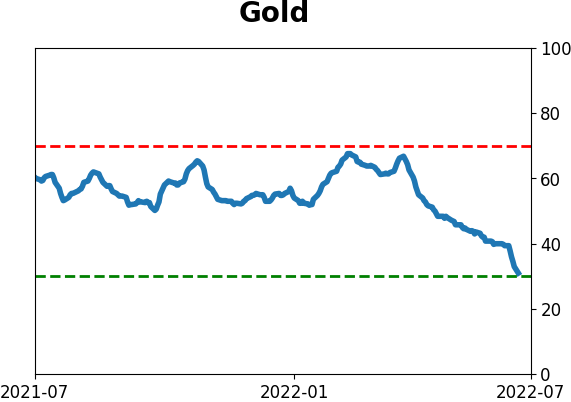
Gold
|
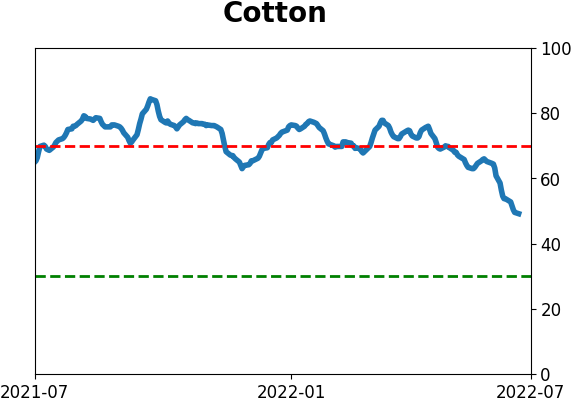
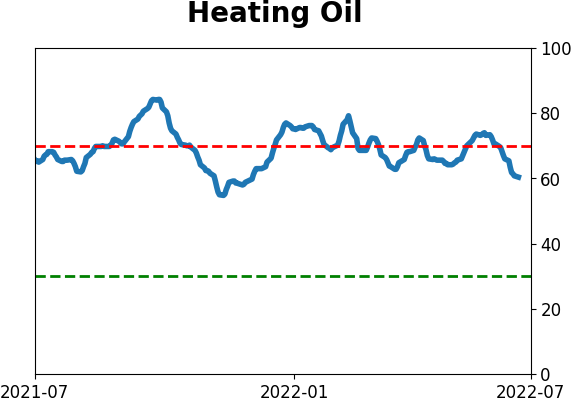
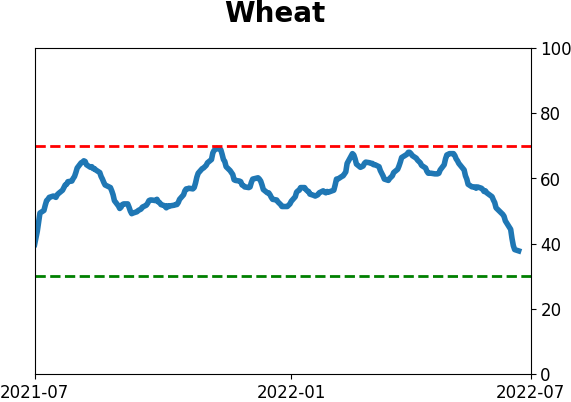
Agriculture

|
|
Research
By Jason Goepfert
BOTTOM LINE
Wall Street analysts spent the last week busy with downgrades. They were heavy downgraders of both price targets and earnings estimates among companies in the S&P 500. The 5-day sum of net revisions plunged to one of the lowest levels since 2010.
FORECAST / TIMEFRAME
None
|
Key points:
- Wall Street analysts have become busy downgrading prospects on stocks in the S&P 500
- Their net price target and earnings revisions have soured to more than 500 over the past week
- Similar jumps in downgrades coincided with bottoms in stocks
A trickle of corporate downgrades turns into a gusher
Main Street has been pessimistic about stocks for a while. Now Wall Street is following in their footsteps...and in a hurry.
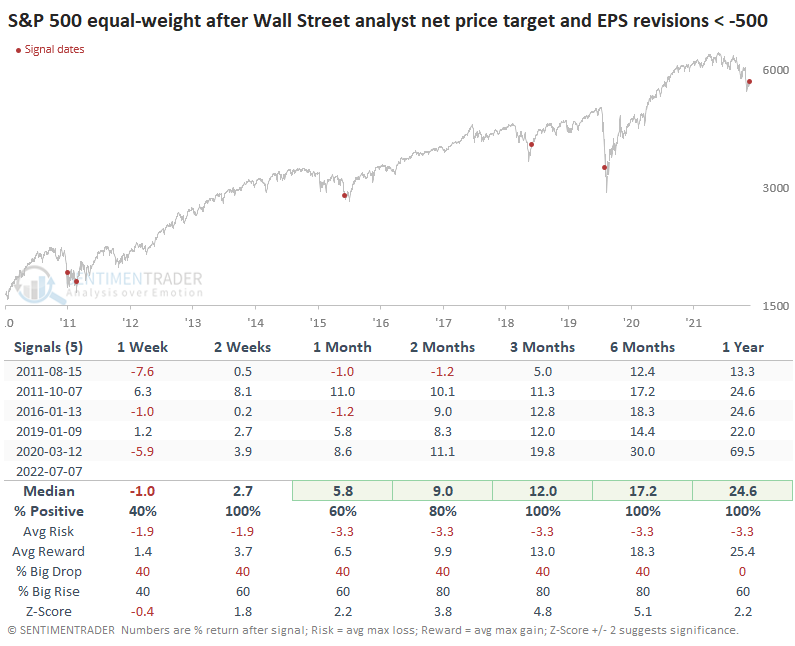
Over the past five days, analysts have issued a net of more than 500 price target and earnings downgrades on S&P 500 stocks. This is a rolling 5-day sum of (price target upgrades minus downgrades) + (earnings upgrades minus downgrades).
They've been downgrading stocks' prospects for months, but not to this degree, likely because of the looming earnings season. Analysts want to get out in front of what is widely assumed to be bruising earnings reports starting this week. Since the aftermath of the financial crisis, when Bloomberg data begin, only four other periods witnessed such a frenetic downgrading cycle.
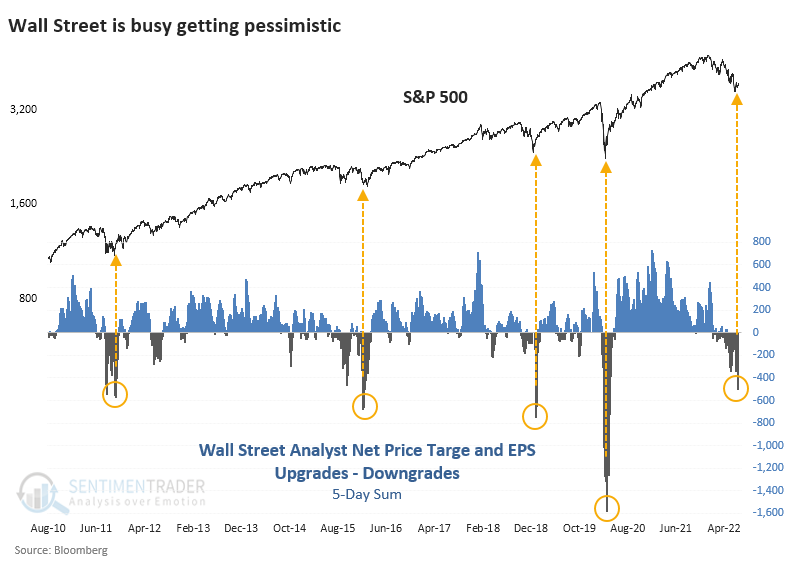
With limited data history and an extreme reading, the sample size is painfully small, which carries the usual caveats. But it's worth noting that analysts were fearing earnings misses after Q3 2011, Q4 2015, and Q4 2018, then again during the pandemic. All the fears were overstated and stocks rebounded strongly.
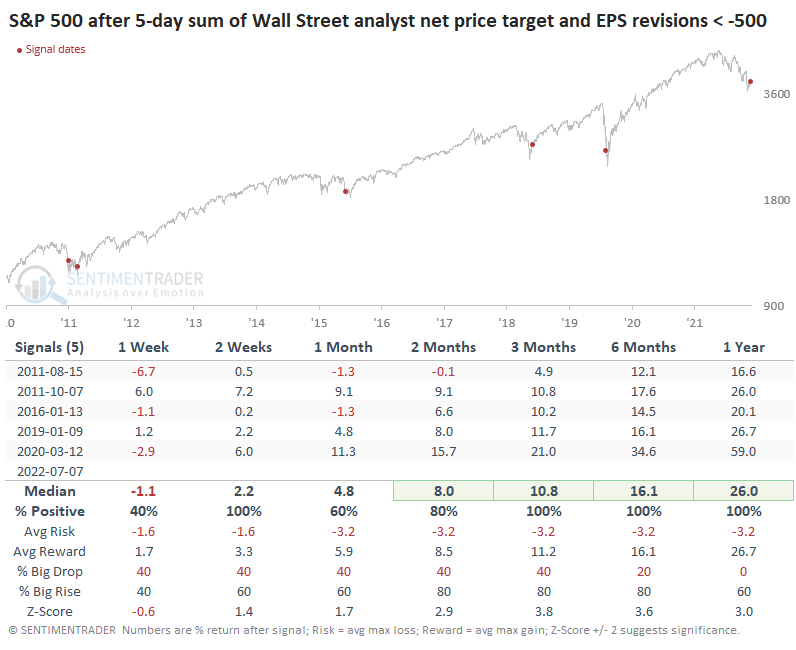
Since the downgrades have been so widespread, it would make sense to expect the equal-weight version of the index to perform well, which it did. Returns were moderately improved from the cap-weighted version of the index over the medium-term.
What the research tells us...
Wall Street denizens are undoubtedly some of the most educated participants in markets. But book learning doesn't necessarily translate to market smarts, and analysts have competing interests other than accurate calls. There is a move toward AI-powered analyst reports, but humans still power most of the research, and funds continue to pay for their insights. With a lot of career risk, analysts suffer from many of the same biases as investors, and the herd mentality is evident when markets are doing well (or poorly). They've started to panic recently, which has been a consistent signal to do the opposite.
Indicators at Extremes
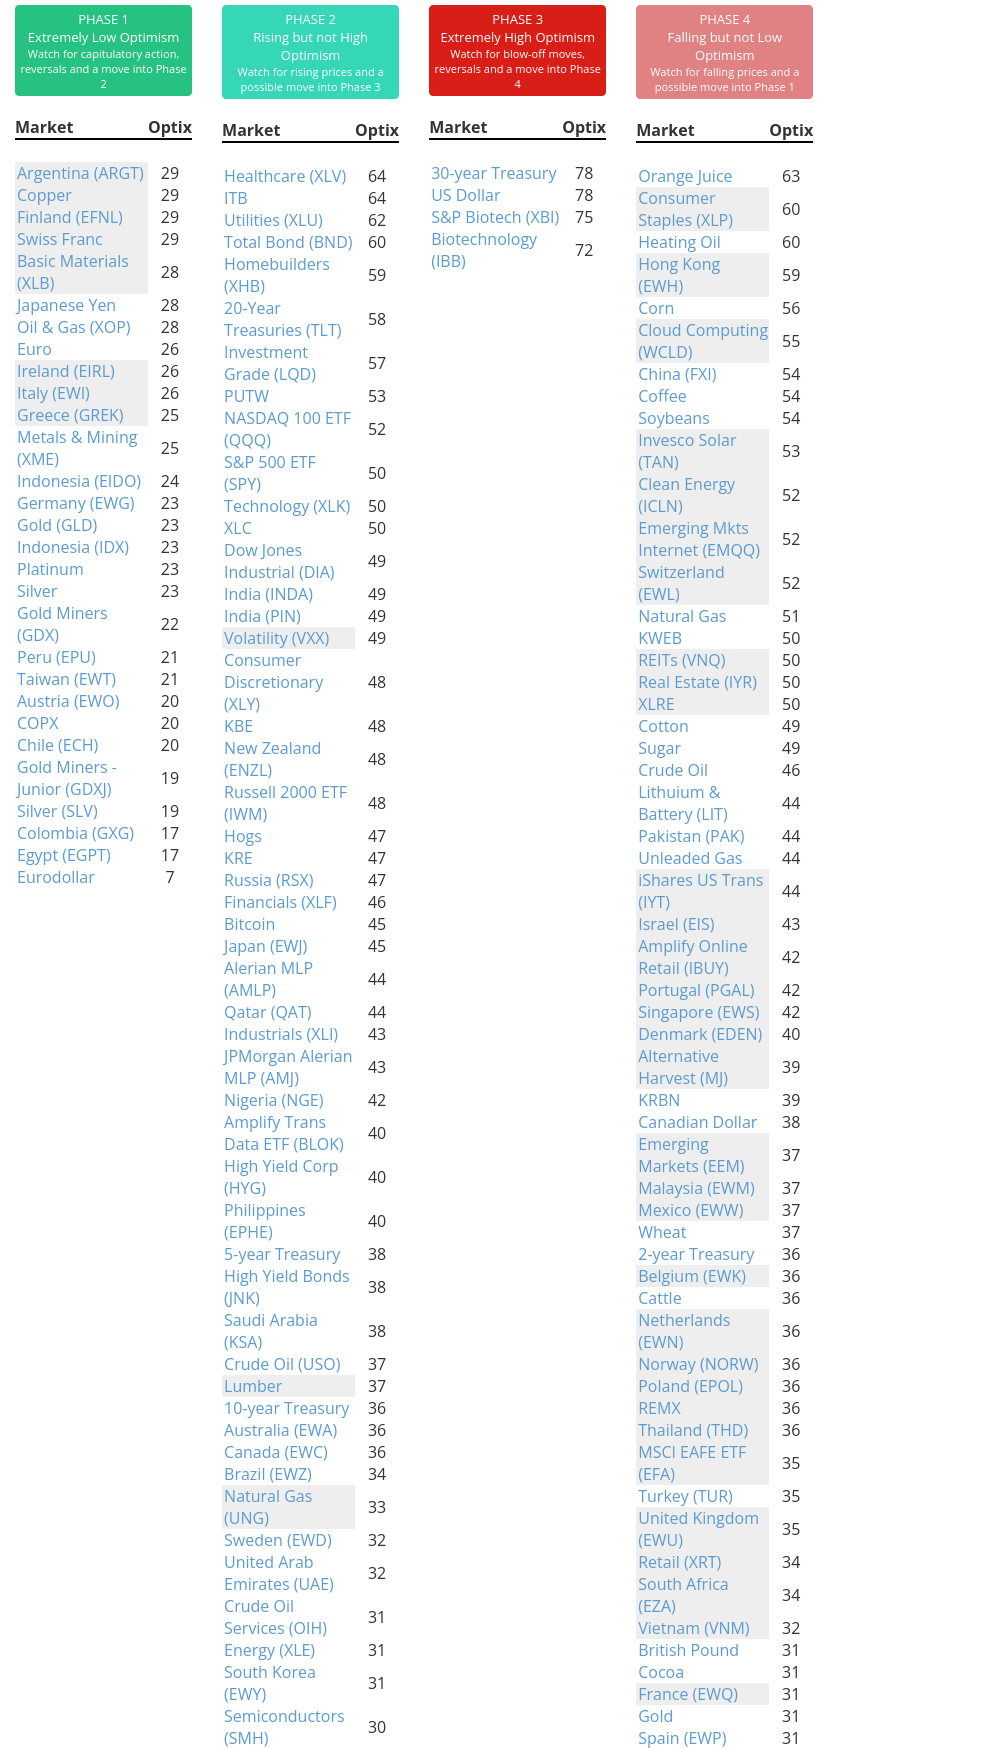
Phase Table
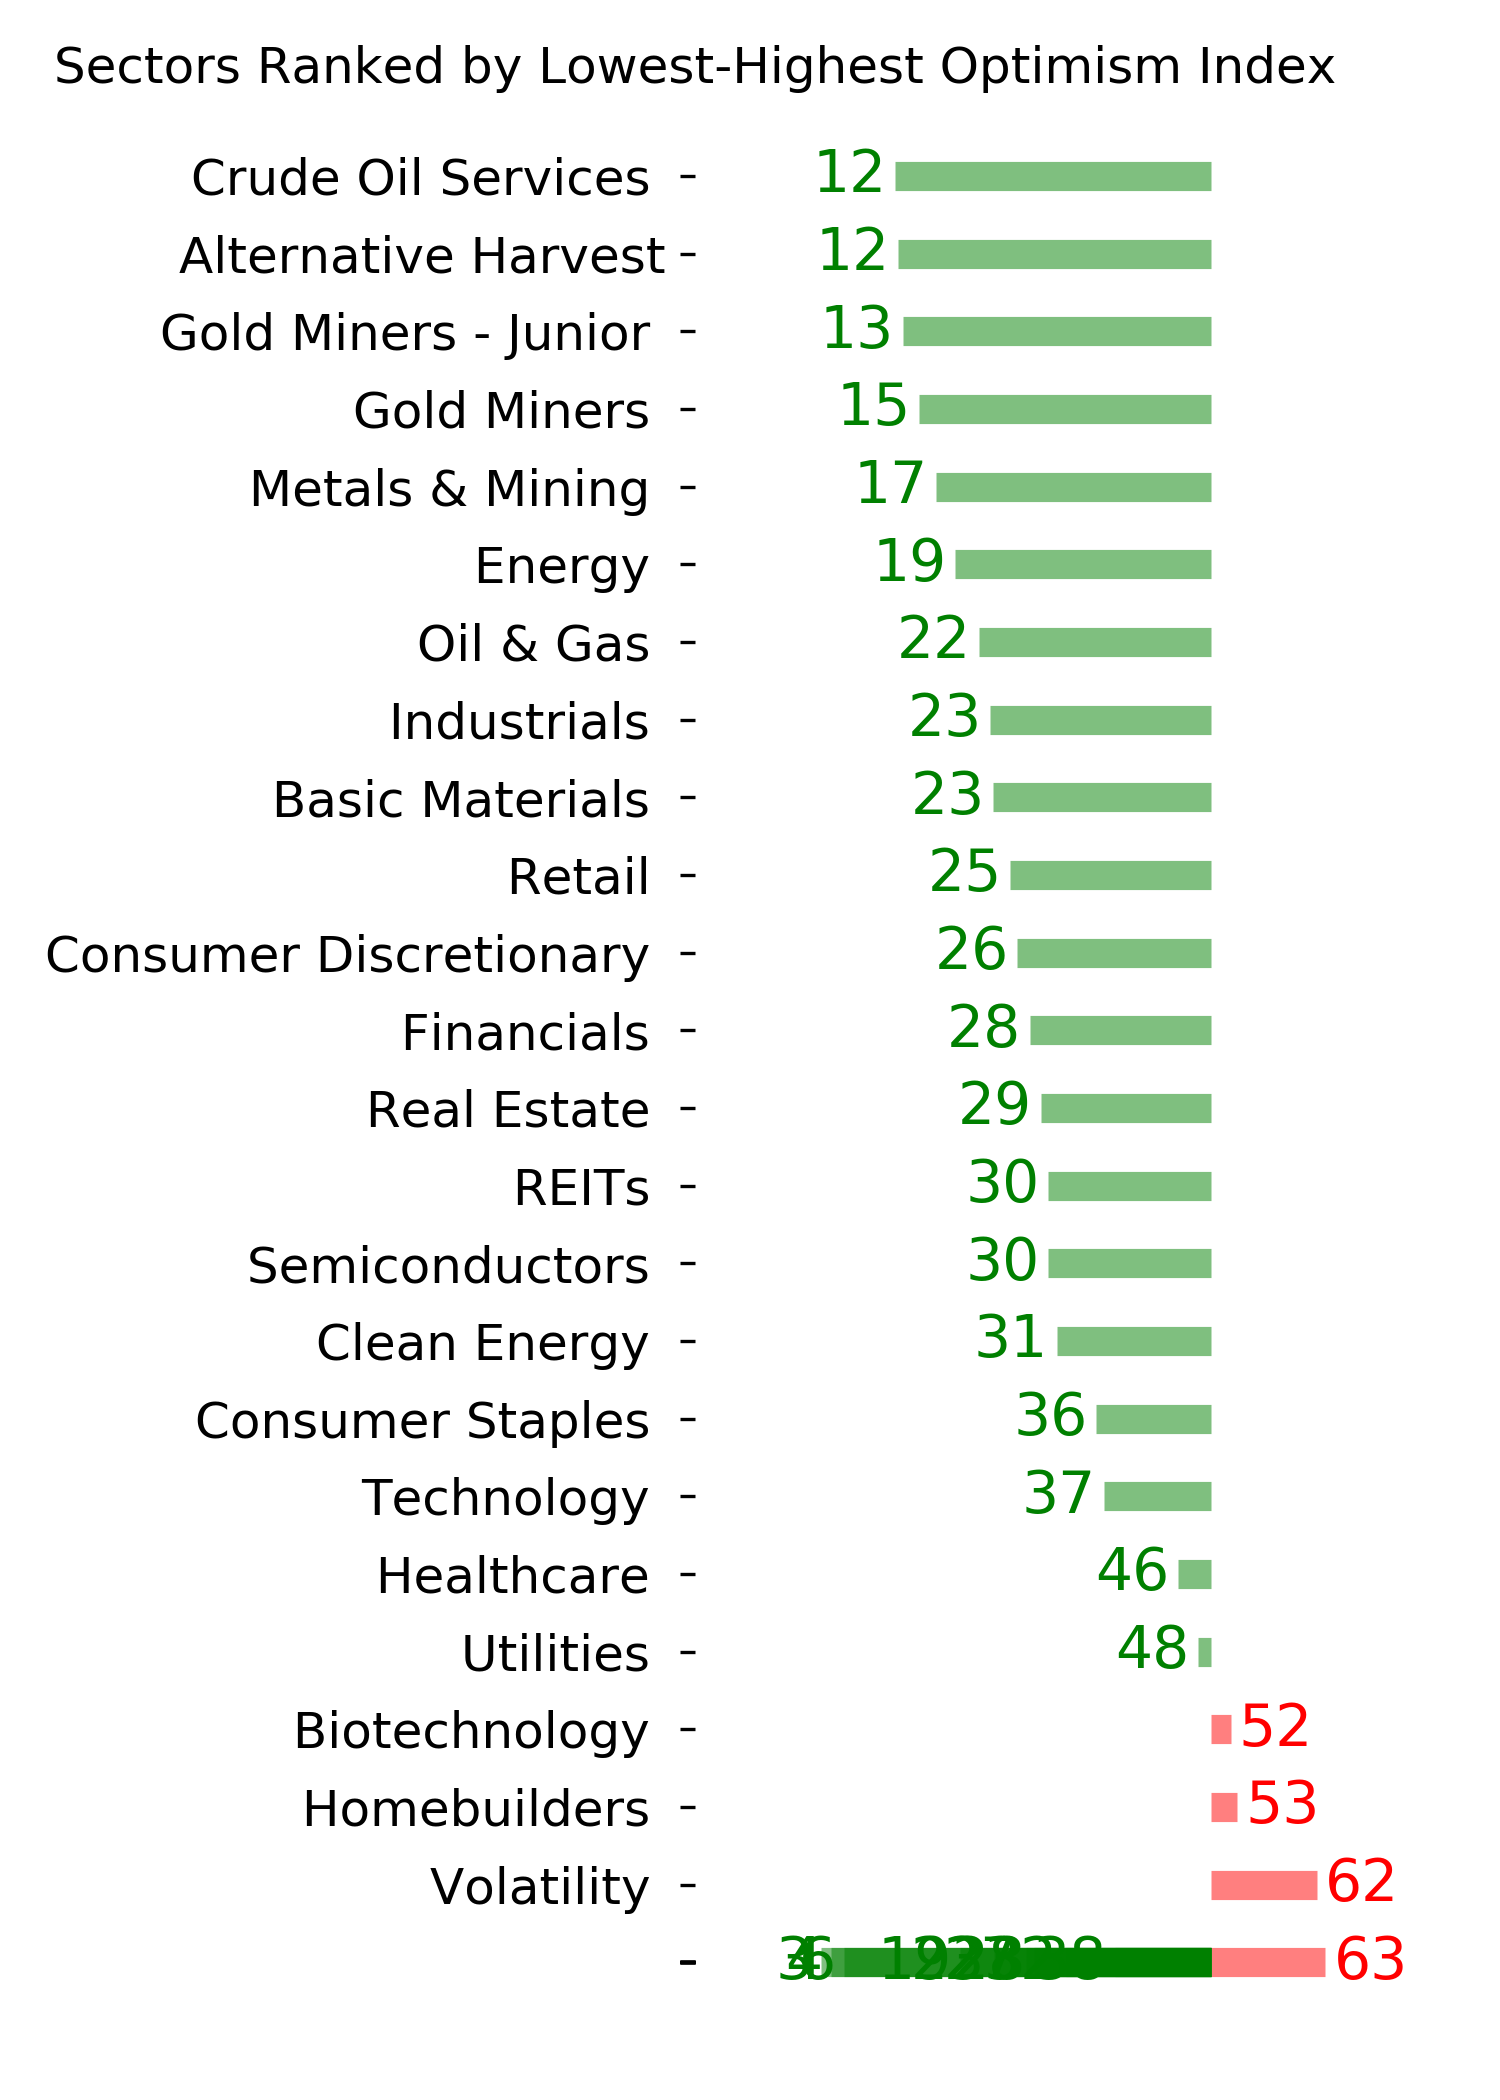
Ranks
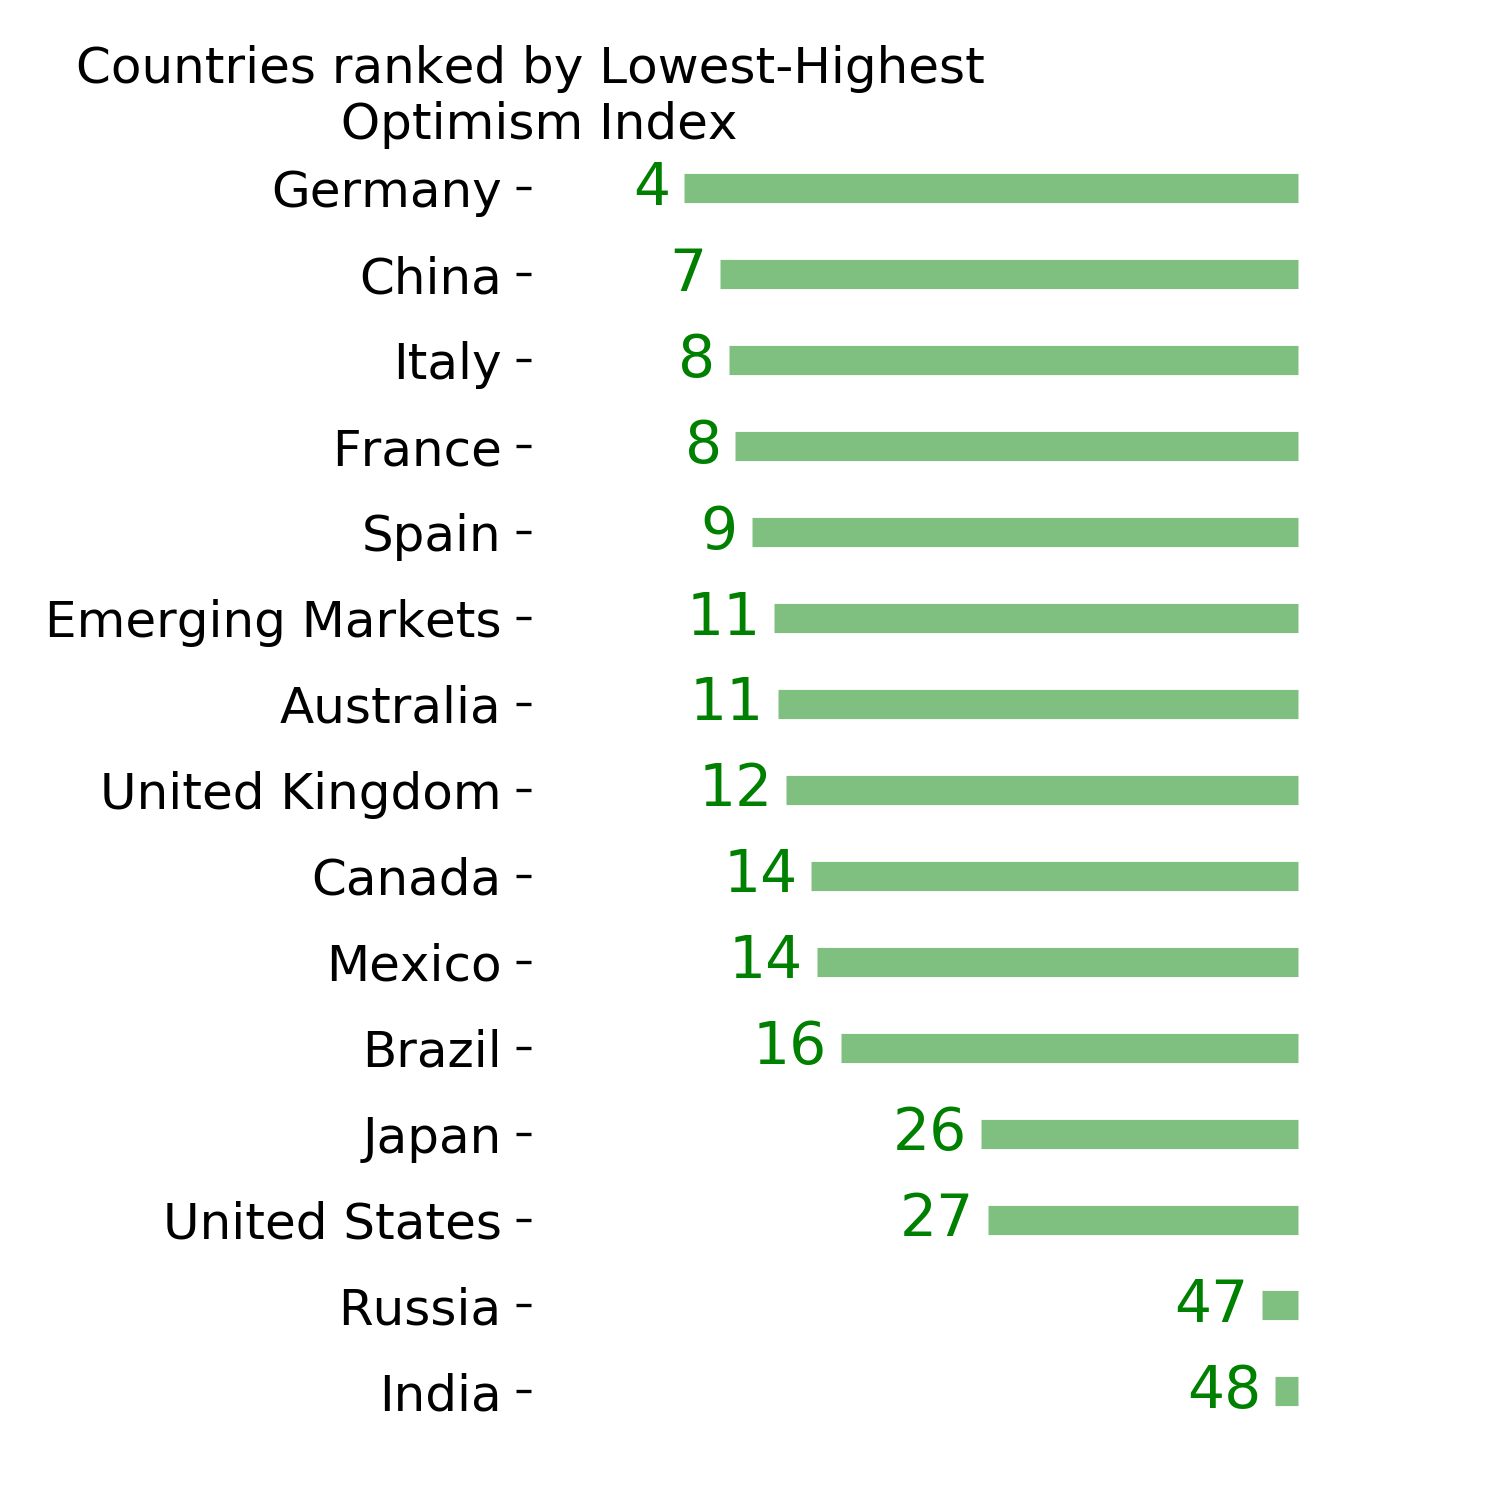
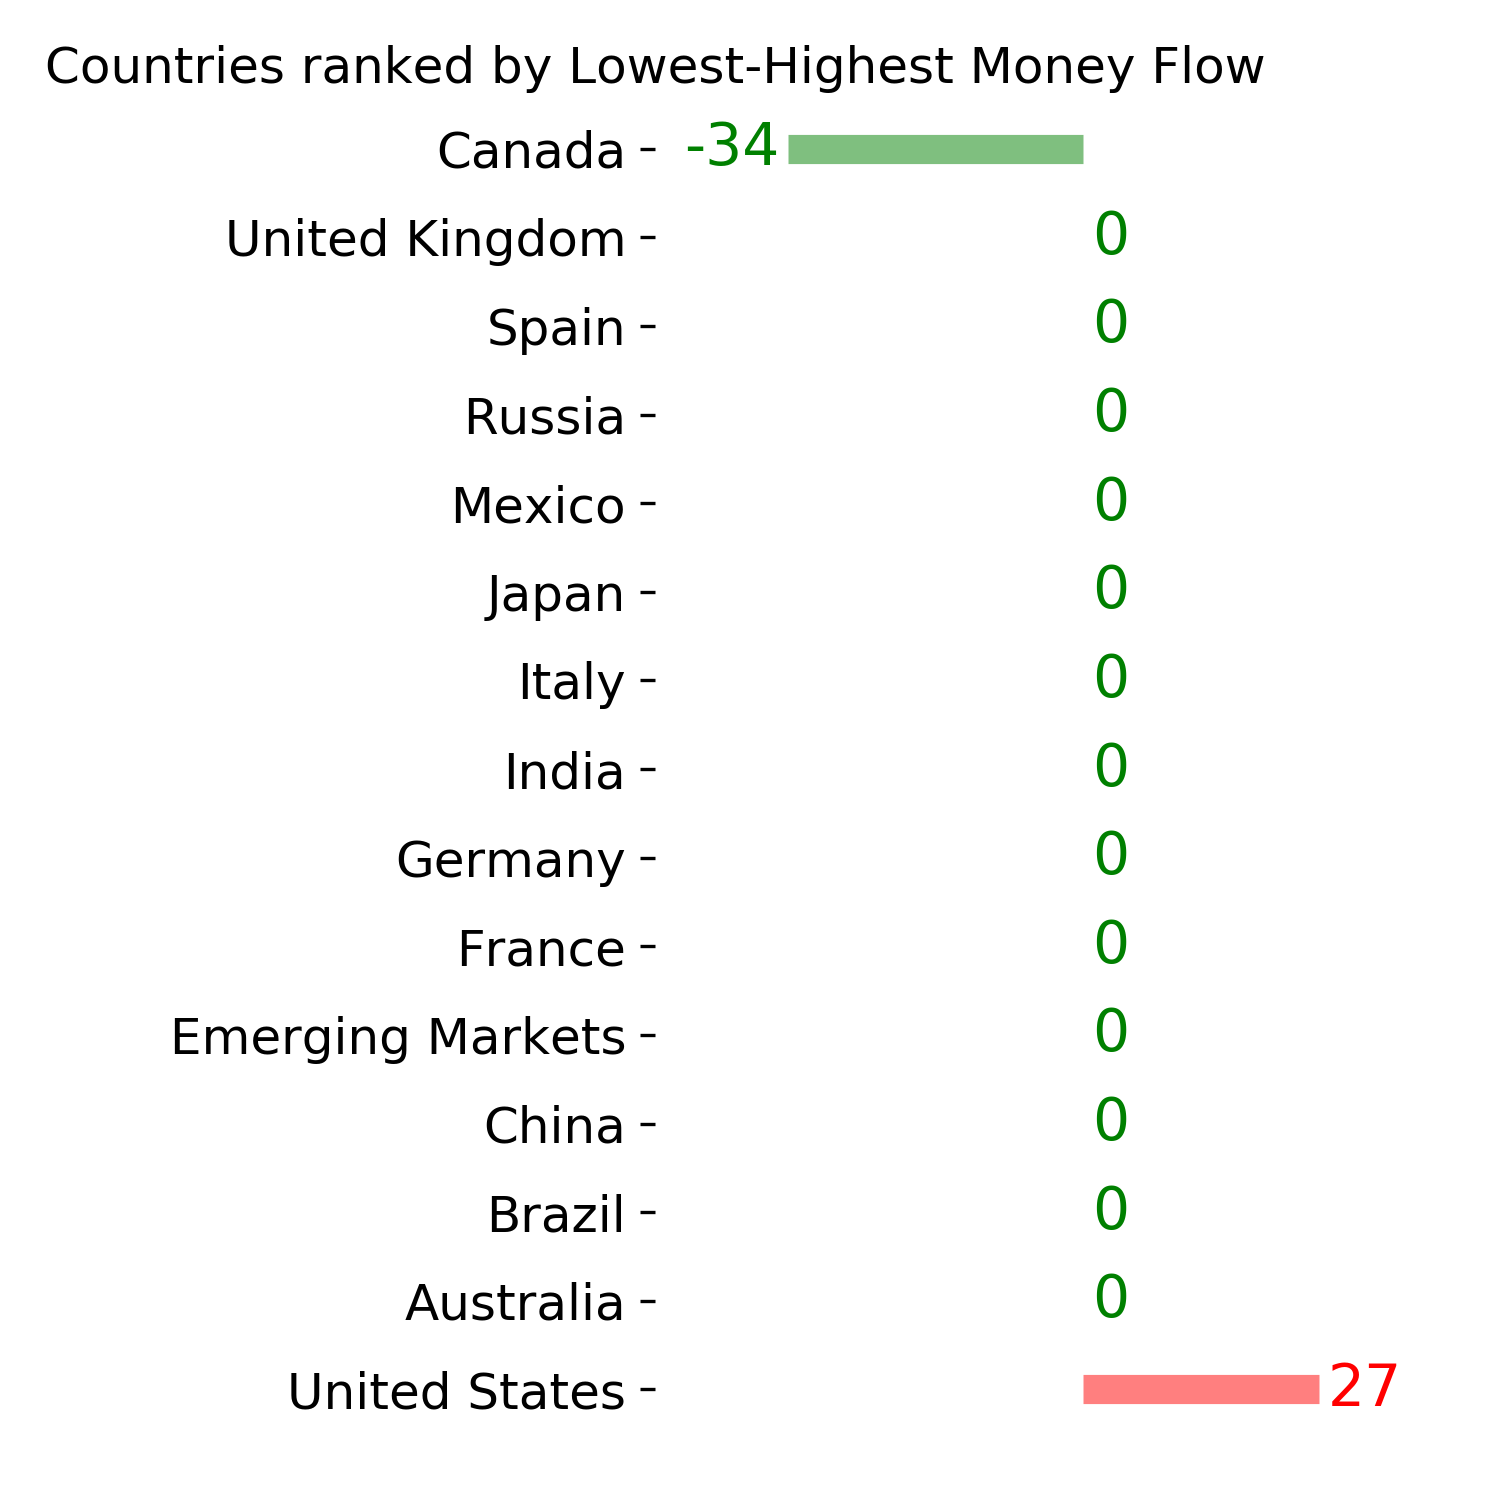
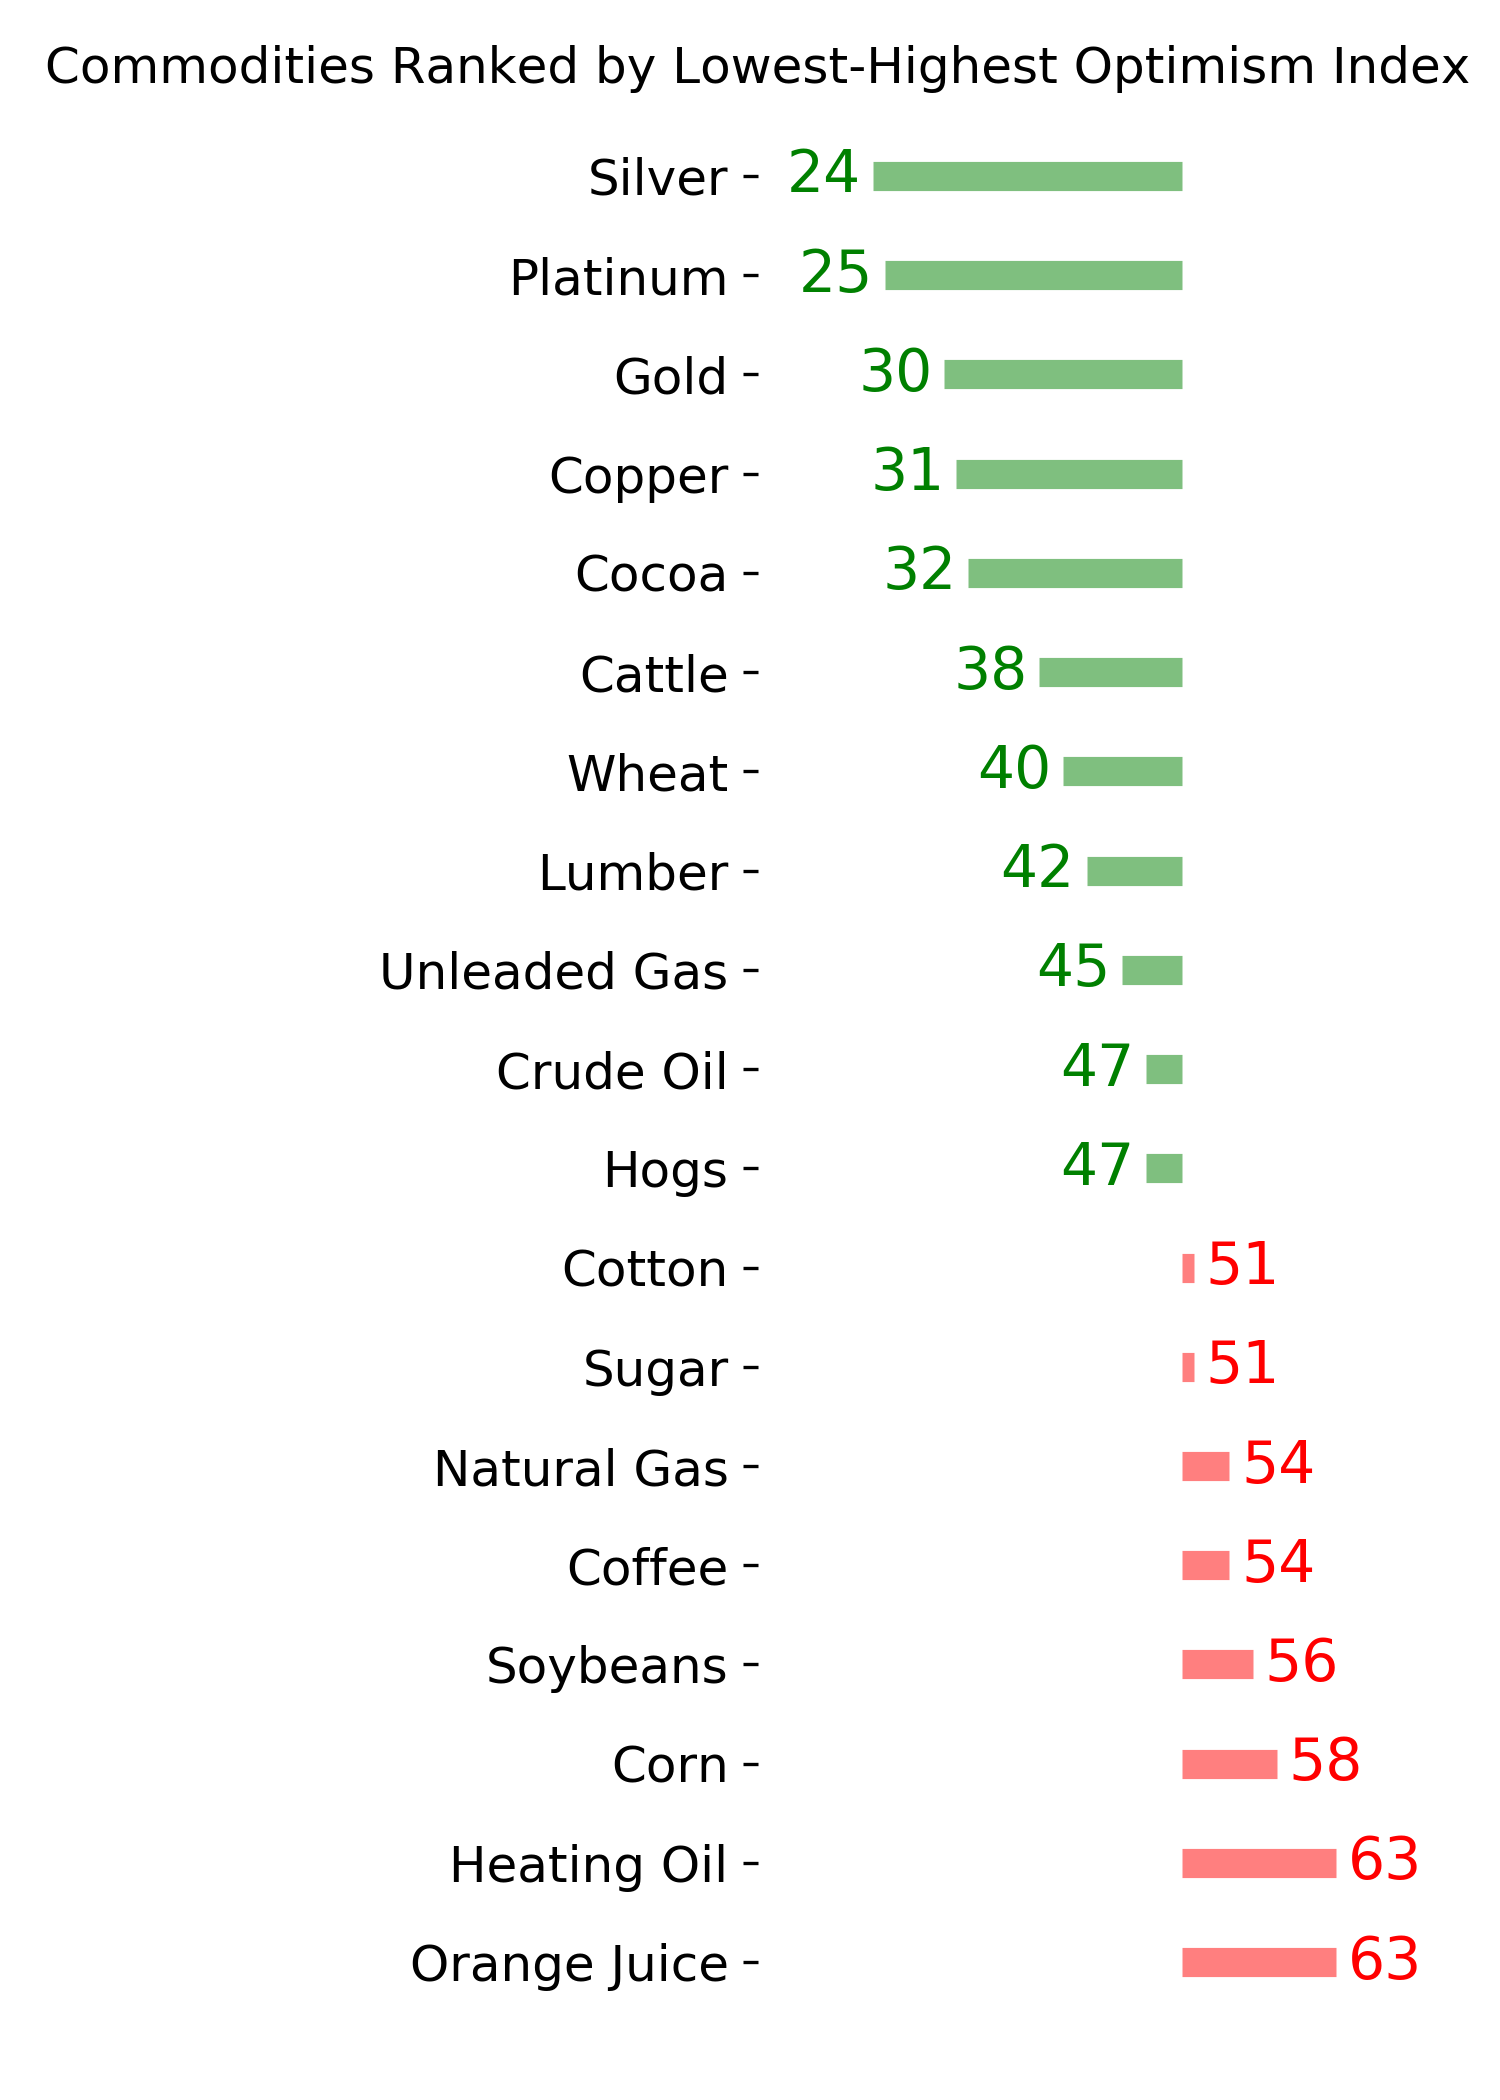
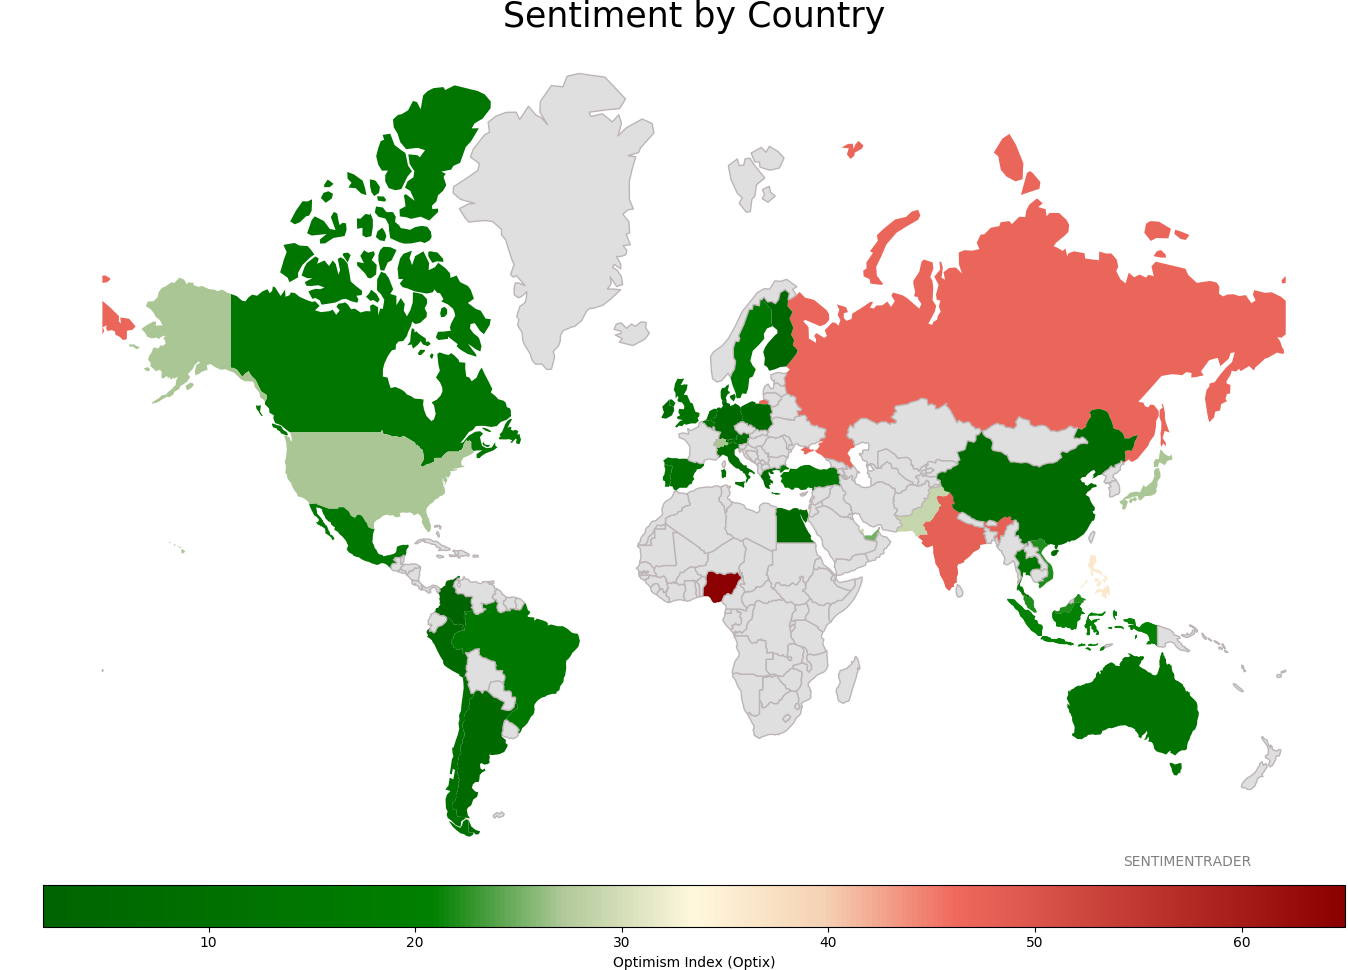
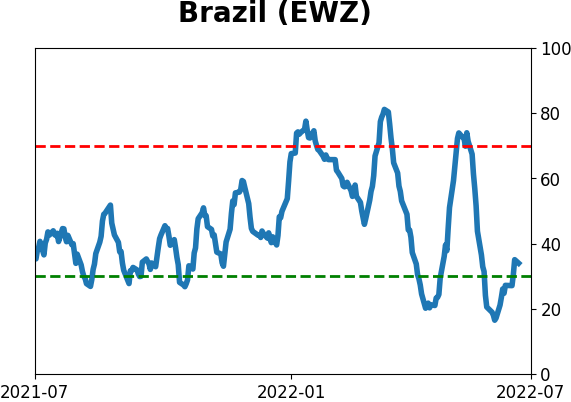
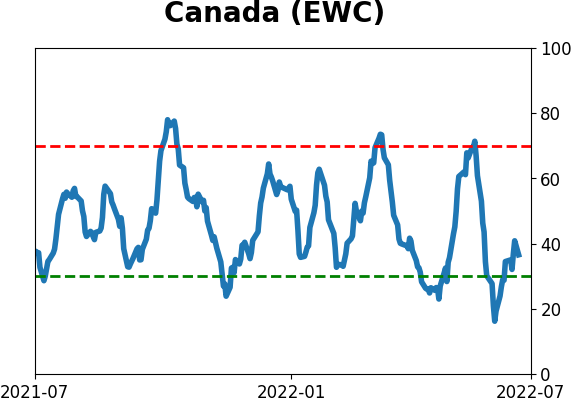
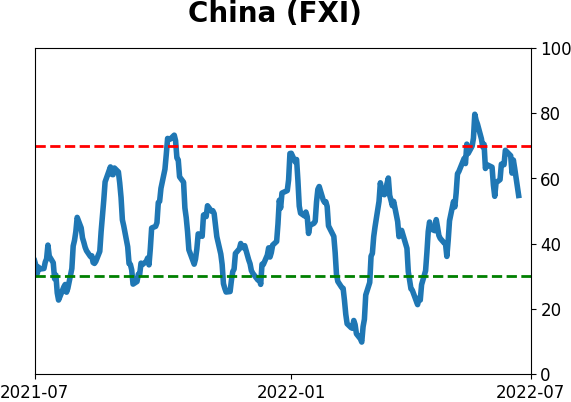
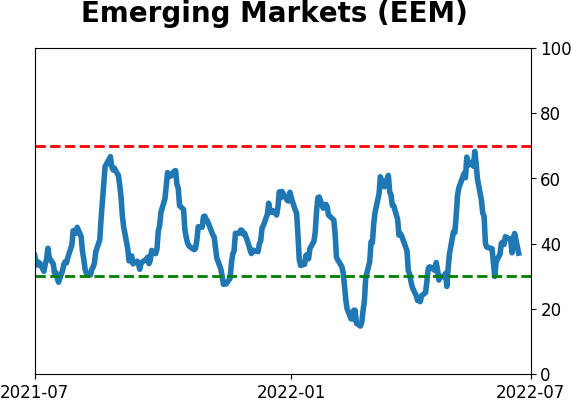
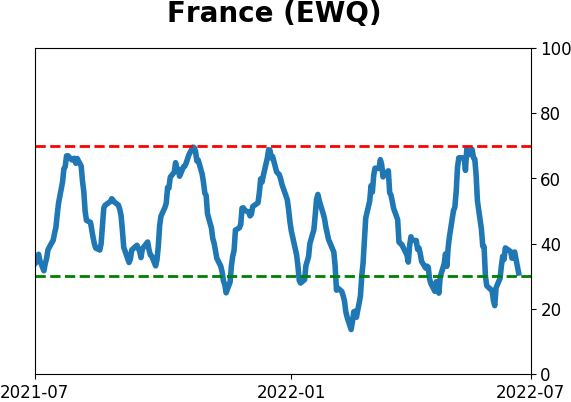
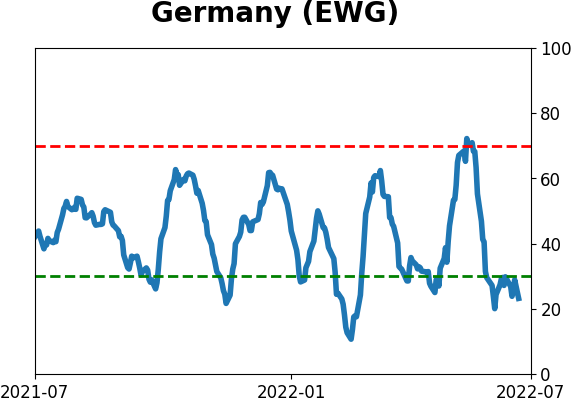
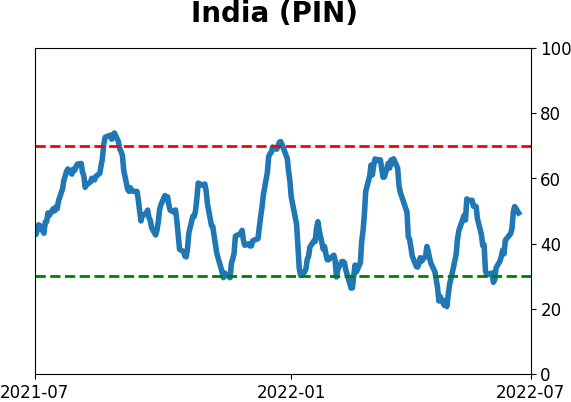
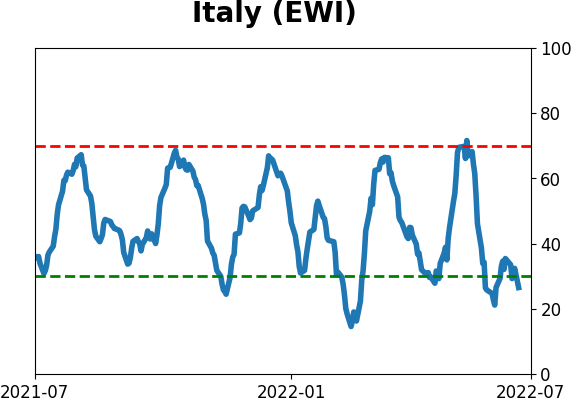
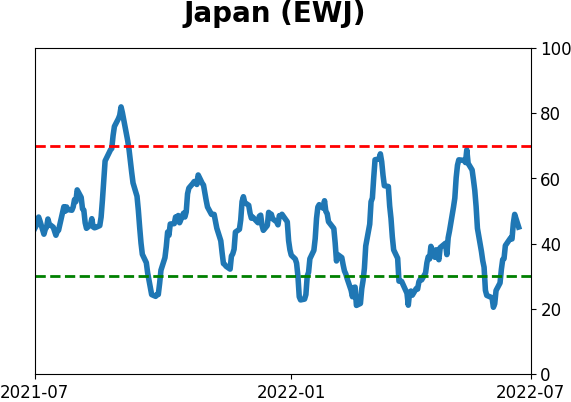
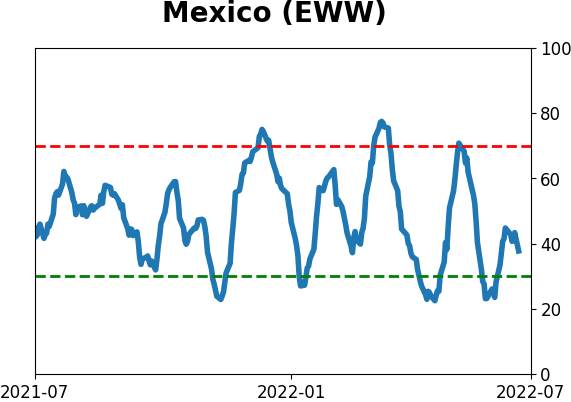
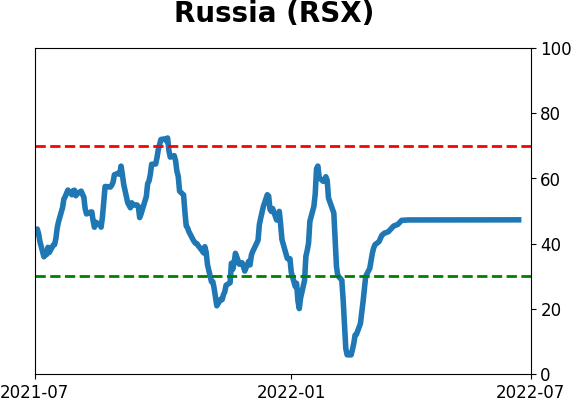
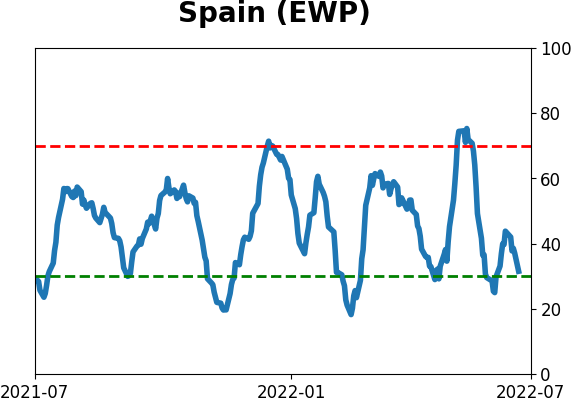
Sentiment Around The World
Optimism Index Thumbnails
|
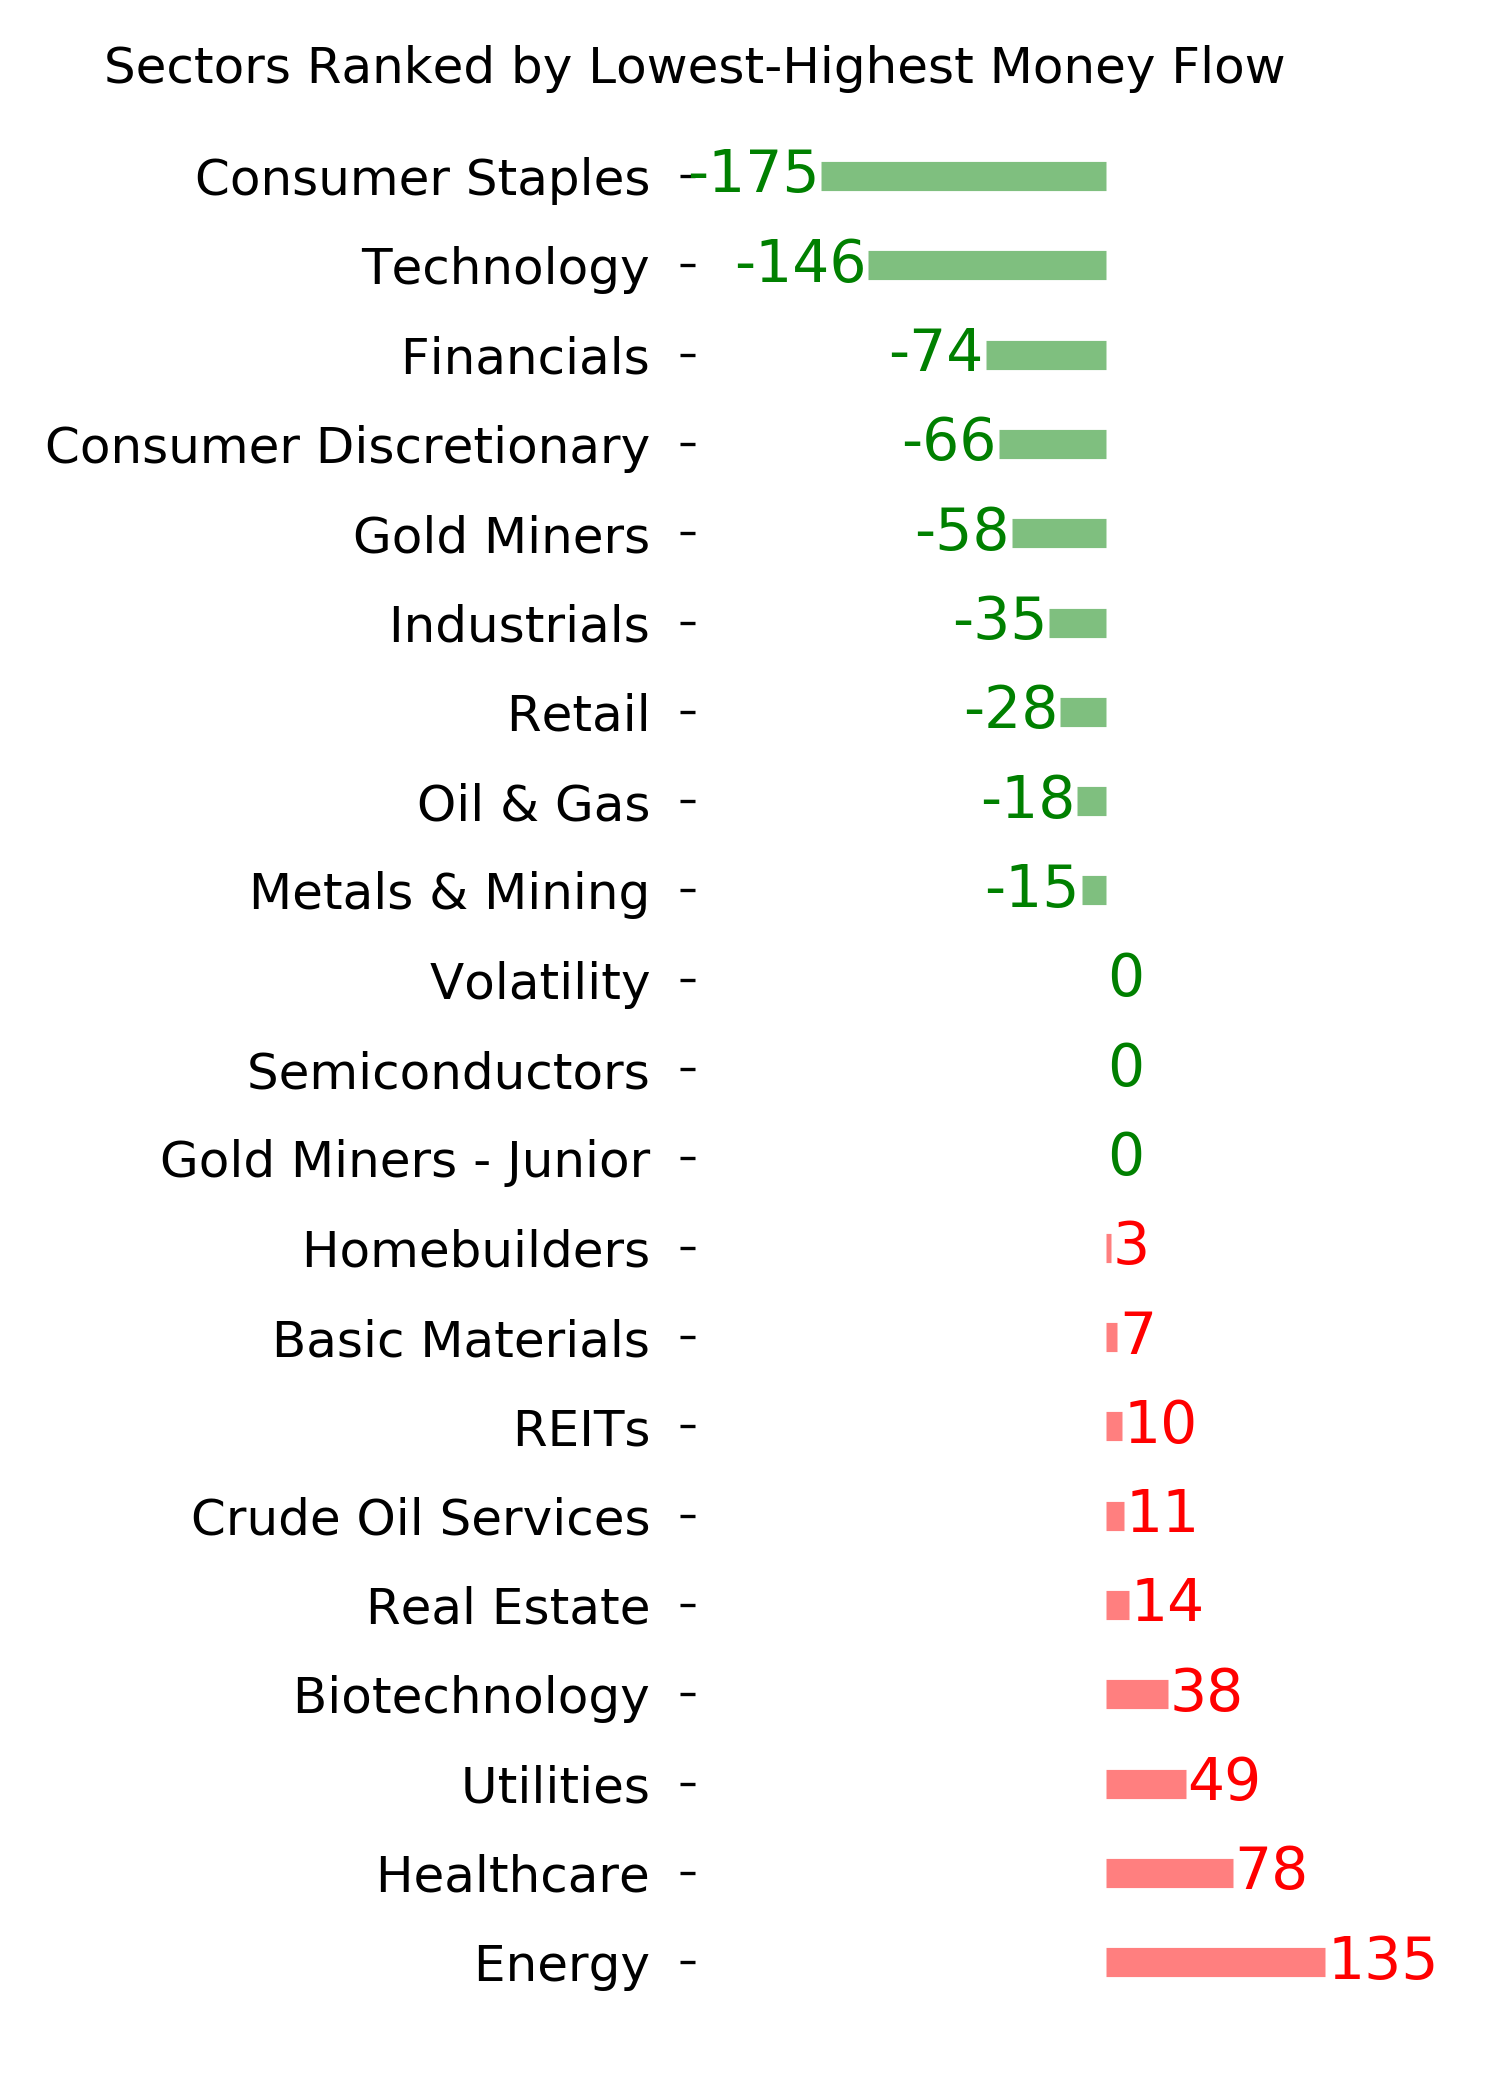
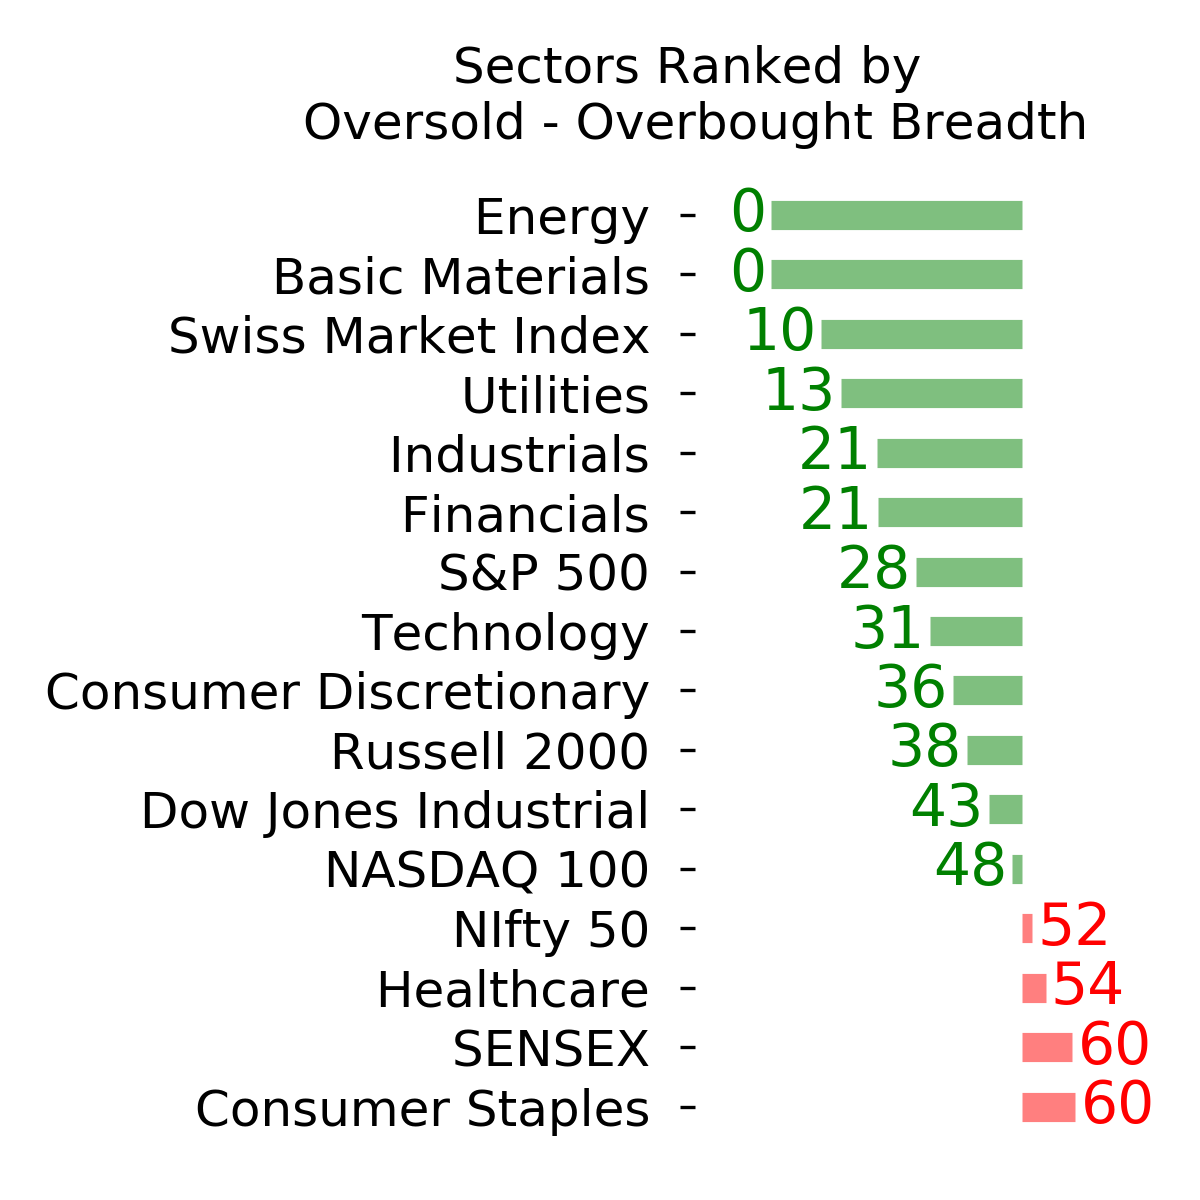
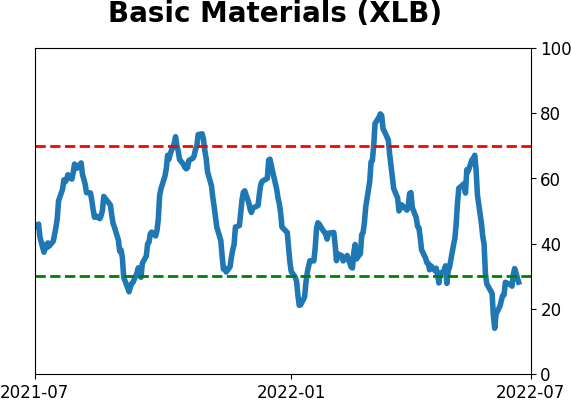
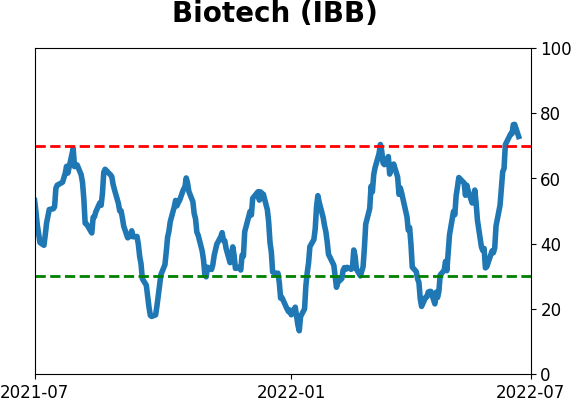
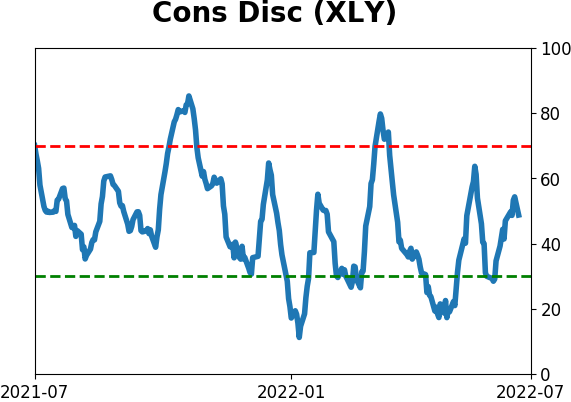
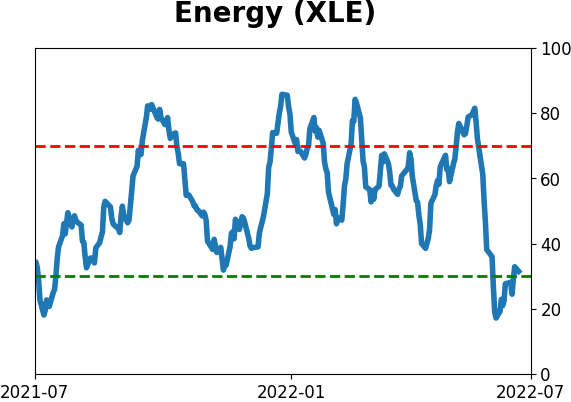
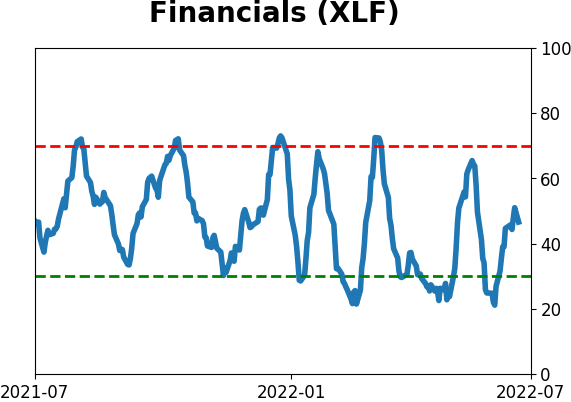
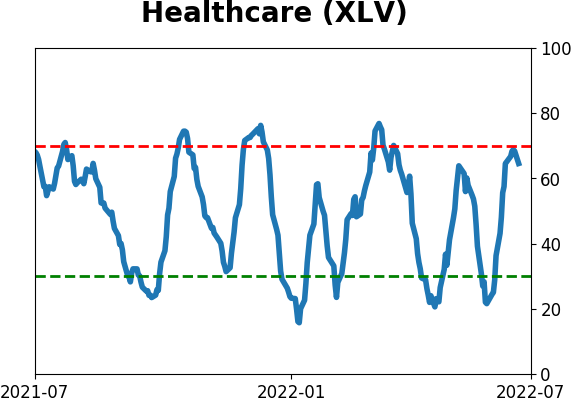
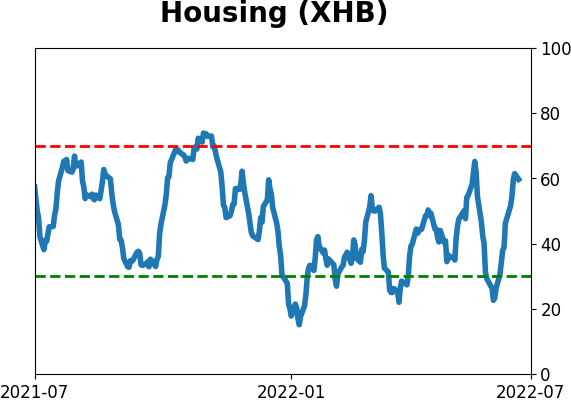
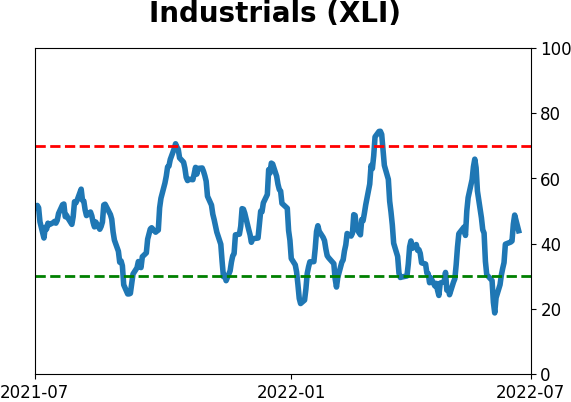
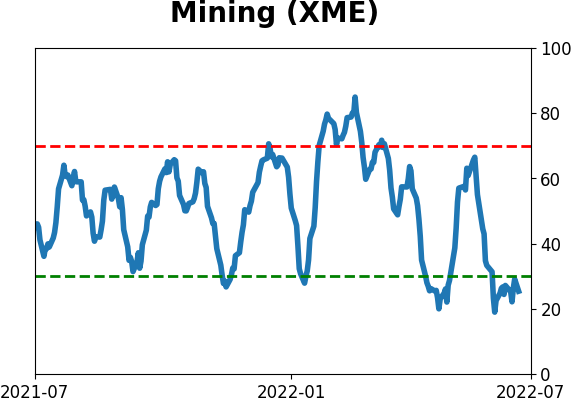
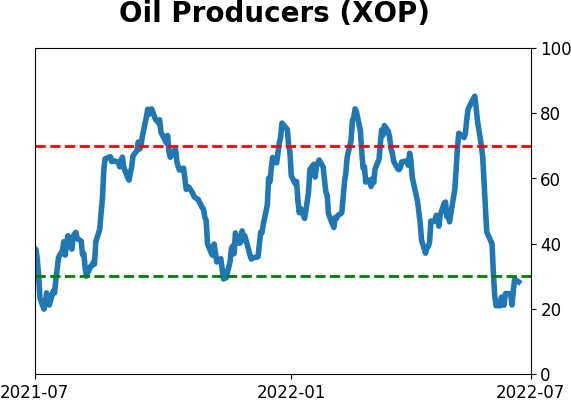
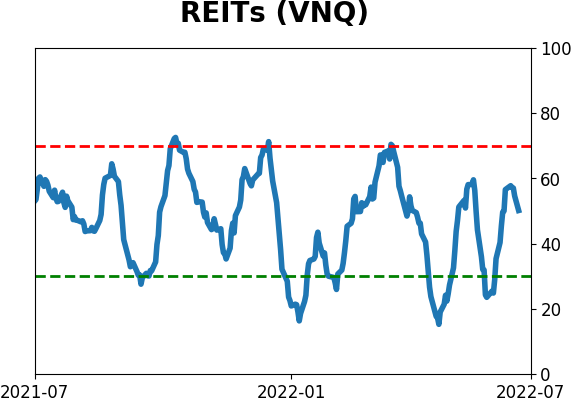
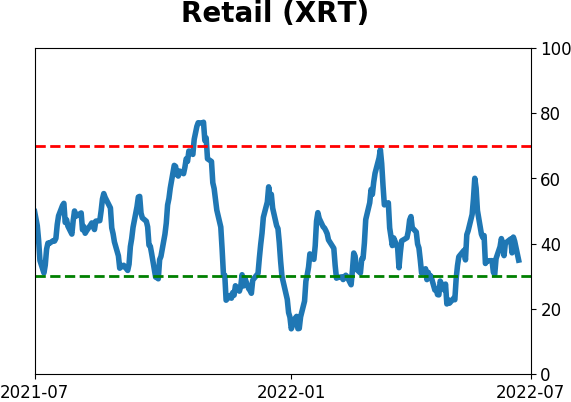
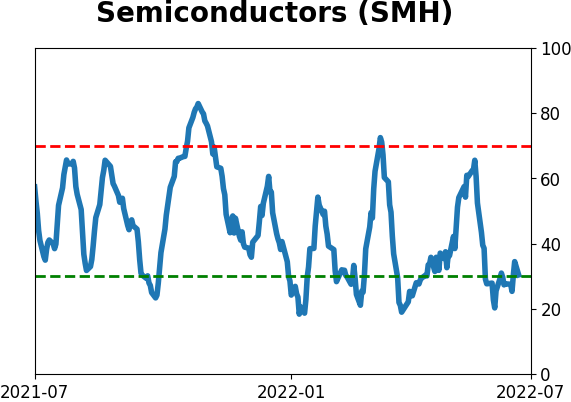
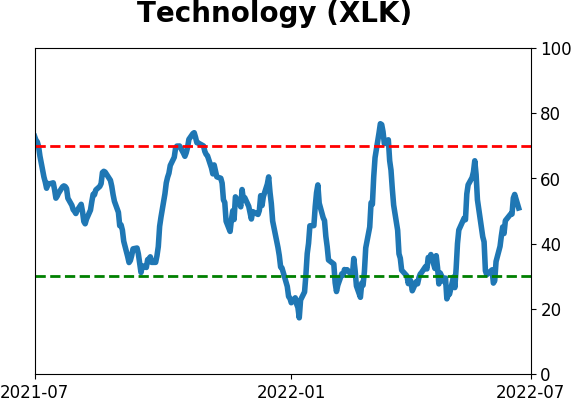
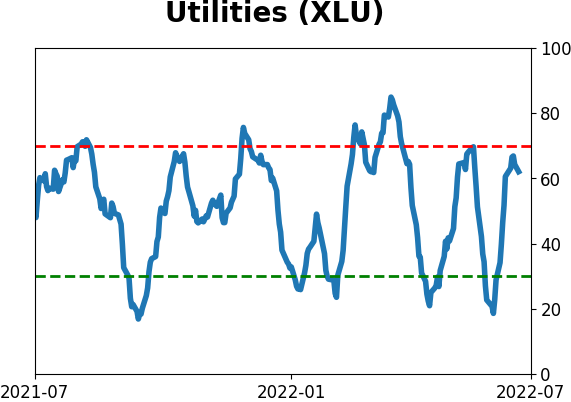
Sector ETF's - 10-Day Moving Average
|
|
|
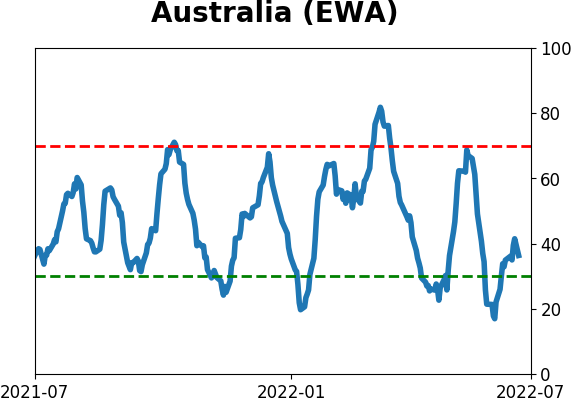
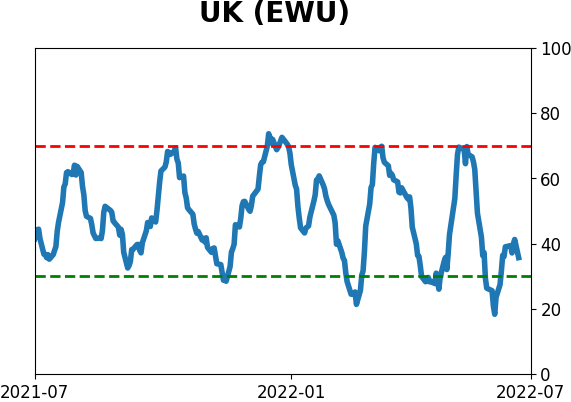
Country ETF's - 10-Day Moving Average
|
|
|
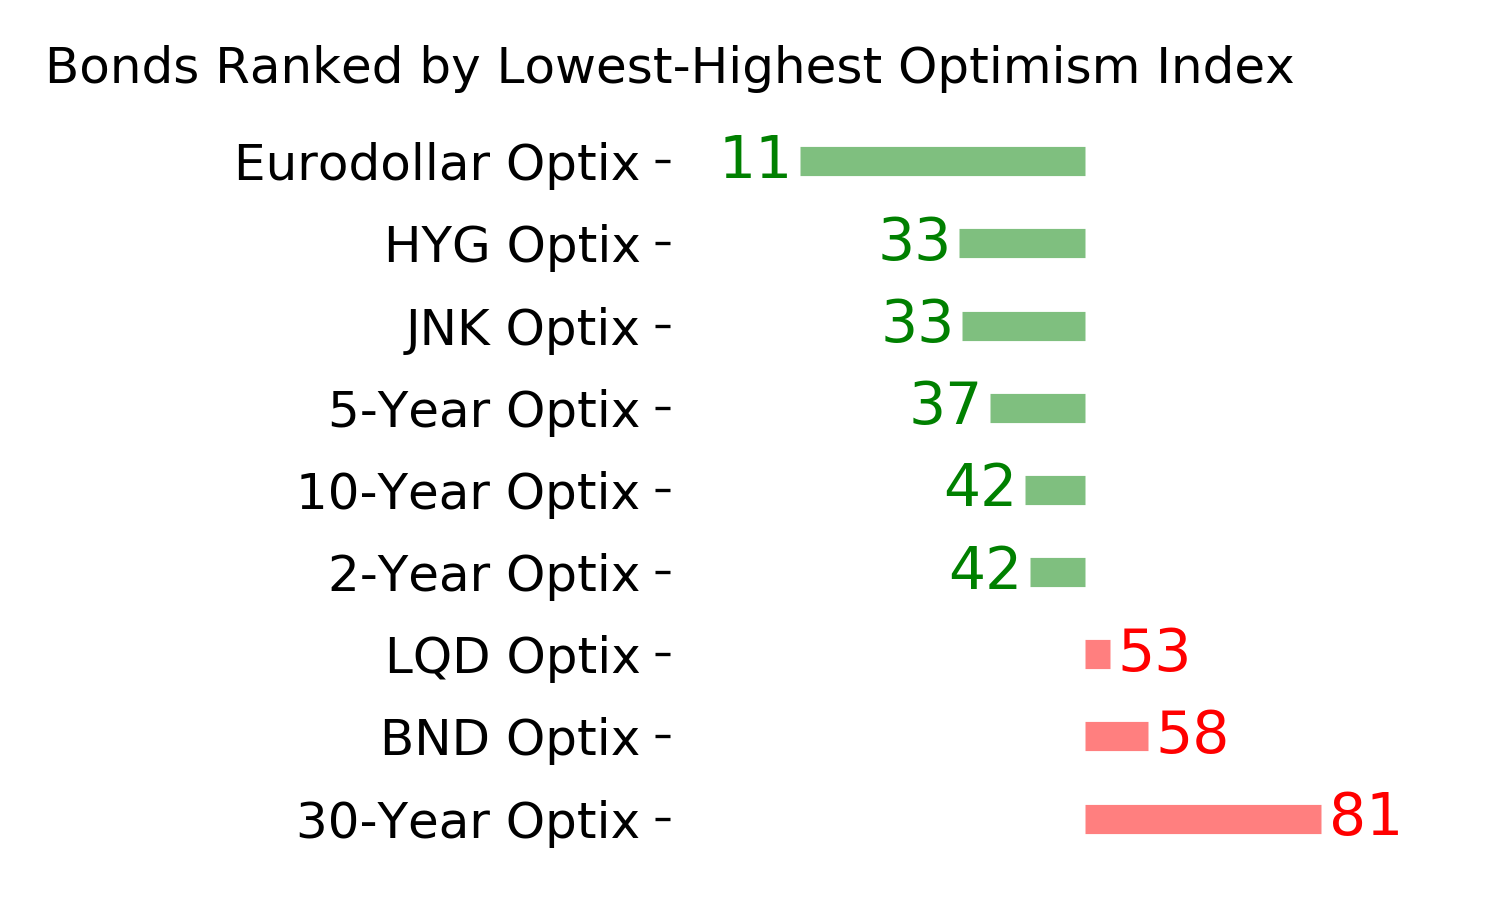
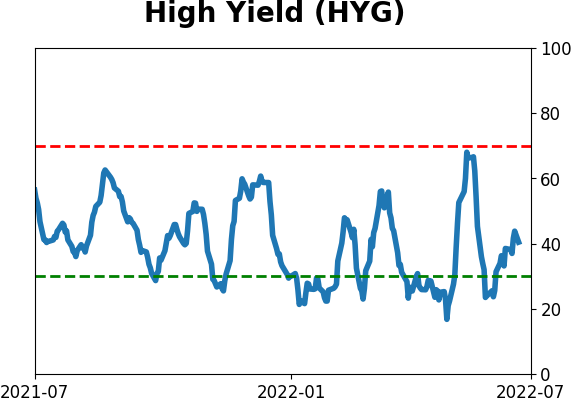
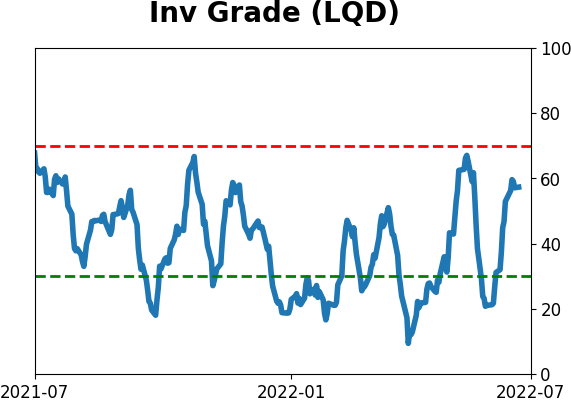
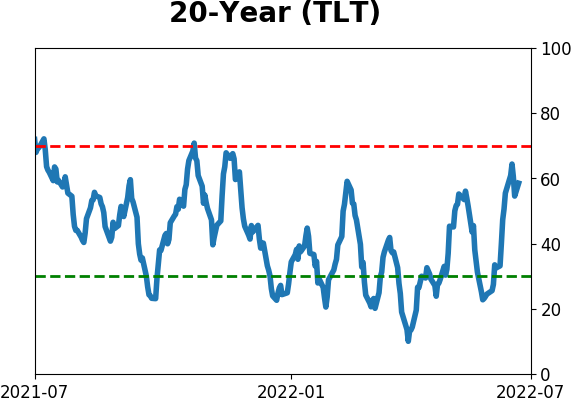
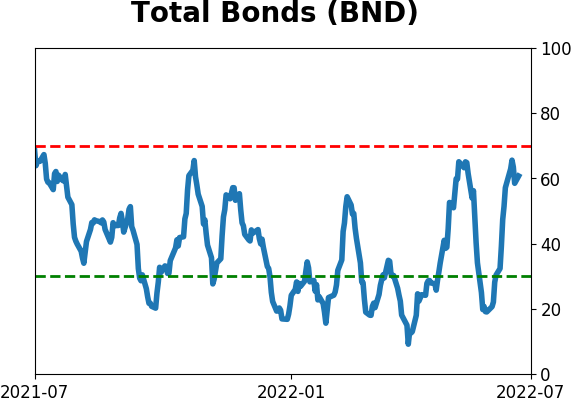
Bond ETF's - 10-Day Moving Average
|
|
|
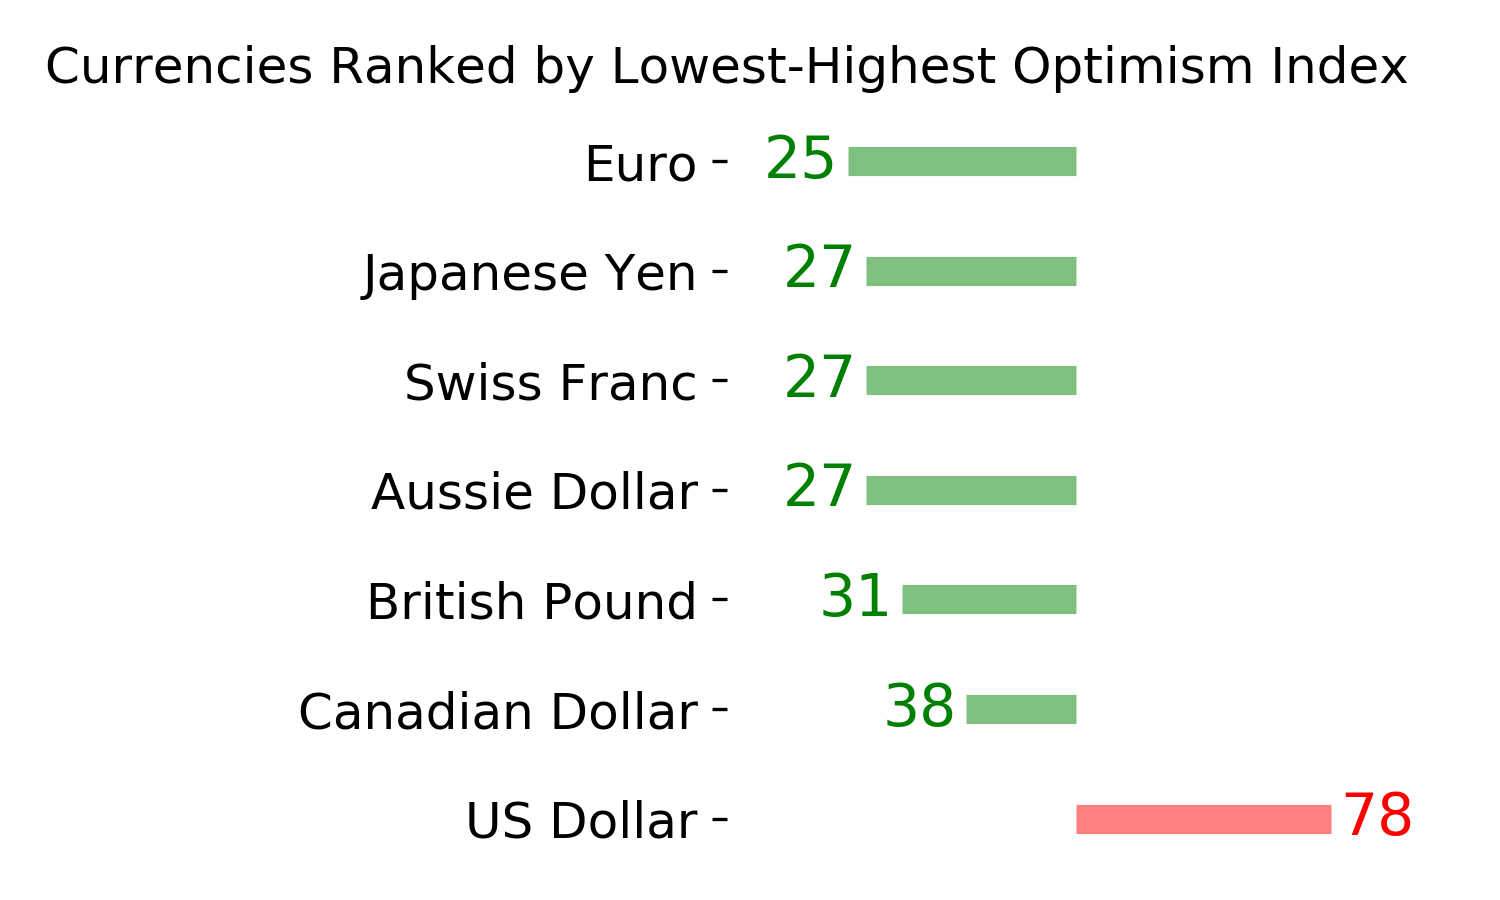
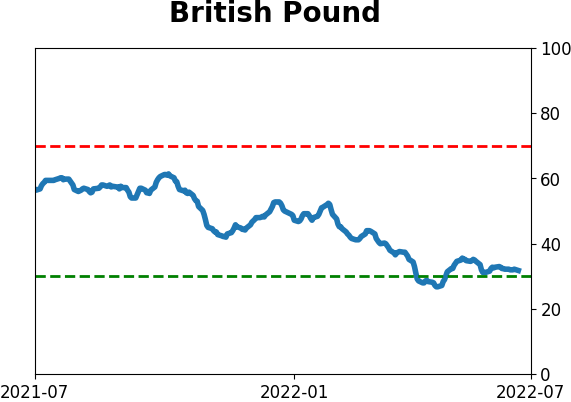
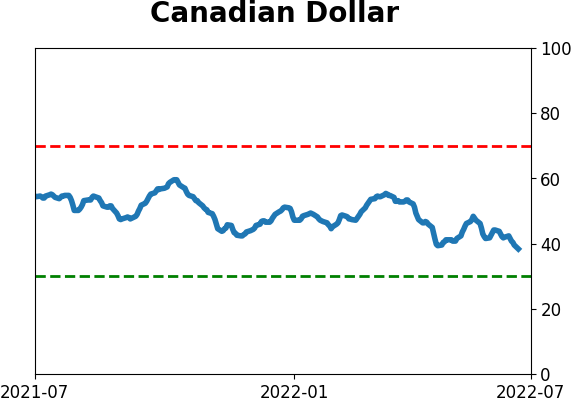
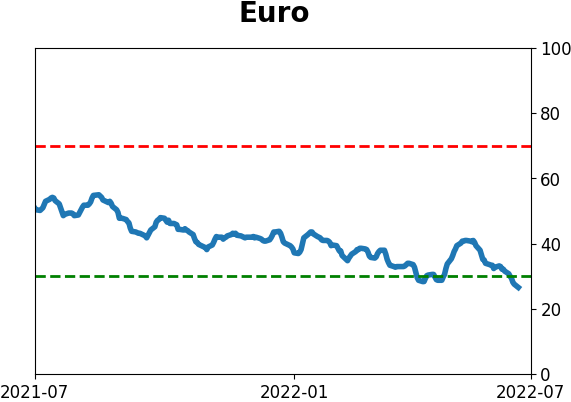
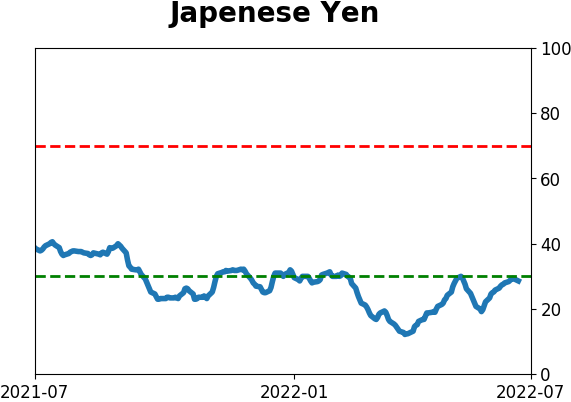
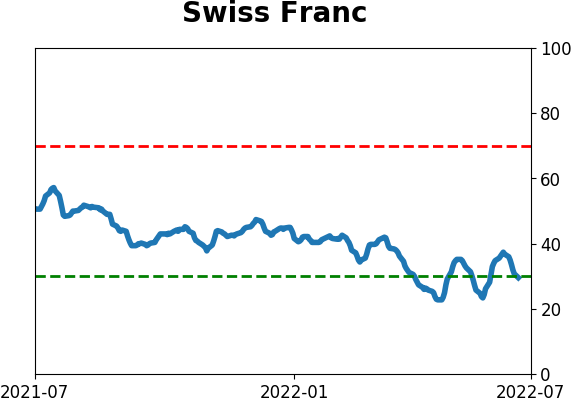
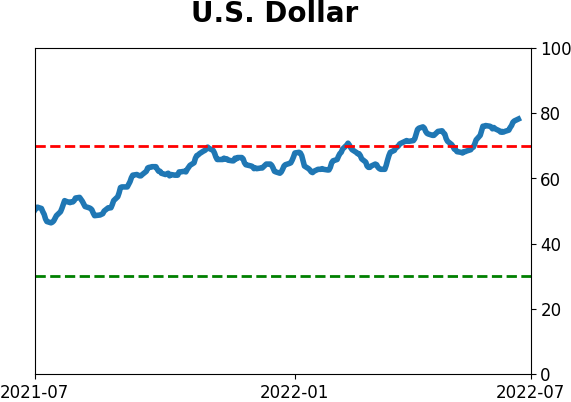
Currency ETF's - 5-Day Moving Average
|
|
|
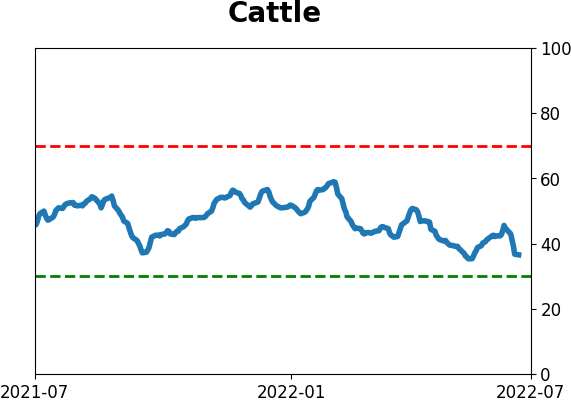
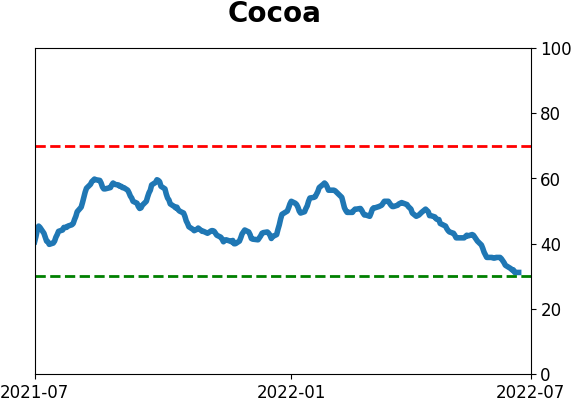
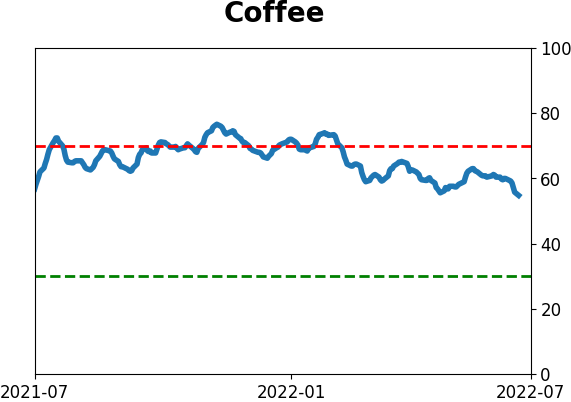
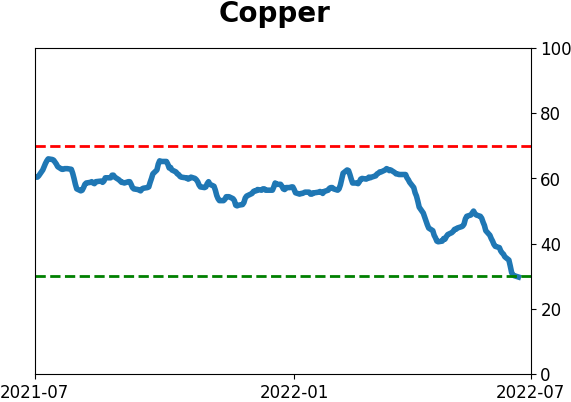
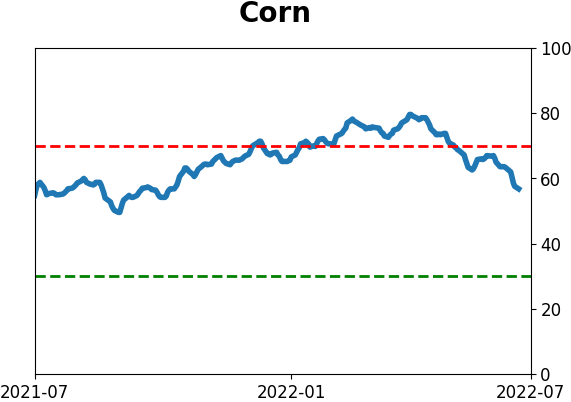
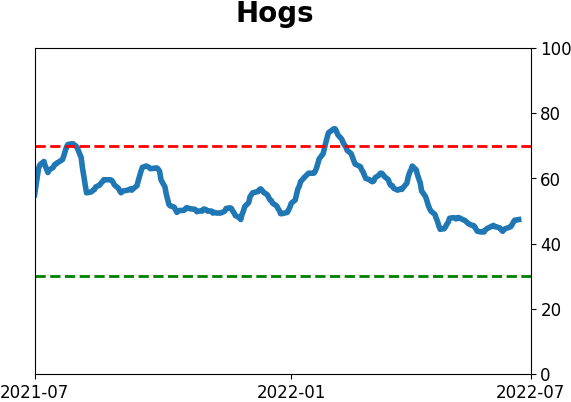
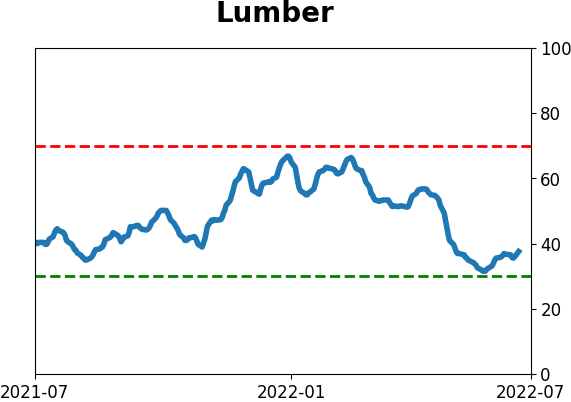
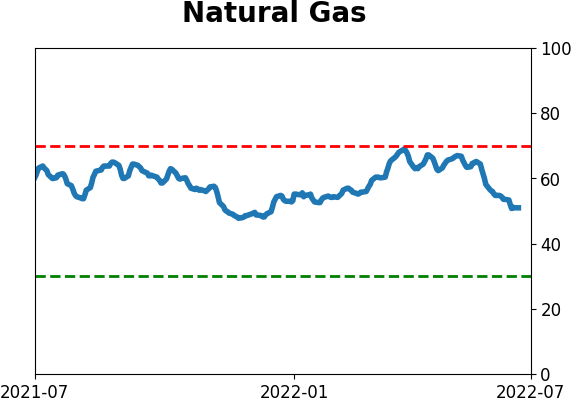
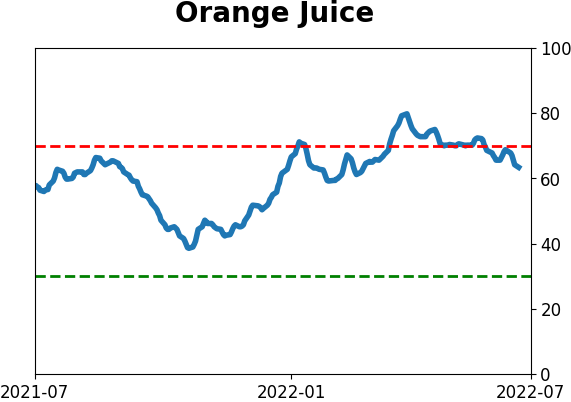
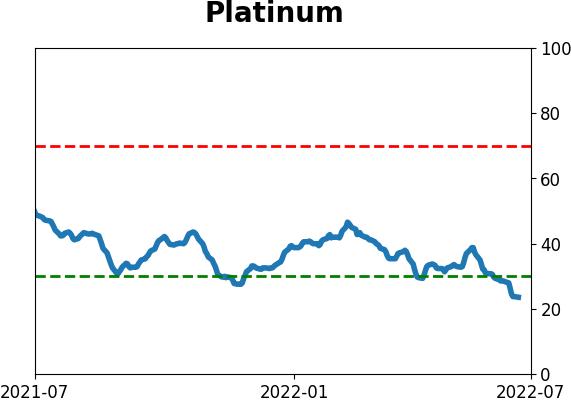
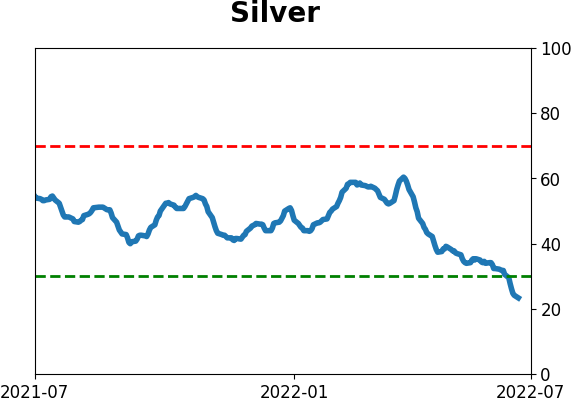
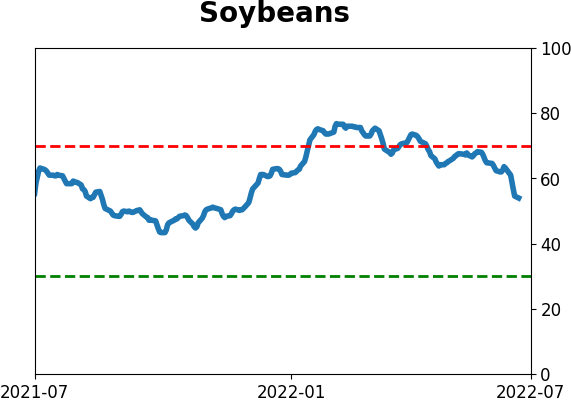
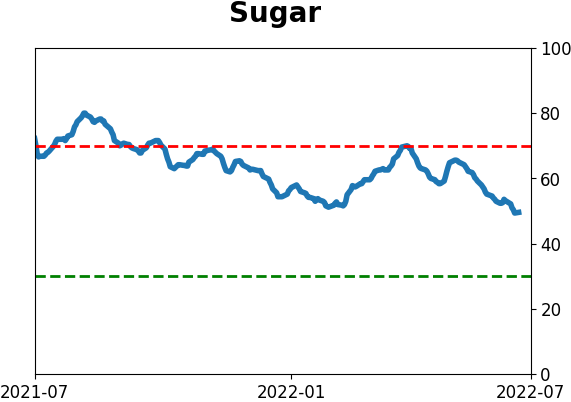
Commodity ETF's - 5-Day Moving Average
|
|