Headlines
|
|
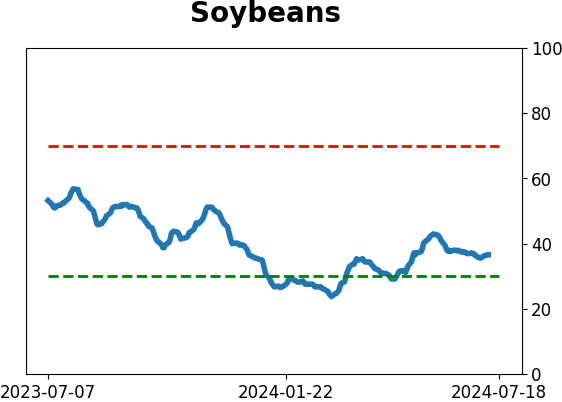
It's time to keep an eye on soybeans:
Soybean prices have been weak for almost a year. Now, beans are entering their most consistently unfavorable period of the year. Can prices continue to fall? Here, we analyze almost 70 years of history to give traders some idea of what to expect.
|
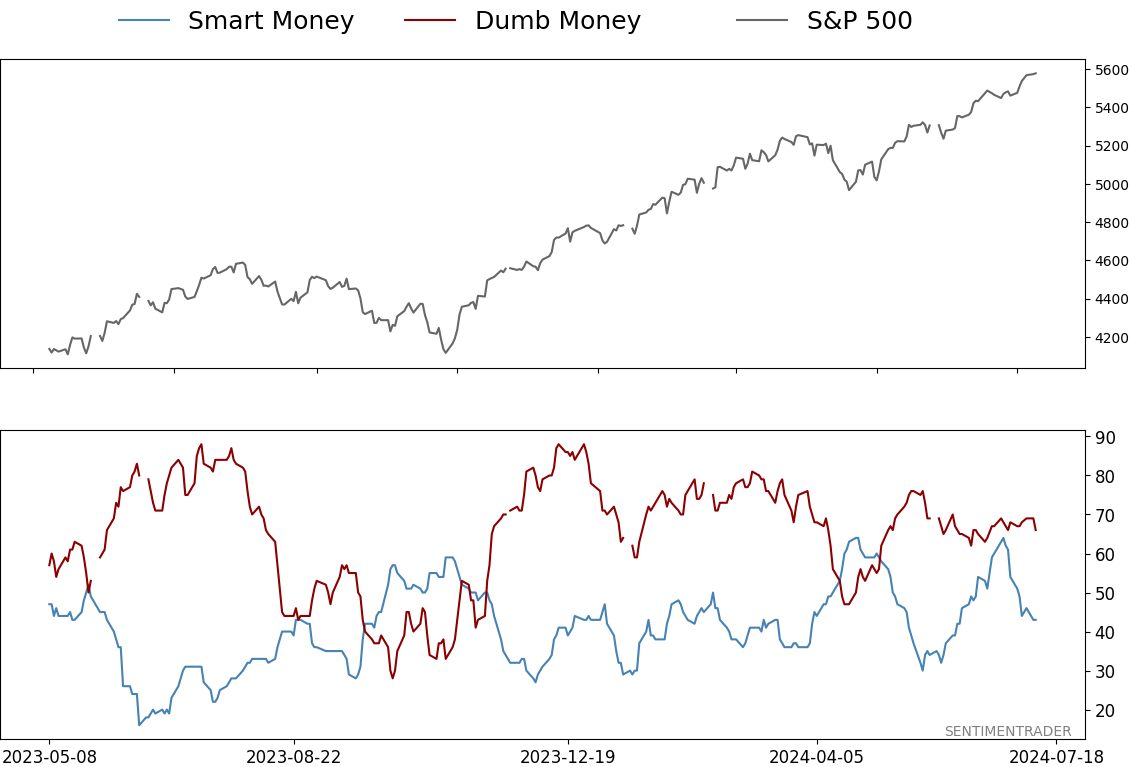
Smart / Dumb Money Confidence
|
Smart Money Confidence: 43%
Dumb Money Confidence: 66%
|
|
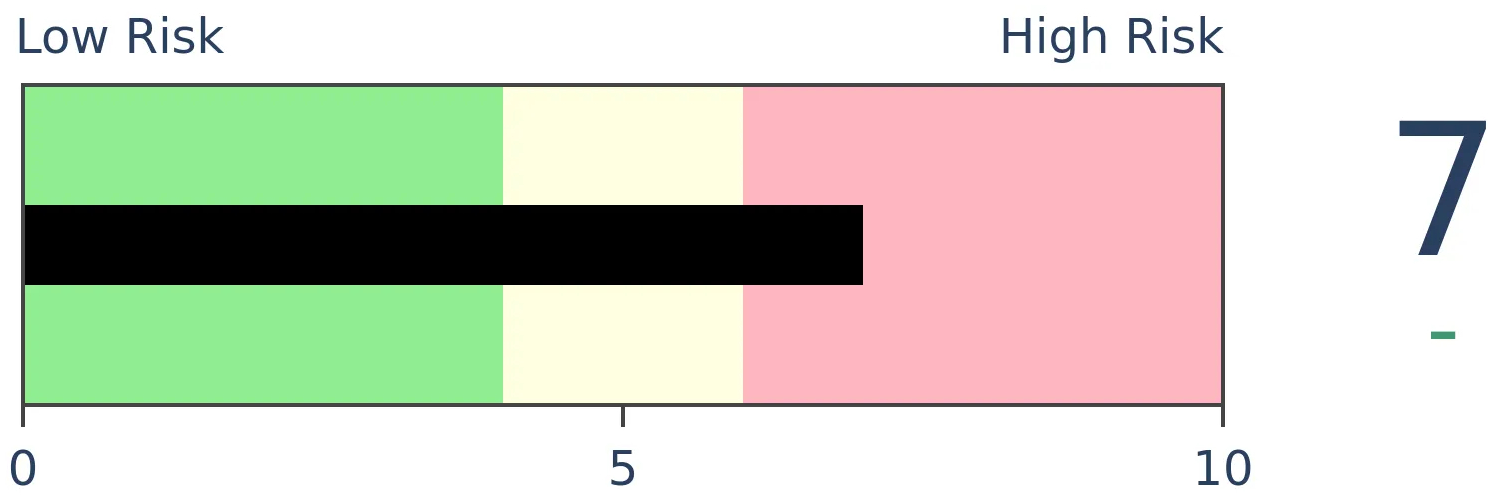
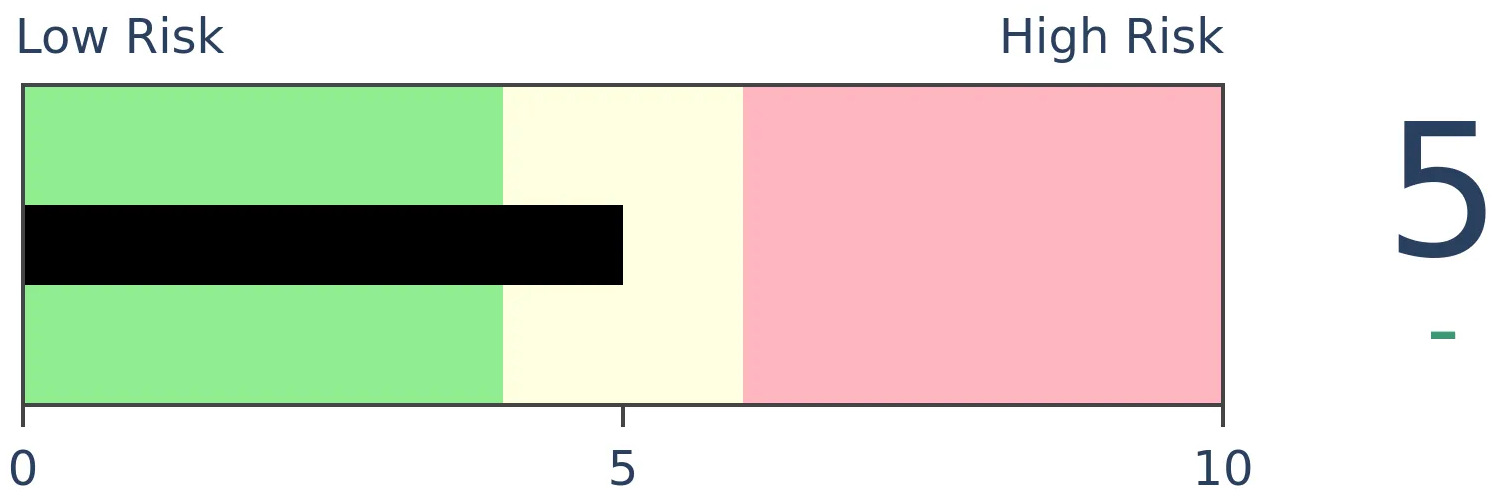
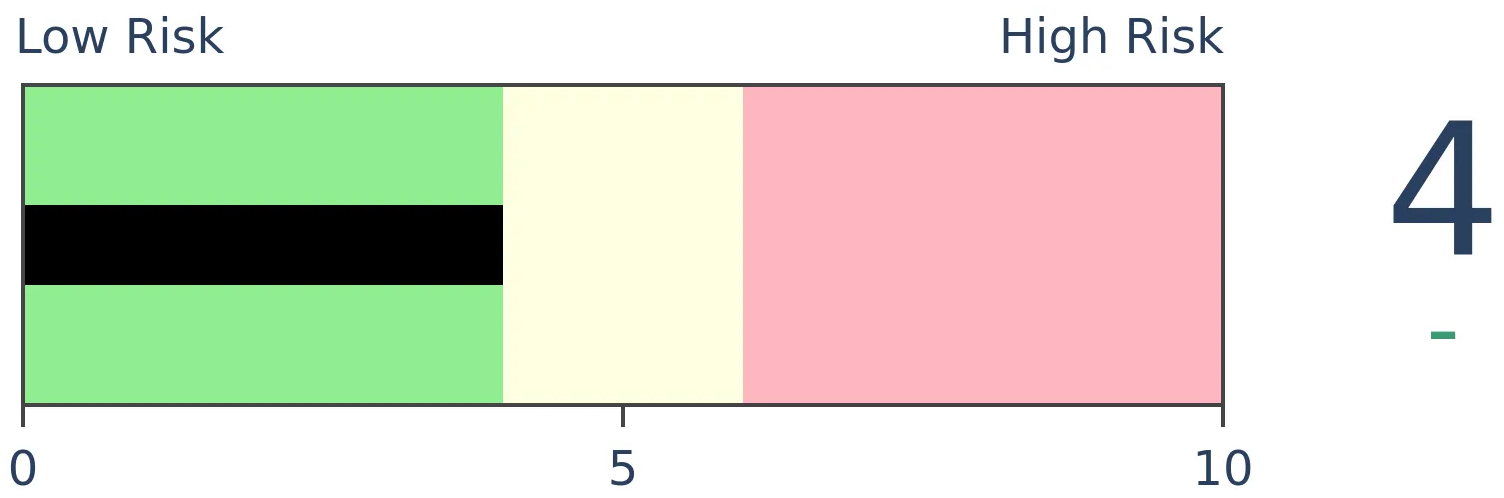
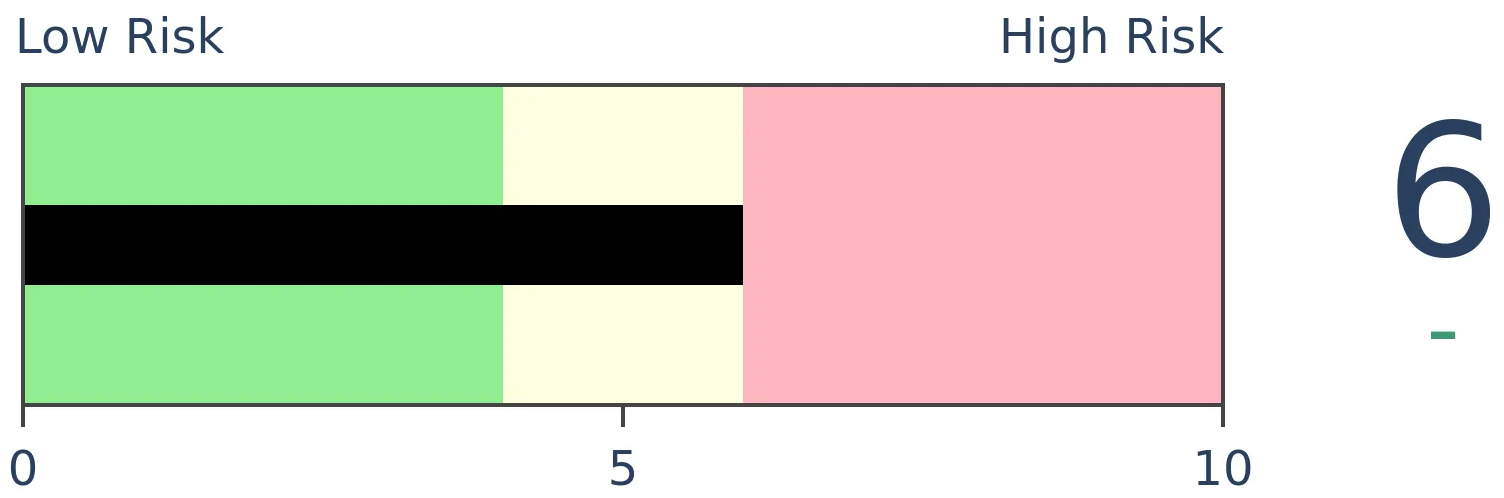
Risk Levels
Stocks Short-Term

|
Stocks Medium-Term
|
|
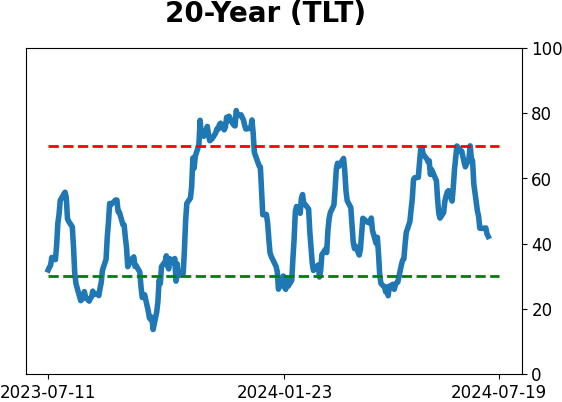
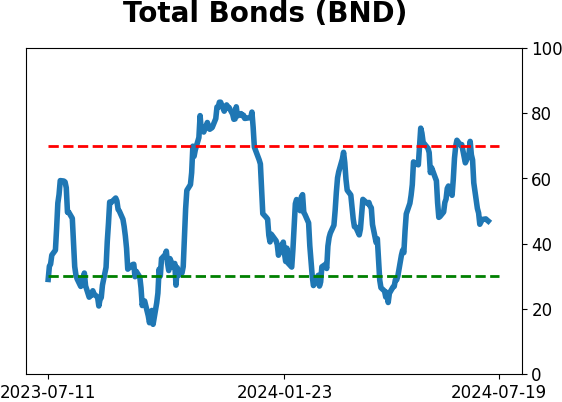
Bonds
|
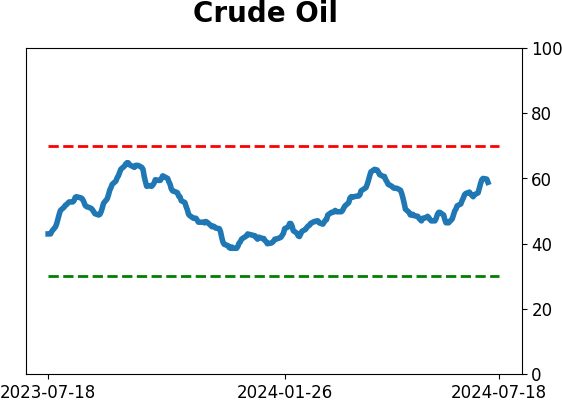
Crude Oil
|
|
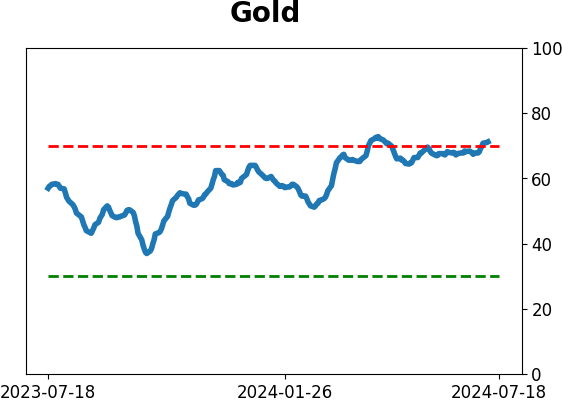
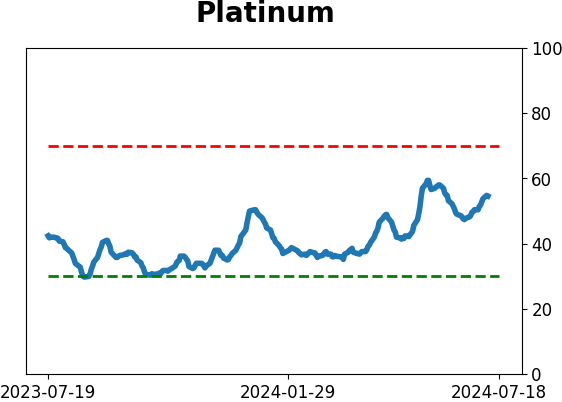
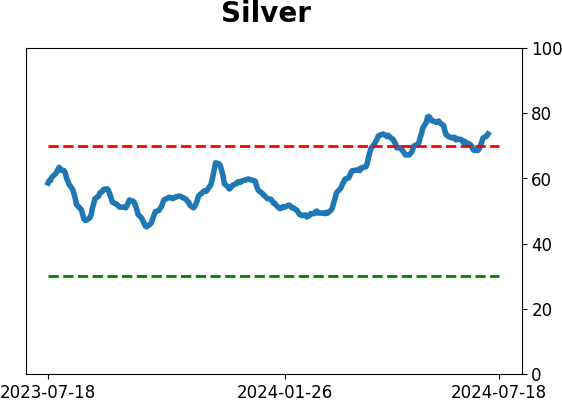
Gold
|
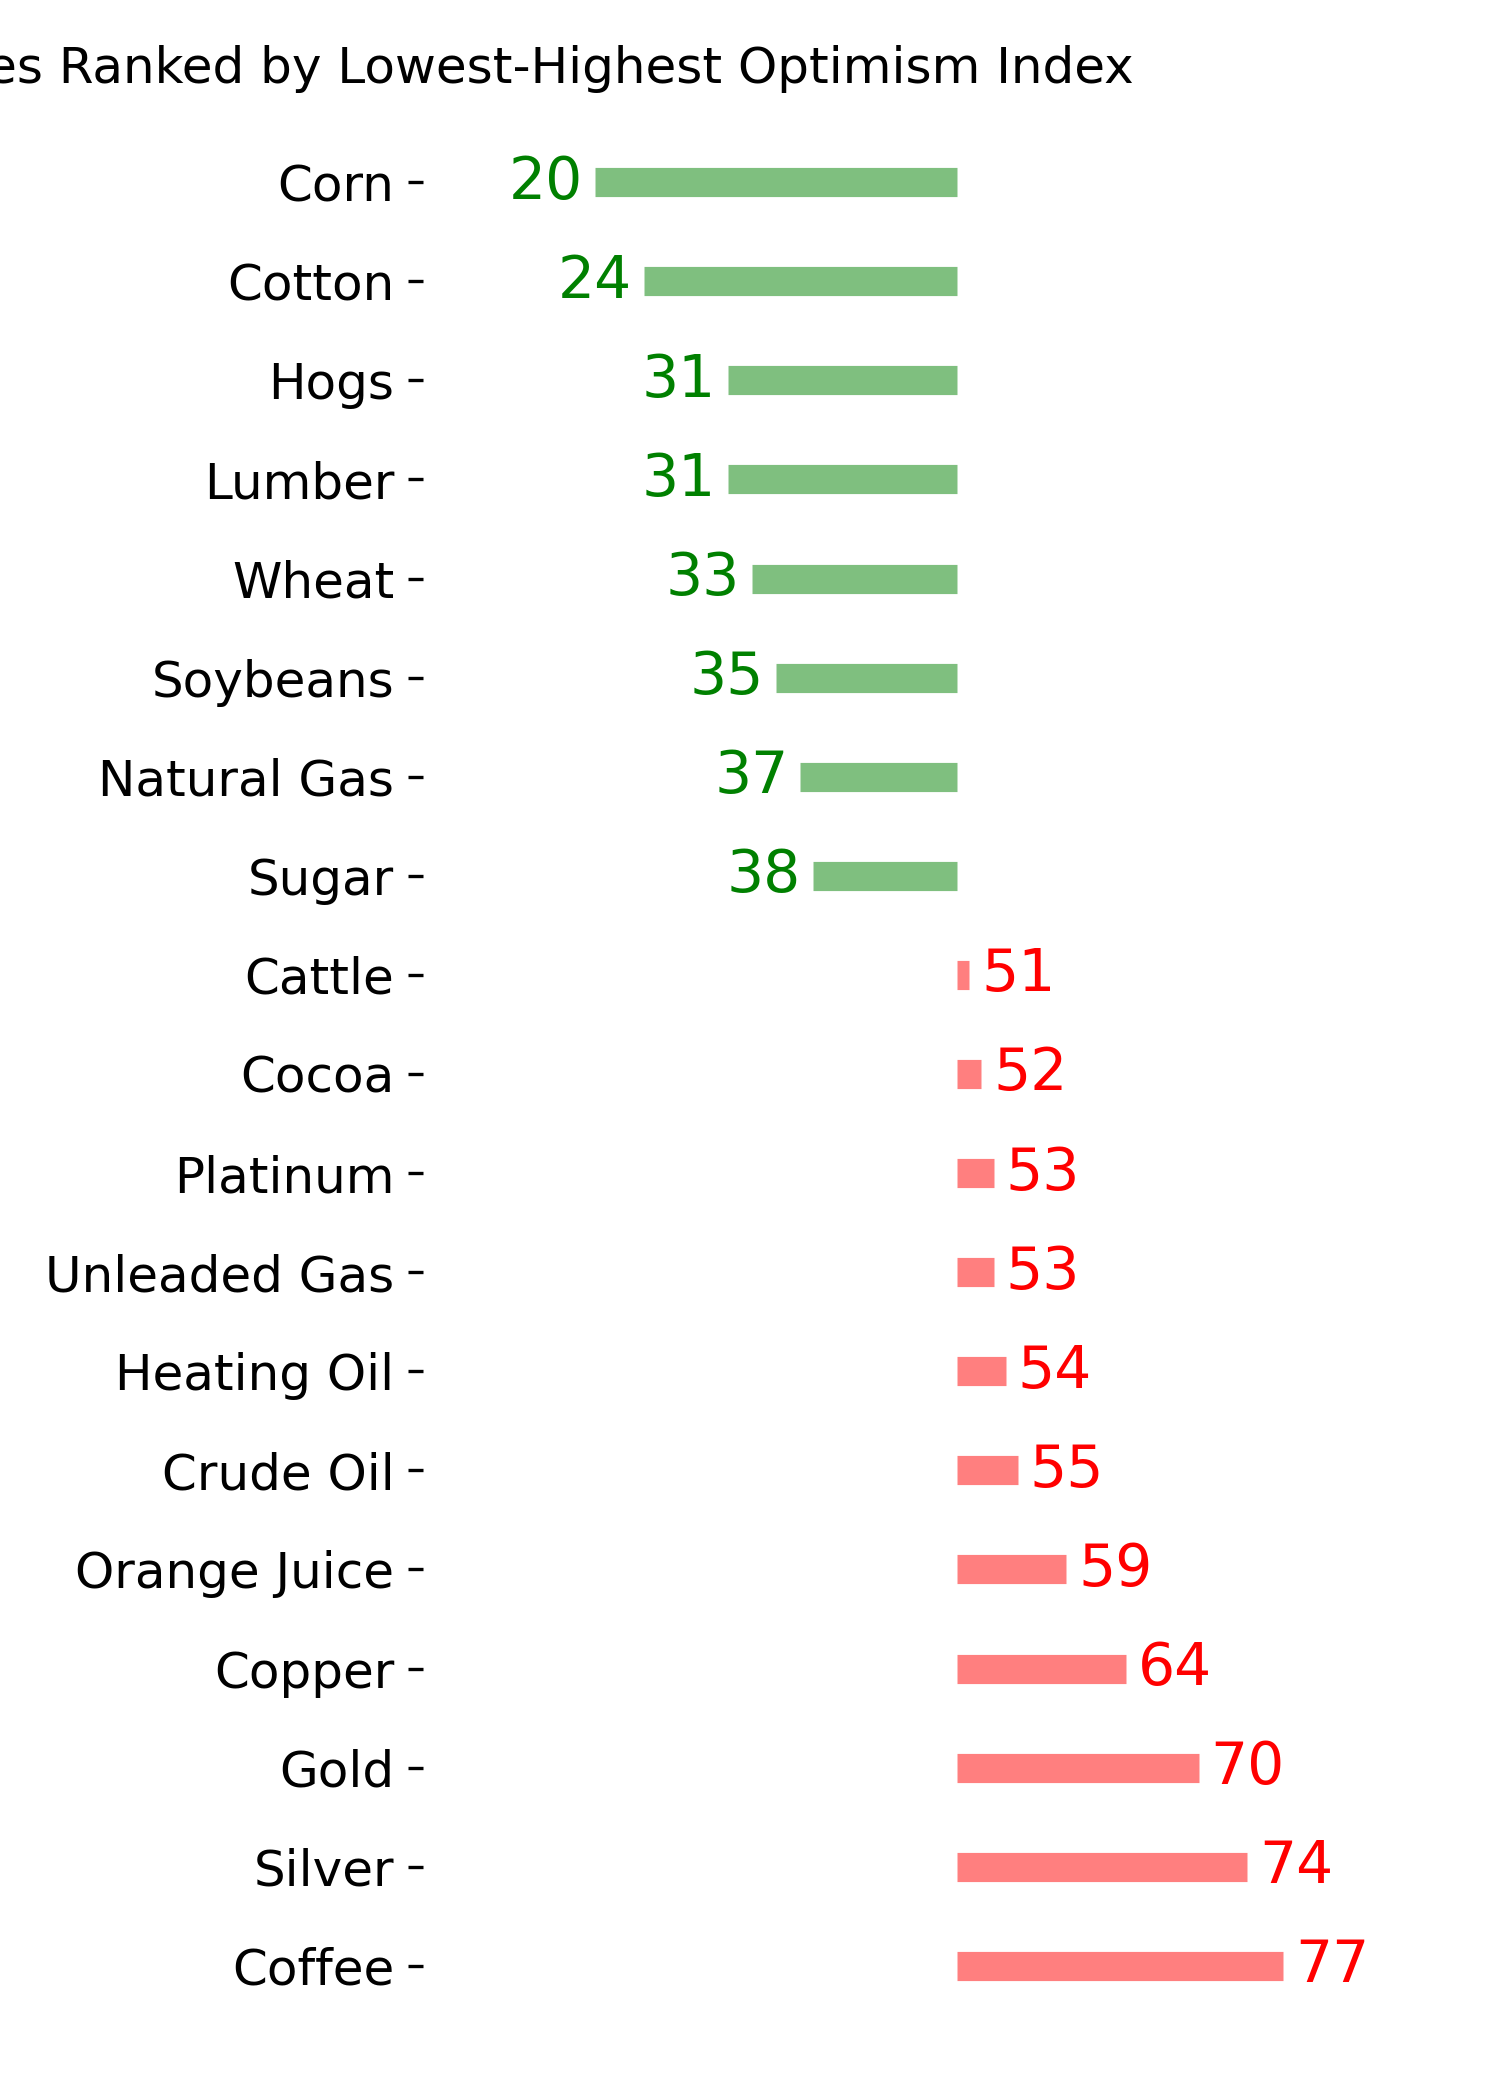
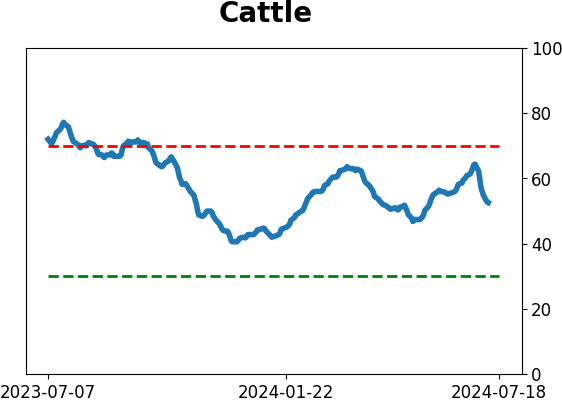
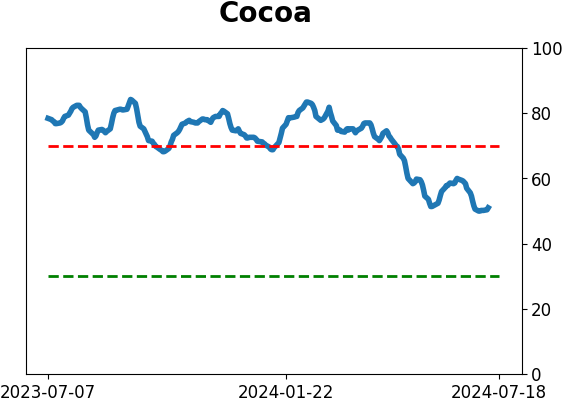
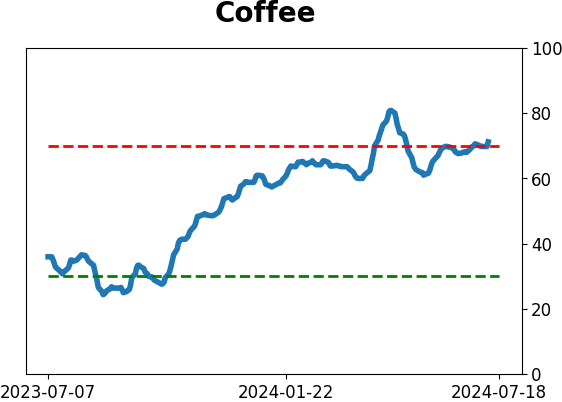
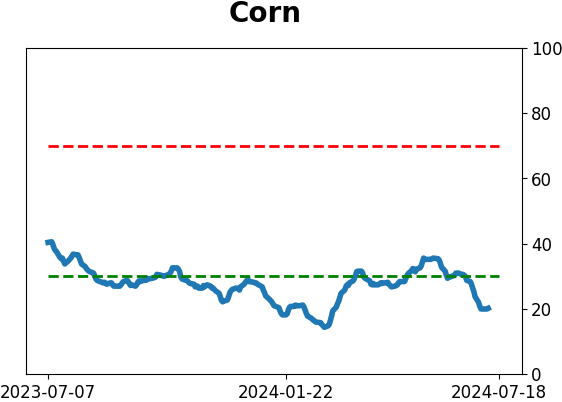
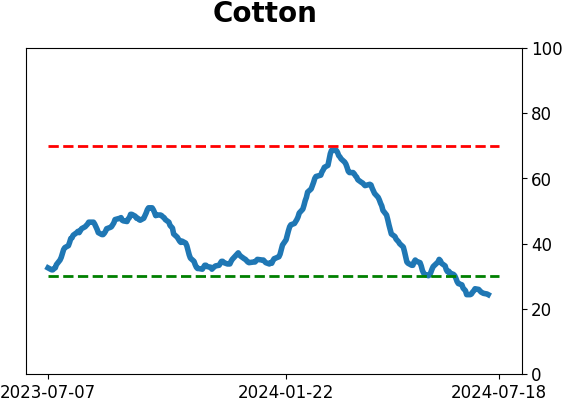
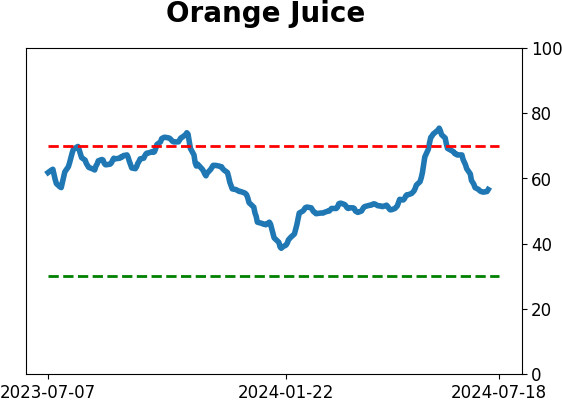
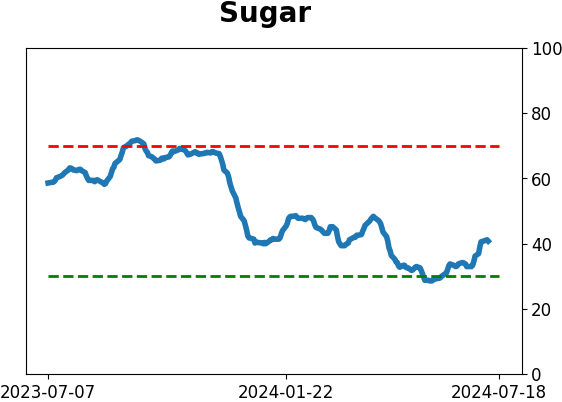
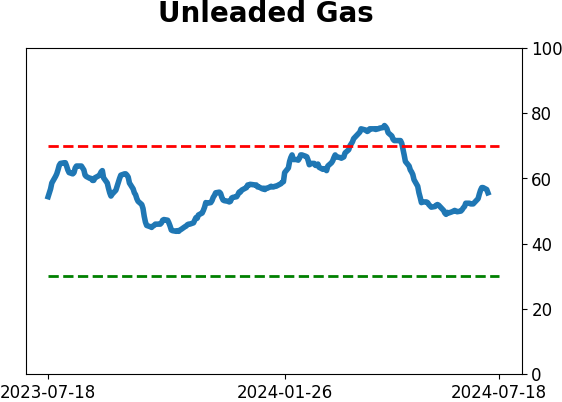
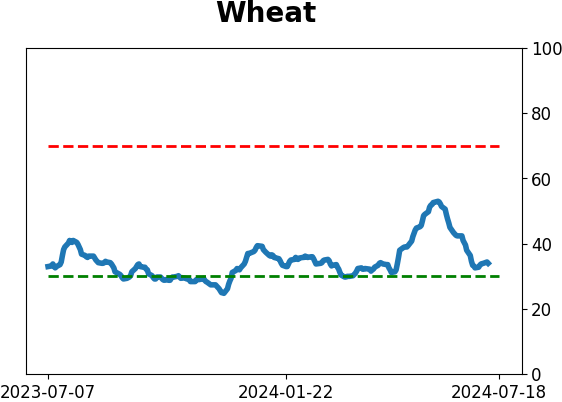
Agriculture

|
|
Research
By Jay Kaeppel
BOTTOM LINE
Soybean prices have been weak for almost a year. Now, beans are entering their most consistently unfavorable period of the year. Can prices continue to fall? Here, we analyze almost 70 years of history to give traders some idea of what to expect.
FORECAST / TIMEFRAME
None
|
Key points
- Soybean prices have been exceptionally weak for almost a year
- Beans are just now entering the weakest seasonal period of the year
- The big question is, "Can the decline continue?"
- The current combination of seasonality and price action suggests the answer is "Yes"
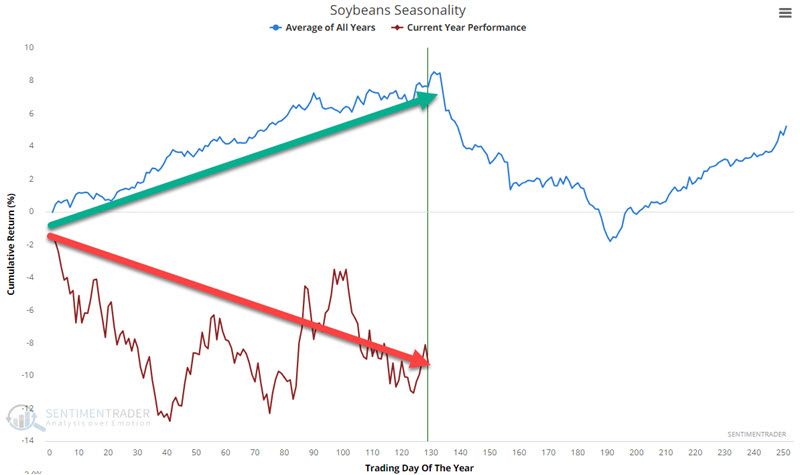
Soybean prices have plunged
Soybean prices have declined roughly 30% in the last year.
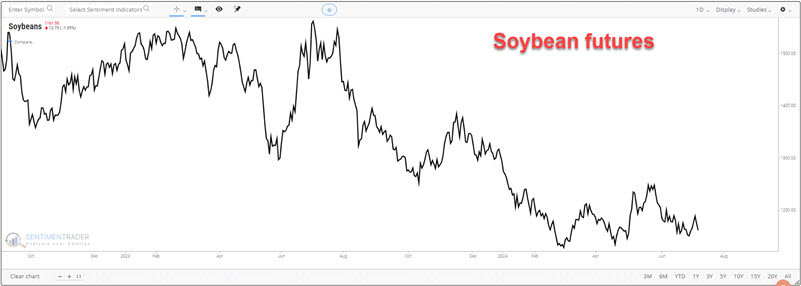
As the chart below shows, bean prices have bucked the usually favorable tendency they typically experience during the year's first half. This raises the question, "Can the price keep falling, and if so, how far?"
Beans are just now entering a period of typical seasonal weakness
A different look at the same chart highlights that July, August, and September are typically the weakest months of the year for beans.
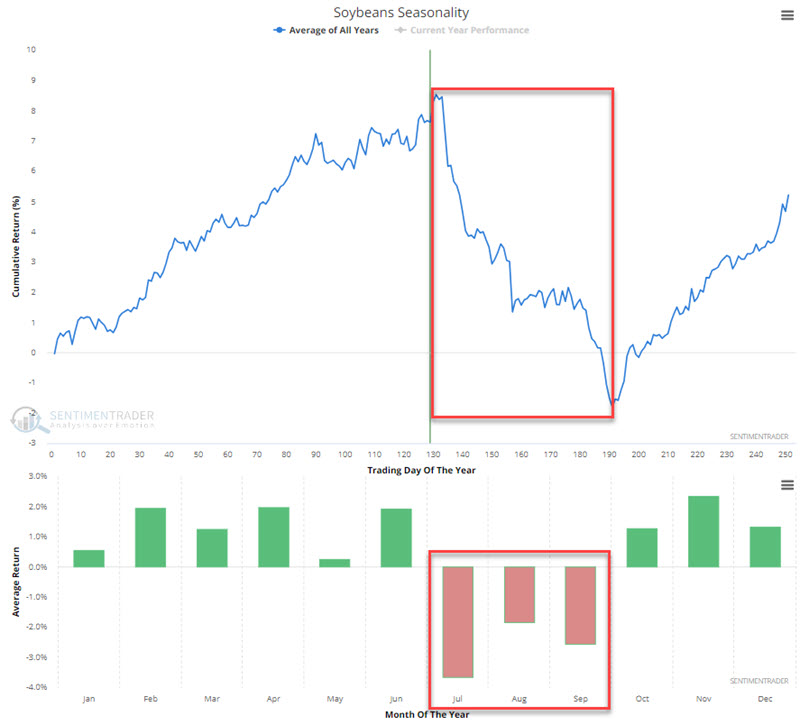
Specifically, the weakest seasonal time of year for beans extends from the close on Trading Day of the Year (TDY) #131 through the close of TDY #191. For 2024, this period extends from the close on 2024-07-10 through 2024-10-03.
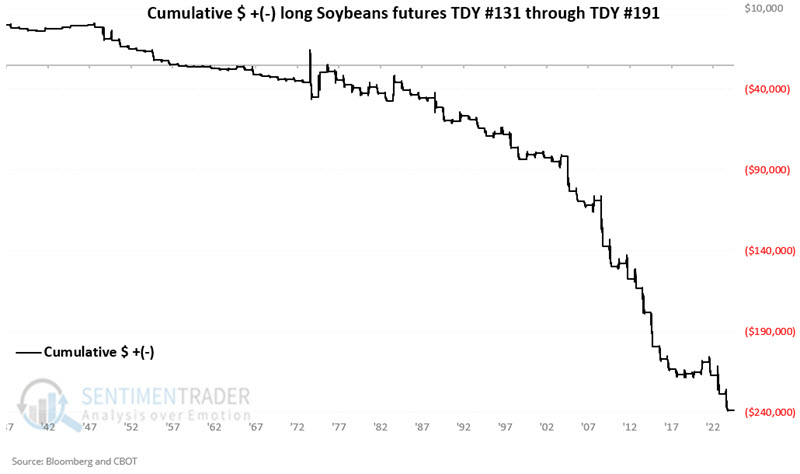
The chart below displays the hypothetical dollar +(-) from holding long one soybean futures contract only during this period every year since 1937.
The table below summarizes soybean performance during this period.
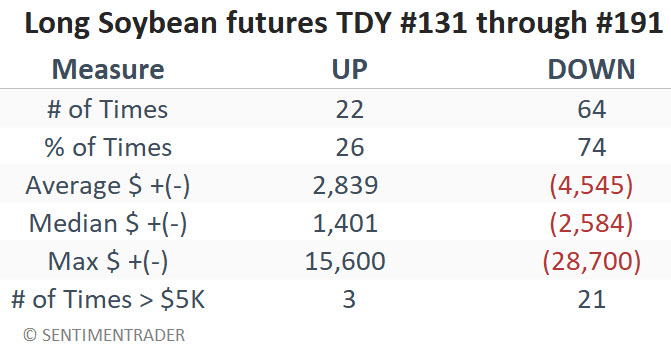
The equity curve chart shown above displaying soybean futures performance during July, August, and September resembles a waterfall and creates the illusion that a decline is practically a sure thing. However, a closer look at the results reminds us that in roughly 1 out of every four years (26% of the time, to be exact), beans buck the trend and rally. In fact, in 1974, beans rallied over $15,000 in contract value, and in 1983, they popped over $12,000 in value. So, as always, there is no such thing as "easy money" to be made in the financial markets. Nevertheless, playing the long side of soybeans in the months ahead would involve flying in the face of a persistent seasonal tendency.
What the research tells us…
Typically, the best time to use seasonal trends is to look for situations when price action is trending in the direction of the expected seasonal trend. We have soybeans about to enter their weakest time of year, with price action firmly ensconced in a downtrend. So, is it "easy money" time? If only. With soybeans as oversold as they are presently, the potential for a sharp counter-trend rally - even if short-lived - is high. And yet, everything is lined up for a continued down move. So, what's a trader to do?
This is where theory and reality diverge. In theory, soybeans should continue to decline in price. In reality, each trader must make important decisions regarding what price or indicator action will trigger them to enter the market on the short side, how much capital they are willing to risk, and where to place a stop-loss order. Remember, setups and indicators - no matter how promising they appear - never relieve you of your responsibility to manage your trades and the capital in your account.
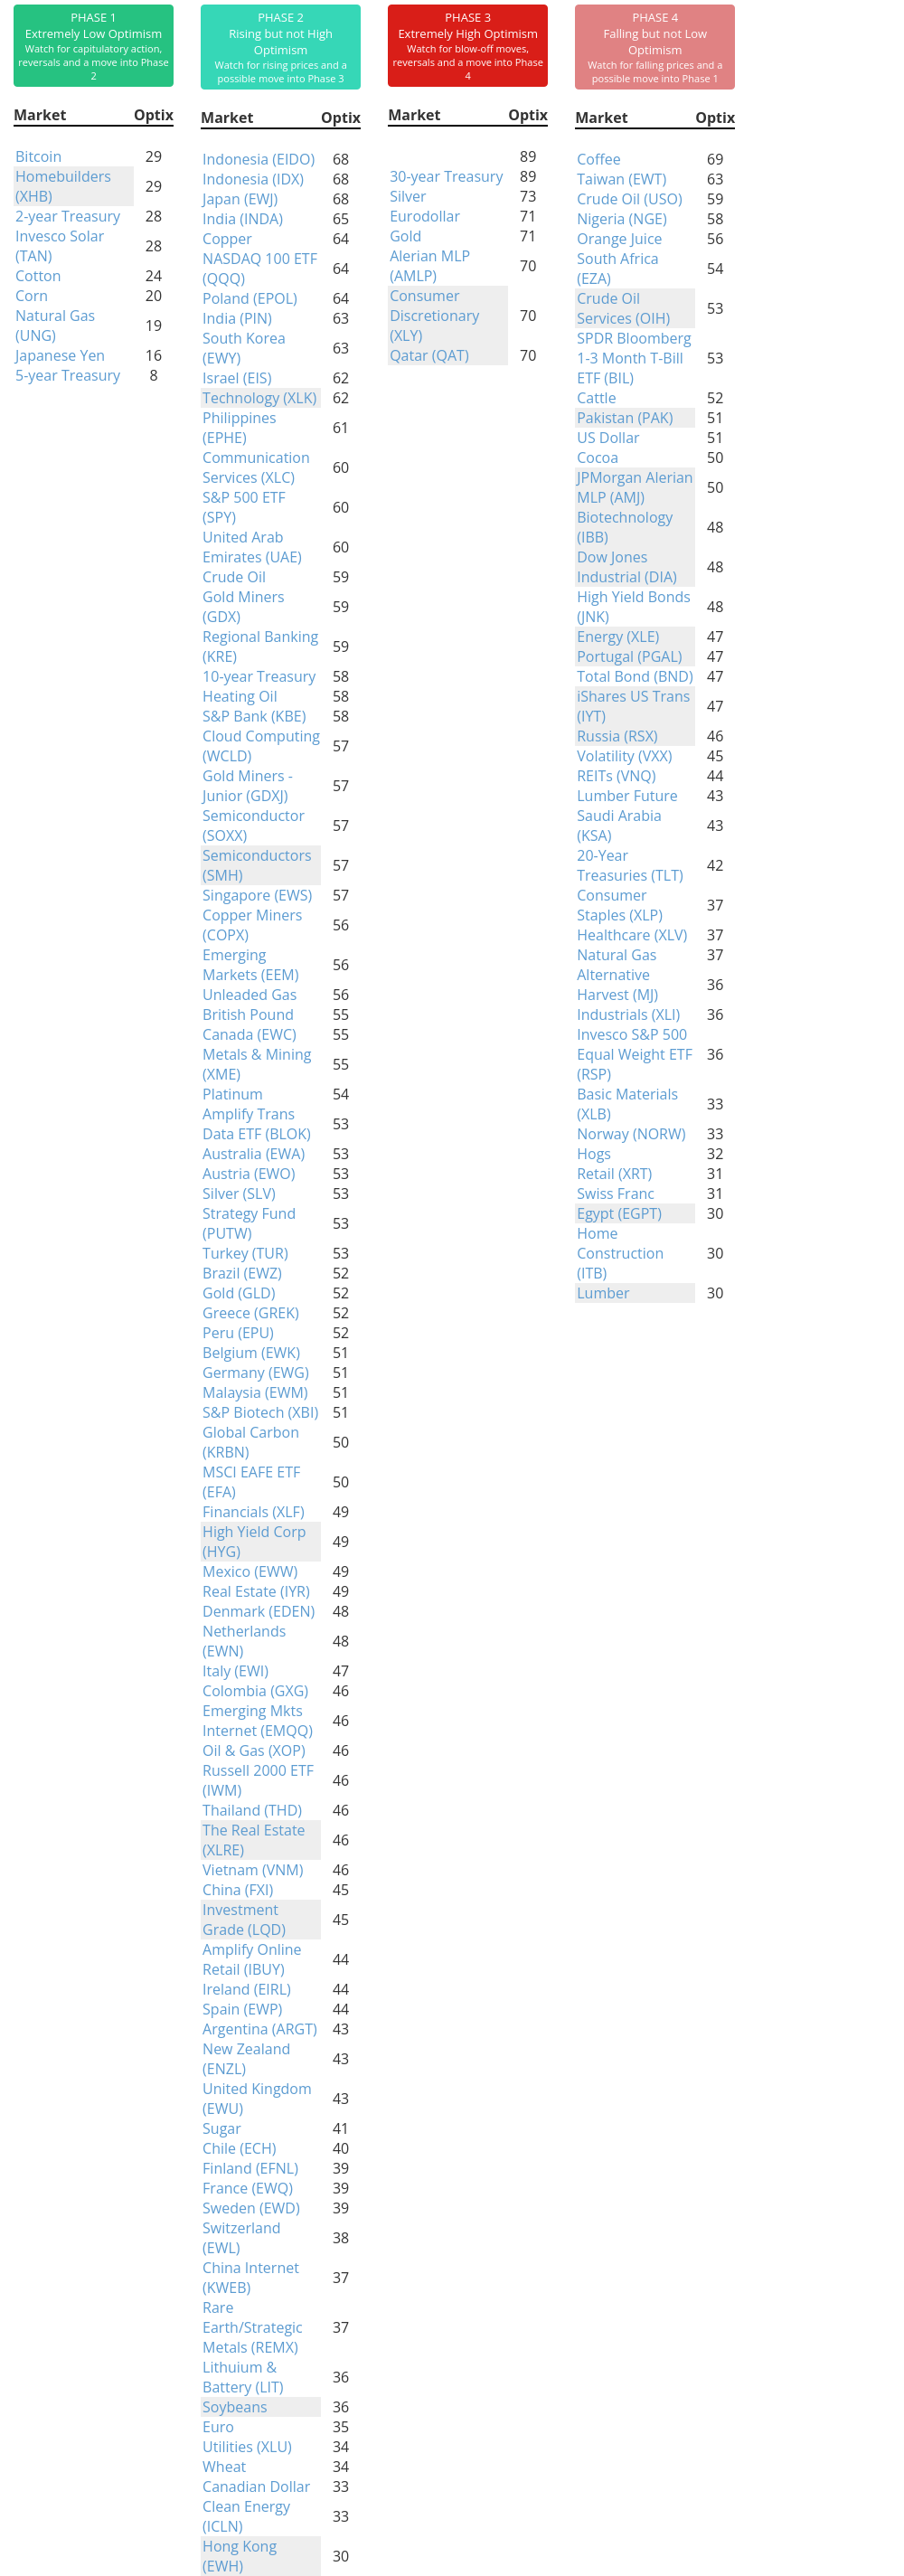
Indicators at Extremes
Phase Table
Ranks
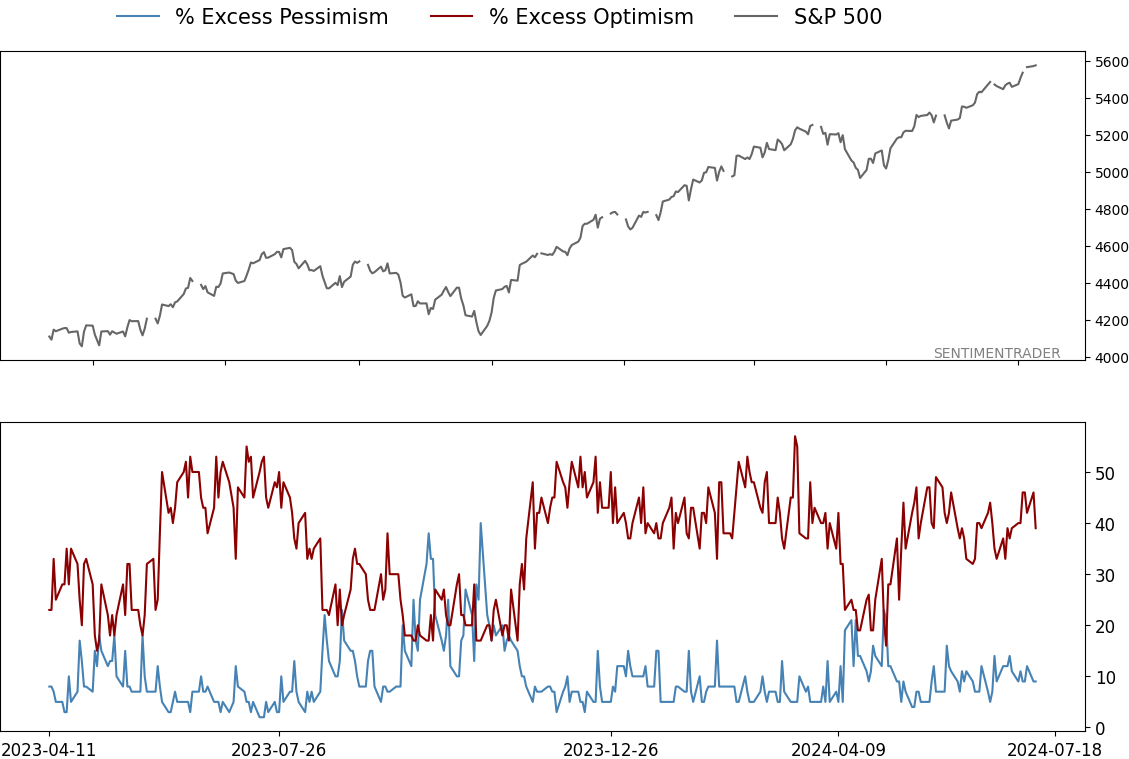
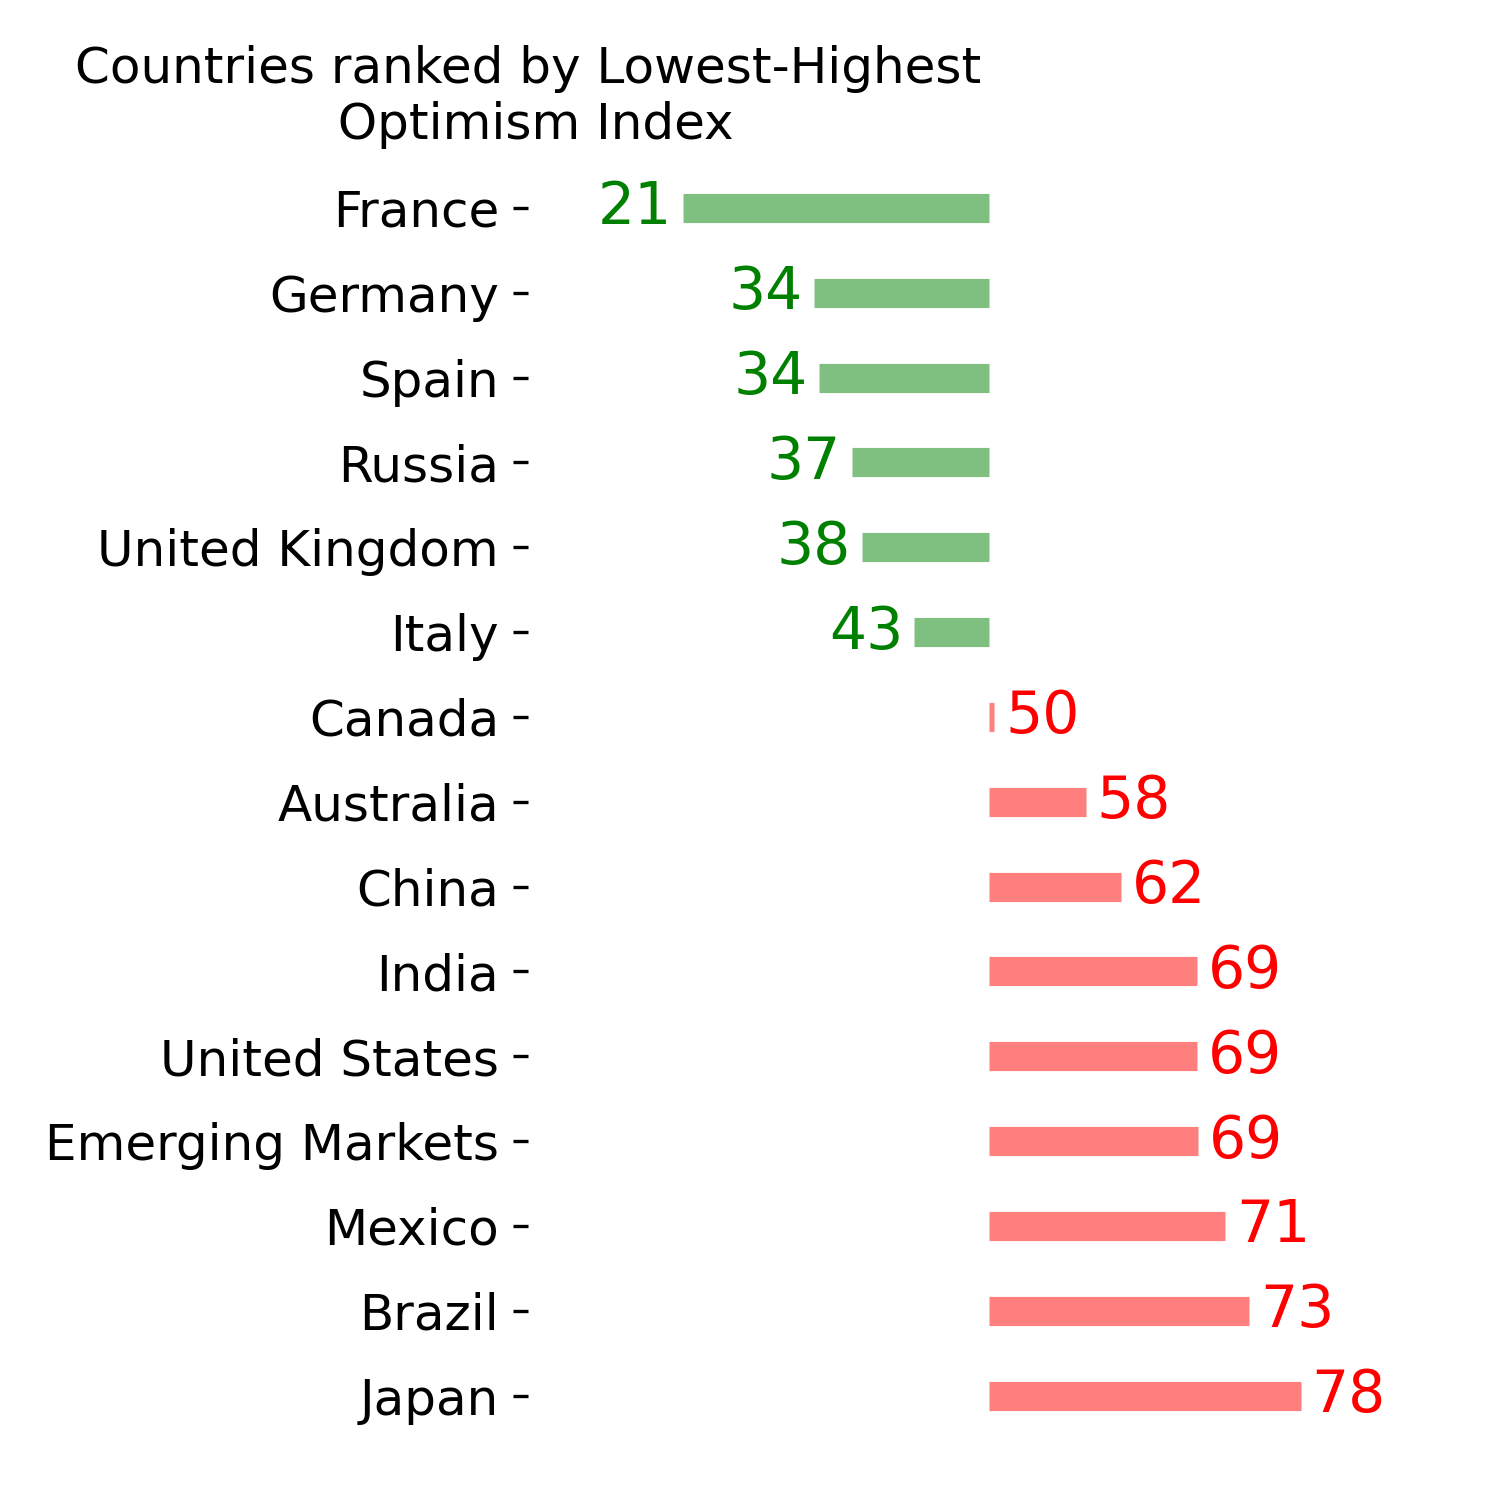
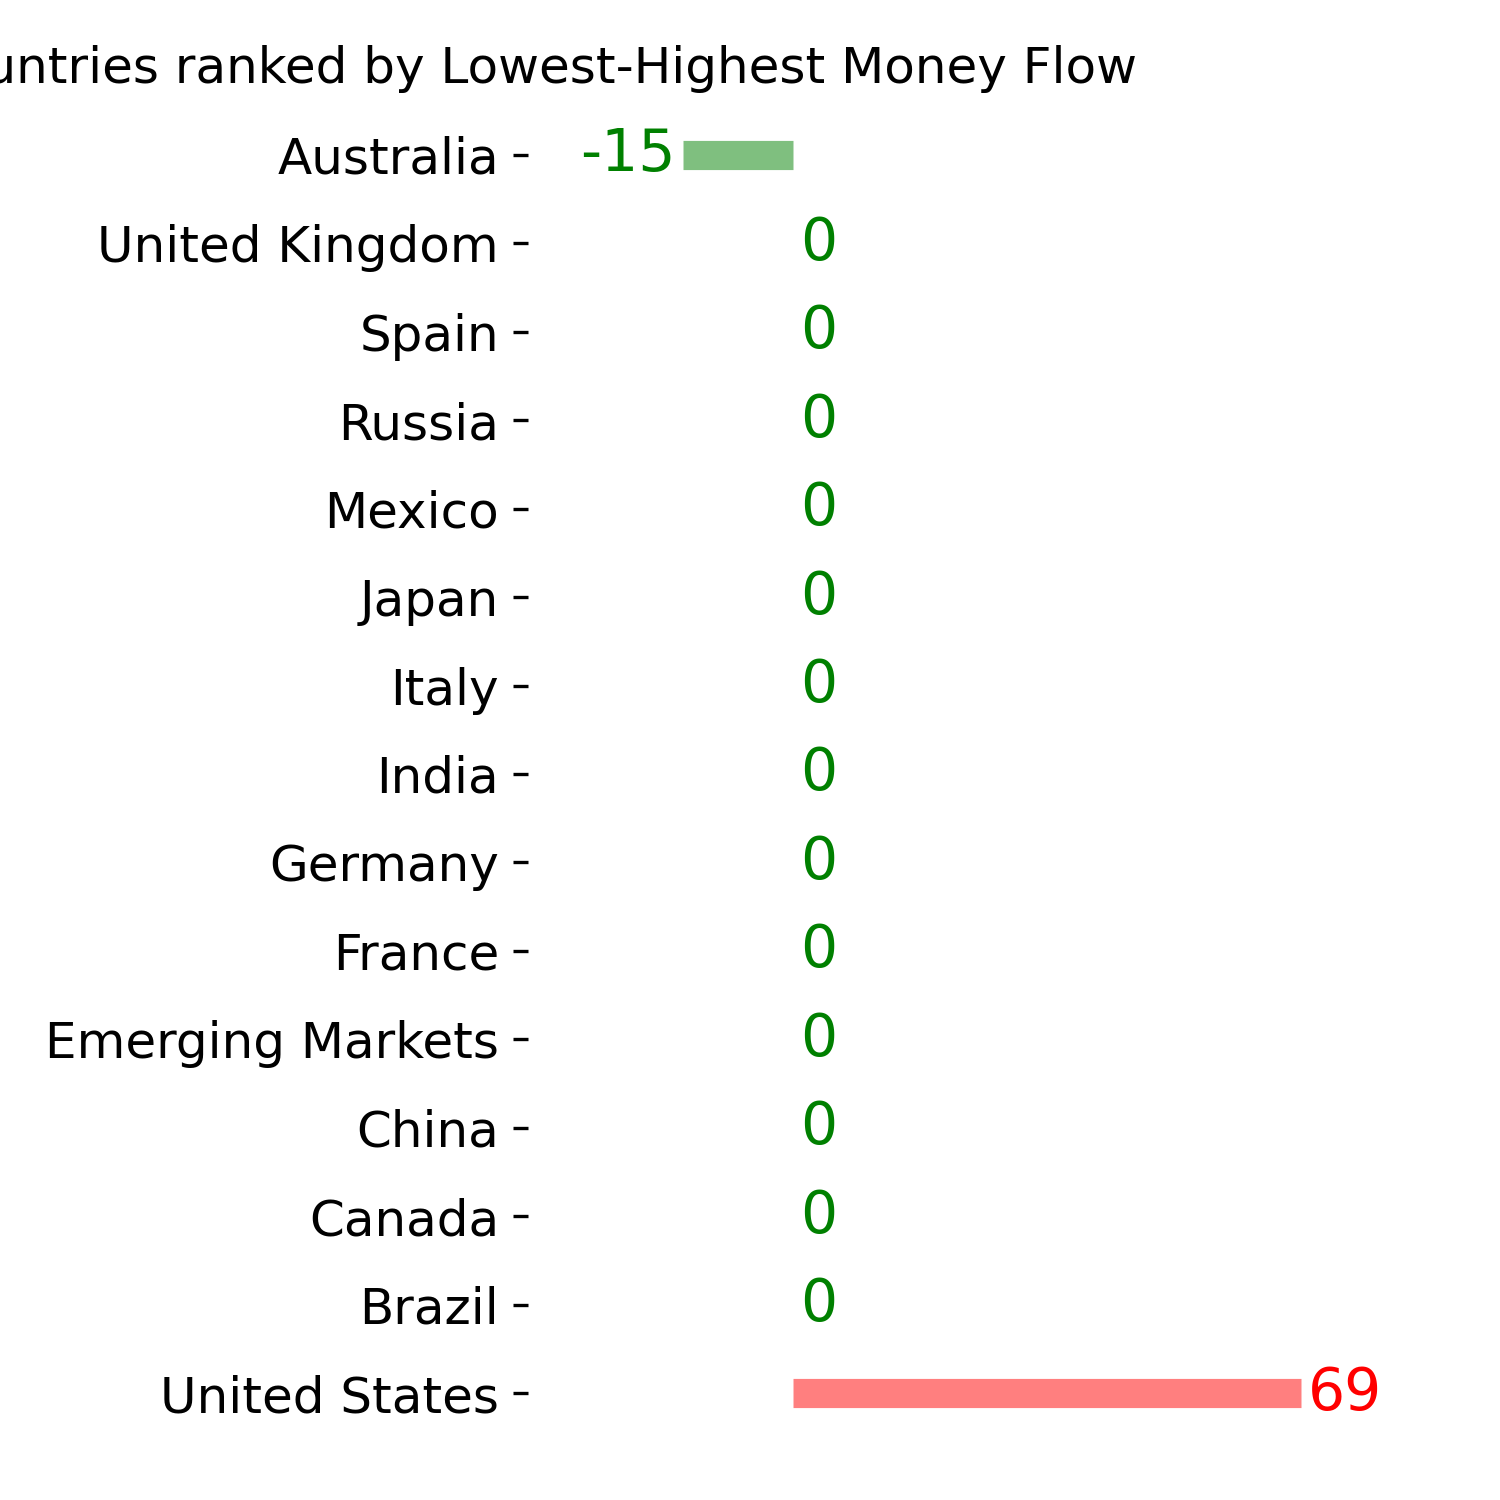
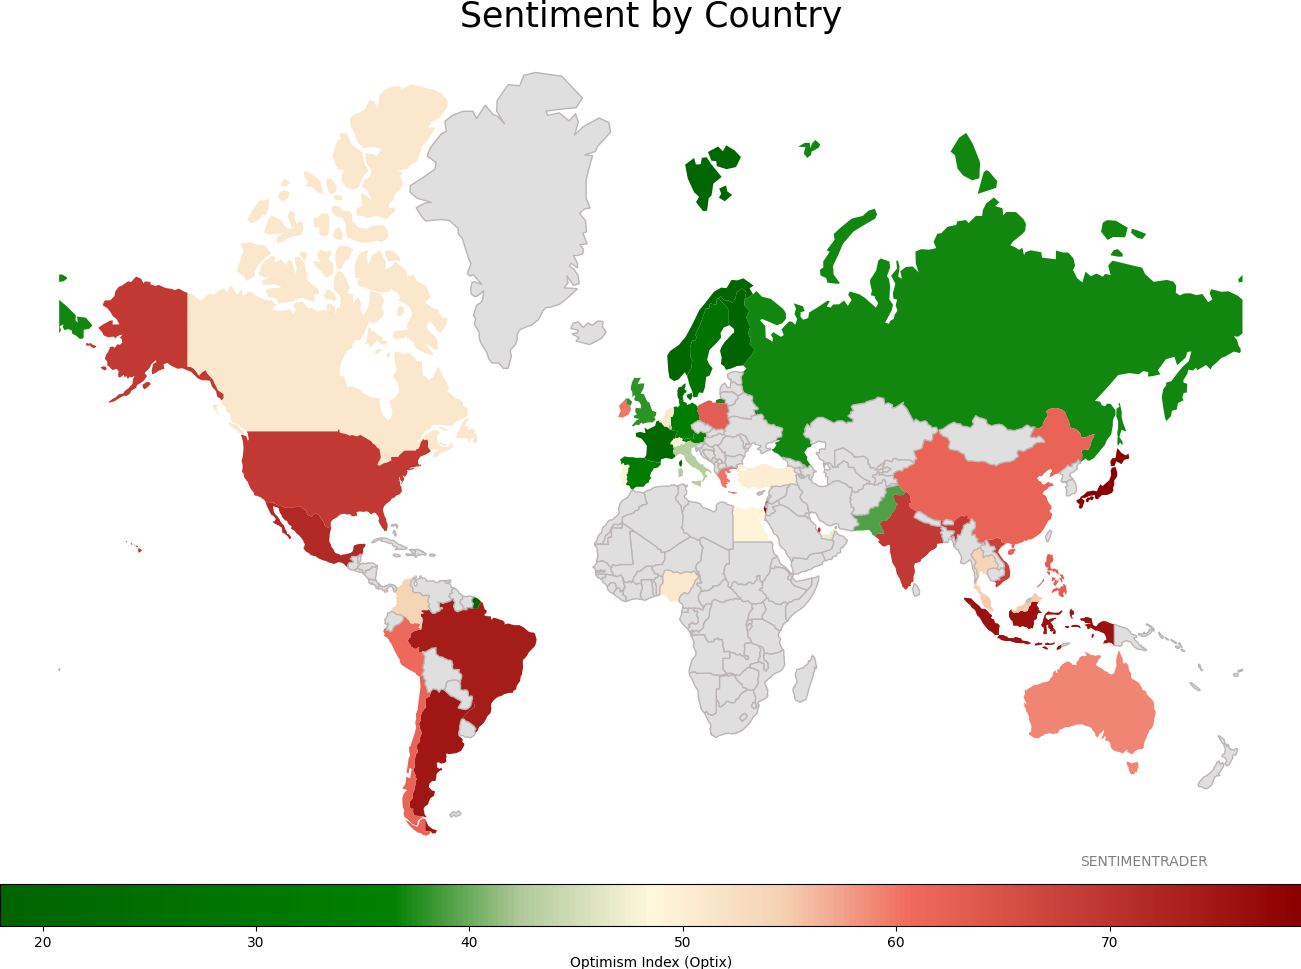
Sentiment Around The World
Optimism Index Thumbnails
|
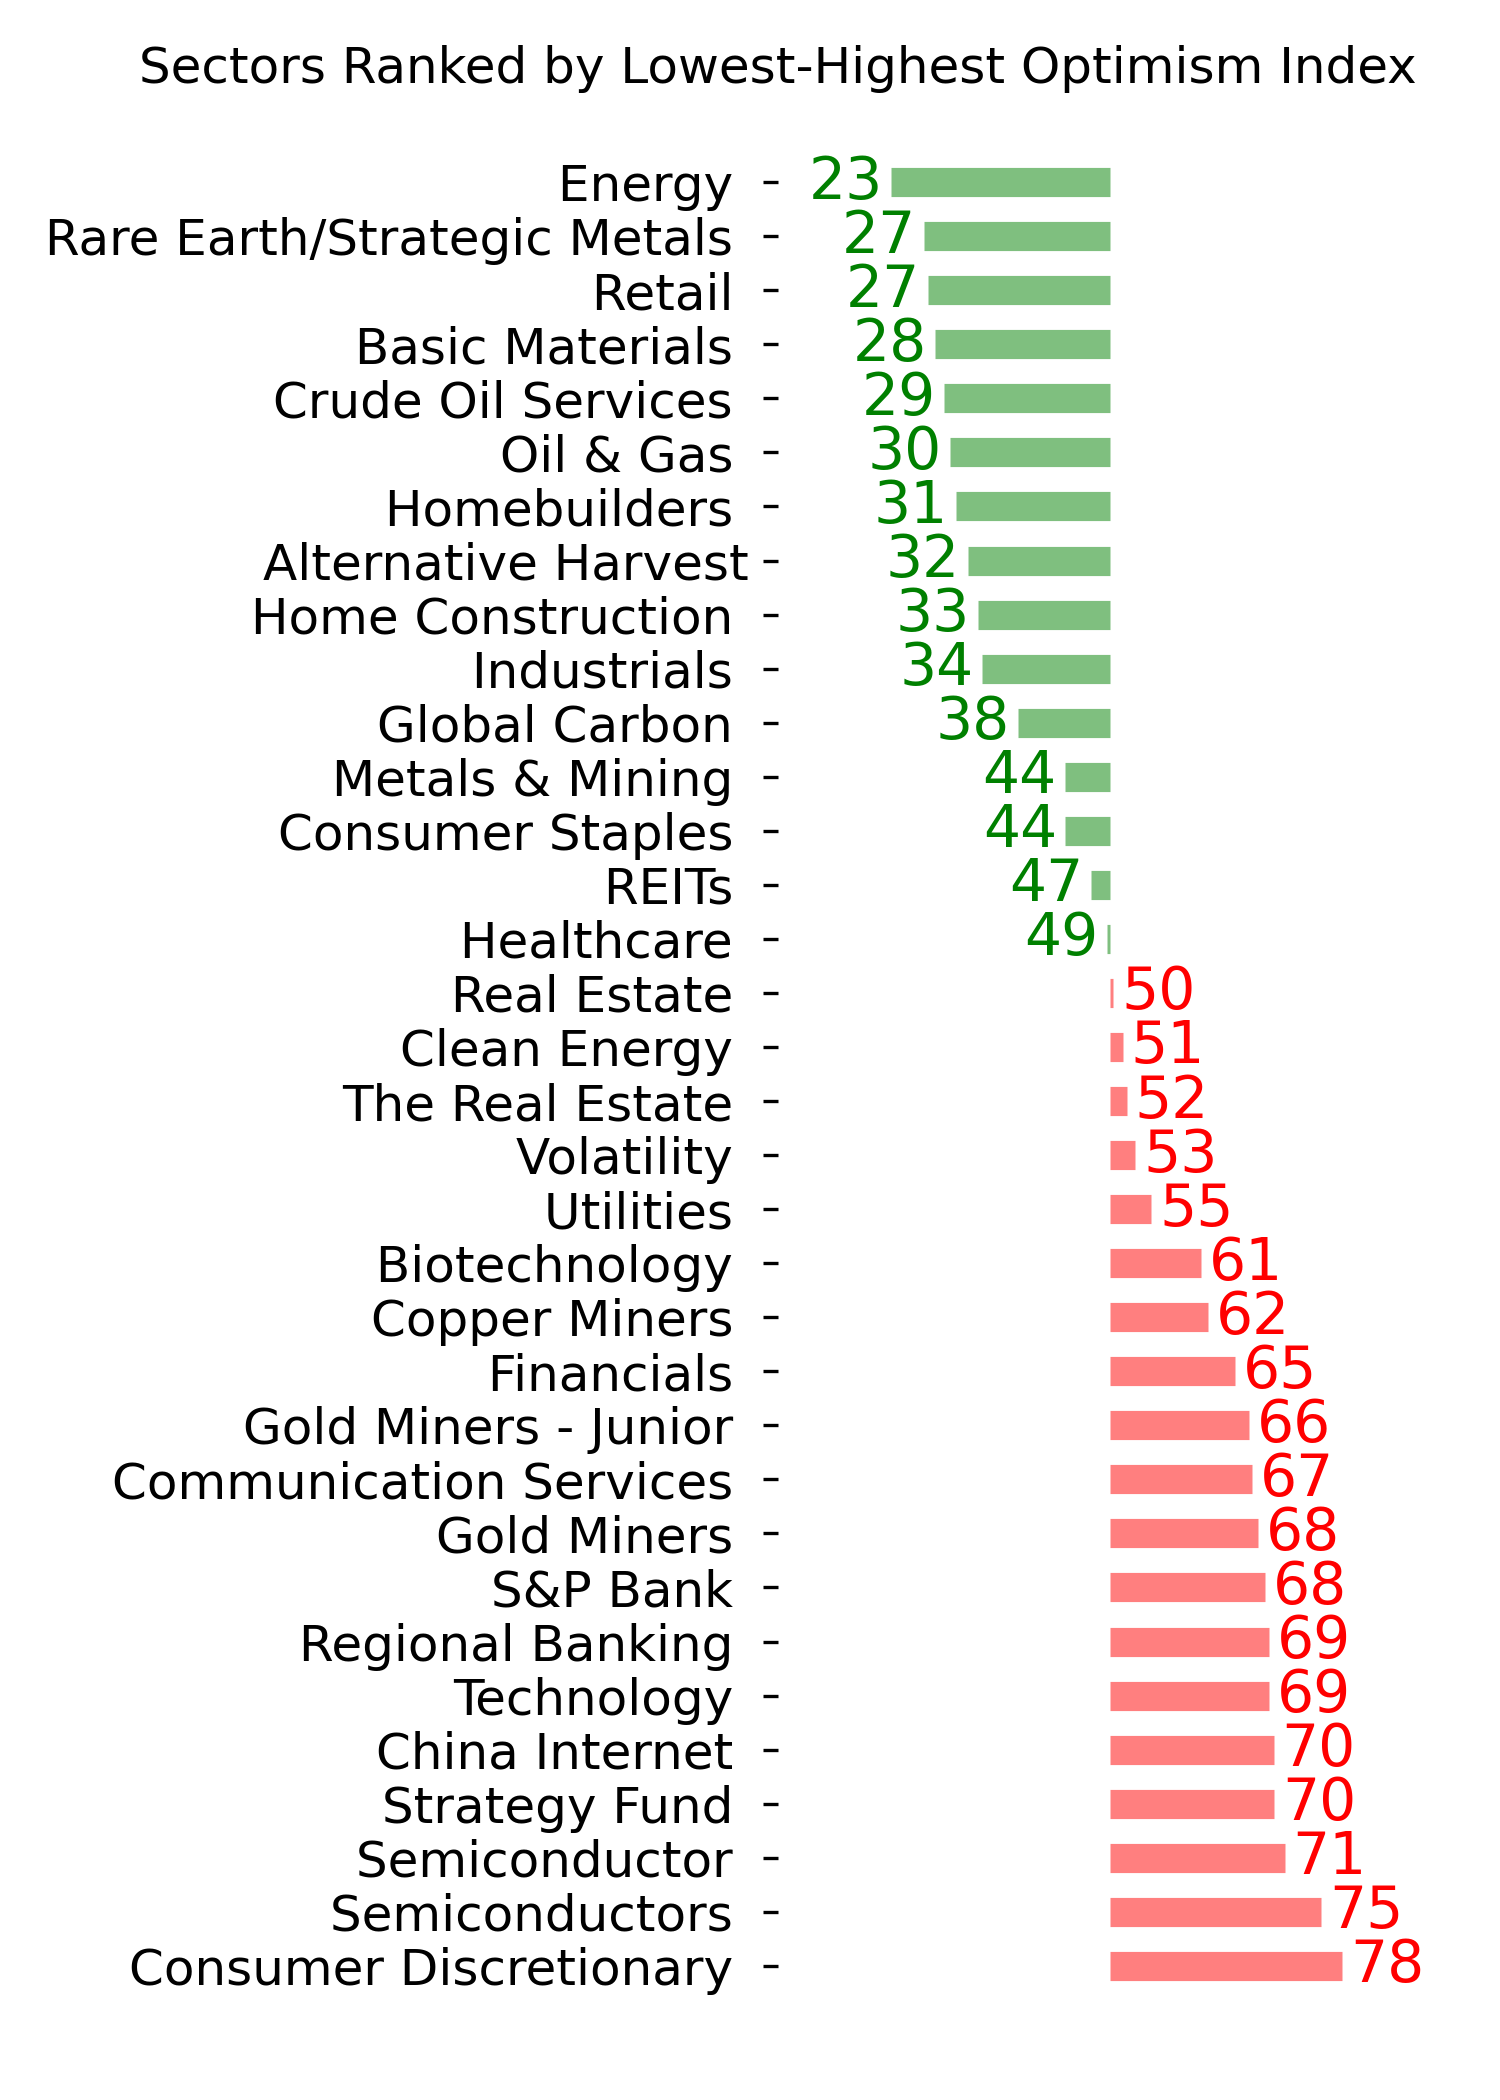
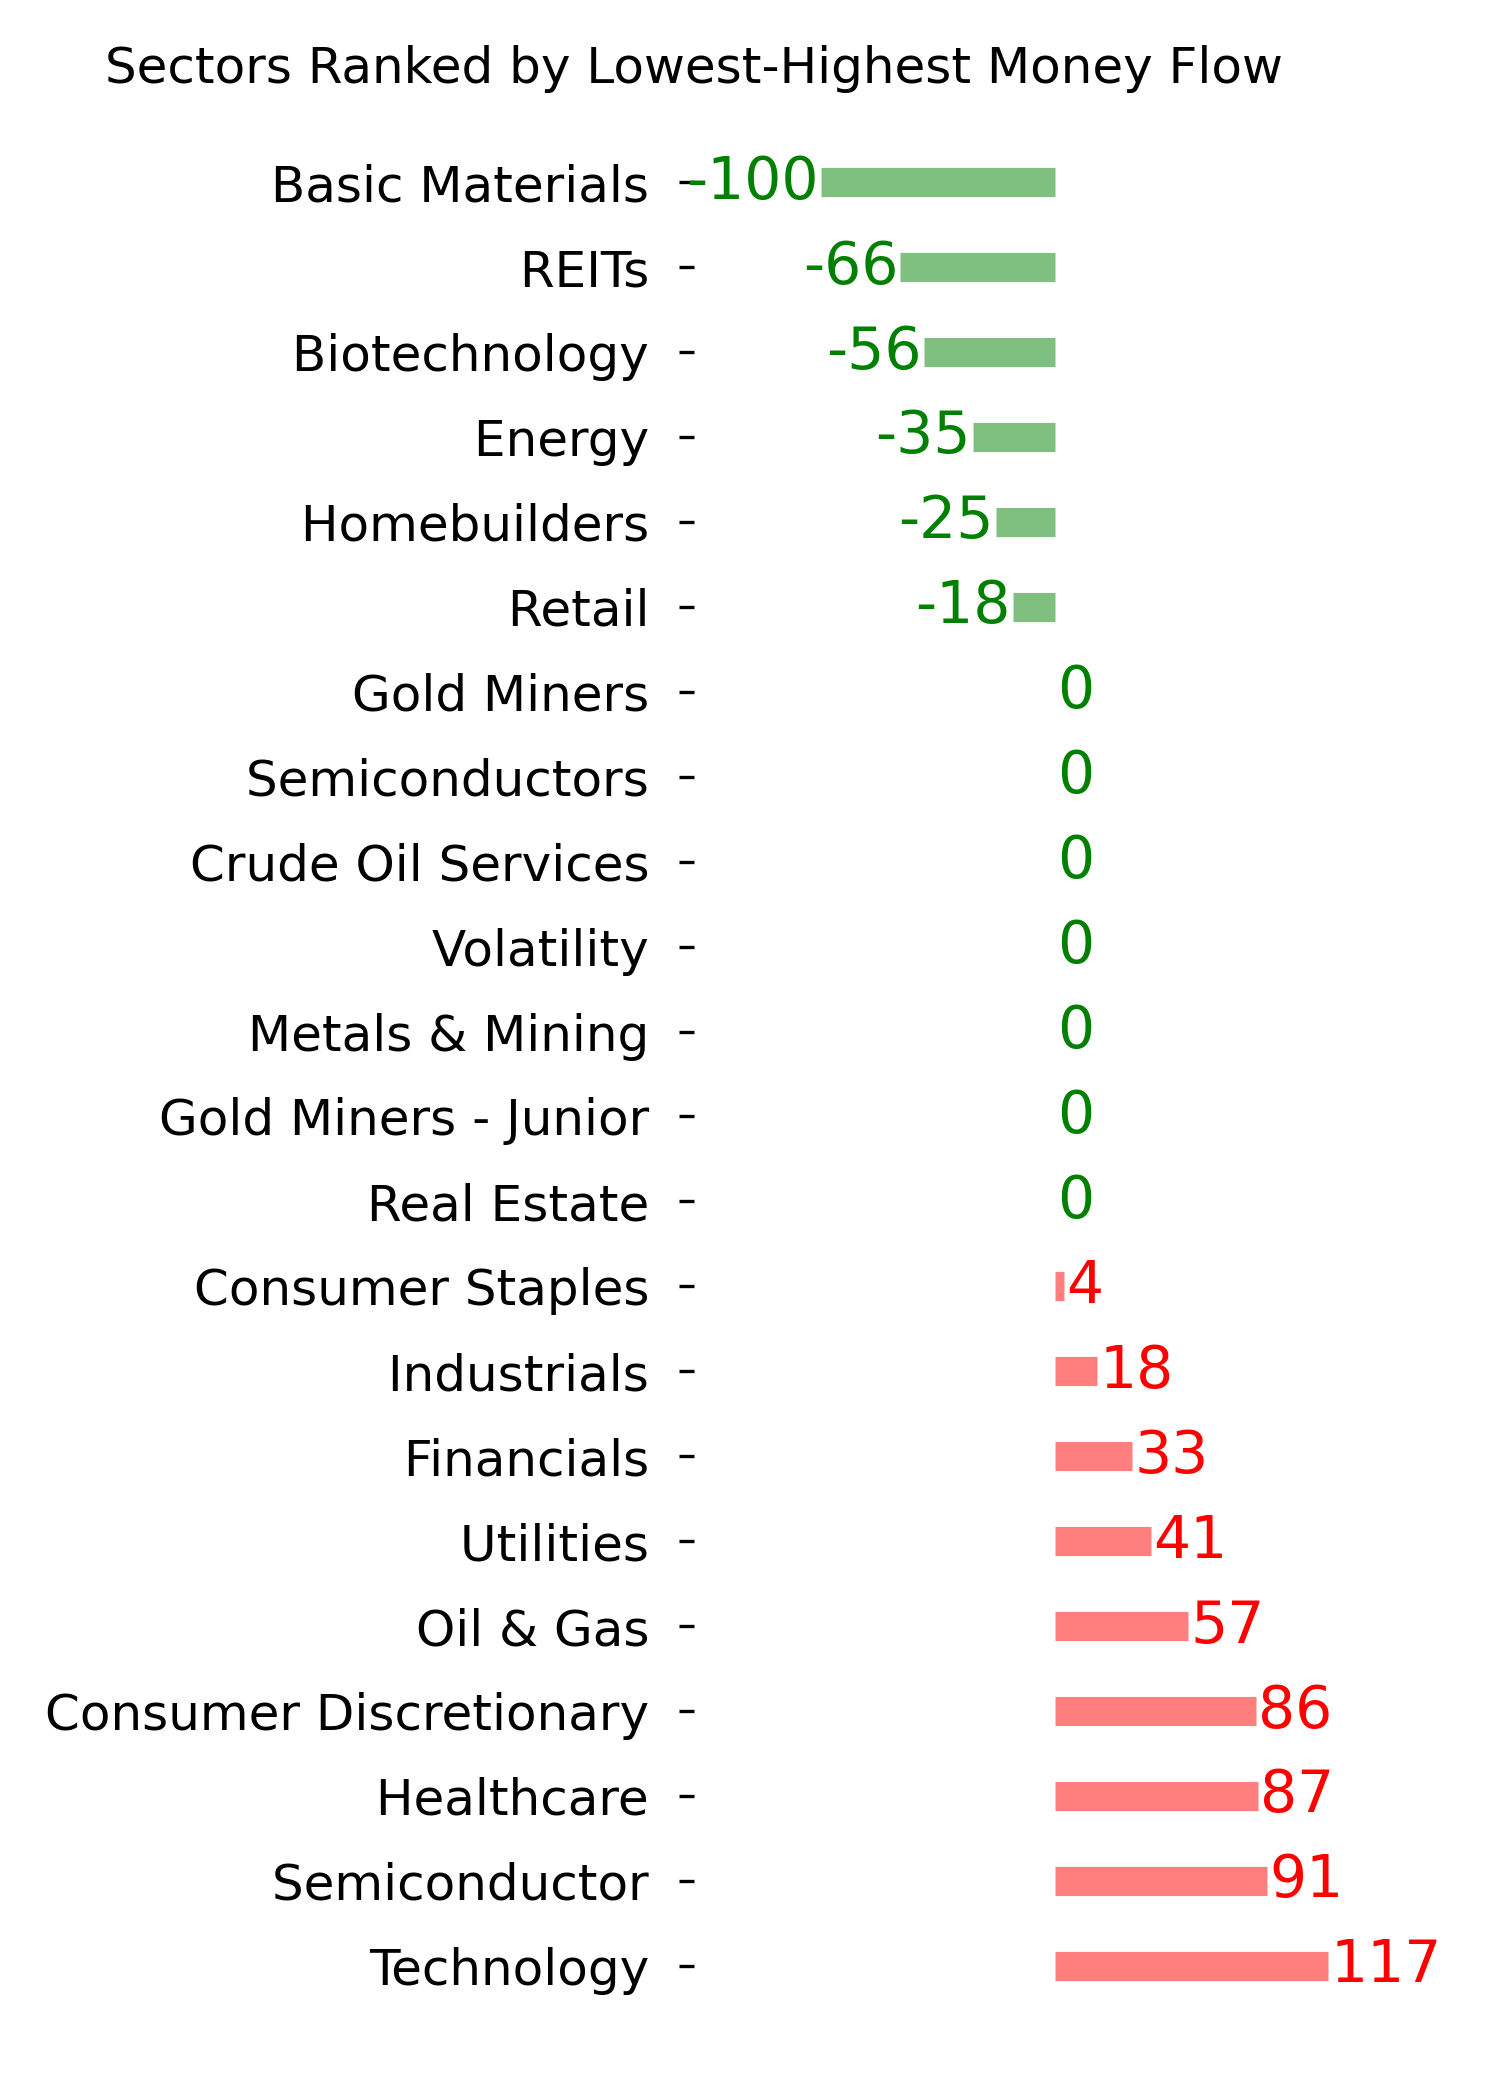
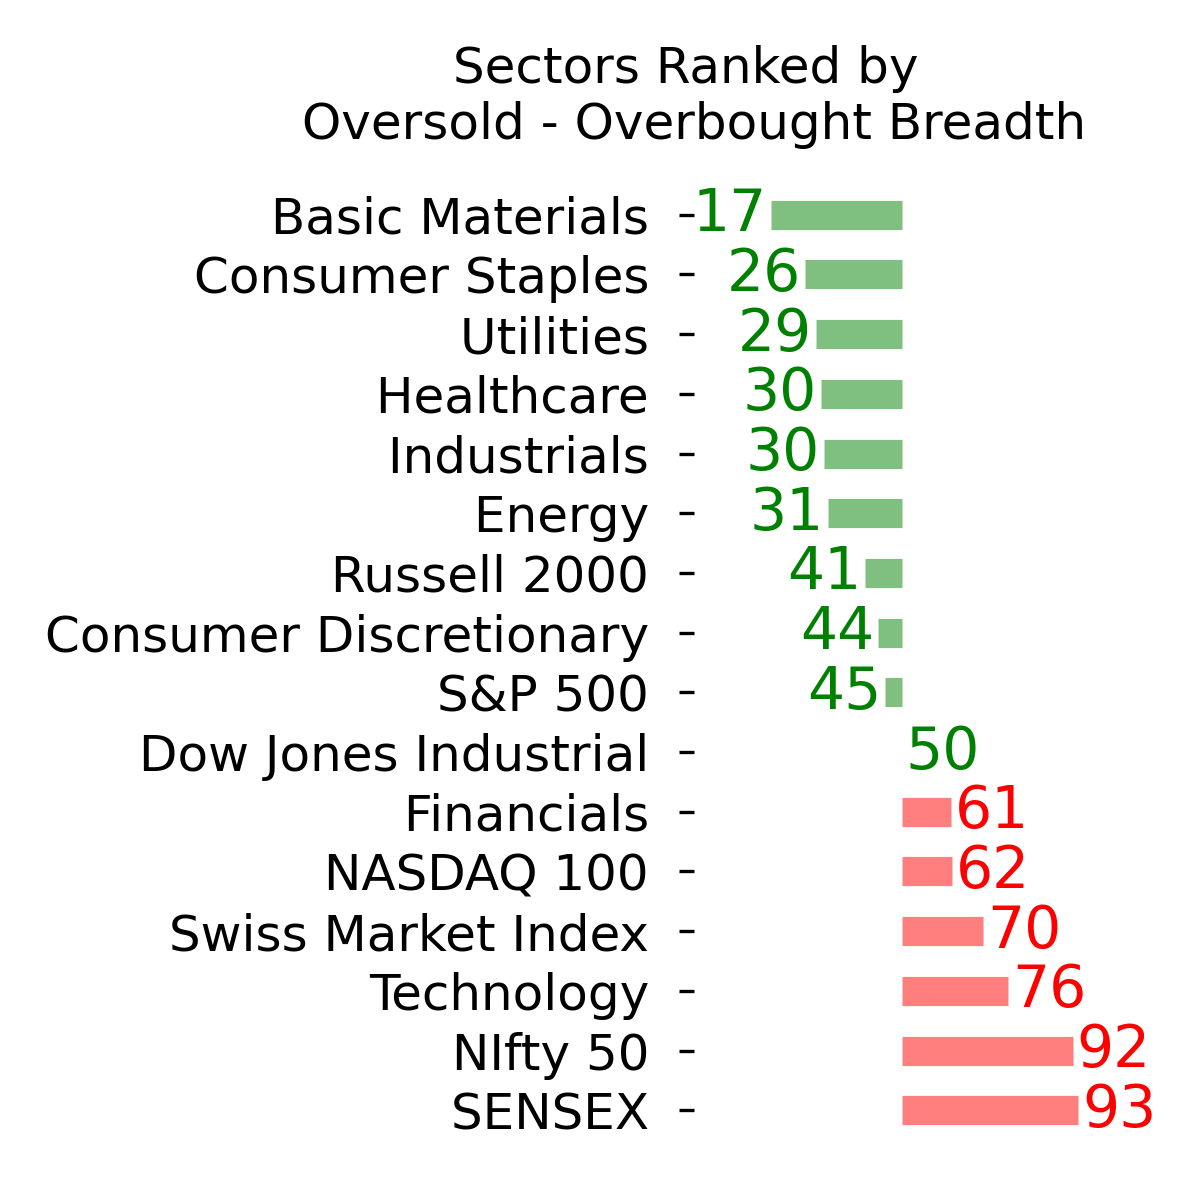
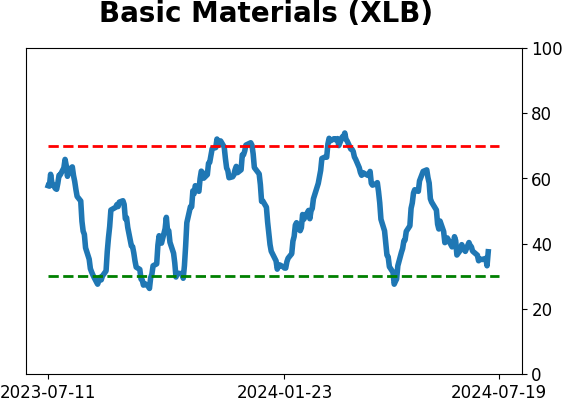
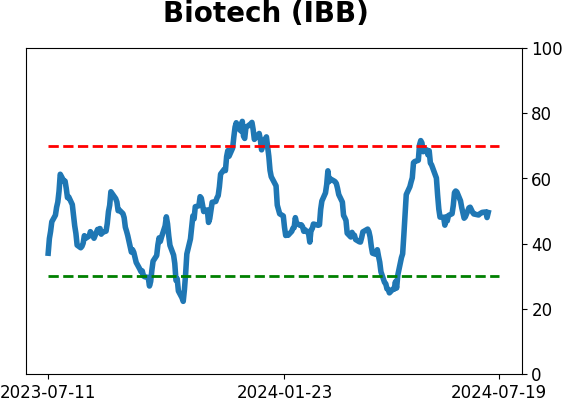
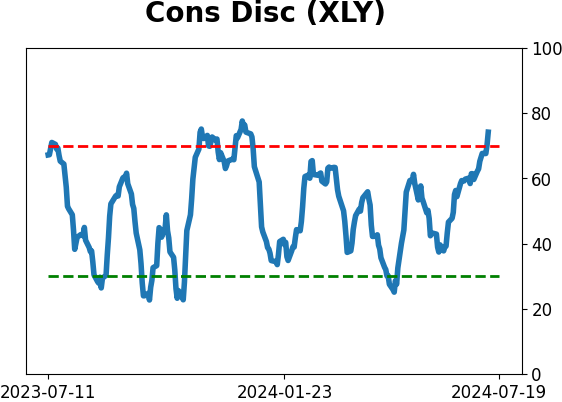
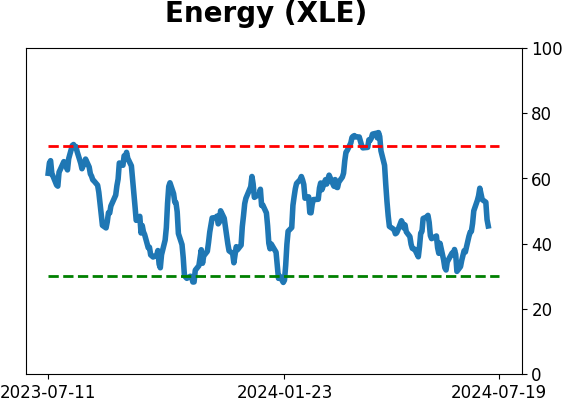
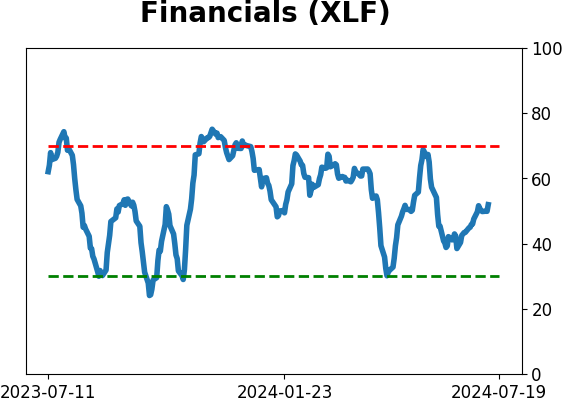
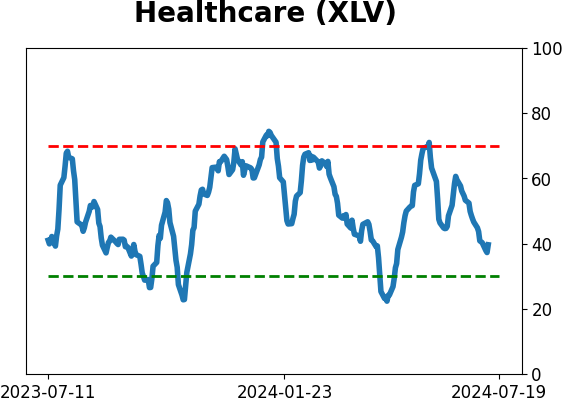
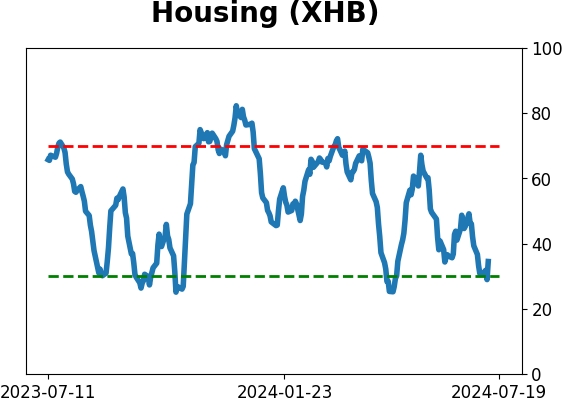
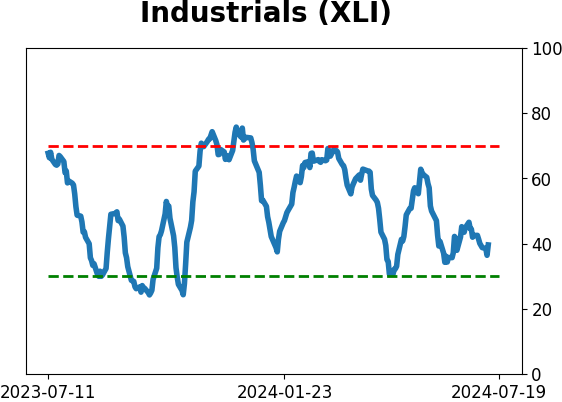
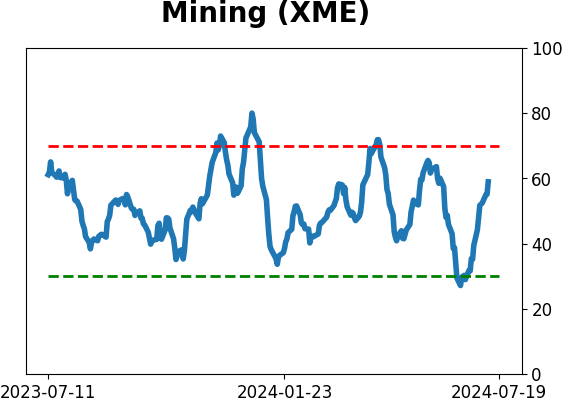
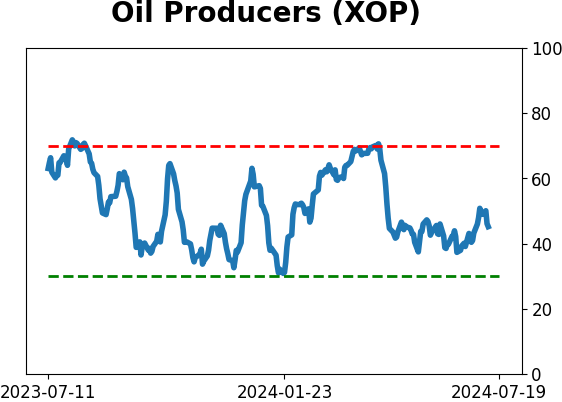
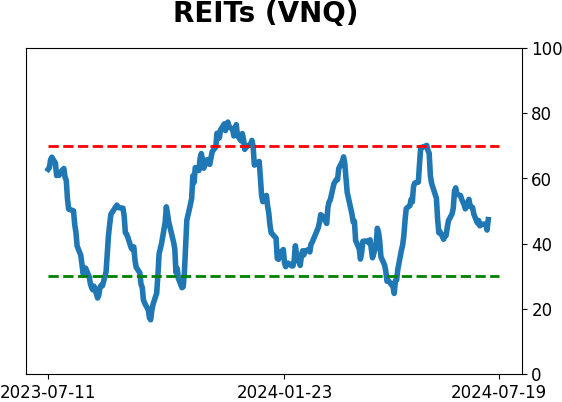
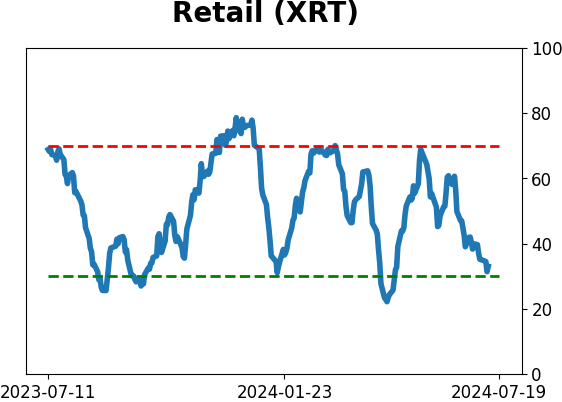
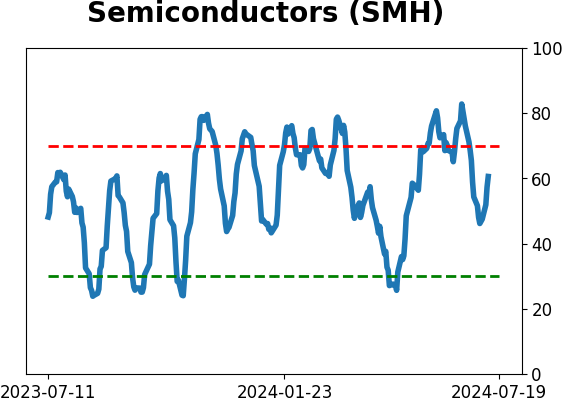
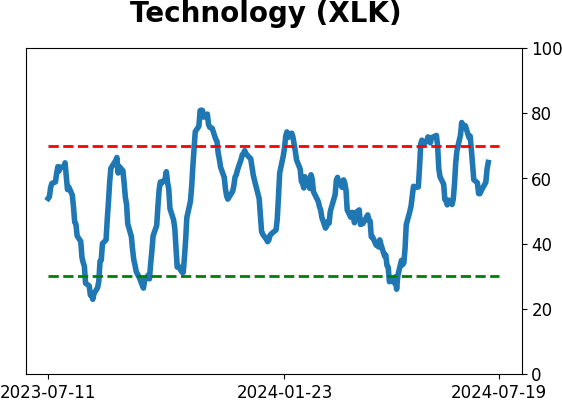
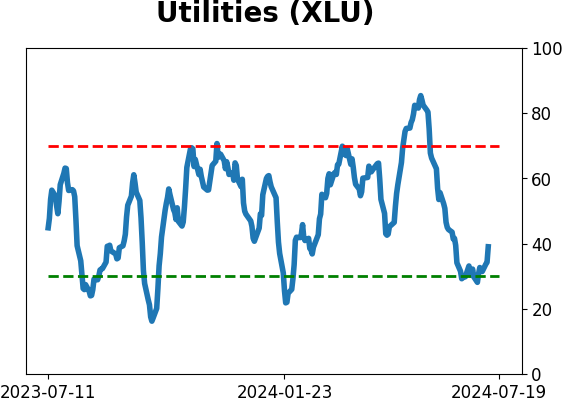
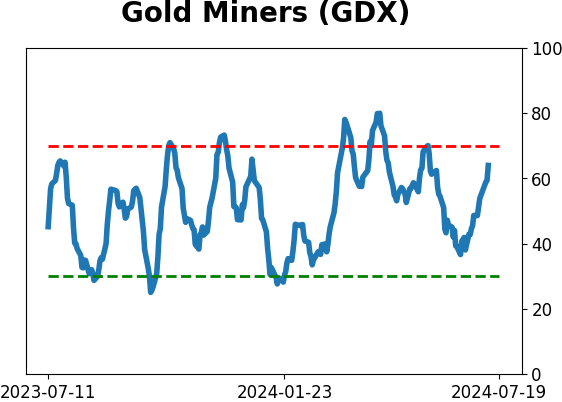
Sector ETF's - 10-Day Moving Average
|
|
|
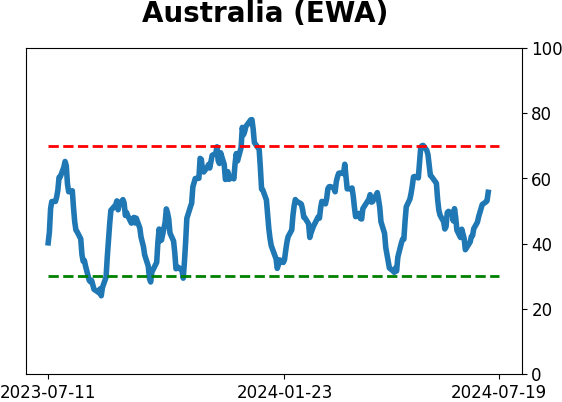
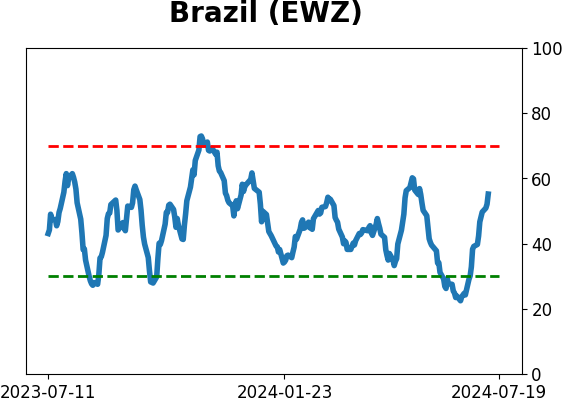
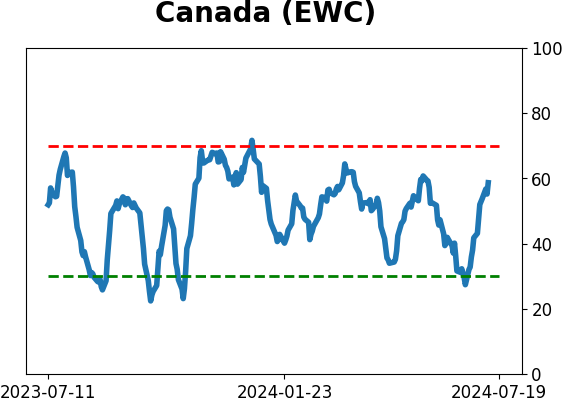
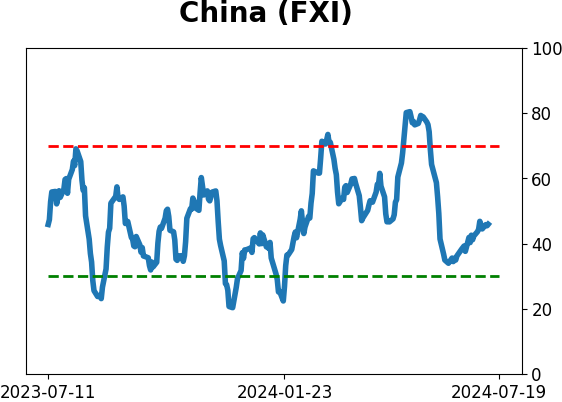
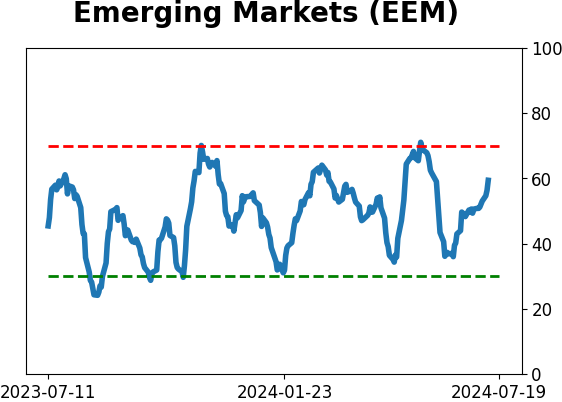
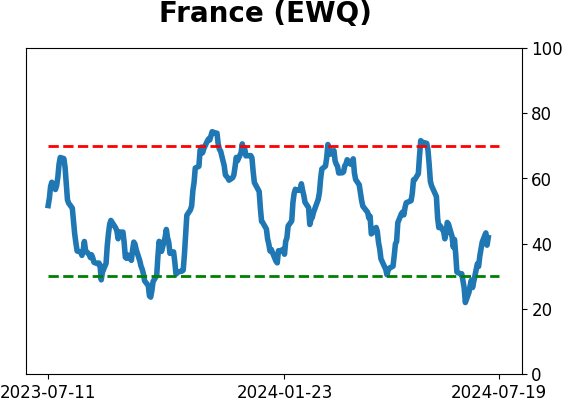
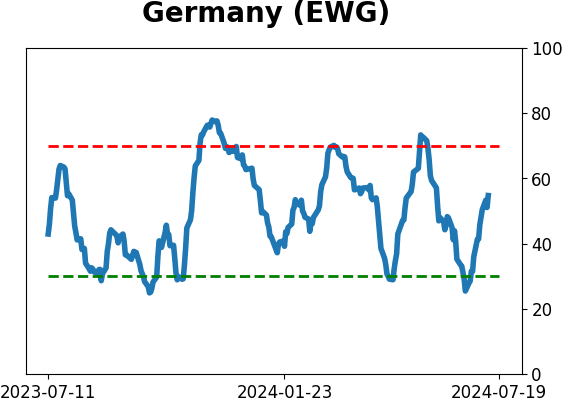
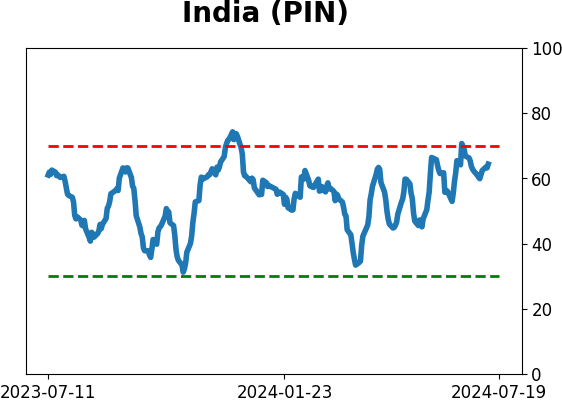
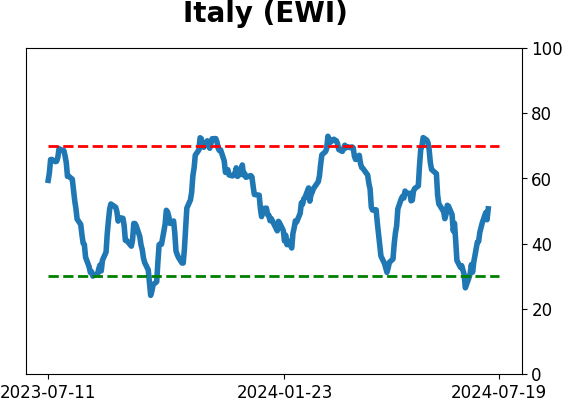
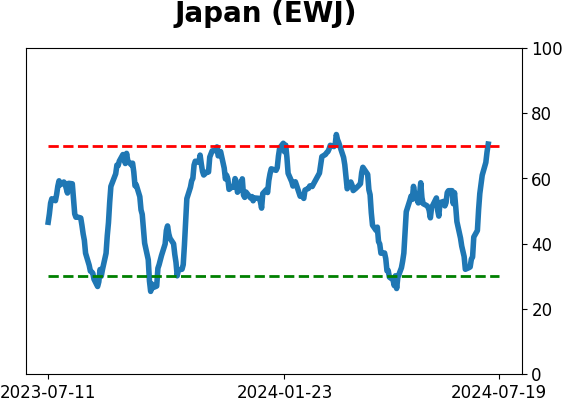
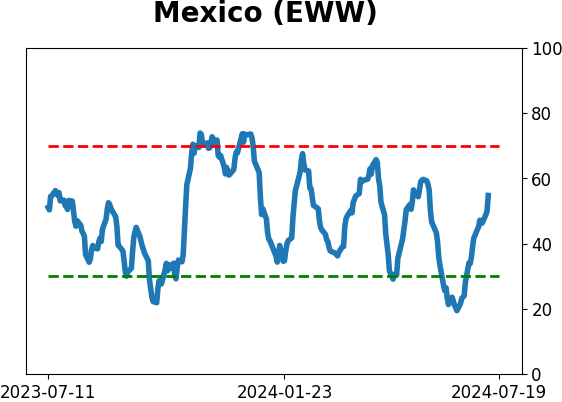
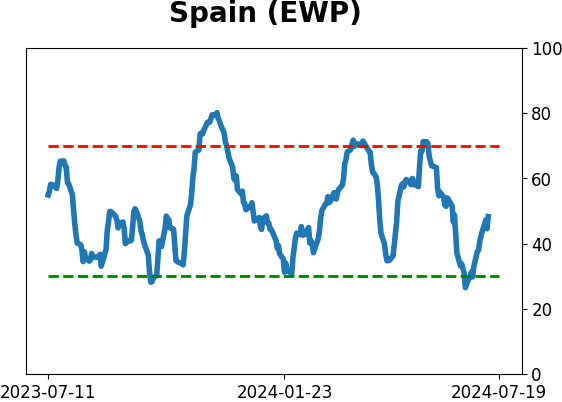
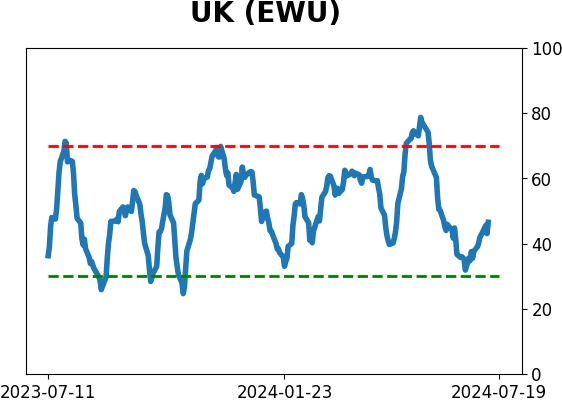
Country ETF's - 10-Day Moving Average
|
|
|
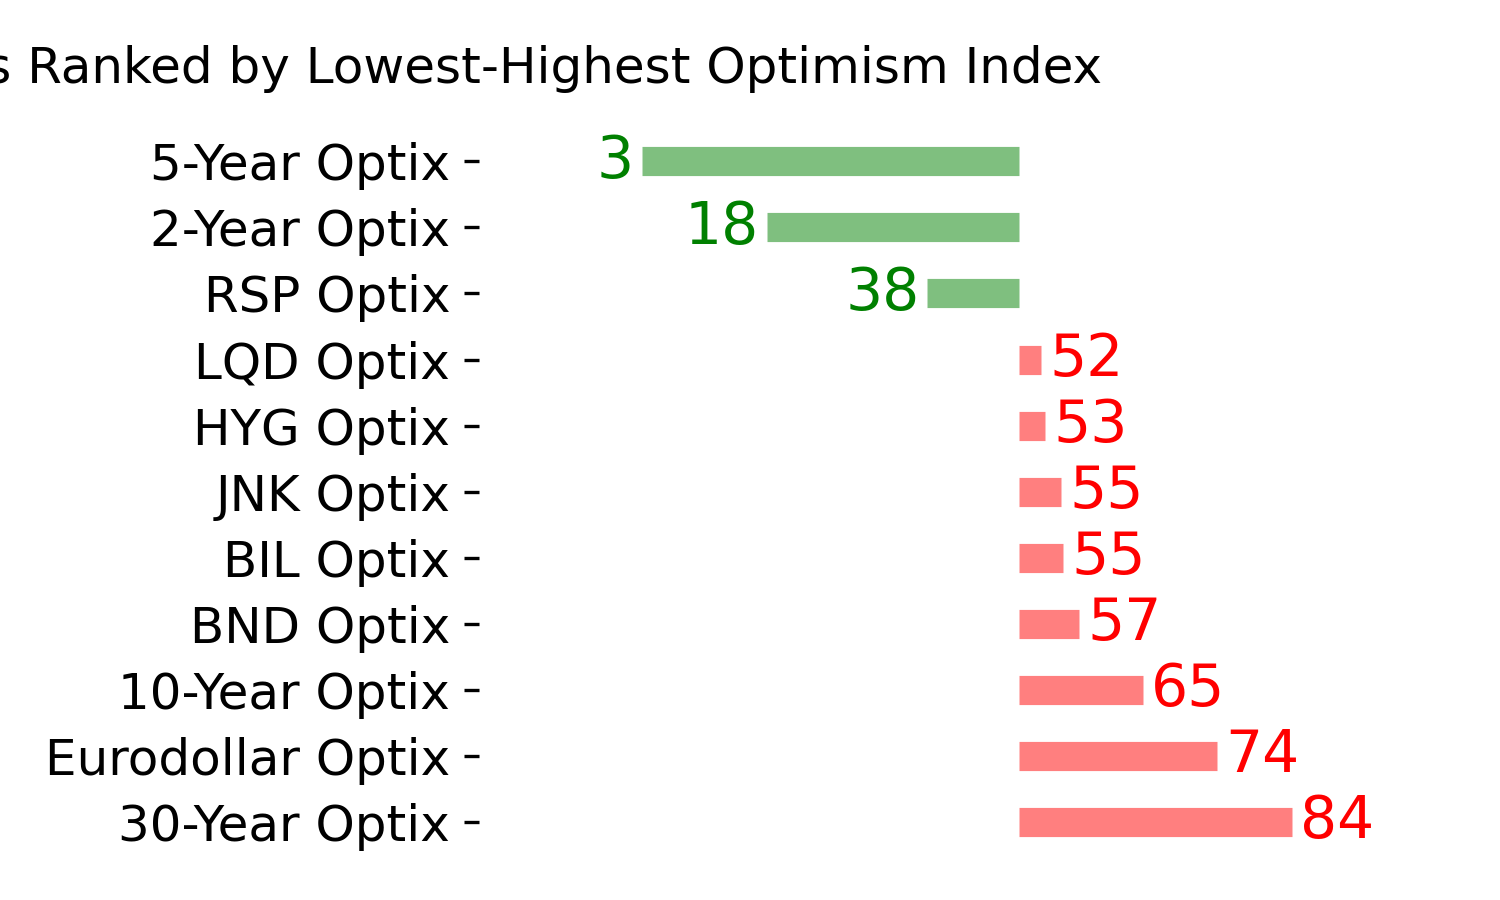
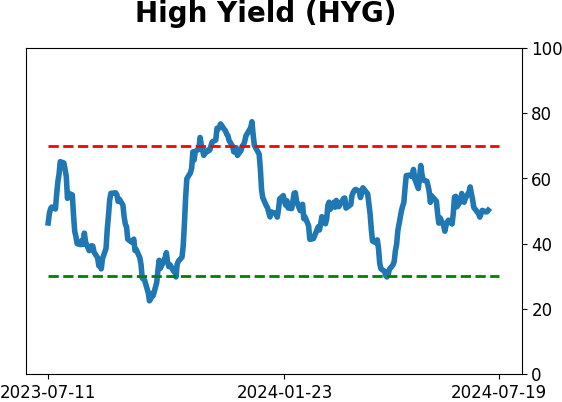
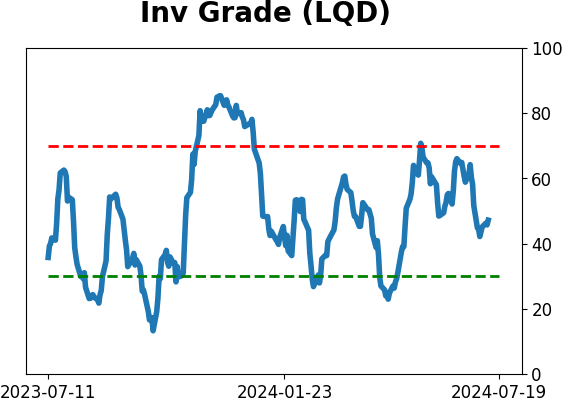
Bond ETF's - 10-Day Moving Average
|
|
|
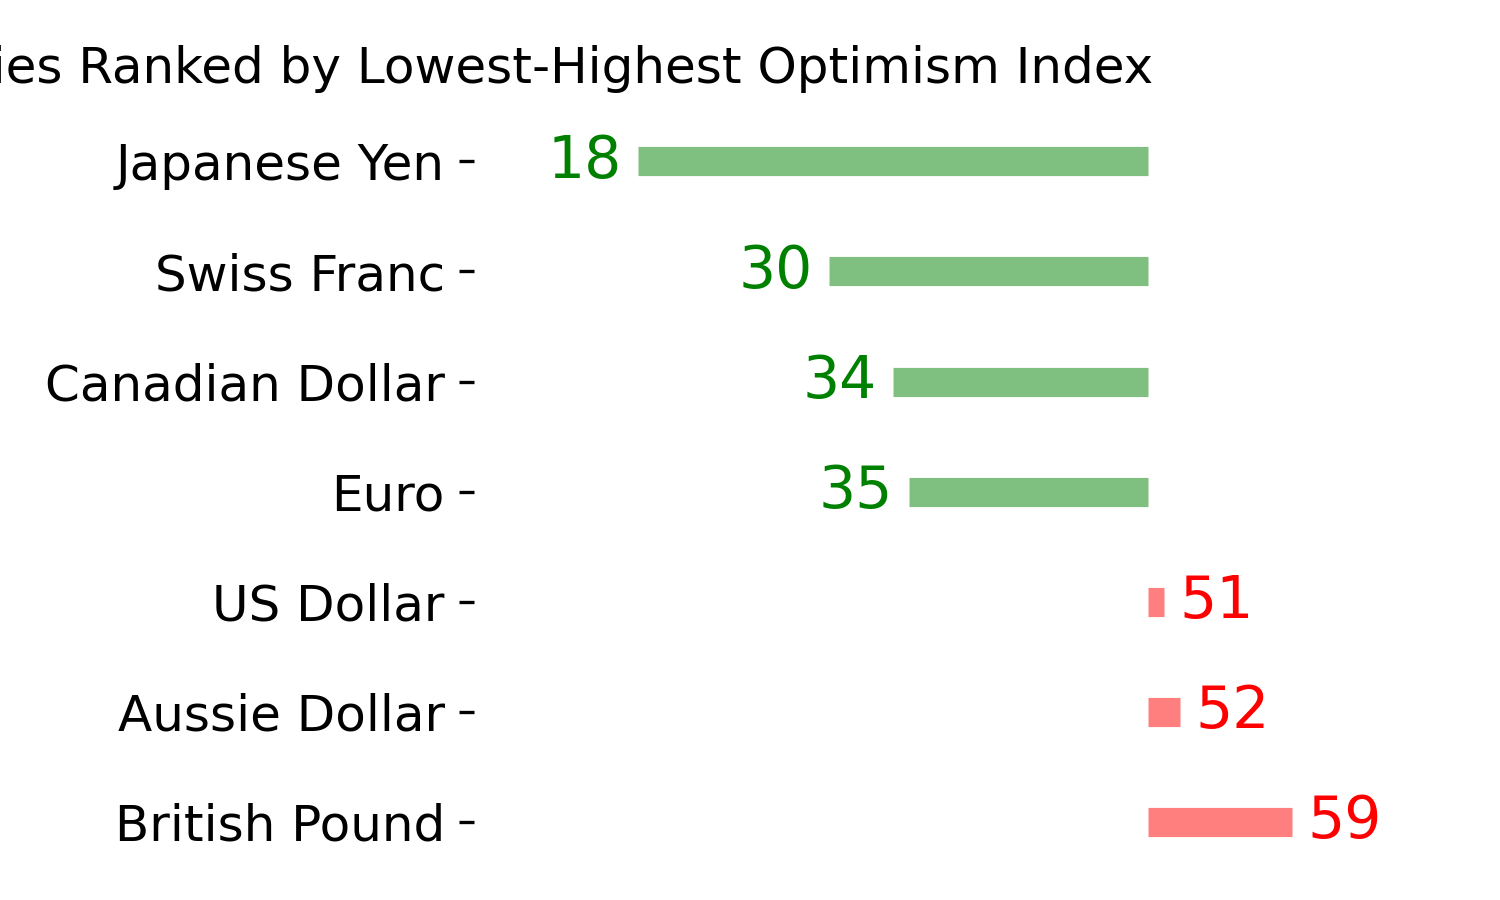
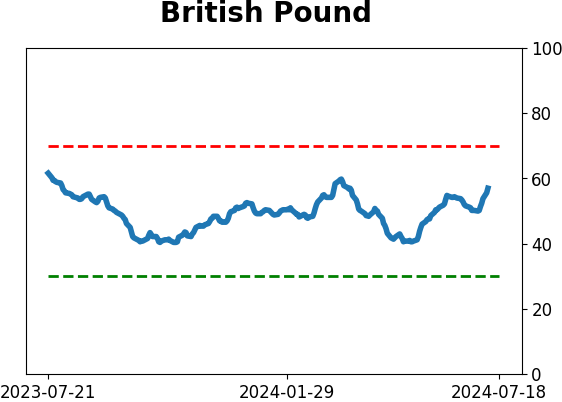
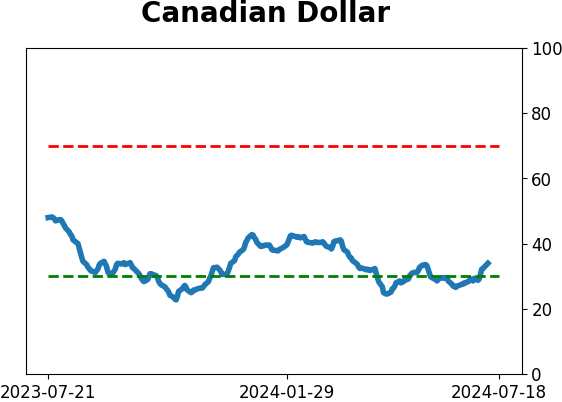
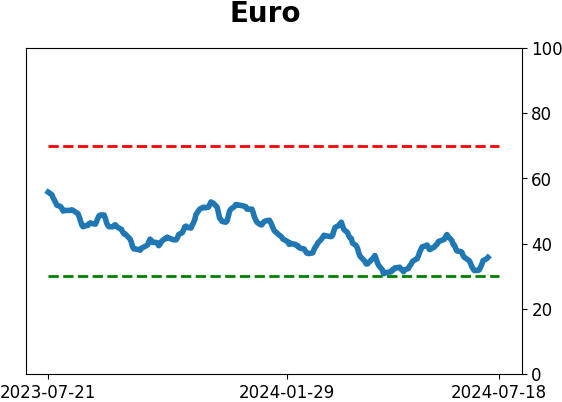
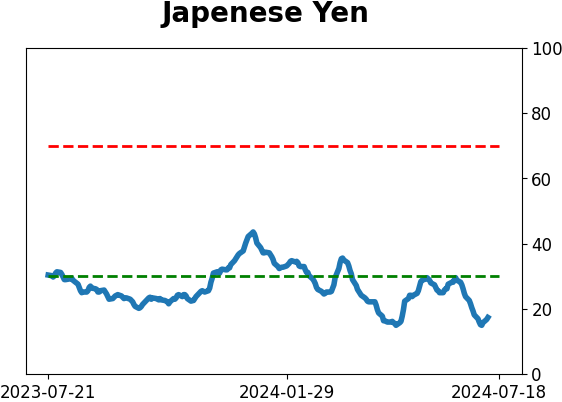
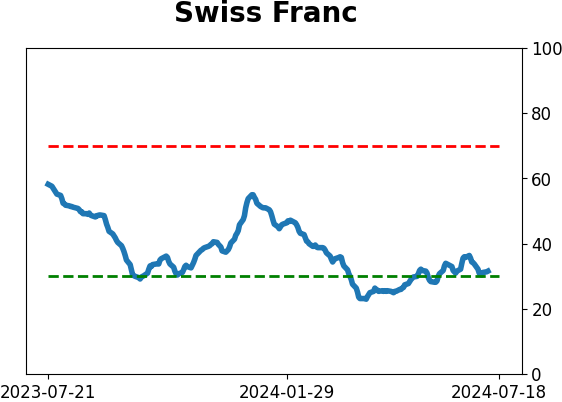
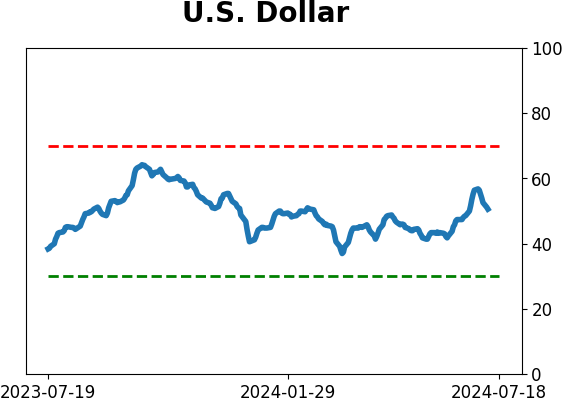
Currency ETF's - 5-Day Moving Average
|
|
|
Commodity ETF's - 5-Day Moving Average
|
|