Headlines
|
|
It's been months since even a minor pullback:
The S&P 500 has gone months without a 5%, or even 3%, pullback from a 20-day high. That's a long stretch, though by no means historically extreme. When it occurs with the index was recently at a one-year (but not multi-year) high, it has tended to precede further gains.
|
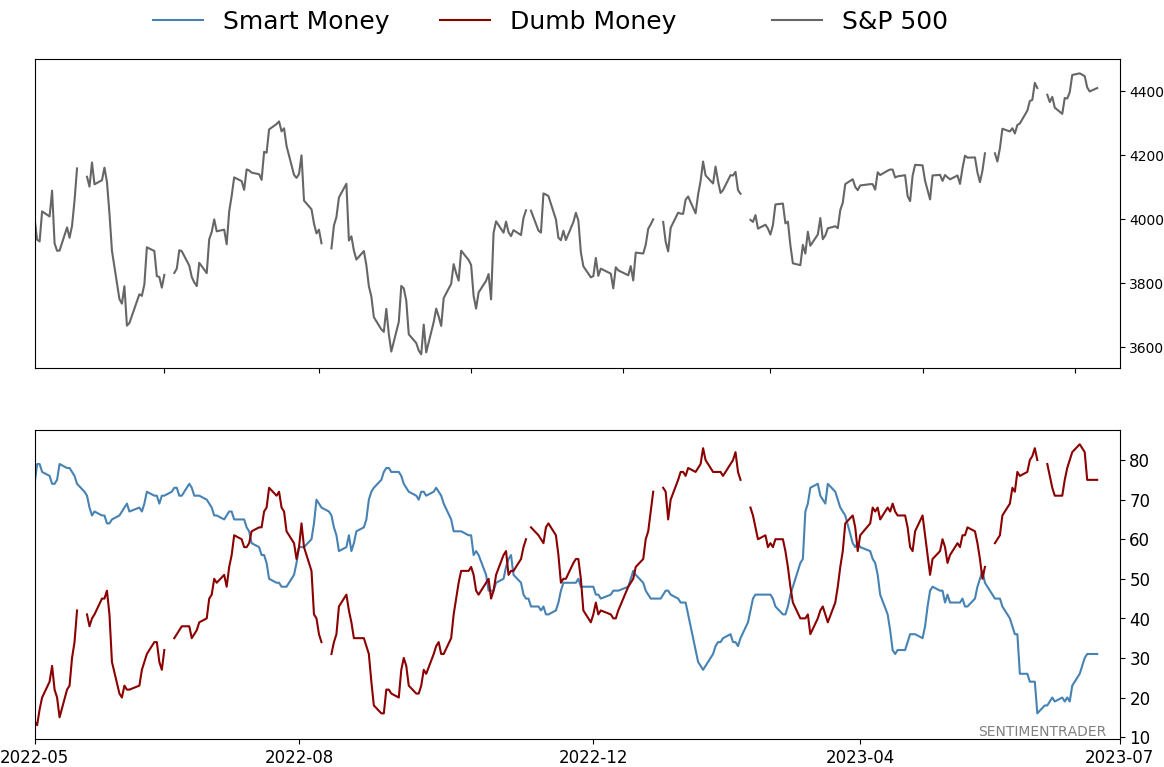
Smart / Dumb Money Confidence
|
Smart Money Confidence: 31%
Dumb Money Confidence: 75%
|
|
Risk Levels
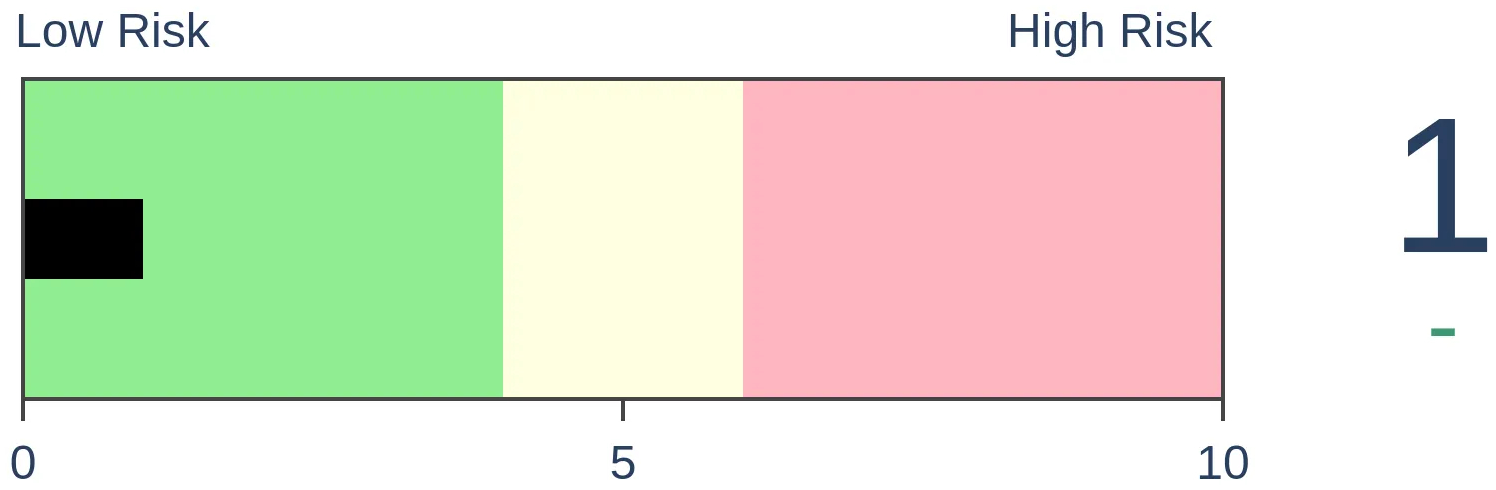
Stocks Short-Term
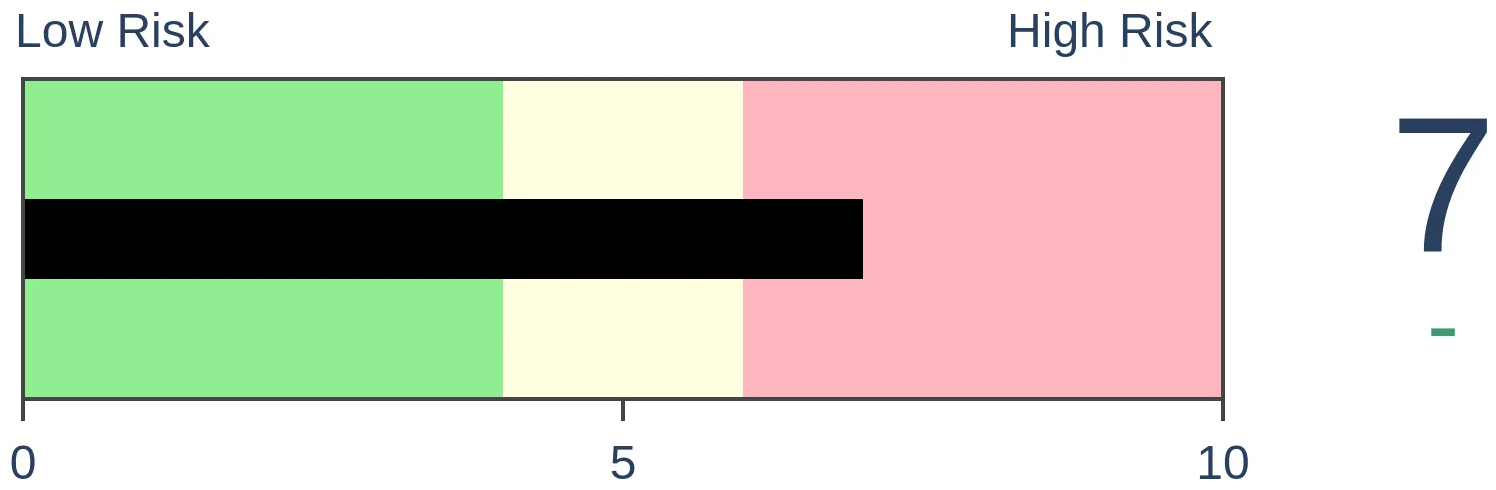
|
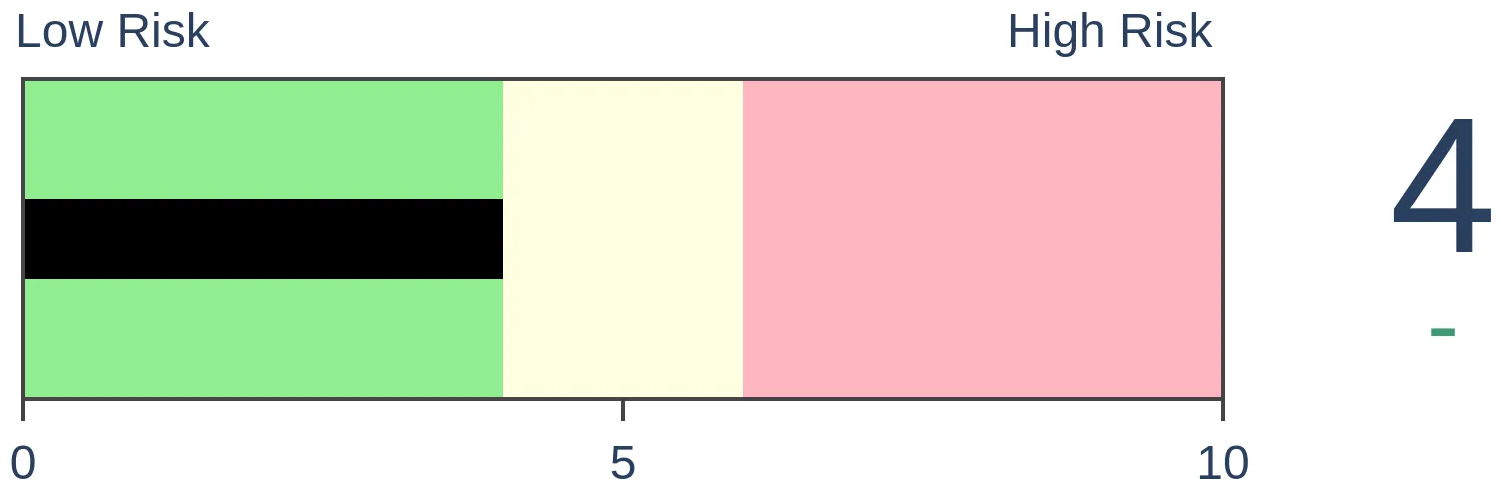
Stocks Medium-Term
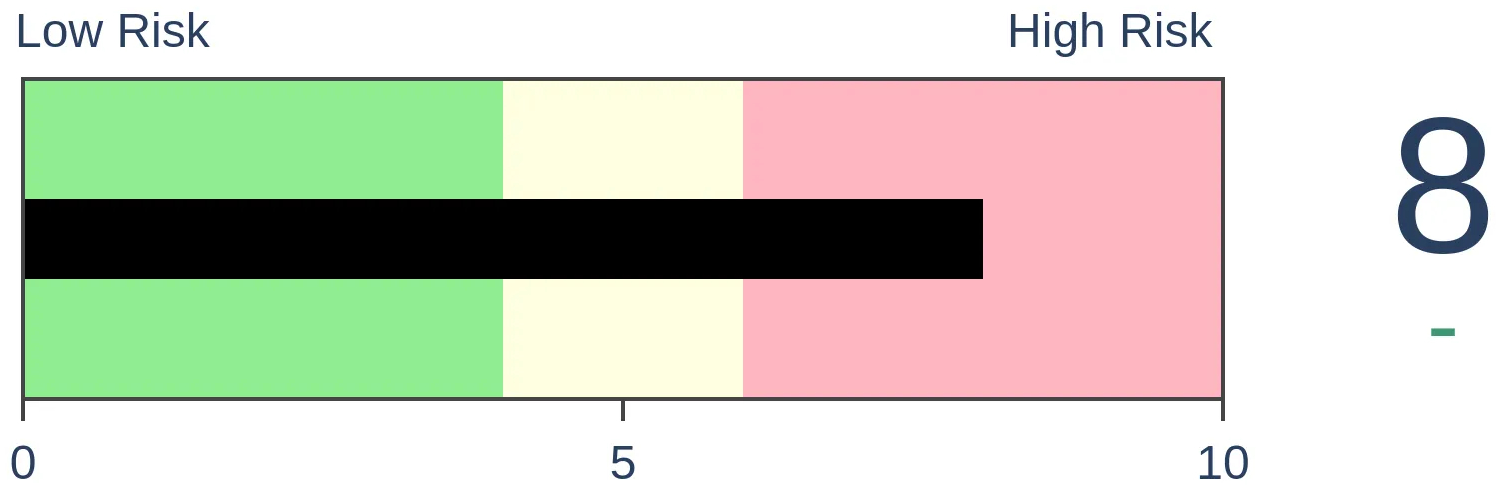
|
|
Bonds
|
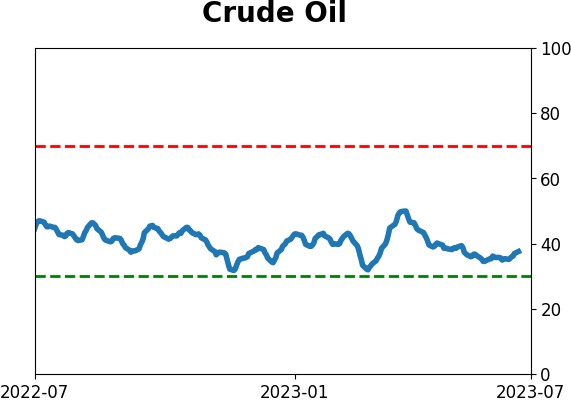
Crude Oil

|
|
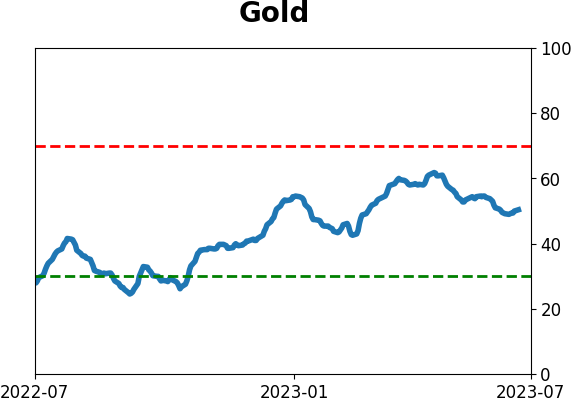
Gold
|
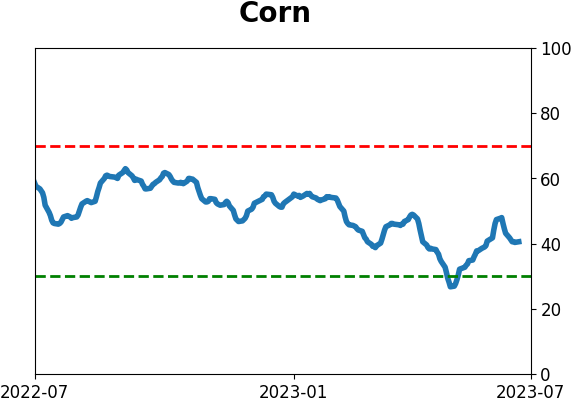
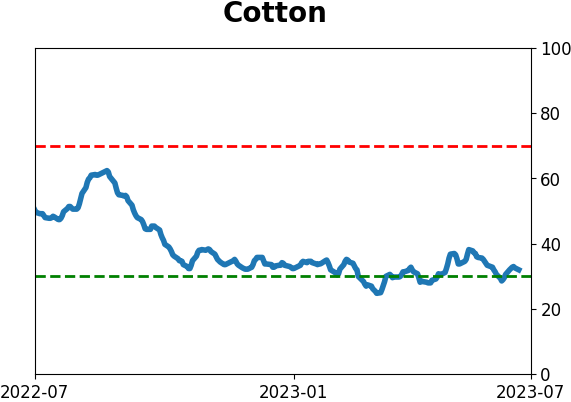
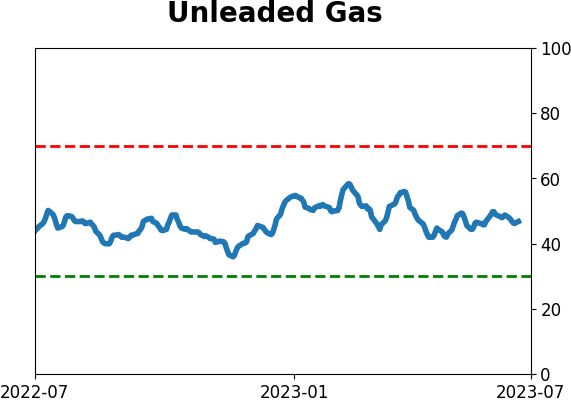
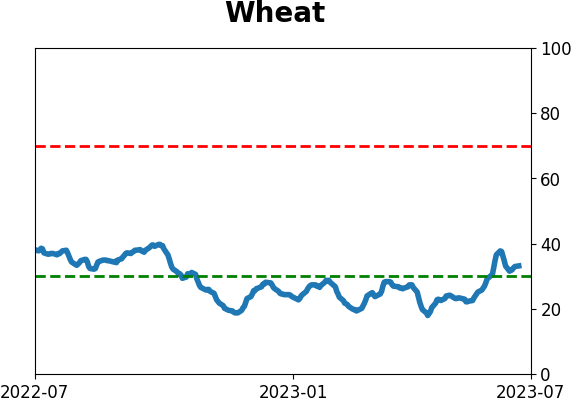
Agriculture

|
|
Research
By Jason Goepfert
BOTTOM LINE
The S&P 500 has gone months without a 5%, or even 3%, pullback from a 20-day high. That's a long stretch, though by no means historically extreme. When it occurs with the index was recently at a one-year (but not multi-year) high, it has tended to precede further gains.
FORECAST / TIMEFRAME
None
|
Key points:
- The S&P 500 has gone months without even a 3% pullback
- When such calm conditions persist with the index at a 52-week high, they tend to persist
- It has been more common to see an imminent pullback when the calm stretch occurs at a multi-year high
It has been a while since investors suffered even a minor pullback
Investors have become a lot more confident over the past couple of months, and it's no wonder why. The most benchmarked index in the world has barely taken a step back for months, with no pullbacks larger than 5%, or even 3%, since March.
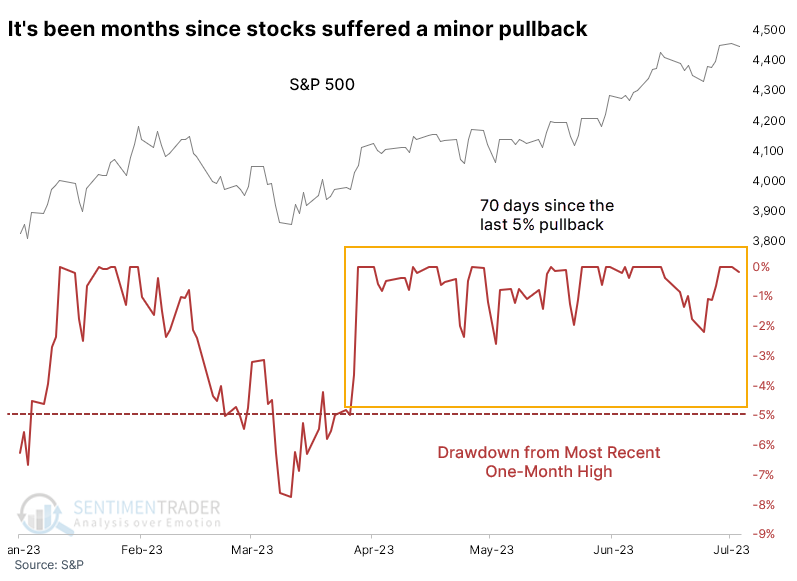
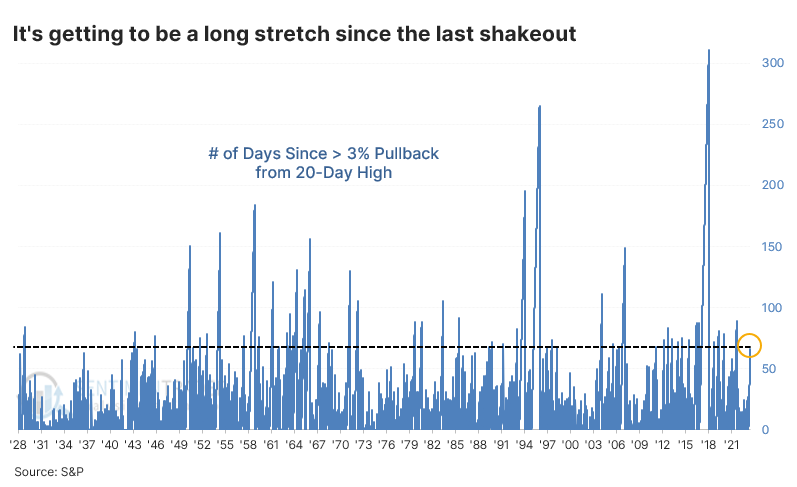
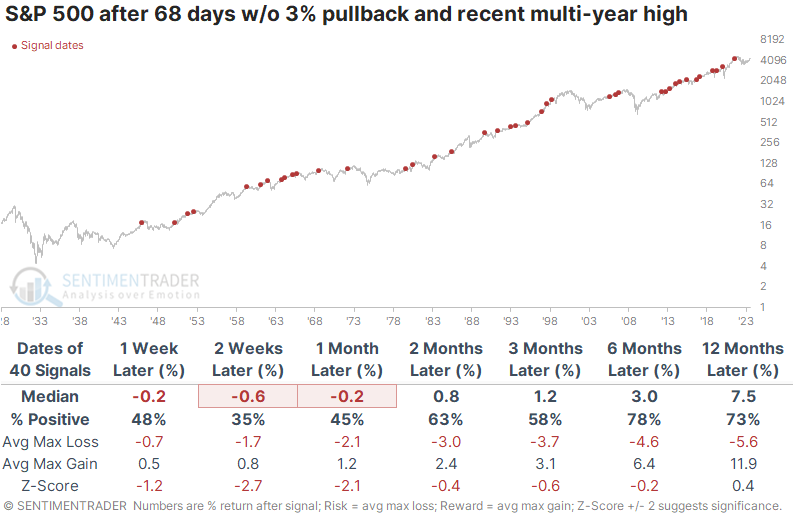
For these purposes, a "pullback" means we are looking at the maximum decline in the S&P 500 from its most recent 20-day high. When a new 20-day high is set, the pullback clock gets reset. The current streak of 68 days since the last 3% pullback ranks in the top 7% of all streaks since 1928.
This low-volatility behavior often signals extreme confidence when stocks are trading at multi-year or all-time highs. And that confidence has often resulted in a quick slap in the face for those who were so confident. Over the next 2-4 weeks, the S&P consistently pulled back, with poor returns.
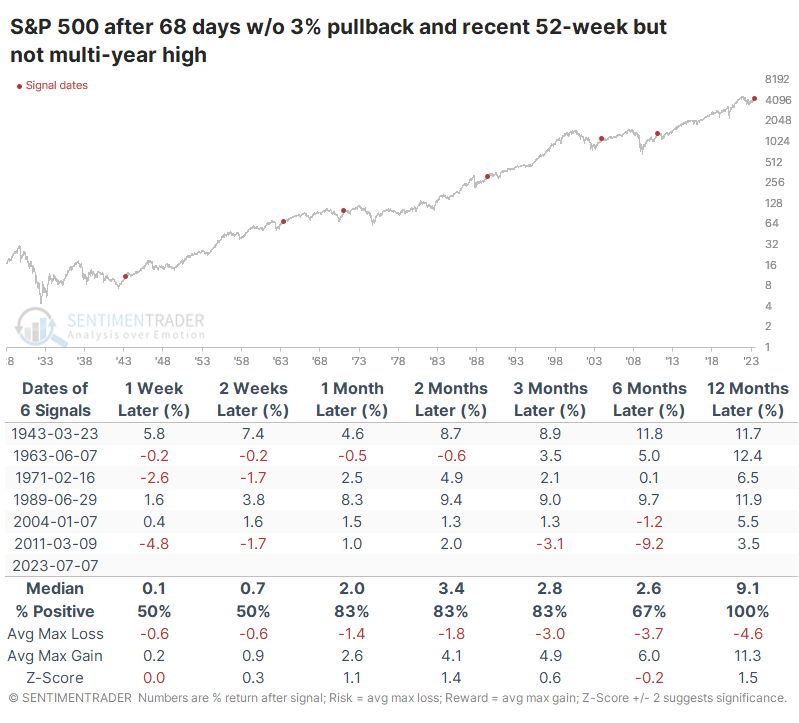
But that doesn't apply now because the index has traded at a one-year but not multi-year high. This is similar to what we've witnessed when coming out of protracted declines, like after the last two great bear markets. And it also means the sample size constricts significantly, with only a handful of precedents since 1928.
Because of the tiny sample size, we have to be more cautious of a conclusion, but at least they were pretty consistent in their message. The S&P had a compelling record of rising after this behavior, with relatively limited risk compared to potential reward in the months ahead. The only one that showed more risk than reward occurred in 2011.
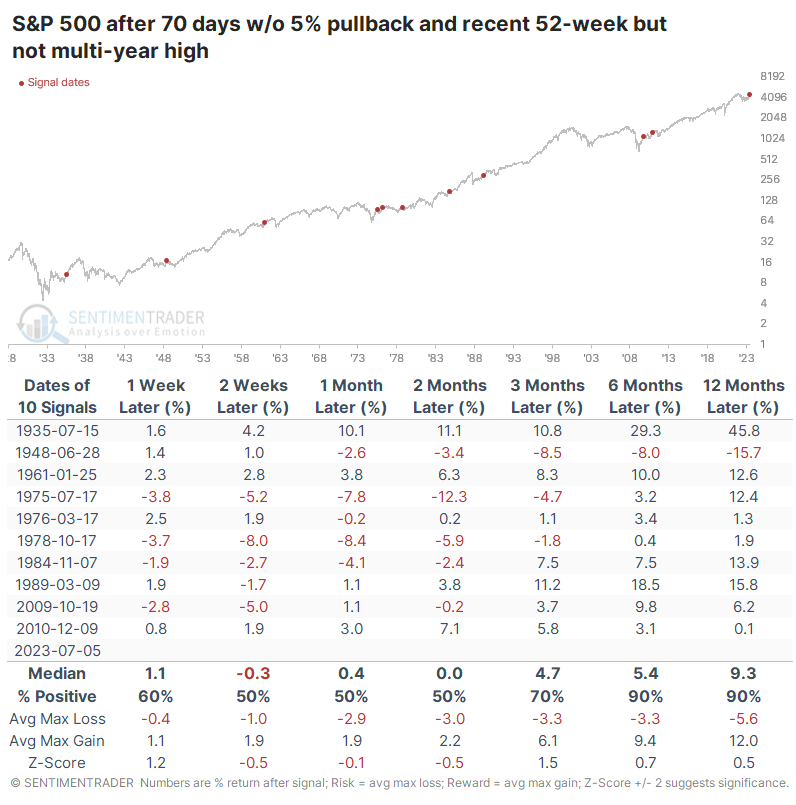
The lack of a 3% pullback is a tough hurdle to cross, but the sample size doesn't increase too much, even if we expand it to a 5% pullback. There were still only ten precedents since 1928, with essentially the same conclusion. Over the next 6-12 months, only a single signal witnessed a loss, though that loss was fairly significant.
What the research tells us...
Calm conditions always make contrarians nervous. When those calm conditions exist for months at a time, with stocks continually hitting new highs, that anxiety is often rewarded, as stocks tend to become more volatile soon afterward. But when markets have not been hitting multi-year highs, it has more often occurred as markets move from a period of high volatility to lower volatility, and those conditions have a better record of continuing for months as opposed to ending imminently.
Indicators at Extremes
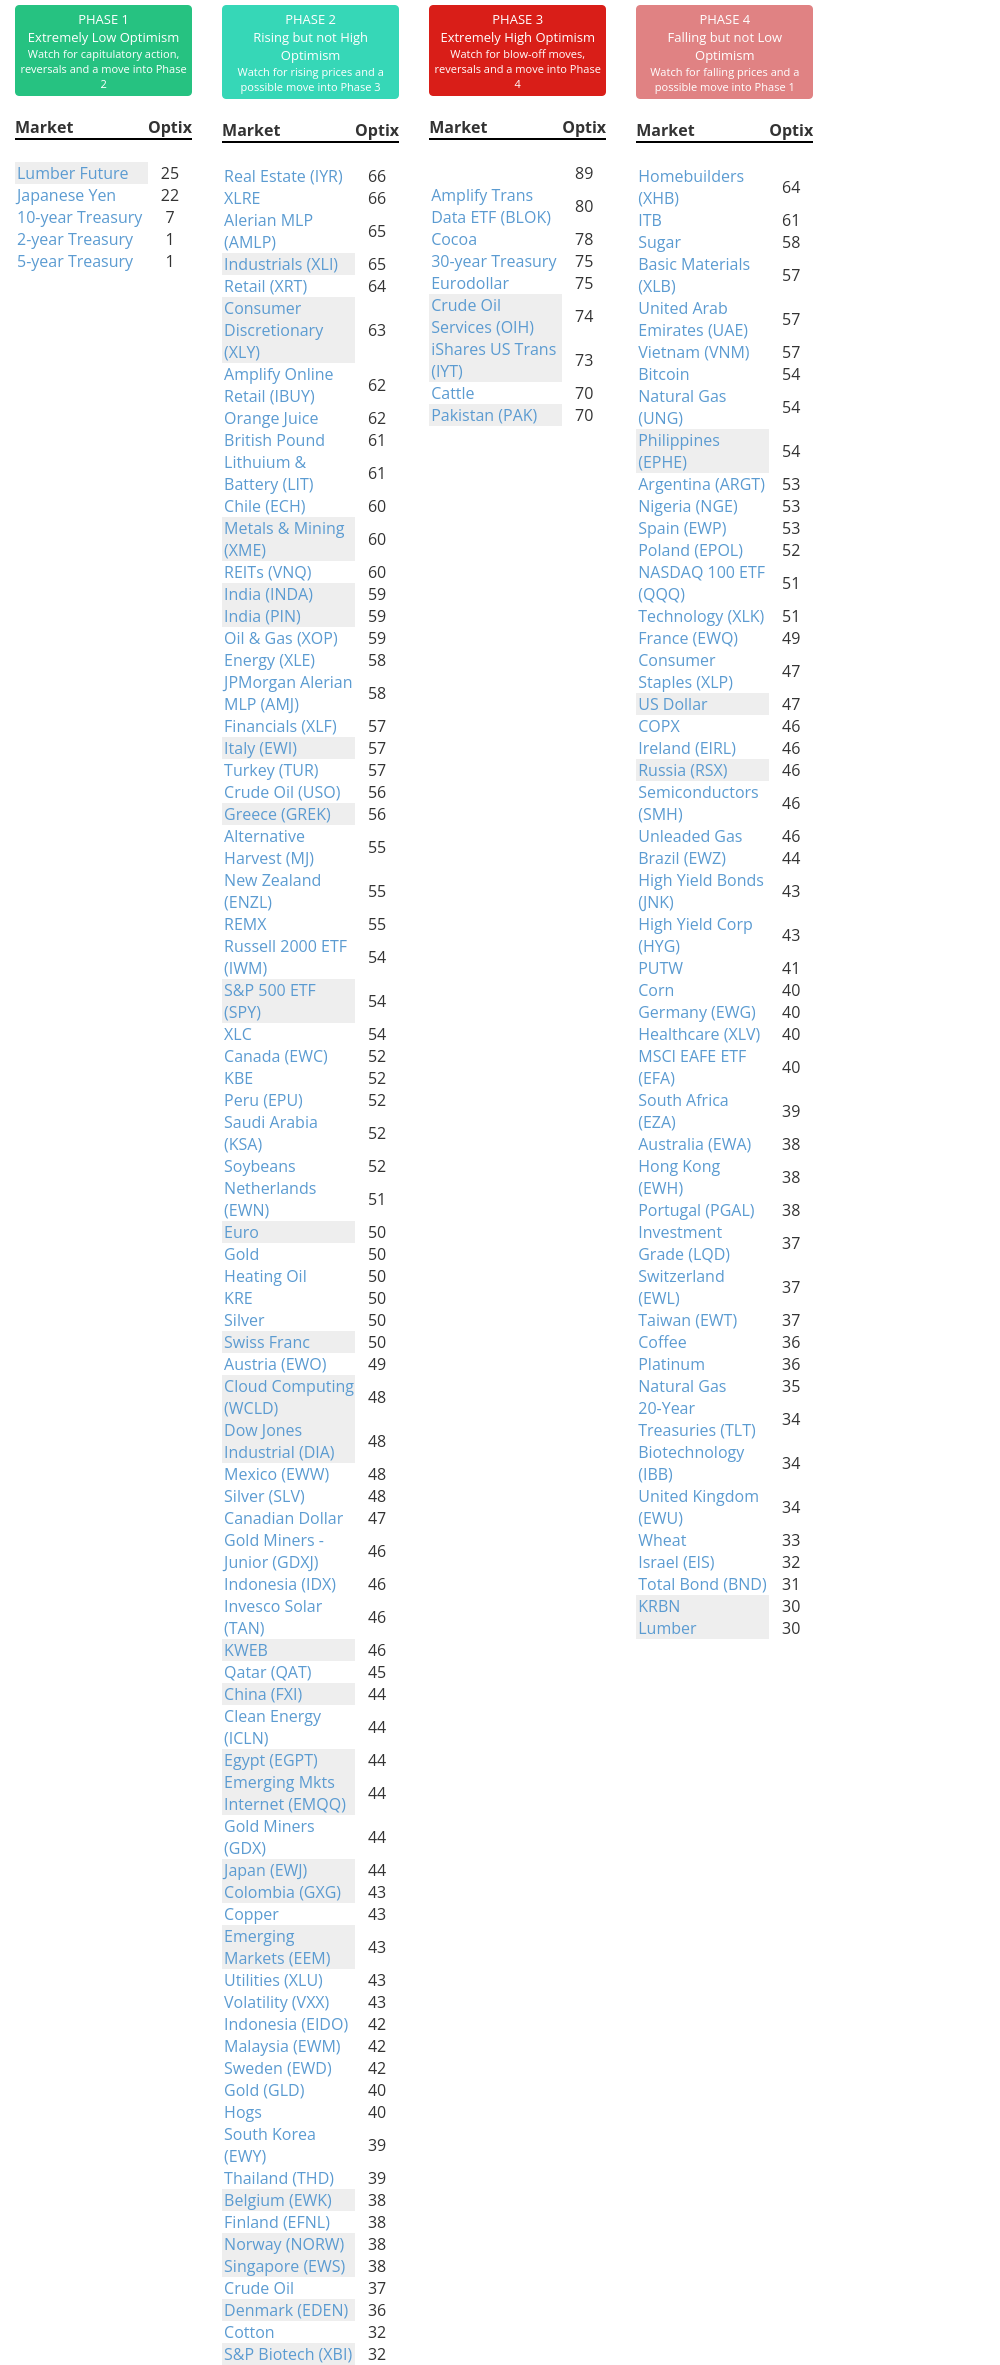
Phase Table
Ranks
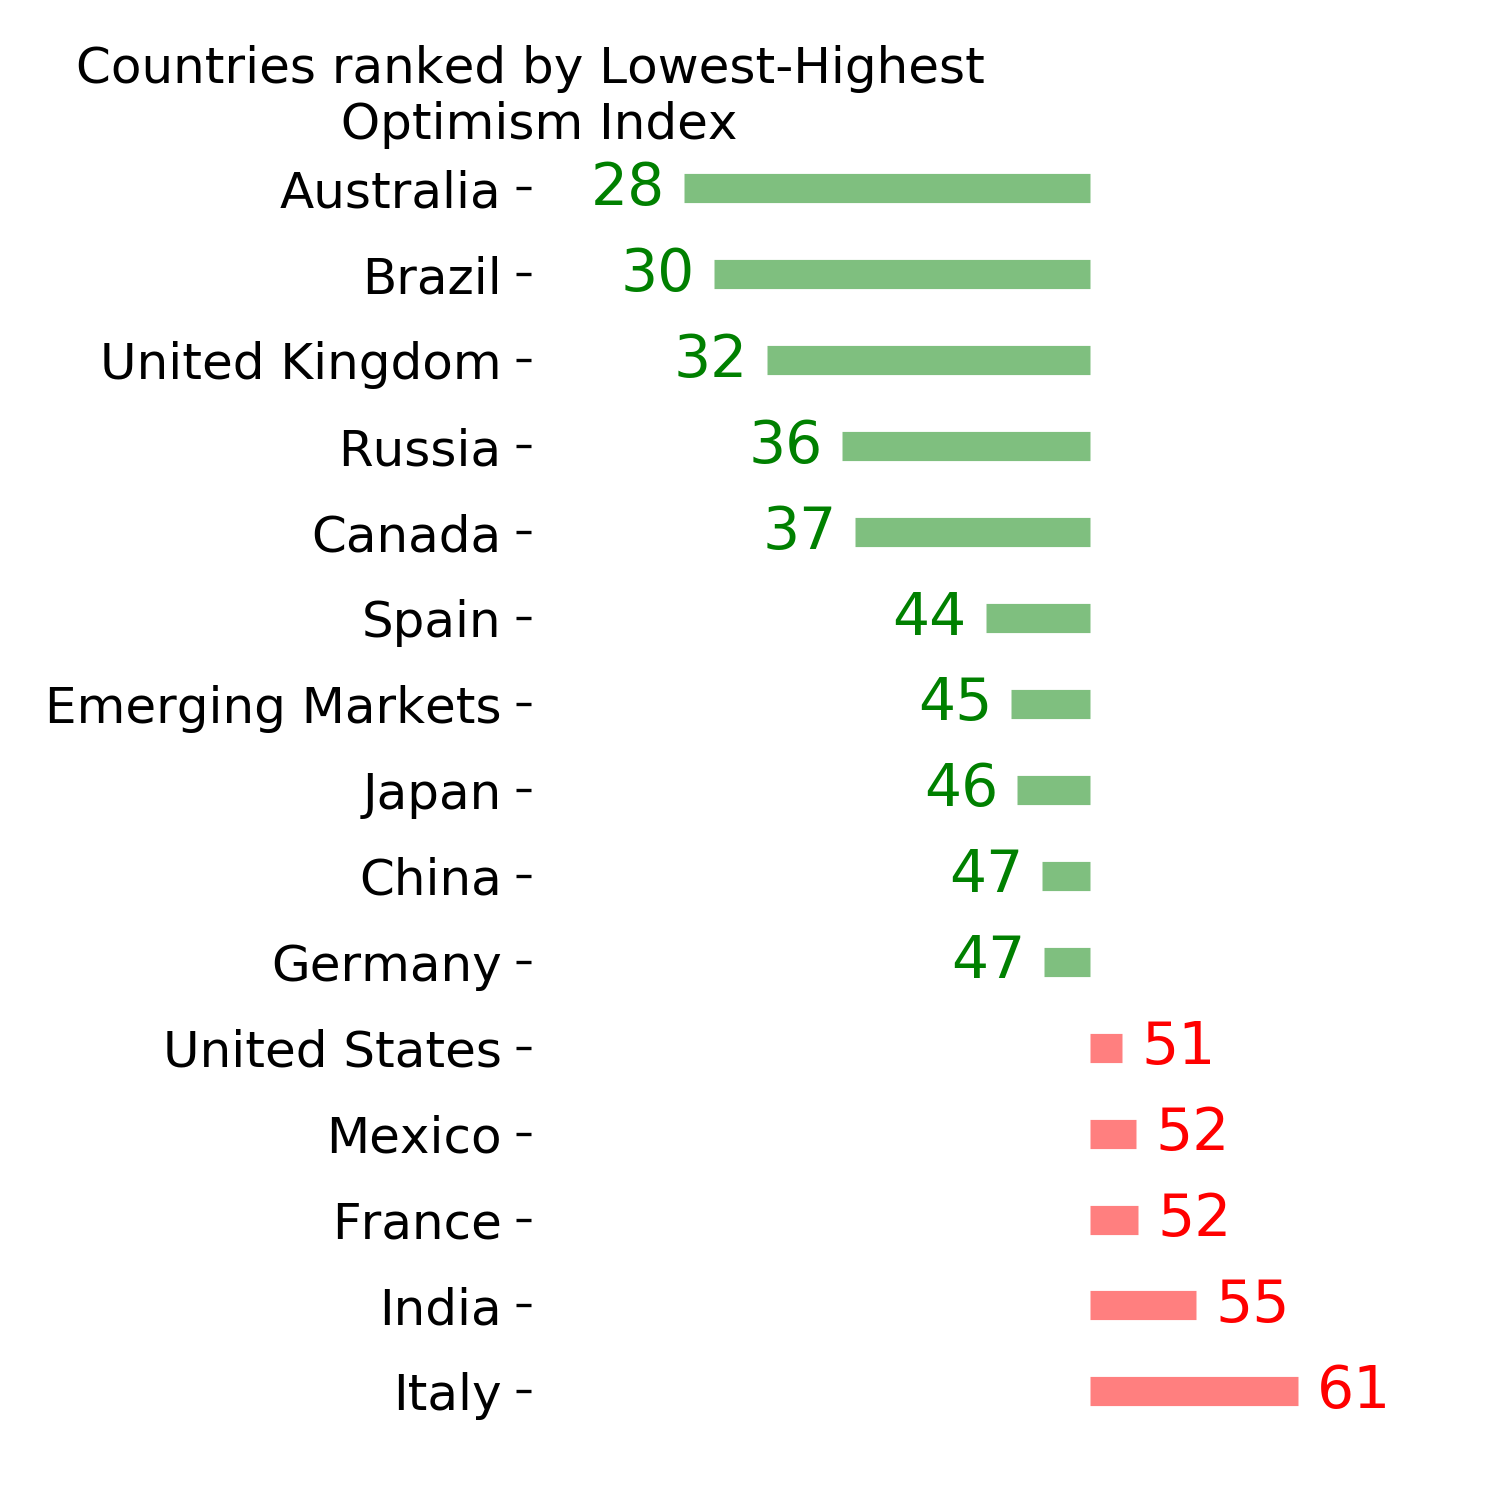
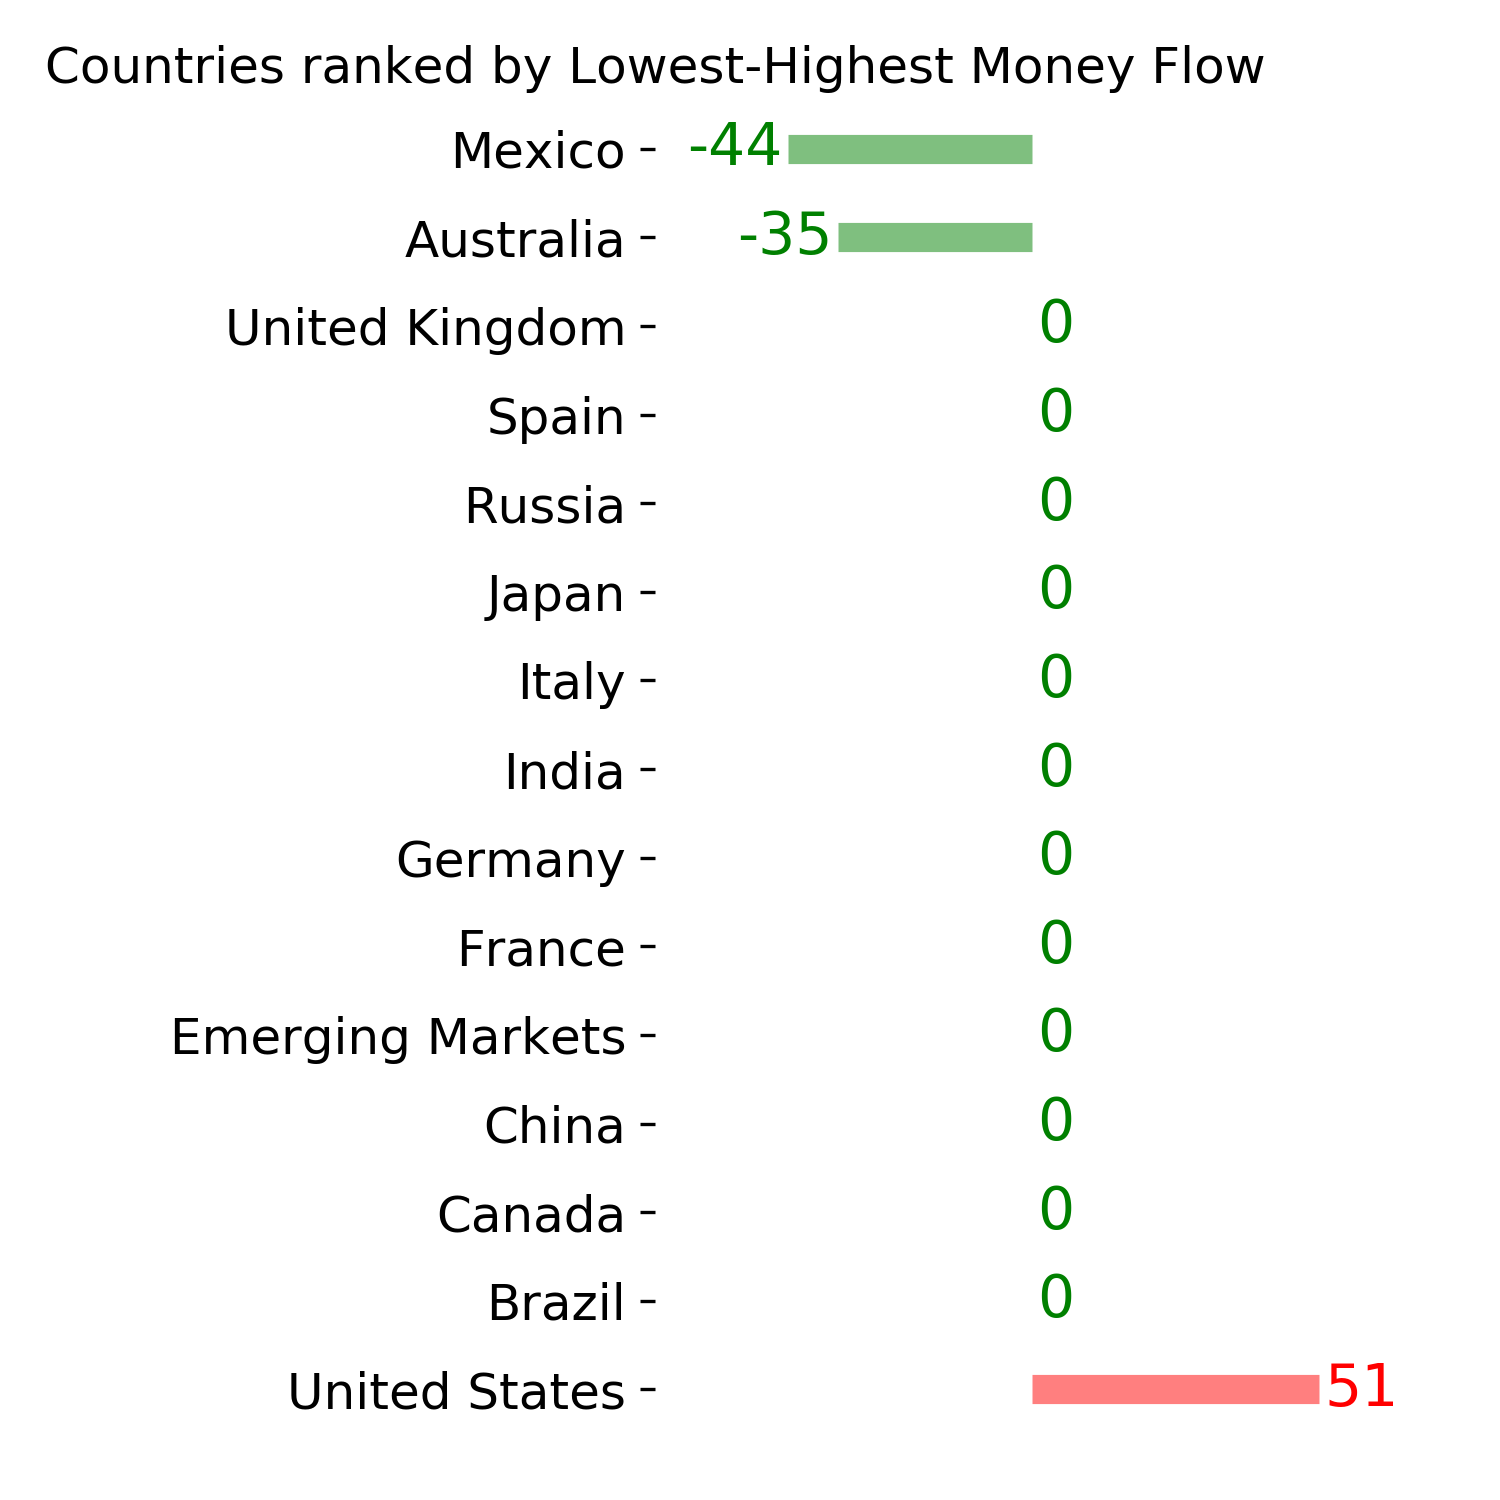
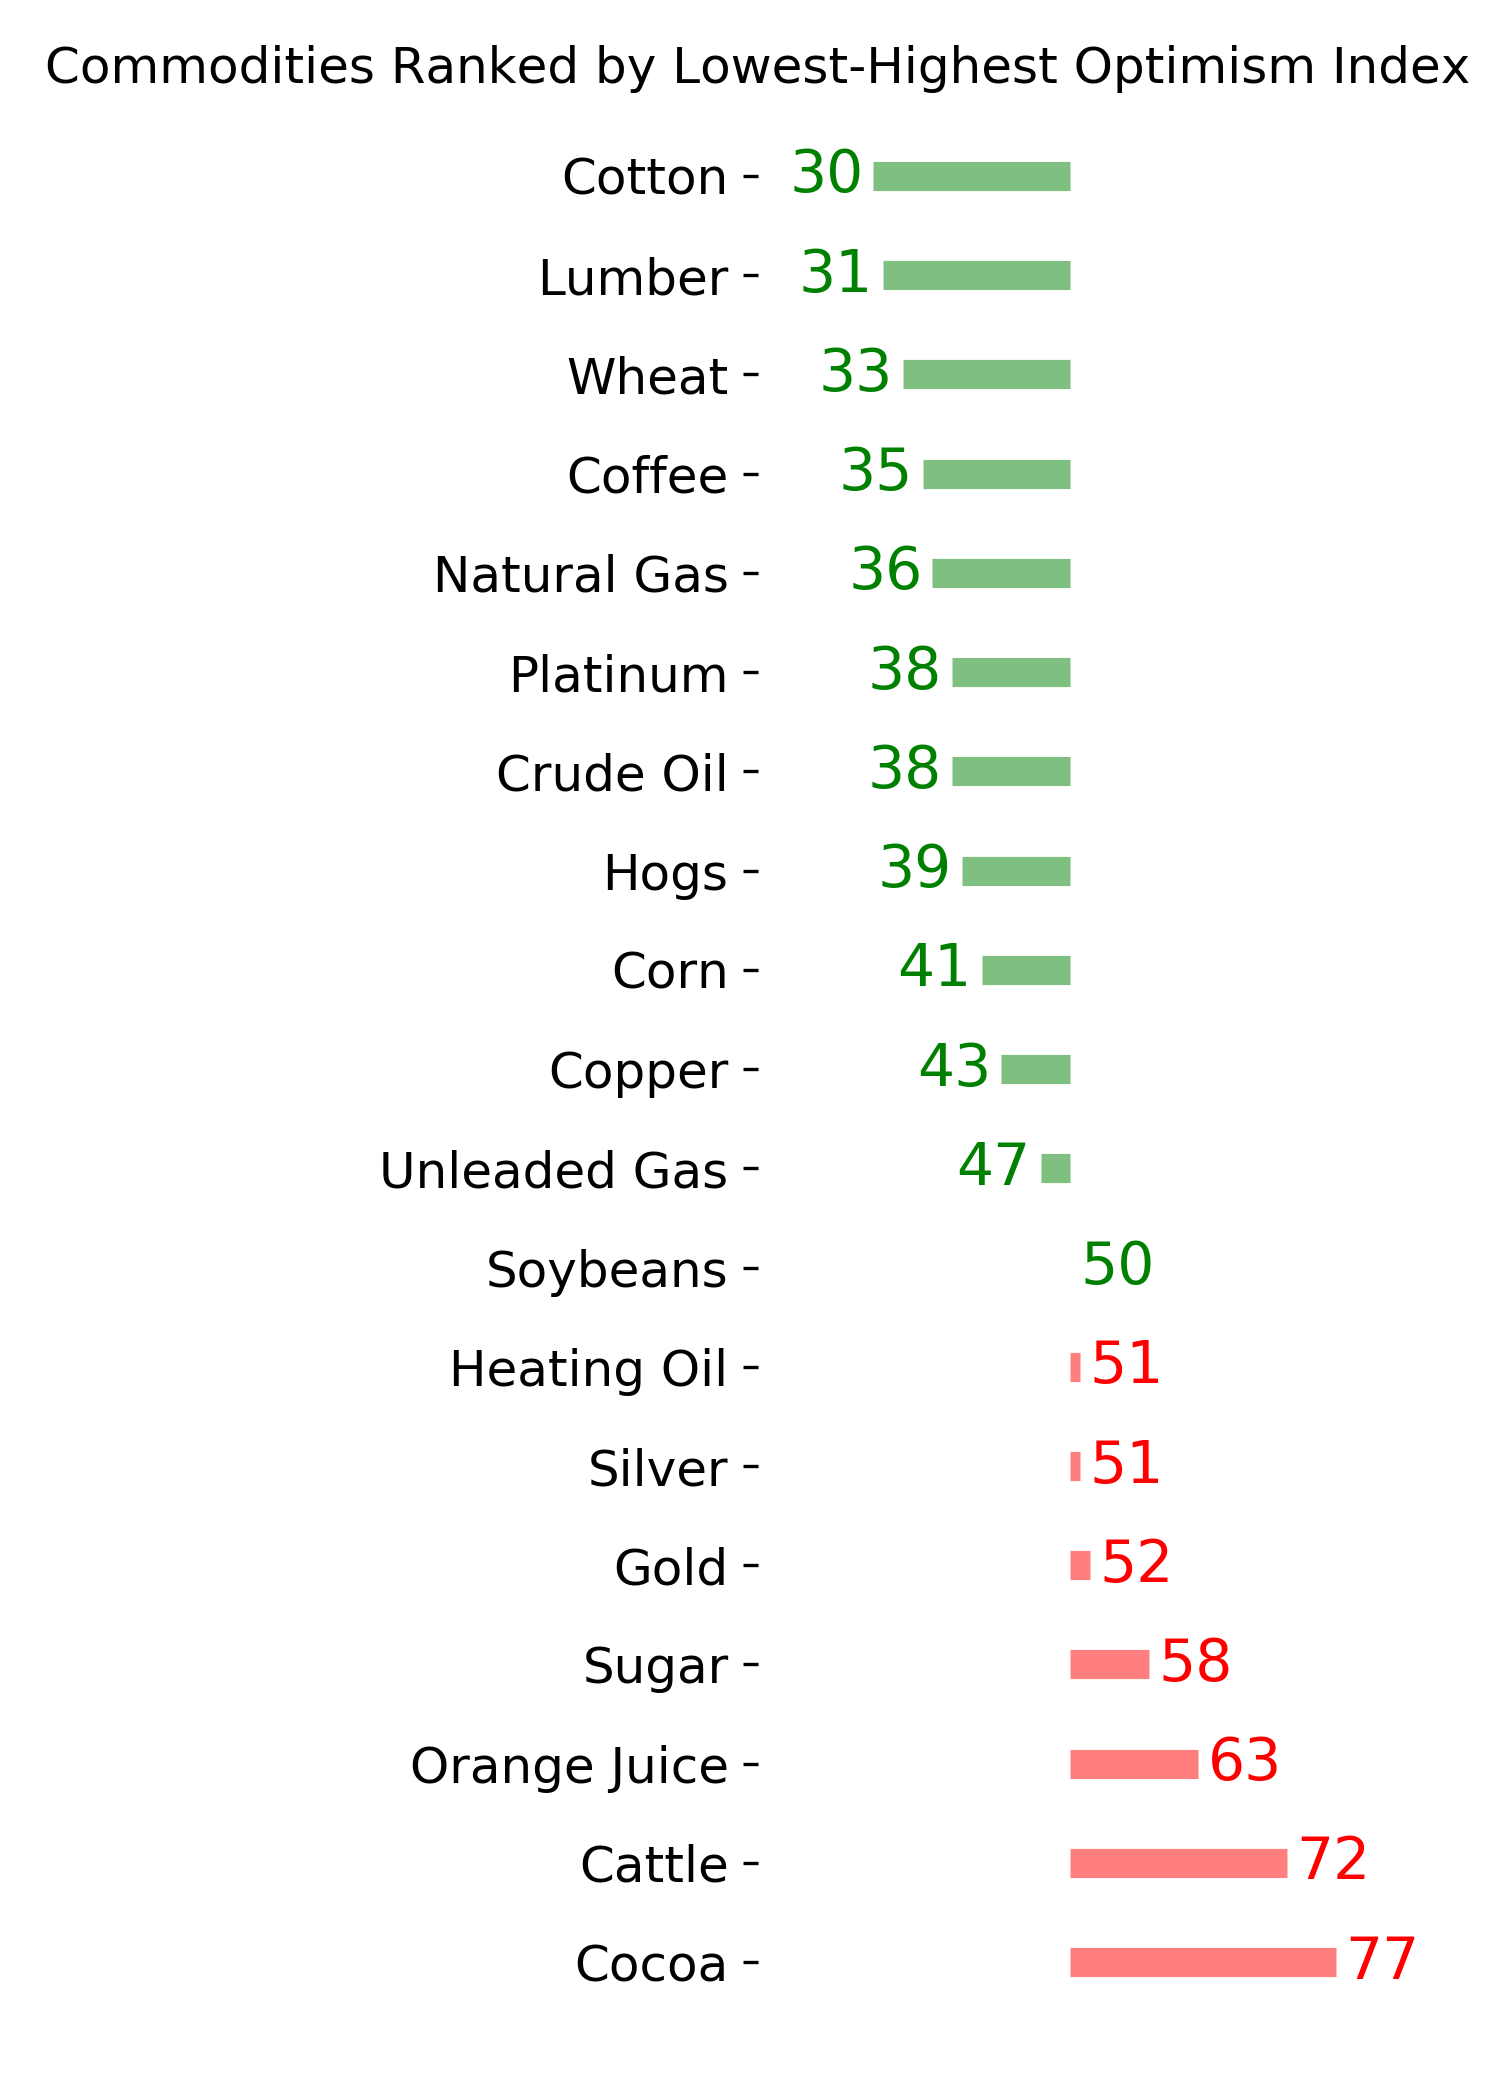
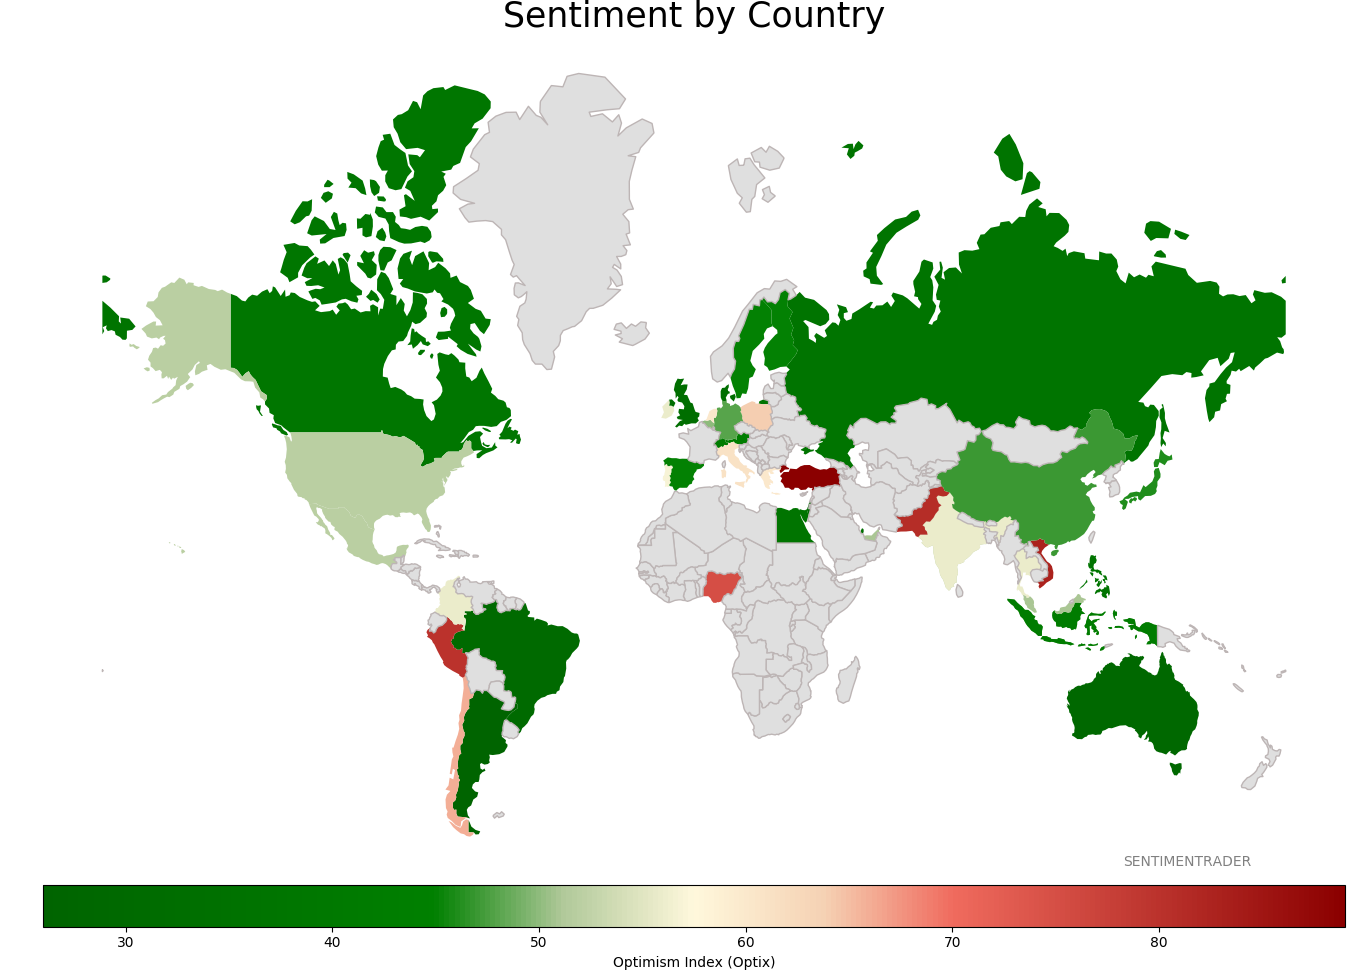
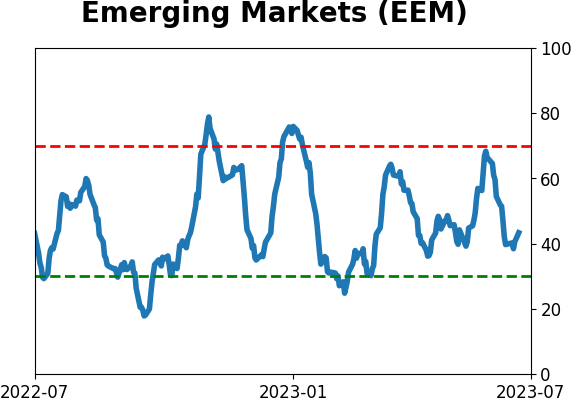
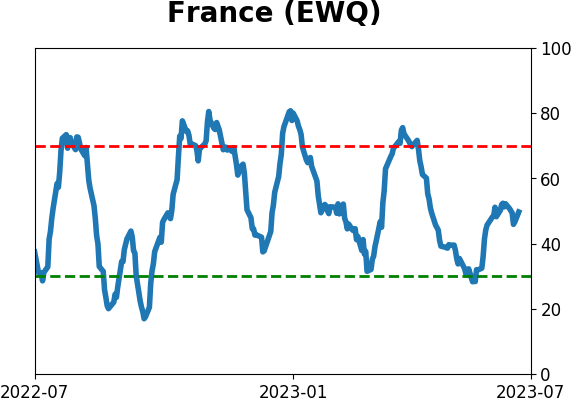
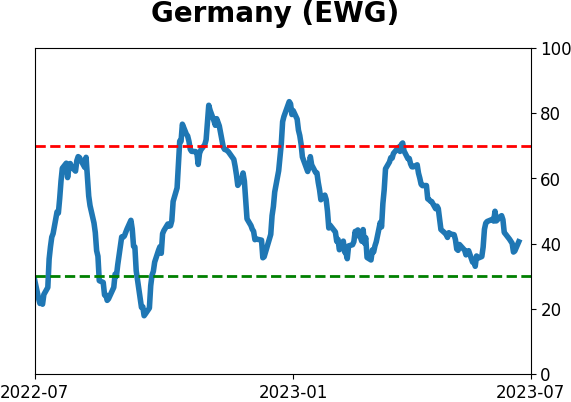
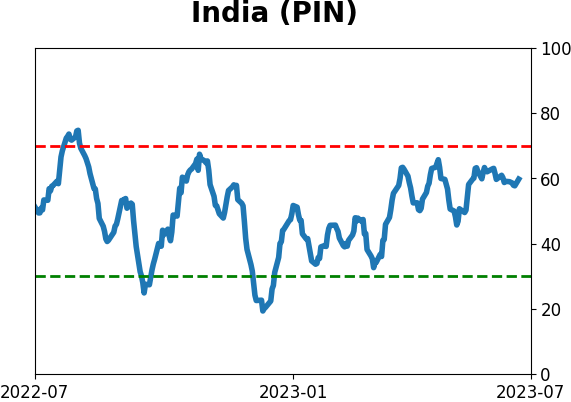
Sentiment Around The World
Optimism Index Thumbnails
|
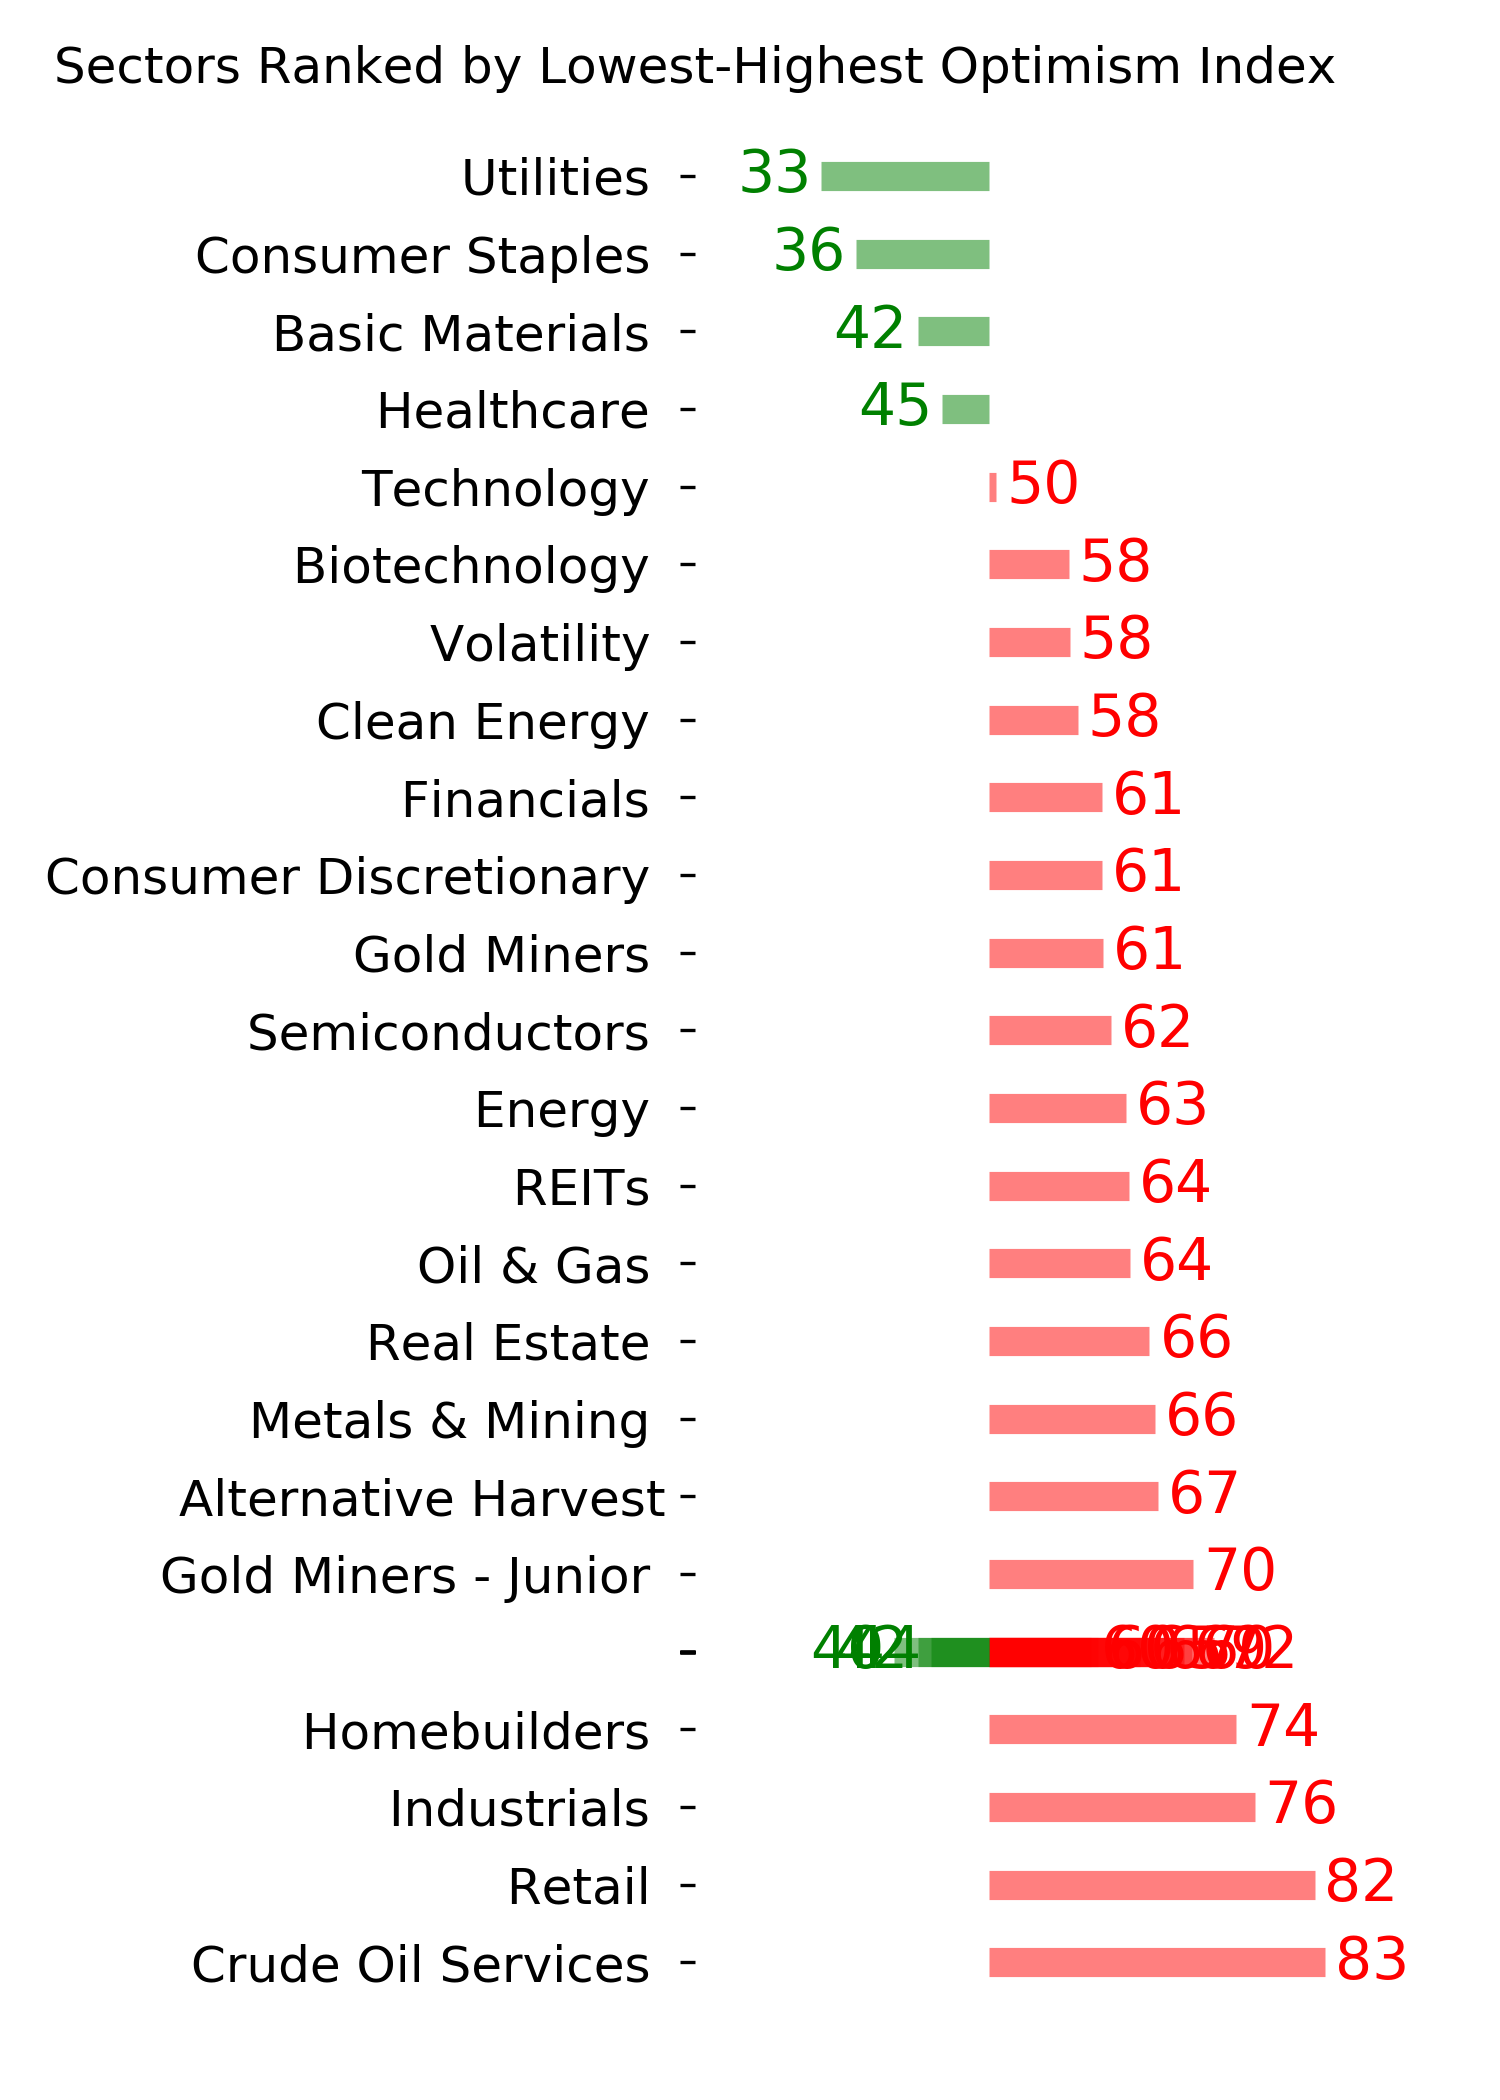
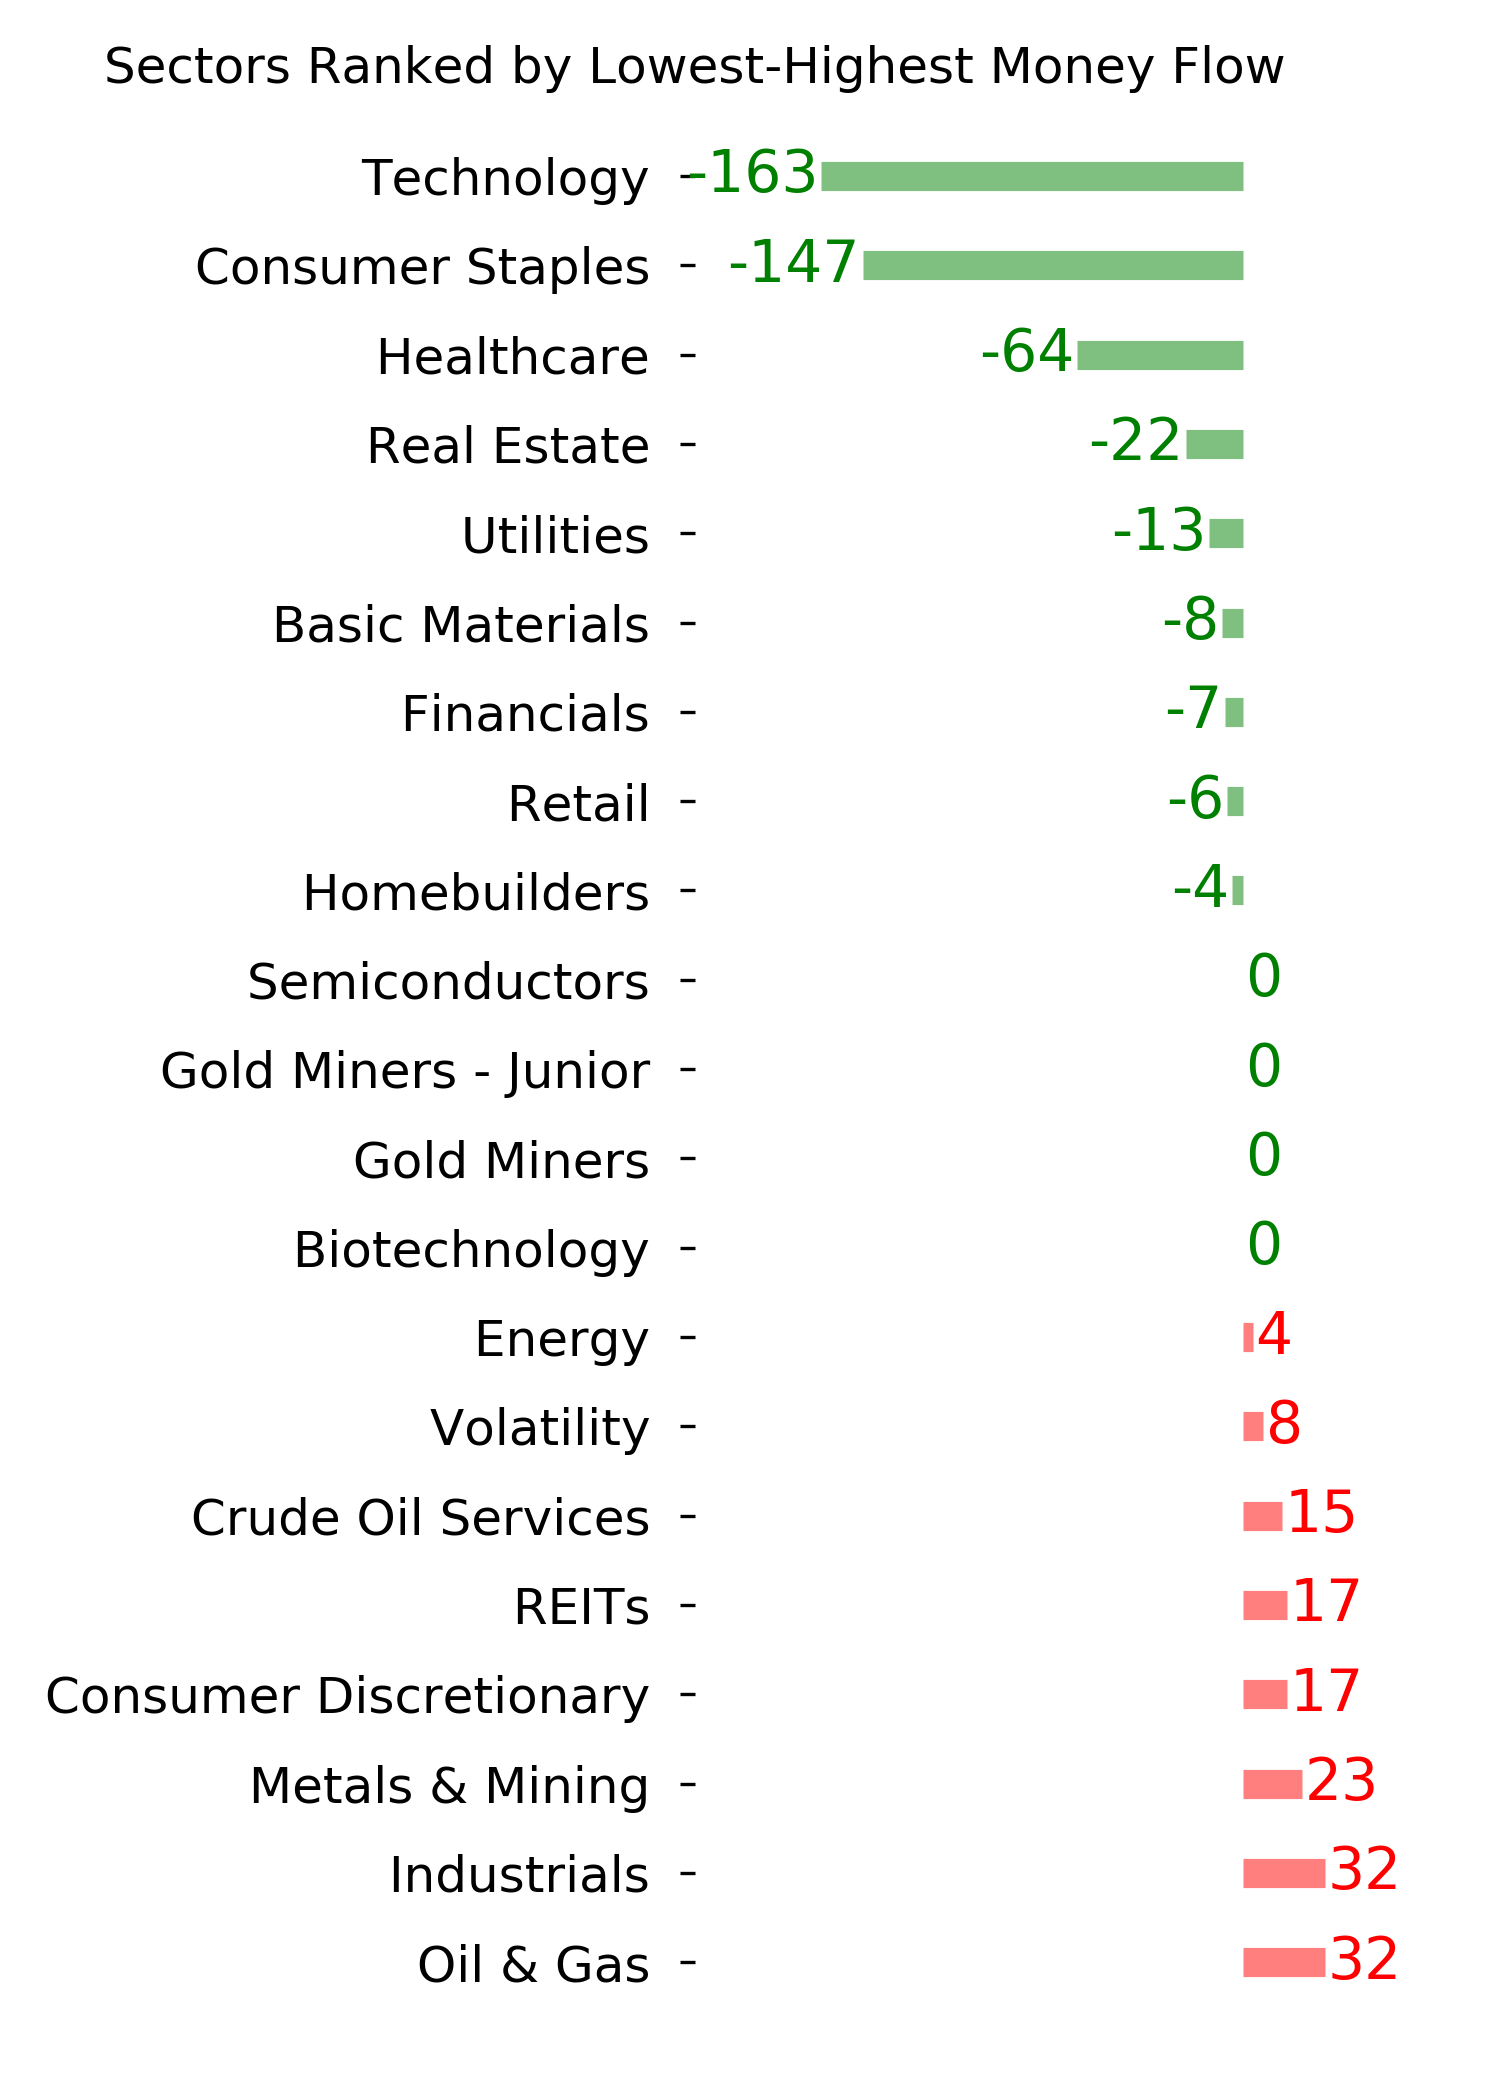
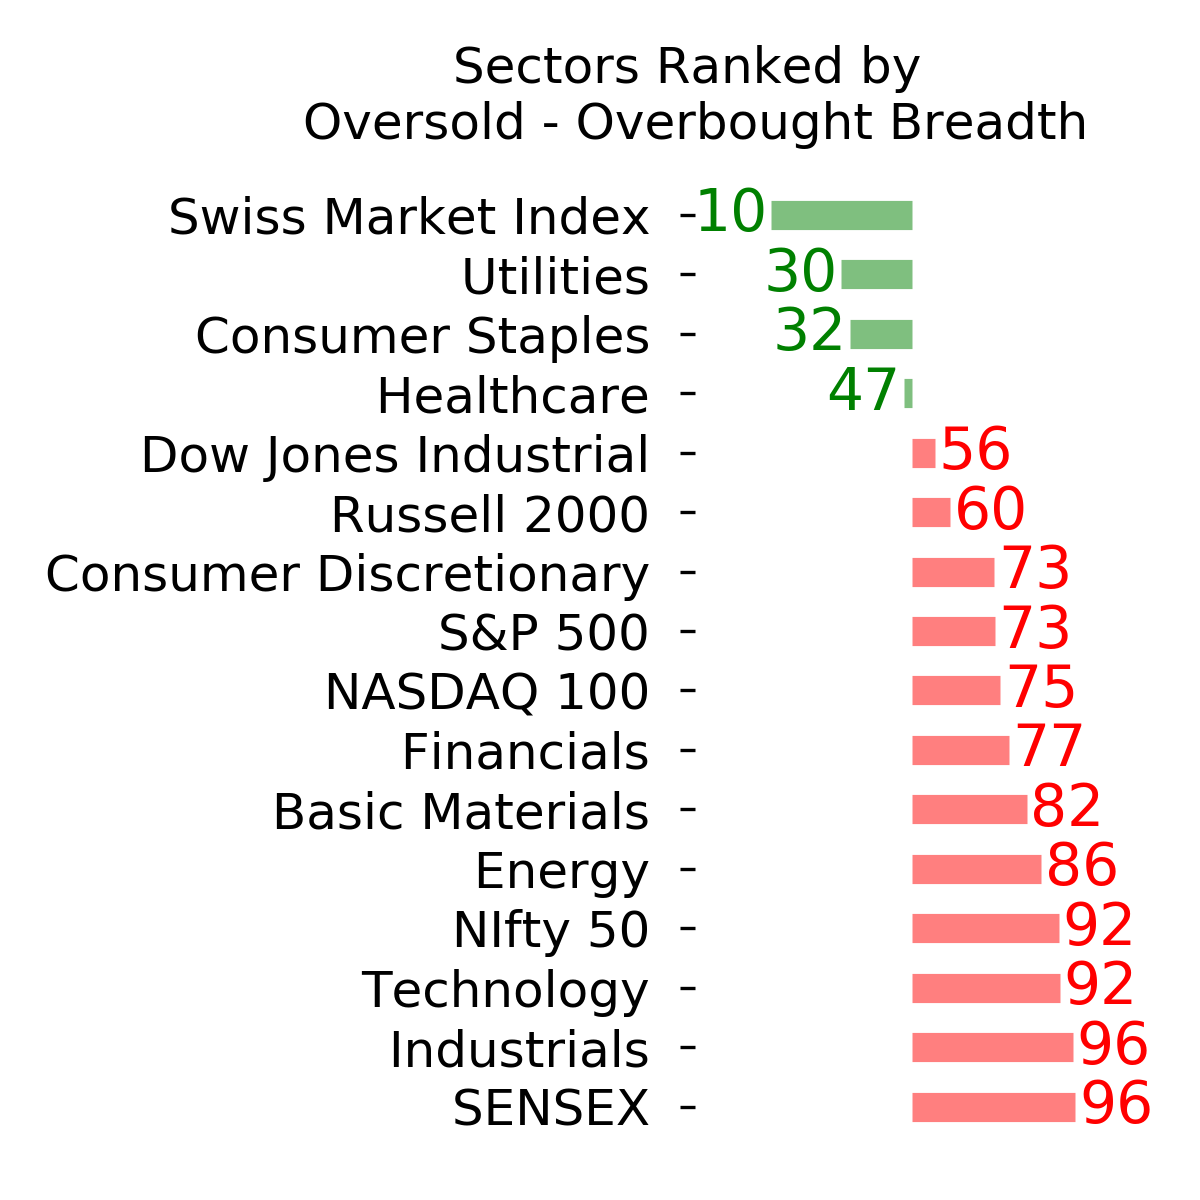
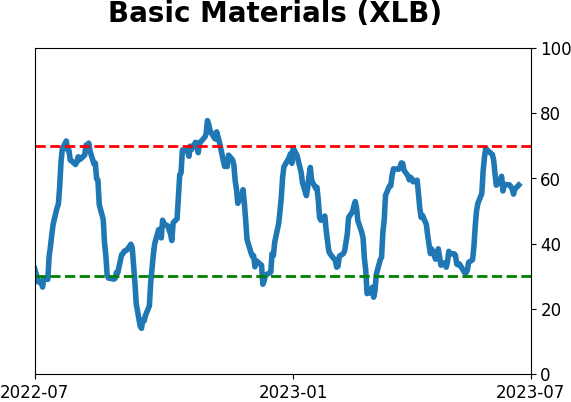
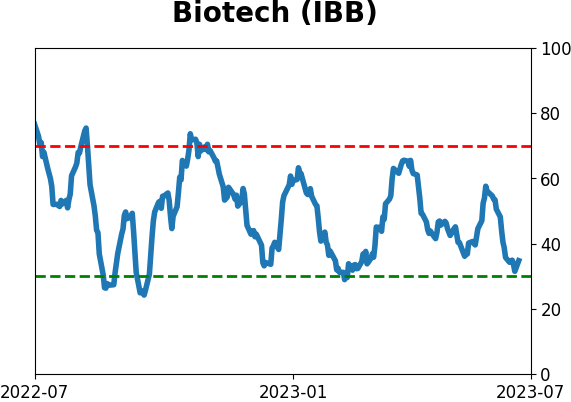
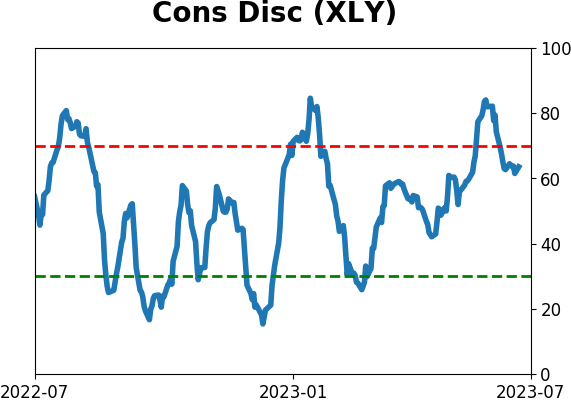
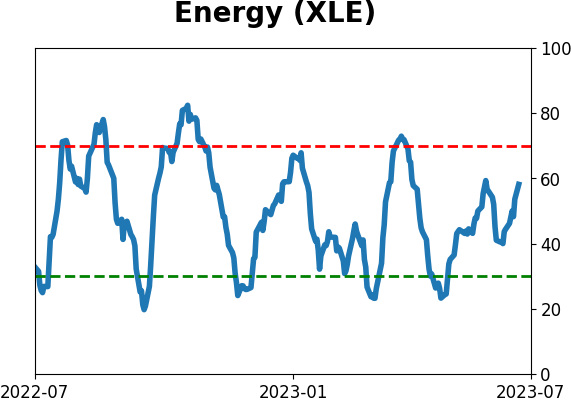
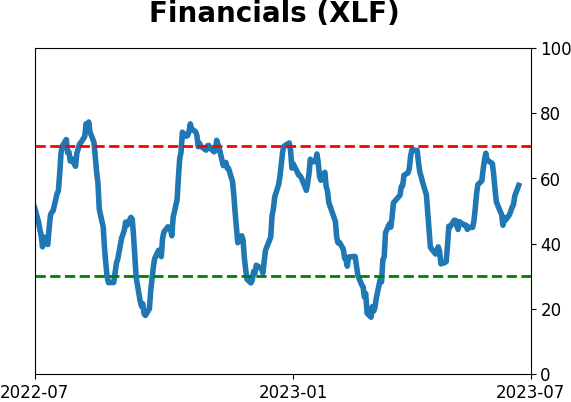
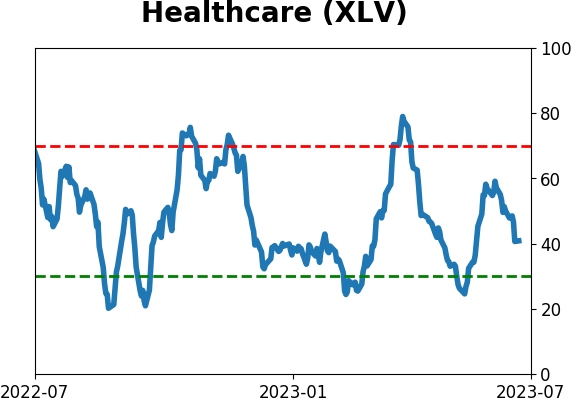
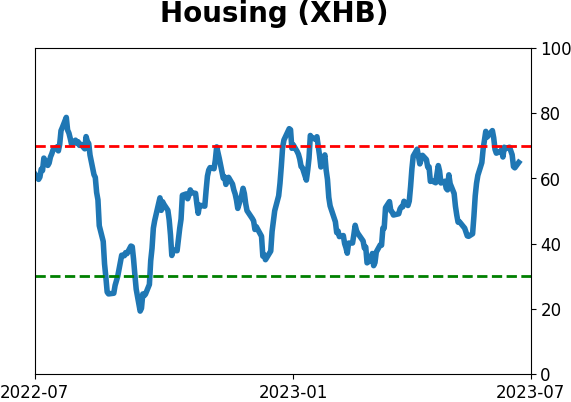
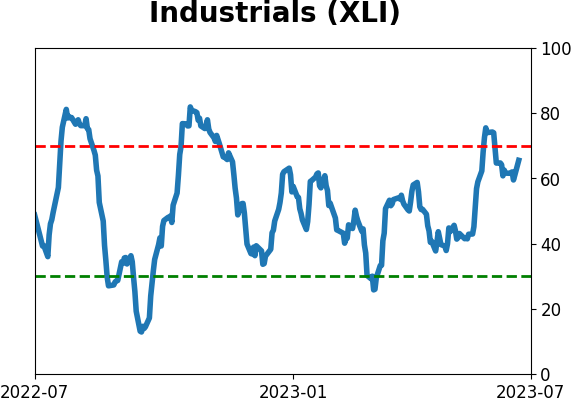
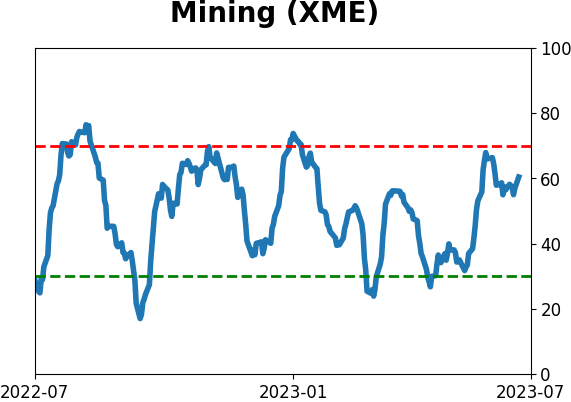
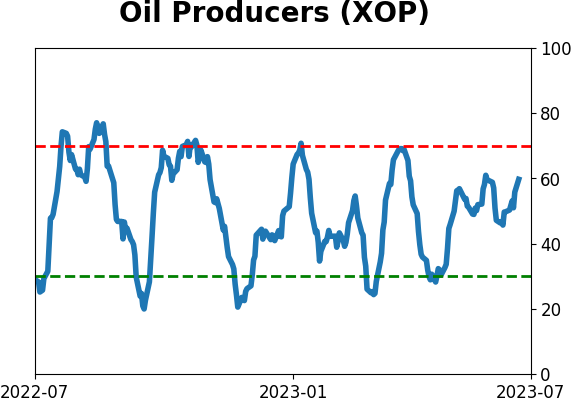
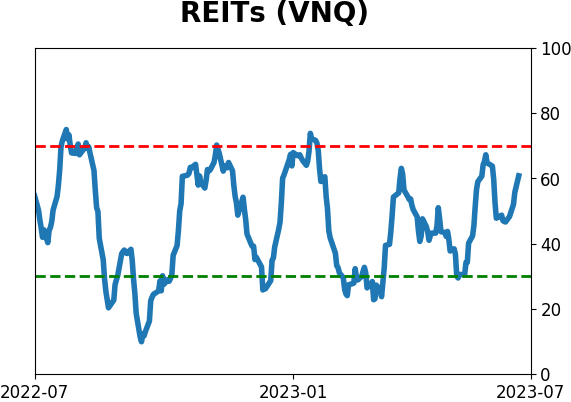
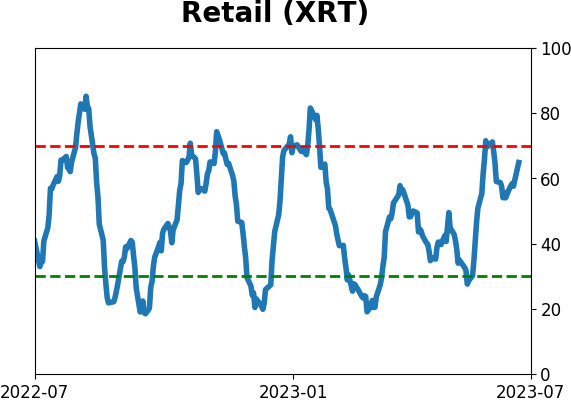
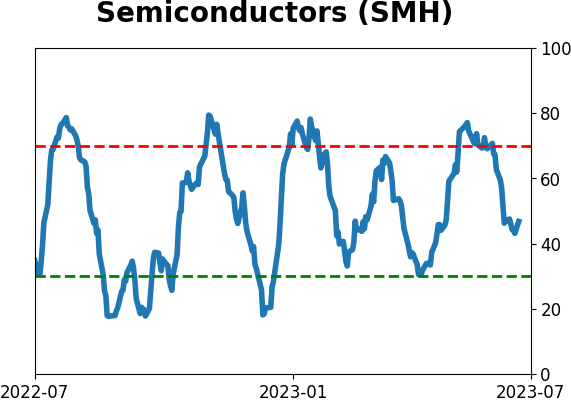
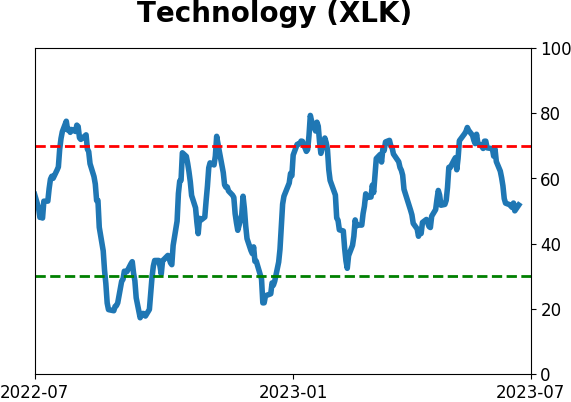
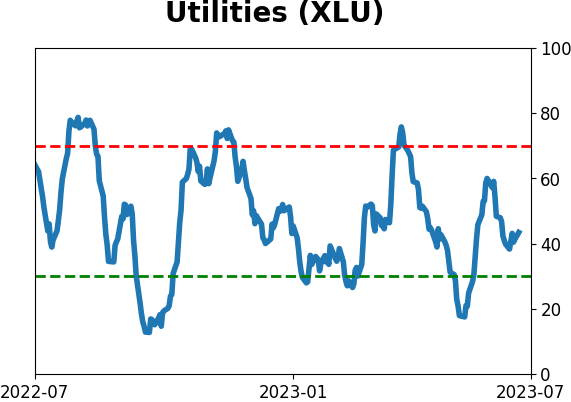
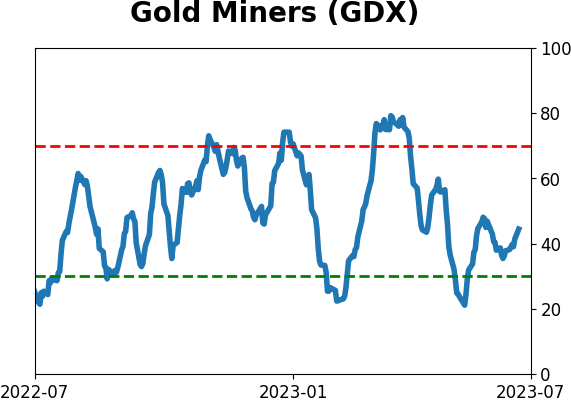
Sector ETF's - 10-Day Moving Average
|
|
|
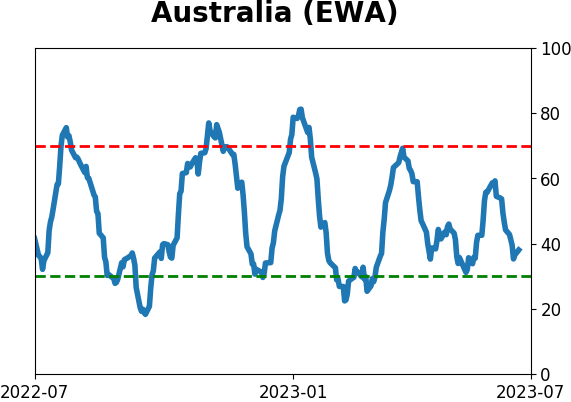
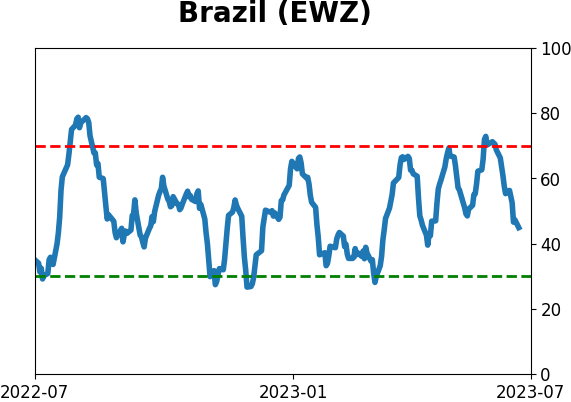
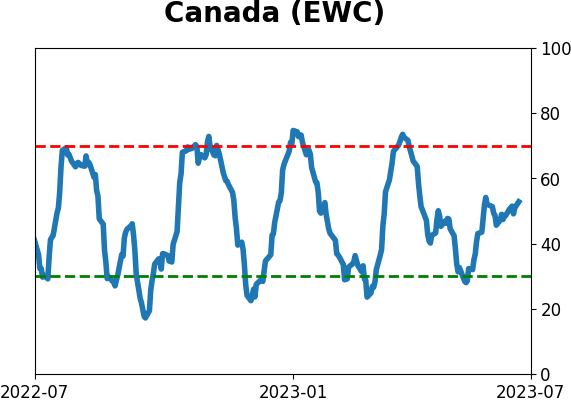
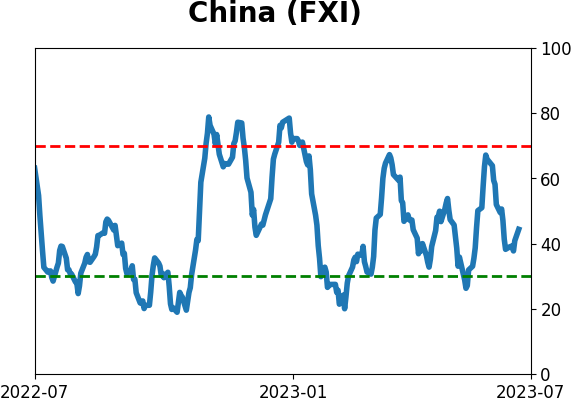
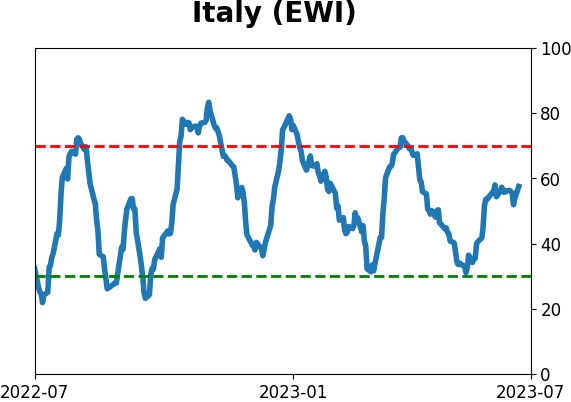
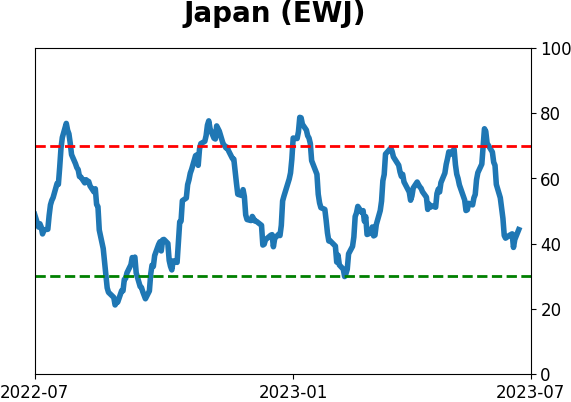
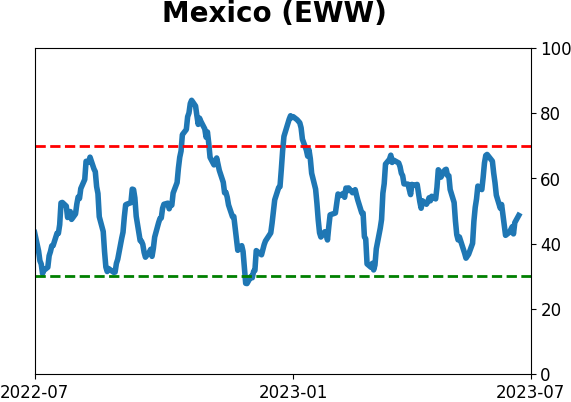
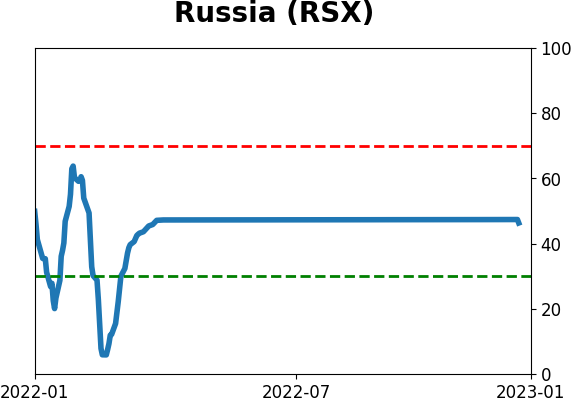
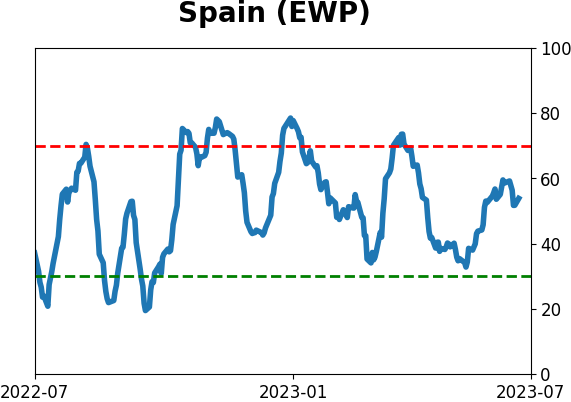
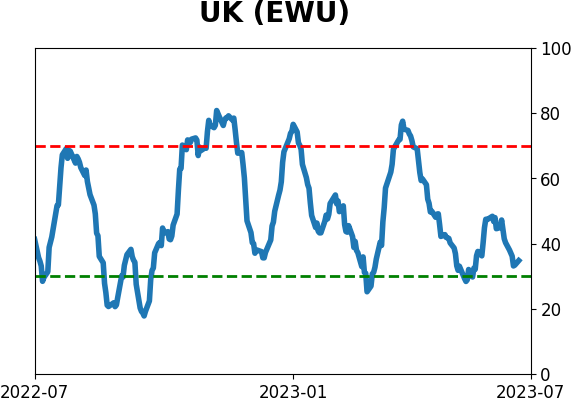
Country ETF's - 10-Day Moving Average
|
|
|
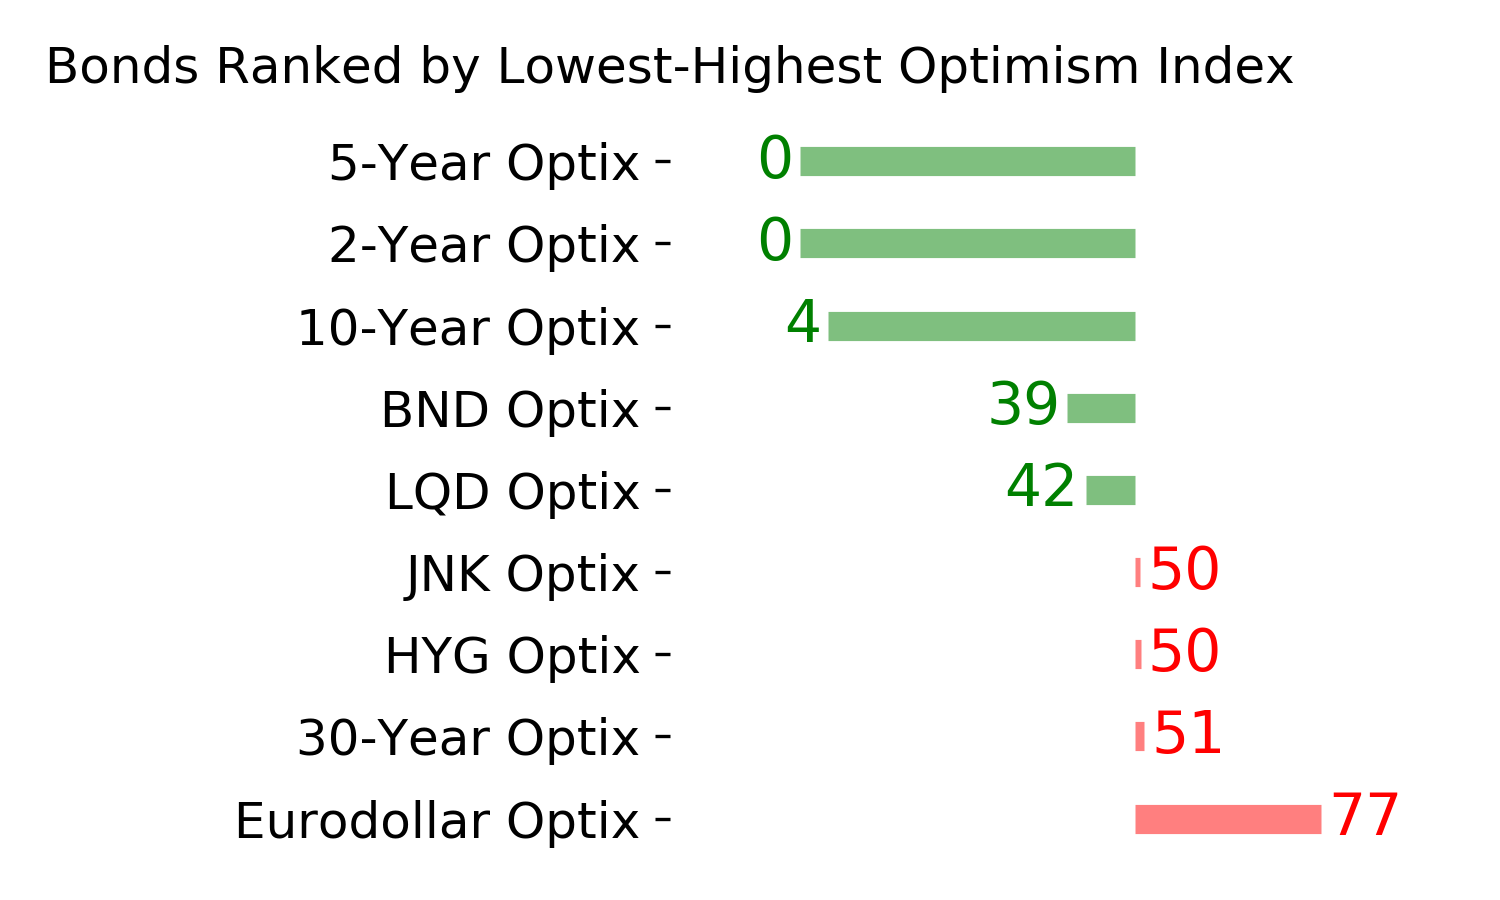
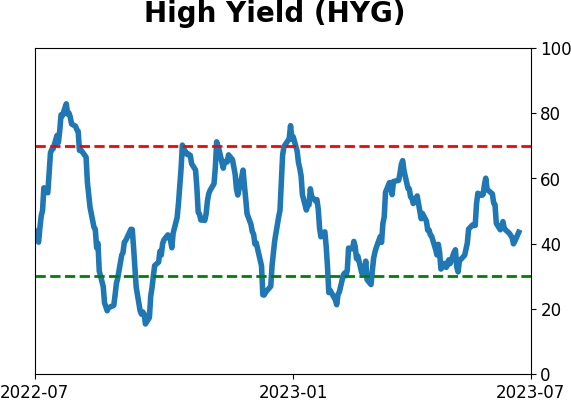
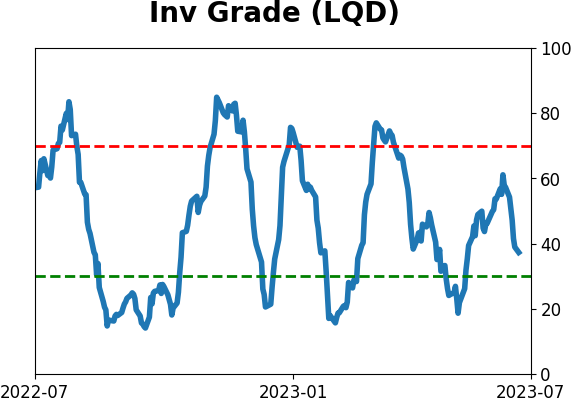
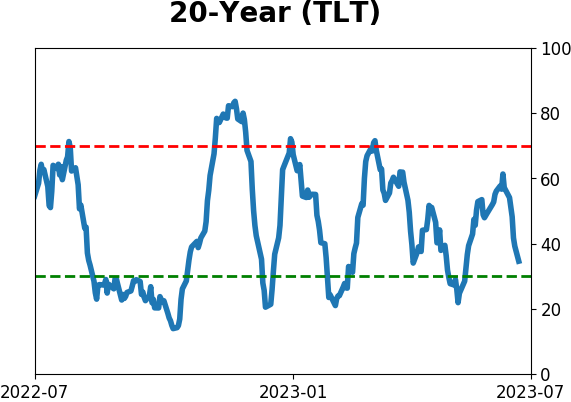
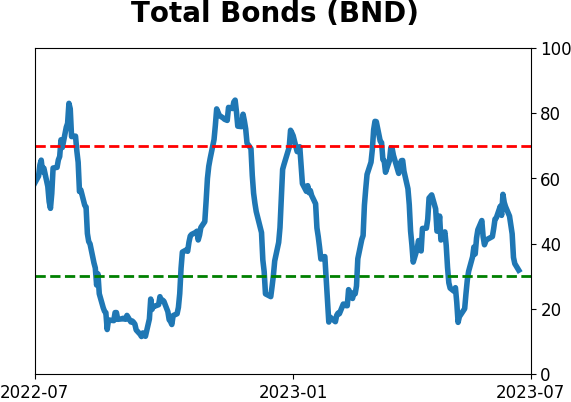
Bond ETF's - 10-Day Moving Average
|
|
|
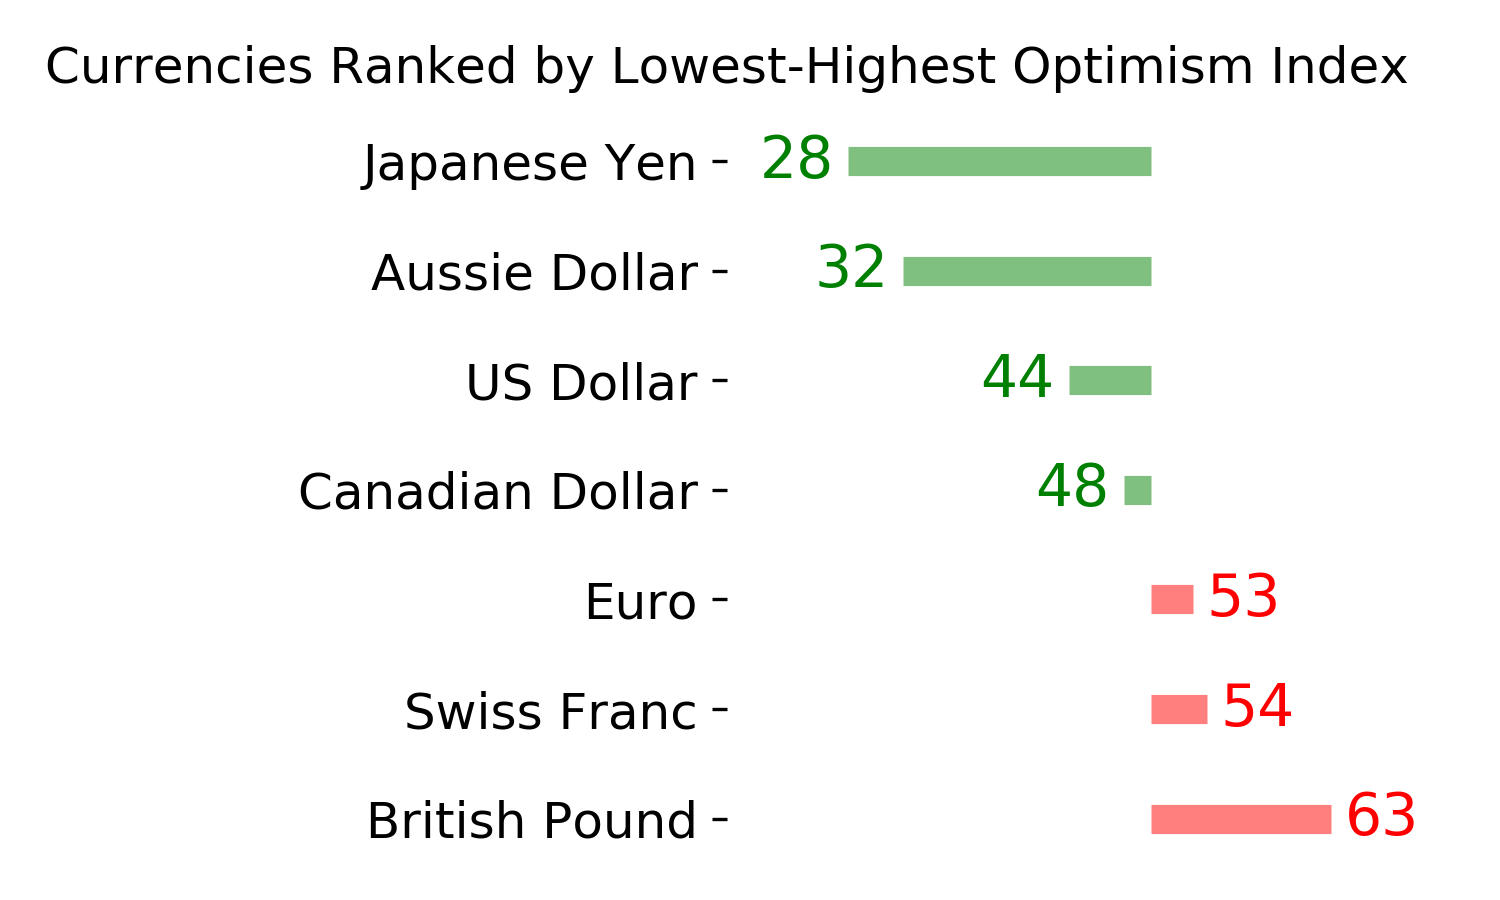
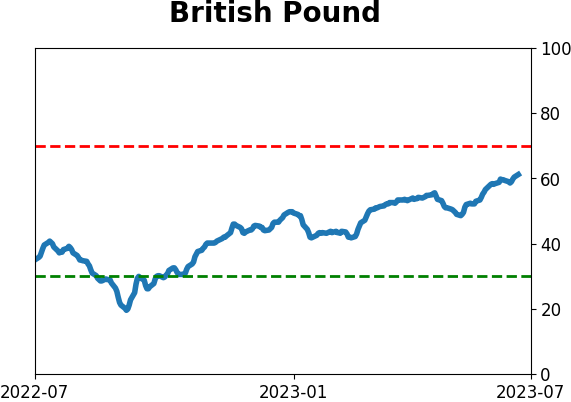
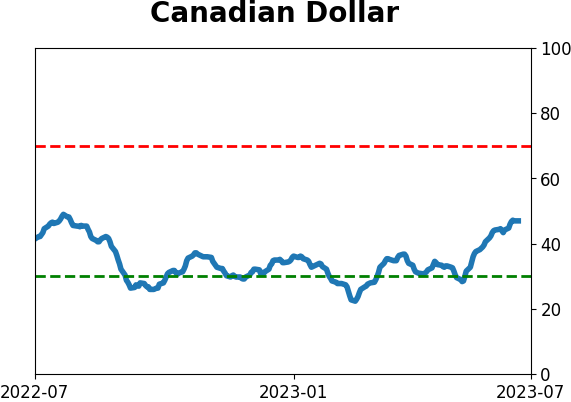
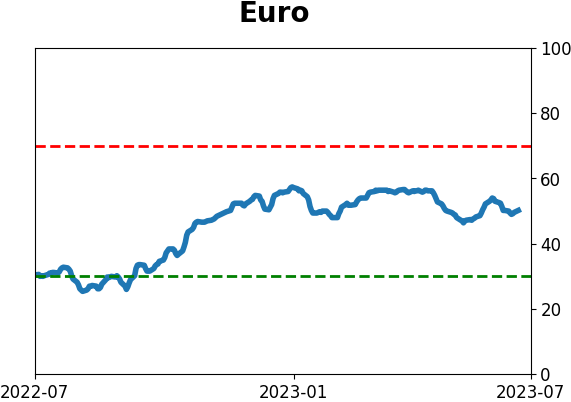
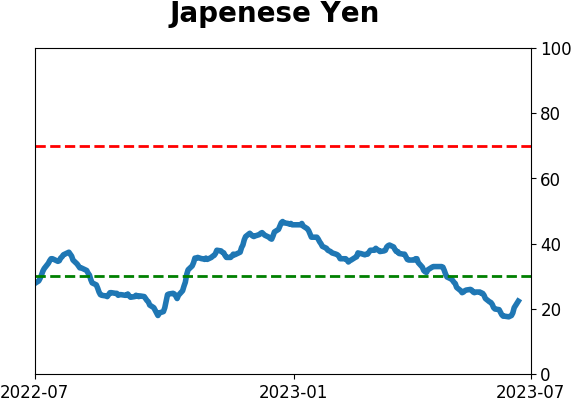
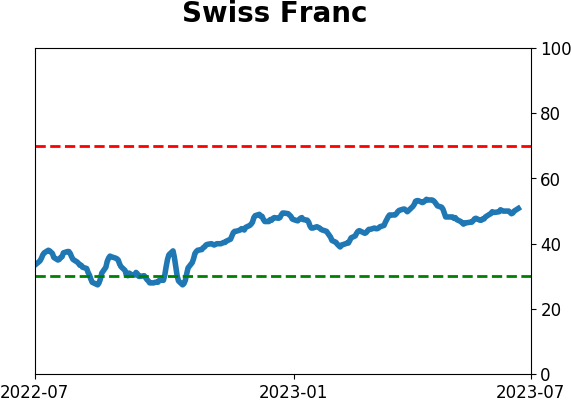
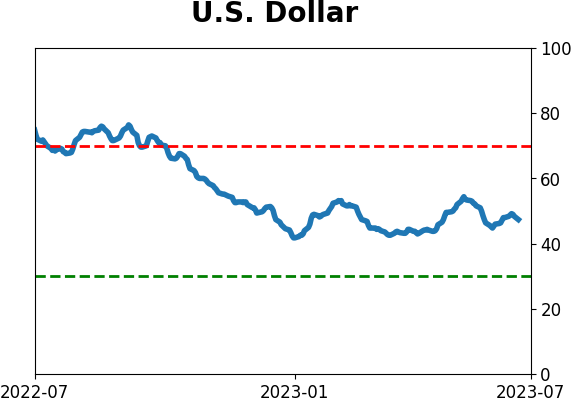
Currency ETF's - 5-Day Moving Average
|
|
|
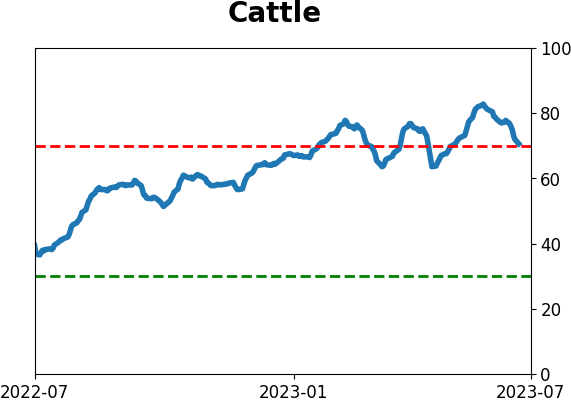
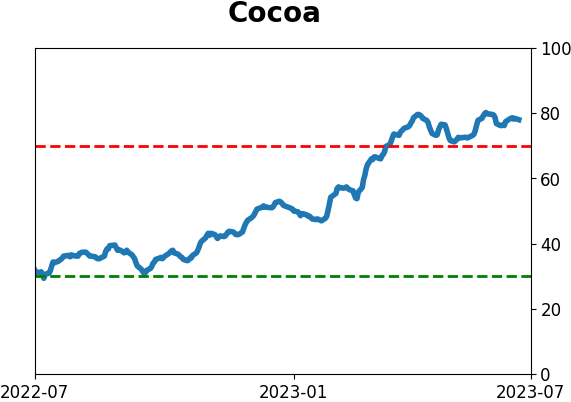
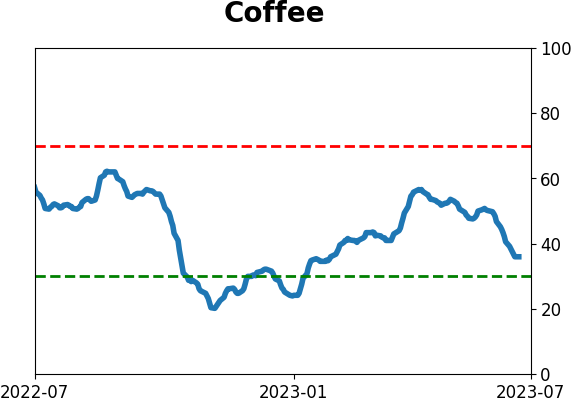
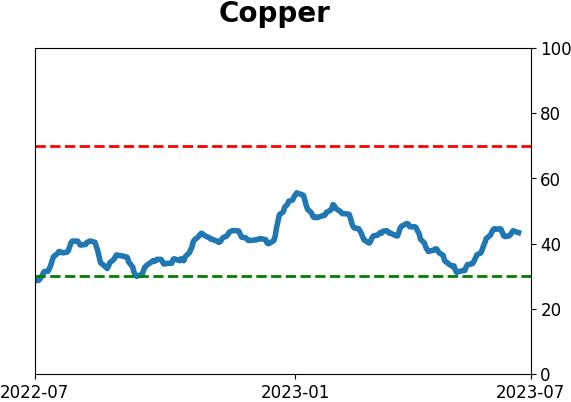
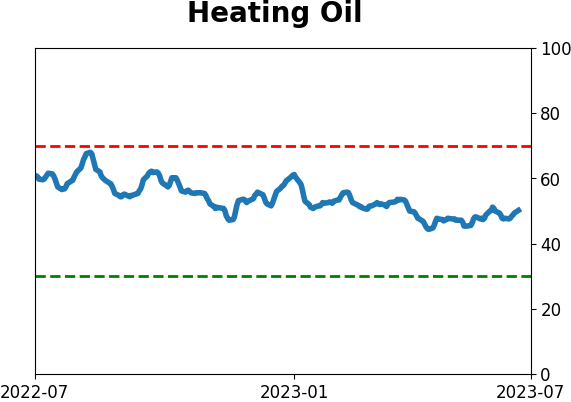
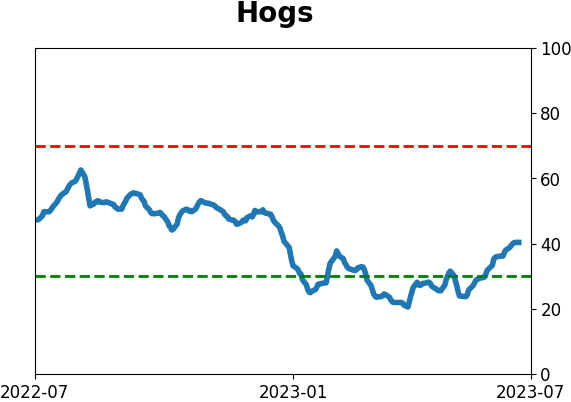
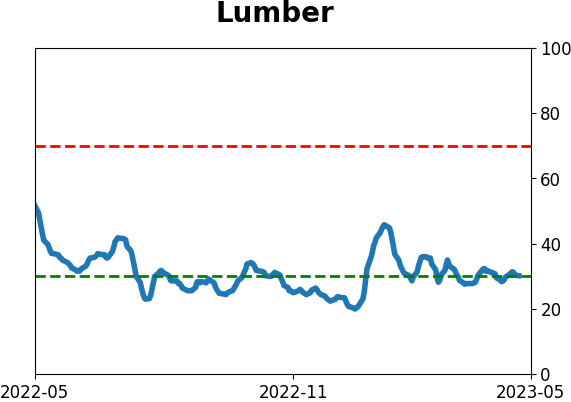
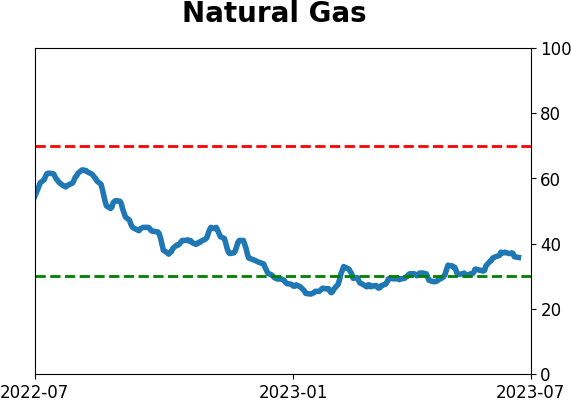
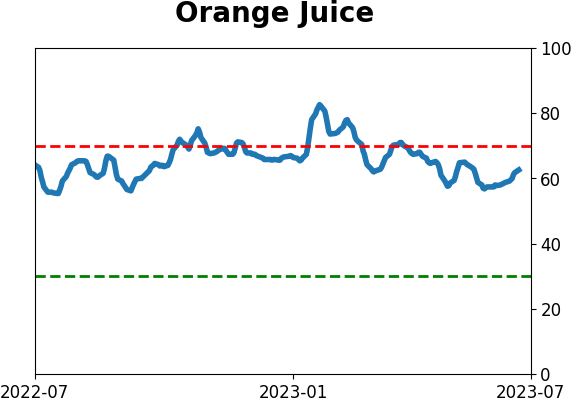
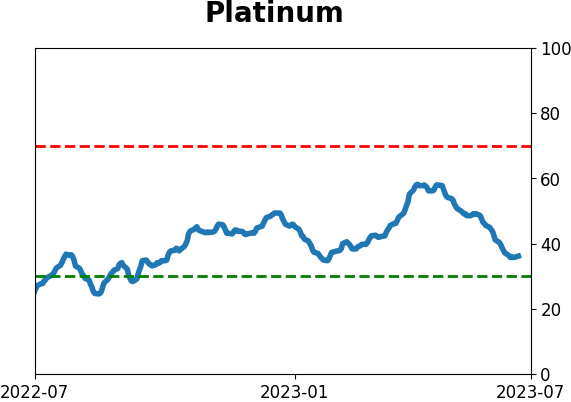
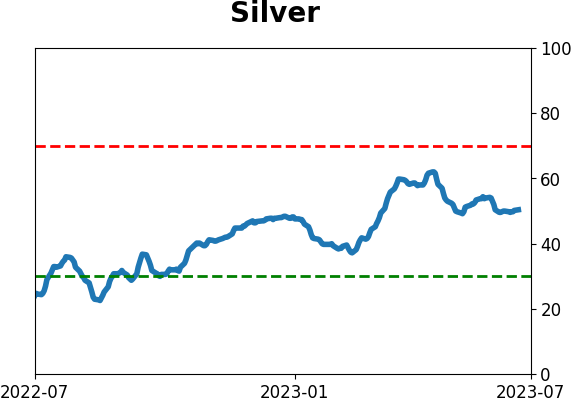
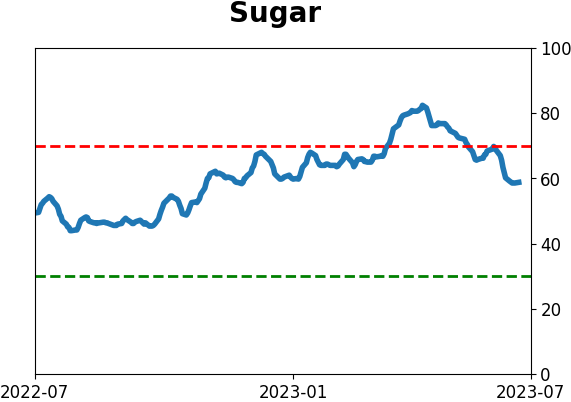
Commodity ETF's - 5-Day Moving Average
|
|