Headlines
|
|
Stocks are suffering from ODD:
Over the past 30 days, half of the sessions have seen the S&P 500 index move one way, and most of its stocks move in the exact opposite direction. This is like a child suffering from Oppositional Defiant Disorder, and it's maddening. Typically, stock returns suffer after behavior like this.
|
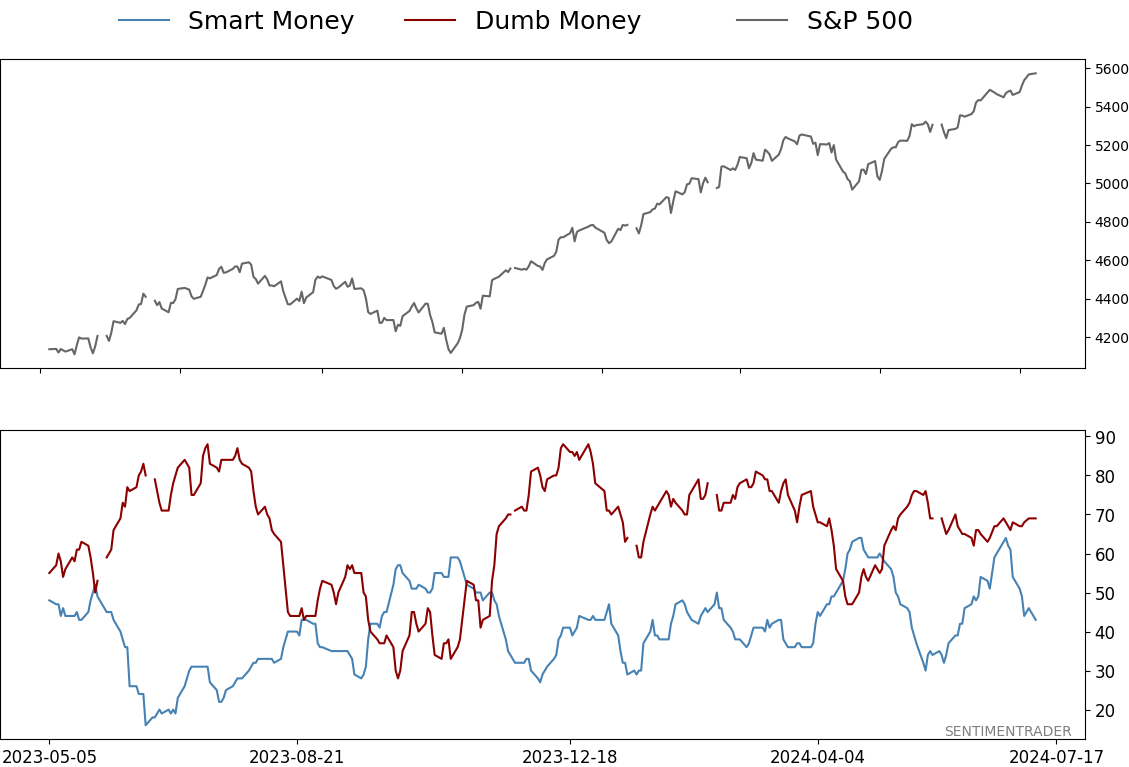
Smart / Dumb Money Confidence
|
Smart Money Confidence: 43%
Dumb Money Confidence: 69%
|
|
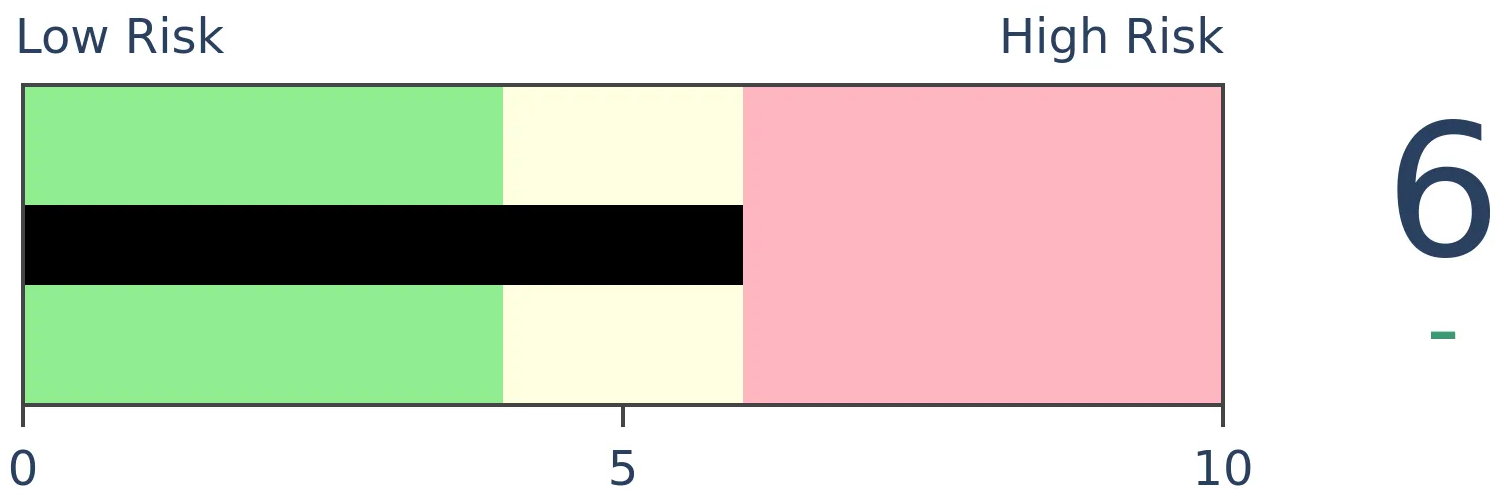
Risk Levels
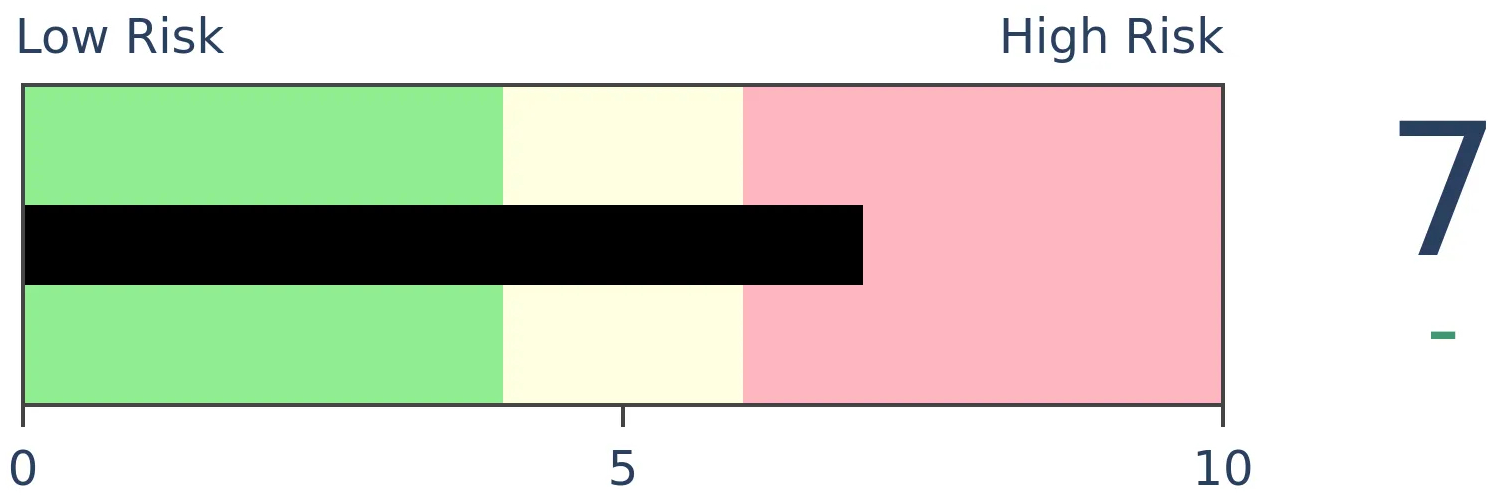
Stocks Short-Term
|
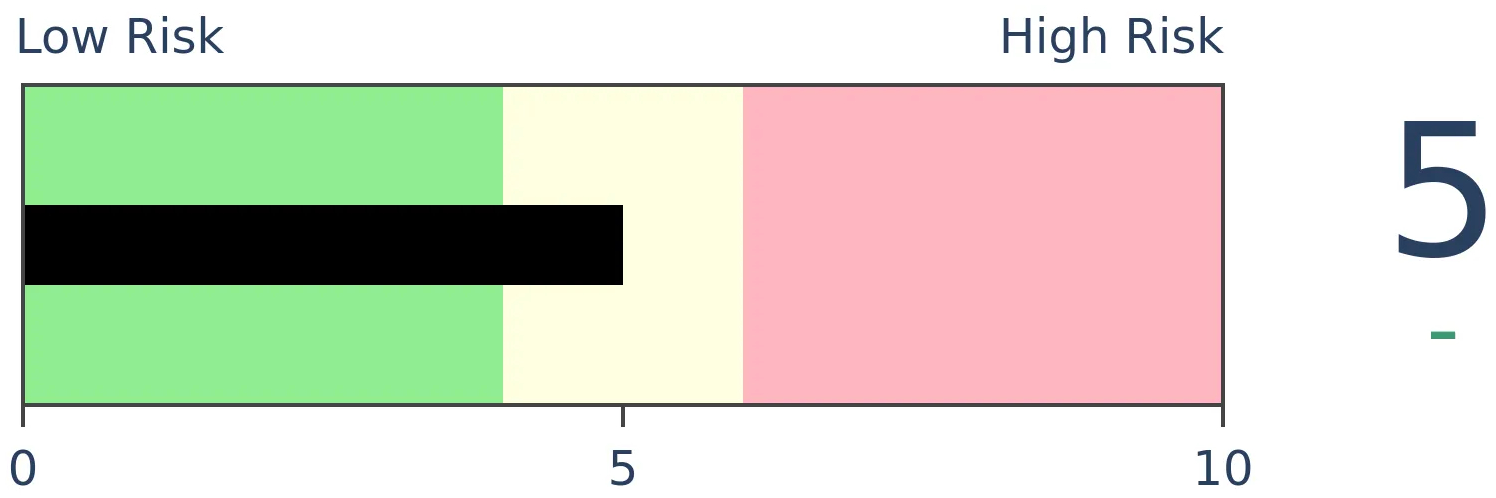
Stocks Medium-Term
|
|
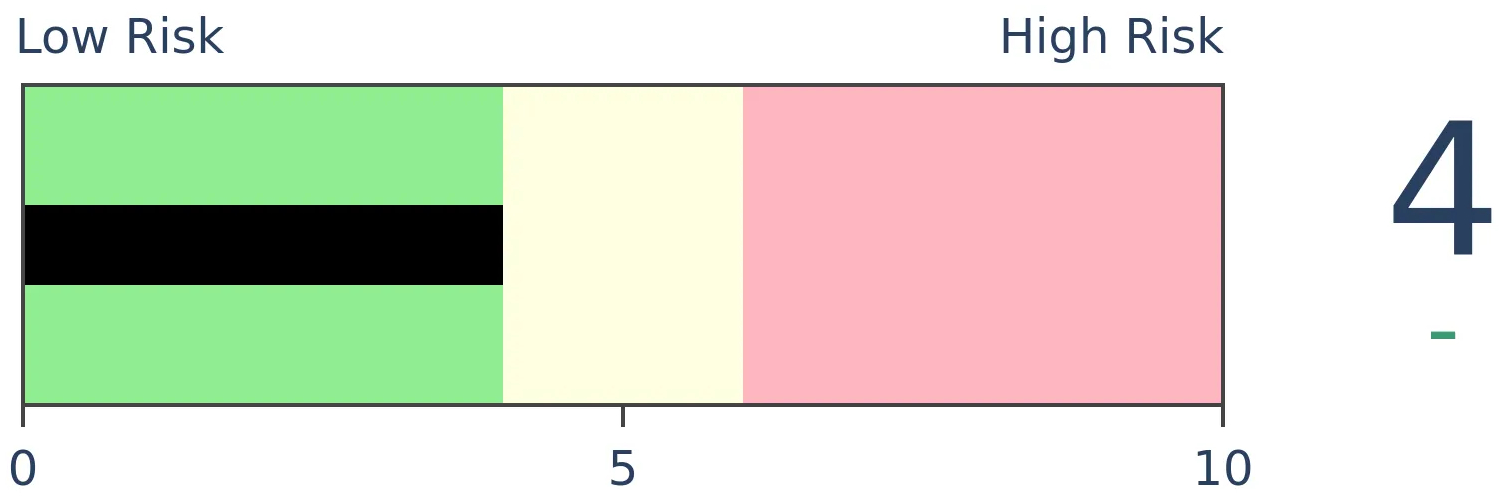
Bonds
|
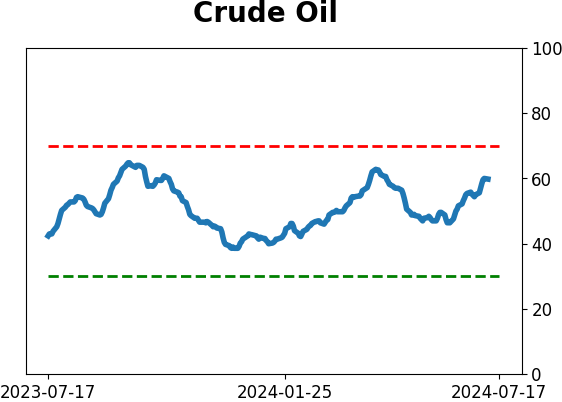
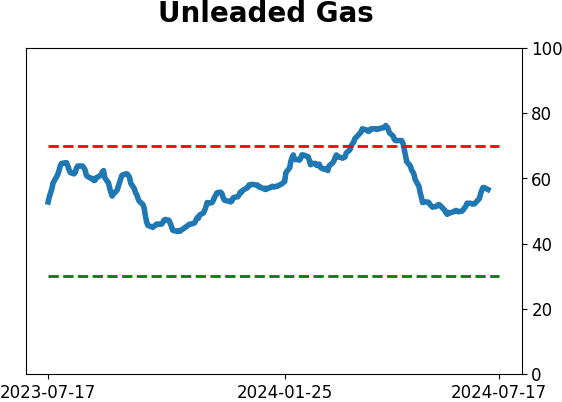
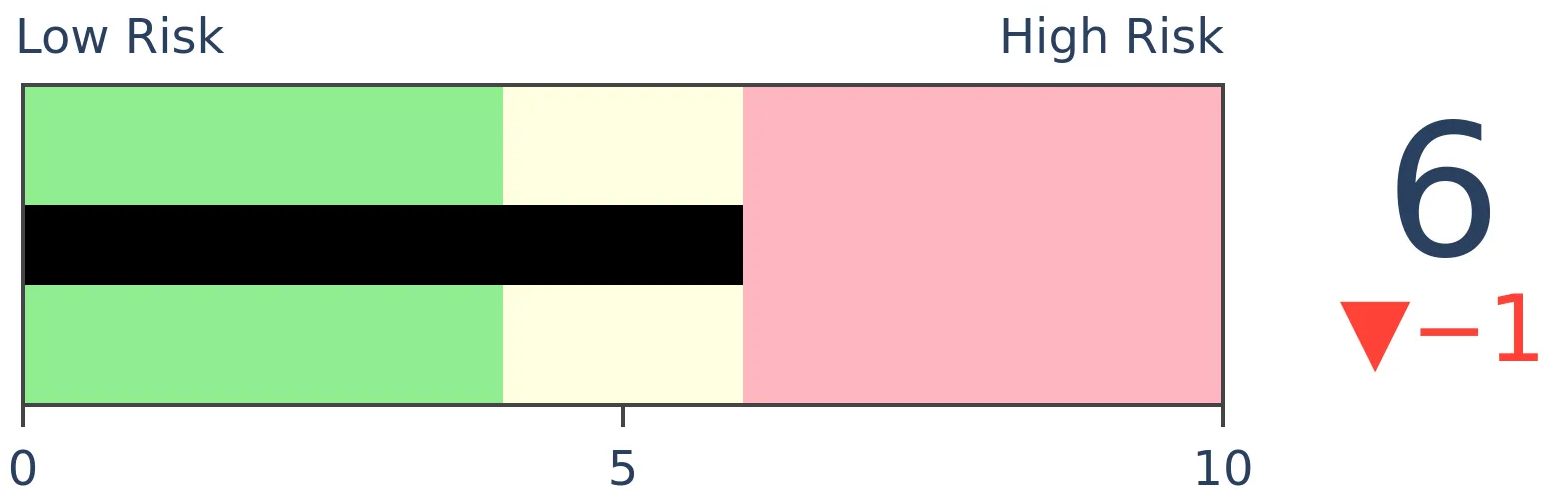
Crude Oil
|
|
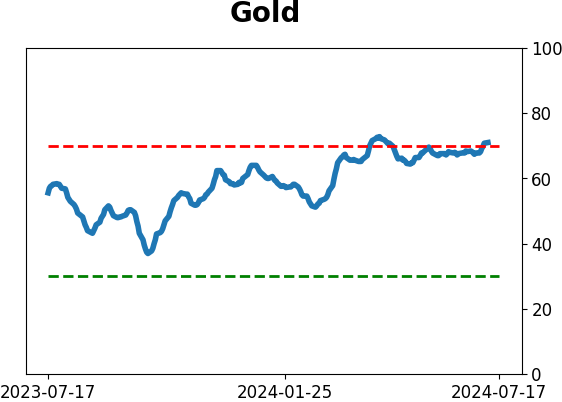
Gold
|
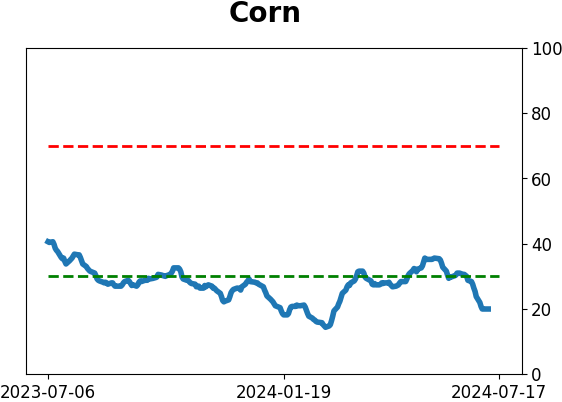
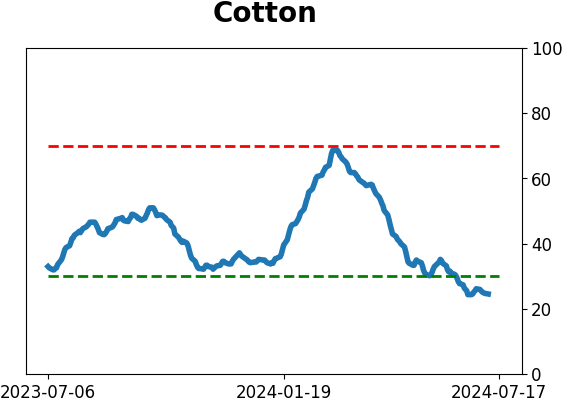
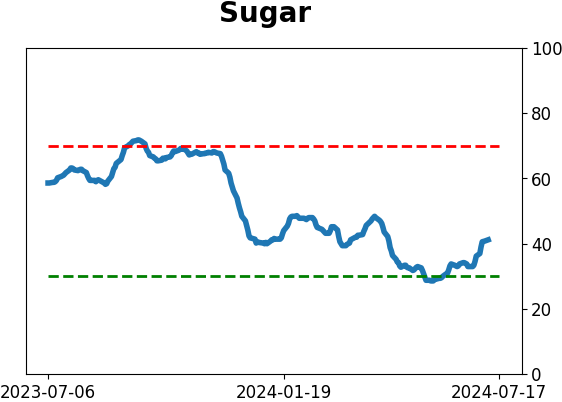
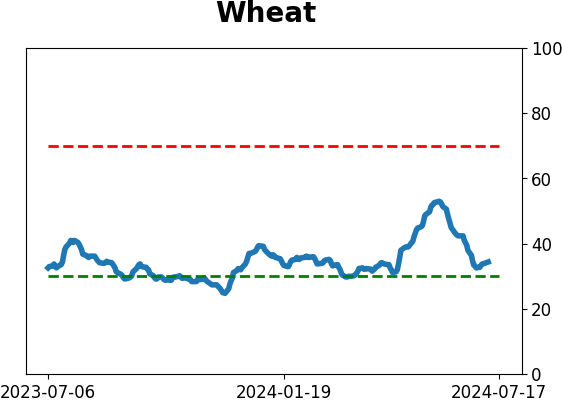
Agriculture

|
|
Research
By Jason Goepfert
BOTTOM LINE
Over the past 30 days, half of the sessions have seen the S&P 500 index move one way, and most of its stocks move in the exact opposite direction. This is like a child suffering from Oppositional Defiant Disorder, and it's maddening. Typically, stock returns suffer after behavior like this.
FORECAST / TIMEFRAME
None
|
Key points:
- More than at any time since 1928, the S&P 500 index is moving one way while its stocks do the opposite
- This is the largest cluster of "Oppositional Defiant Disorder" days since the 2000 market peak
- Returns have suffered after clusters of defiant sessions much more than after "good behavior" ones
A market suffering from Oppositional Defiant Disorder
We're in a bizarro world. Look one way, and investments are doing one thing. Look another way, and they're doing the exact opposite.
Most investors watch the major indexes, especially the S&P 500. It's the most benchmarked index in the world for good reason, and yet it increasingly has nothing to do with what's going on under the surface.
Look, you're probably tired of hearing or reading about breadth. I'm tired of writing about it because it hasn't mattered. What usually happens isn't happening, and that's frustrating and unprofitable. So, if I can help myself, this will probably be one of the last times I write about this for a while.
The folks at Bespoke noted a wrinkle about the bad breadth we've seen on many days, which we've highlighted for over a month. Fewer stocks have been rising along with the index, and when the index declines, we often see more stocks advancing than usual. The index does one thing; the underlying stocks do another.
Anyone with a family member with Oppositional Defiant Disorder (ODD) can relate. It's maddening behavior, and we've never seen it like this. To the greatest degree in history (by far), stocks within the S&P 500 are defiant against whatever the index is doing.
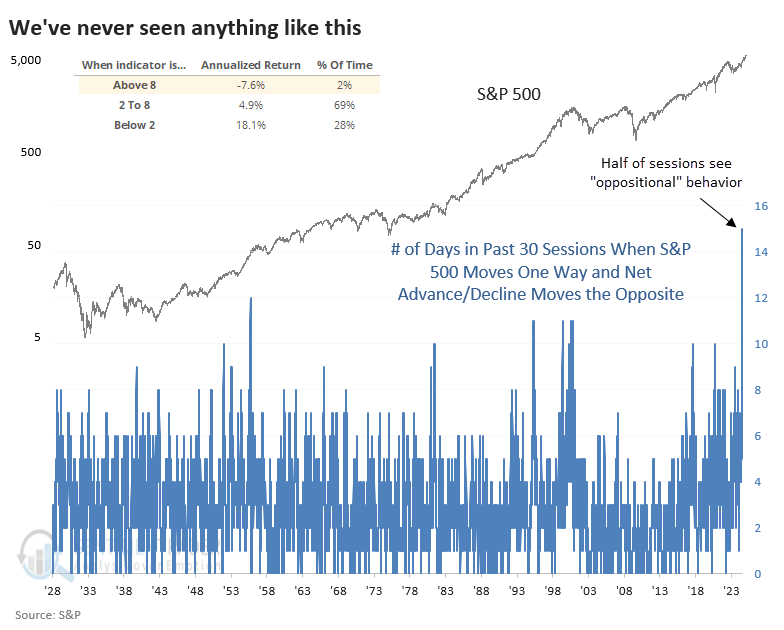
The inset table on the chart shows that when the market suffered ODD, the S&P's annualized return was a woeful -7.6%. When breadth was in agreement with the index (regardless of whether it went up or down), the annualized return was a wonderful +18.1%.
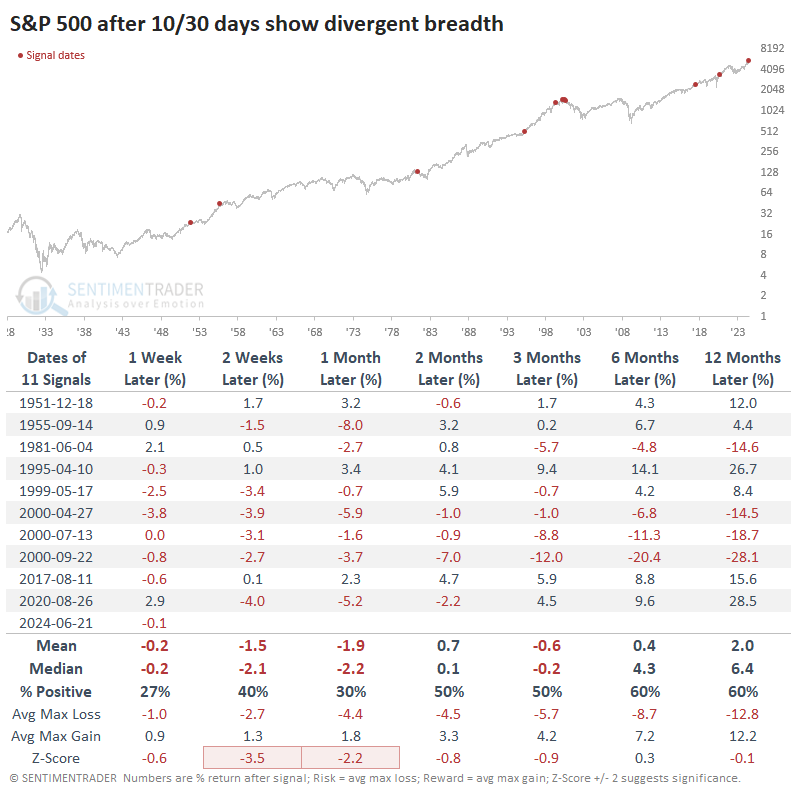
Stocks tend to slide after ODD, especially the index
This was not a good sign for the index most of the time. Again, however, this started triggering a few weeks ago, and it's still triggering, and it's still not mattering.
In 2017, this didn't matter, either, and that lasted for a very long time...until it did, and all the gains were given back (though quickly regained again). In 1995, it simply didn't matter and never did until the blow-off four years later.
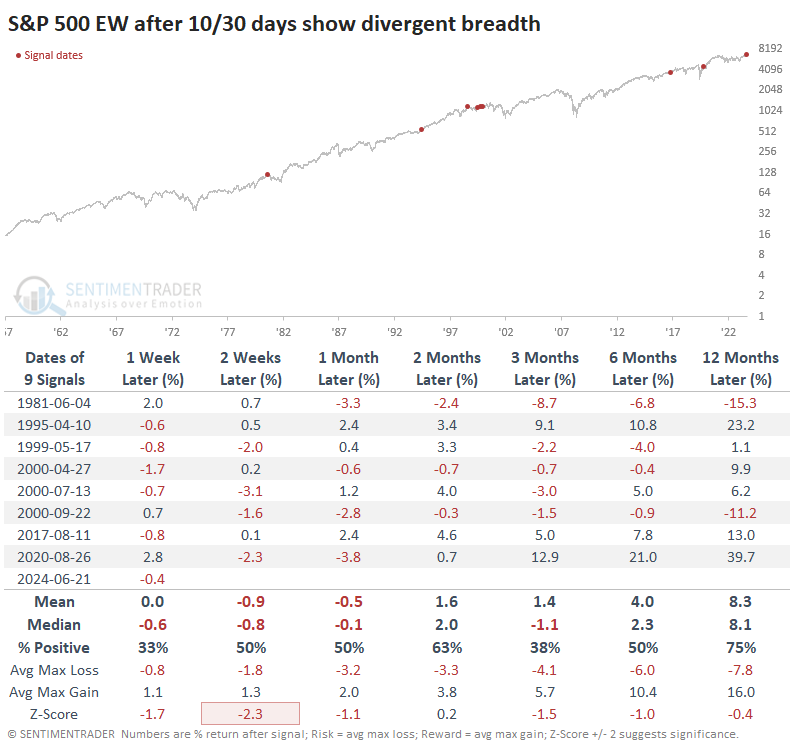
We have less history for an equal-weight version of the S&P 500, but what we do have tells us how the average stock in the index performed after the post-1957 signals in the table above. Returns weren't all that great, but at least they tended to be better.
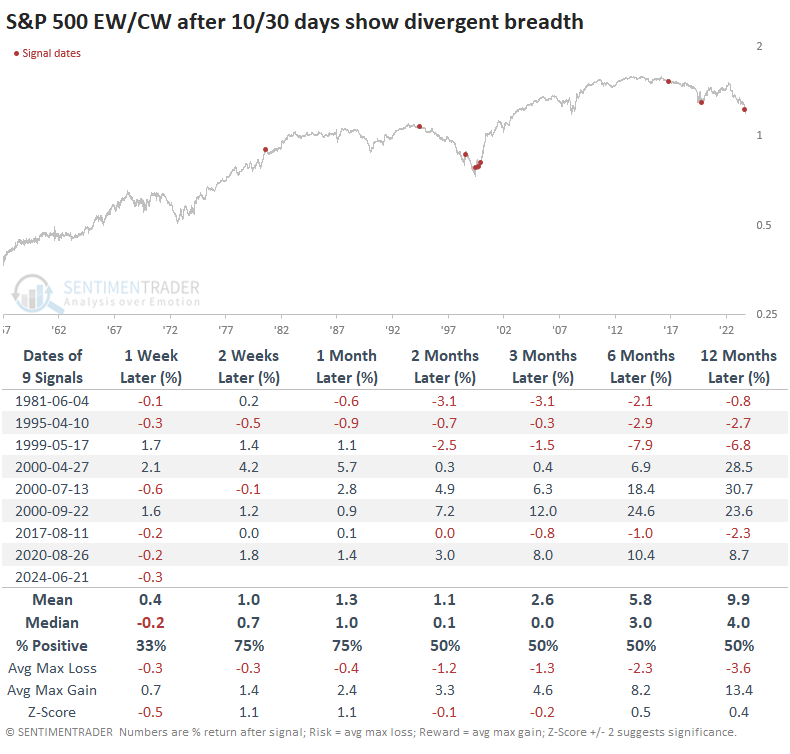
The table below makes that more apparent. It shows returns in the ratio of the S&P equal-weight to the capitalization-weight index after it suffered ODD. It seems notable that there were clusters of these signals around the low in the ratio in 2000 and 2020. The fact that we have a historic cluster of them now gives some weight to the index that the equal-weight version might start finally outperforming again.
What the research tells us...
The drumbeat of "bad breadth" calls and divergence outliers has become deafening. Even casual market observers are becoming aware of the phenomenon, and it hasn't made one bit of difference as the indexes continue to chug along. We've gone through this many times, always with the same catcalls about "just follow the charts" and all the rest. People never change.
Divergences can last for a long time, but it's extremely rare for them not to have an effect at some point. The "at some point" is the problem because it can matter tomorrow or a year from now. But there has really only been one time in 90+ years when it just never mattered, which is 1995. Some economists are clinging to that as the most like our current environment with the high probability of a soft landing. Recent economic data throws a lot of doubt on that concept, but the market is playing out like they're right. From an internal participation point of view, if those economists are right and we skate along unharmed, they should get the rewards they deserve because it goes against almost all available history.
Indicators at Extremes
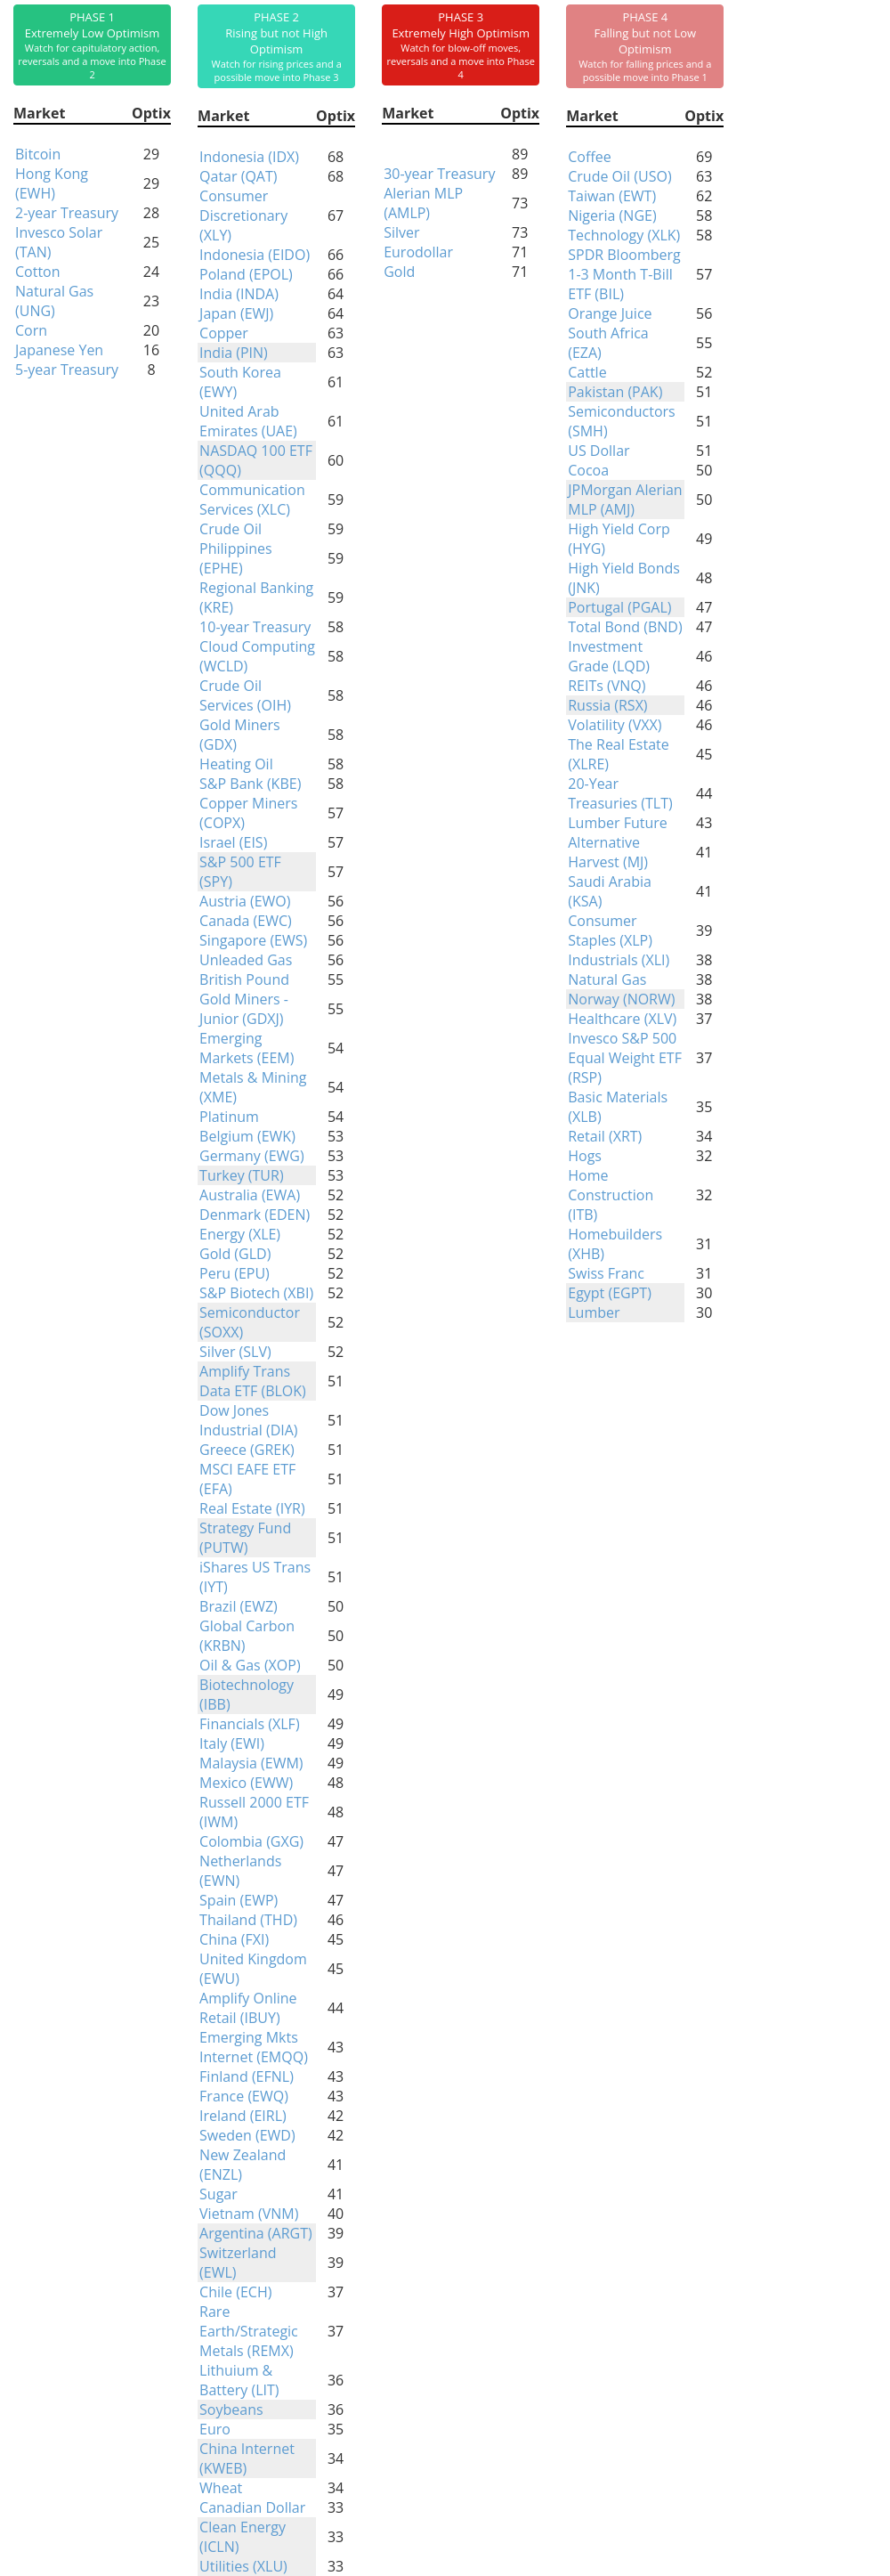
Phase Table
Ranks
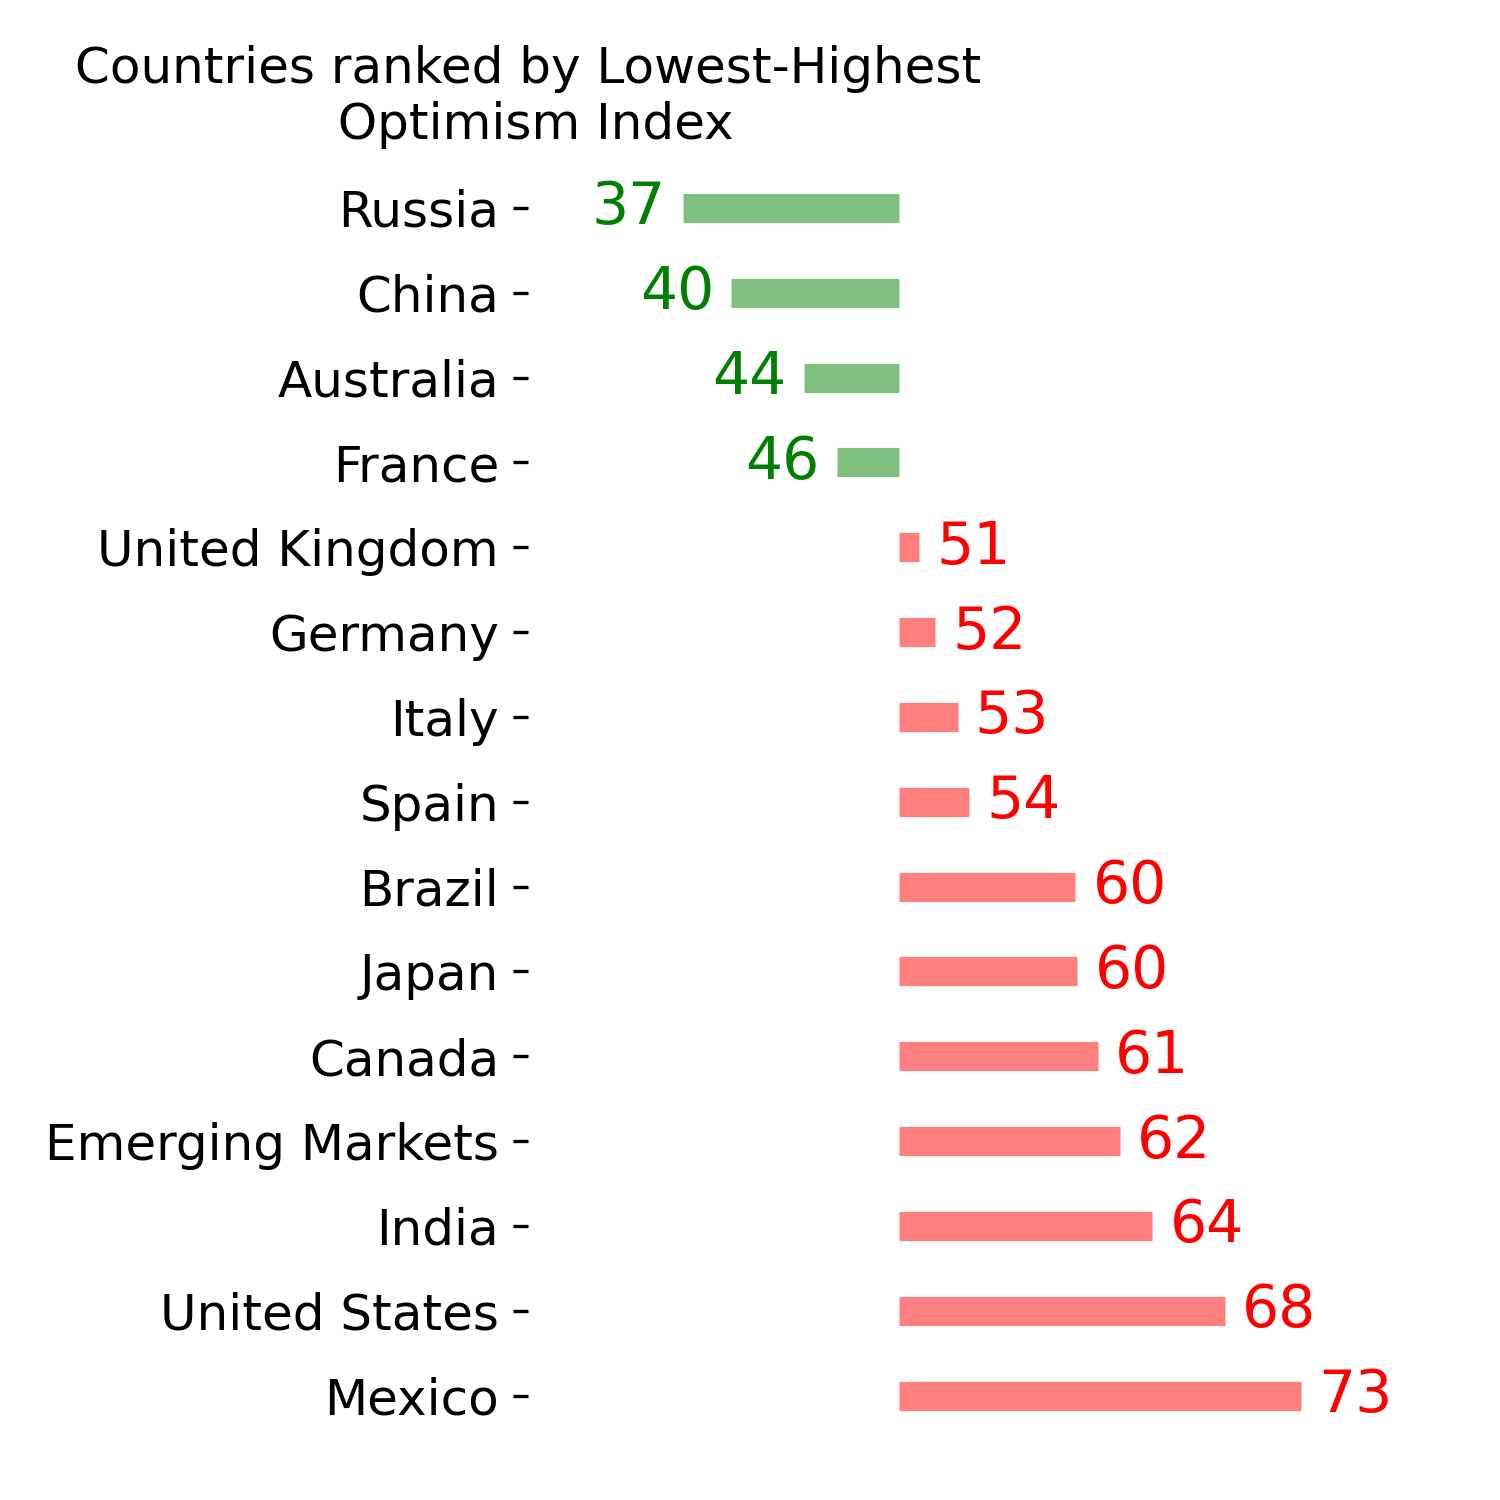
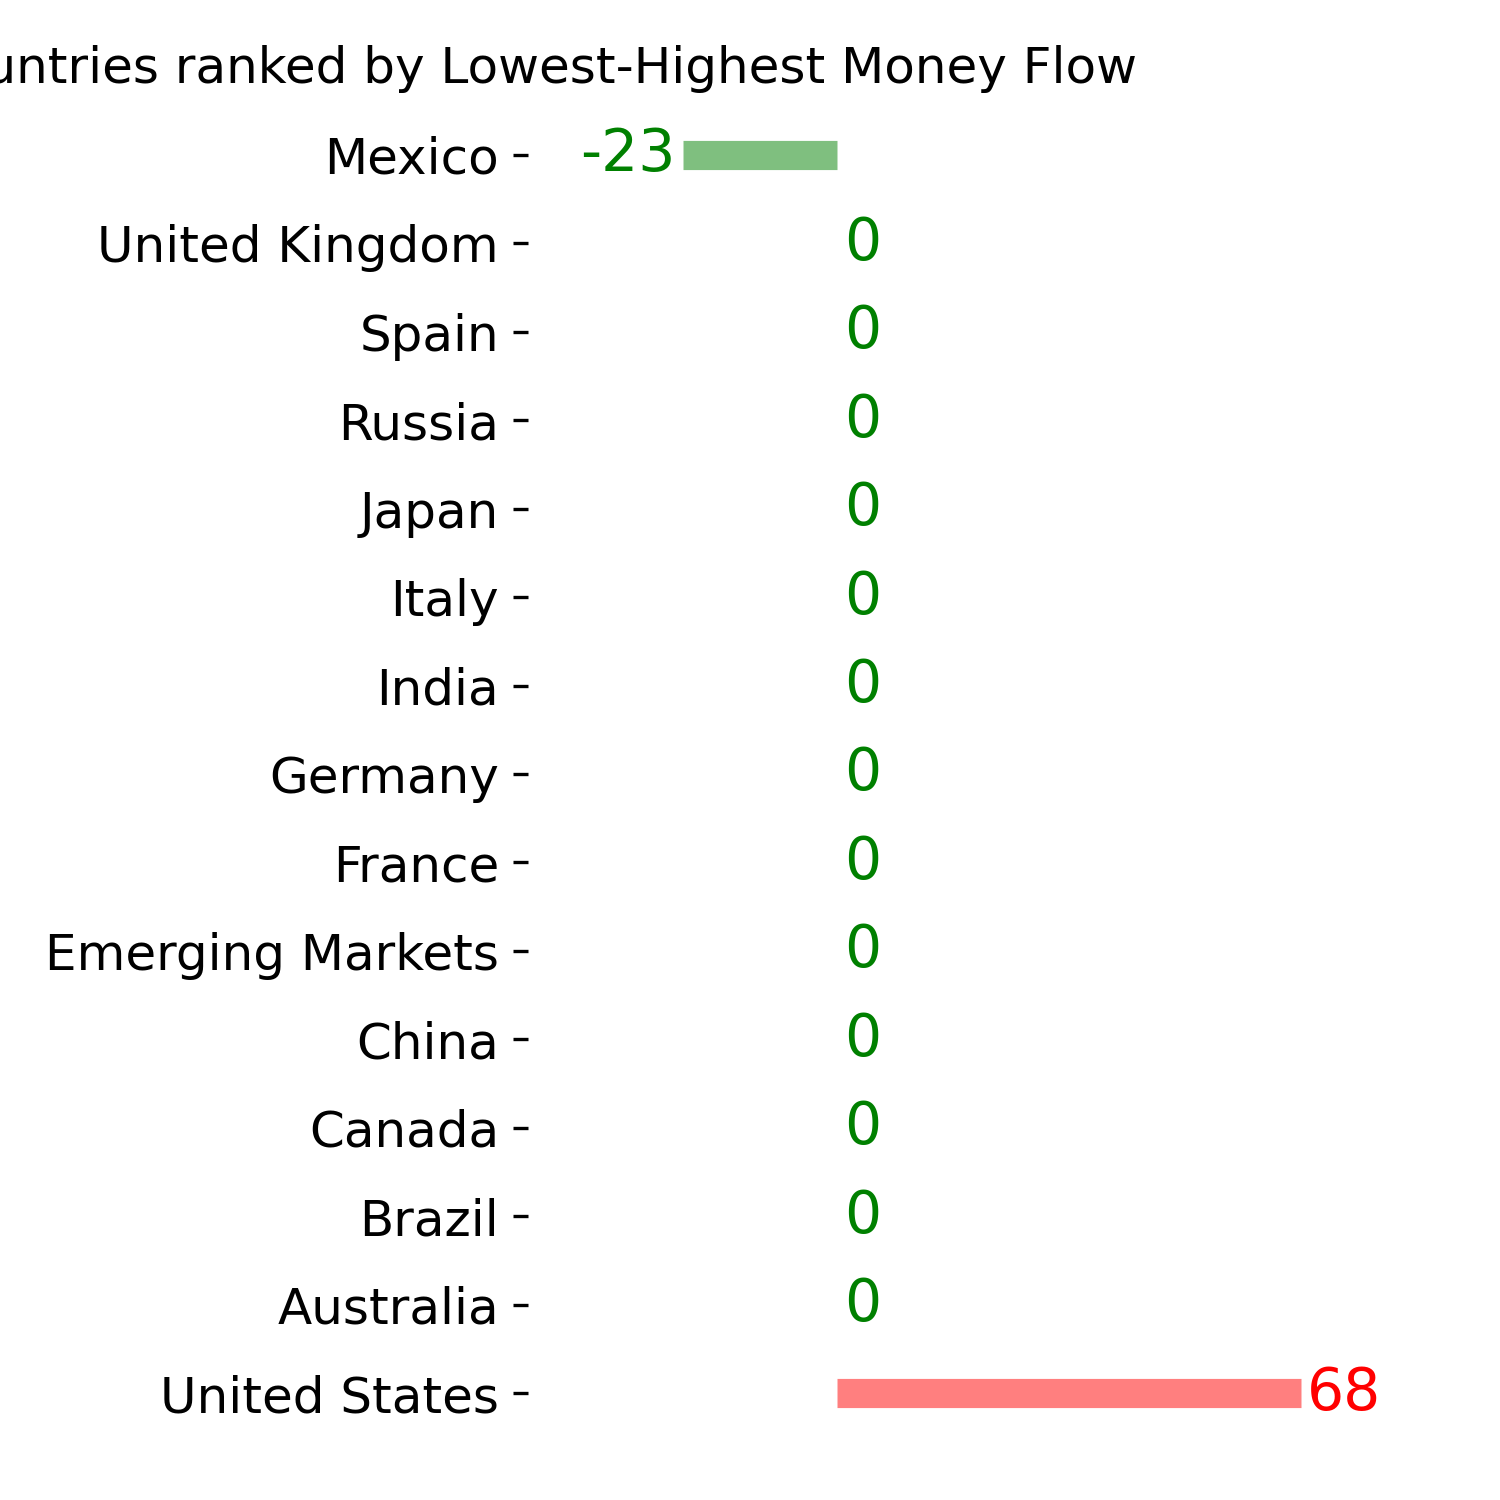
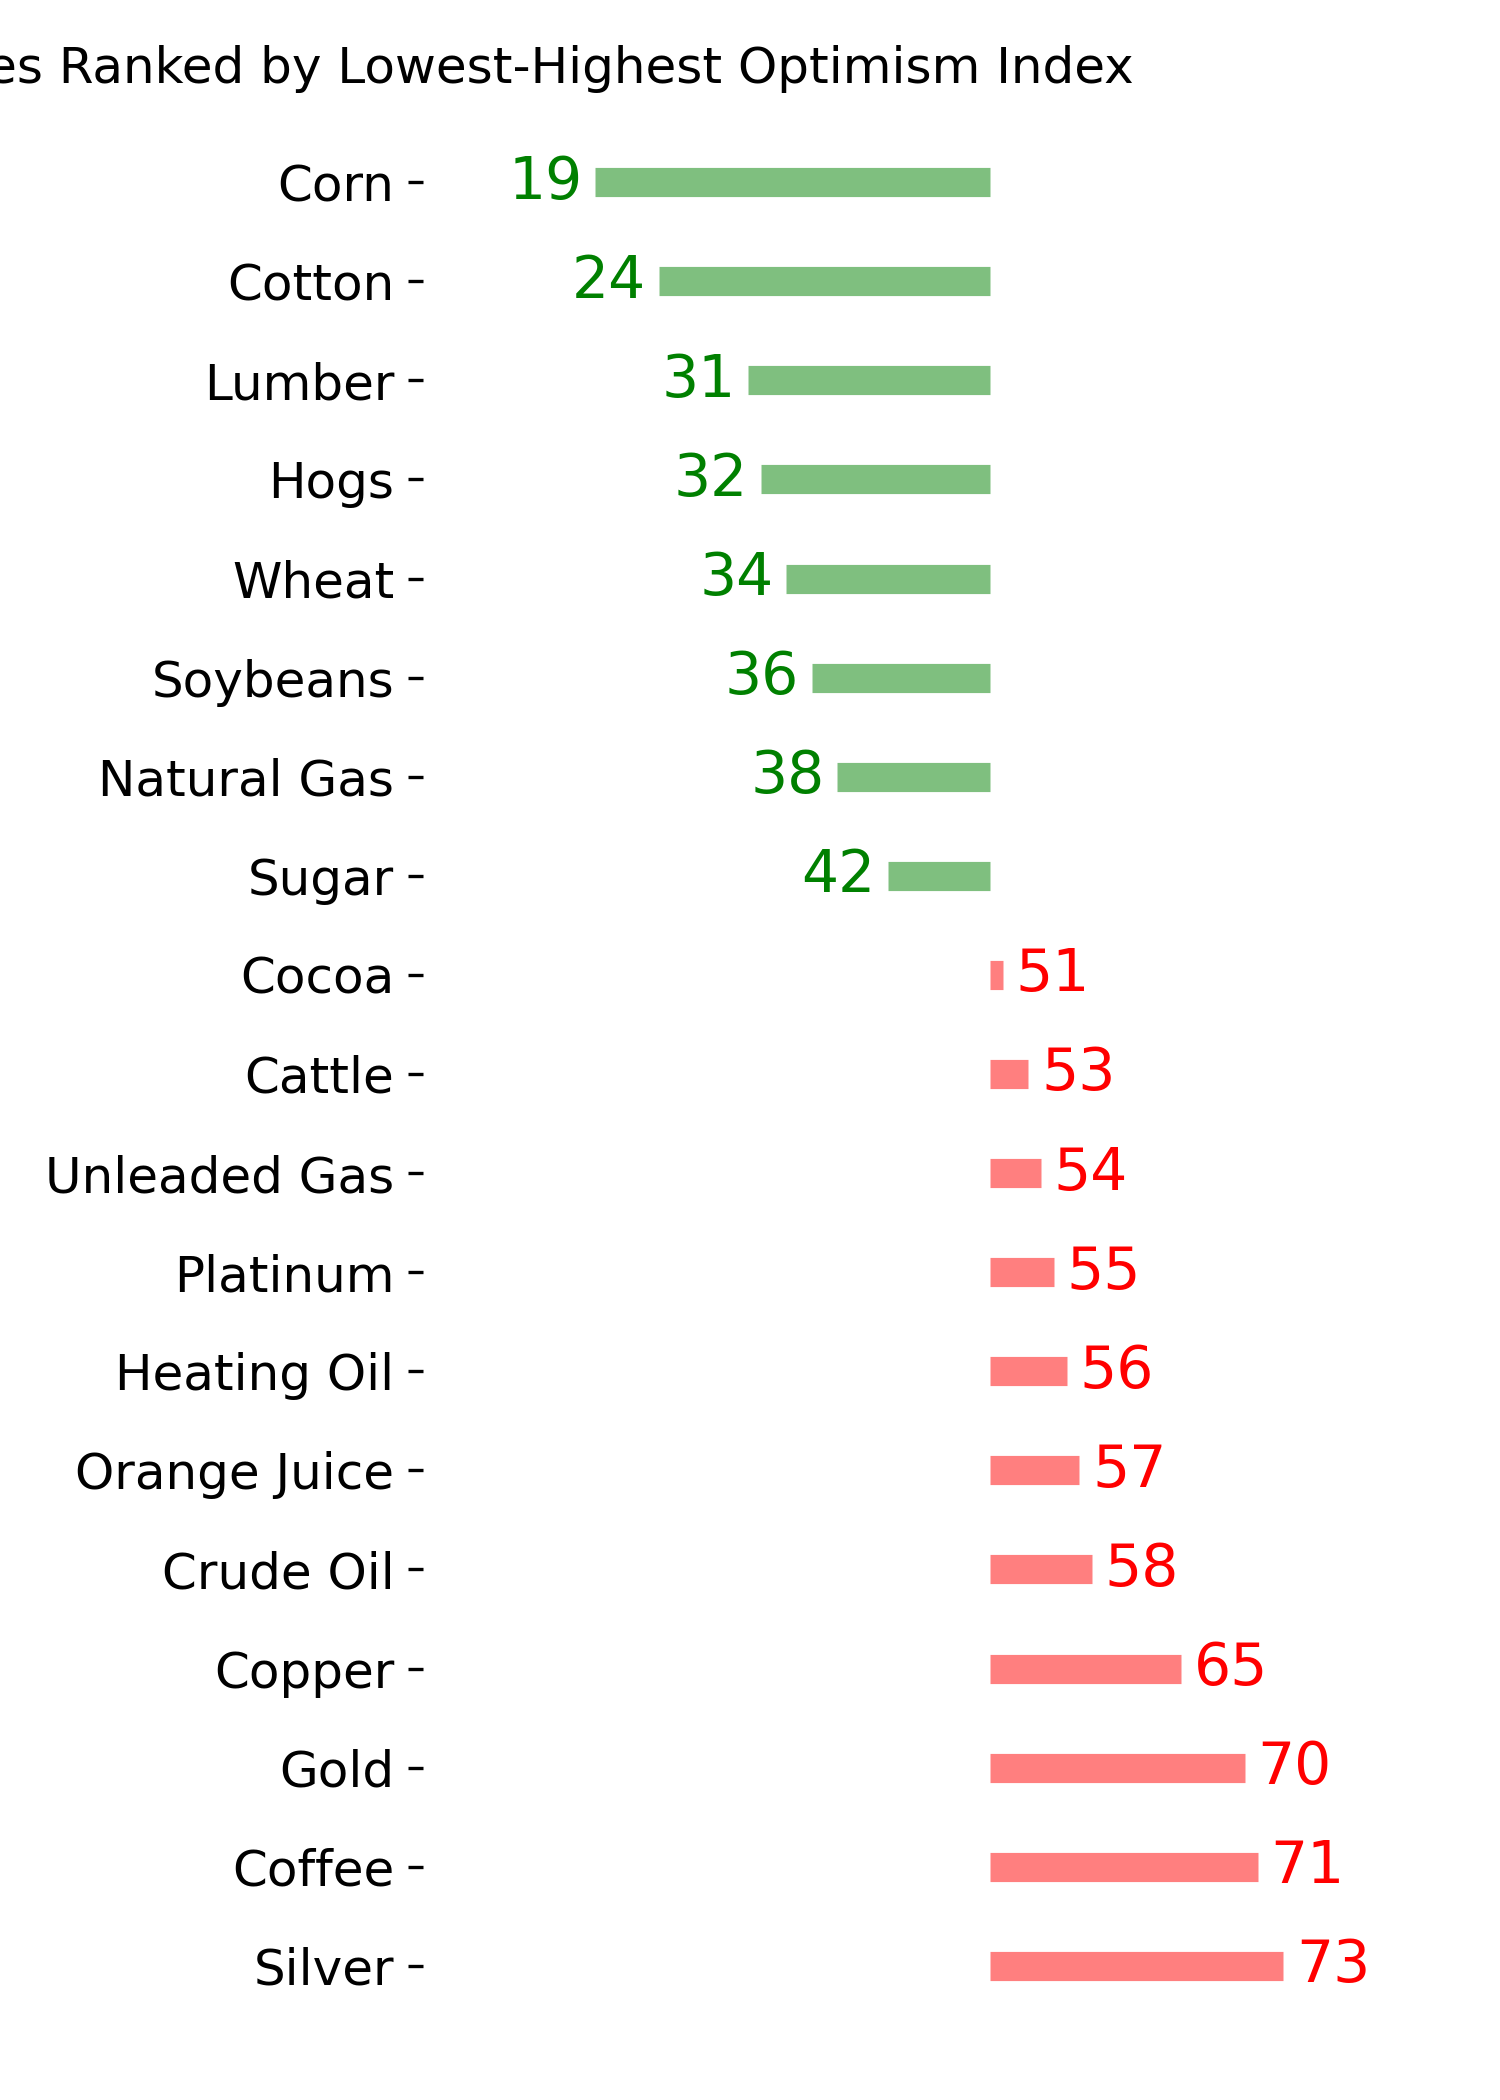
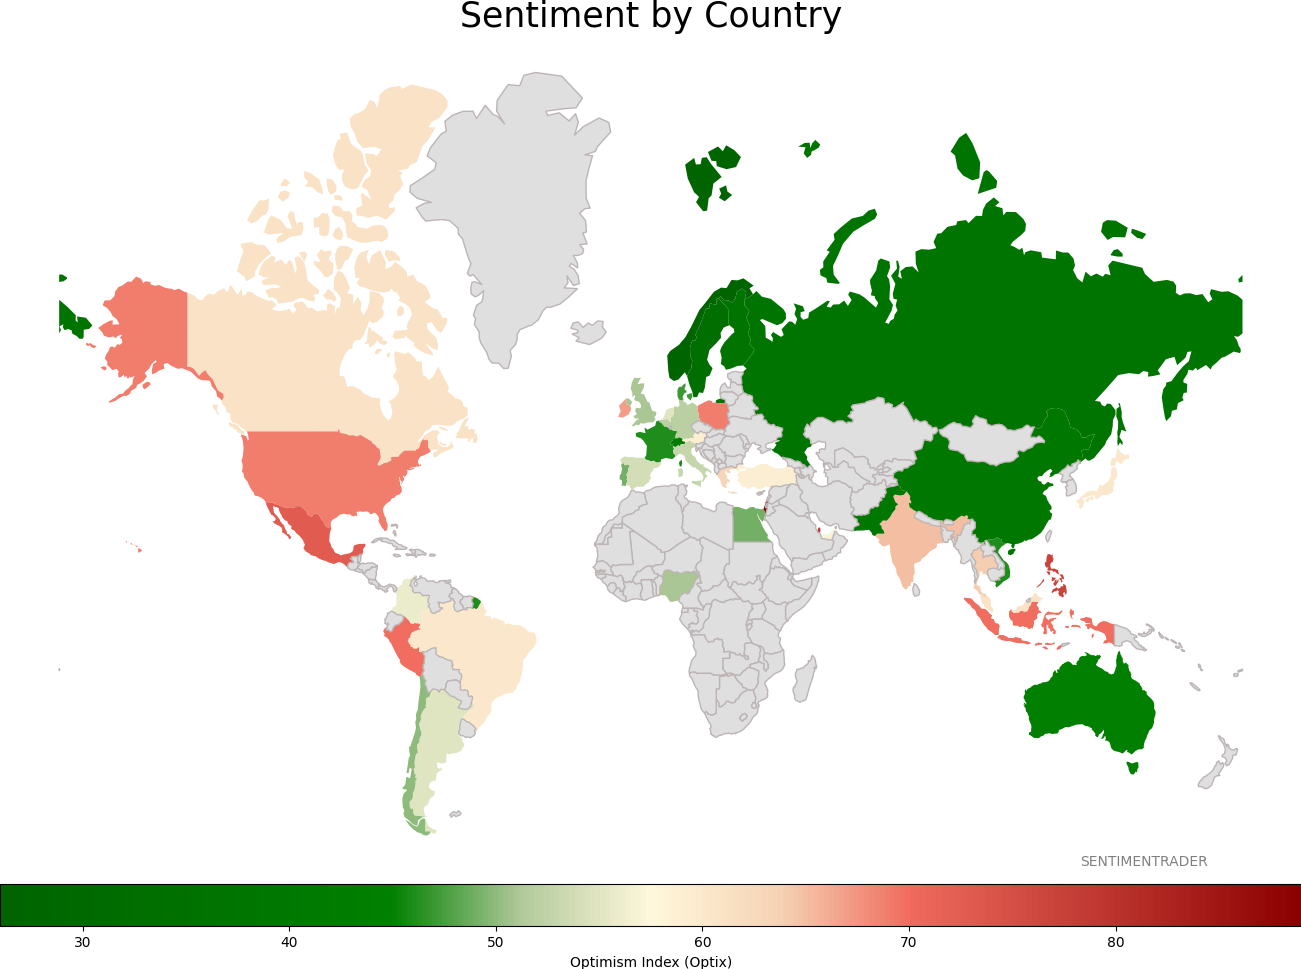
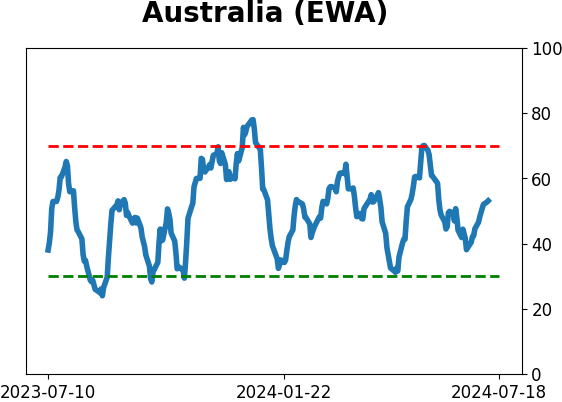
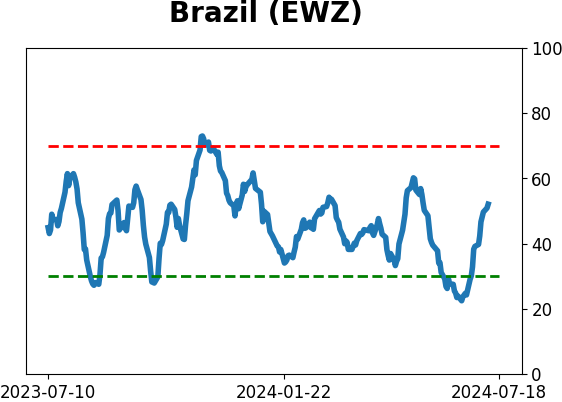
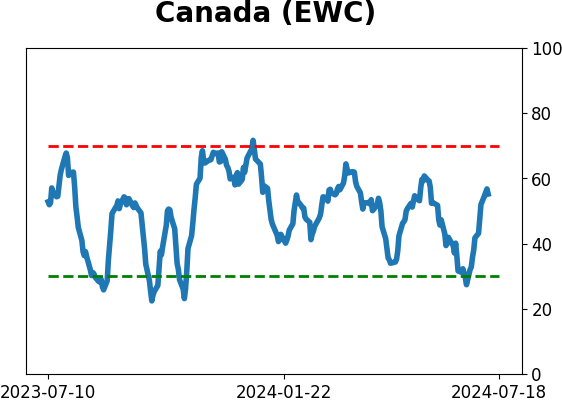
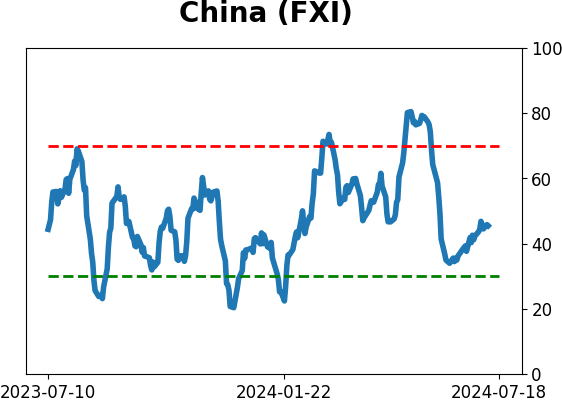
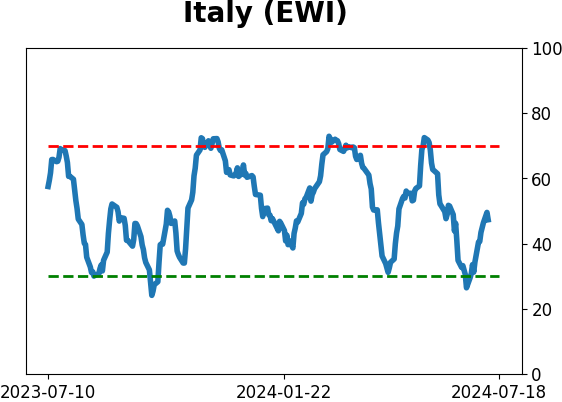
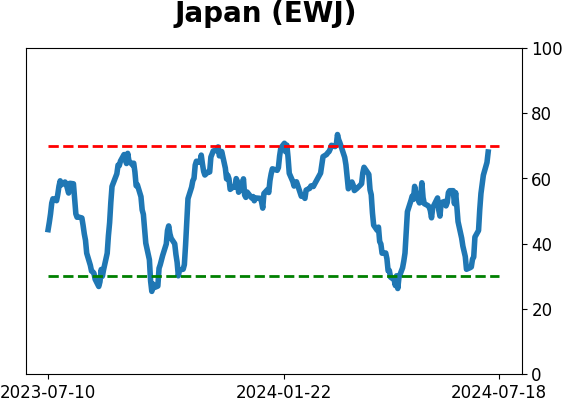
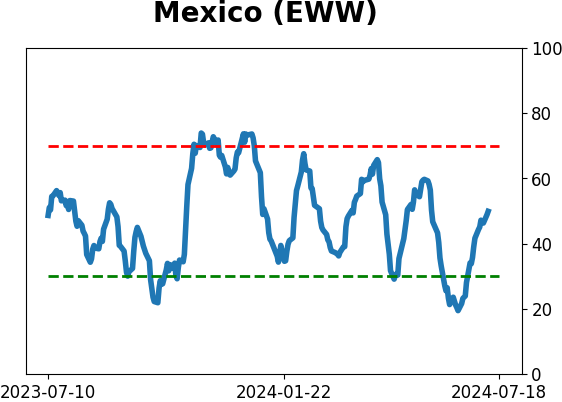
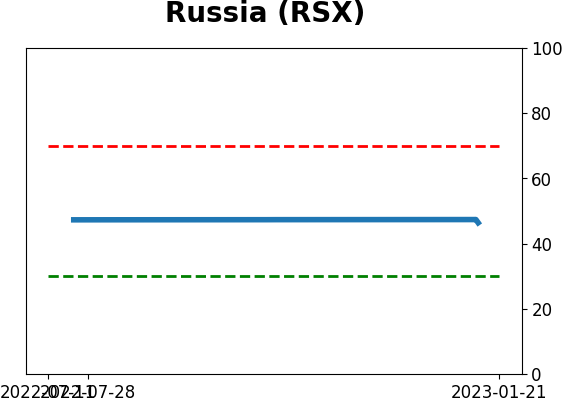
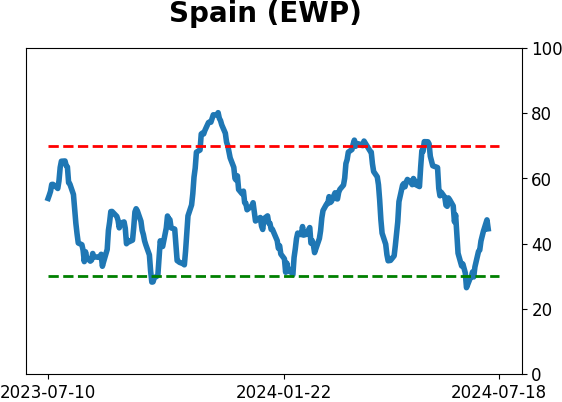
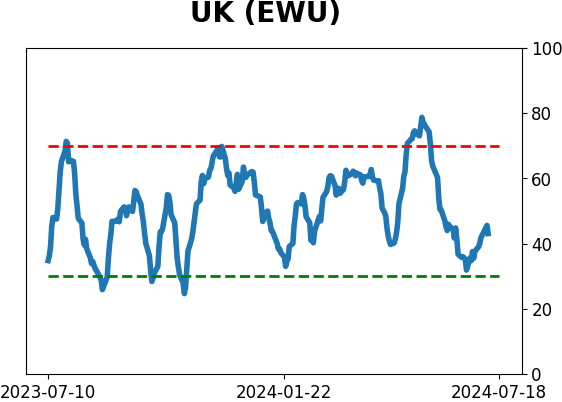
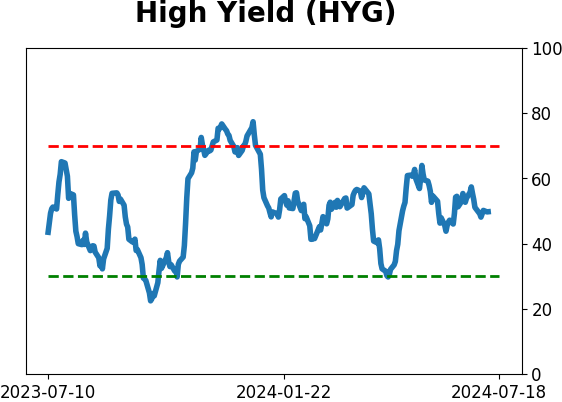
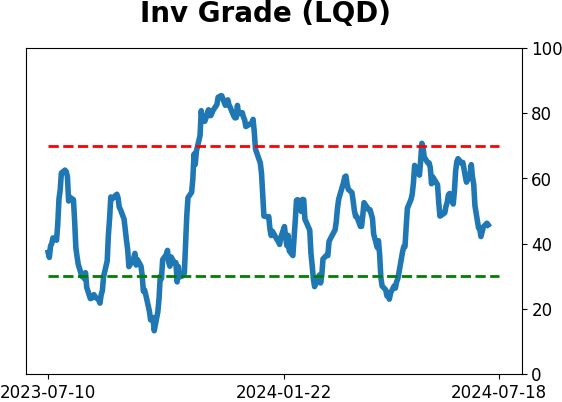
Sentiment Around The World
Optimism Index Thumbnails
|
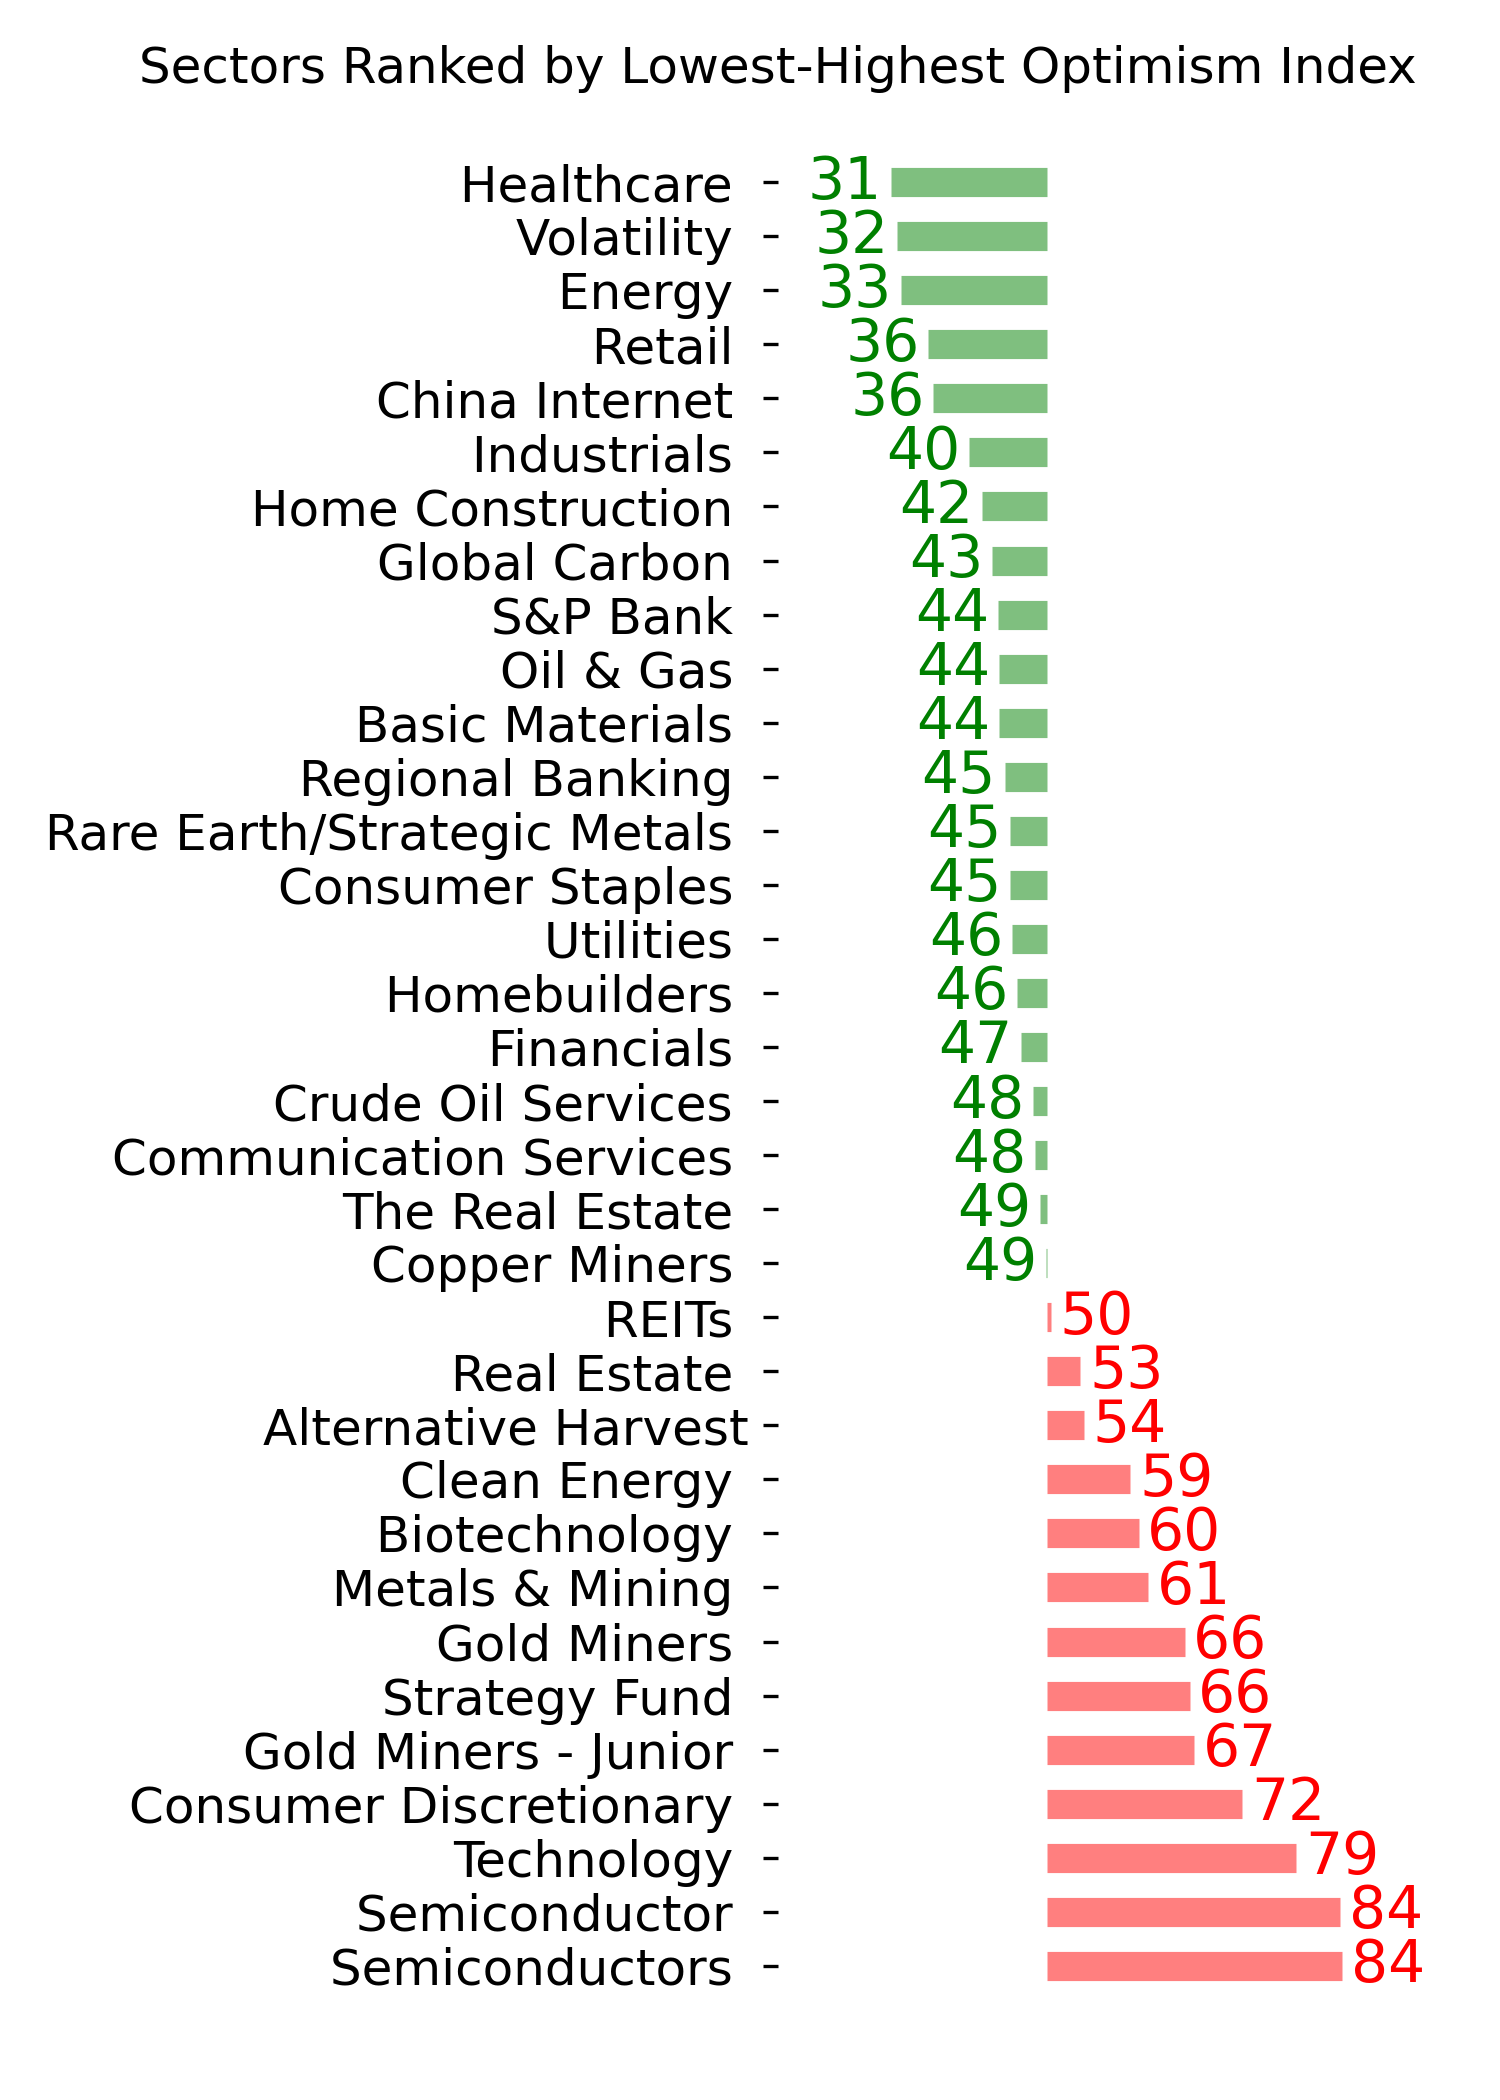
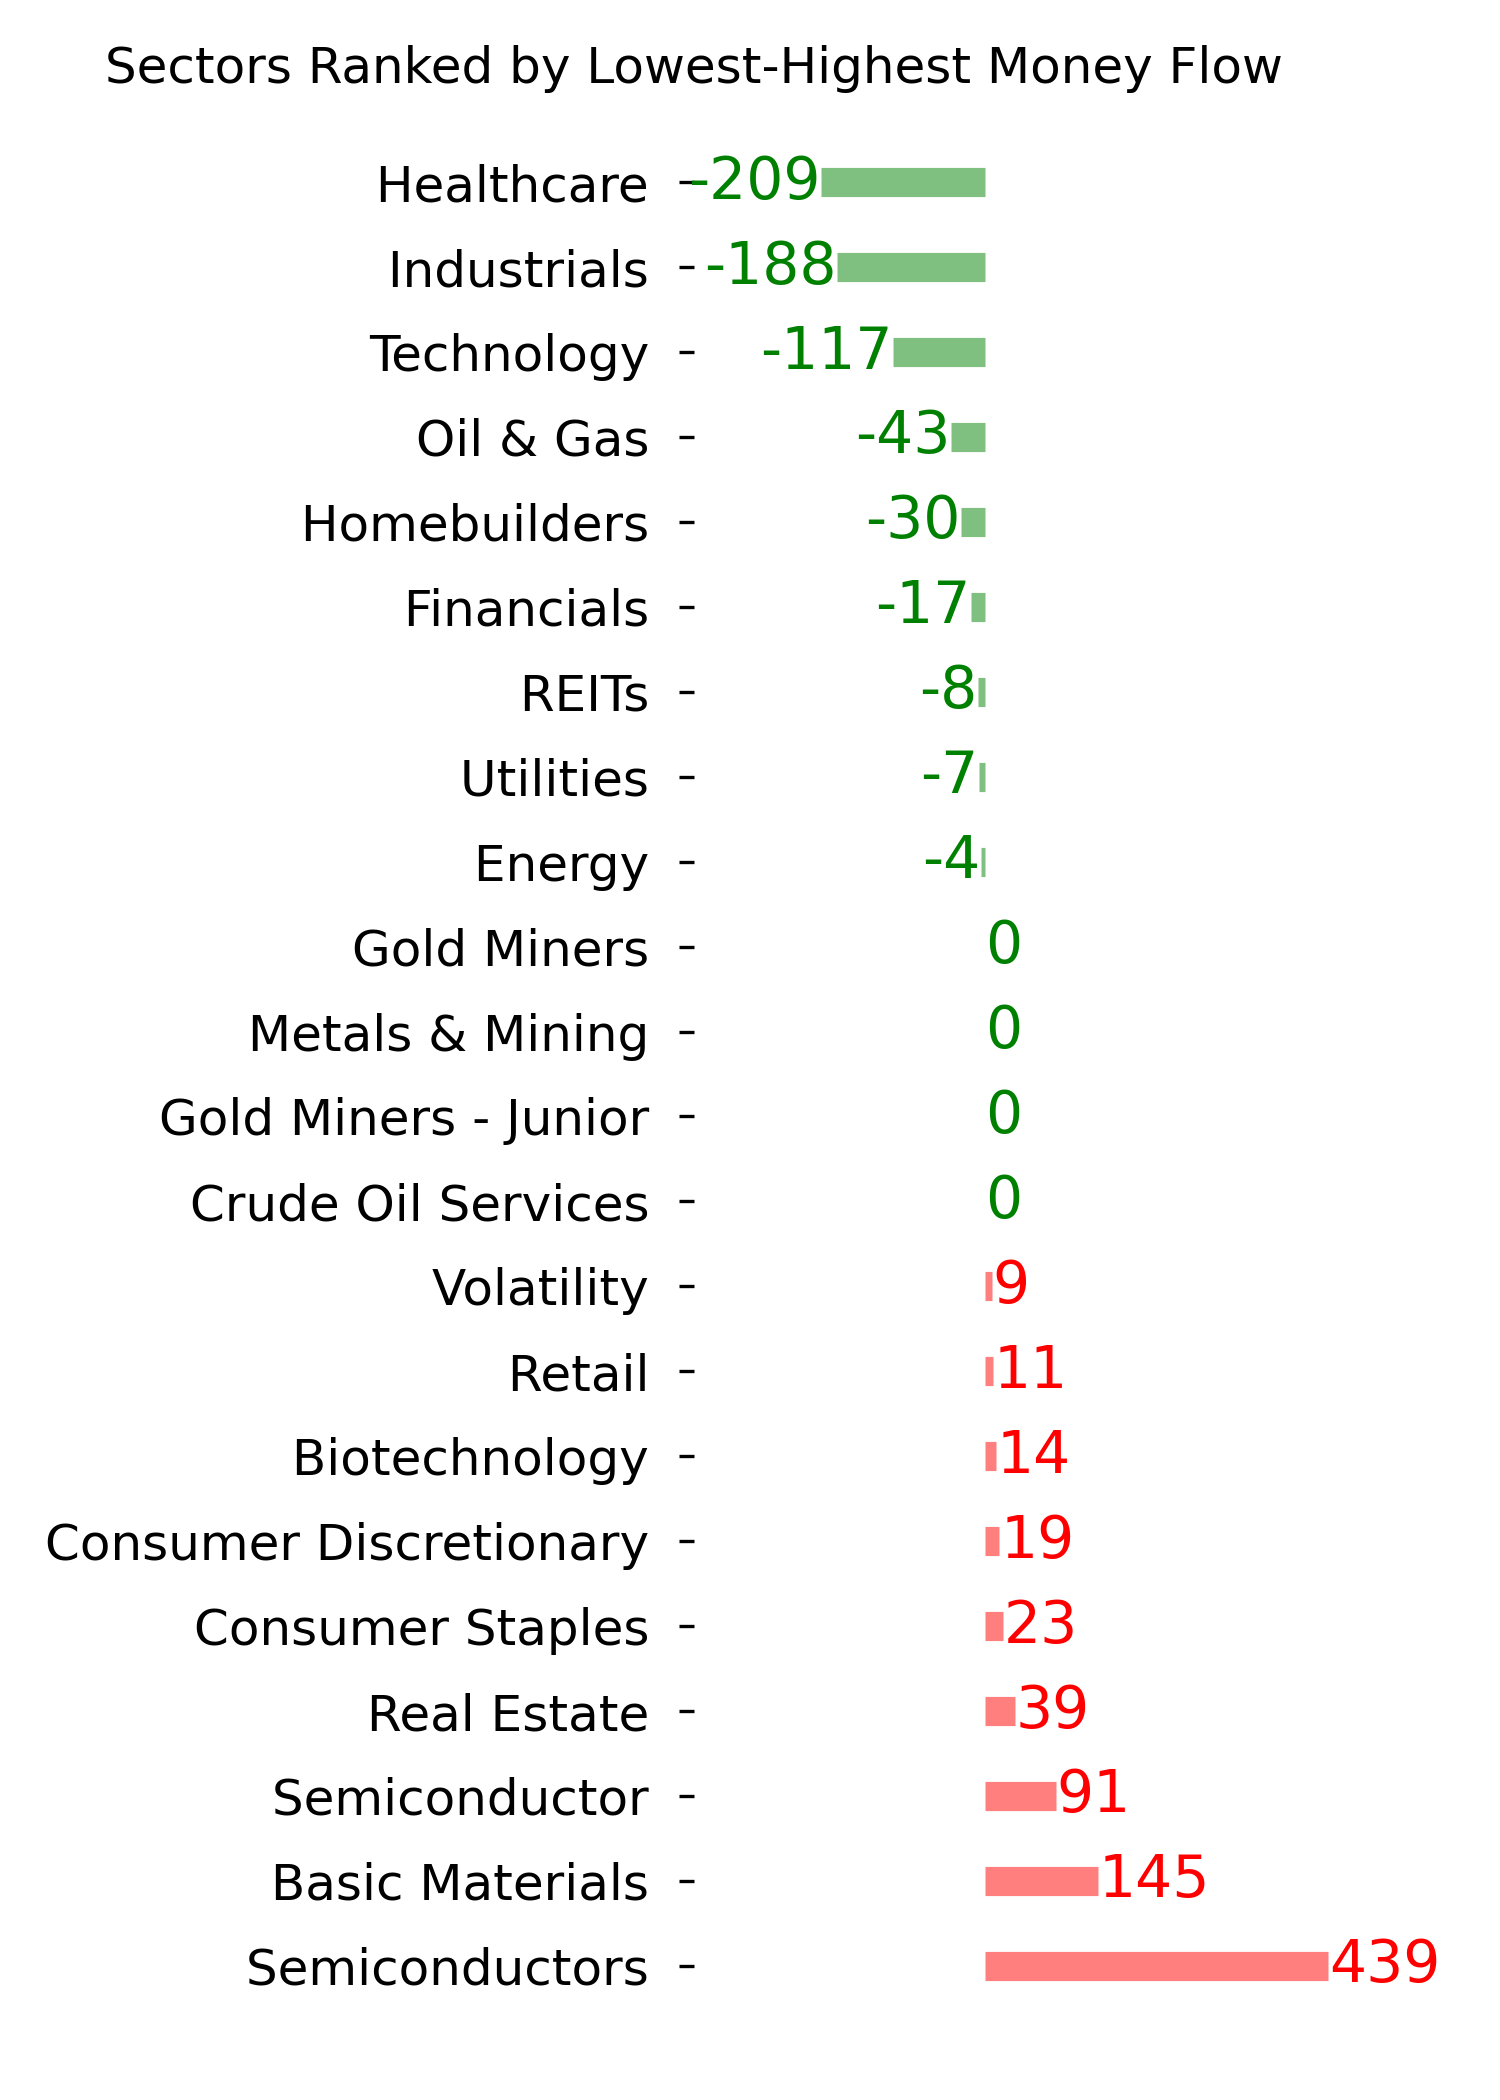
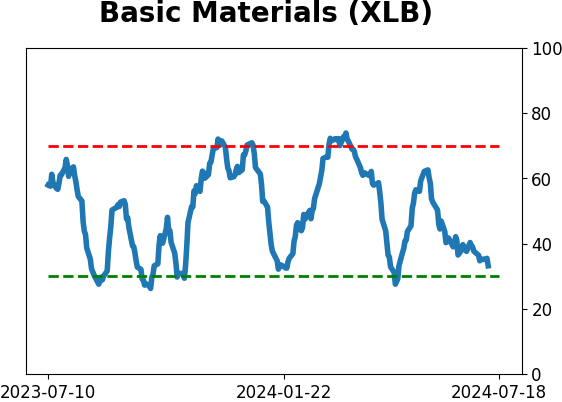
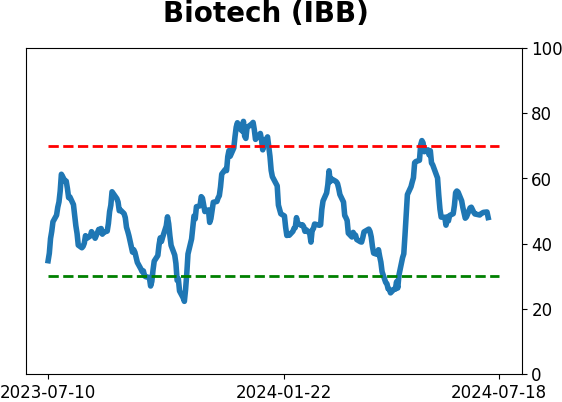
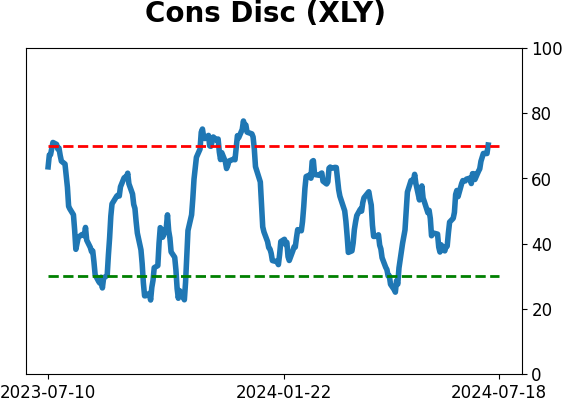
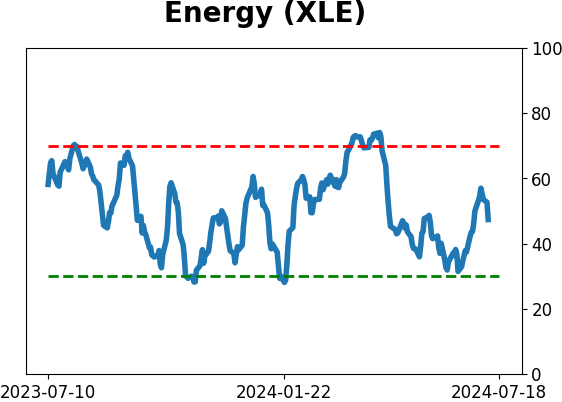
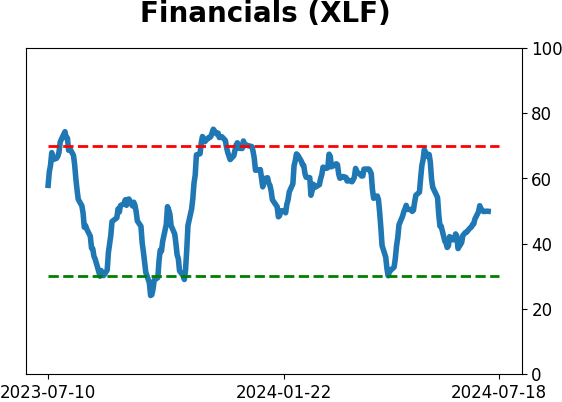
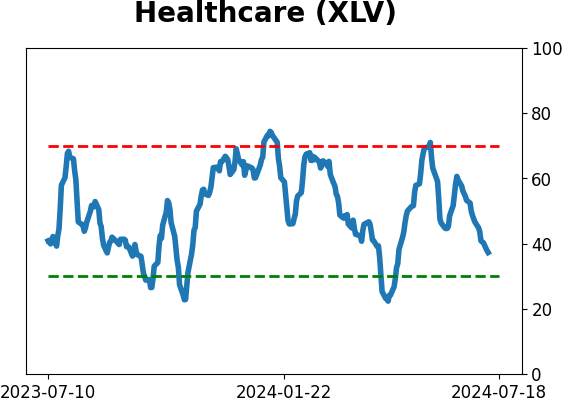
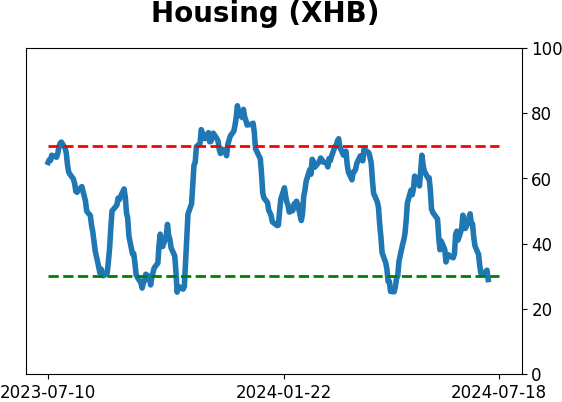
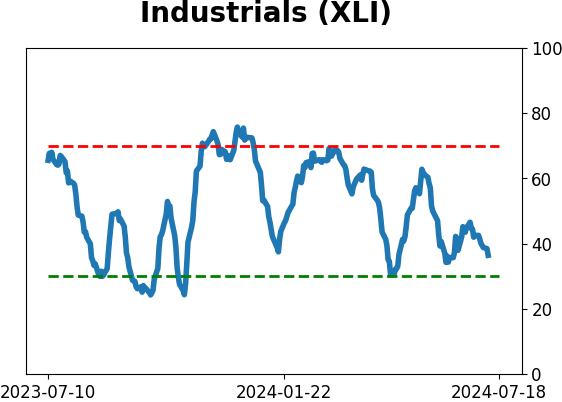
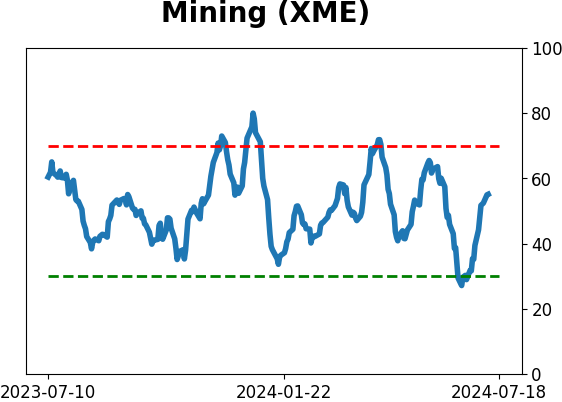
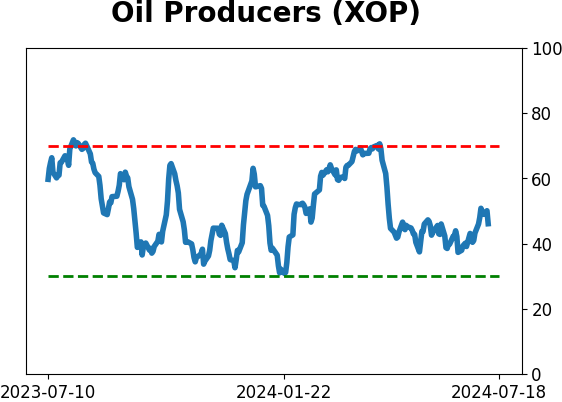
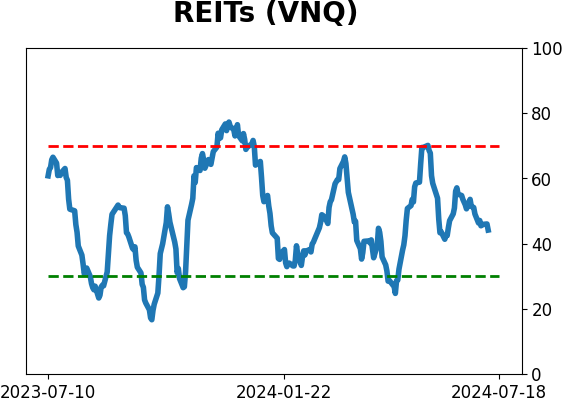
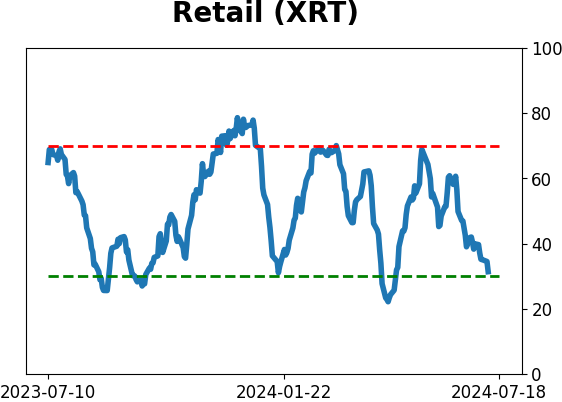
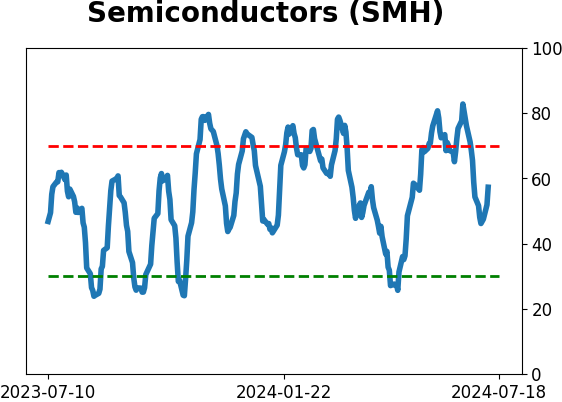
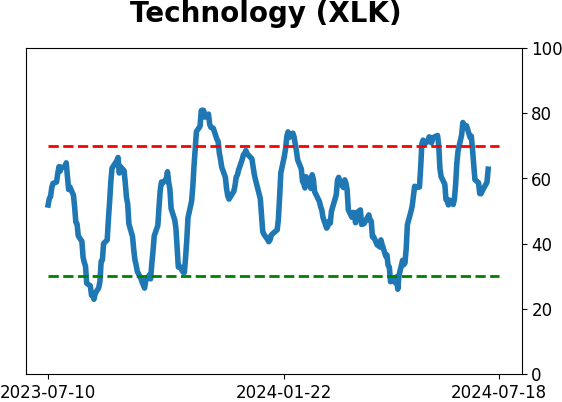
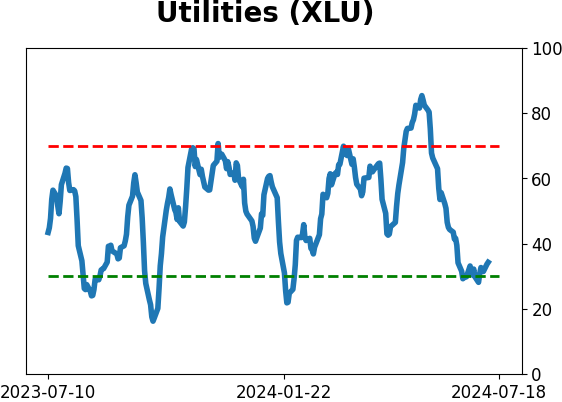
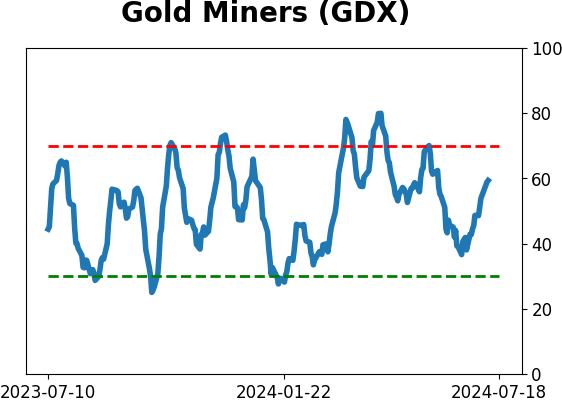
Sector ETF's - 10-Day Moving Average
|
|
|
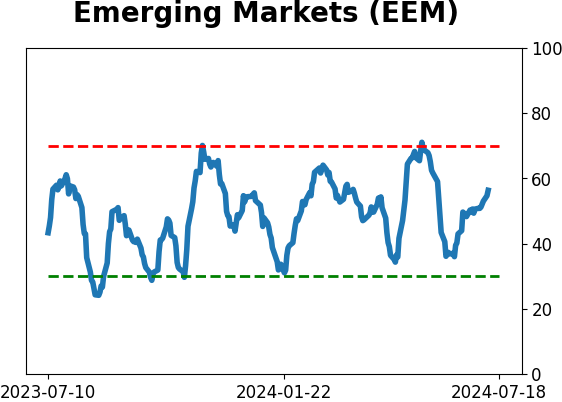
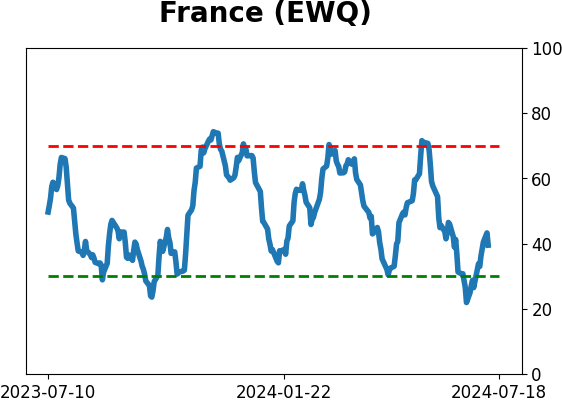
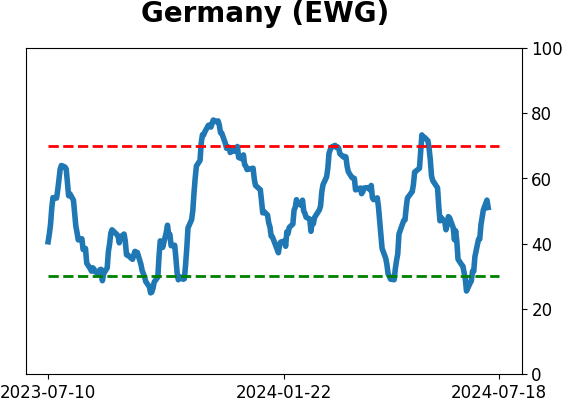
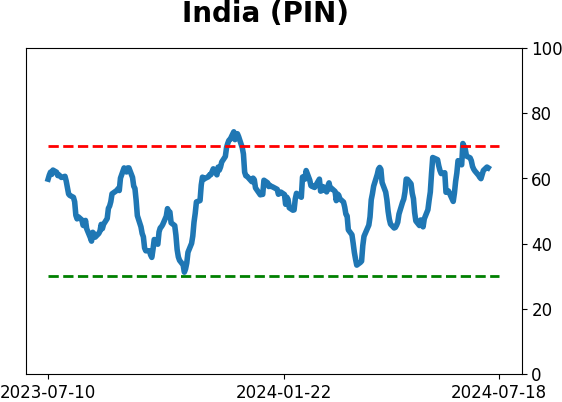
Country ETF's - 10-Day Moving Average
|
|
|
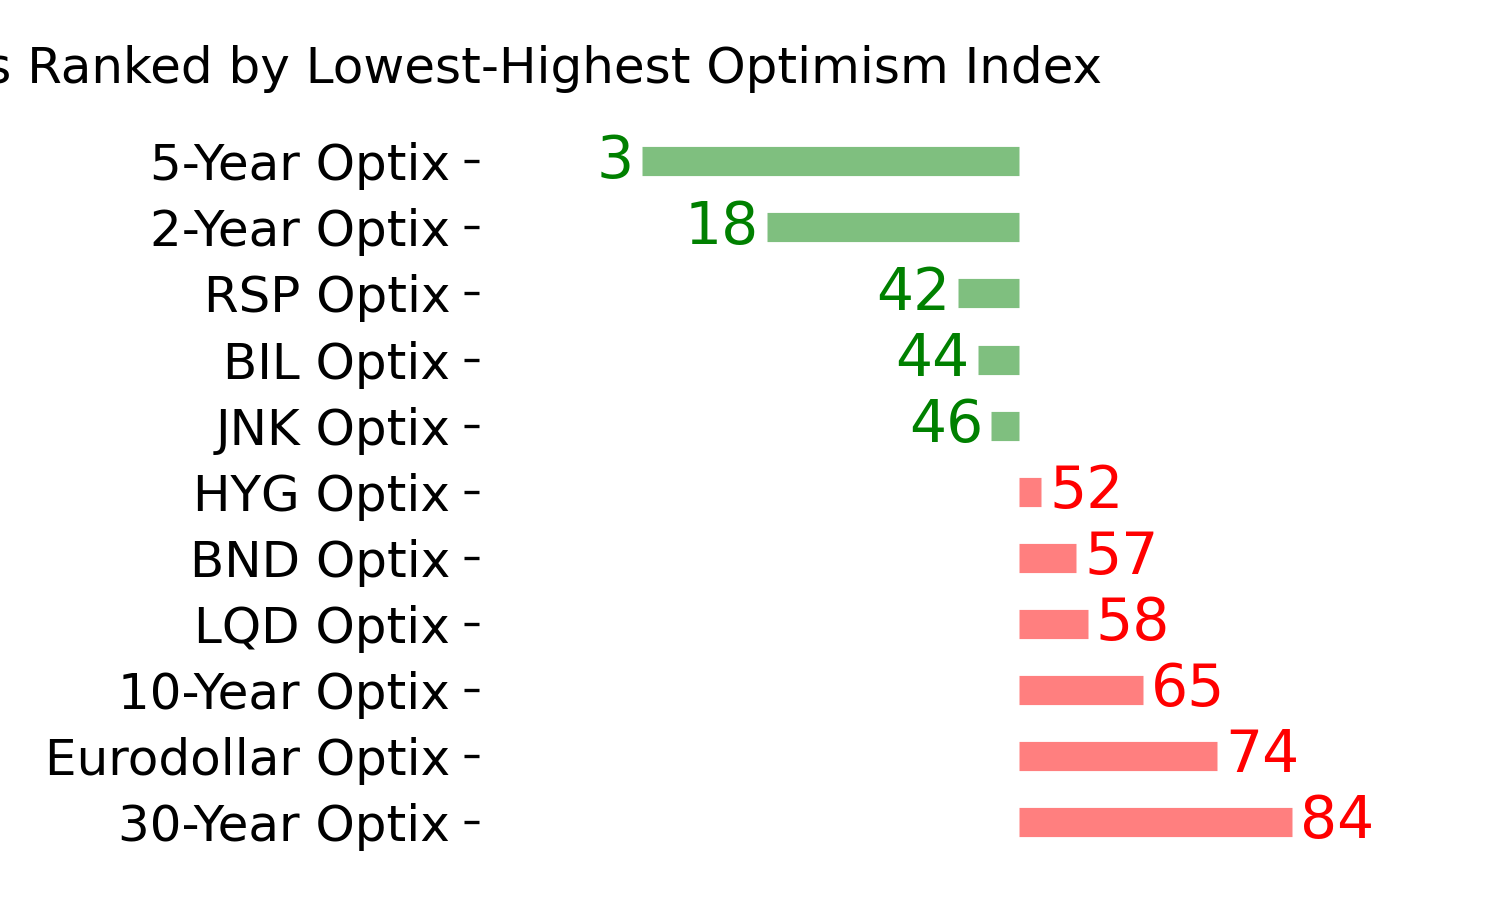
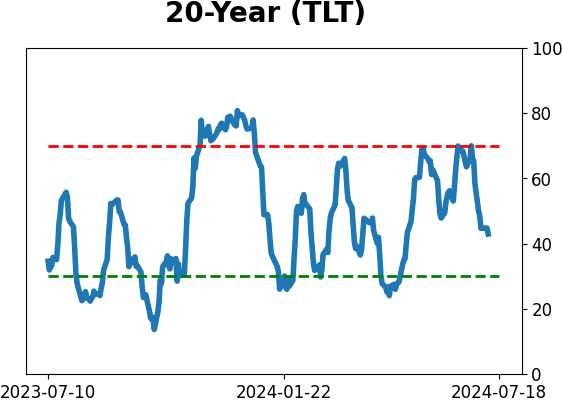
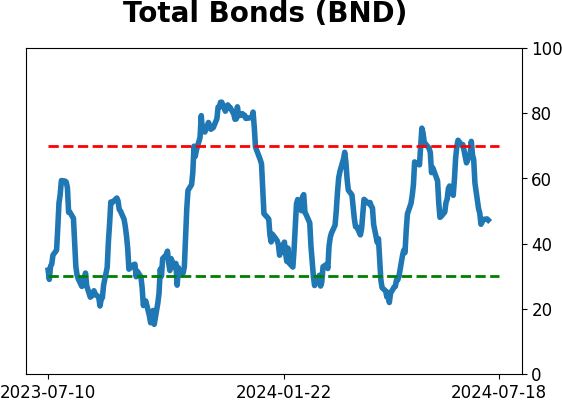
Bond ETF's - 10-Day Moving Average
|
|
|
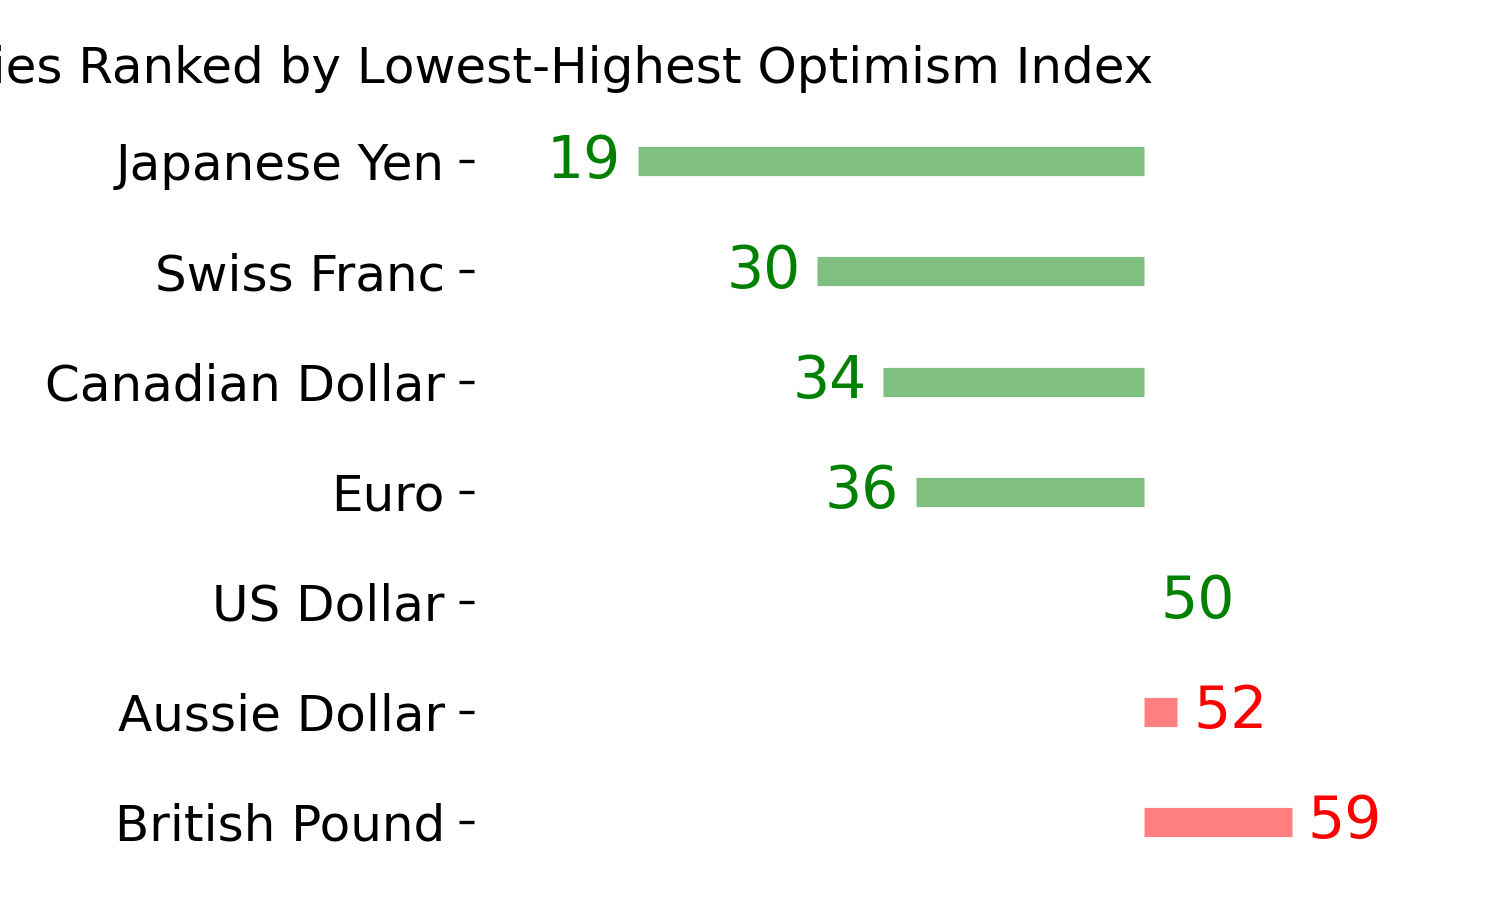
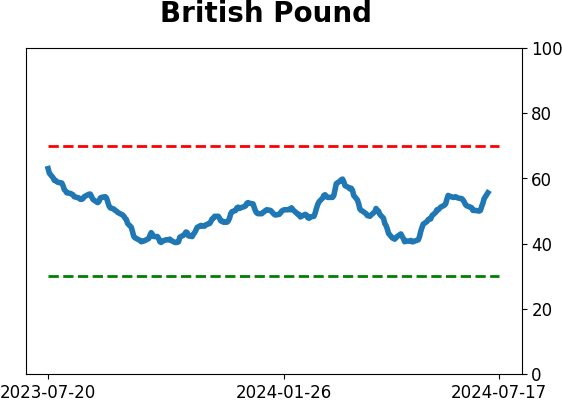
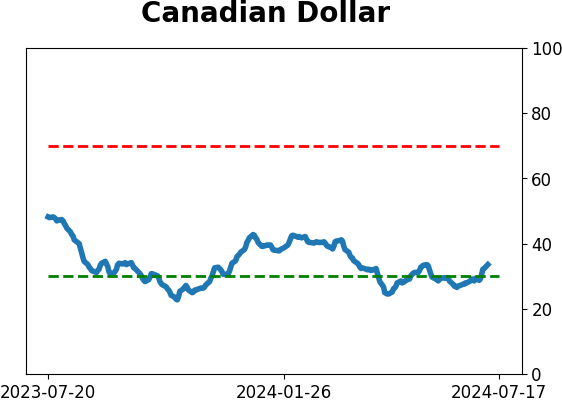
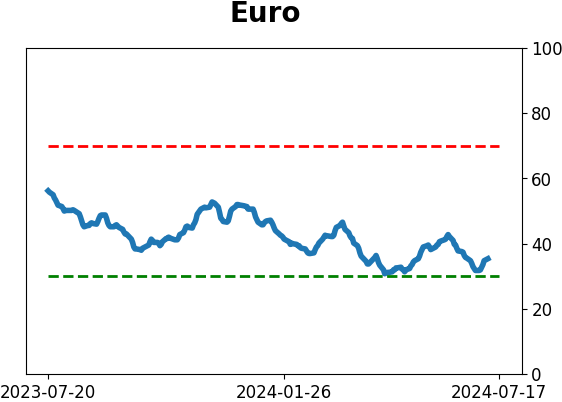
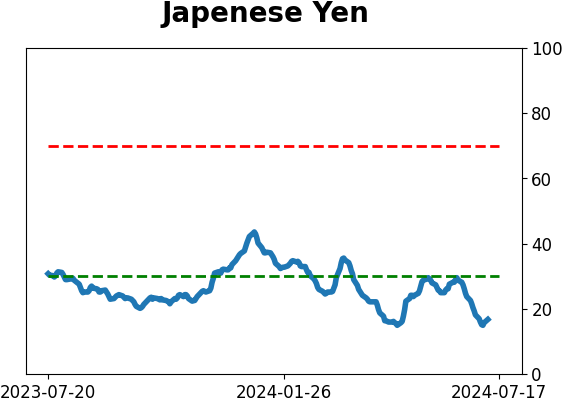
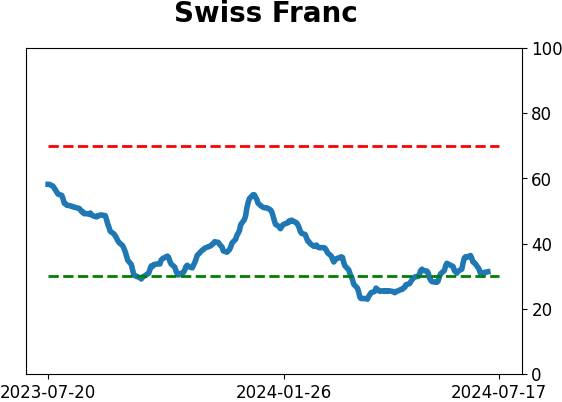
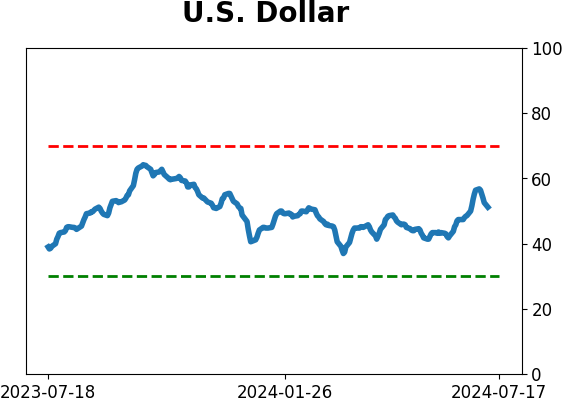
Currency ETF's - 5-Day Moving Average
|
|
|
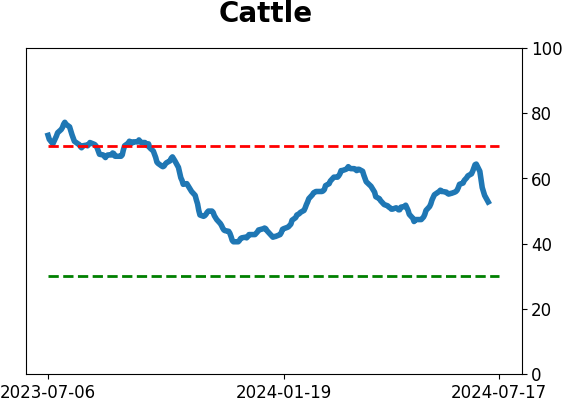
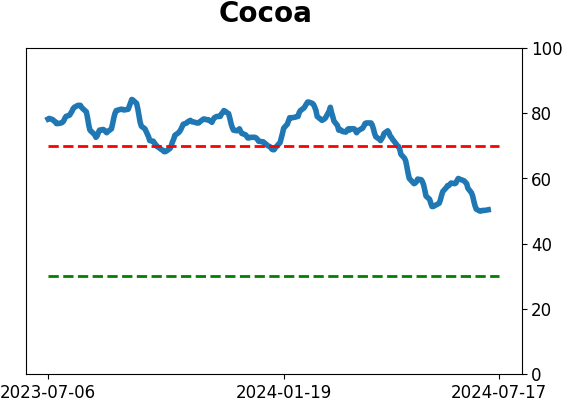
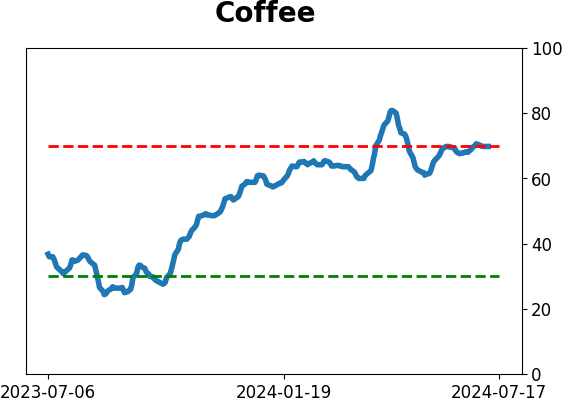
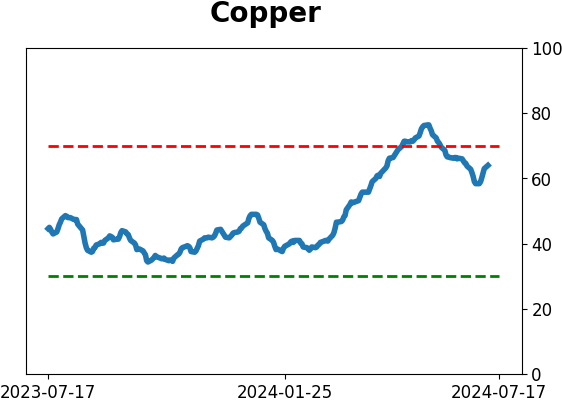
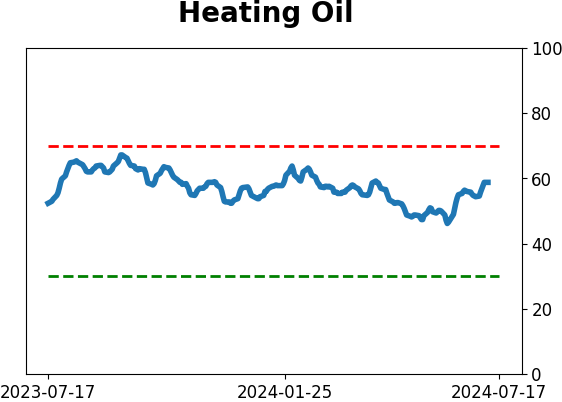
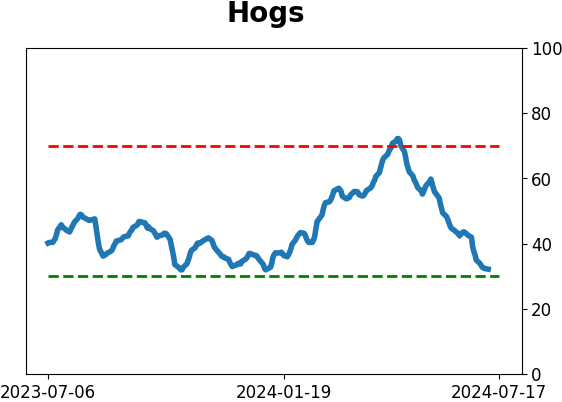
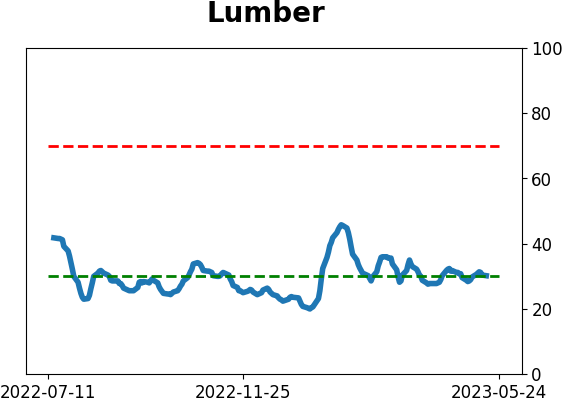
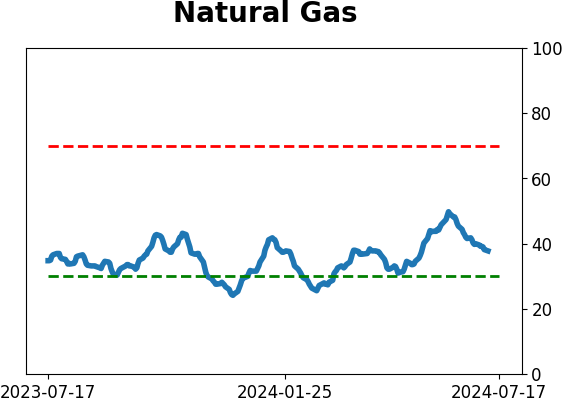
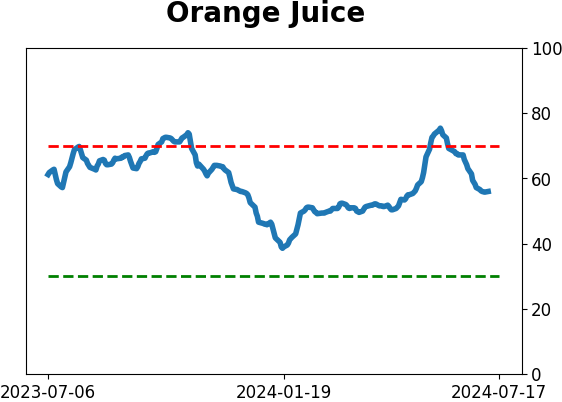
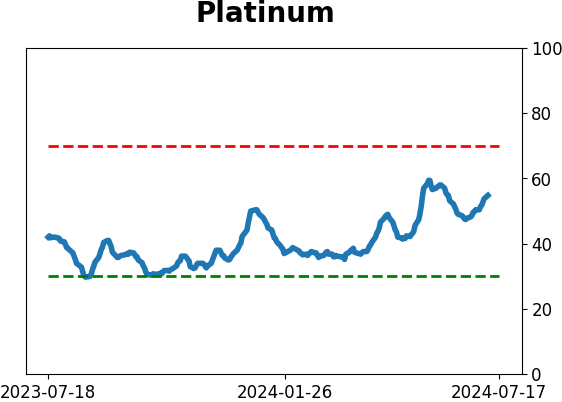
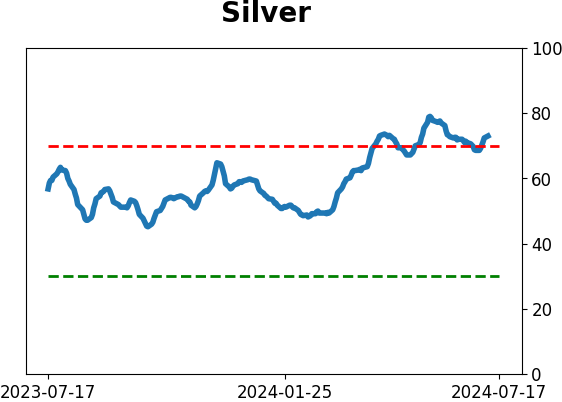
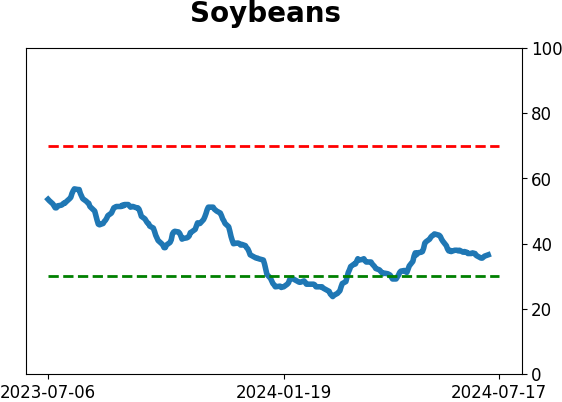
Commodity ETF's - 5-Day Moving Average
|
|