Headlines
|
|
A Dead Cat Bounce in Treasury Notes:
The rally in 10-year Treasury notes has gone 65 days since hitting a 6-month low in April. Despite those months of rallying, 10-year futures have gained less than 2%, among the weakest rallies in 30 years. Weak rallies have had much more of a tendency to falter than stronger rallies did.
Syndrome spotted: Thanks to a recent new high in the Nasdaq on historically poor breadth, on Thursday there were more 52-week lows than 52-week highs on that exchange. Those conditions triggered a Titanic Syndrome warning. Over the past year, this triggered on September 3, 2020, then again on April 20 of this year. Both preceded further pullbacks of at least 5% in the Nasdaq Composite over the next 2-3 weeks.
Bottom Line:
See the Outlook & Allocations page for more details on these summaries STOCKS: Hold
The speculative frenzy in February is wrung out. Internal dynamics have mostly held up, with some exceptions. Many of our studies still show a mixed to poor short-term view, with medium- and long-term ones turning more positive. BONDS: Hold
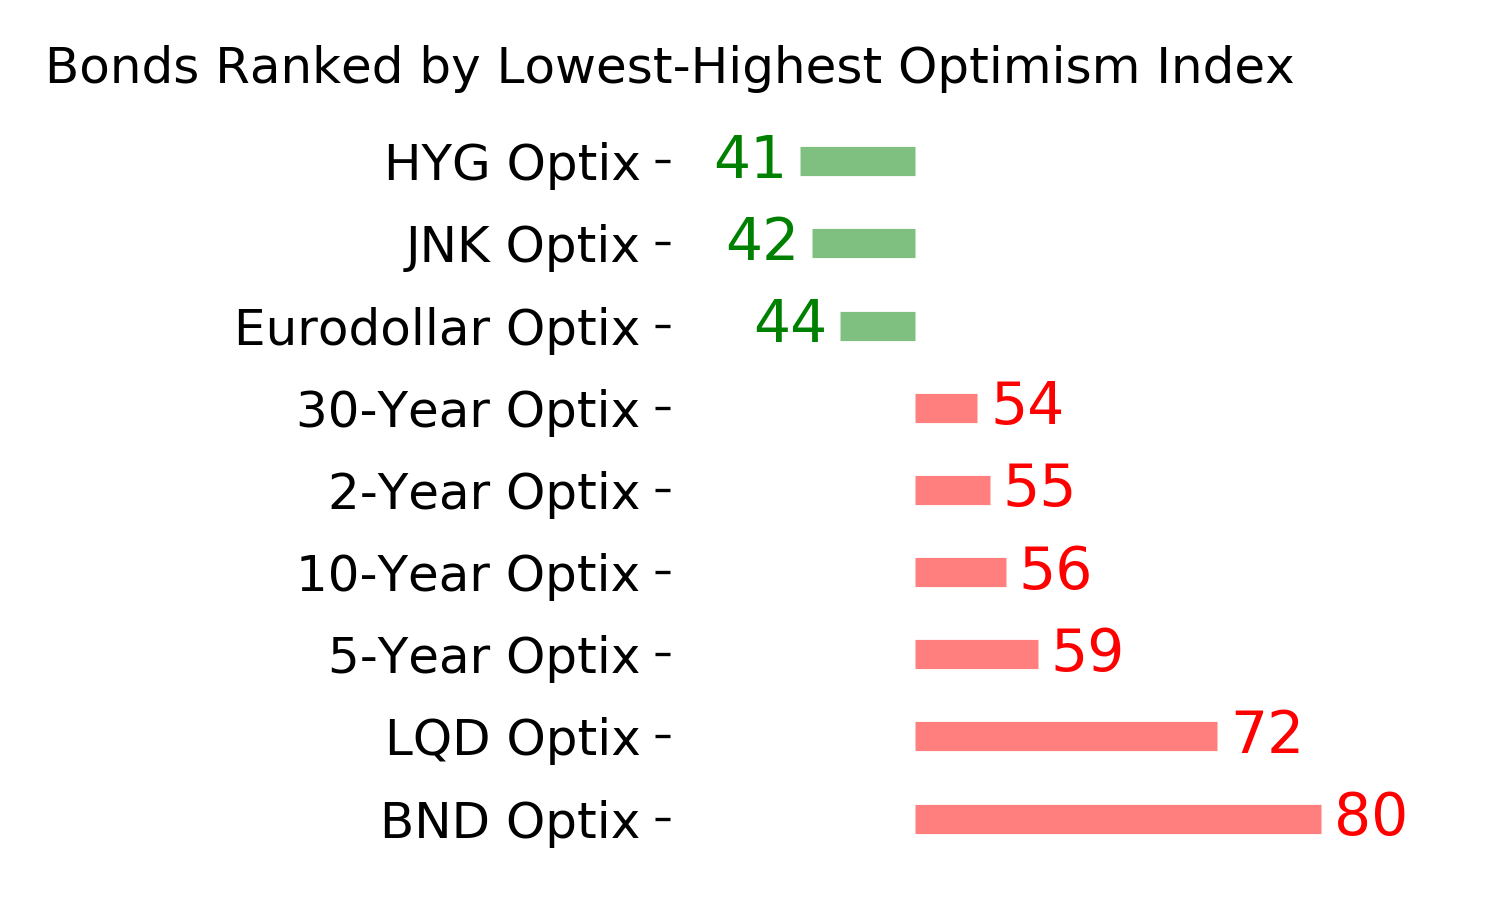
Various parts of the market got hit in March, with the lowest Bond Optimism Index we usually see during healthy environments. After a shaky couple of weeks, the broad bond market has modestly recovered. Not a big edge here either way. GOLD: Hold
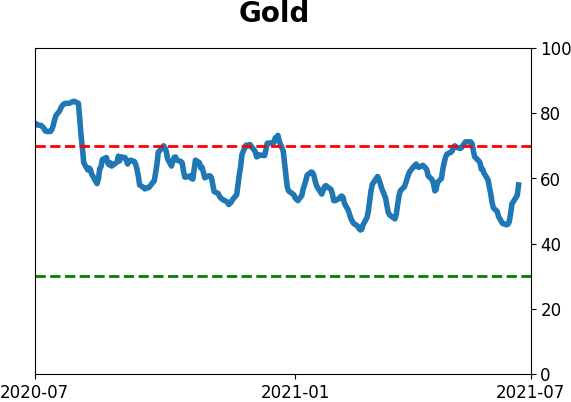
Gold and miners have done very well, recovering above long-term trend lines. The issue is that both have tended to perform poorly after similar situations - will have to wait and see how it plays out.
|
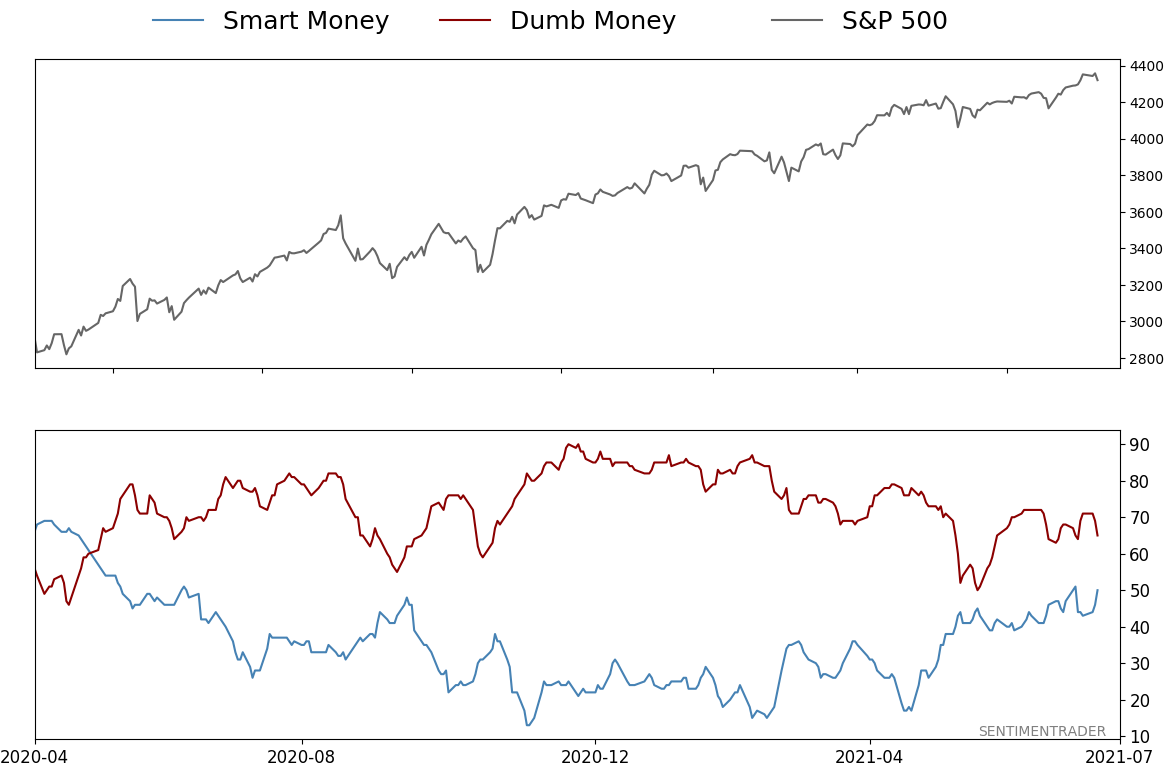
Smart / Dumb Money Confidence
|
Smart Money Confidence: 50%
Dumb Money Confidence: 65%
|
|
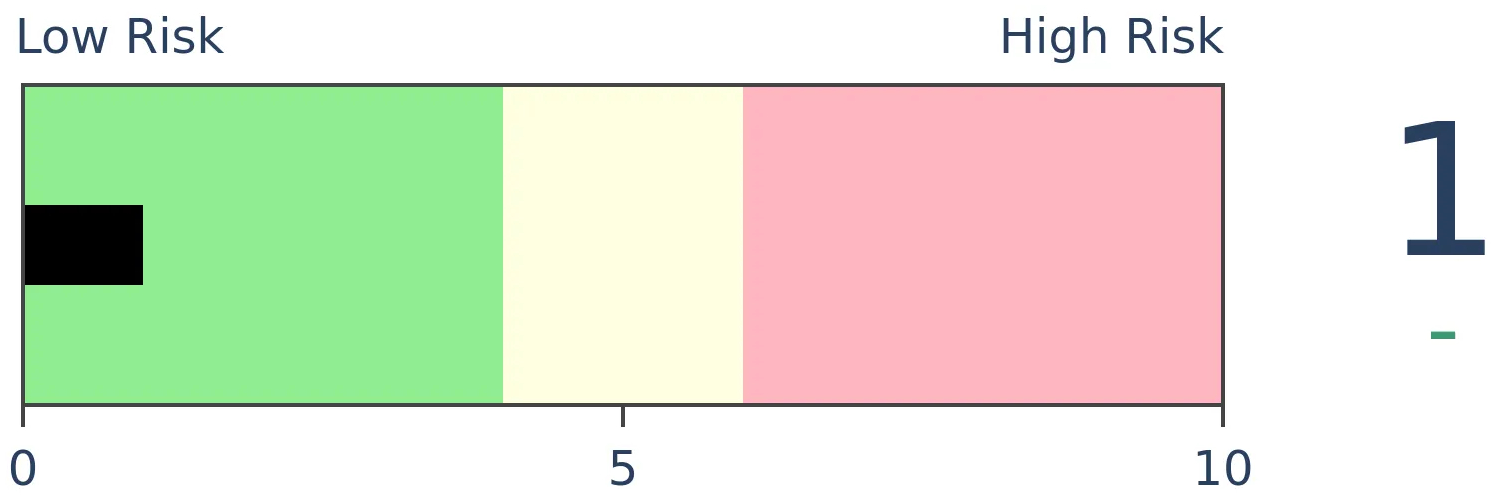
Risk Levels
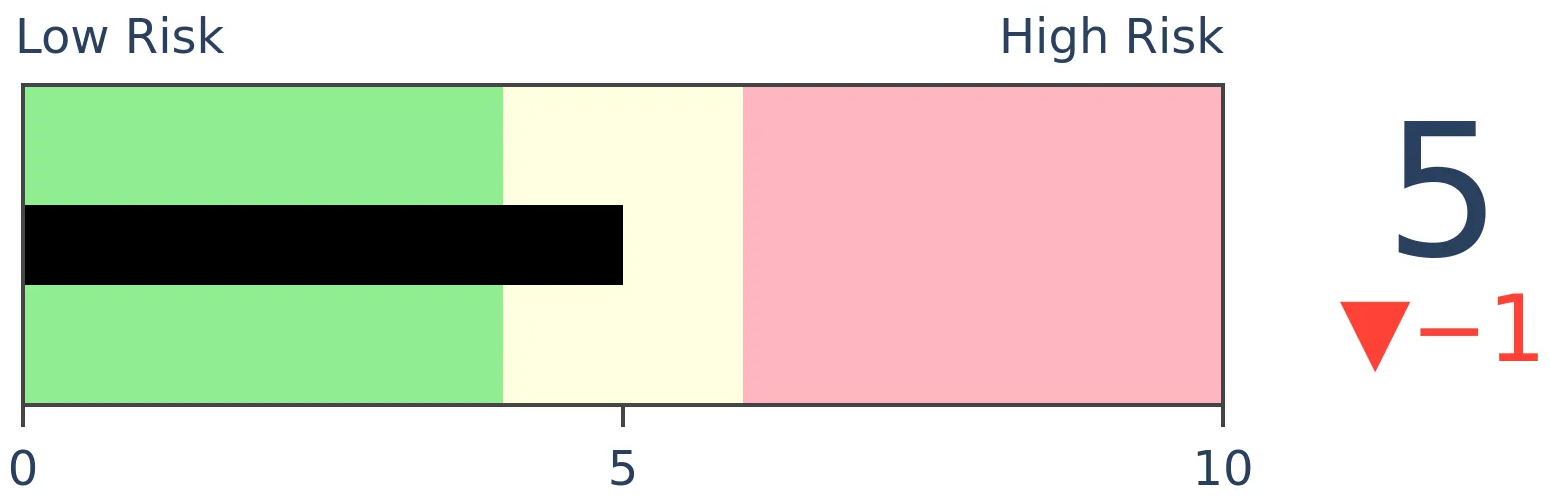
Stocks Short-Term
|
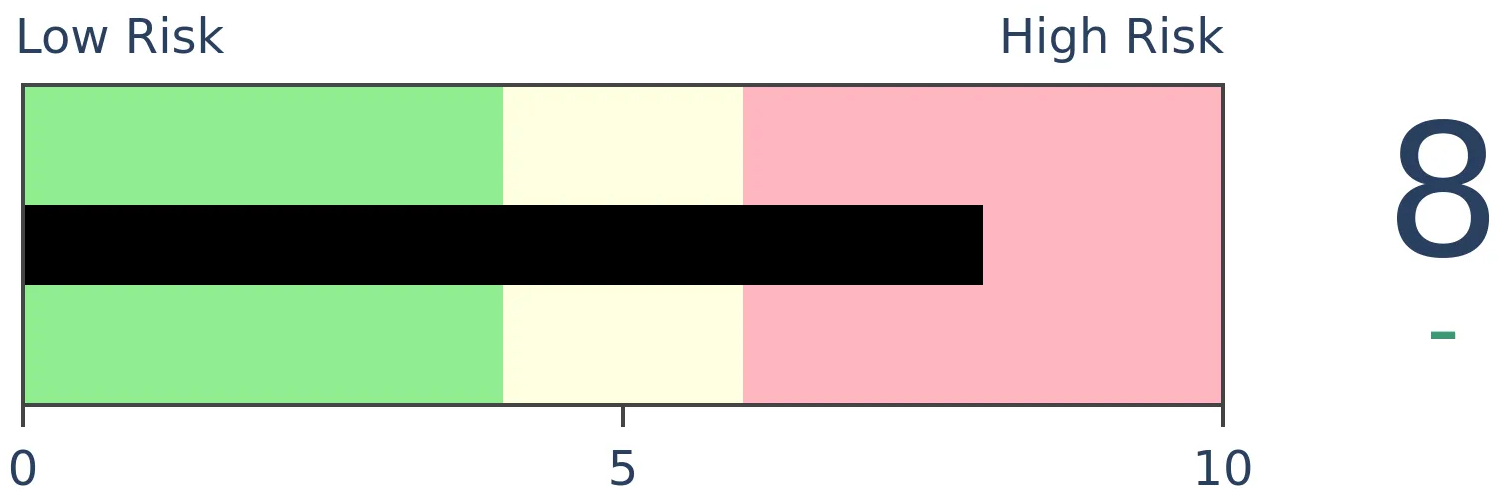
Stocks Medium-Term
|
|
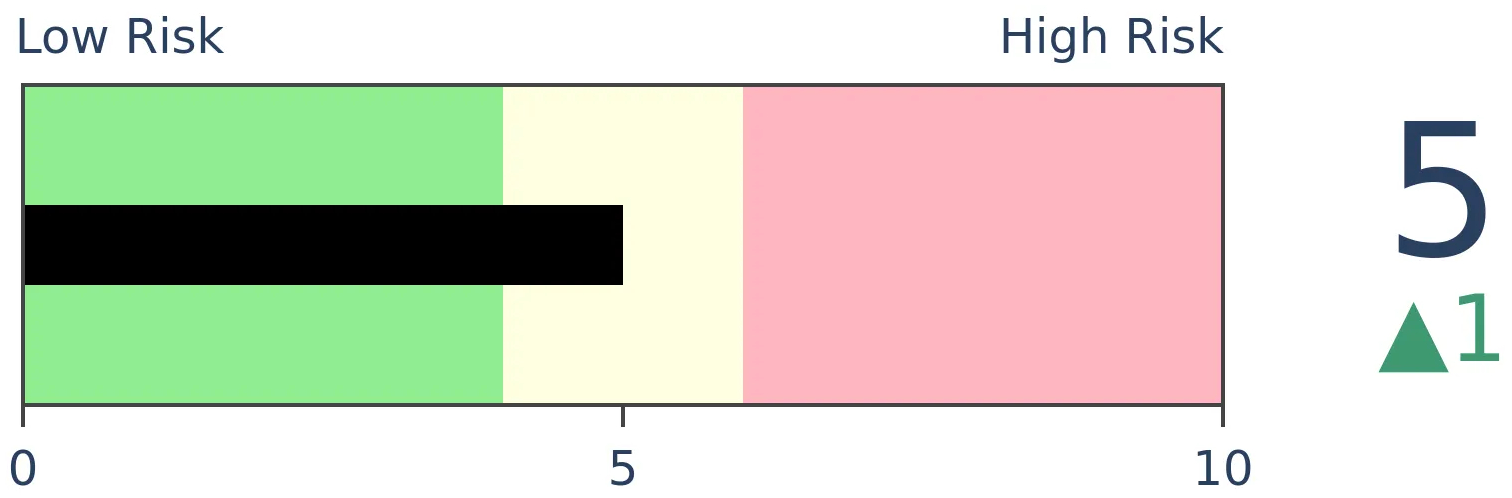
Bonds
|
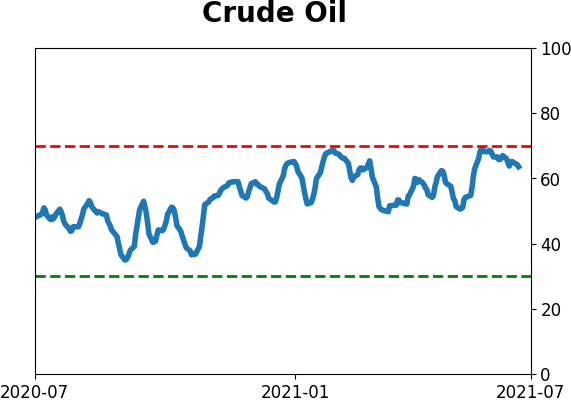
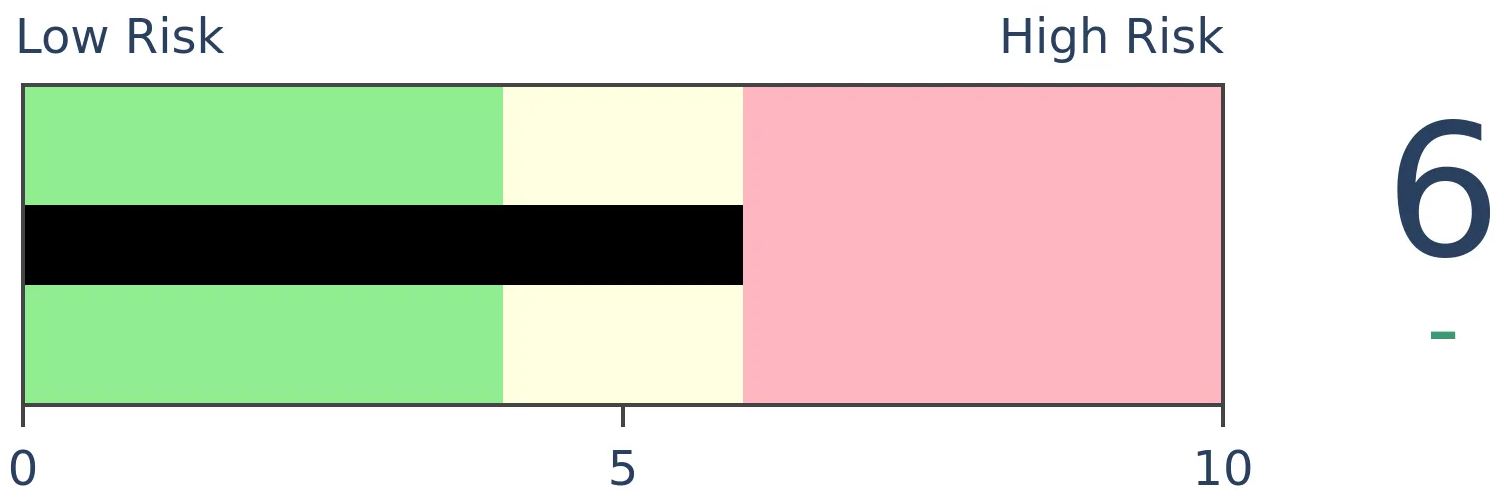
Crude Oil
|
|
Gold
|
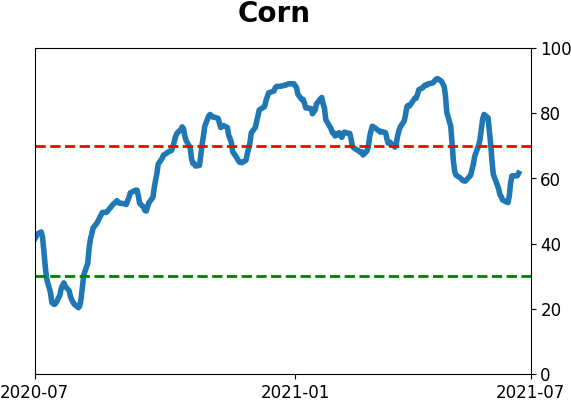
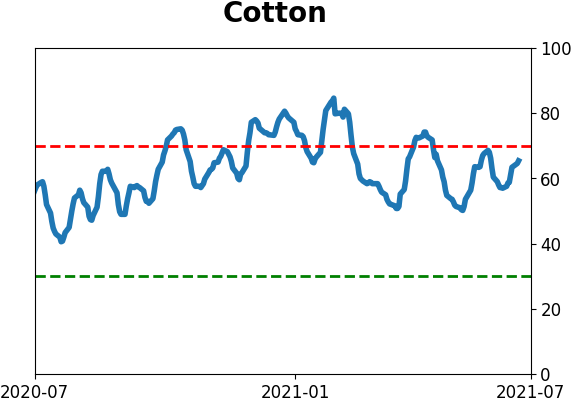
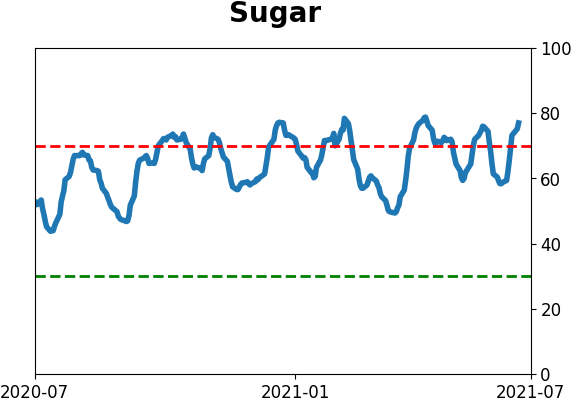
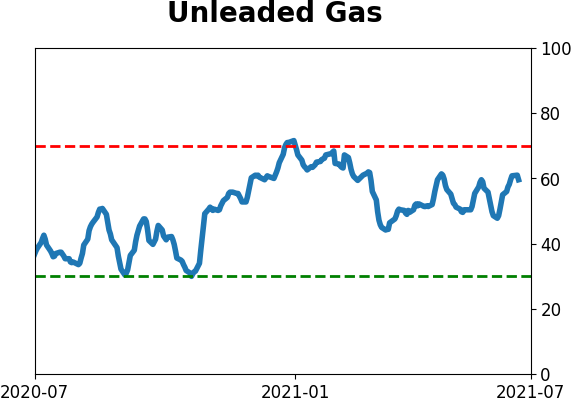
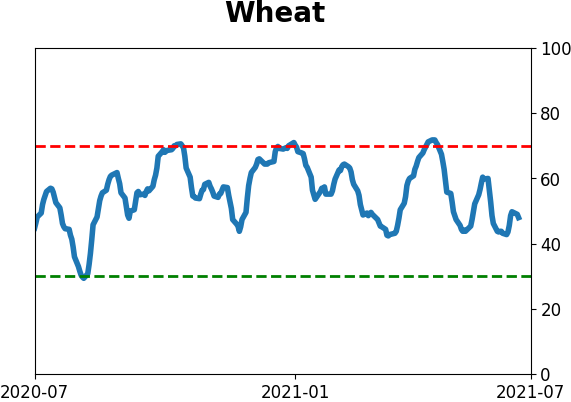
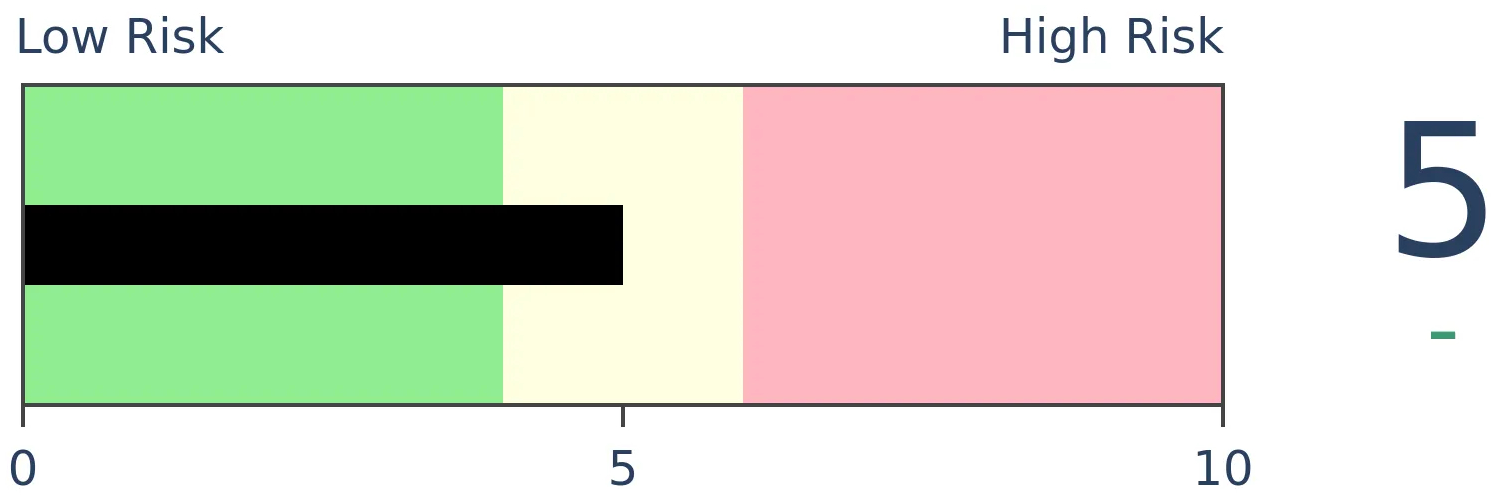
Agriculture
|
|
Research
BOTTOM LINE
The rally in 10-year Treasury notes has gone 65 days since hitting a 6-month low in April. Despite those months of rallying, 10-year futures have gained less than 2%, among the weakest rallies in 30 years. Weak rallies have had much more of a tendency to falter than stronger rallies did.
FORECAST / TIMEFRAME
TLT -- Down, Medium-Term
|
After Treasury notes and bonds took a tumble into April, sentiment soured, and inflation was on the tip of seemingly every investor's tongue.
That has quieted down quite a bit in recent weeks as economic data has been mixed and yields retreated from their highs. If yields are declining, that means note and bond prices are rising.
For 10-year Treasury notes, the rally off the bottom has gone 65 days. Some old trend-following systems suggested that if a market goes this long without setting a new low, then the trend has changed.
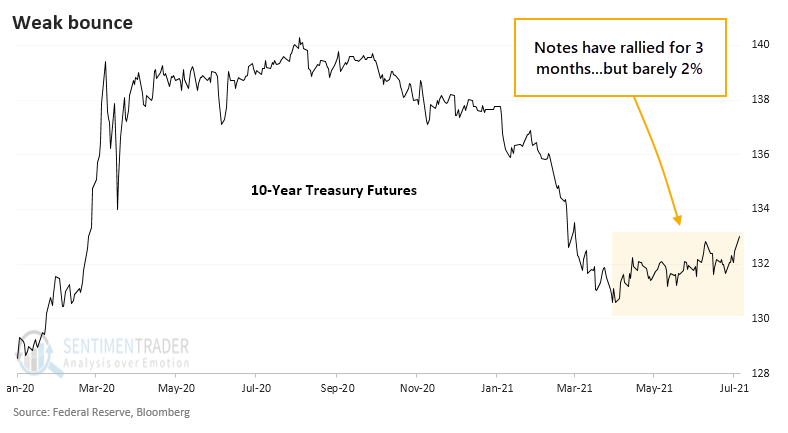
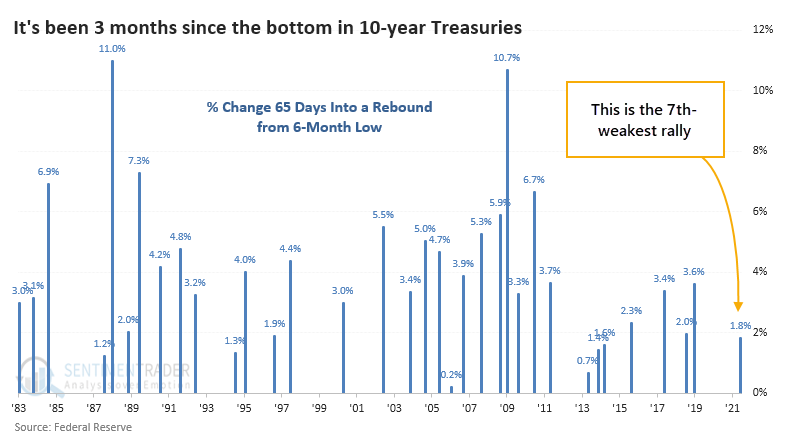
What's notable about this rally, though, is that it has a 'dead cat' feel to it. Note prices haven't even bounced 2% from the low, making it the 7th-weakest rally since futures began trading 30 years ago.
WEAK BOUNCES VS. STRONG ONES
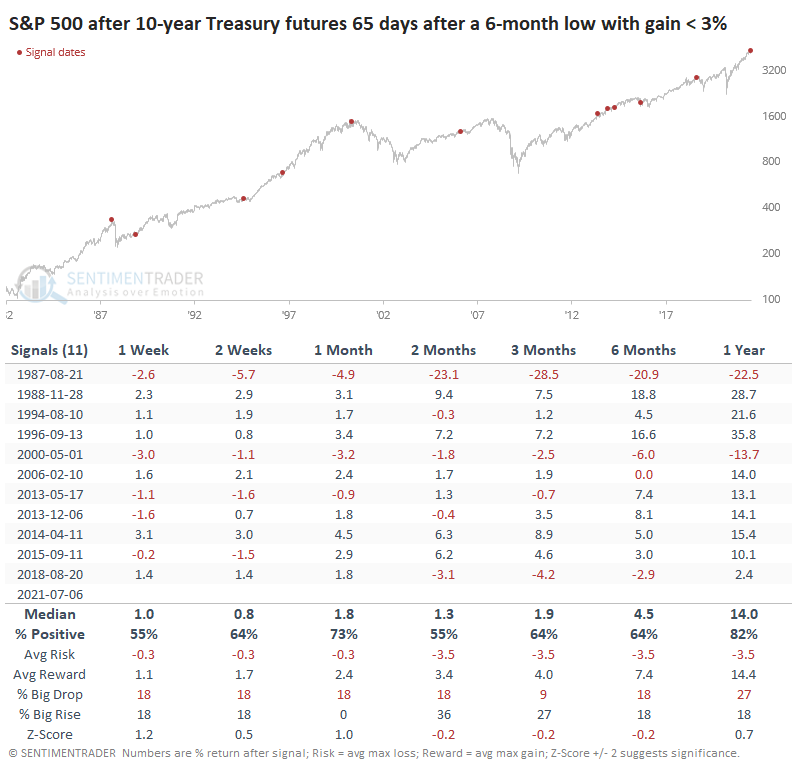
As for what this might mean, the table below shows whenever 10-year note futures rallied for 65 days off of a 6-month low, but with a price gain of less than 3%.
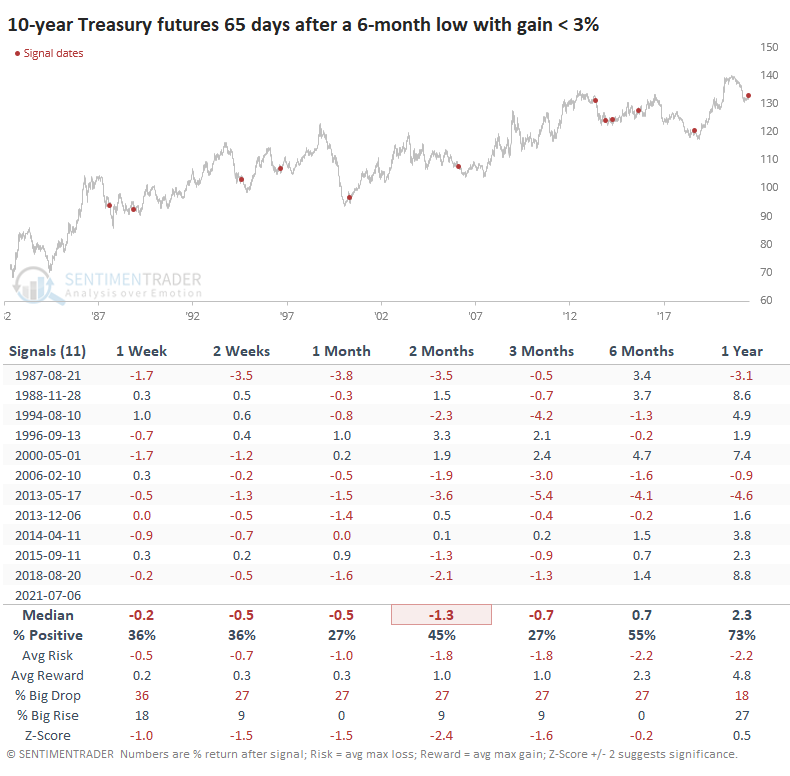
After these 'dead cat' bounces, there was a consistent tendency for notes to revert to a downtrend. Over the medium-term, prices continued to rally only once - May 2000 is the only signal that showed persistent and meaningful gains in 10-year Treasury futures over a multi-month time frame.
When we contrast that to times when notes had stronger rallies, at least 3.5%, then there was quite a big difference in future returns.
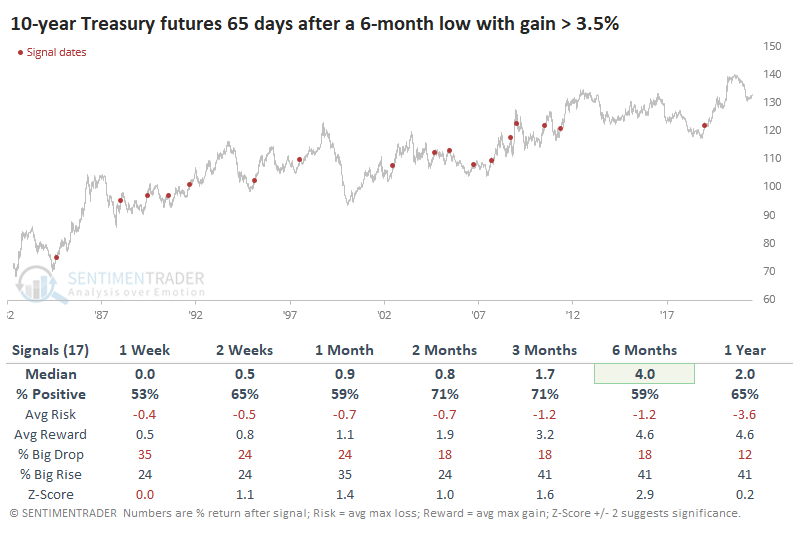
After these signals, 10-year notes rallied more than 70% of the time over the next 2-3 months, and the risk/reward was tilted toward reward.
IMPACT ON STOCKS, SECTORS, AND FACTORS
For stocks, weak rebounds in 10-year Treasuries didn't mean much. The S&P 500 showed mixed returns in the months ahead, with mostly positive returns but a poor risk/reward ratio over the medium-term of several months.
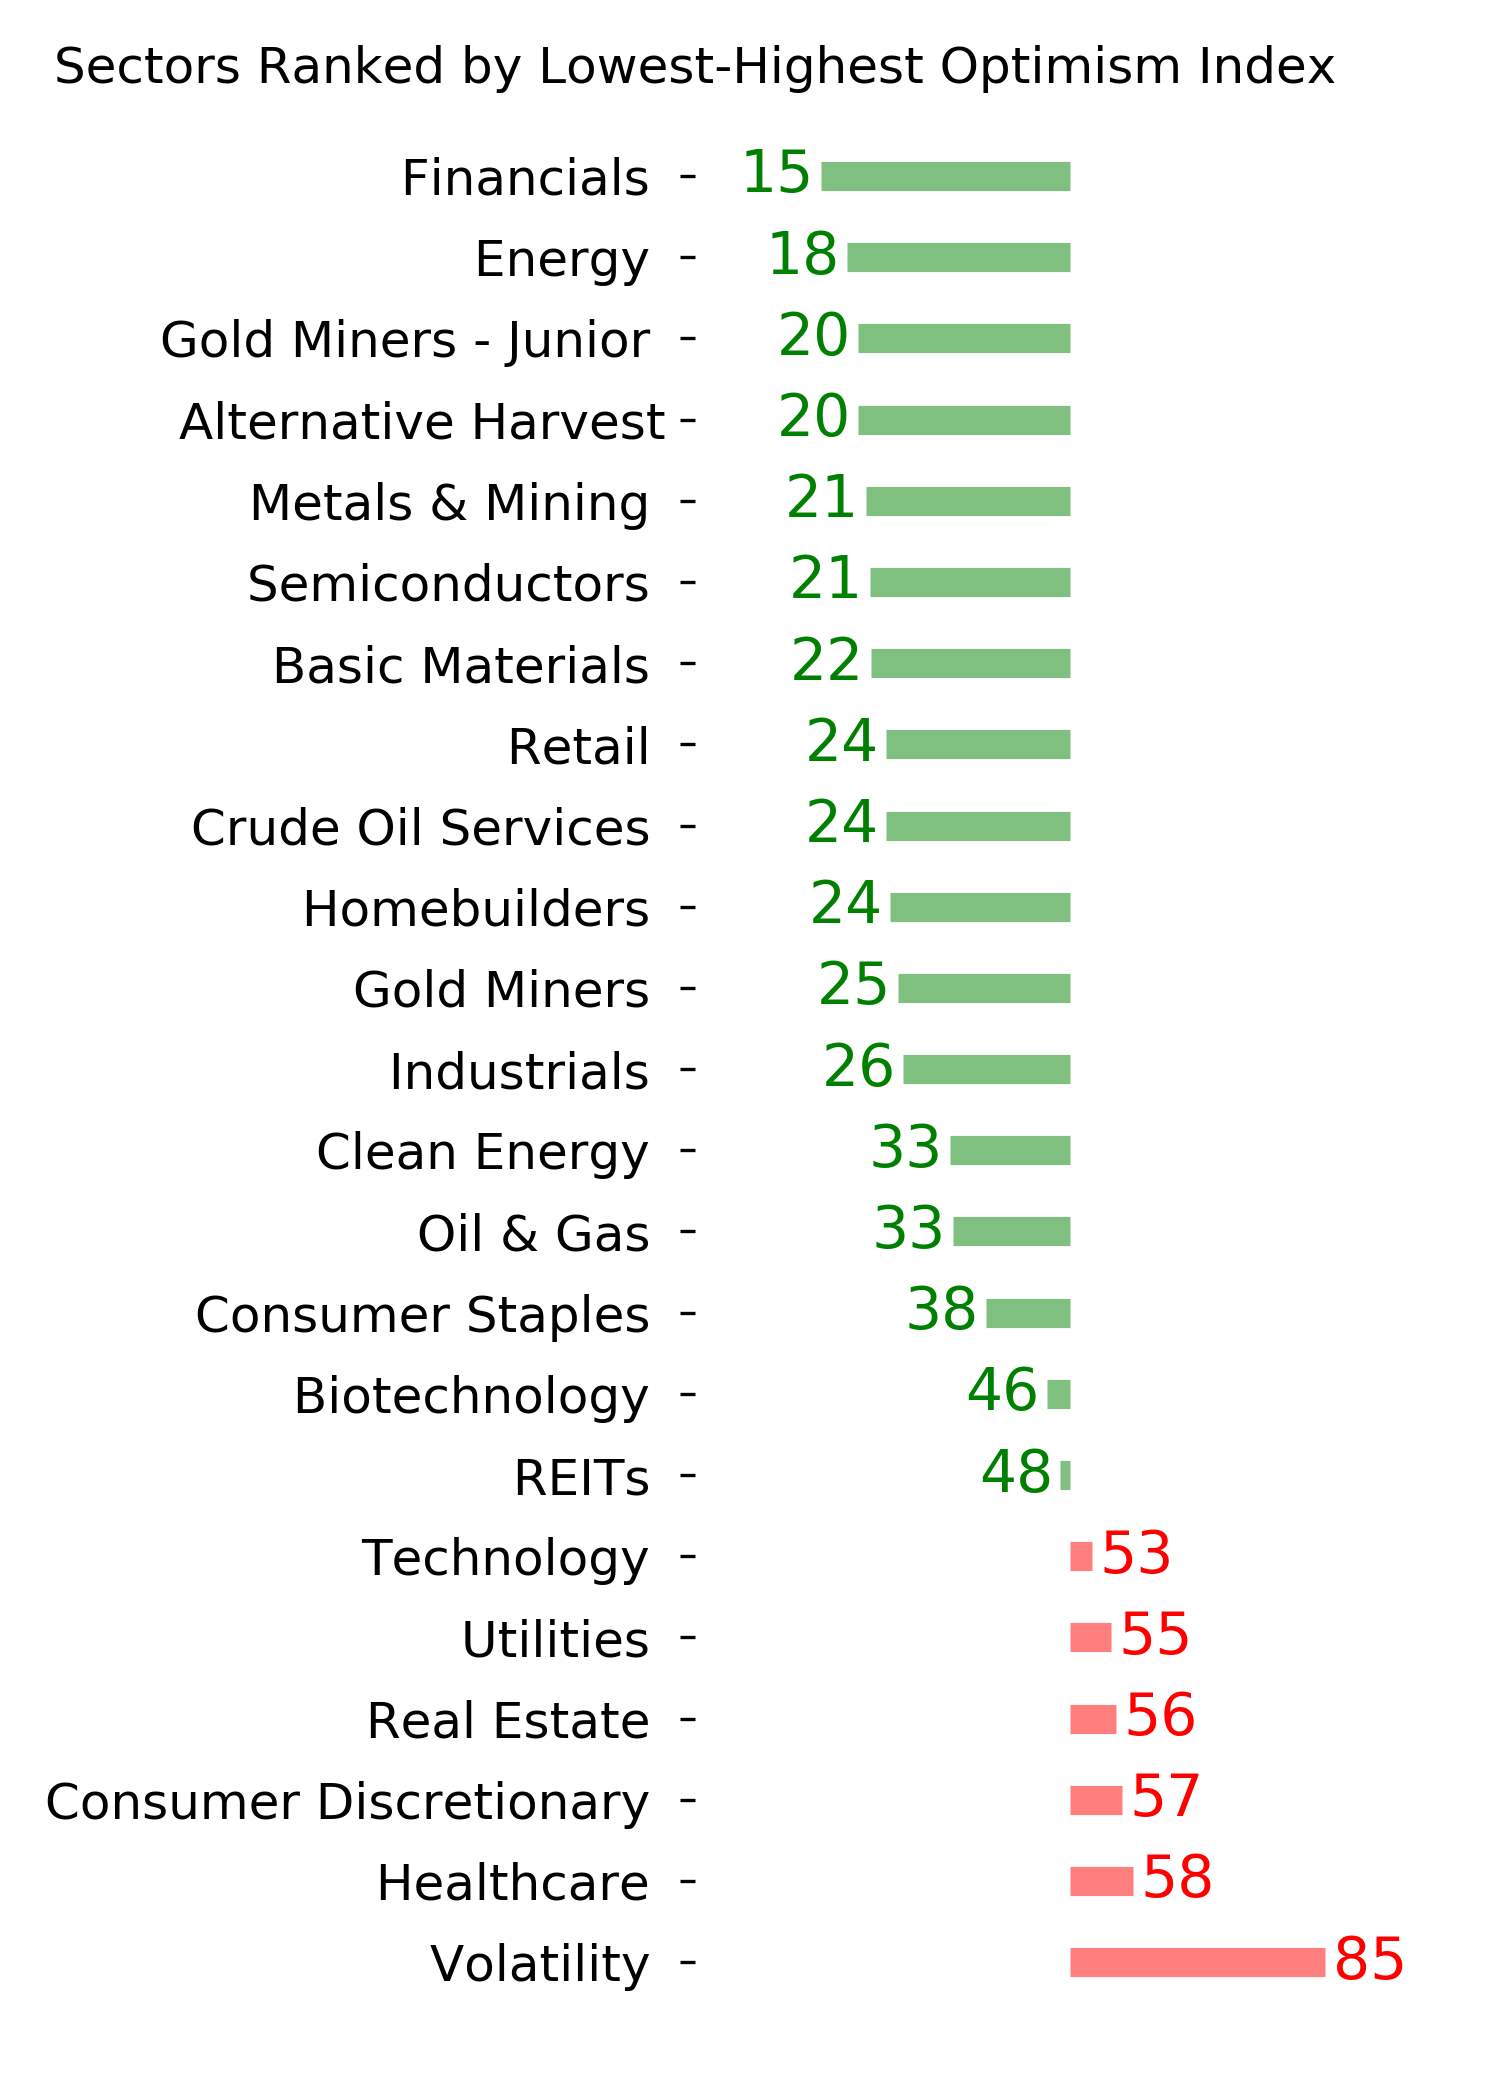
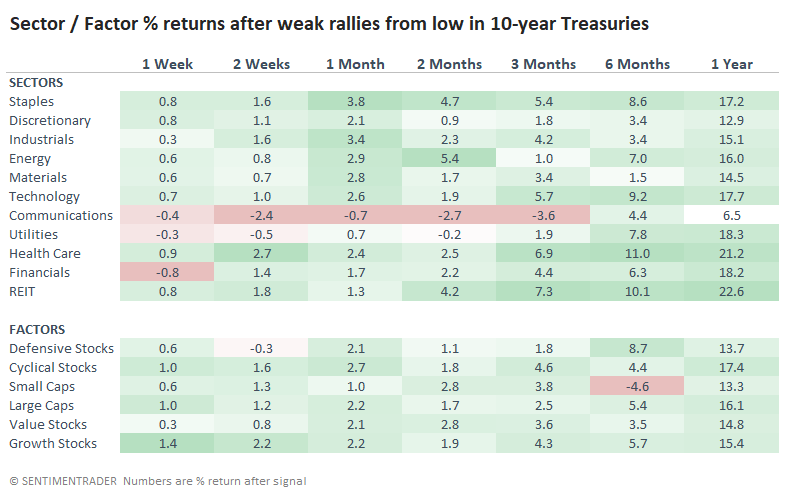
In terms of sectors, Small-Caps didn't fare well, neither did the Communications sector. Energy, Staples, Health Care, and REITs tended to show the strongest returns.
Those sectors were also among the most consistent.
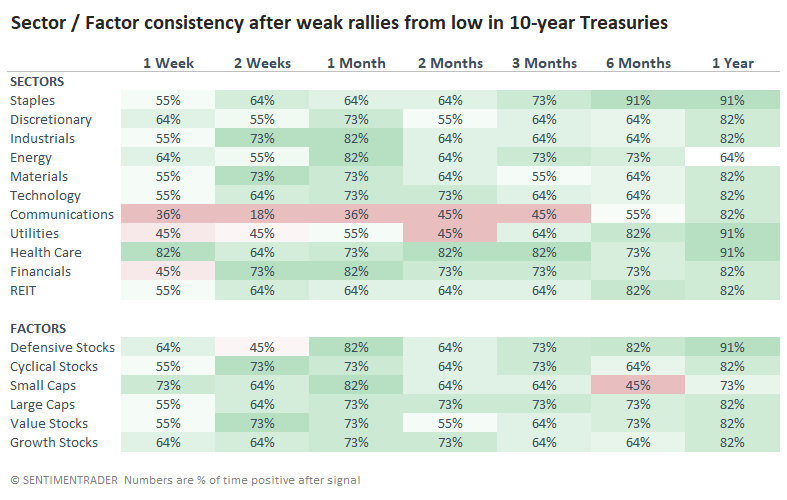
There isn't a super compelling edge in future returns among sectors, but it's more telling for Treasury notes. Weak rebounds have had a strong tendency to lead to declines rather than continuations of the rallies. With sentiment on Treasuries rapidly improving, bond bulls need to hope that the 'dead cat' tendency will not play out yet again.
Active Studies
| Time Frame | Bullish | Bearish | | Short-Term | 0 | 1 | | Medium-Term | 2 | 2 | | Long-Term | 9 | 5 |
|
Indicators at Extremes
Portfolio
| Position | Description | Weight % | Added / Reduced | Date | | Stocks | RSP | 4.1 | Added 4.1% | 2021-05-19 | | Bonds | 23.9% BND, 6.9% SCHP | 30.7 | Reduced 7.1% | 2021-05-19 | | Commodities | GCC | 2.6 | Reduced 2.1%
| 2020-09-04 | | Precious Metals | GDX | 5.6 | Reduced 4.2% | 2021-05-19 | | Special Situations | 4.3% XLE, 2.2% PSCE | 7.6 | Reduced 5.6% | 2021-04-22 | | Cash | | 49.4 | | |
|
Updates (Changes made today are underlined)
Much of our momentum and trend work has remained positive for several months, with some scattered exceptions. Almost all sentiment-related work has shown a poor risk/reward ratio for stocks, especially as speculation drove to record highs in exuberance in February. Much of that has worn off, and most of our models are back toward neutral levels. There isn't much to be excited about here. The same goes for bonds and even gold. Gold has been performing well lately and is back above long-term trend lines. The issue is that it has a poor record of holding onto gains when attempting a long-term trend change like this, so we'll take a wait-and-see approach. RETURN YTD: 9.0% 2020: 8.1%, 2019: 12.6%, 2018: 0.6%, 2017: 3.8%, 2016: 17.1%, 2015: 9.2%, 2014: 14.5%, 2013: 2.2%, 2012: 10.8%, 2011: 16.5%, 2010: 15.3%, 2009: 23.9%, 2008: 16.2%, 2007: 7.8%
|
|
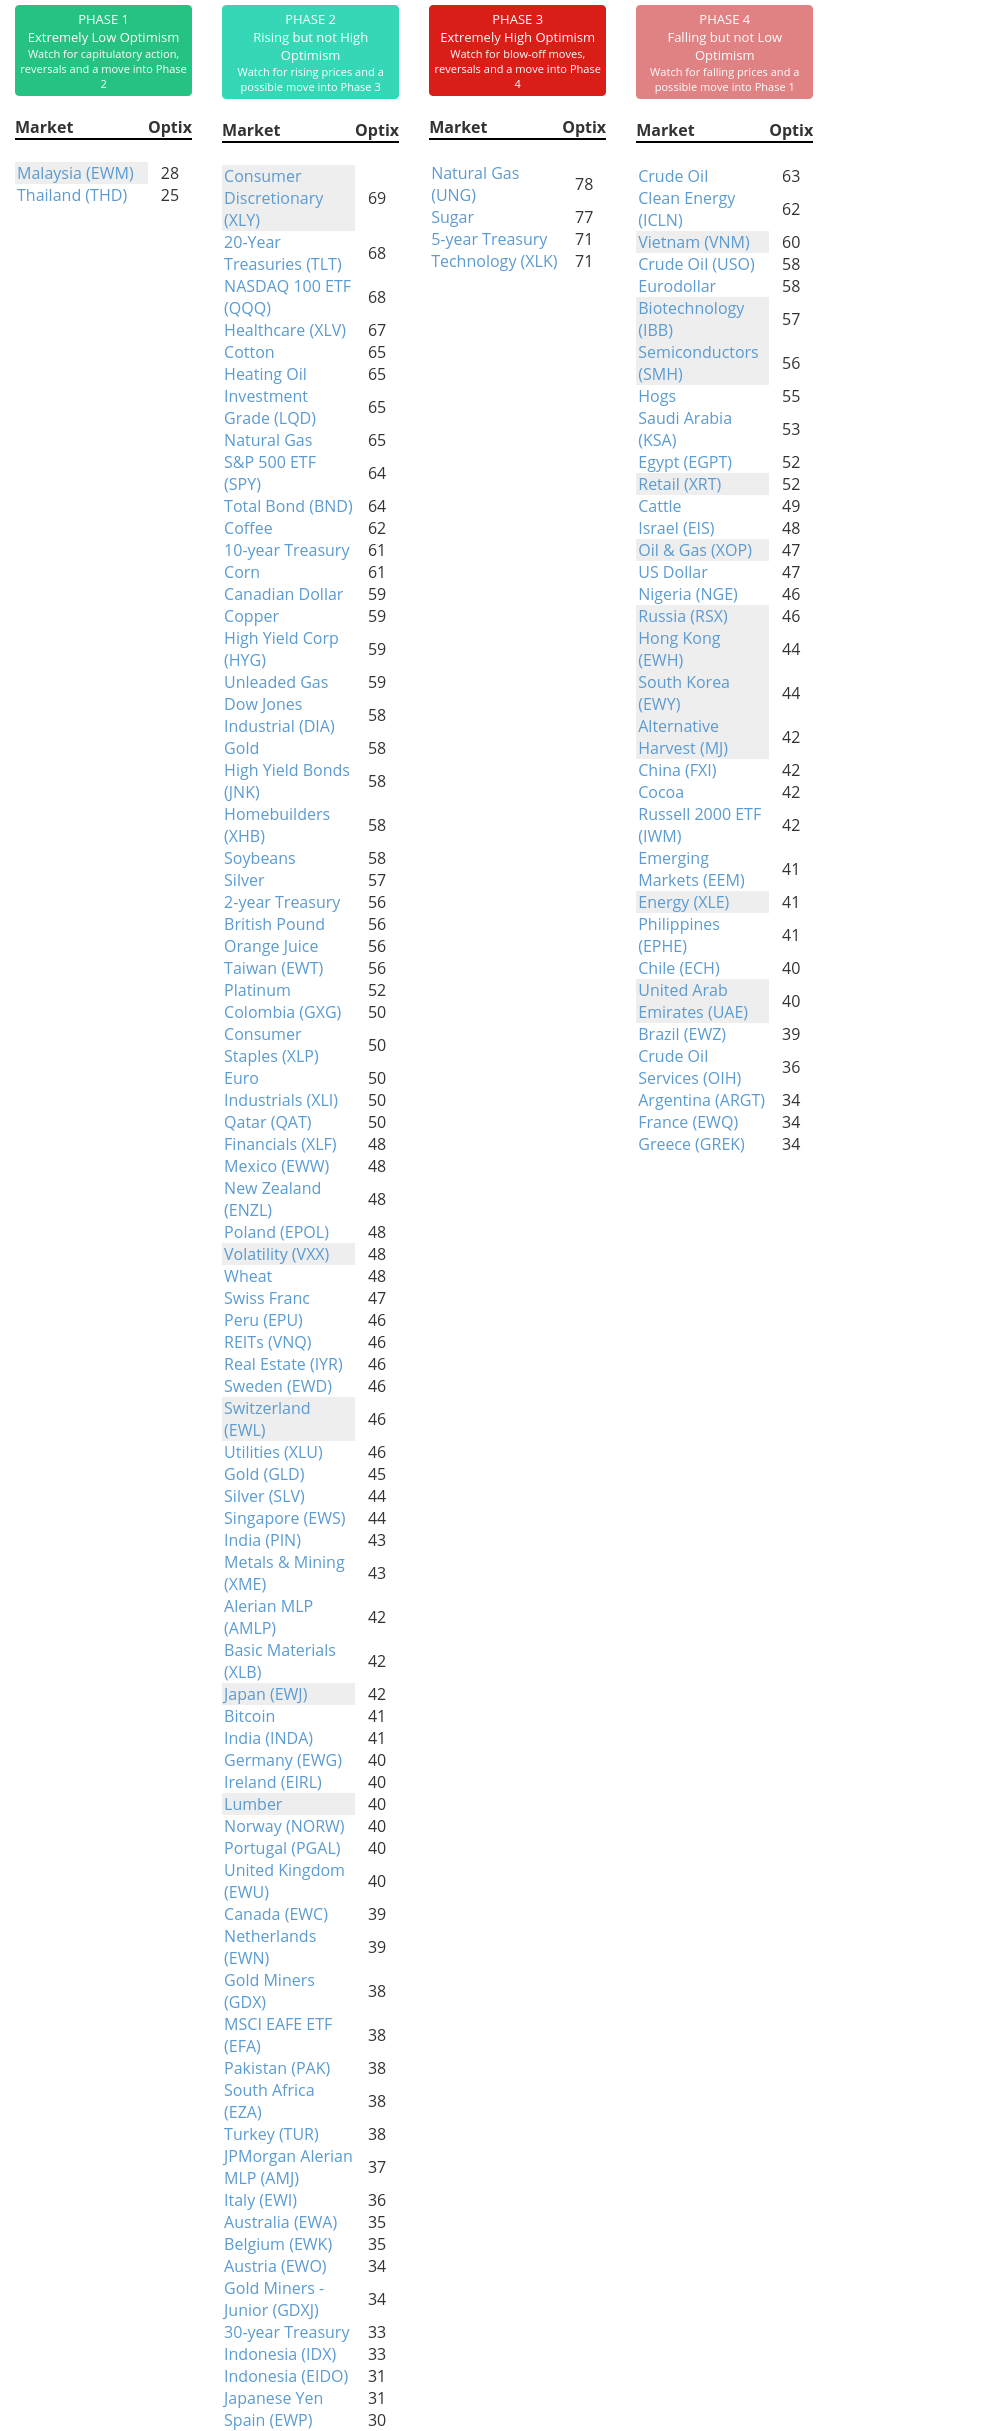
Phase Table
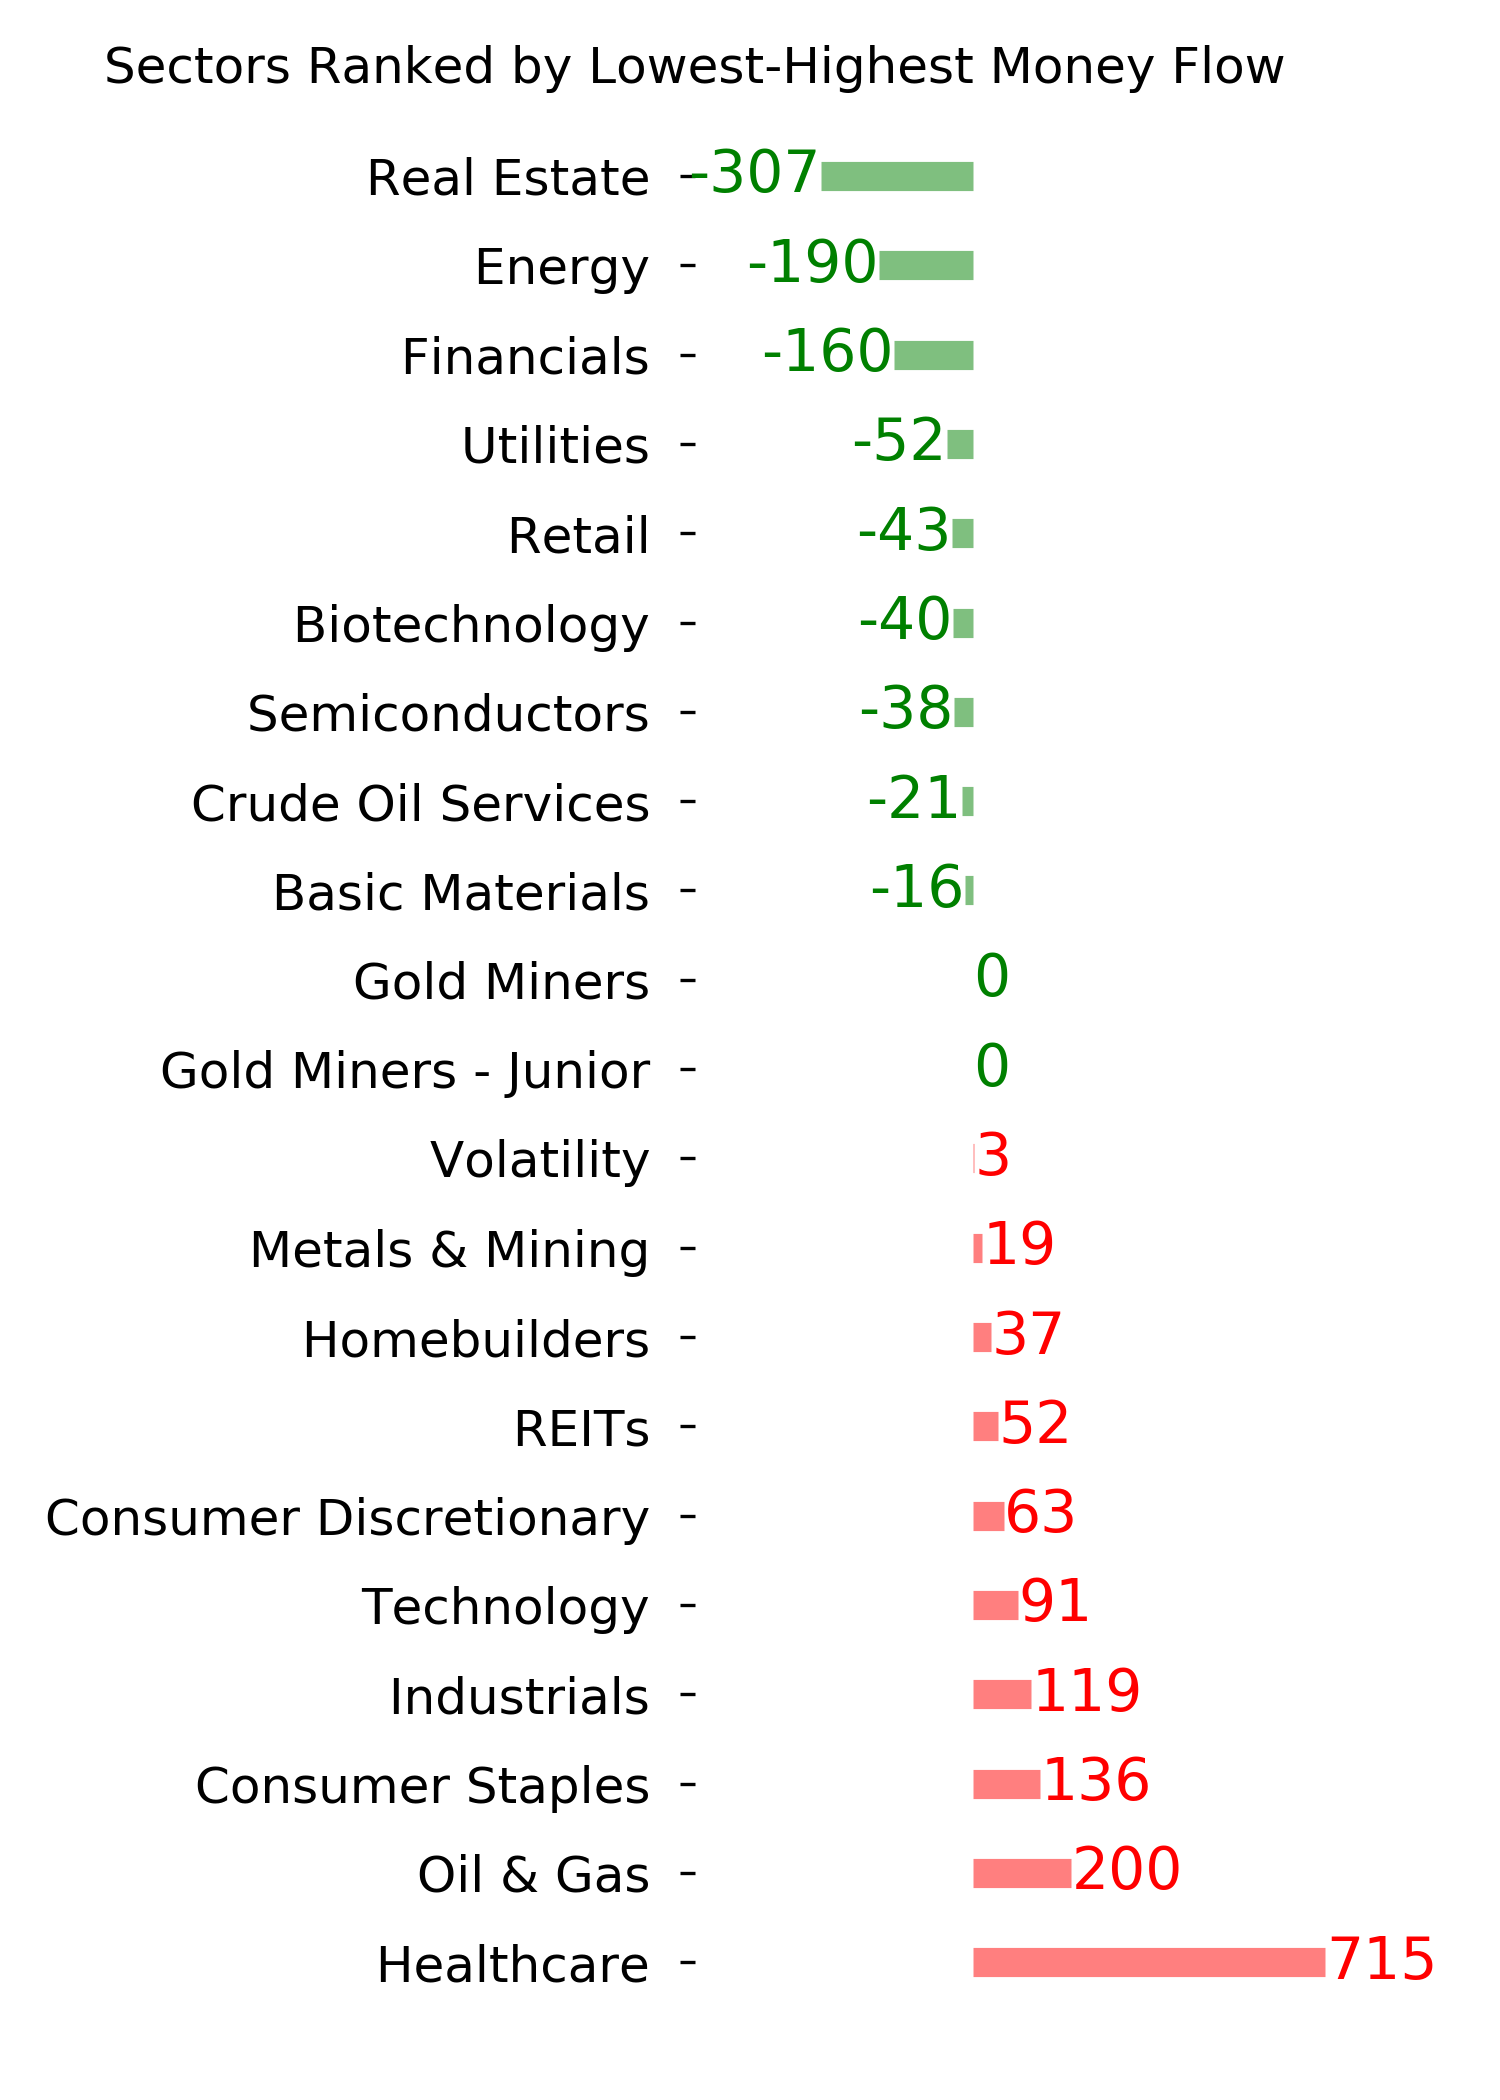
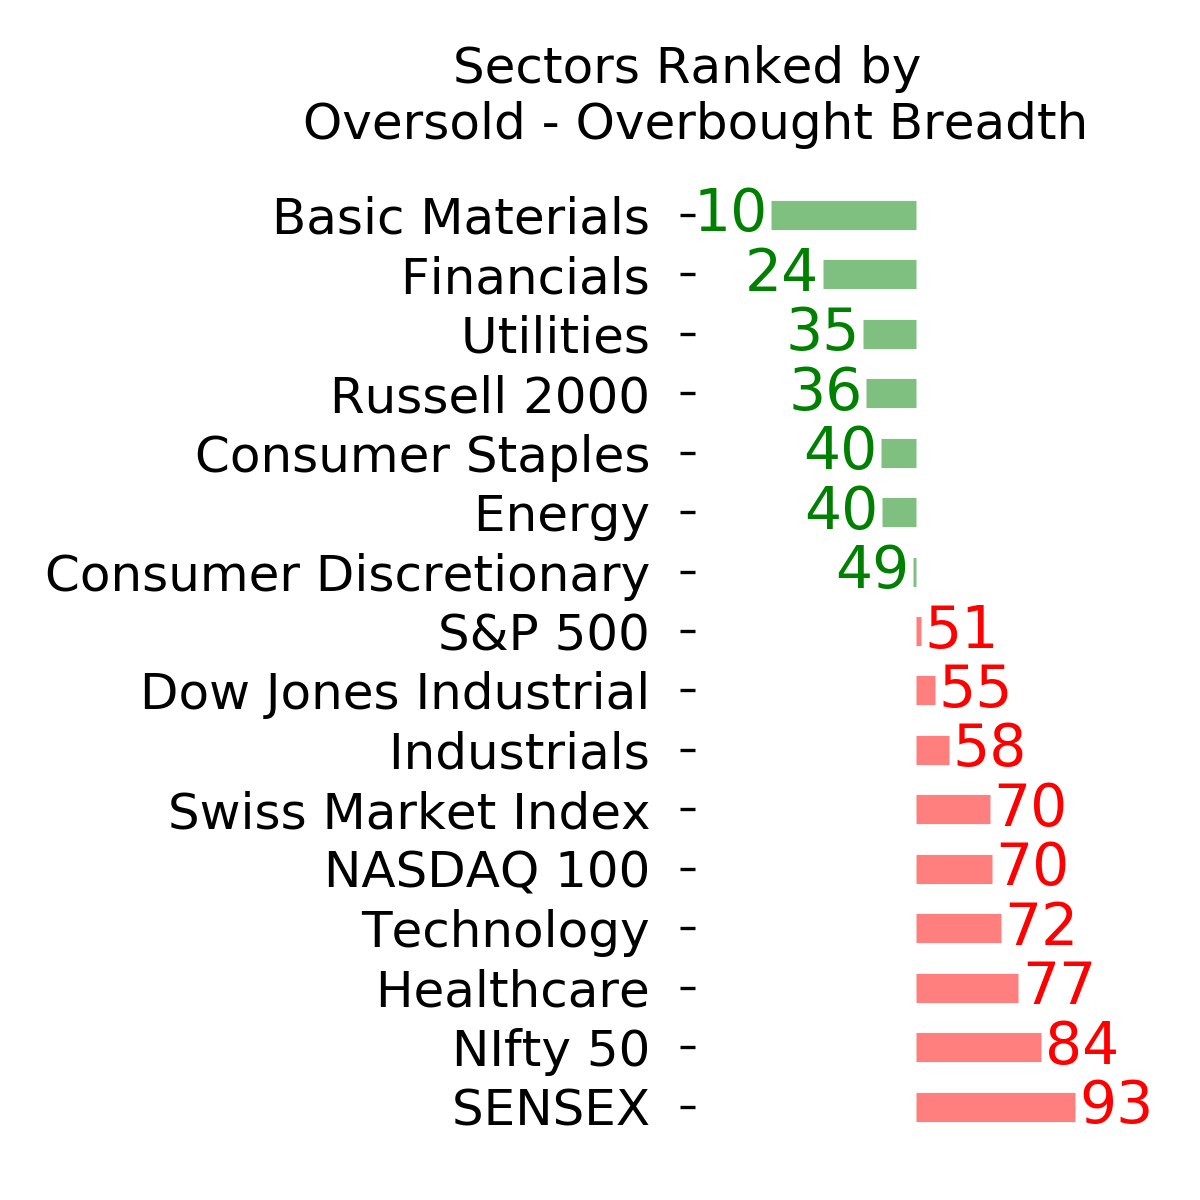
Ranks
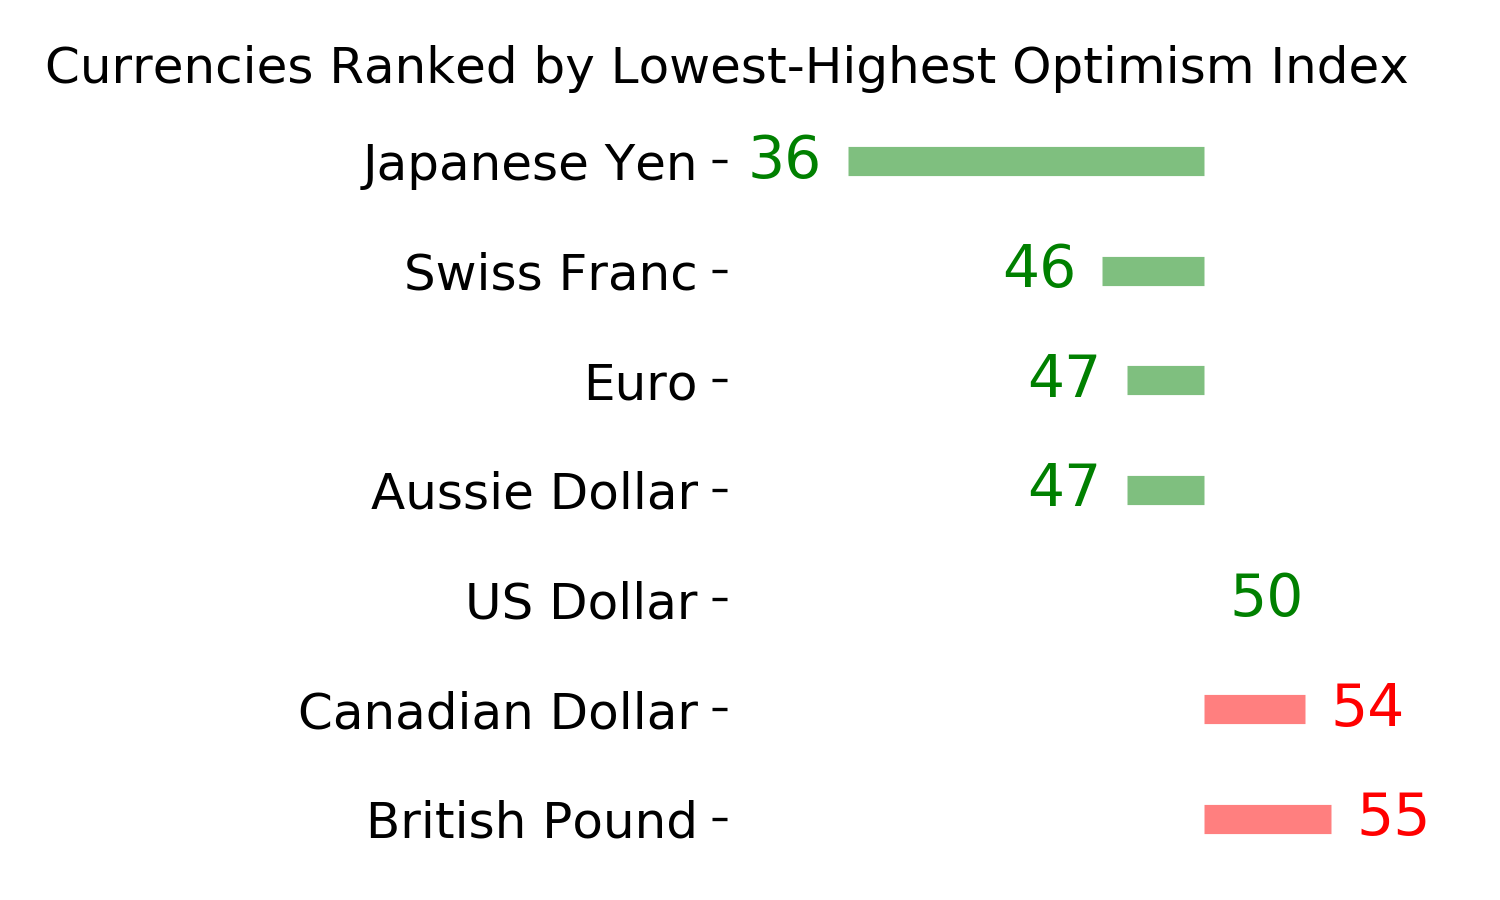
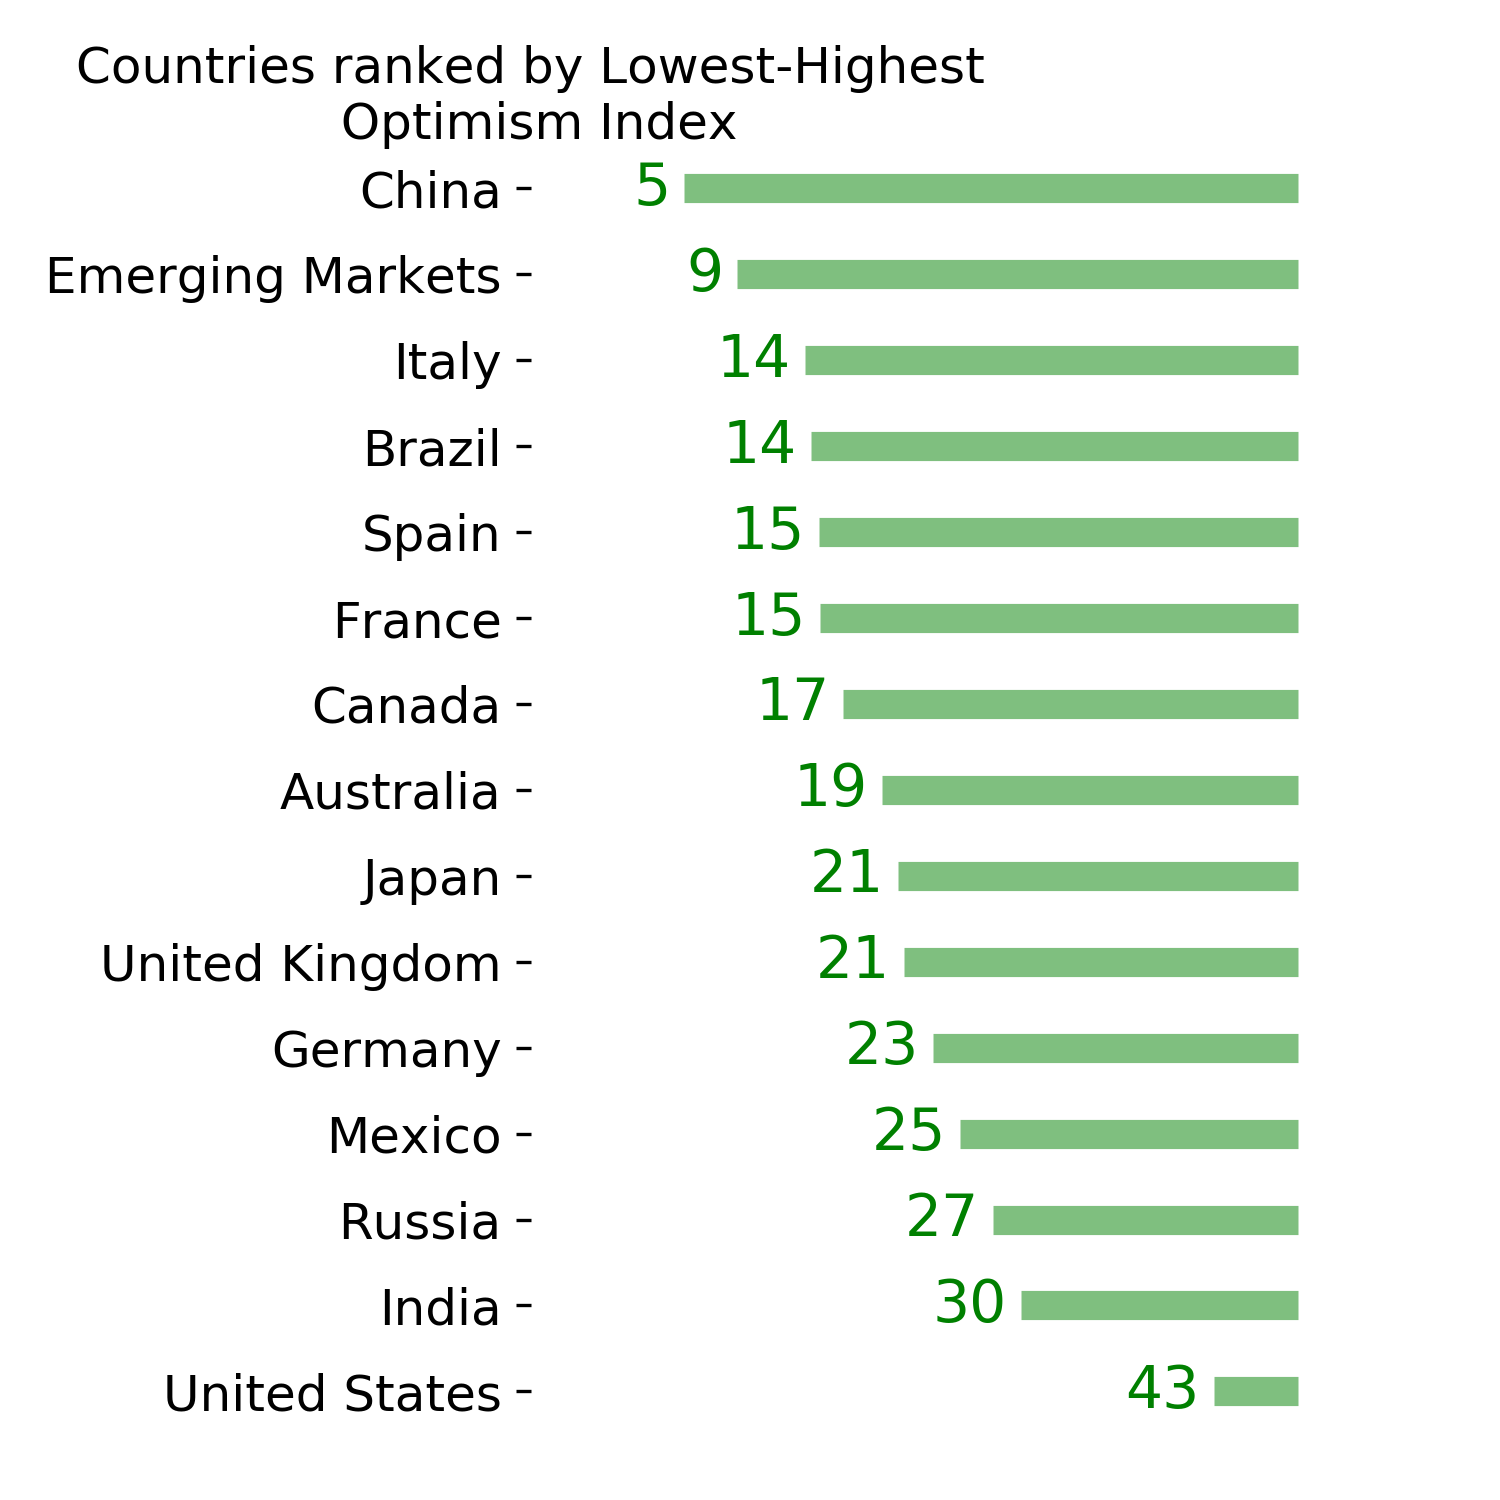
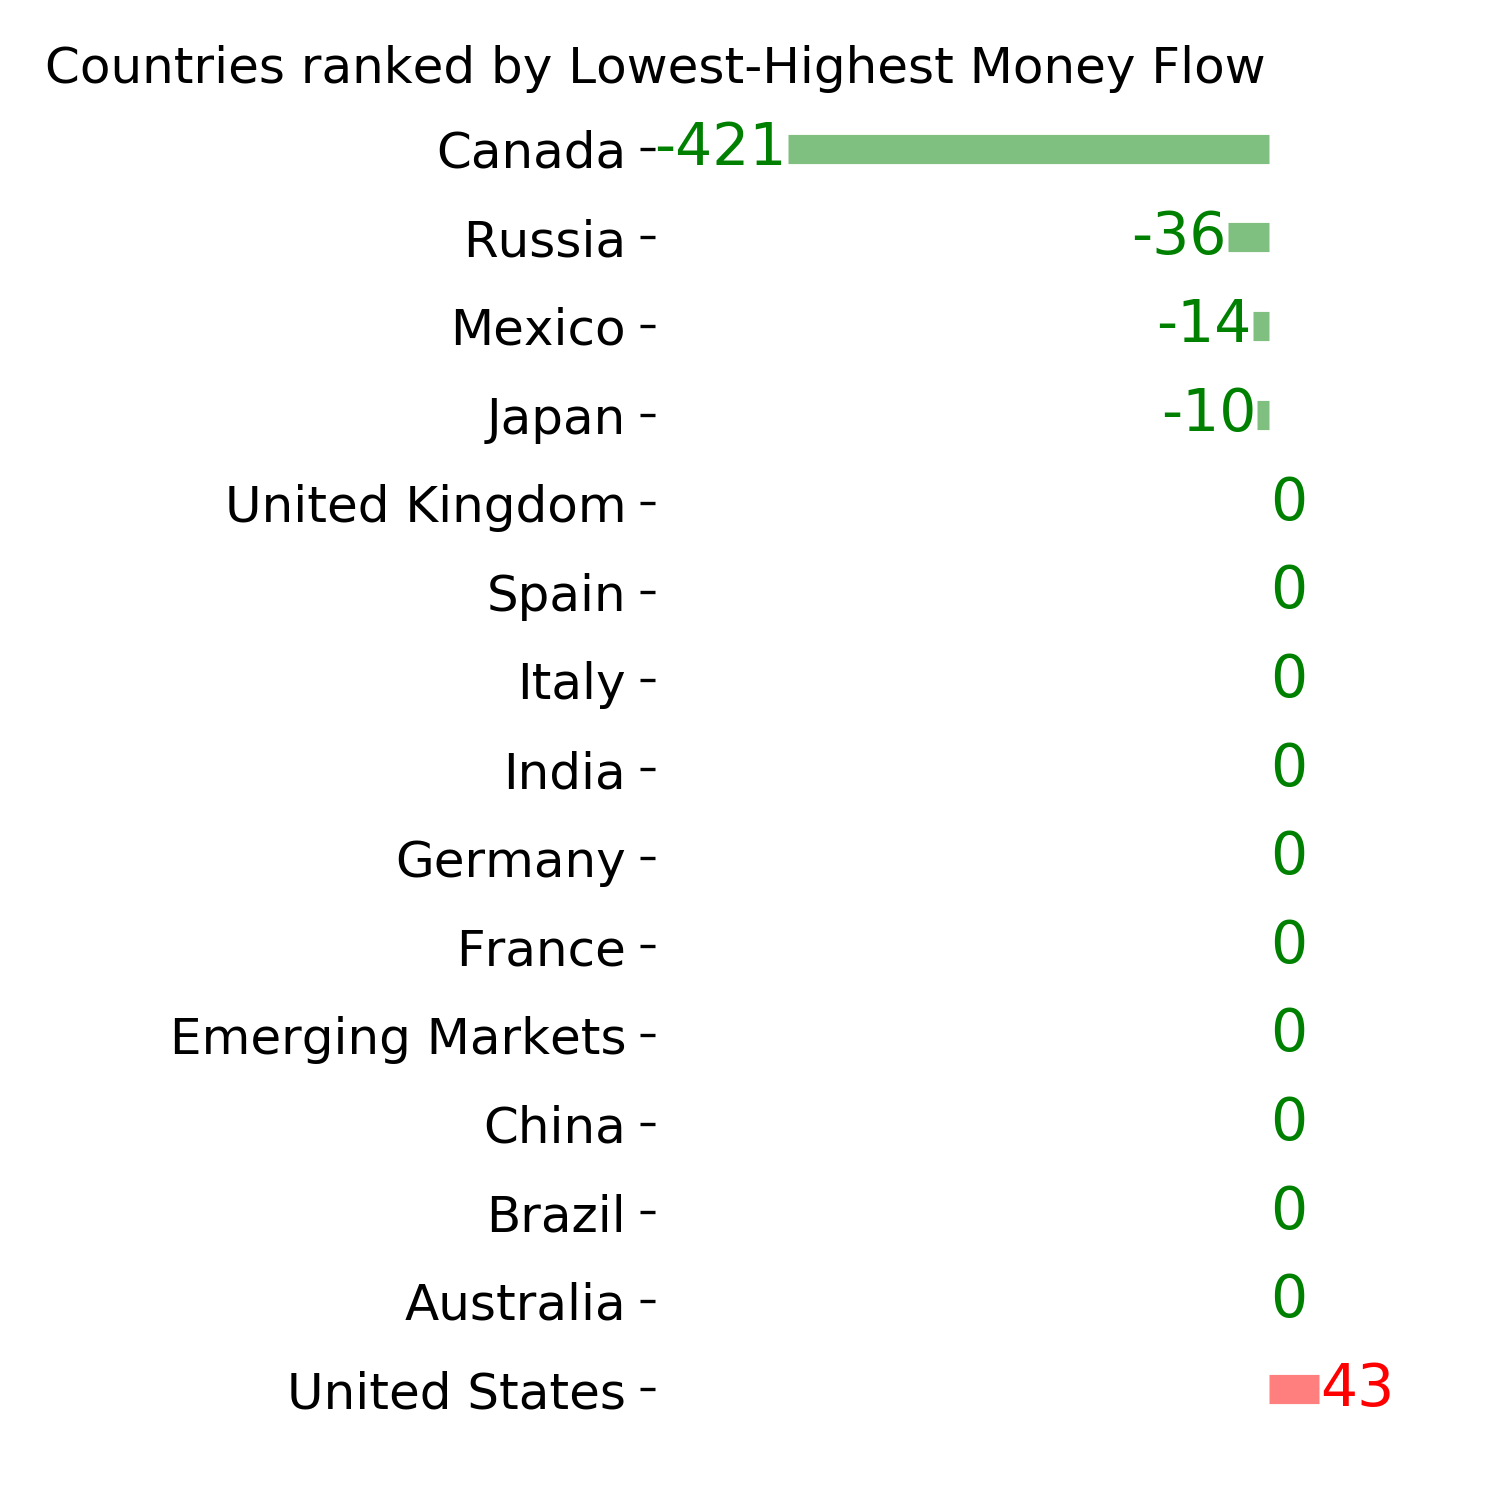
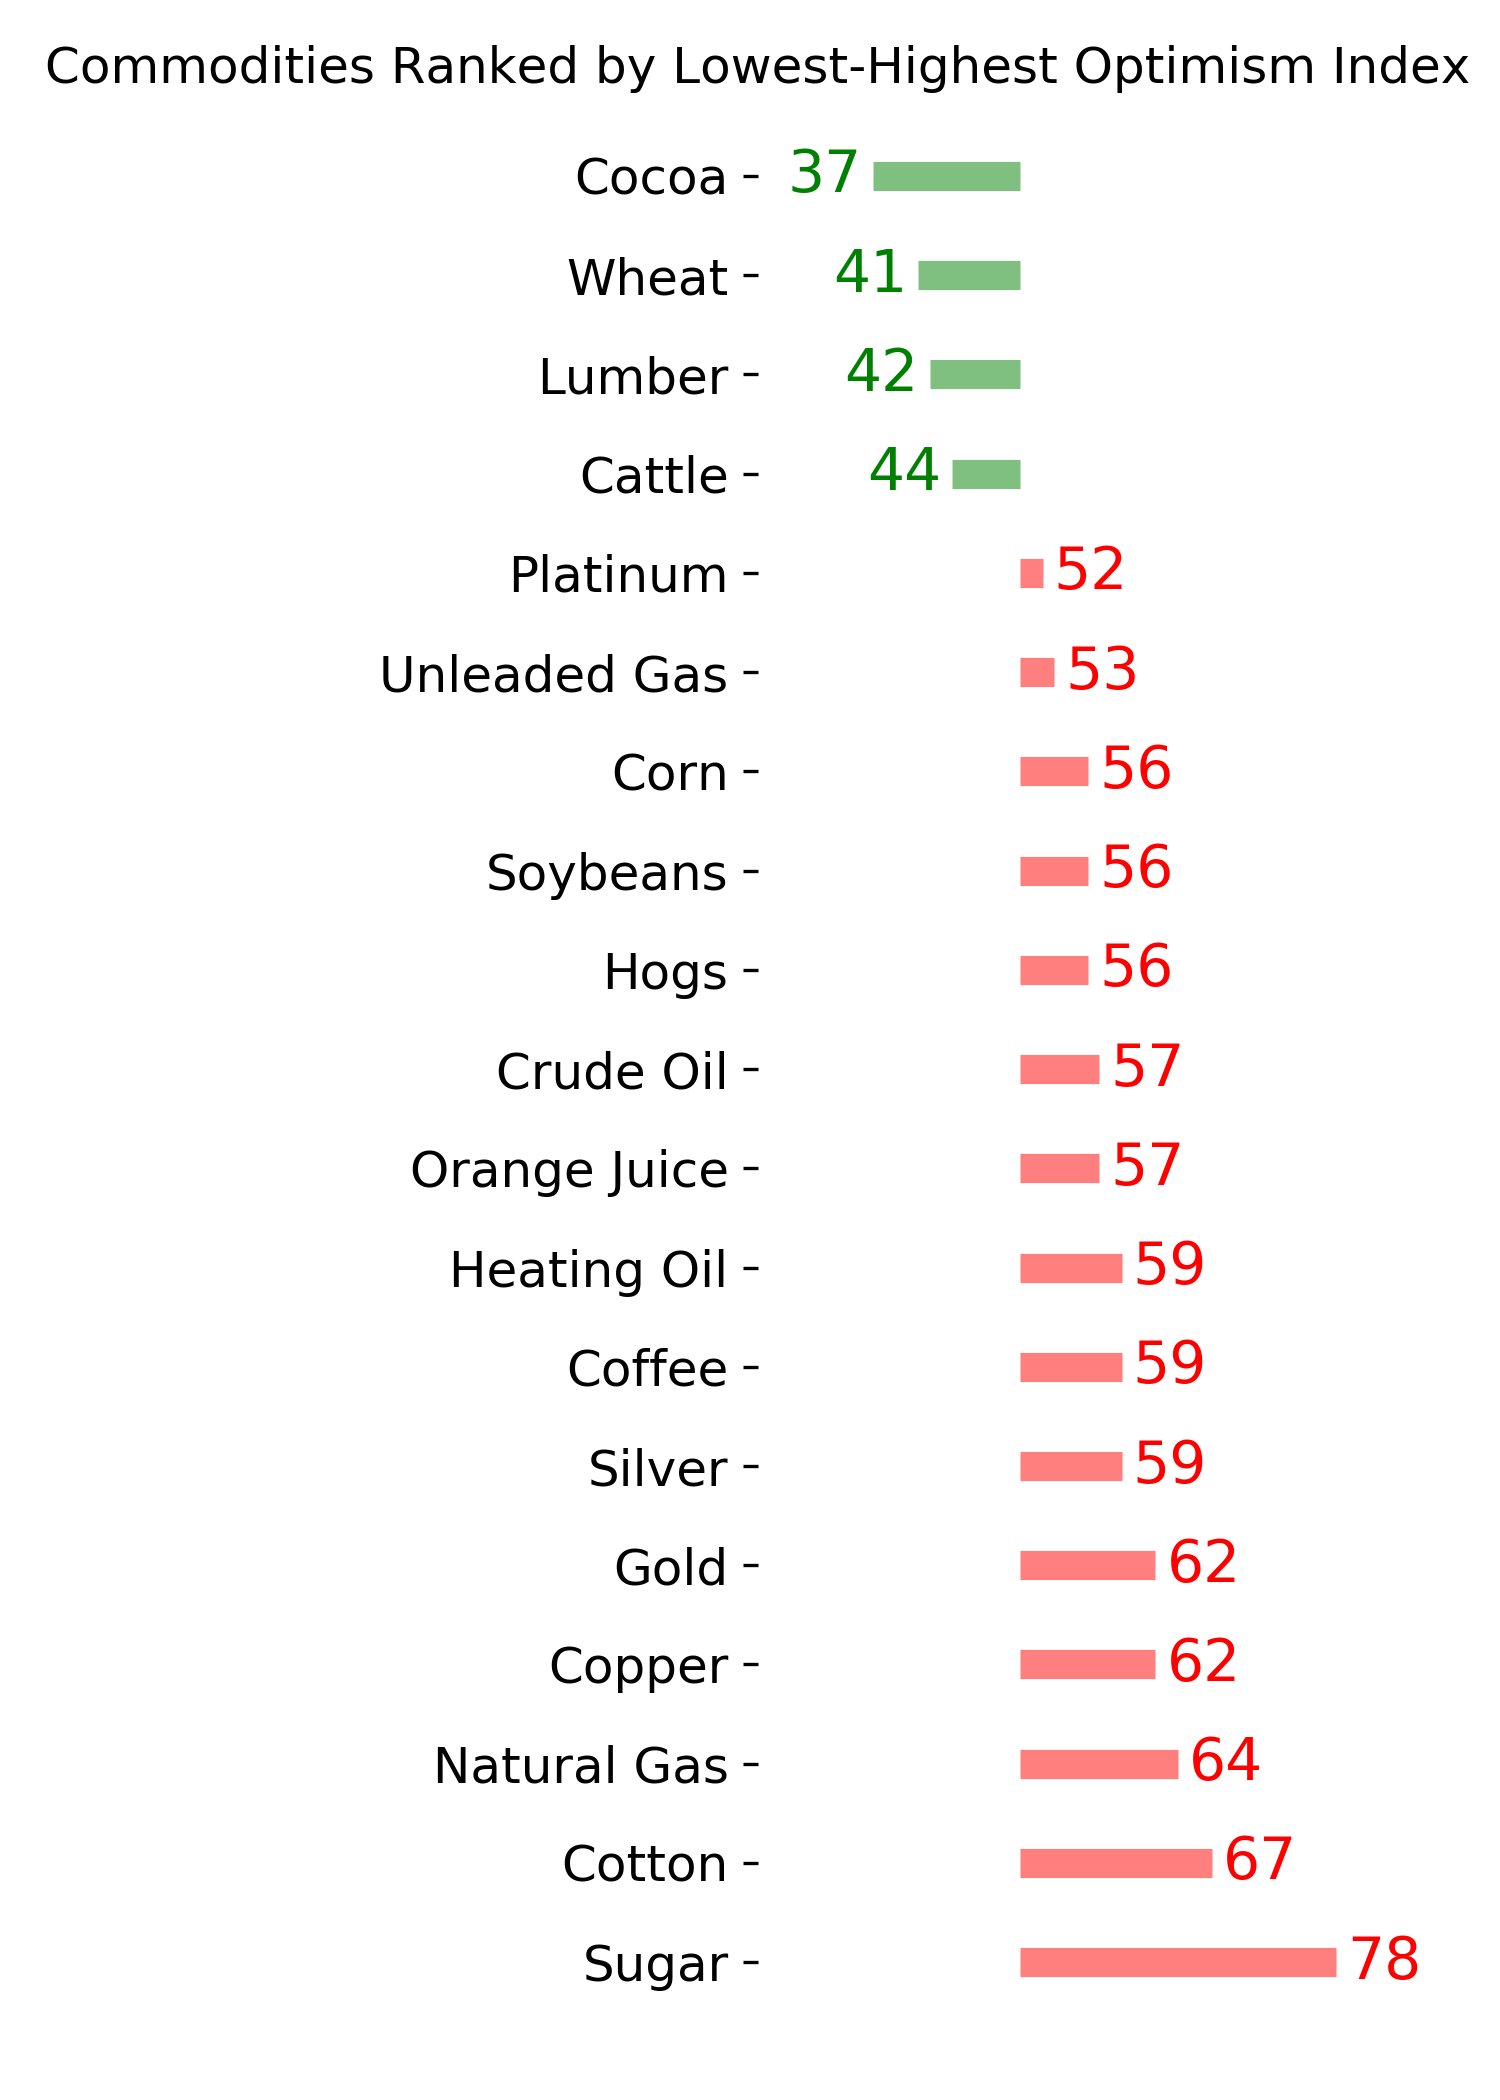
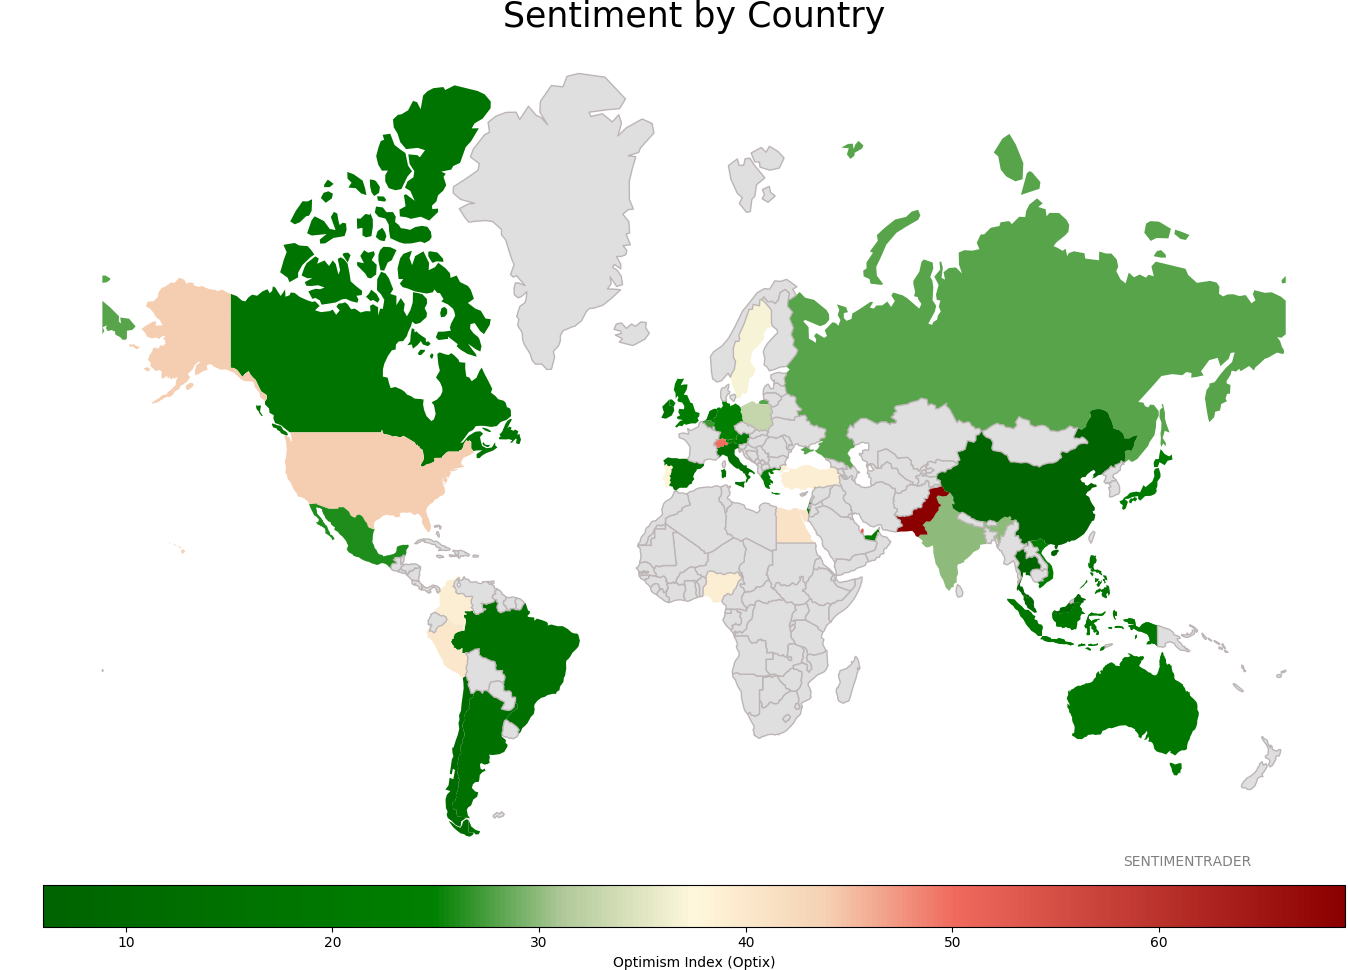
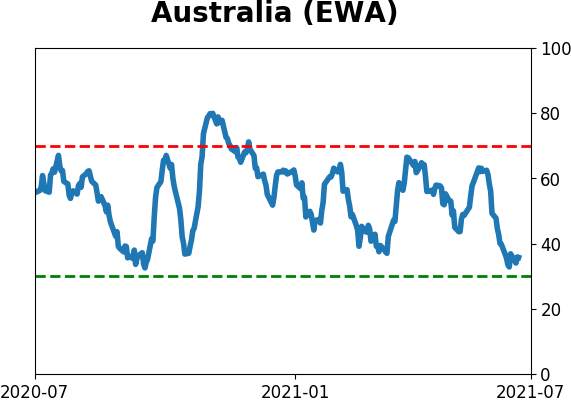
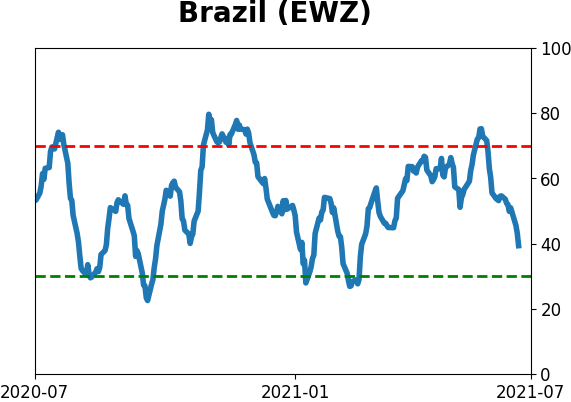
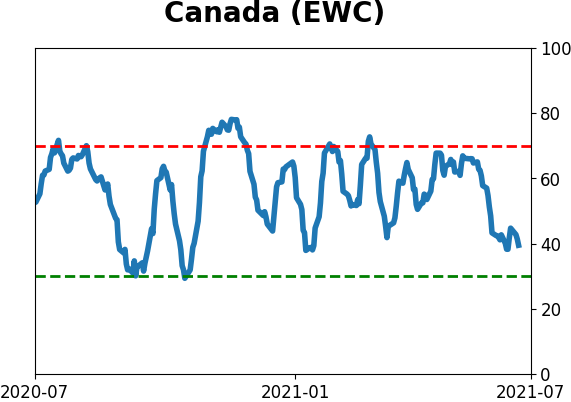
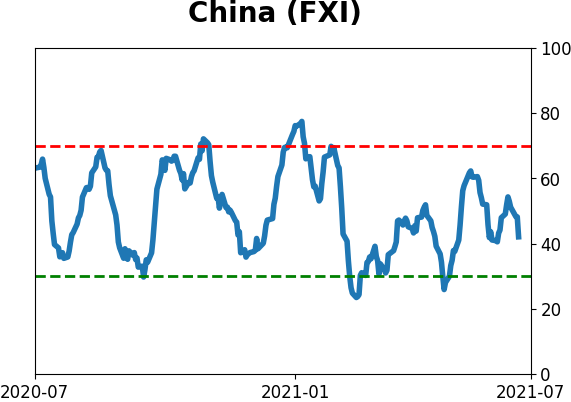
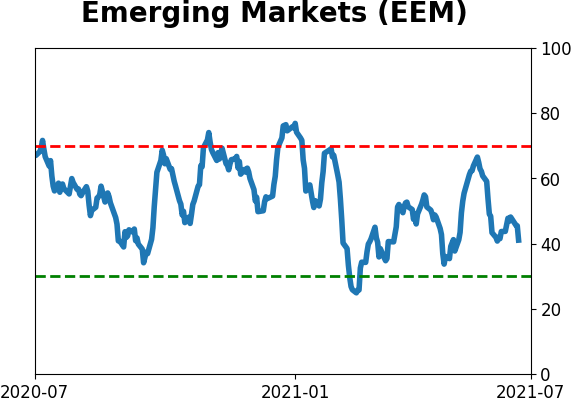
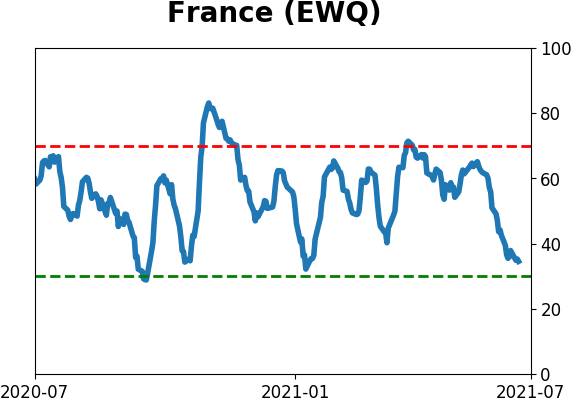
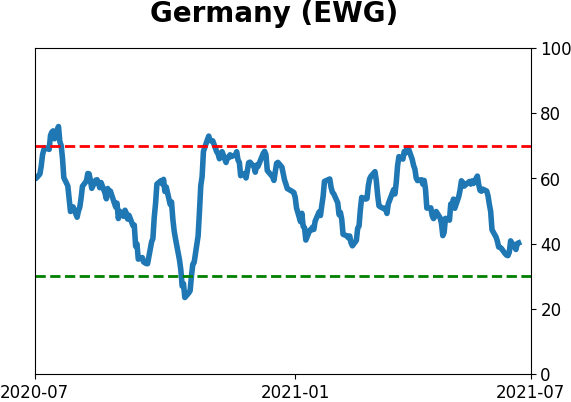
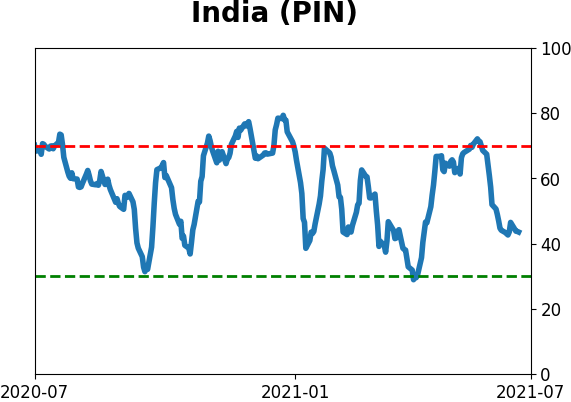
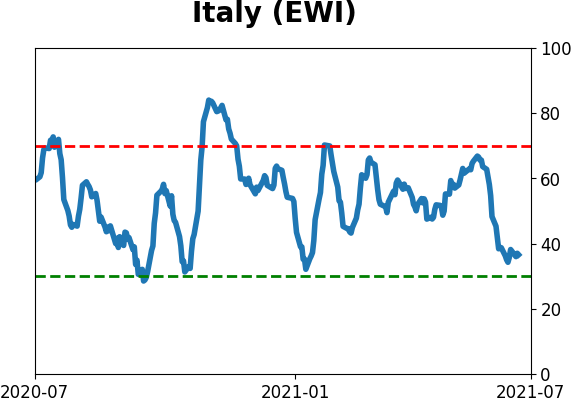
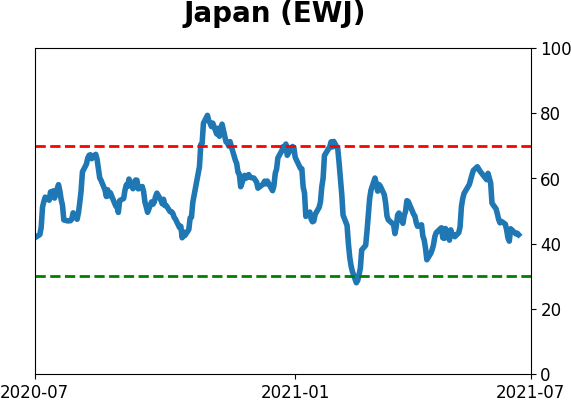
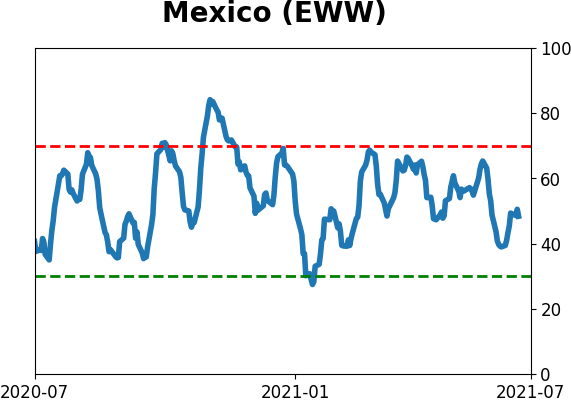
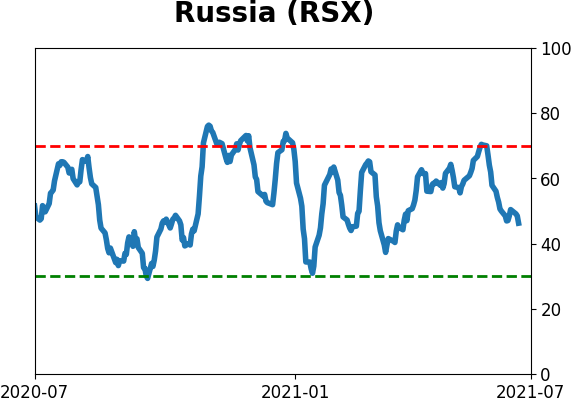
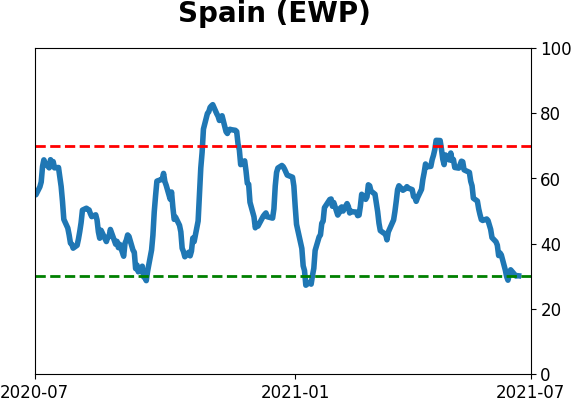
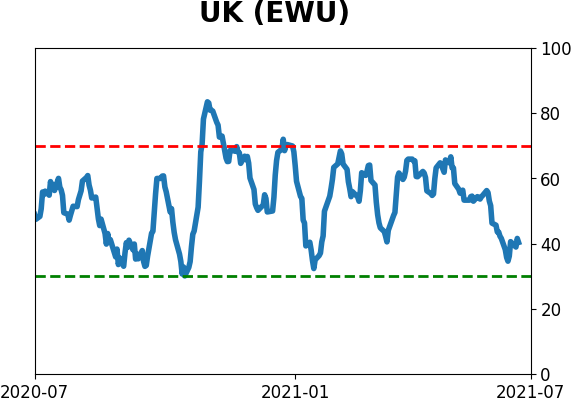
Sentiment Around The World
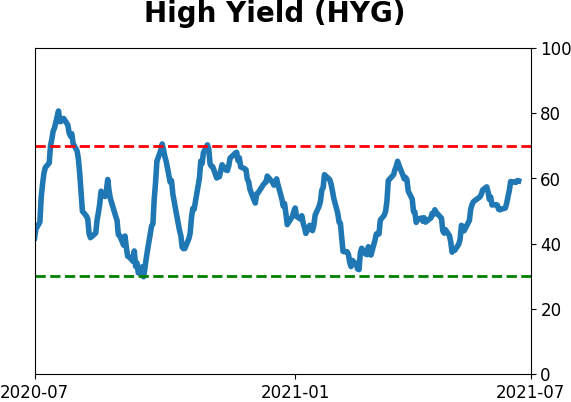
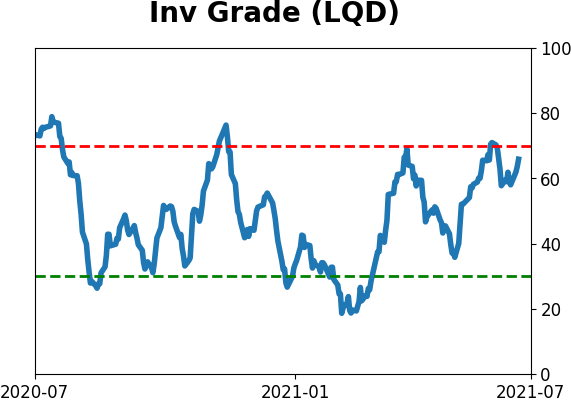
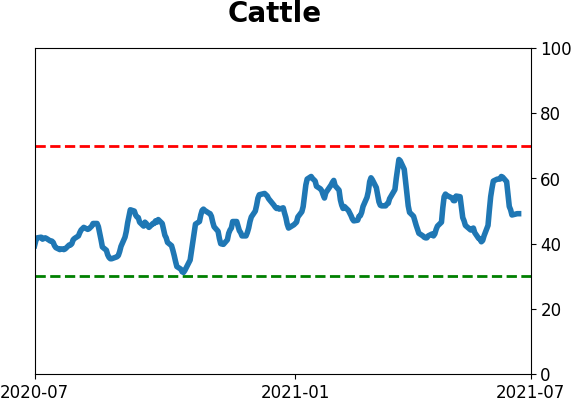
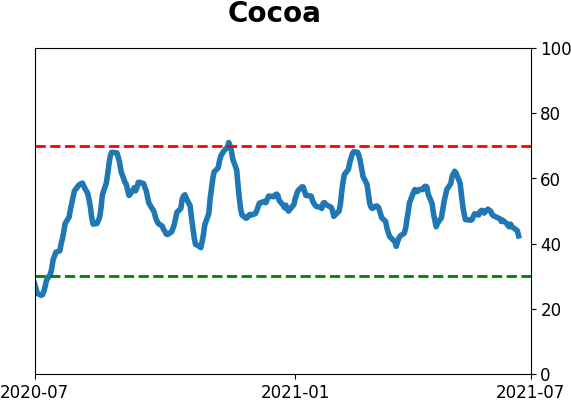
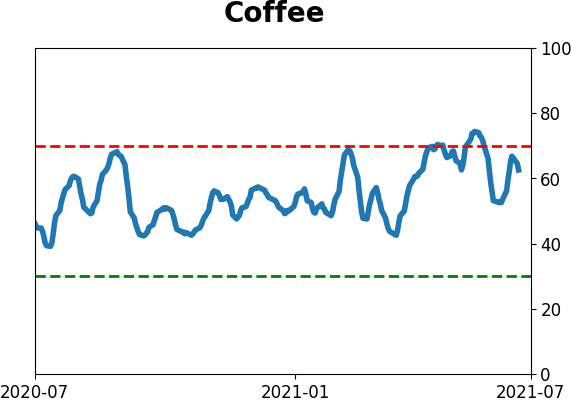
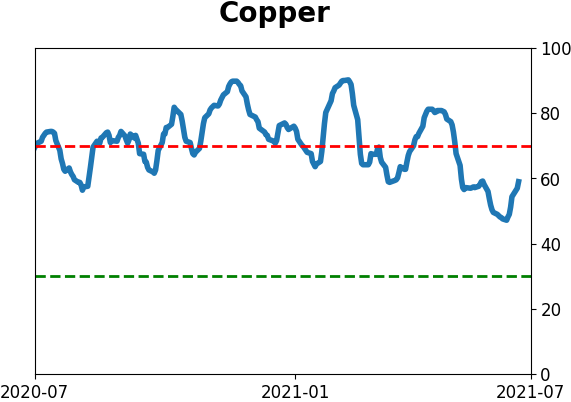
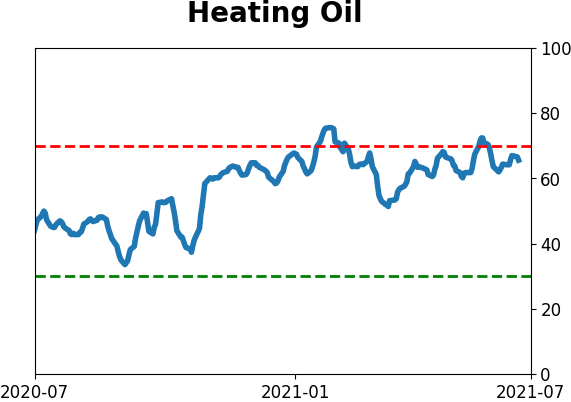
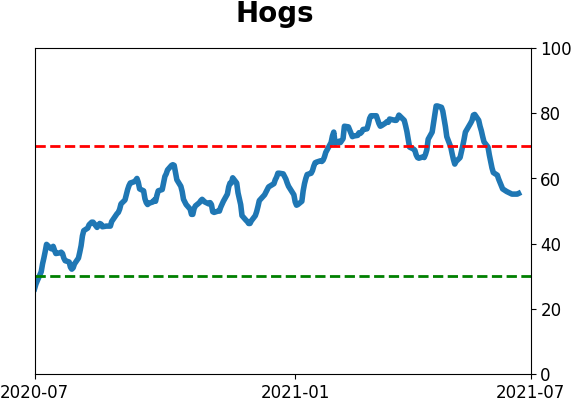
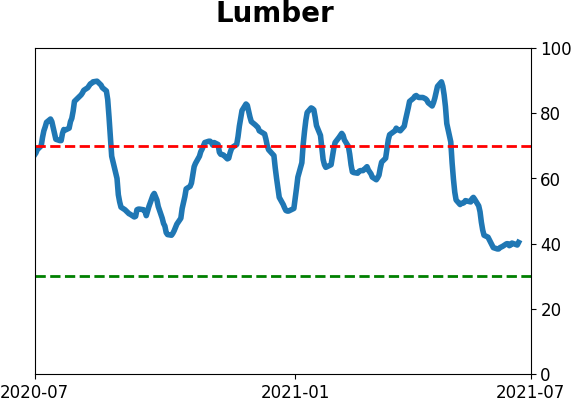
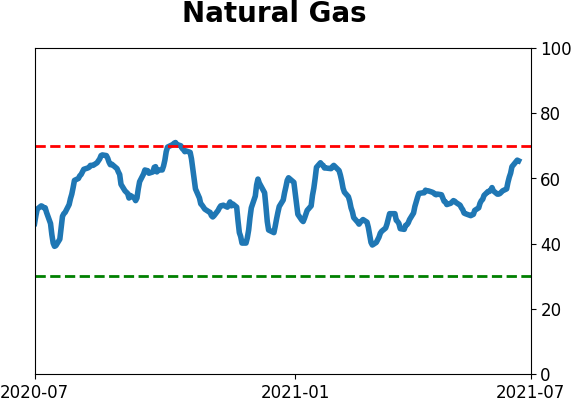
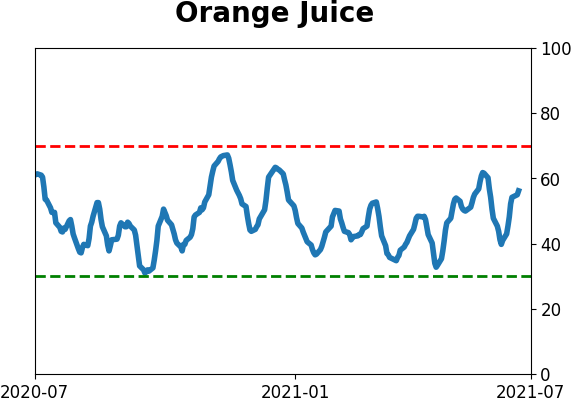
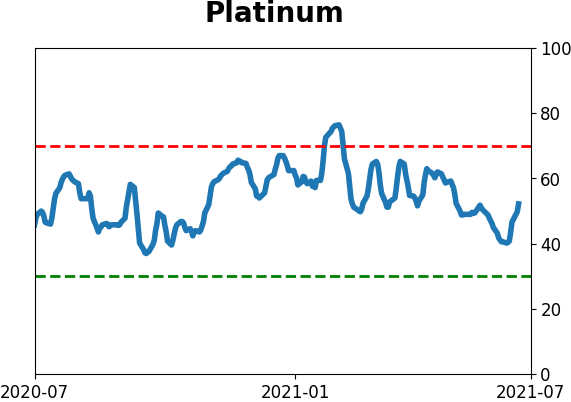
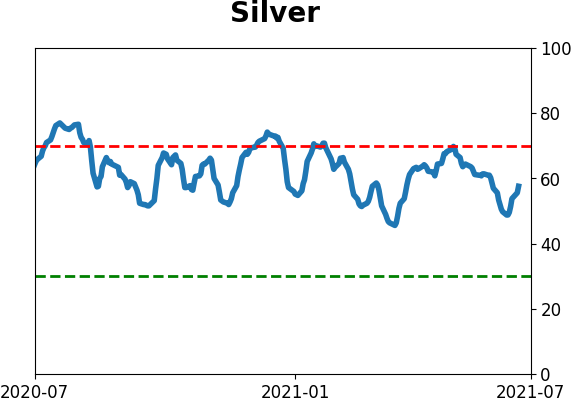
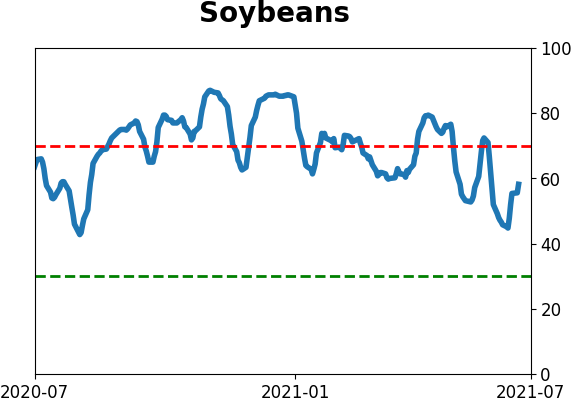
Optimism Index Thumbnails
|
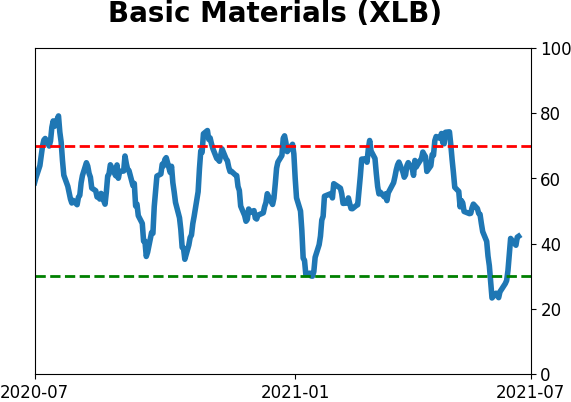
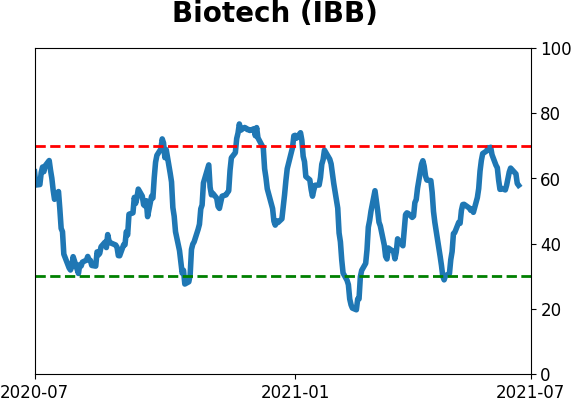
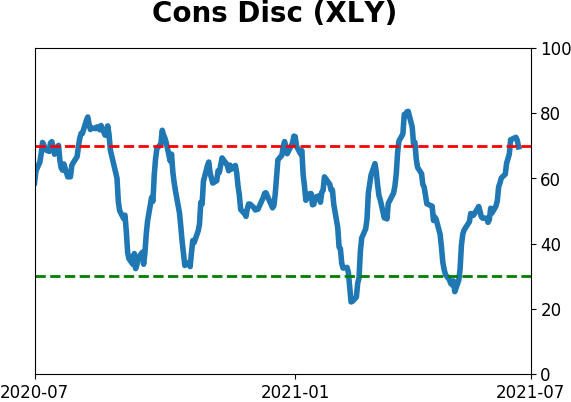
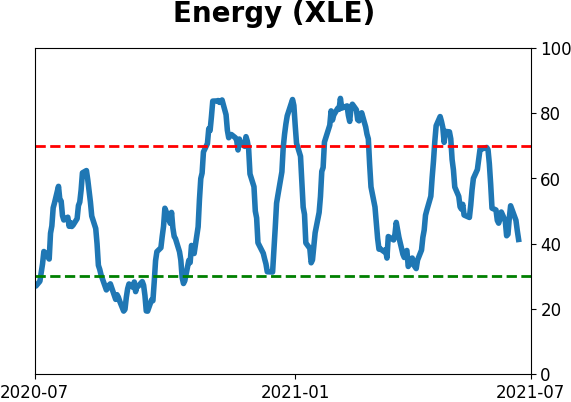
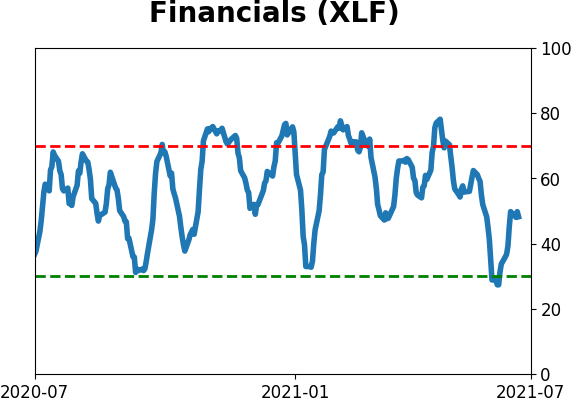
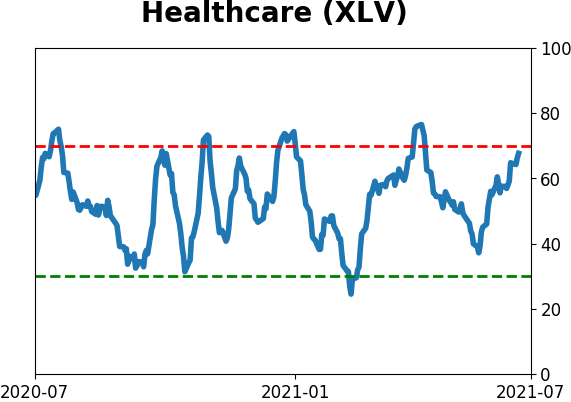
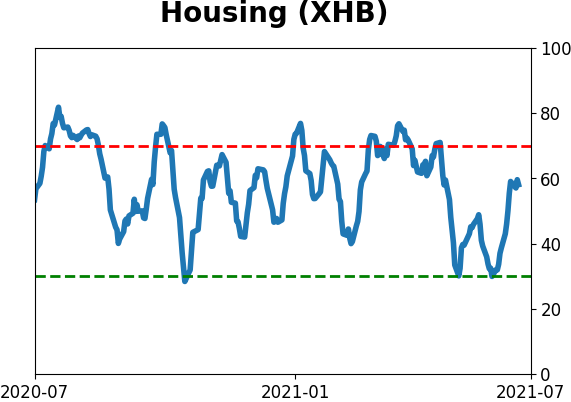
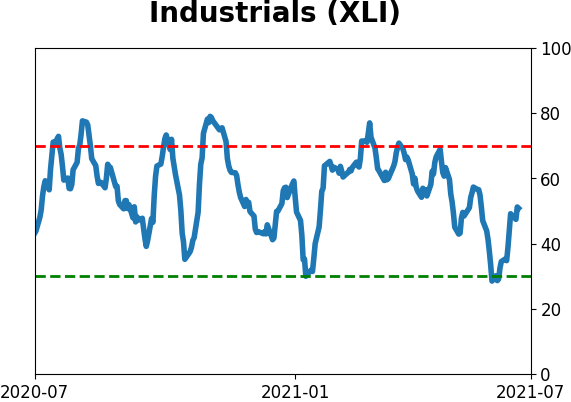
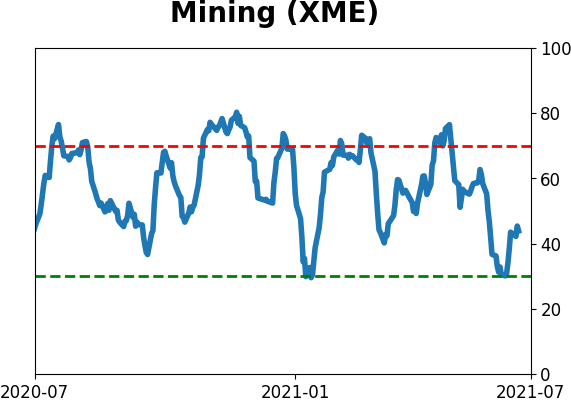
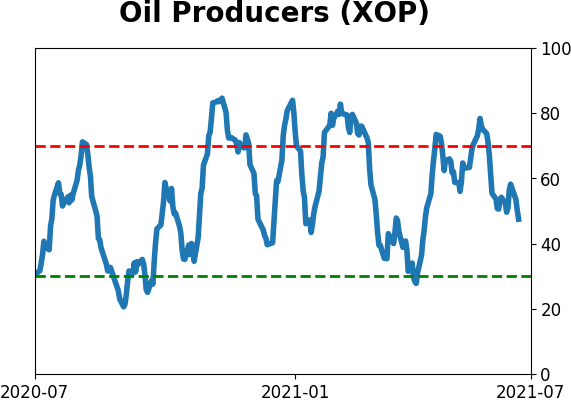
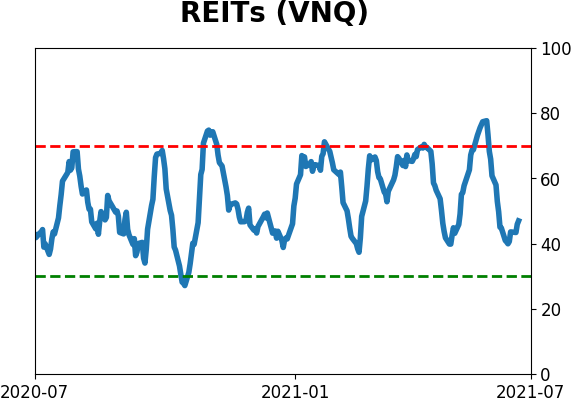
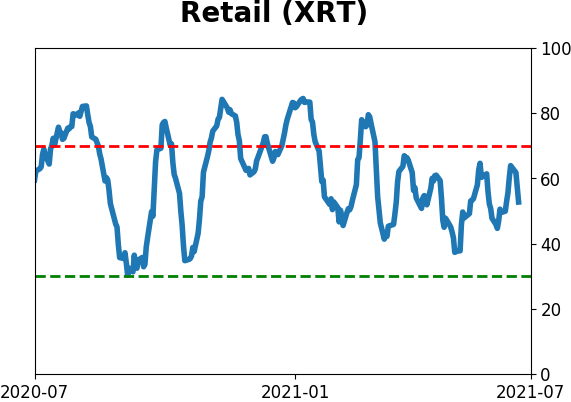
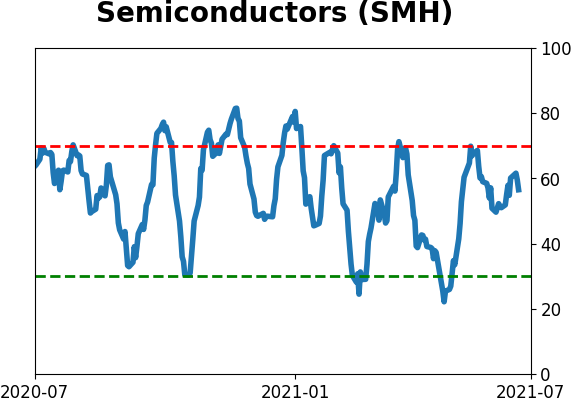
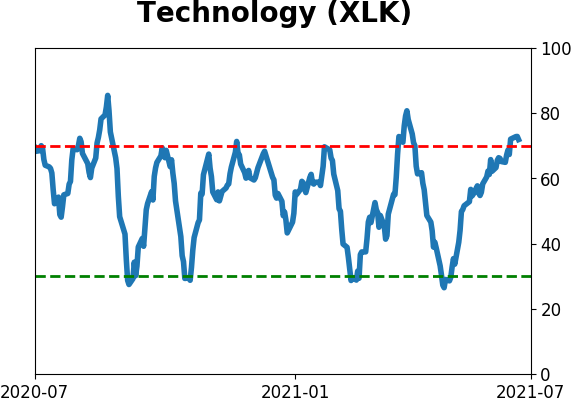
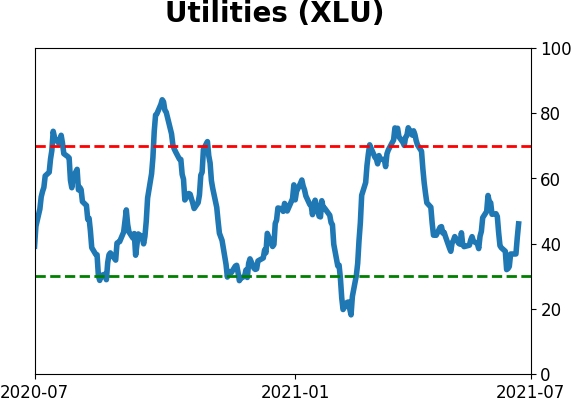
Sector ETF's - 10-Day Moving Average
|
|
|
Country ETF's - 10-Day Moving Average
|
|
|
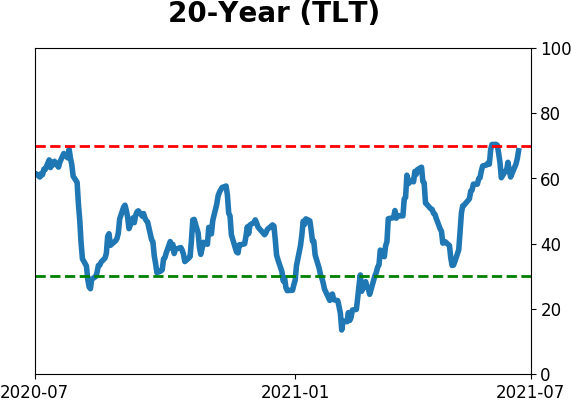
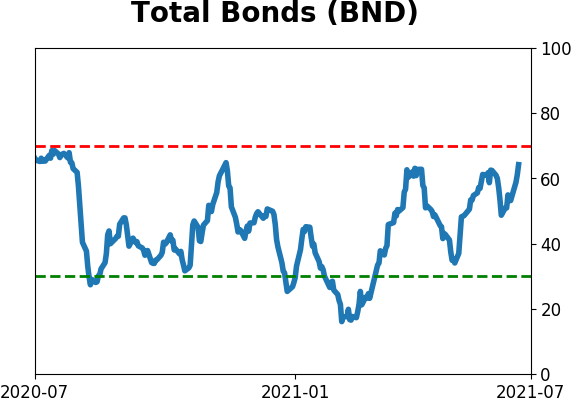
Bond ETF's - 10-Day Moving Average
|
|
|
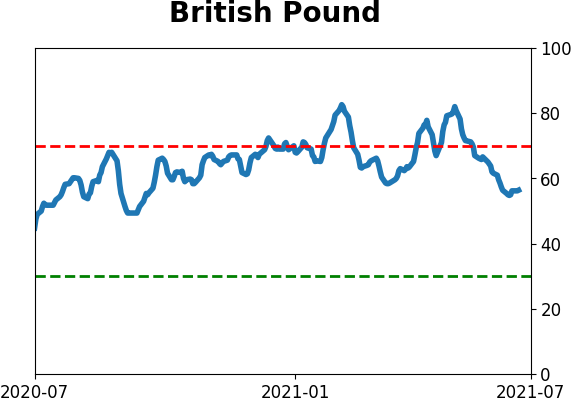
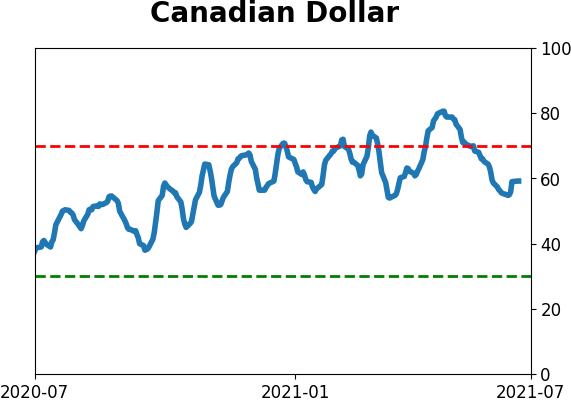
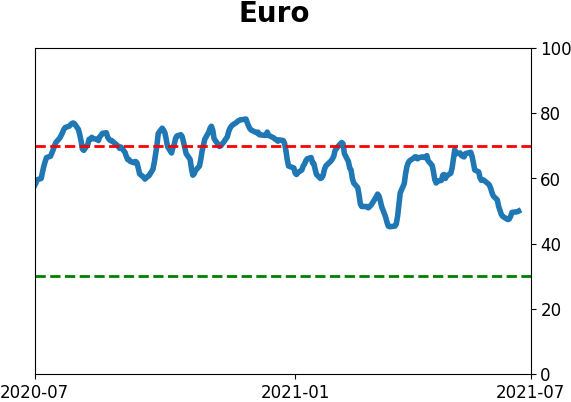
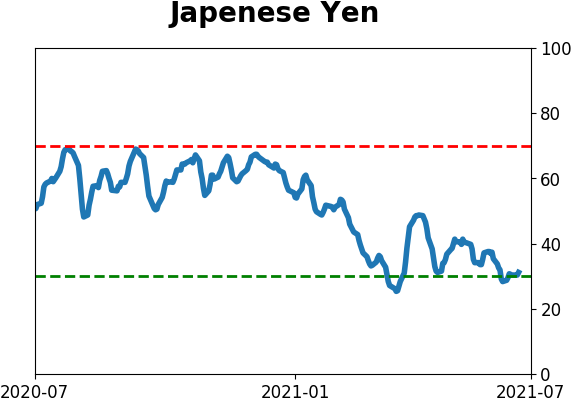
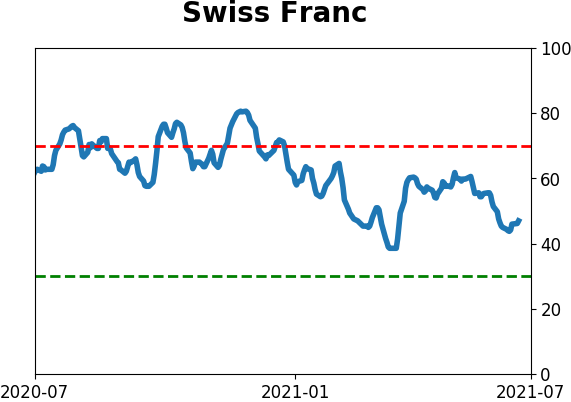
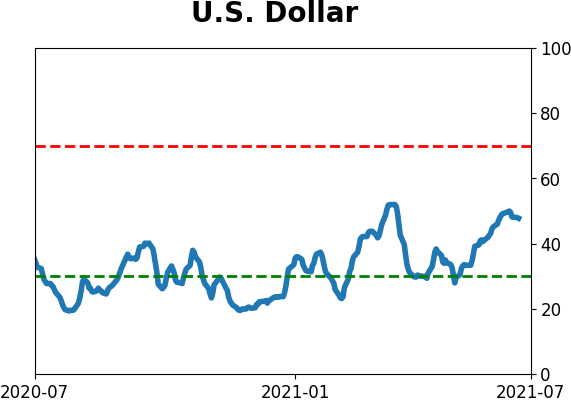
Currency ETF's - 5-Day Moving Average
|
|
|
Commodity ETF's - 5-Day Moving Average
|
|