Headlines
|
|
The Panic Button is persistently perky:
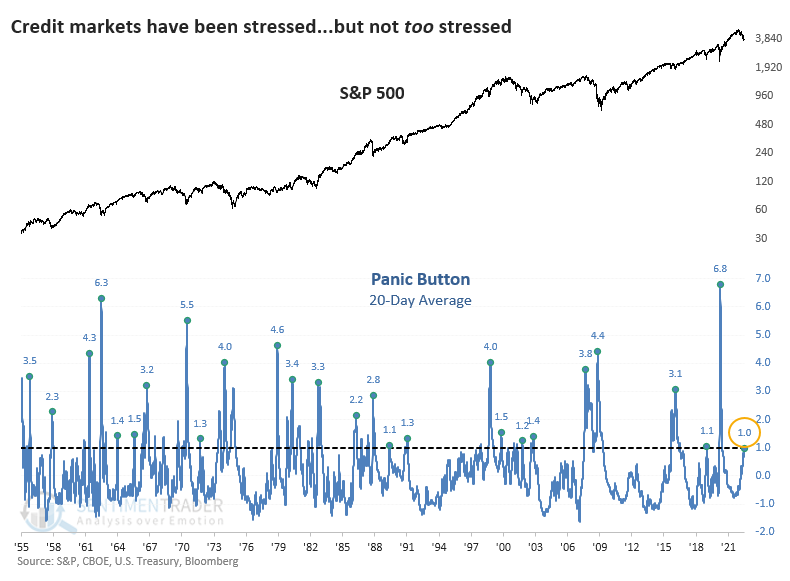
The Panic Button indicator, which monitors stress in credit markets, has stayed persistently high. But it's still not spiking above levels that have tended to occur during the "puke" phases of equity market declines. Stocks and bonds have both tended to rebound after readings this high (but not higher).
|
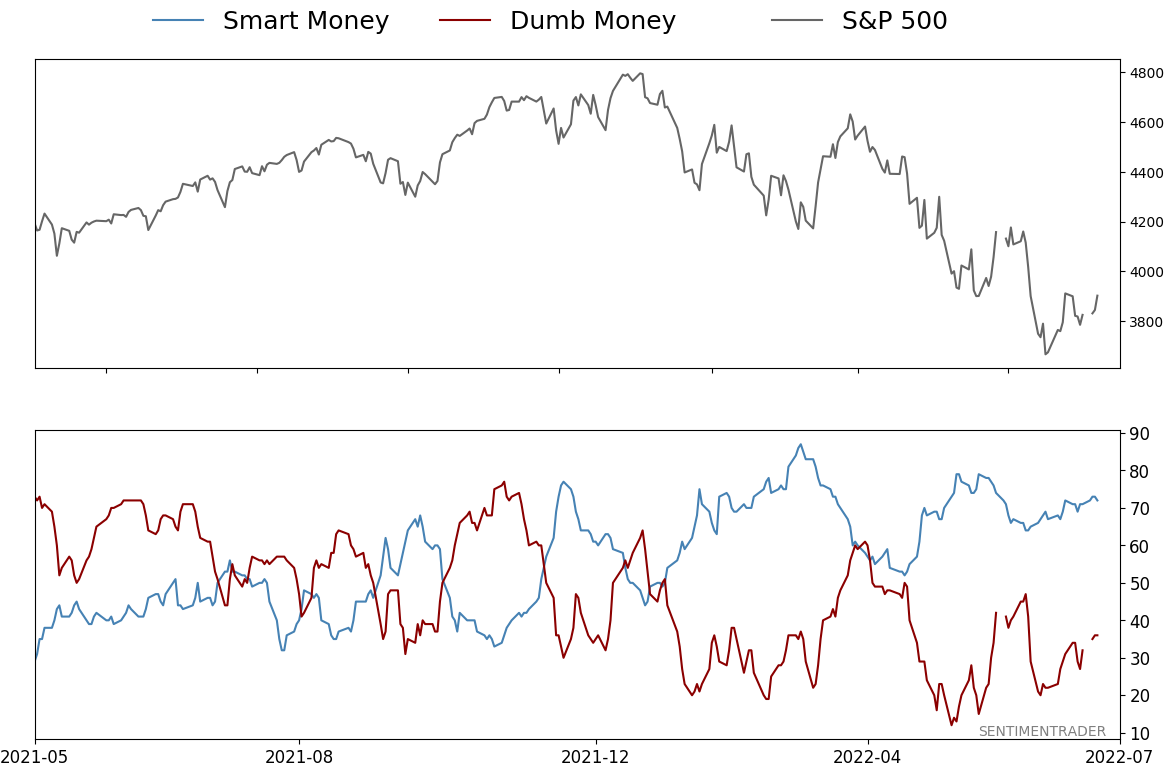
Smart / Dumb Money Confidence
|
Smart Money Confidence: 72%
Dumb Money Confidence: 36%
|
|
Risk Levels
Stocks Short-Term
|
Stocks Medium-Term
|
|
Bonds
|
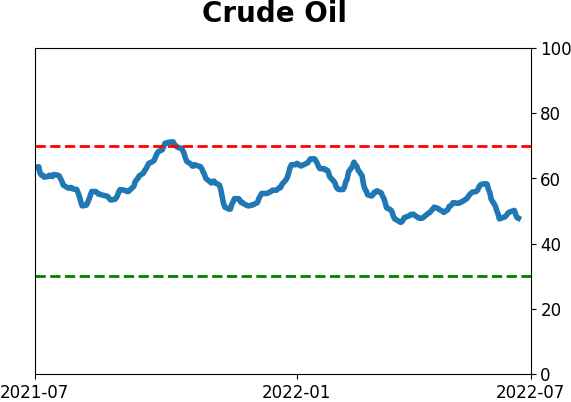
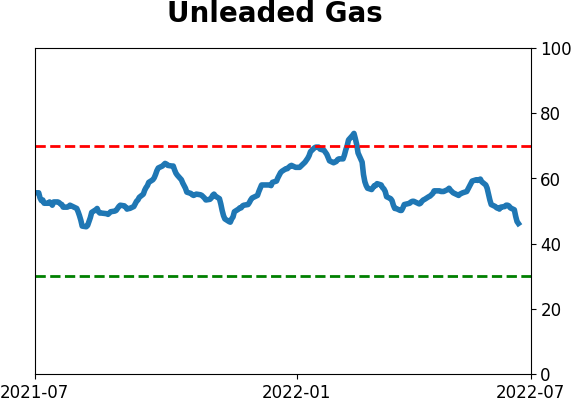
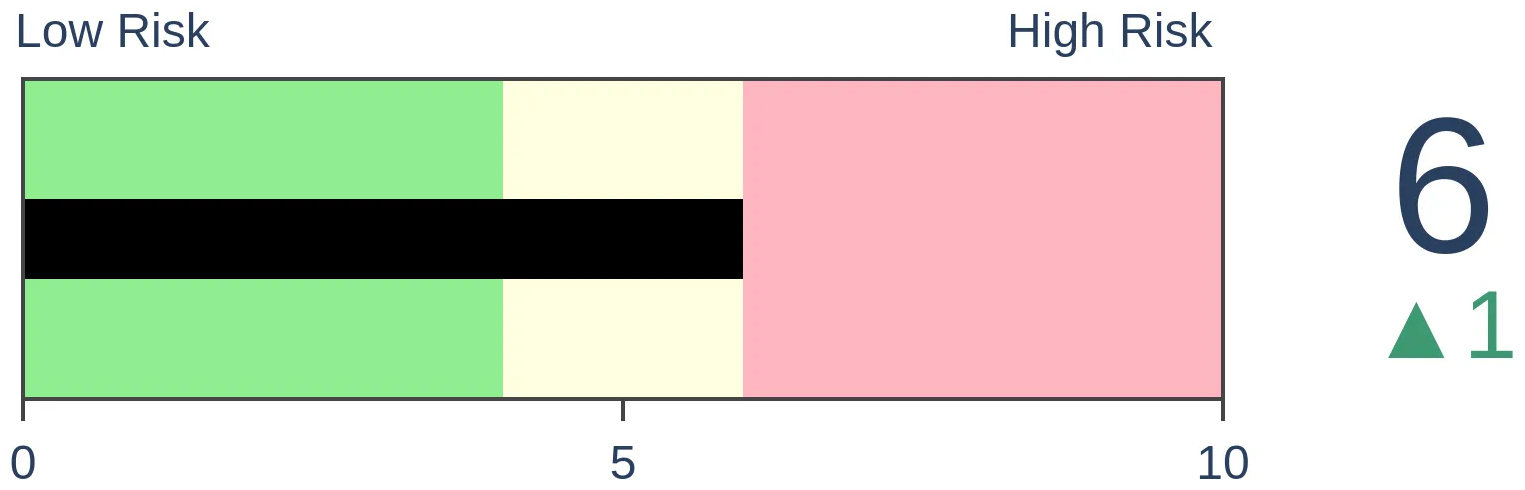
Crude Oil
|
|
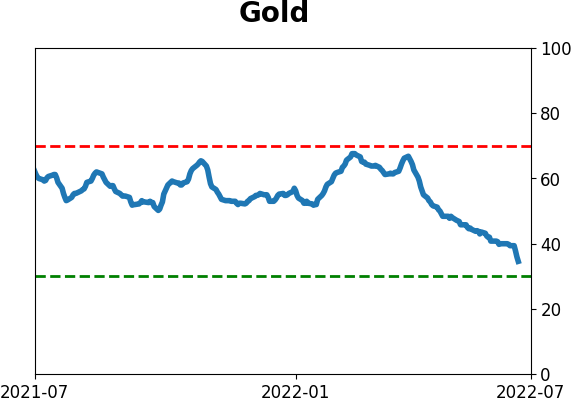
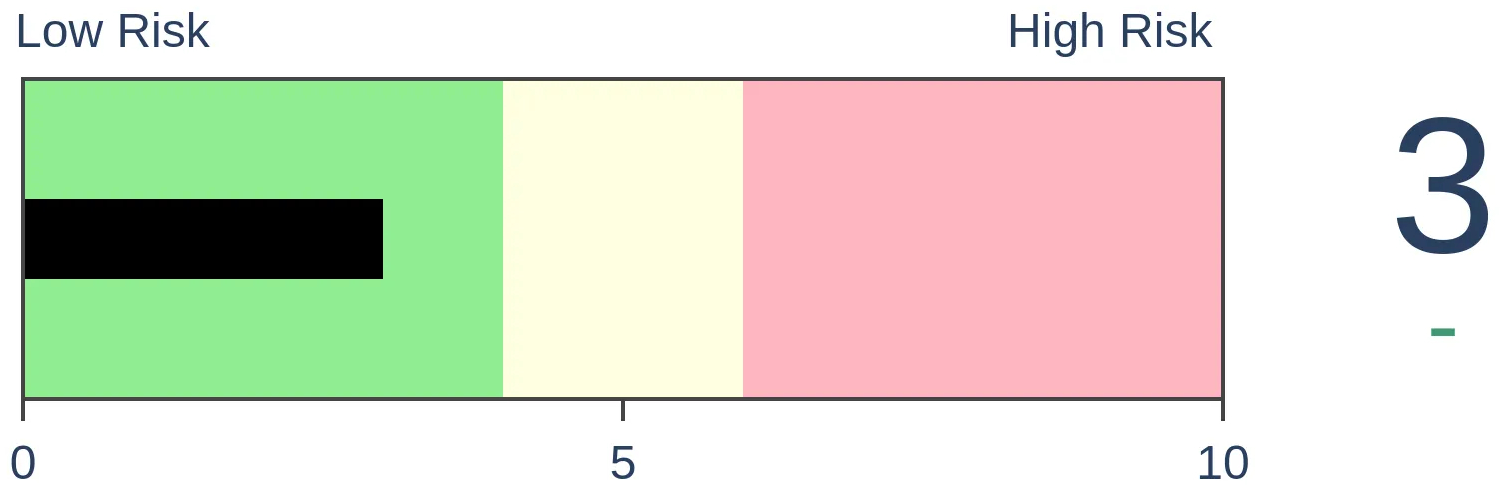
Gold

|
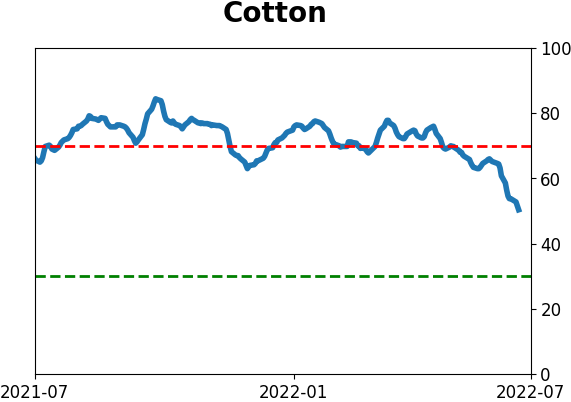
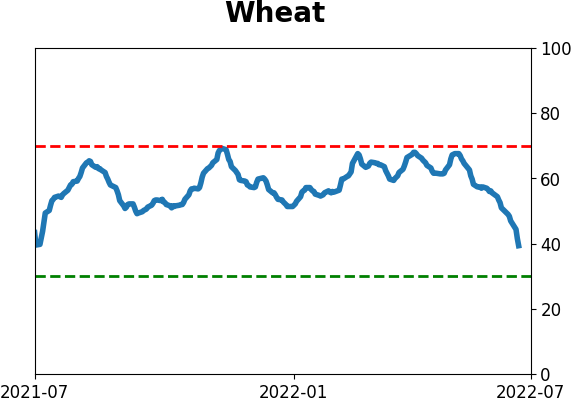
Agriculture
|
|
Research
By Jason Goepfert
BOTTOM LINE
The Panic Button indicator, which monitors stress in credit markets, has stayed persistently high. But it's still not spiking above levels that have tended to occur during the "puke" phases of equity market declines. Stocks and bonds have both tended to rebound after readings this high (but not higher).
FORECAST / TIMEFRAME
None
|
Key points:
- A model of stress in credit markets has stayed high but is not moving above the "panic" threshold
- The 20-day average of the model has glided above 1.0, which has coincided with mature declines
- Stocks and bonds have had a strong tendency to rebound after such persistently high readings
The Panic Button is still high but not spiking
In May, we updated the Panic Button indicator, which monitors the credit markets for signs of systemic stress. At the time, it was high, which tends to be a modestly good sign...as long as it doesn't get much higher.
As a reminder, the indicator incorporates:
- The TED Spread
- High-yield bond spreads
- A ratio of volatility to 3-month Treasury bill yields
- High-yield CDS spreads
These indicators tend to spike higher when uncertainty about the economy, corporate outlooks, and stock prices are high. They reach extreme levels only during times of outright panic across markets.
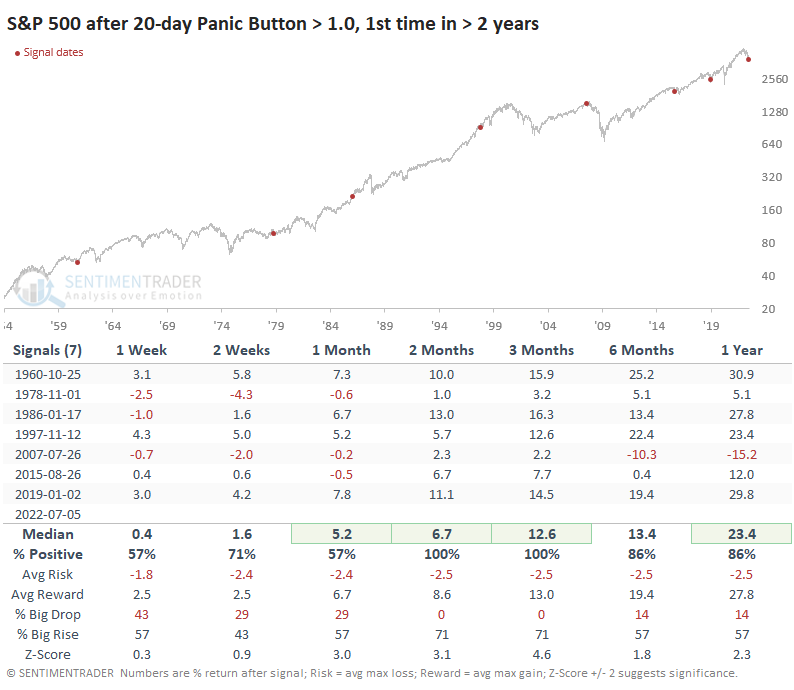
With some spreads continuing to widen, it's a good time to revisit the Panic Button. Surprisingly, it still hasn't jumped above 1.5, which is when things tend to get hairy. The highest it got was 1.28 on June 30. Still, it has been relatively high for weeks, so the 20-day average has now climbed above 1.0 for the first time in two years.
It would make sense to expect investors to freak out once these indicators show real stress for the first time in years. Memories tend to be short, recency bias is a real issue, and people like to sell first and ask questions later.
Forward returns tend to be well above average
Looking at the handful of precedents, investors didn't panic at these signs of modest but persistent stresses in credit. Over the next 2-3 months, the S&P 500 managed to show a positive return every time, with an impressive risk/reward ratio.
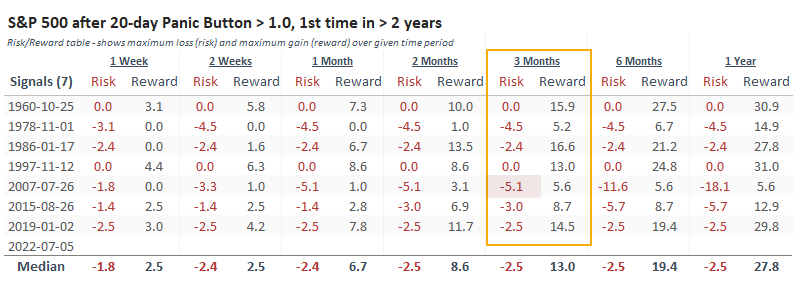
The Risk/Reward Table shows that within the next three months, every signal rallied at least +5% at some point, but only one lost more than -5% (and that was just barely, at -5.1%). There was still some major trouble on the horizon in 2008, and the medium-term rally fizzled miserably, but the others held up.
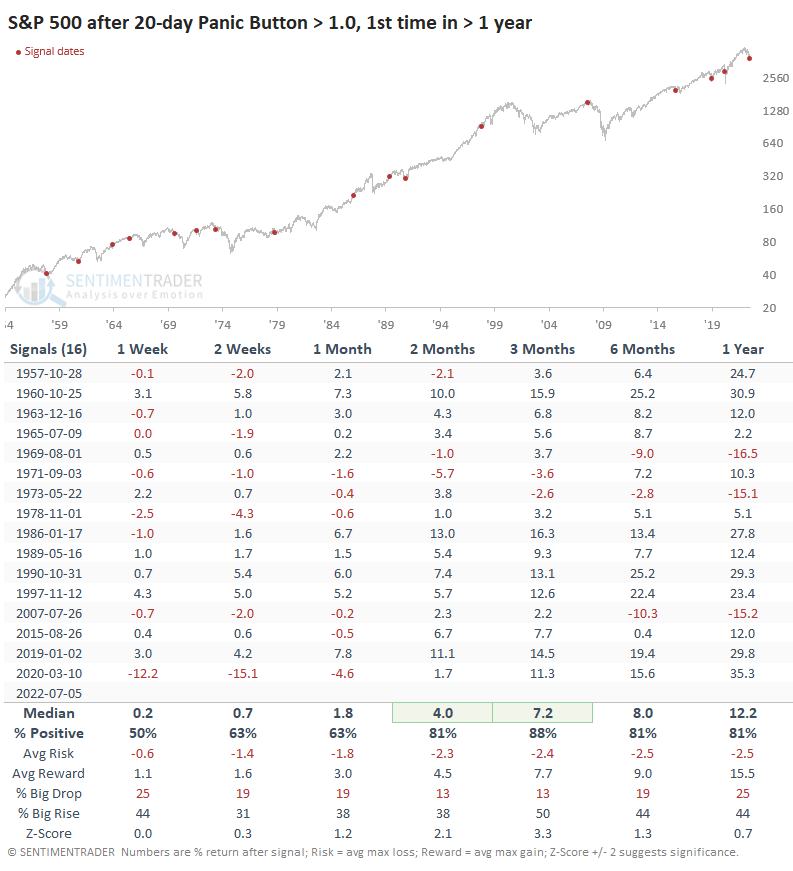
As always, it's harder to rely on precedents the smaller the sample size, so if we relax the parameters to the first 20-day reading above 1.0 in one year (instead of two years), returns dipped a bit. Even so, the next two months tended to be more positive than we saw from the one in May because these use a 20-day average, so the declines were more mature and more likely to reverse.
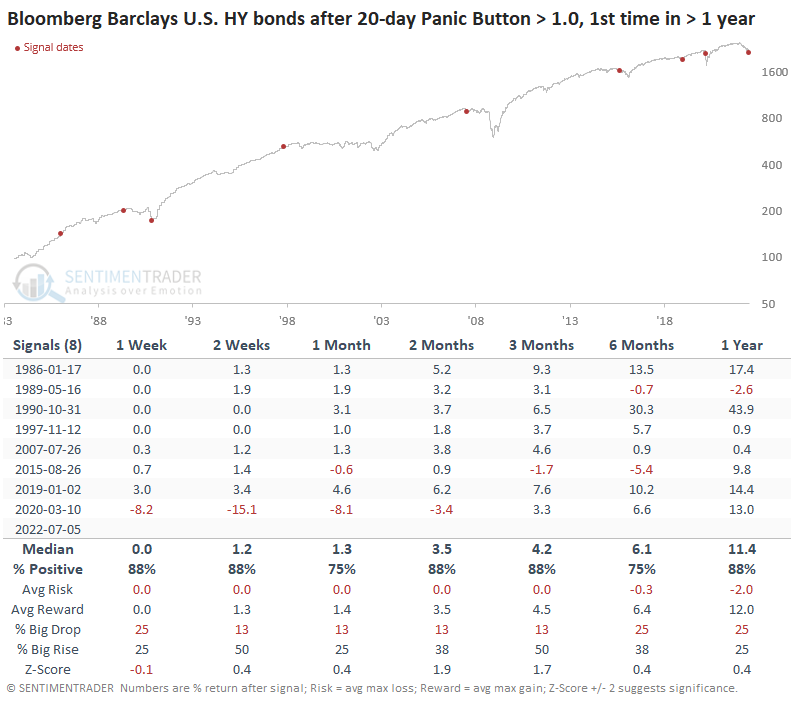
Bonds - especially high-yield ones - tended to rally
Since the inception of Bloomberg Barclays U.S. Aggregate Bond Total Return data, these signals preceded gains every time. This is with the usual caveat that bonds have had a 40-year tailwind.
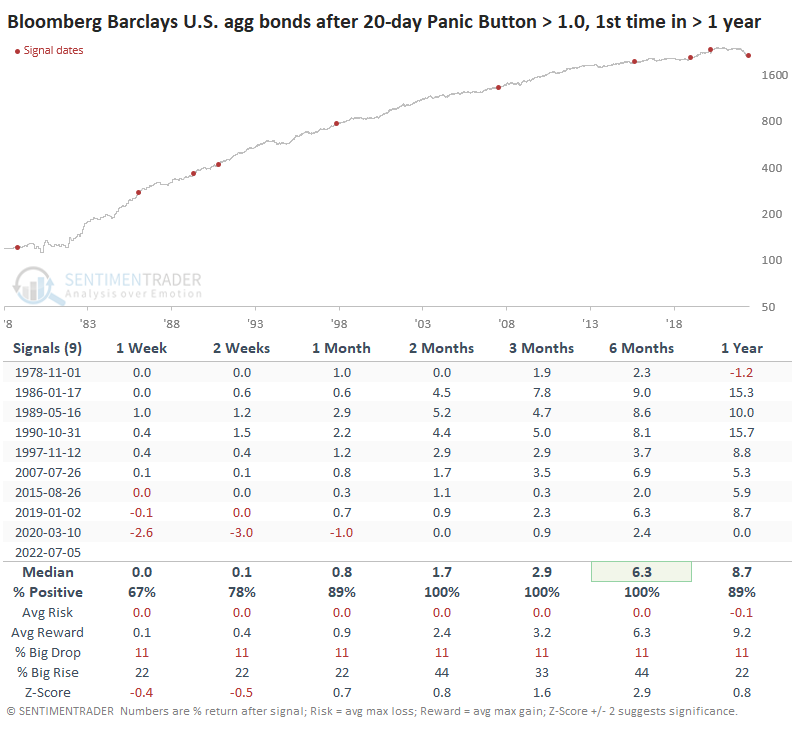
High-yield bonds were more volatile, but that also meant higher returns on average.
What the research tells us...
Equity investors do not want to see risk aversion hit the credit markets. And they certainly don't want to see panic because that will quickly translate to the stocks in the form of heavy institutional selling pressure. So far, the issues in credit have been isolated, and the widening of spreads has been steady. If it gets jumpy, and we days with massive widening, you can be sure it will coincide with a puke in stocks. Right now, we're in an area that has meant investors are concerned but within reason. That's a good sign from a contrary point of view. It just needs to stay tame.
Indicators at Extremes
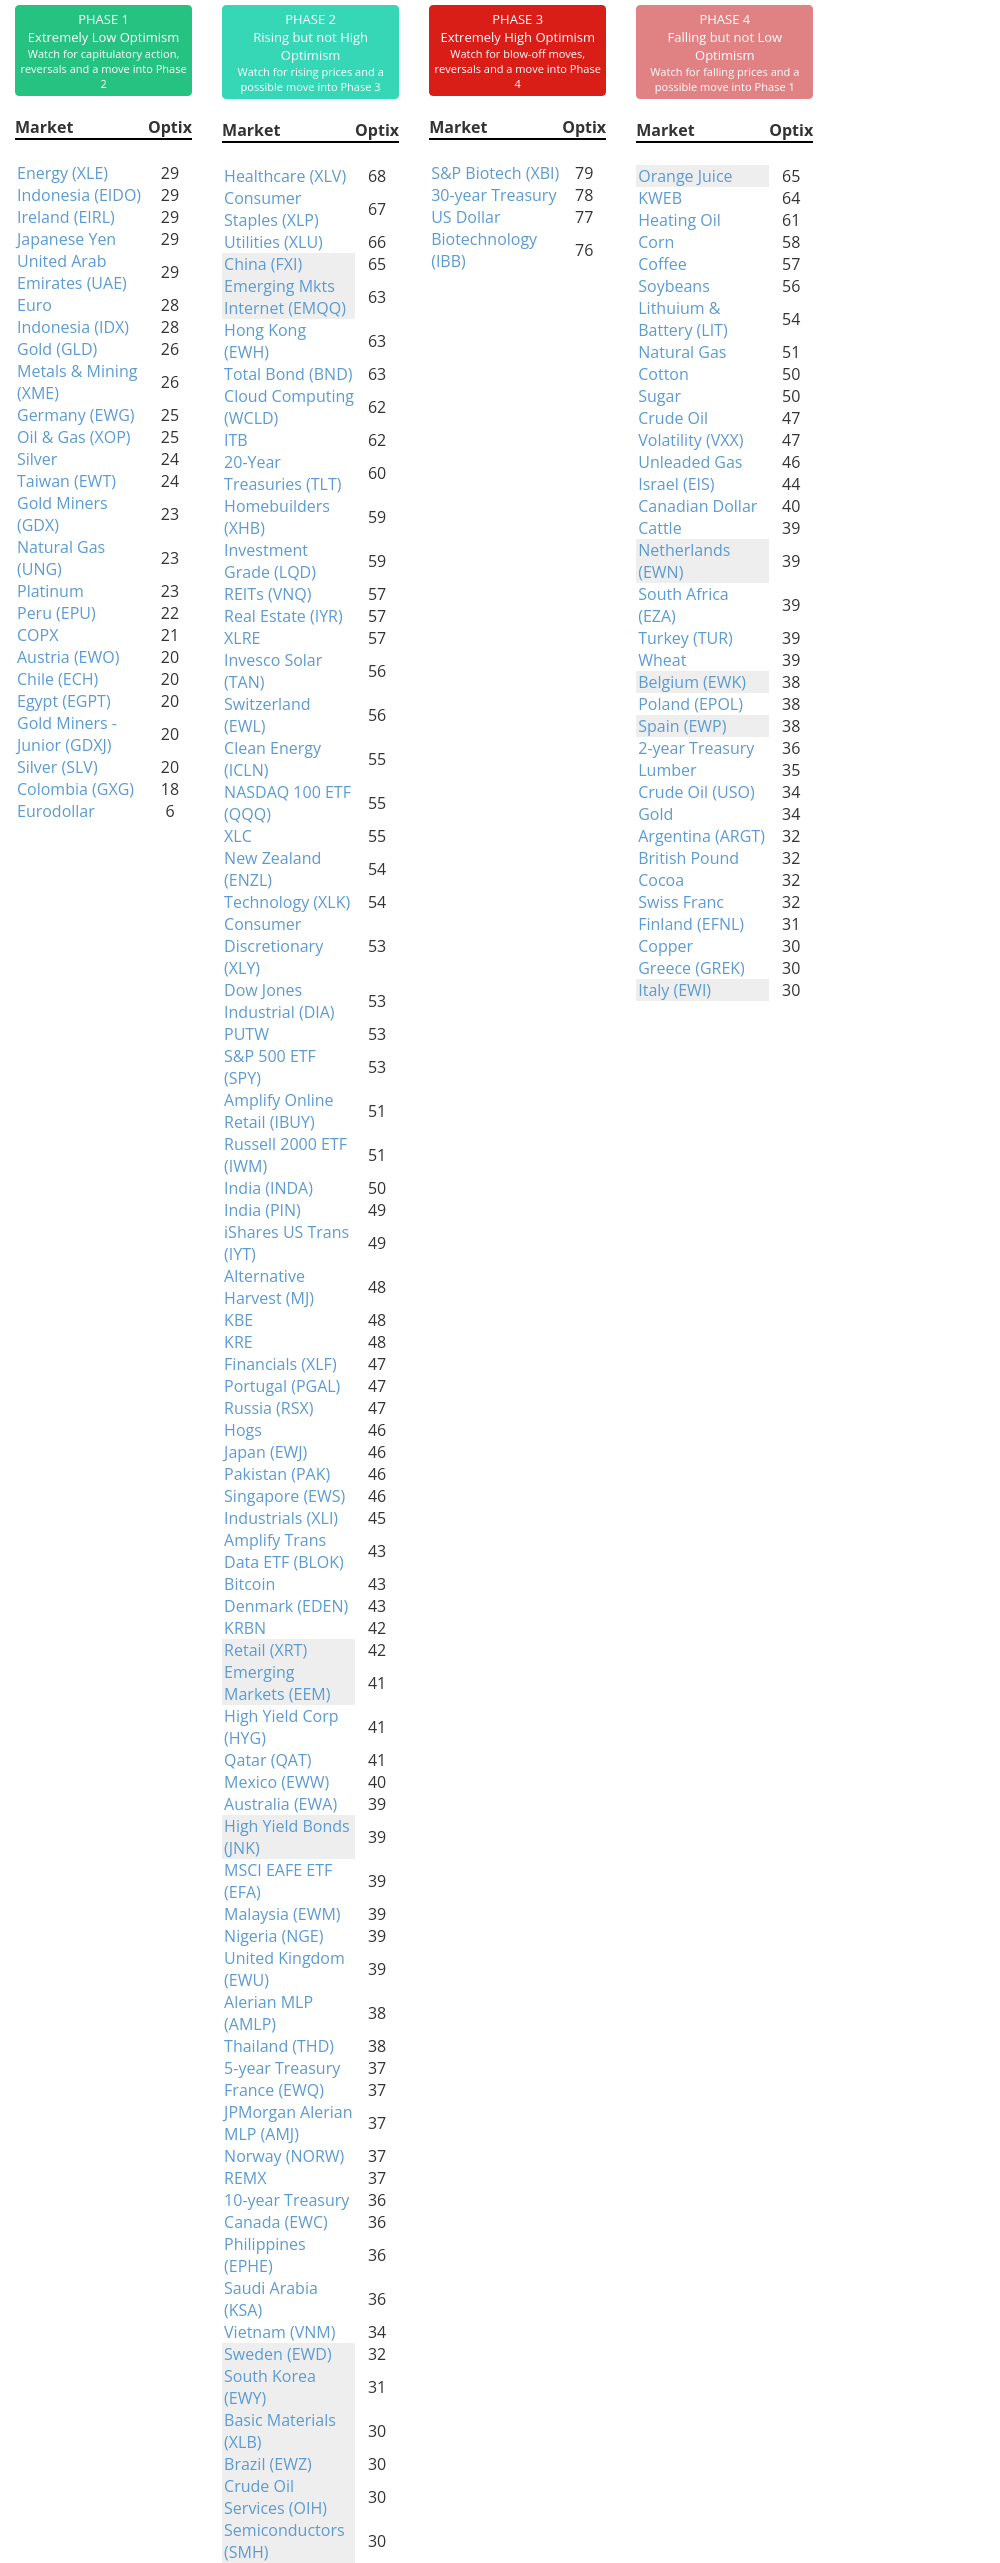
Phase Table
Ranks
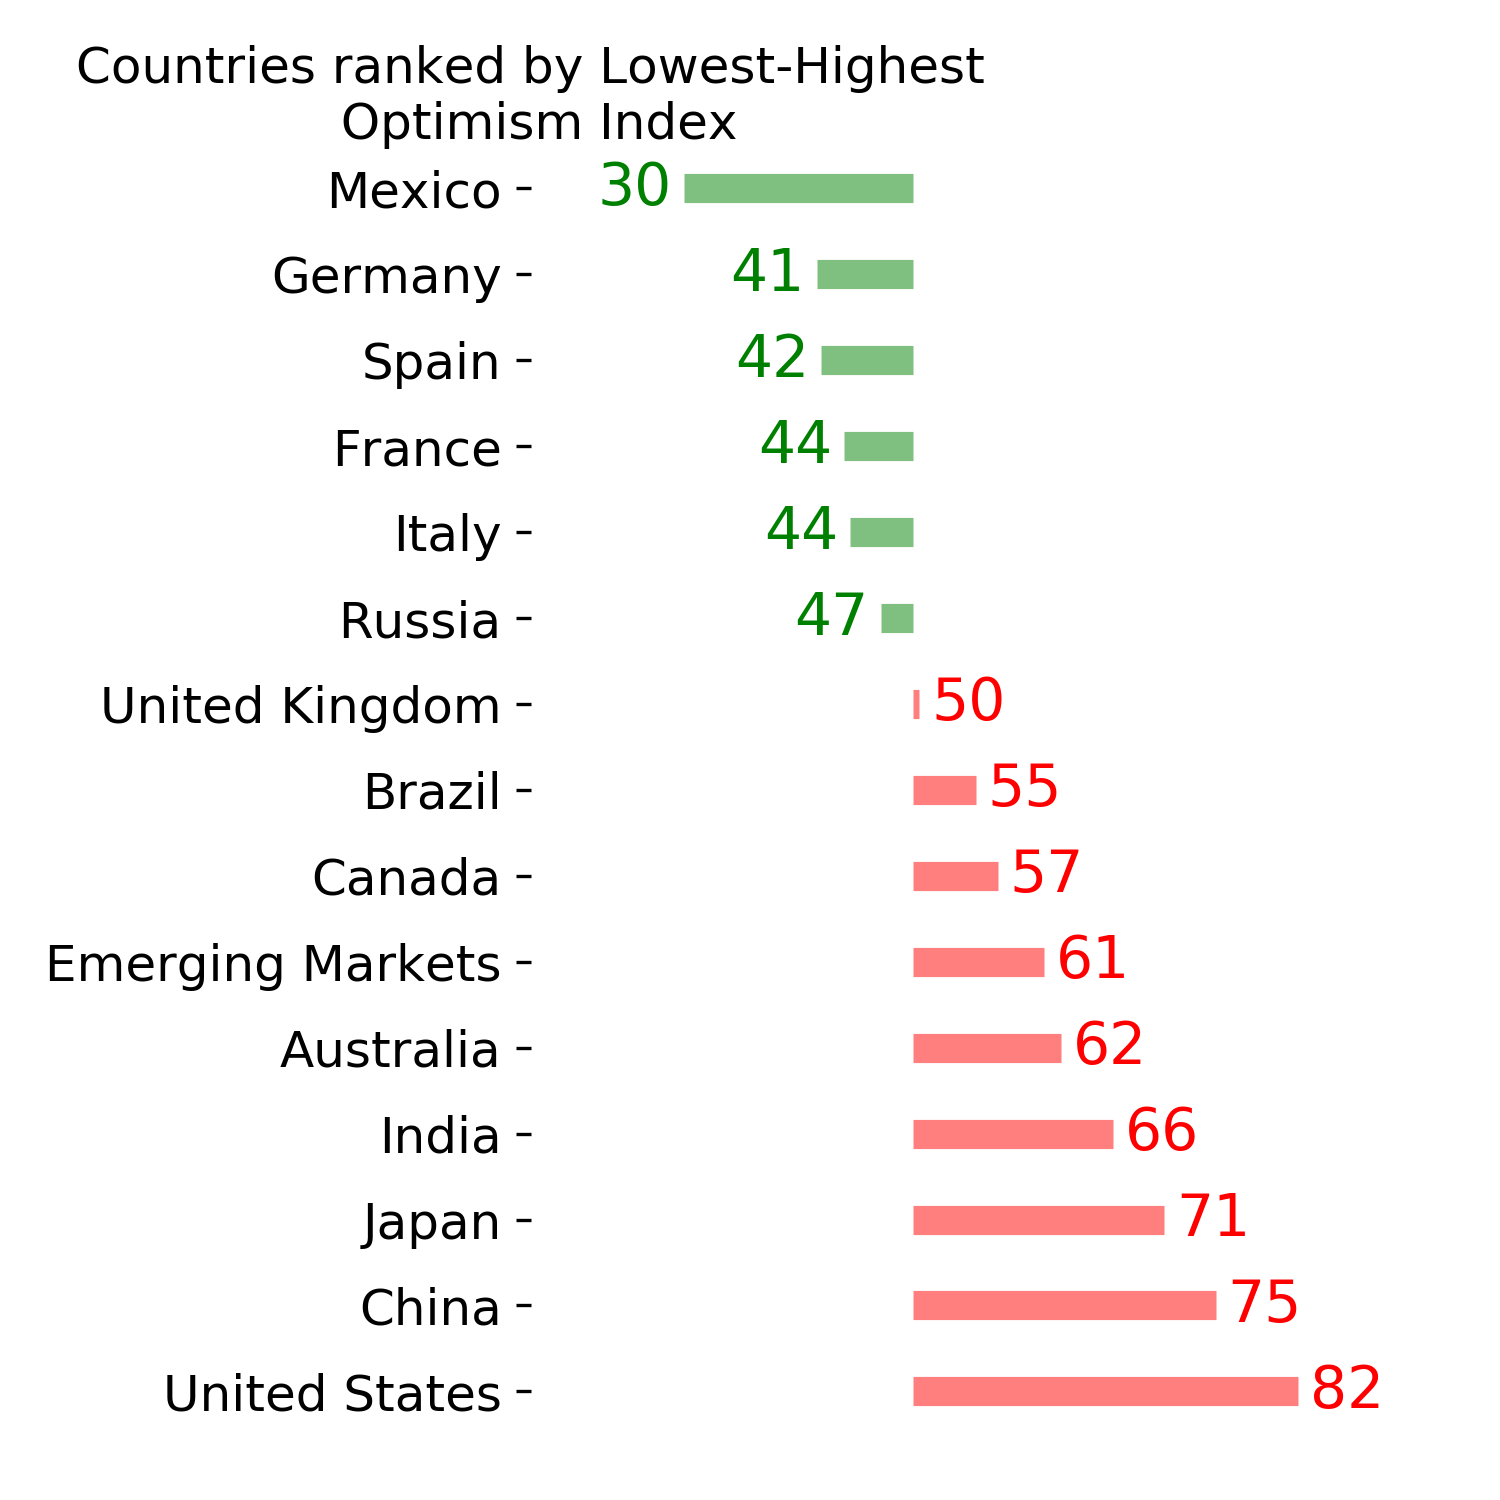
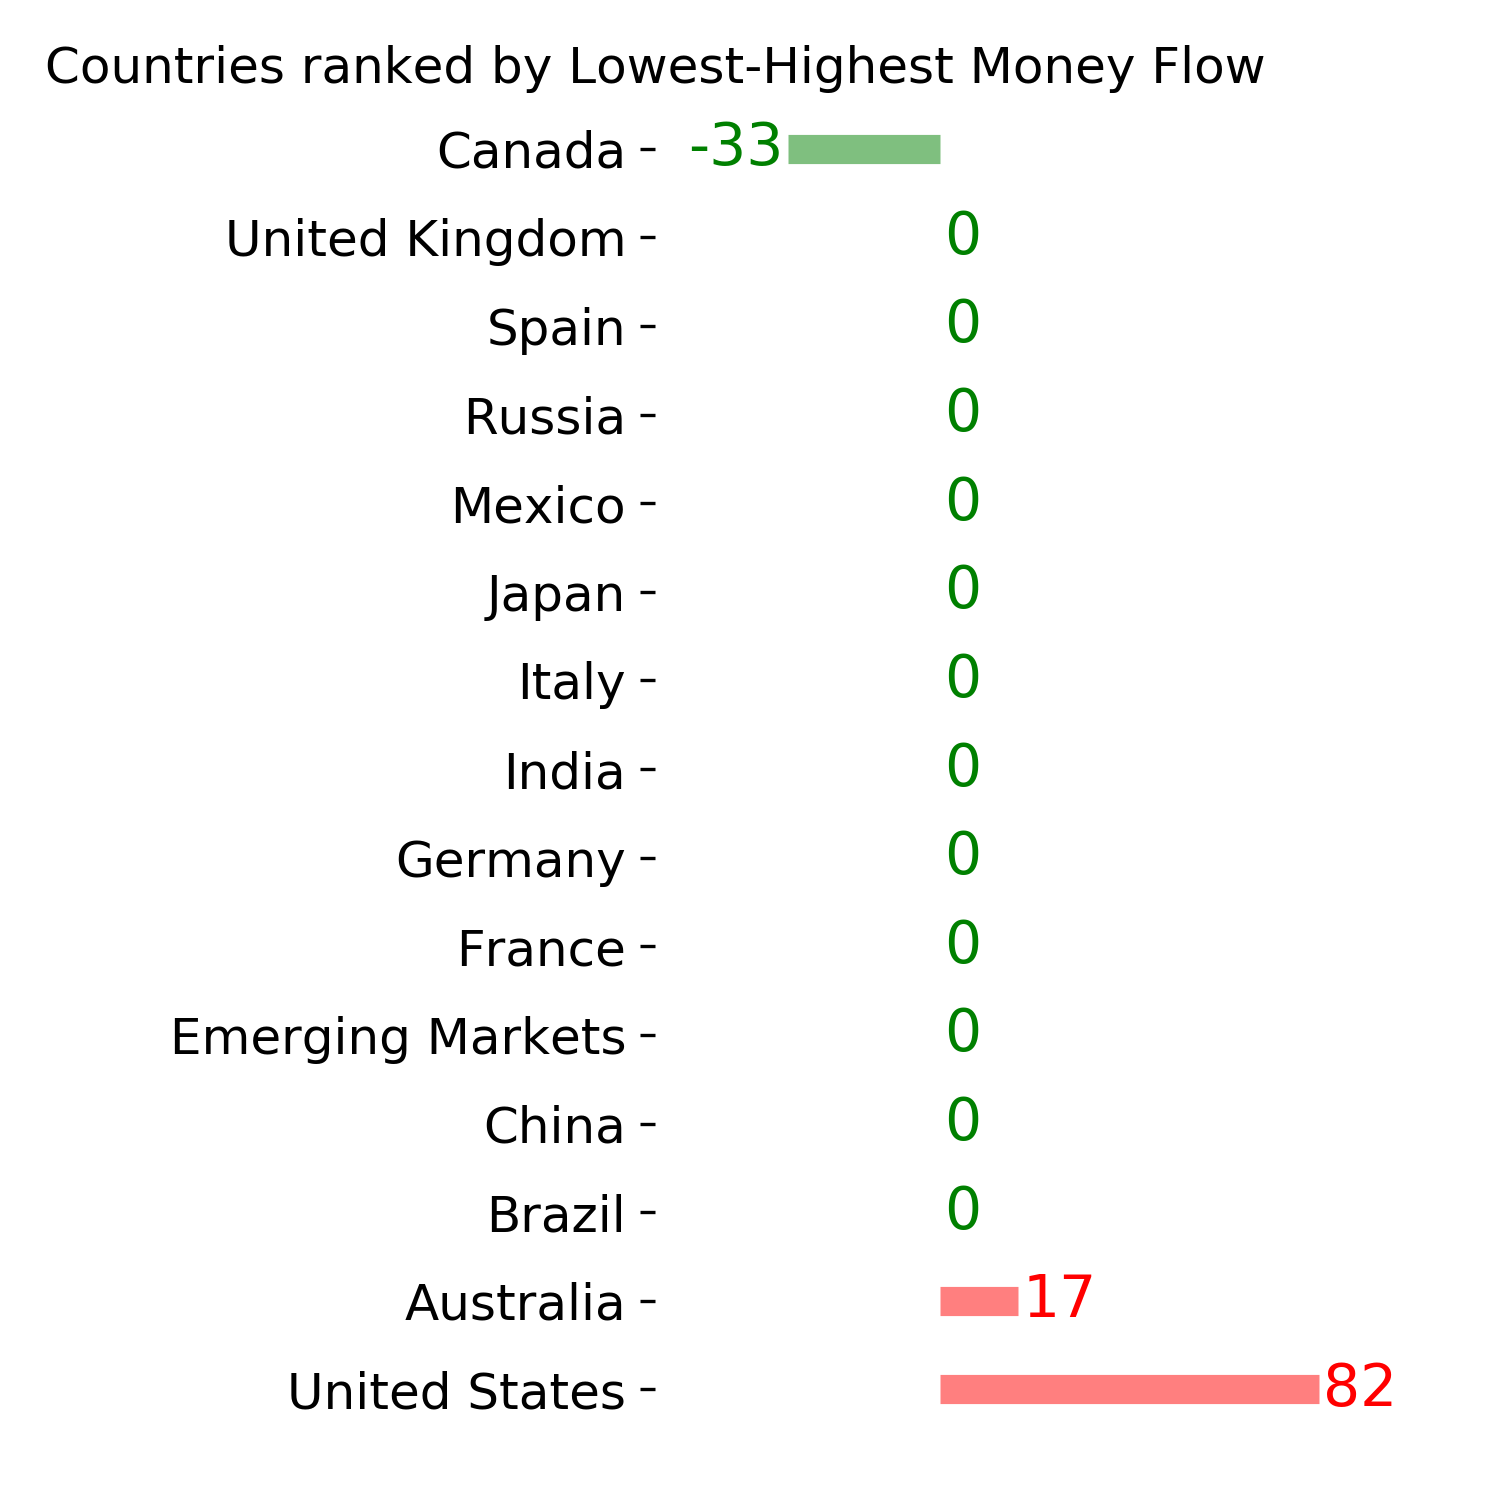
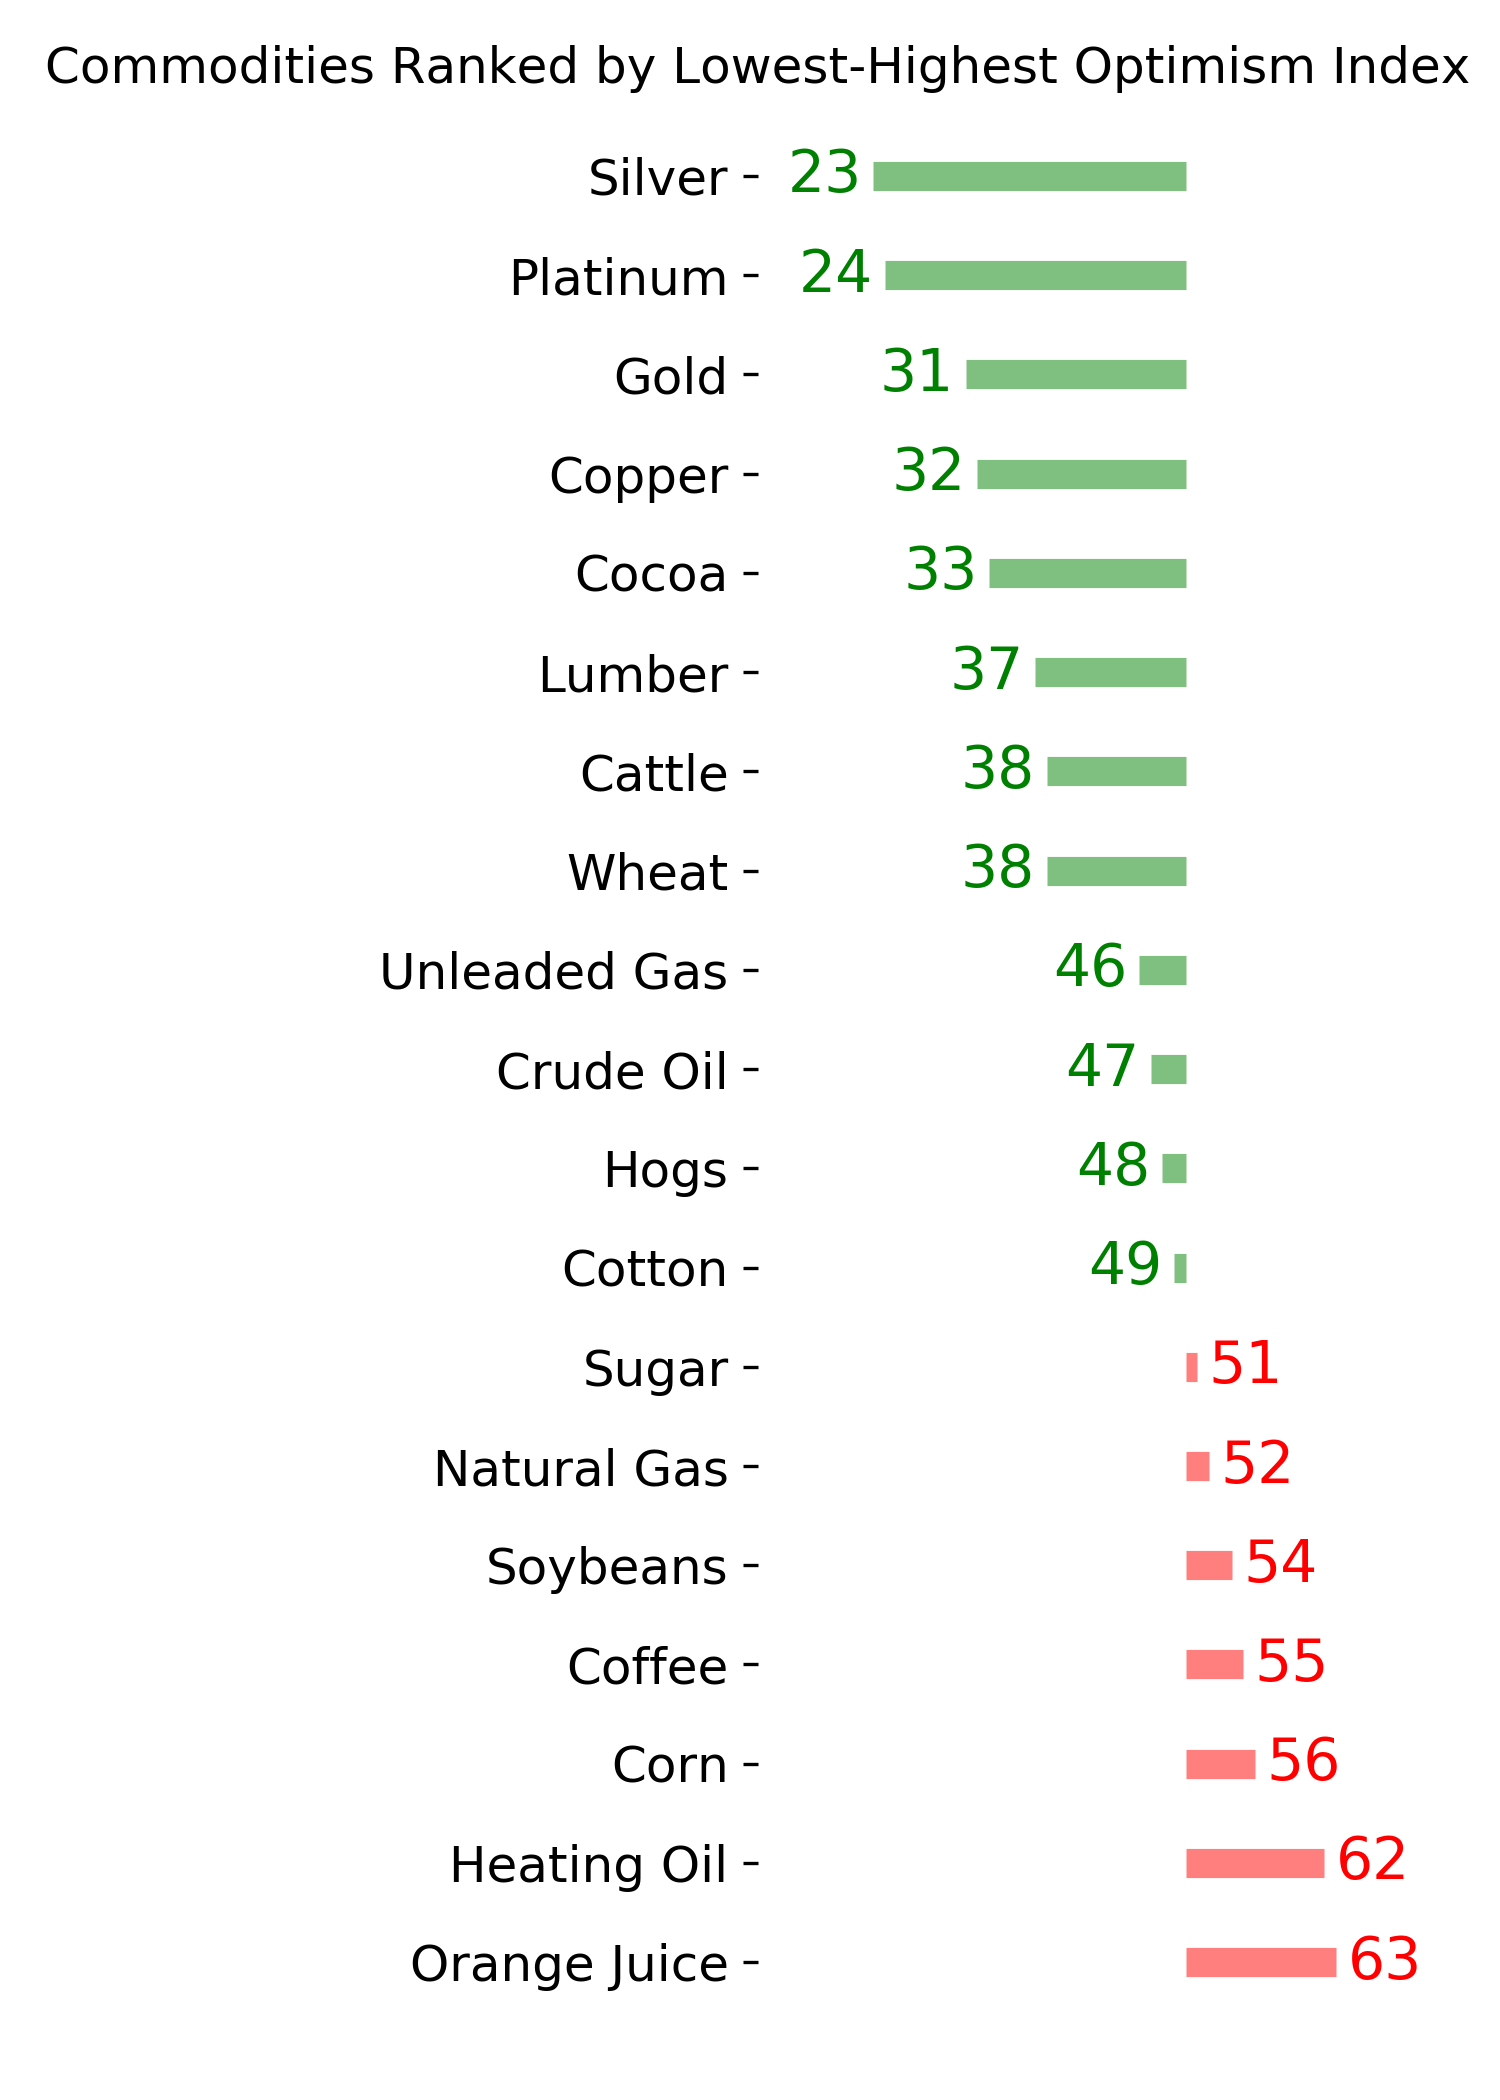
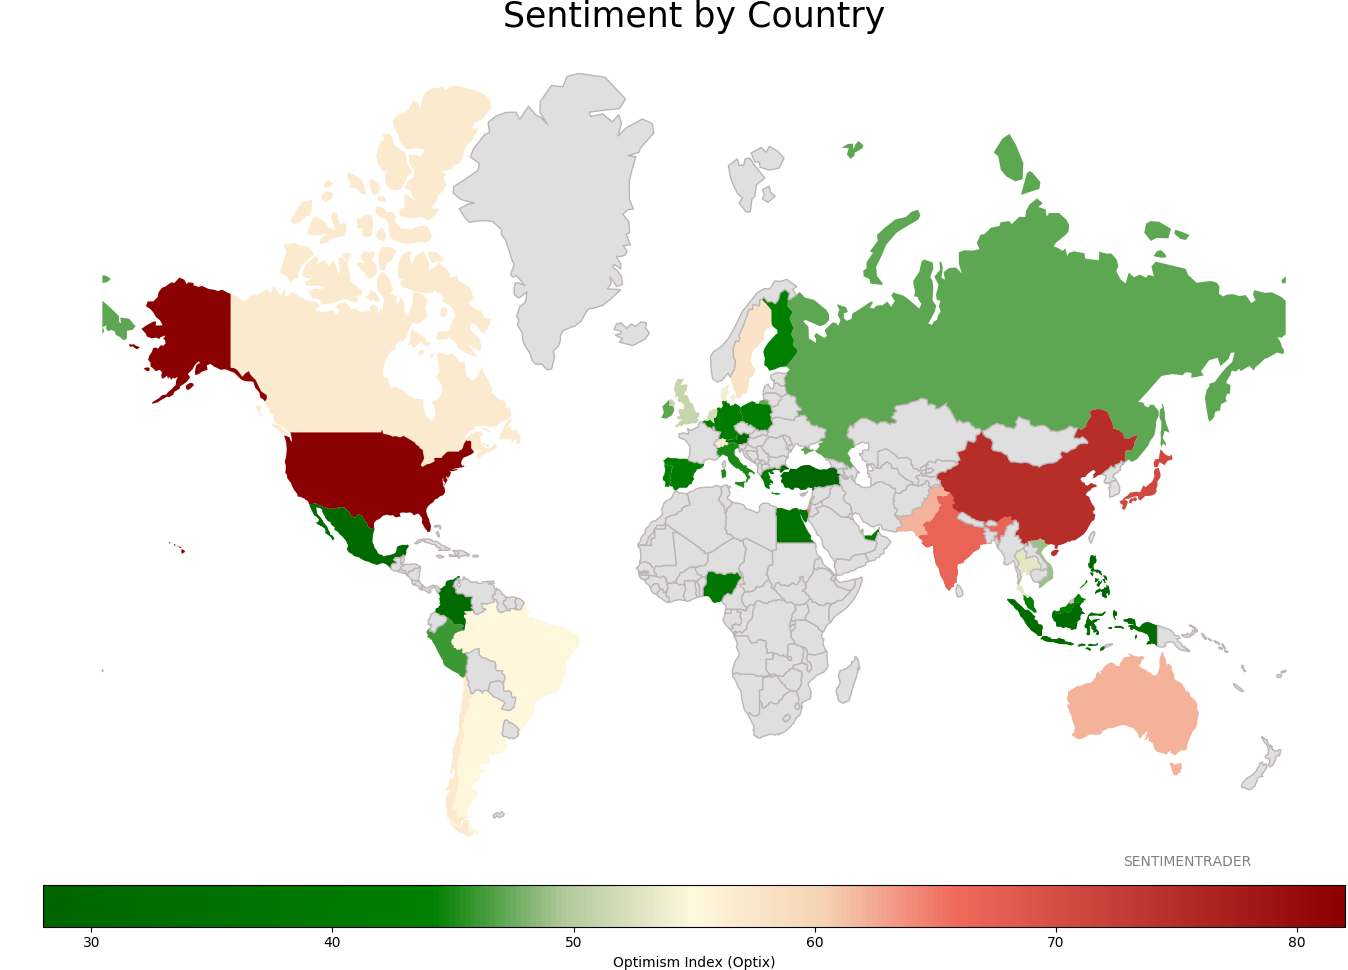
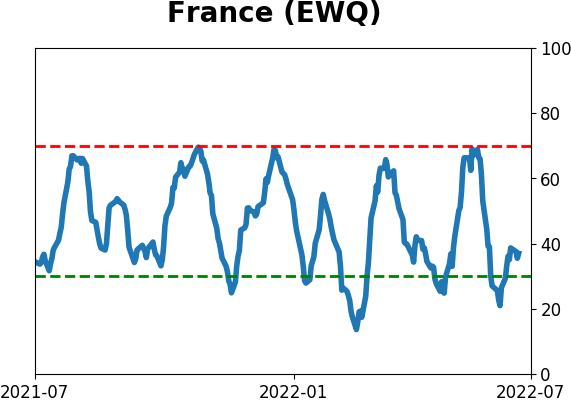
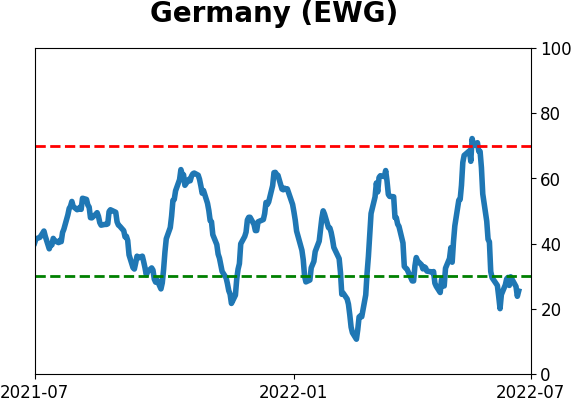
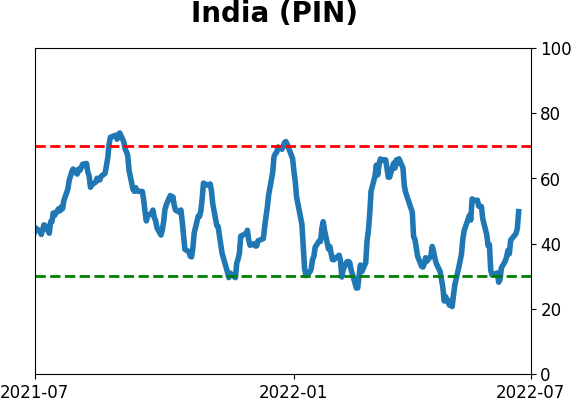
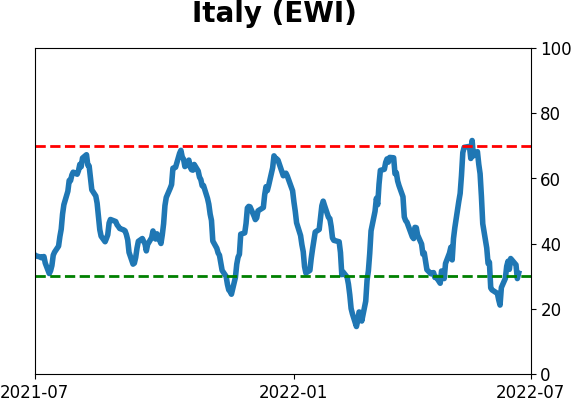
Sentiment Around The World
Optimism Index Thumbnails
|
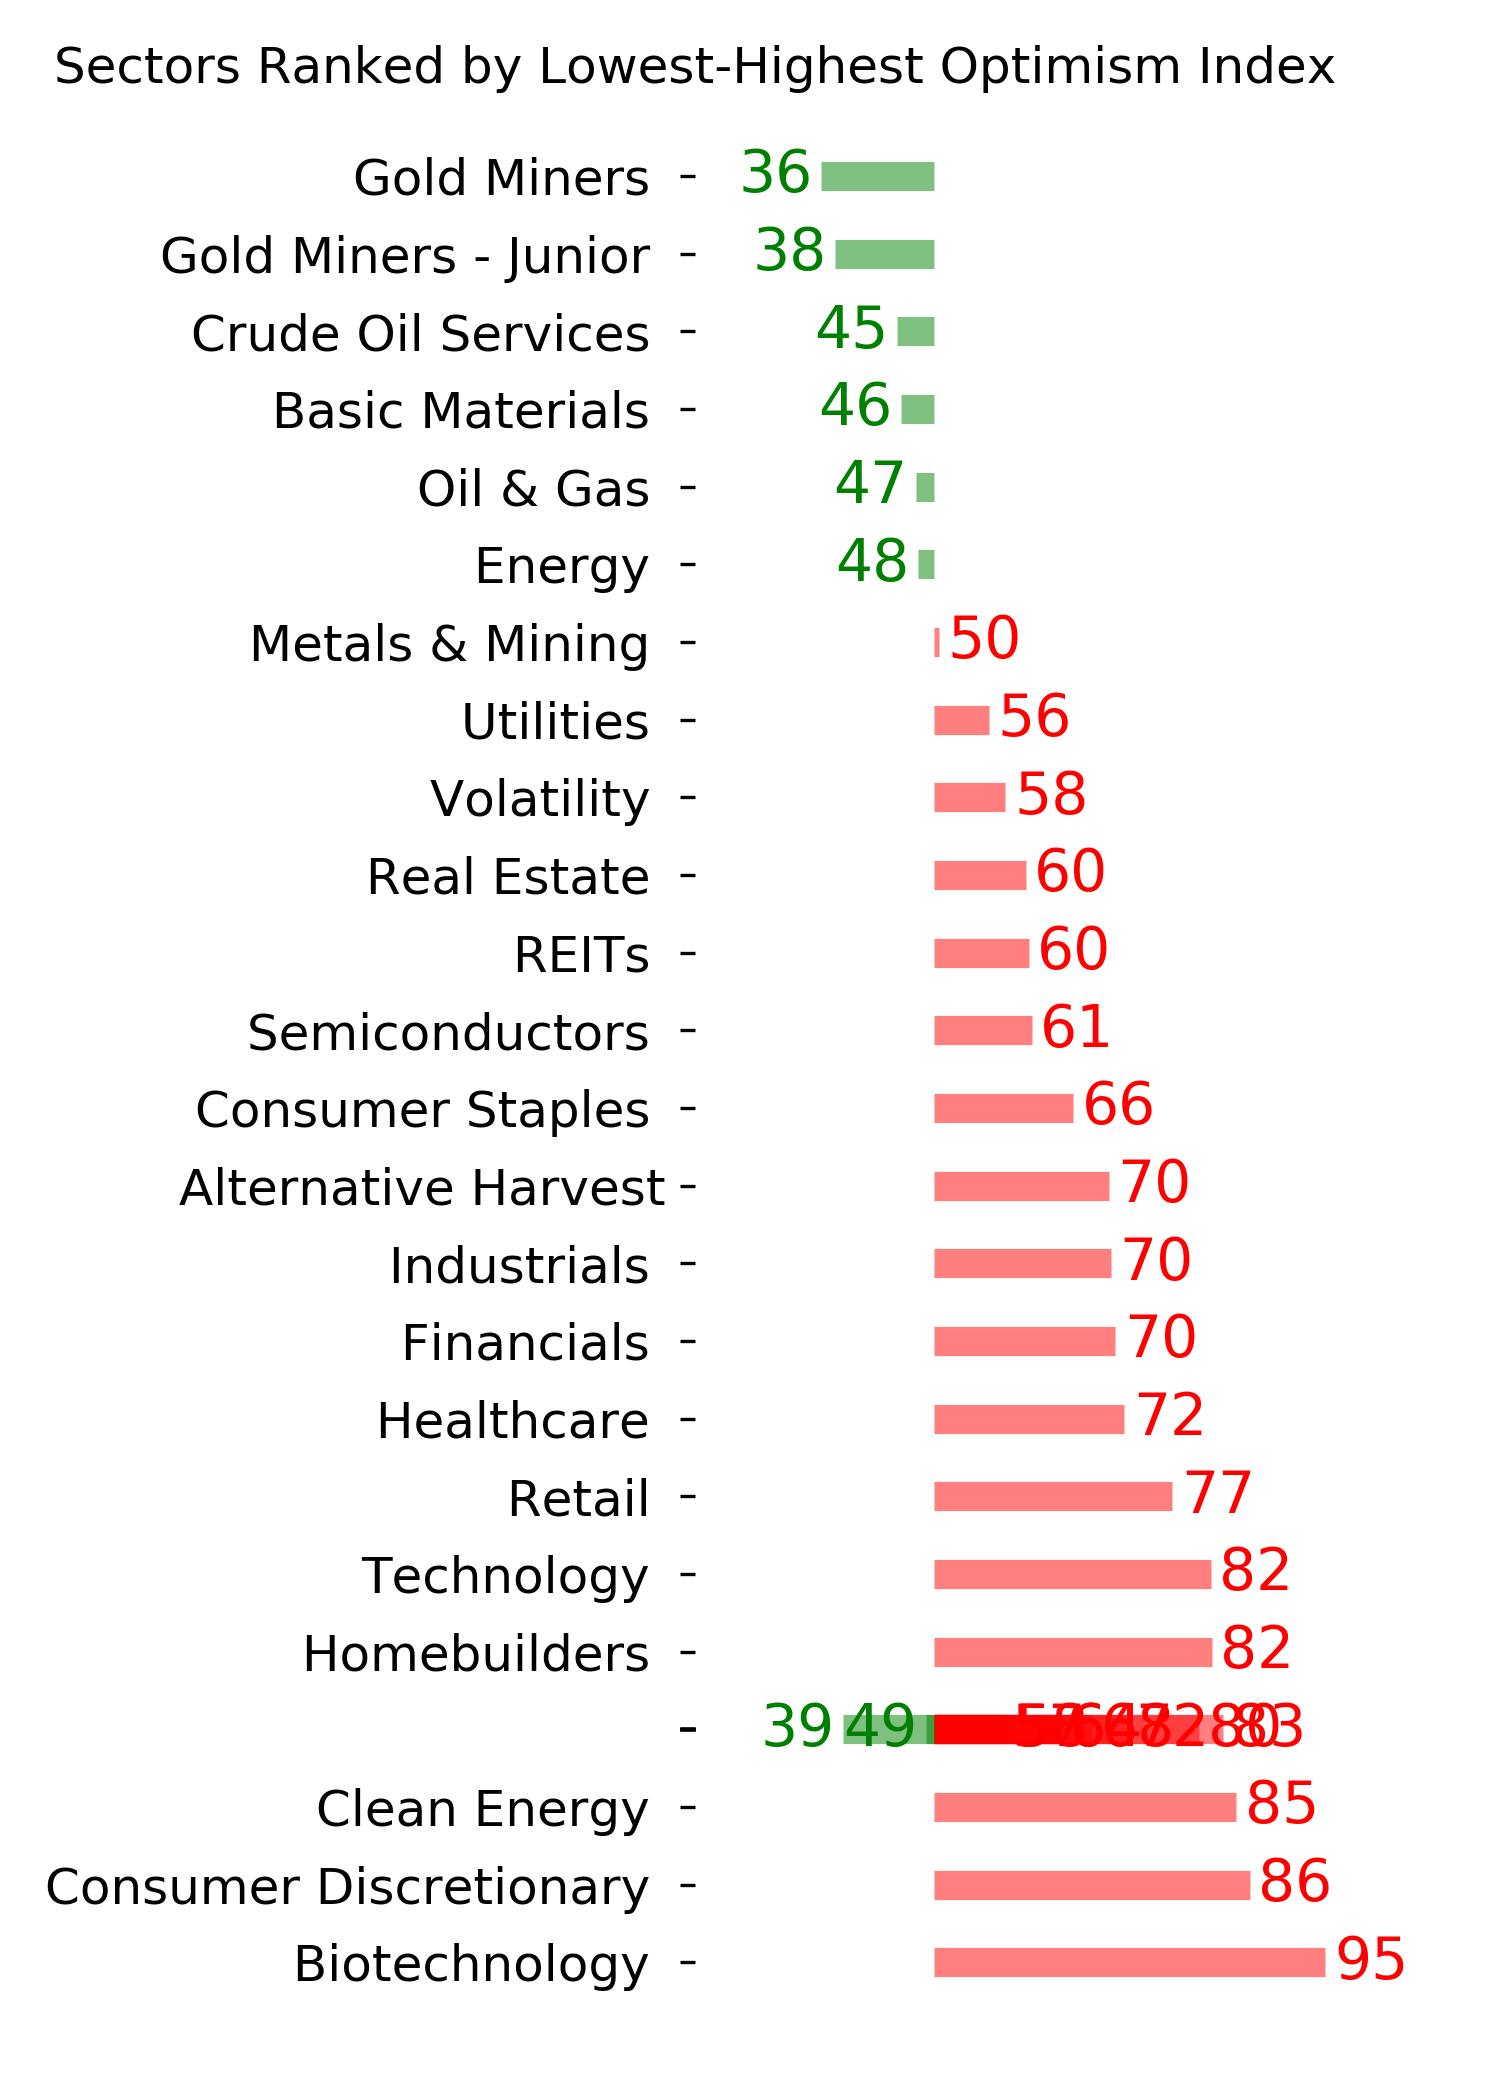
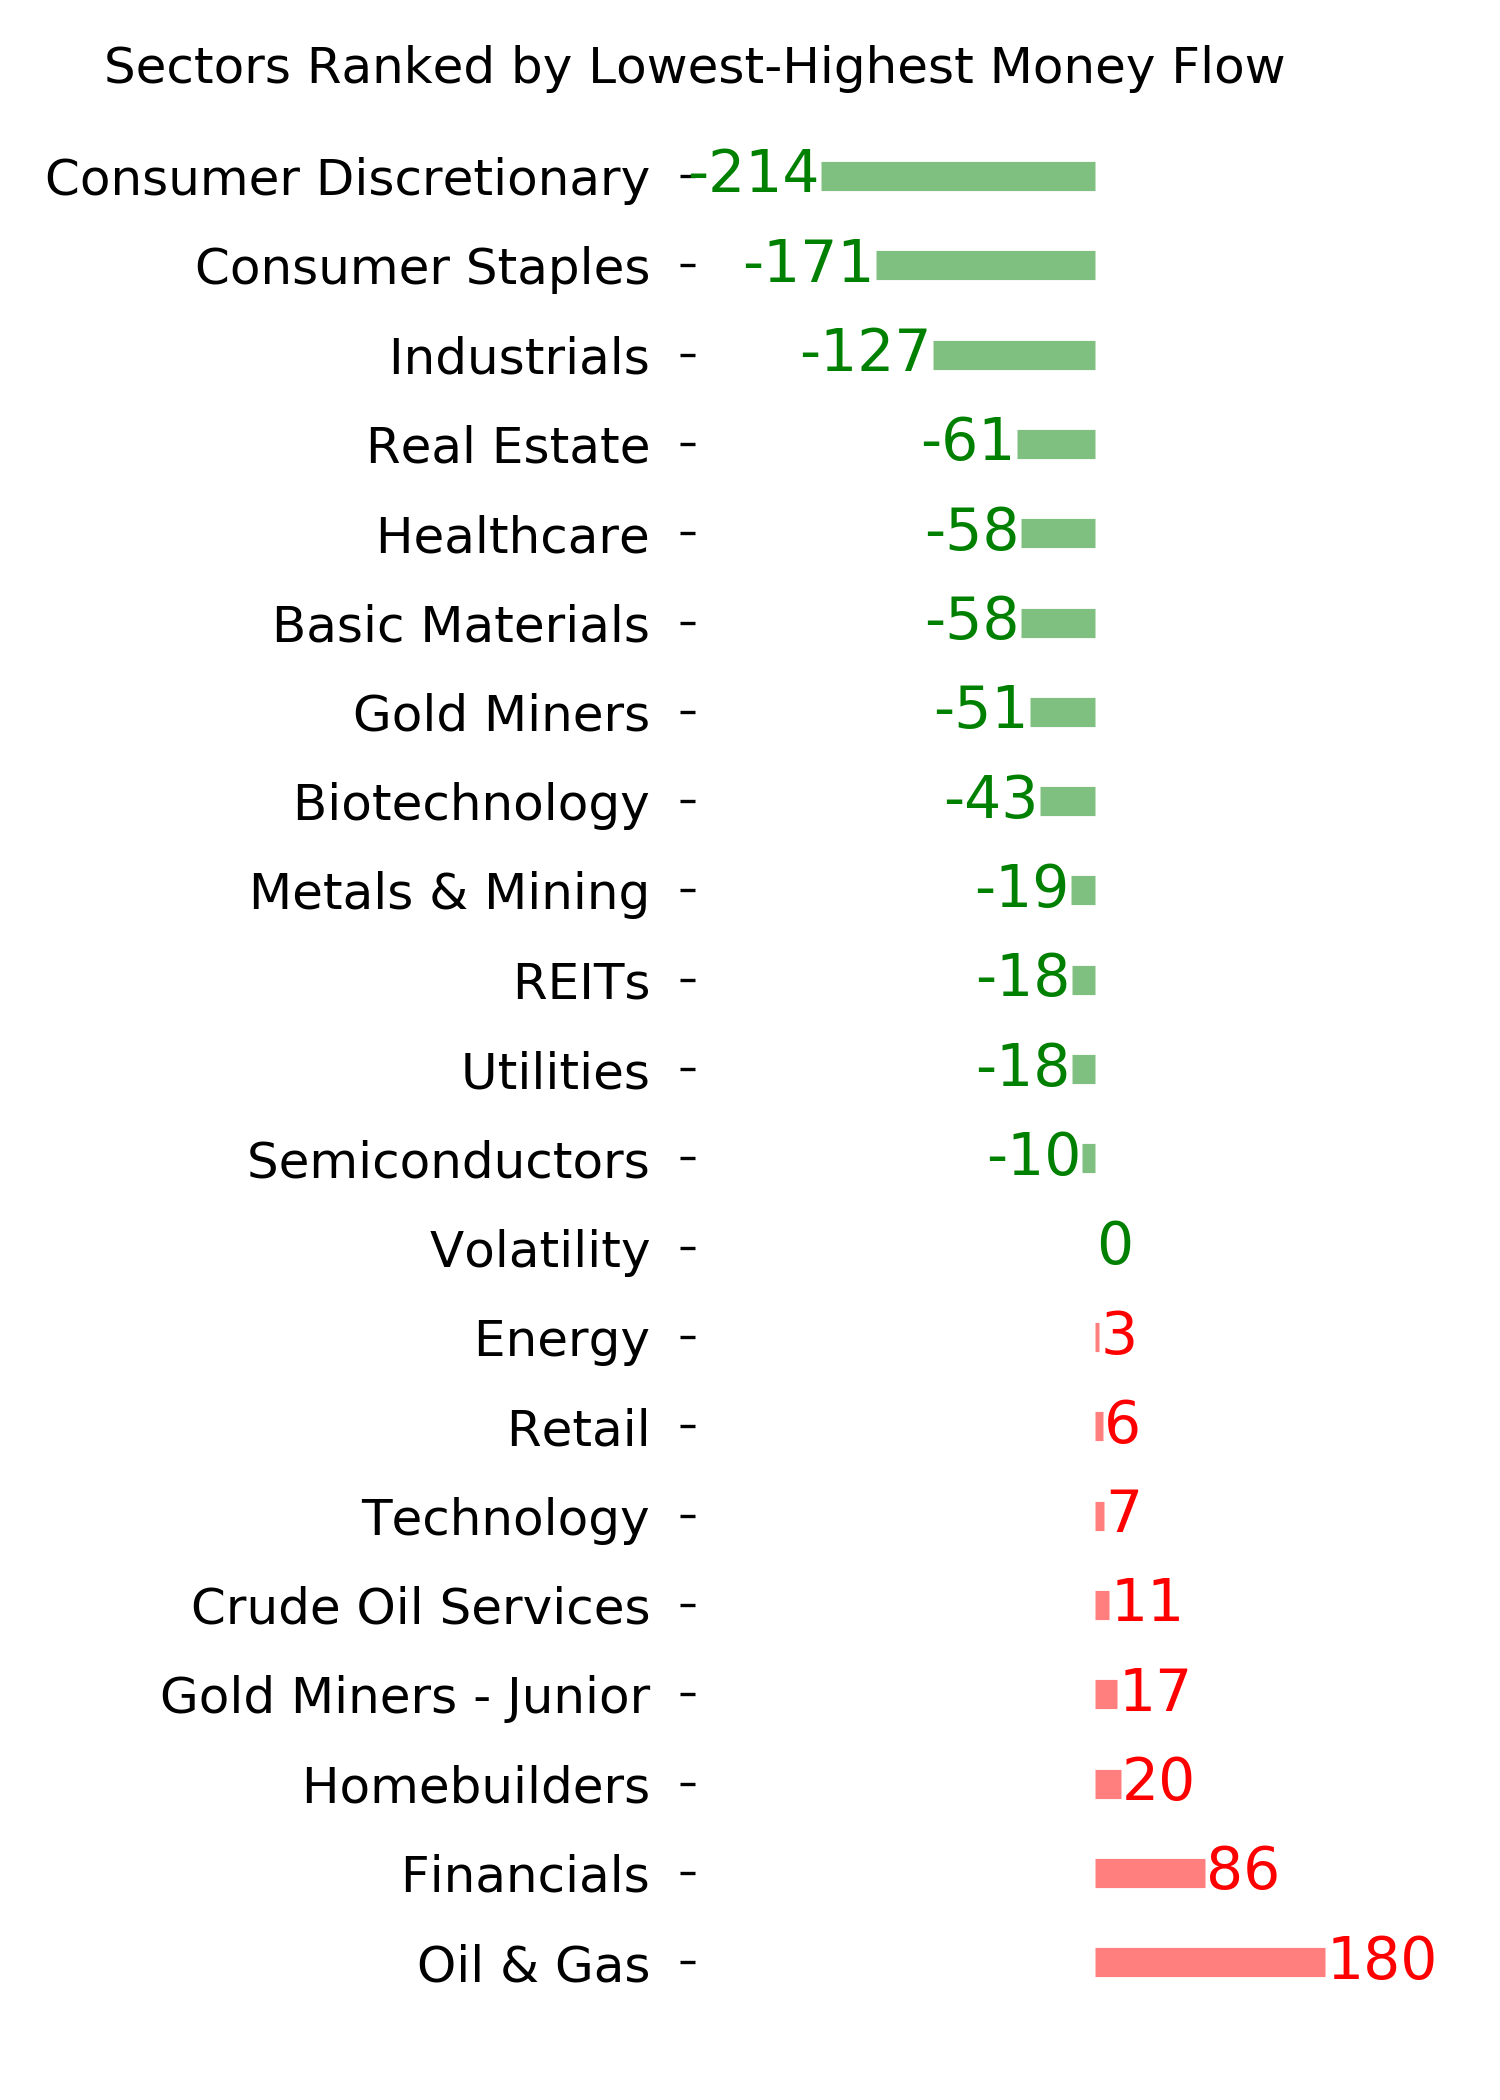
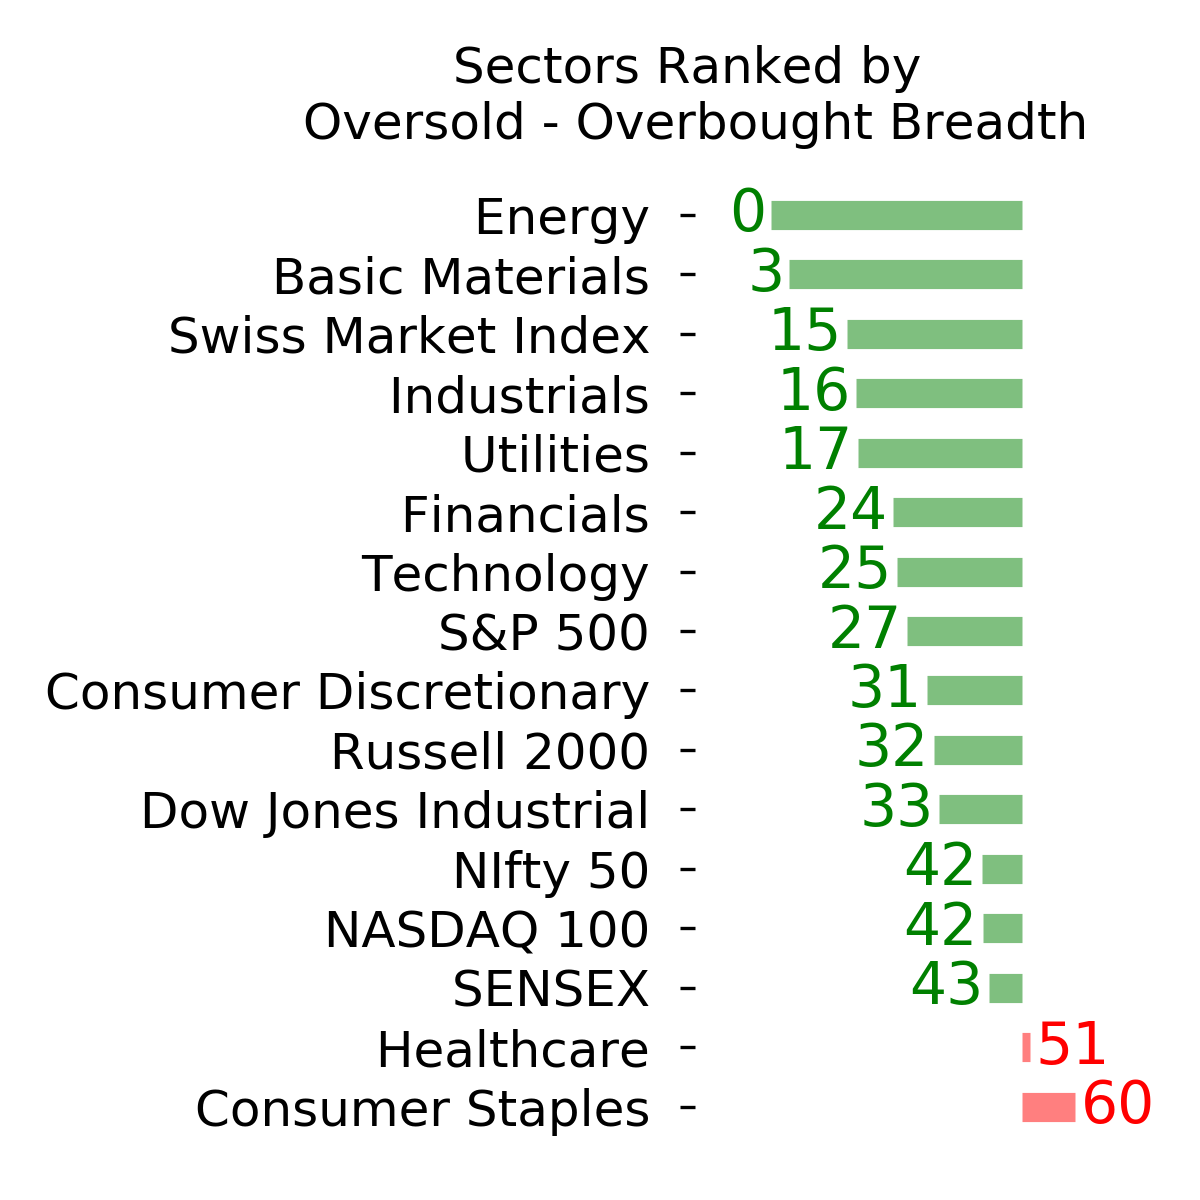
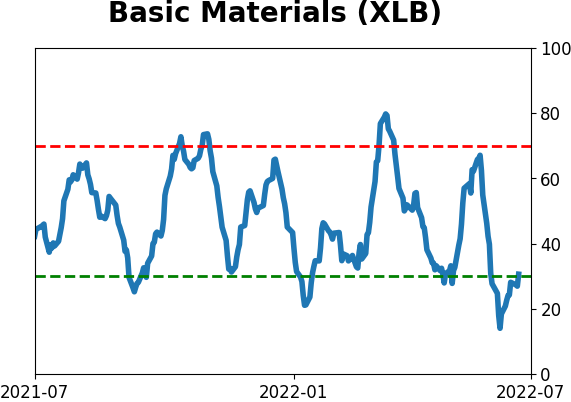
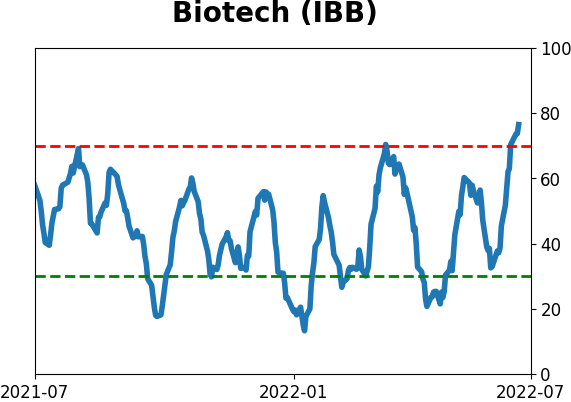
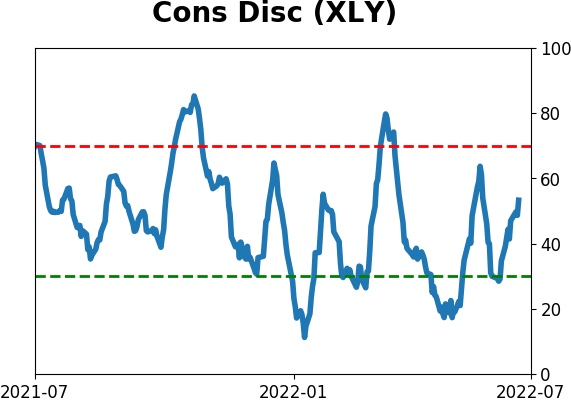
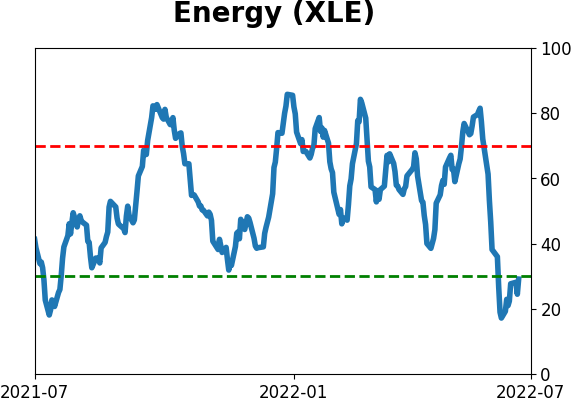
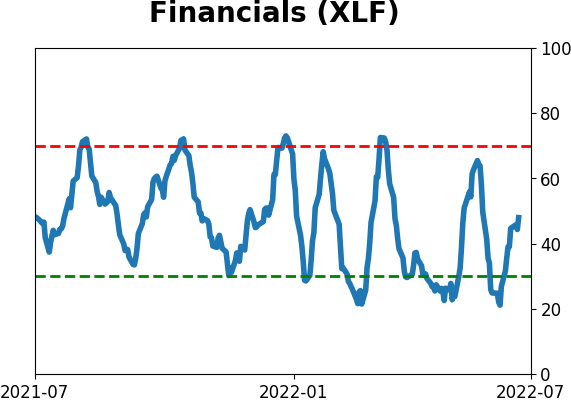
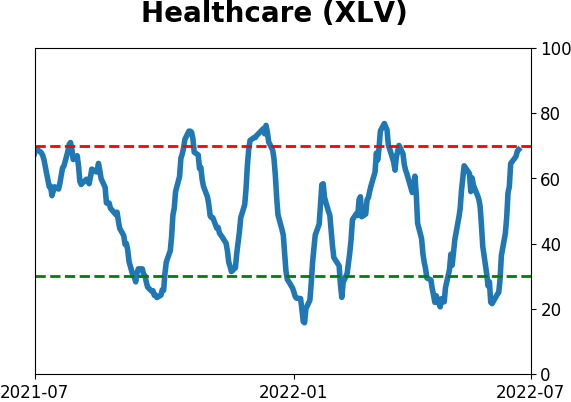
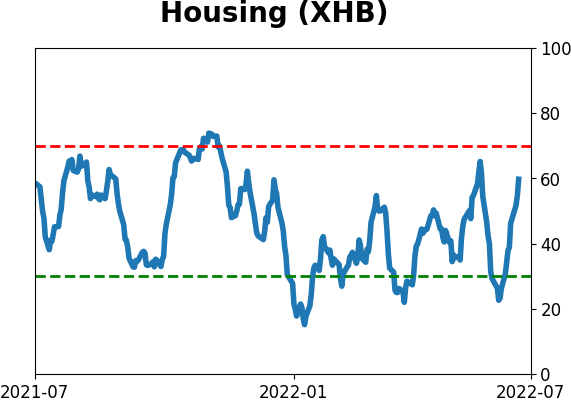
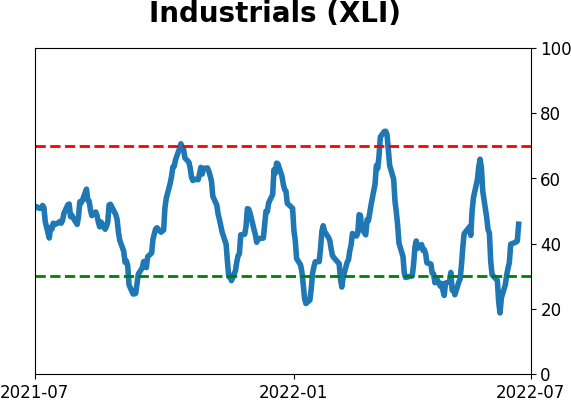
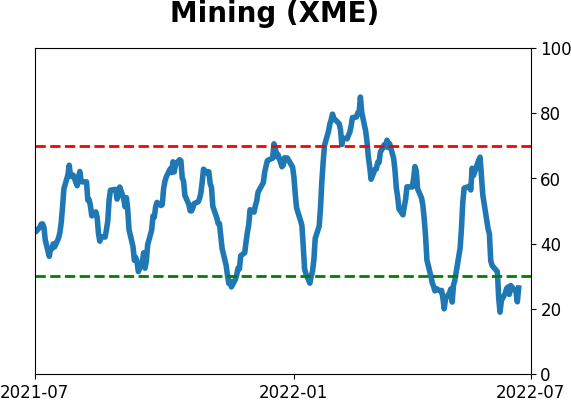
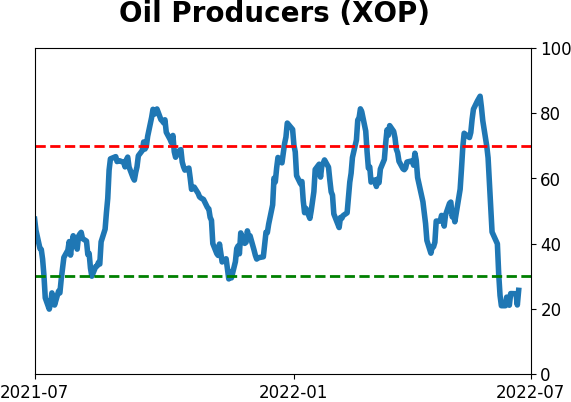
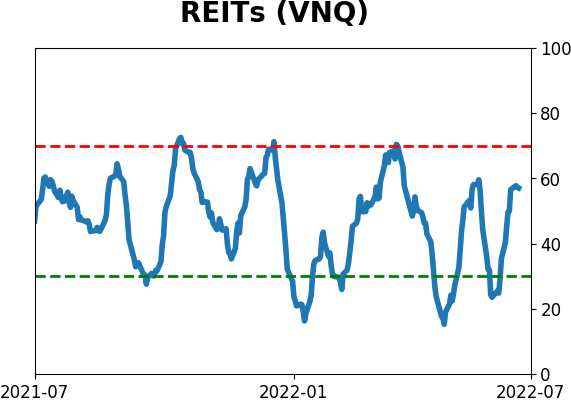
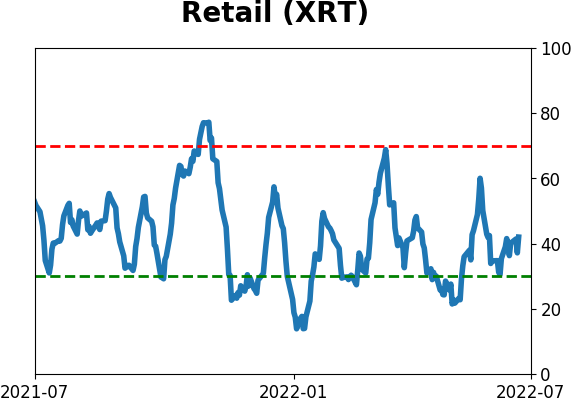
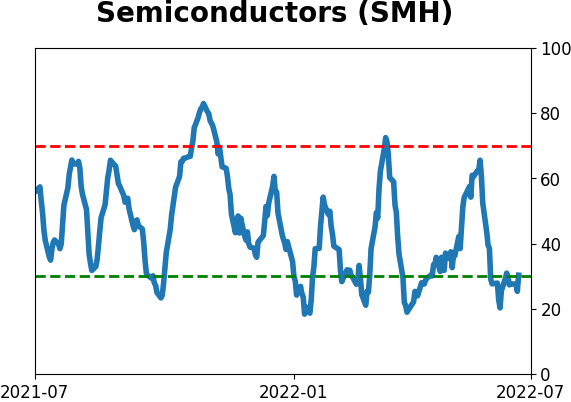
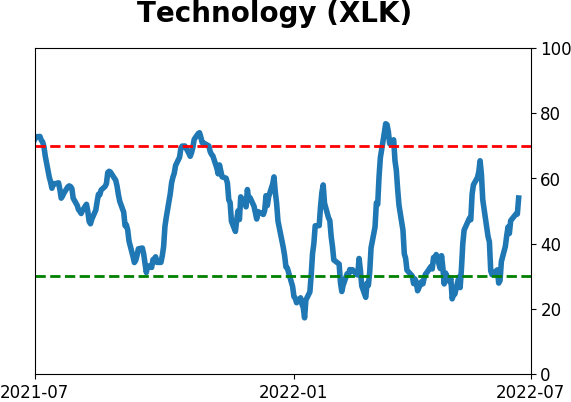
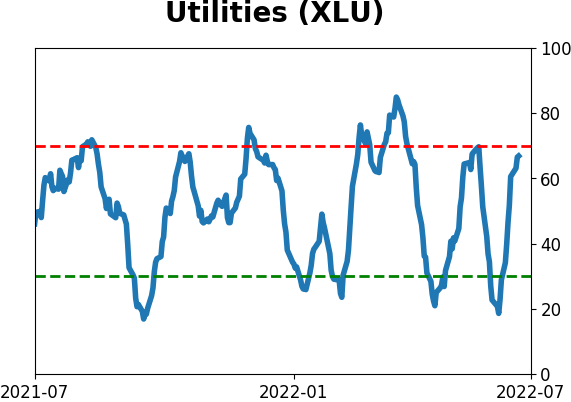
Sector ETF's - 10-Day Moving Average
|
|
|
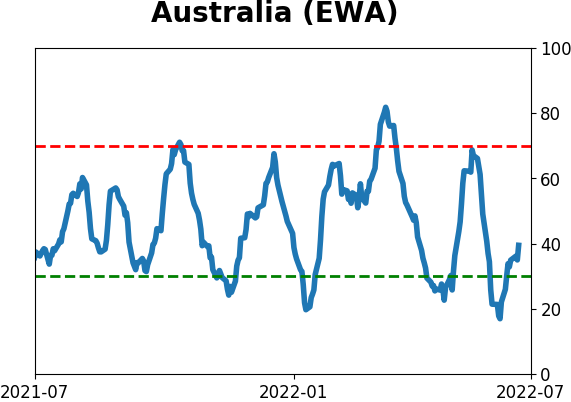
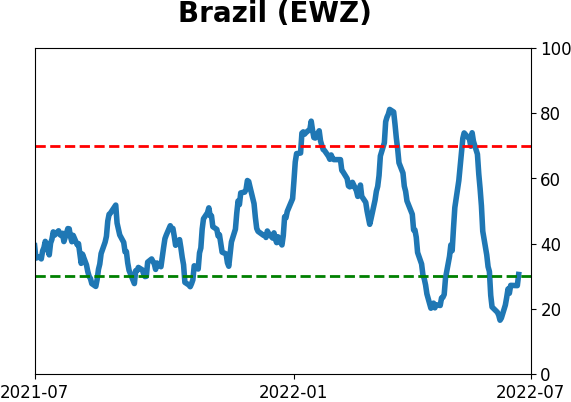
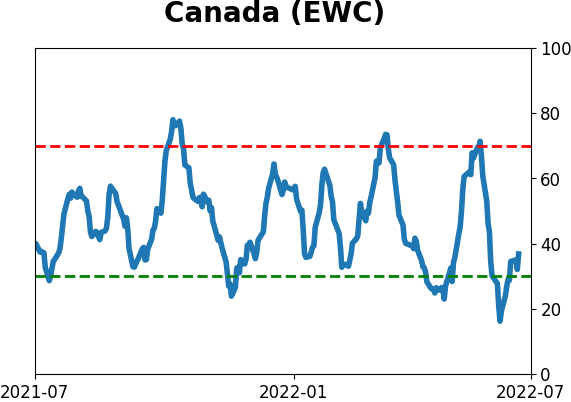
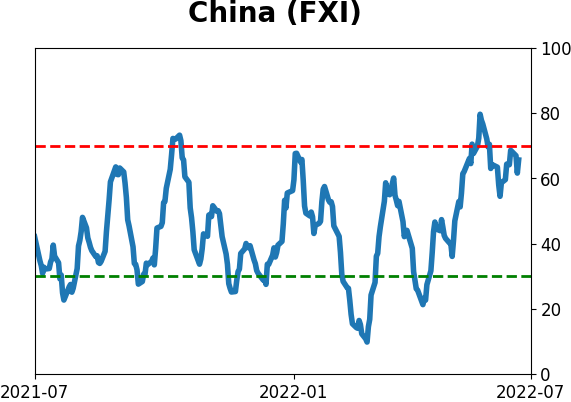
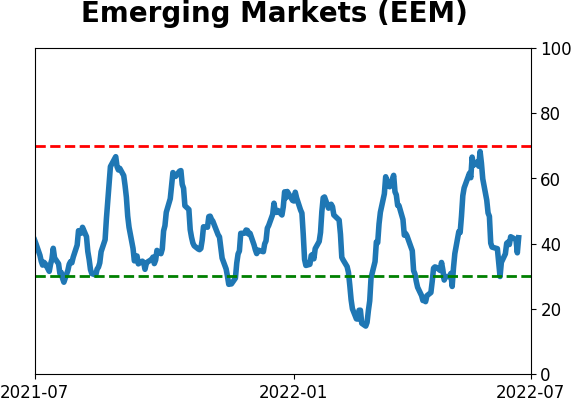
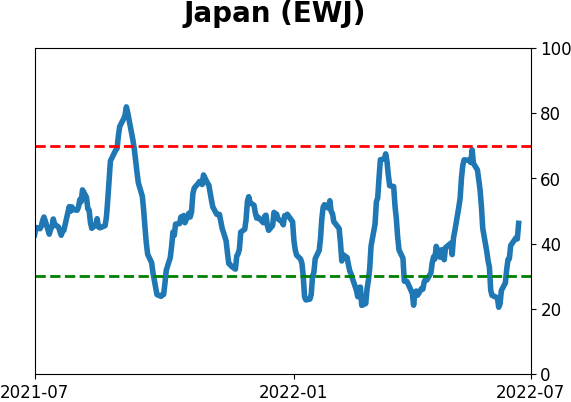
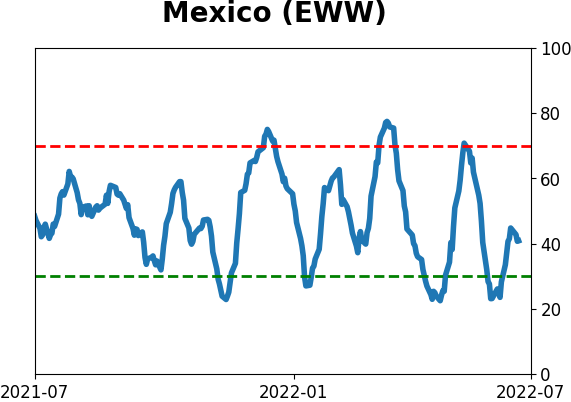
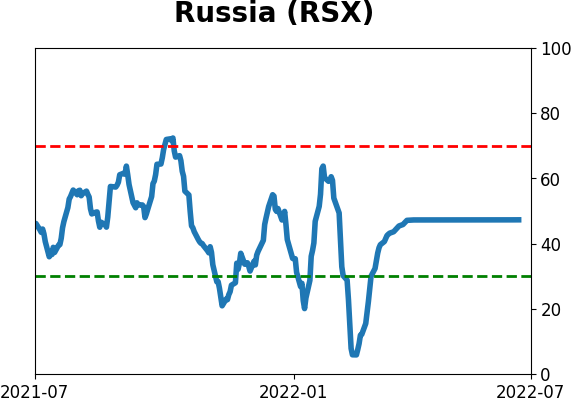
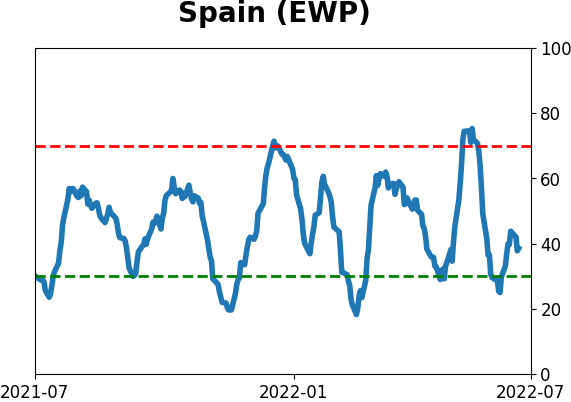
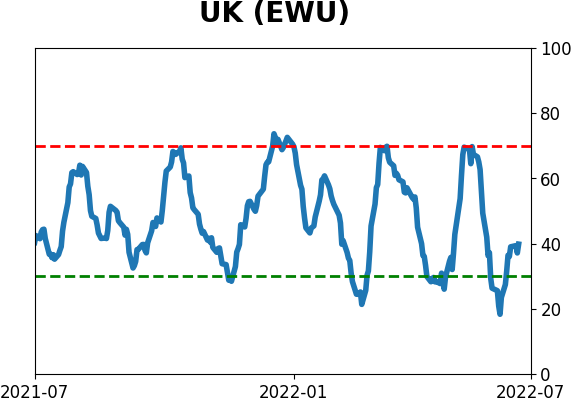
Country ETF's - 10-Day Moving Average
|
|
|
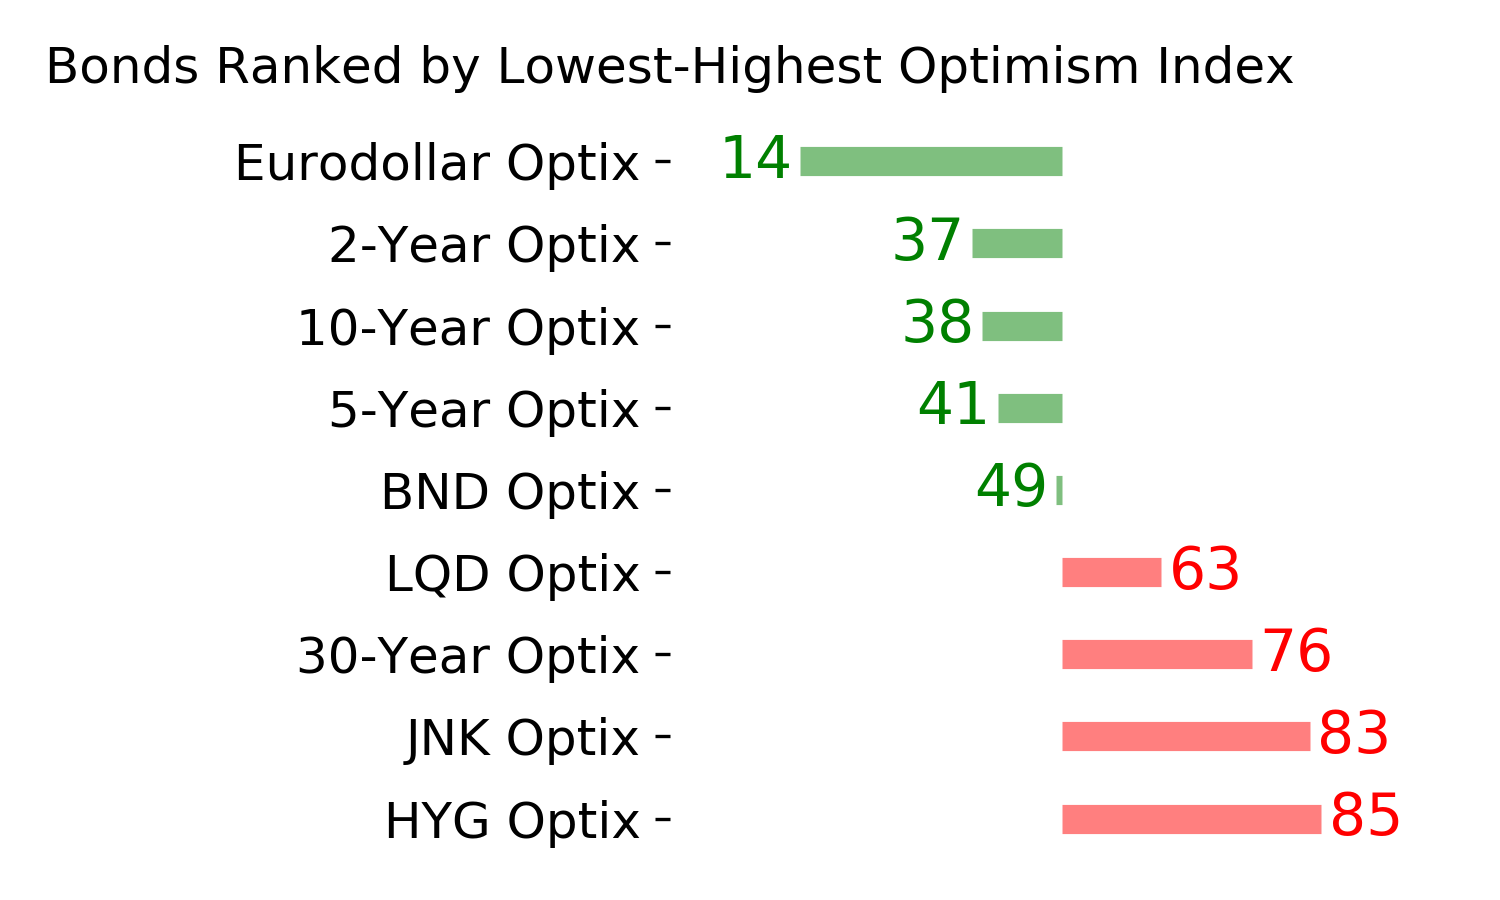
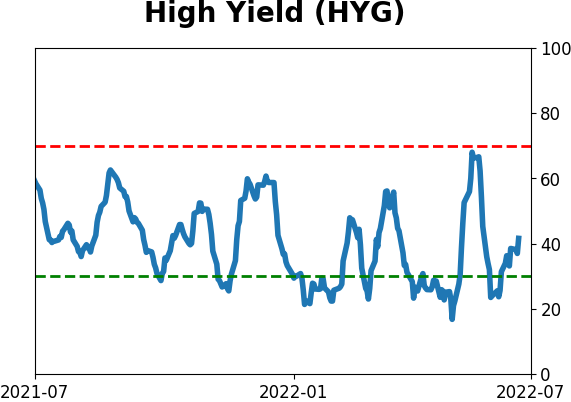
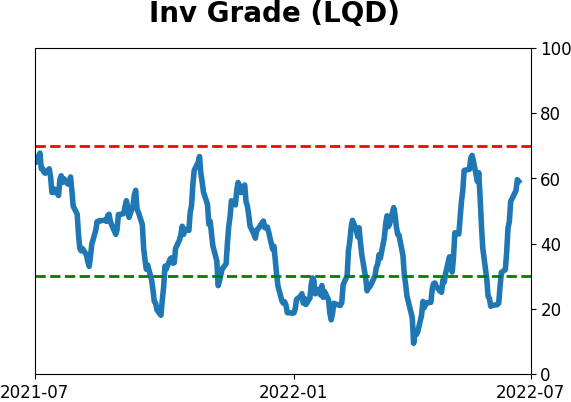
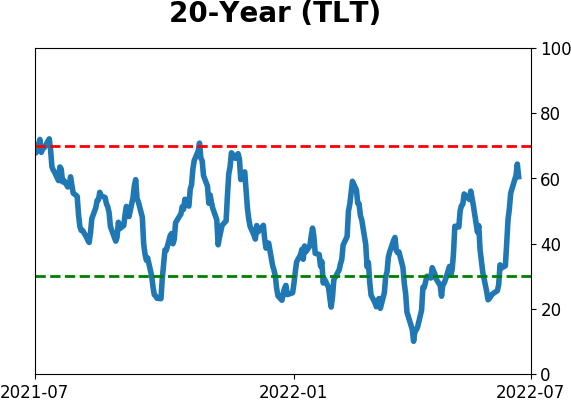
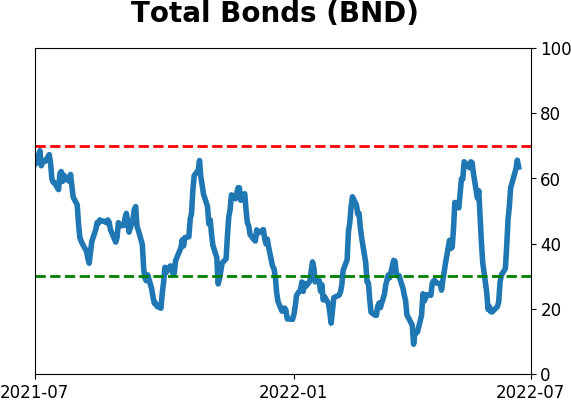
Bond ETF's - 10-Day Moving Average
|
|
|
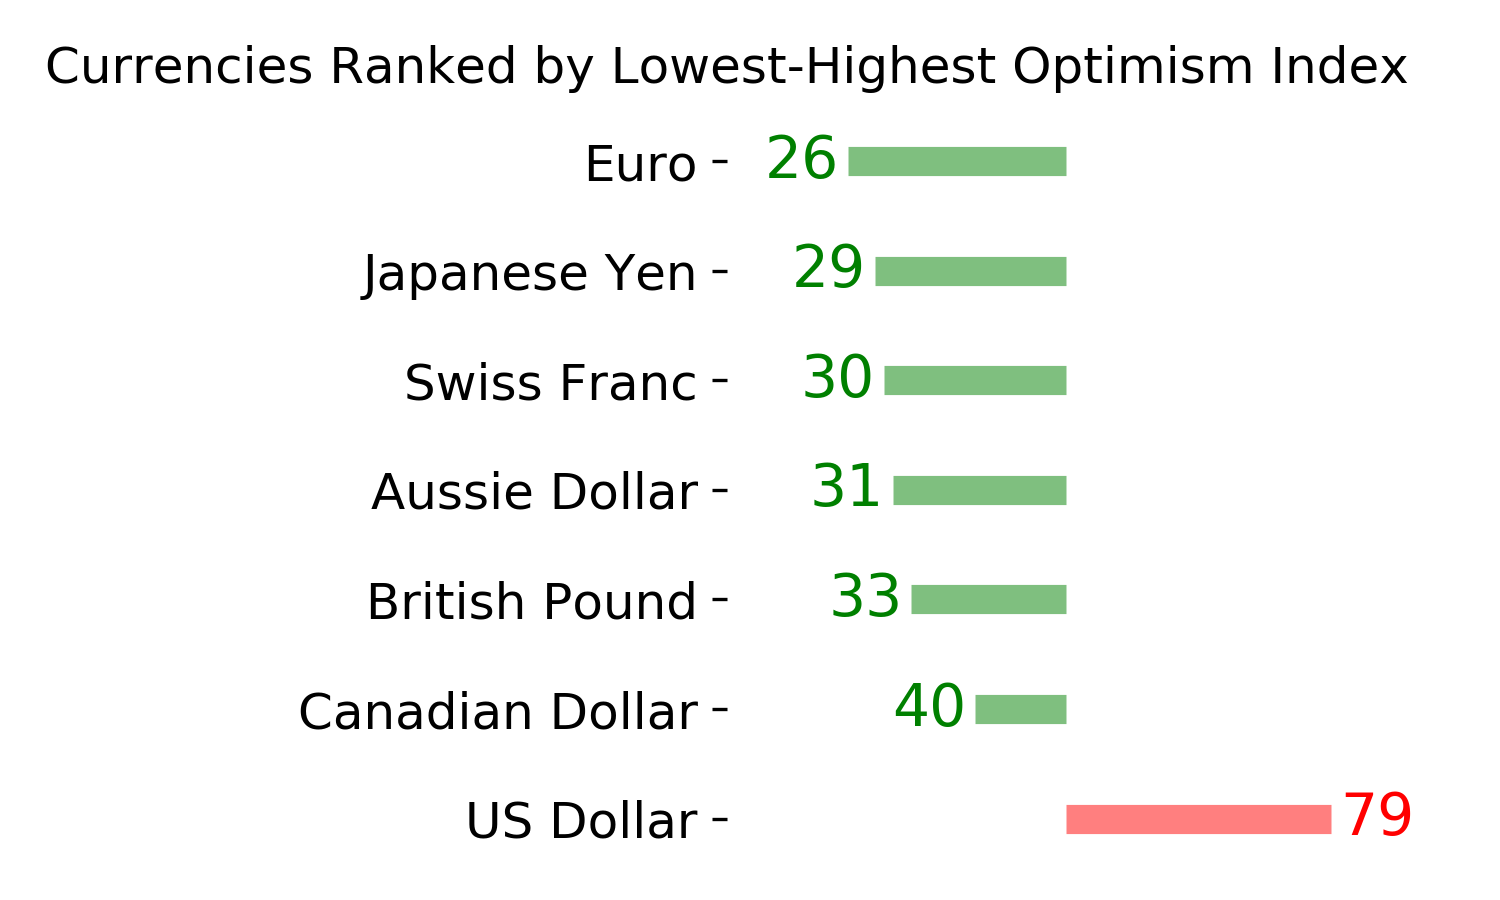
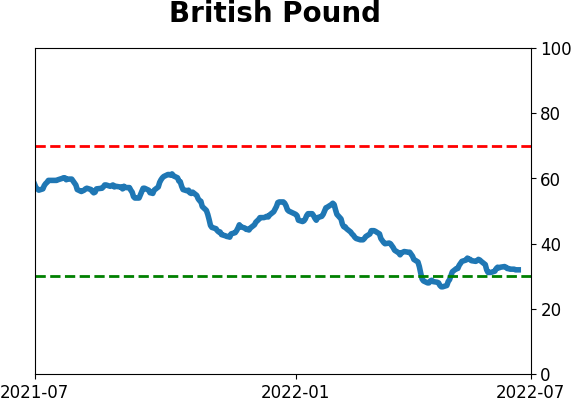
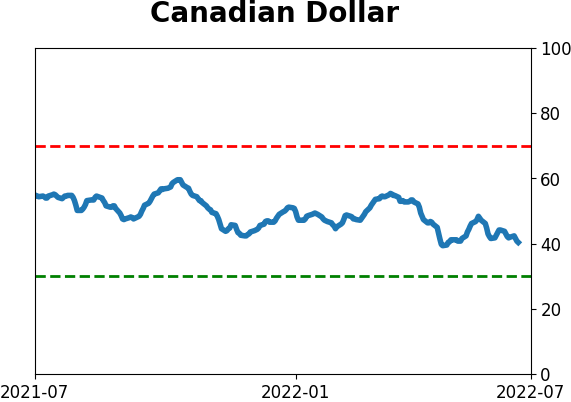
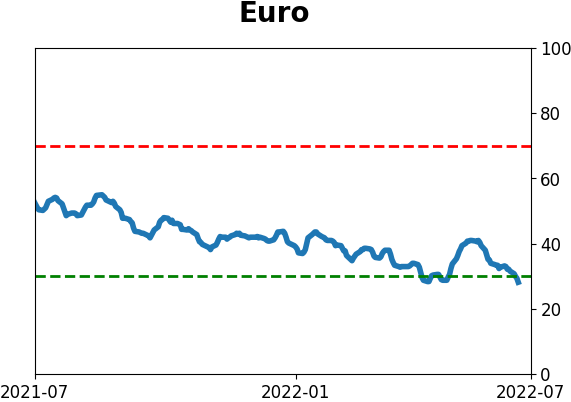
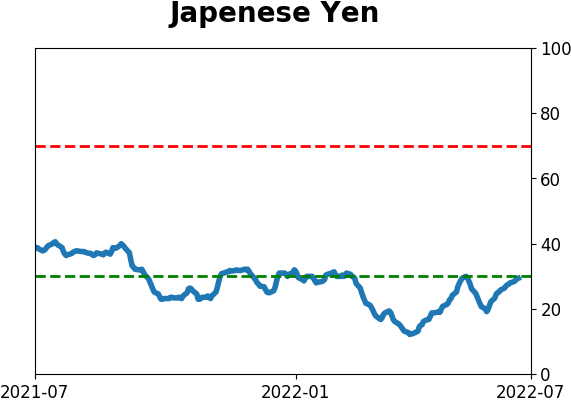
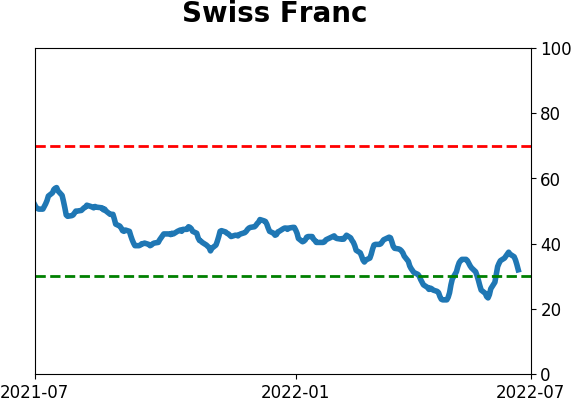
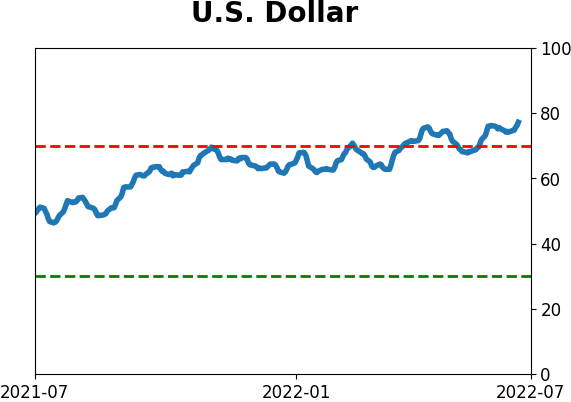
Currency ETF's - 5-Day Moving Average
|
|
|
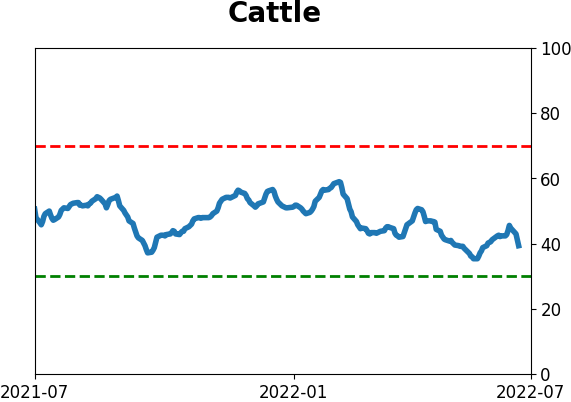
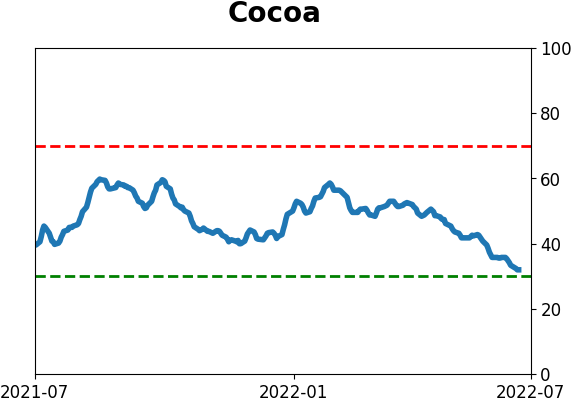
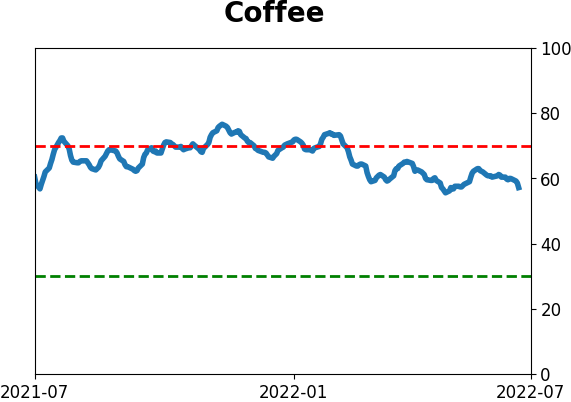
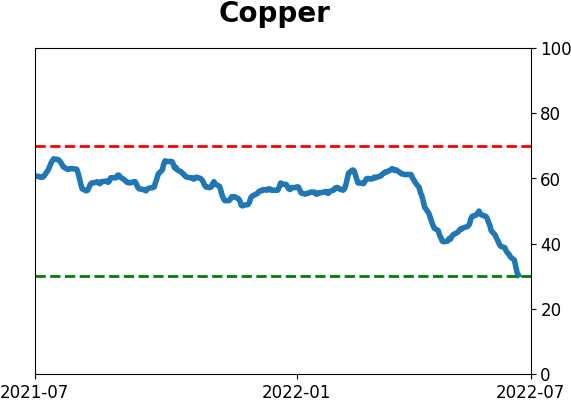
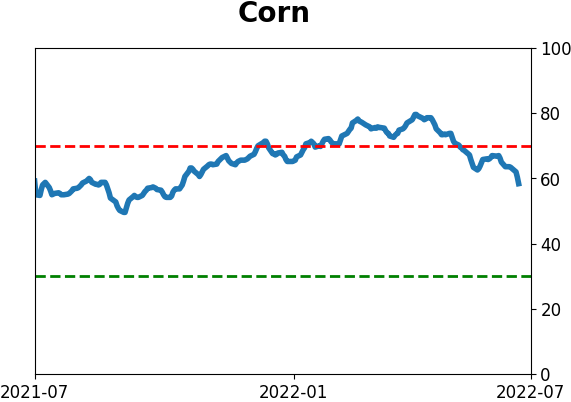
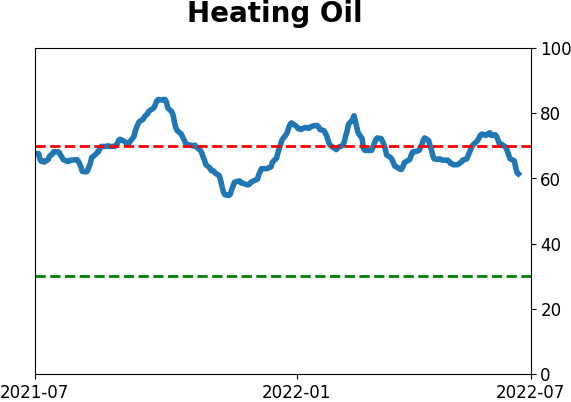
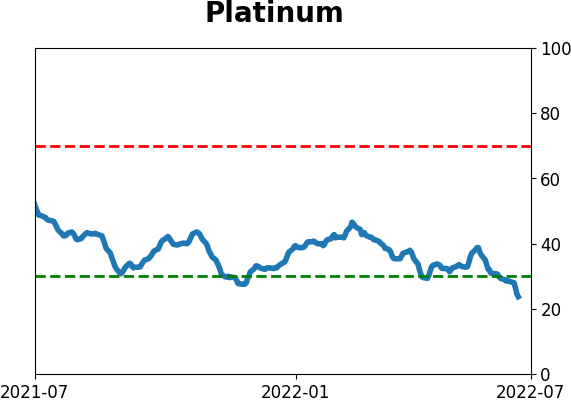
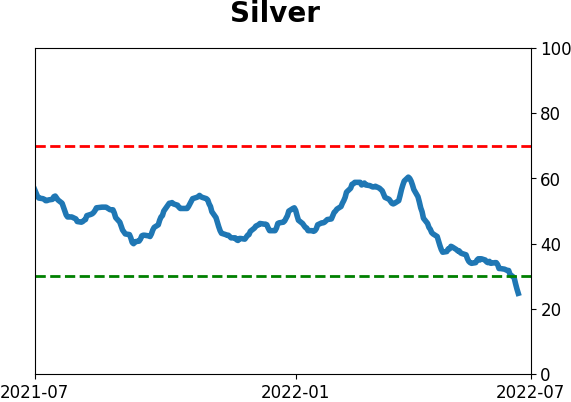
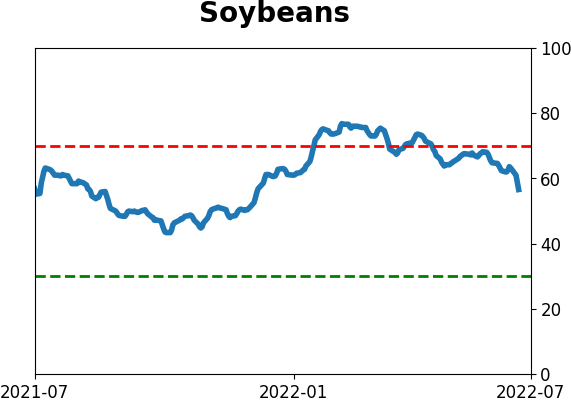
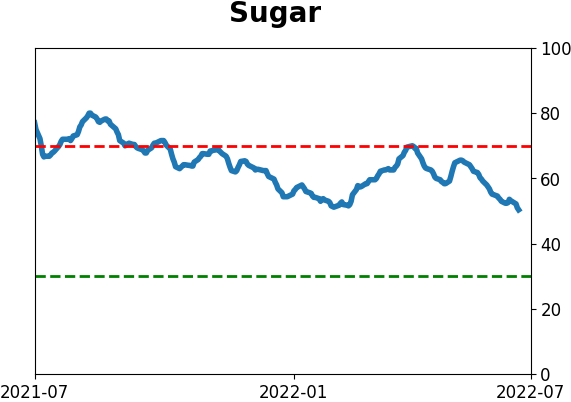
Commodity ETF's - 5-Day Moving Average
|
|