Headlines
|
|
A Record Breaking Half for Fund Flows:
There has been a flood of money into equity mutual funds and ETFs over the past 6 months, the most ever for the first half of a year. As a percentage of stocks' market cap, the inflows aren't nearly as extreme but still high enough to show poor forward returns.
Bottom Line:
See the Outlook & Allocations page for more details on these summaries STOCKS: Hold
The speculative frenzy in February is wrung out. Internal dynamics have mostly held up, with some exceptions. Many of our studies still show a mixed to poor short-term view, with medium- and long-term ones turning more positive. BONDS: Hold
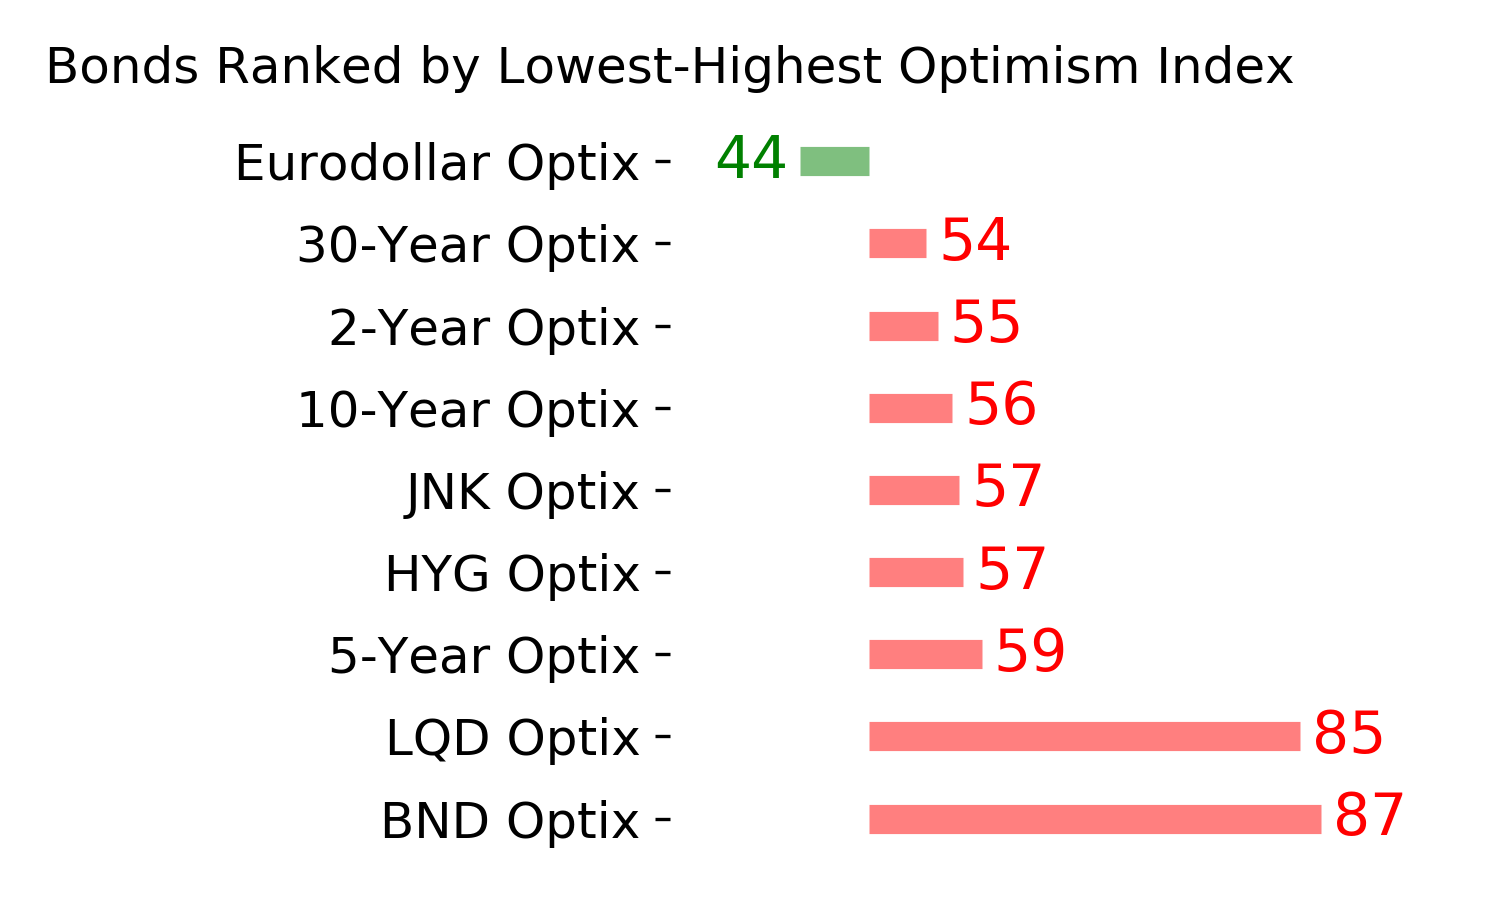
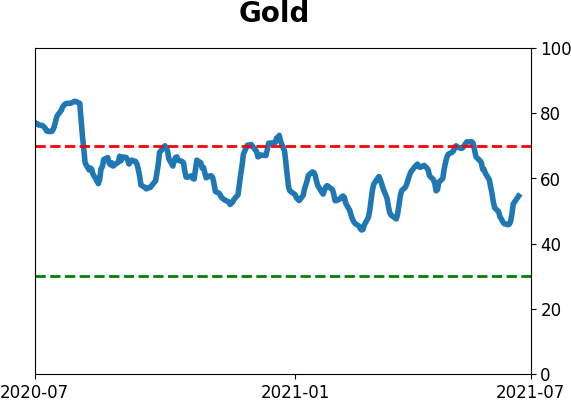
Various parts of the market got hit in March, with the lowest Bond Optimism Index we usually see during healthy environments. After a shaky couple of weeks, the broad bond market has modestly recovered. Not a big edge here either way. GOLD: Hold
Gold and miners have done very well, recovering above long-term trend lines. The issue is that both have tended to perform poorly after similar situations - will have to wait and see how it plays out.
|
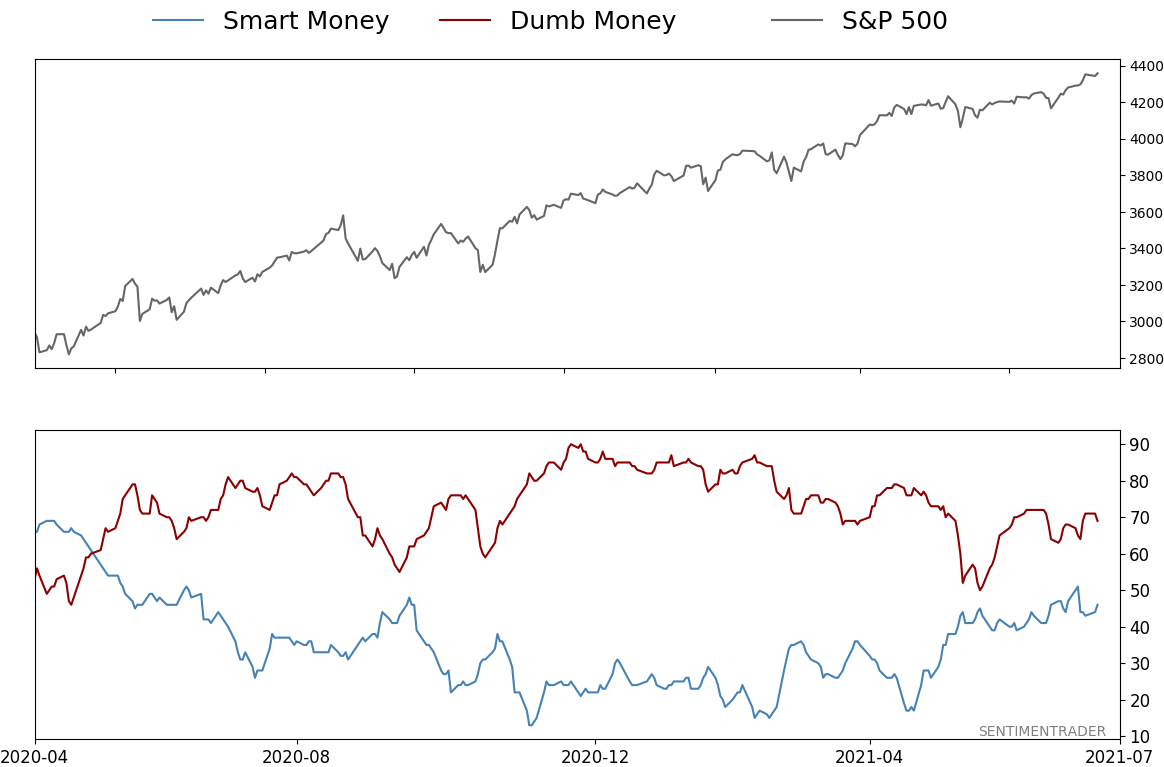
Smart / Dumb Money Confidence
|
Smart Money Confidence: 46%
Dumb Money Confidence: 69%
|
|
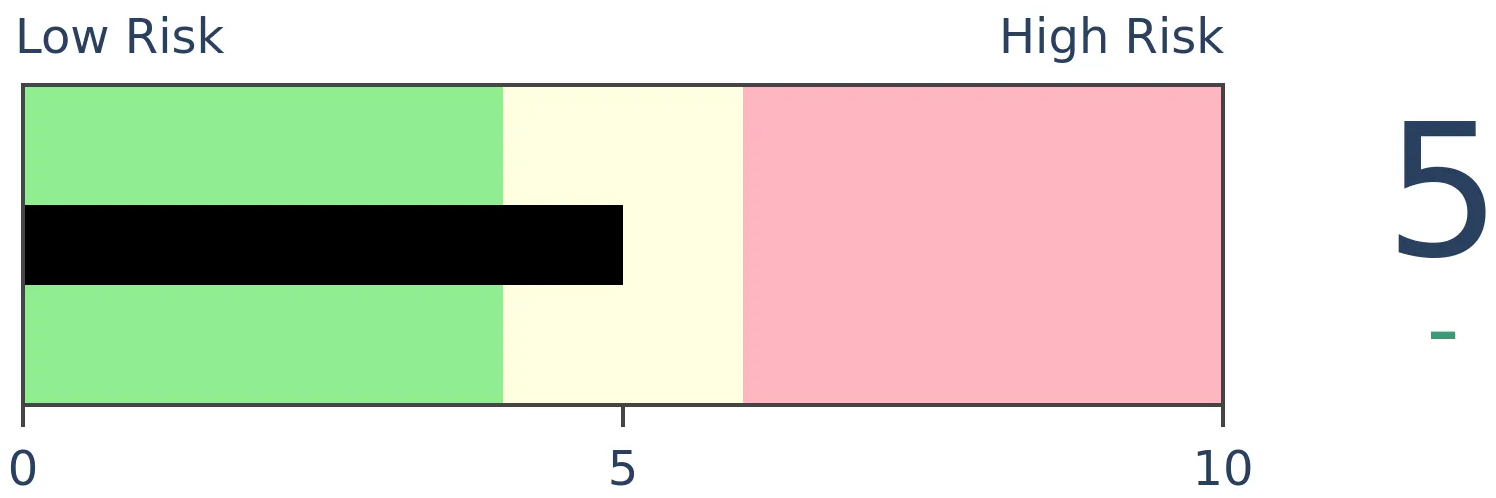
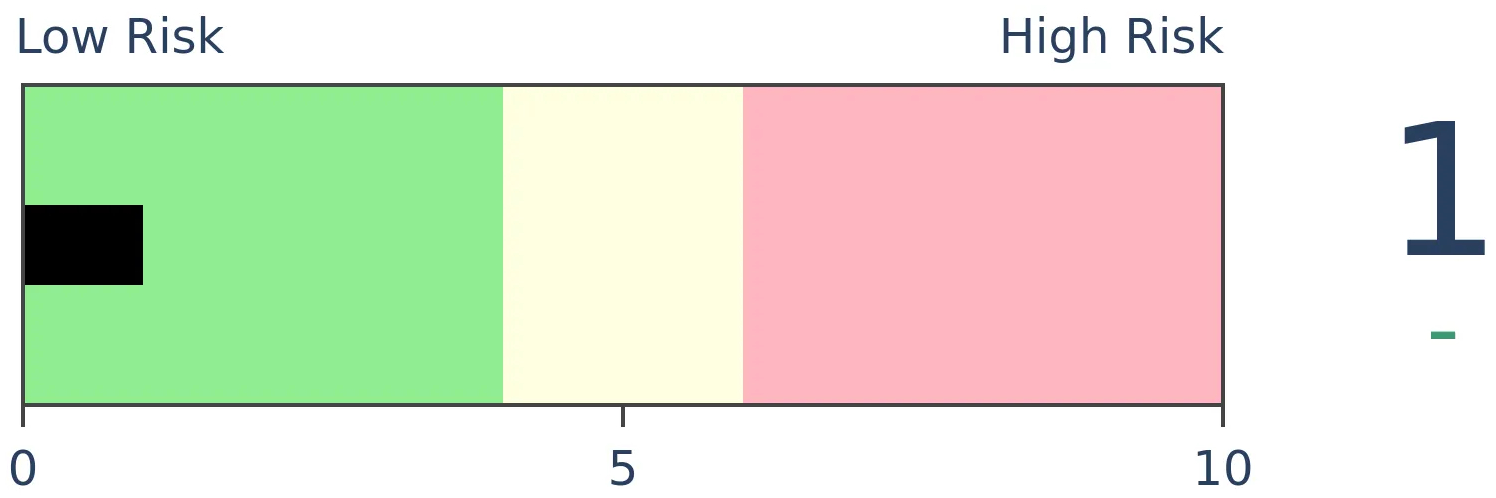
Risk Levels
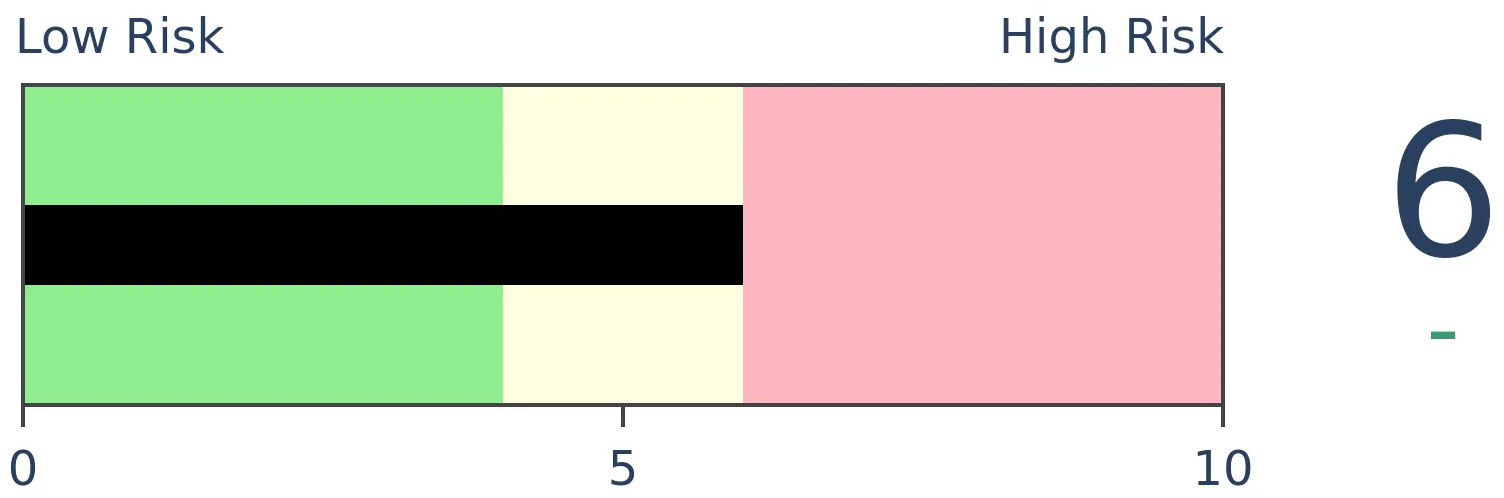
Stocks Short-Term
|
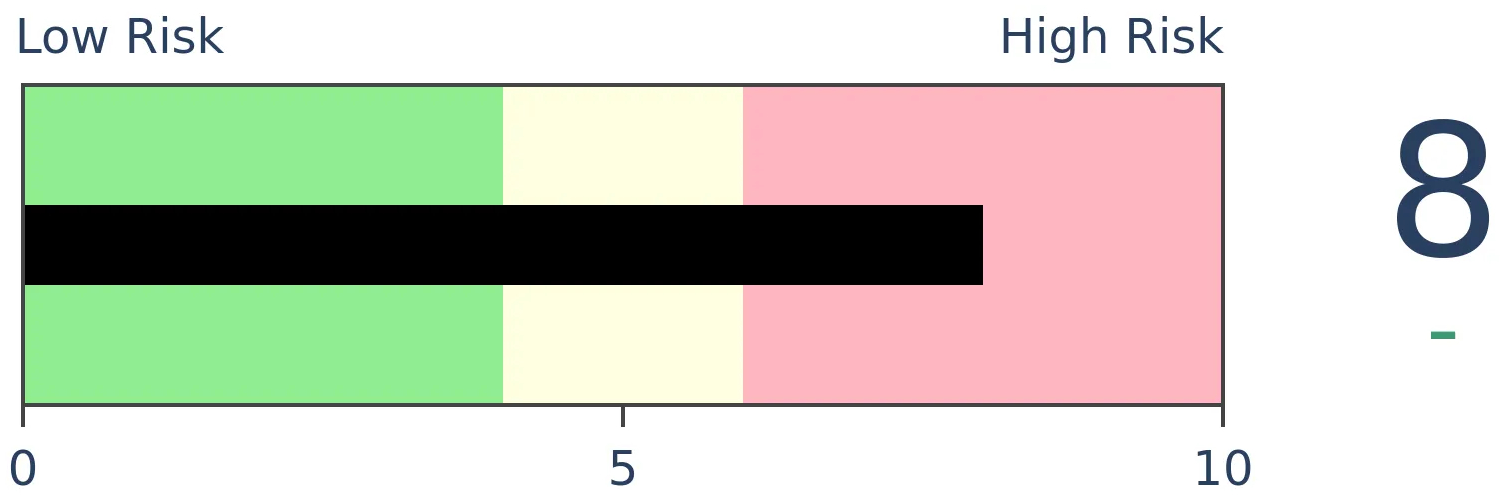
Stocks Medium-Term
|
|
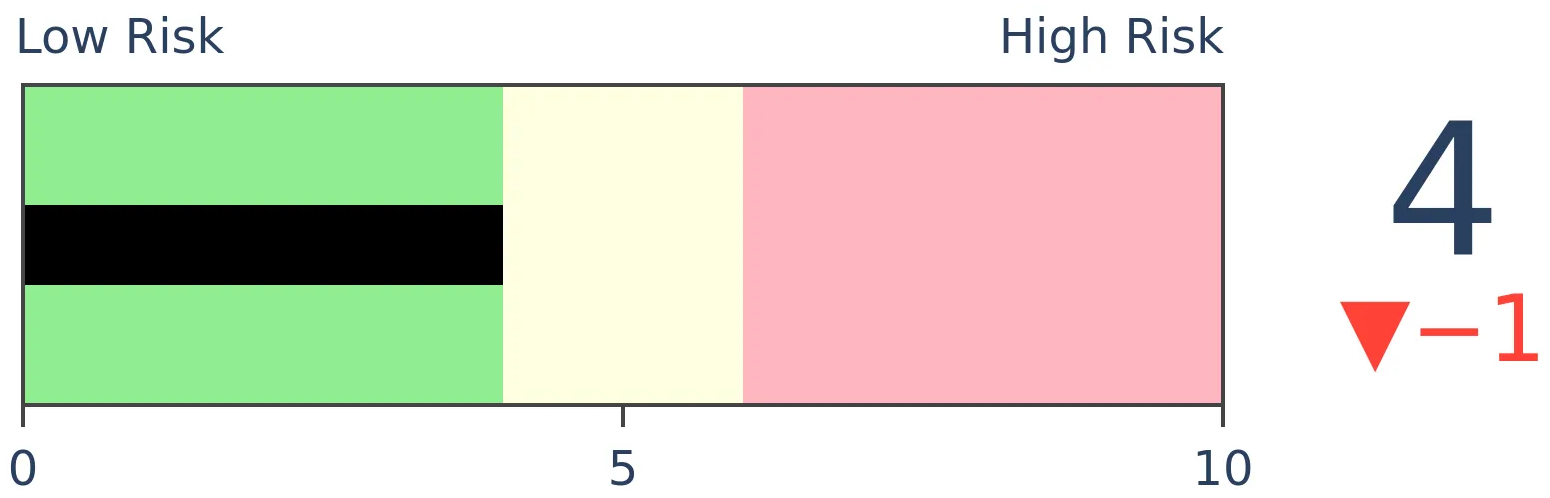
Bonds
|
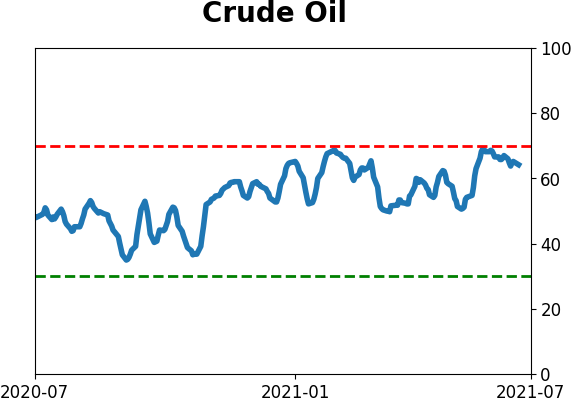
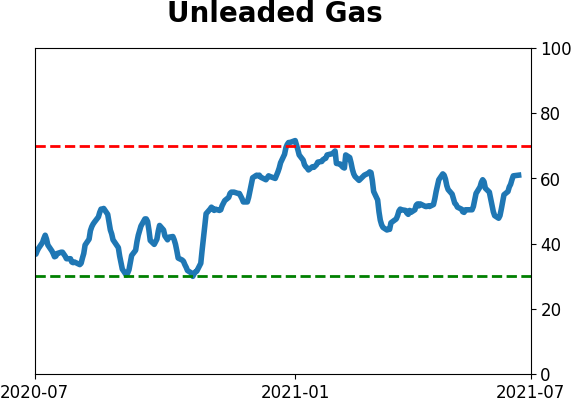
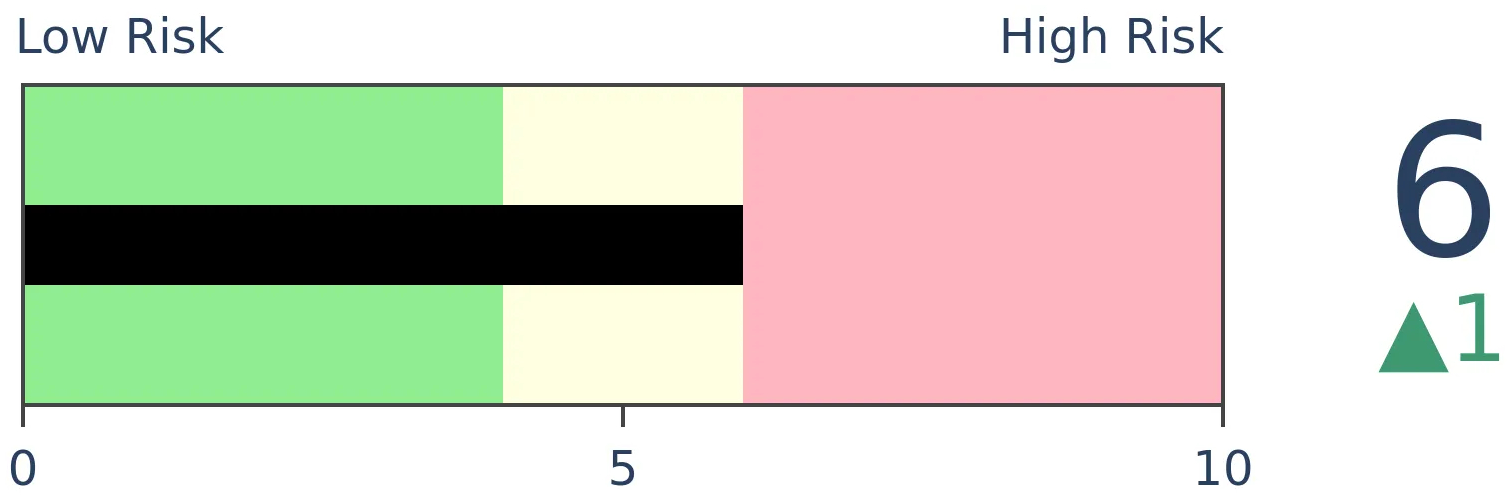
Crude Oil
|
|
Gold
|
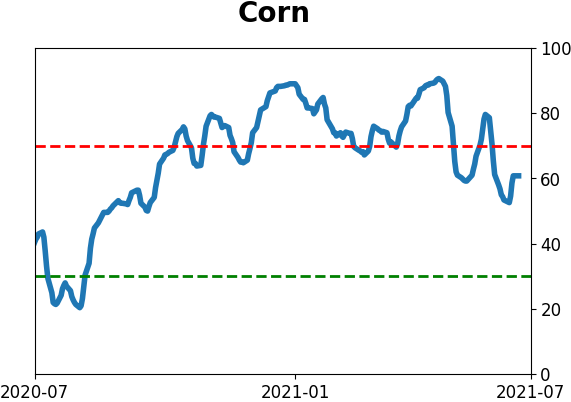
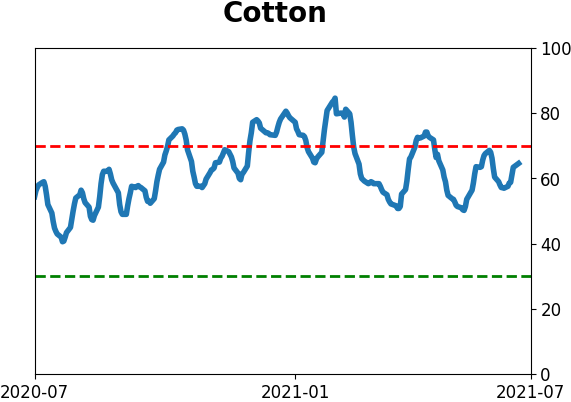
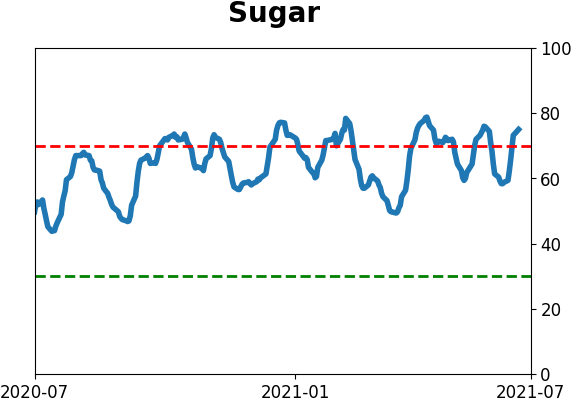
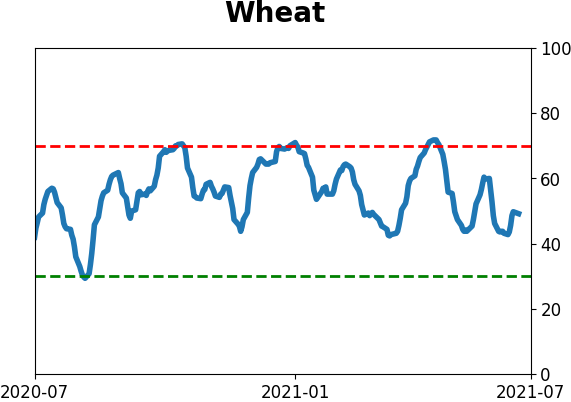
Agriculture
|
|
Research
BOTTOM LINE
There has been a flood of money into equity mutual funds and ETFs over the past 6 months, the most ever for the first half of a year. As a percentage of stocks' market cap, the inflows aren't nearly as extreme but still high enough to show poor forward returns.
FORECAST / TIMEFRAME
None
|
Stocks keep hitting records, there hasn't been even a pullback for six months, and investors are feeling good. And what do investors do when they're feeling good? Why, they add to their bets, of course.
Through June, equity mutual funds and ETFs have taken in more than $122 billion in assets, according to Lipper. That's the best first half for flows in almost 20 years. The only first half that exceeds this flow, in or out, was the pandemic-inspired outflow last year.
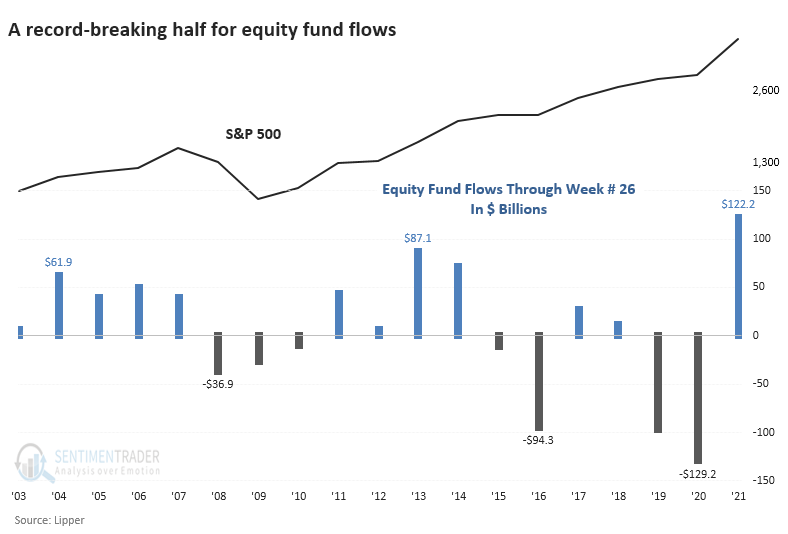
This is a bit restrictive since it's only looking at flows through the first half of each year, but it's still more extreme than any other 6-month stretch in 20 years.
A LOOSER LOOK AT FLOWS
If we remove the calendar and just look at every rolling 6-month period, we're still seeing a record flow. While it exceeds the prior record from 2013, it only reverses some of the outflows from 2019 - 2020.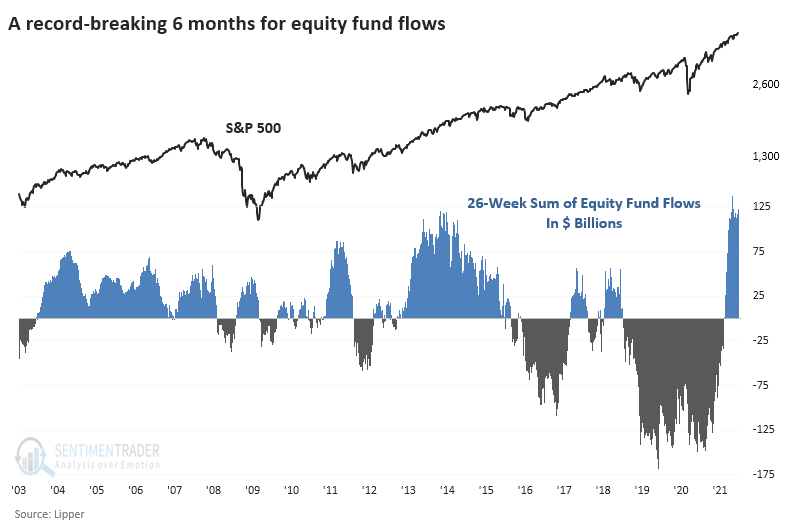
This is also a bit misleading because it ignores the fact that the overall size of the market has grown.
HIGH FLOWS = LOWER RETURNS
When we adjust fund flows for the total market capitalization of the U.S. stock market, then the past six months don't seem to be as much of a driver as other periods. It's less than half the extremes reached in 2003, 2011, and 2013.
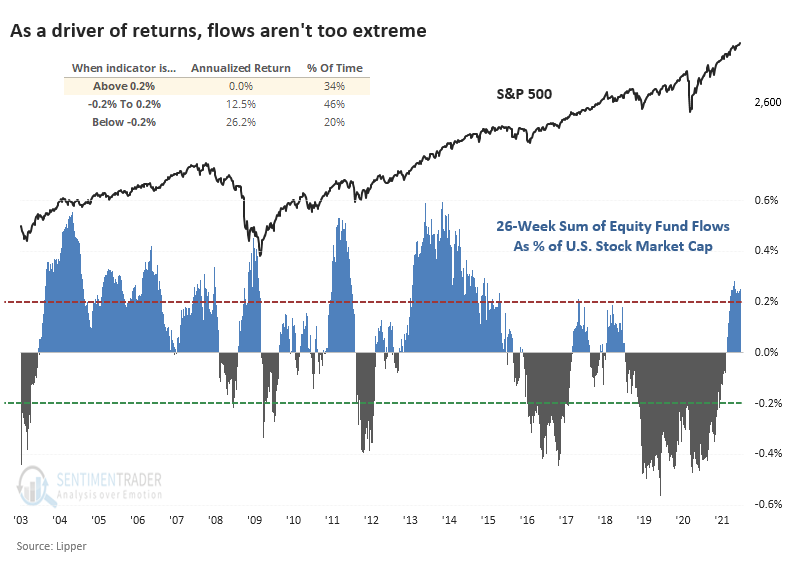
Still, there was a consistent contrary nature to investors' behavior. The higher the flow, the lower the S&P 500's annualized forward return. When it exceeded 0.2% of market cap, which it currently is, then the S&P 500's annualized future return was perfectly flat. That's far below the other periods when flows were less extreme or (especially) when there was an extreme outflow.
The biggest thing stocks have going for them is long-term momentum. There have been some shorter-term signs of internal deterioration, so that's a worry, as is the continued too-optimistic nature of sentiment. Fund flows are another sign that complacency is high enough to be a concern.
Active Studies
| Time Frame | Bullish | Bearish | | Short-Term | 0 | 1 | | Medium-Term | 2 | 2 | | Long-Term | 9 | 5 |
|
Indicators at Extremes
Portfolio
| Position | Description | Weight % | Added / Reduced | Date | | Stocks | RSP | 4.1 | Added 4.1% | 2021-05-19 | | Bonds | 23.9% BND, 6.9% SCHP | 30.7 | Reduced 7.1% | 2021-05-19 | | Commodities | GCC | 2.6 | Reduced 2.1%
| 2020-09-04 | | Precious Metals | GDX | 5.6 | Reduced 4.2% | 2021-05-19 | | Special Situations | 4.3% XLE, 2.2% PSCE | 7.6 | Reduced 5.6% | 2021-04-22 | | Cash | | 49.4 | | |
|
Updates (Changes made today are underlined)
Much of our momentum and trend work has remained positive for several months, with some scattered exceptions. Almost all sentiment-related work has shown a poor risk/reward ratio for stocks, especially as speculation drove to record highs in exuberance in February. Much of that has worn off, and most of our models are back toward neutral levels. There isn't much to be excited about here. The same goes for bonds and even gold. Gold has been performing well lately and is back above long-term trend lines. The issue is that it has a poor record of holding onto gains when attempting a long-term trend change like this, so we'll take a wait-and-see approach. RETURN YTD: 9.2% 2020: 8.1%, 2019: 12.6%, 2018: 0.6%, 2017: 3.8%, 2016: 17.1%, 2015: 9.2%, 2014: 14.5%, 2013: 2.2%, 2012: 10.8%, 2011: 16.5%, 2010: 15.3%, 2009: 23.9%, 2008: 16.2%, 2007: 7.8%
|
|
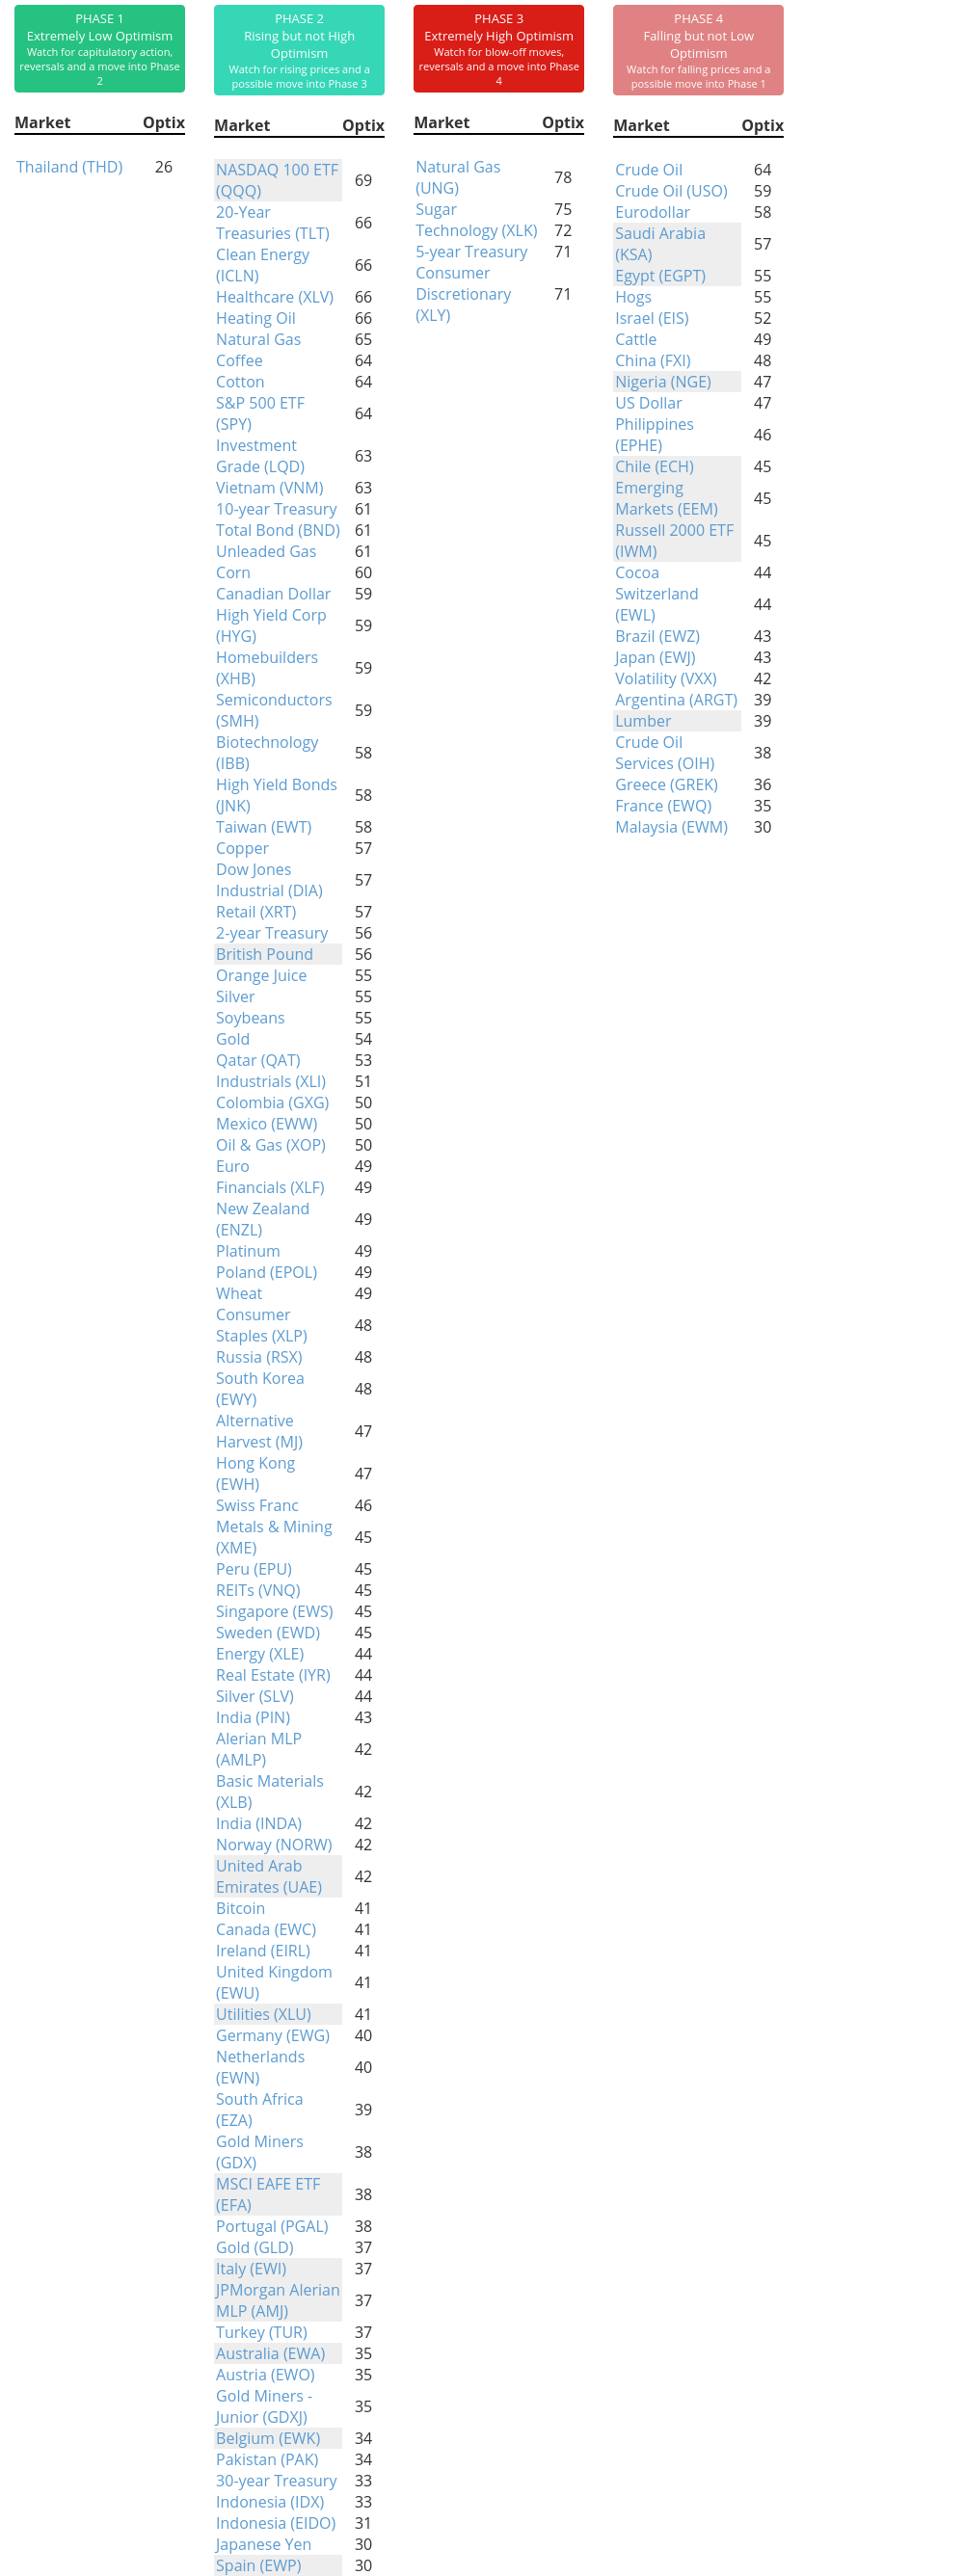
Phase Table
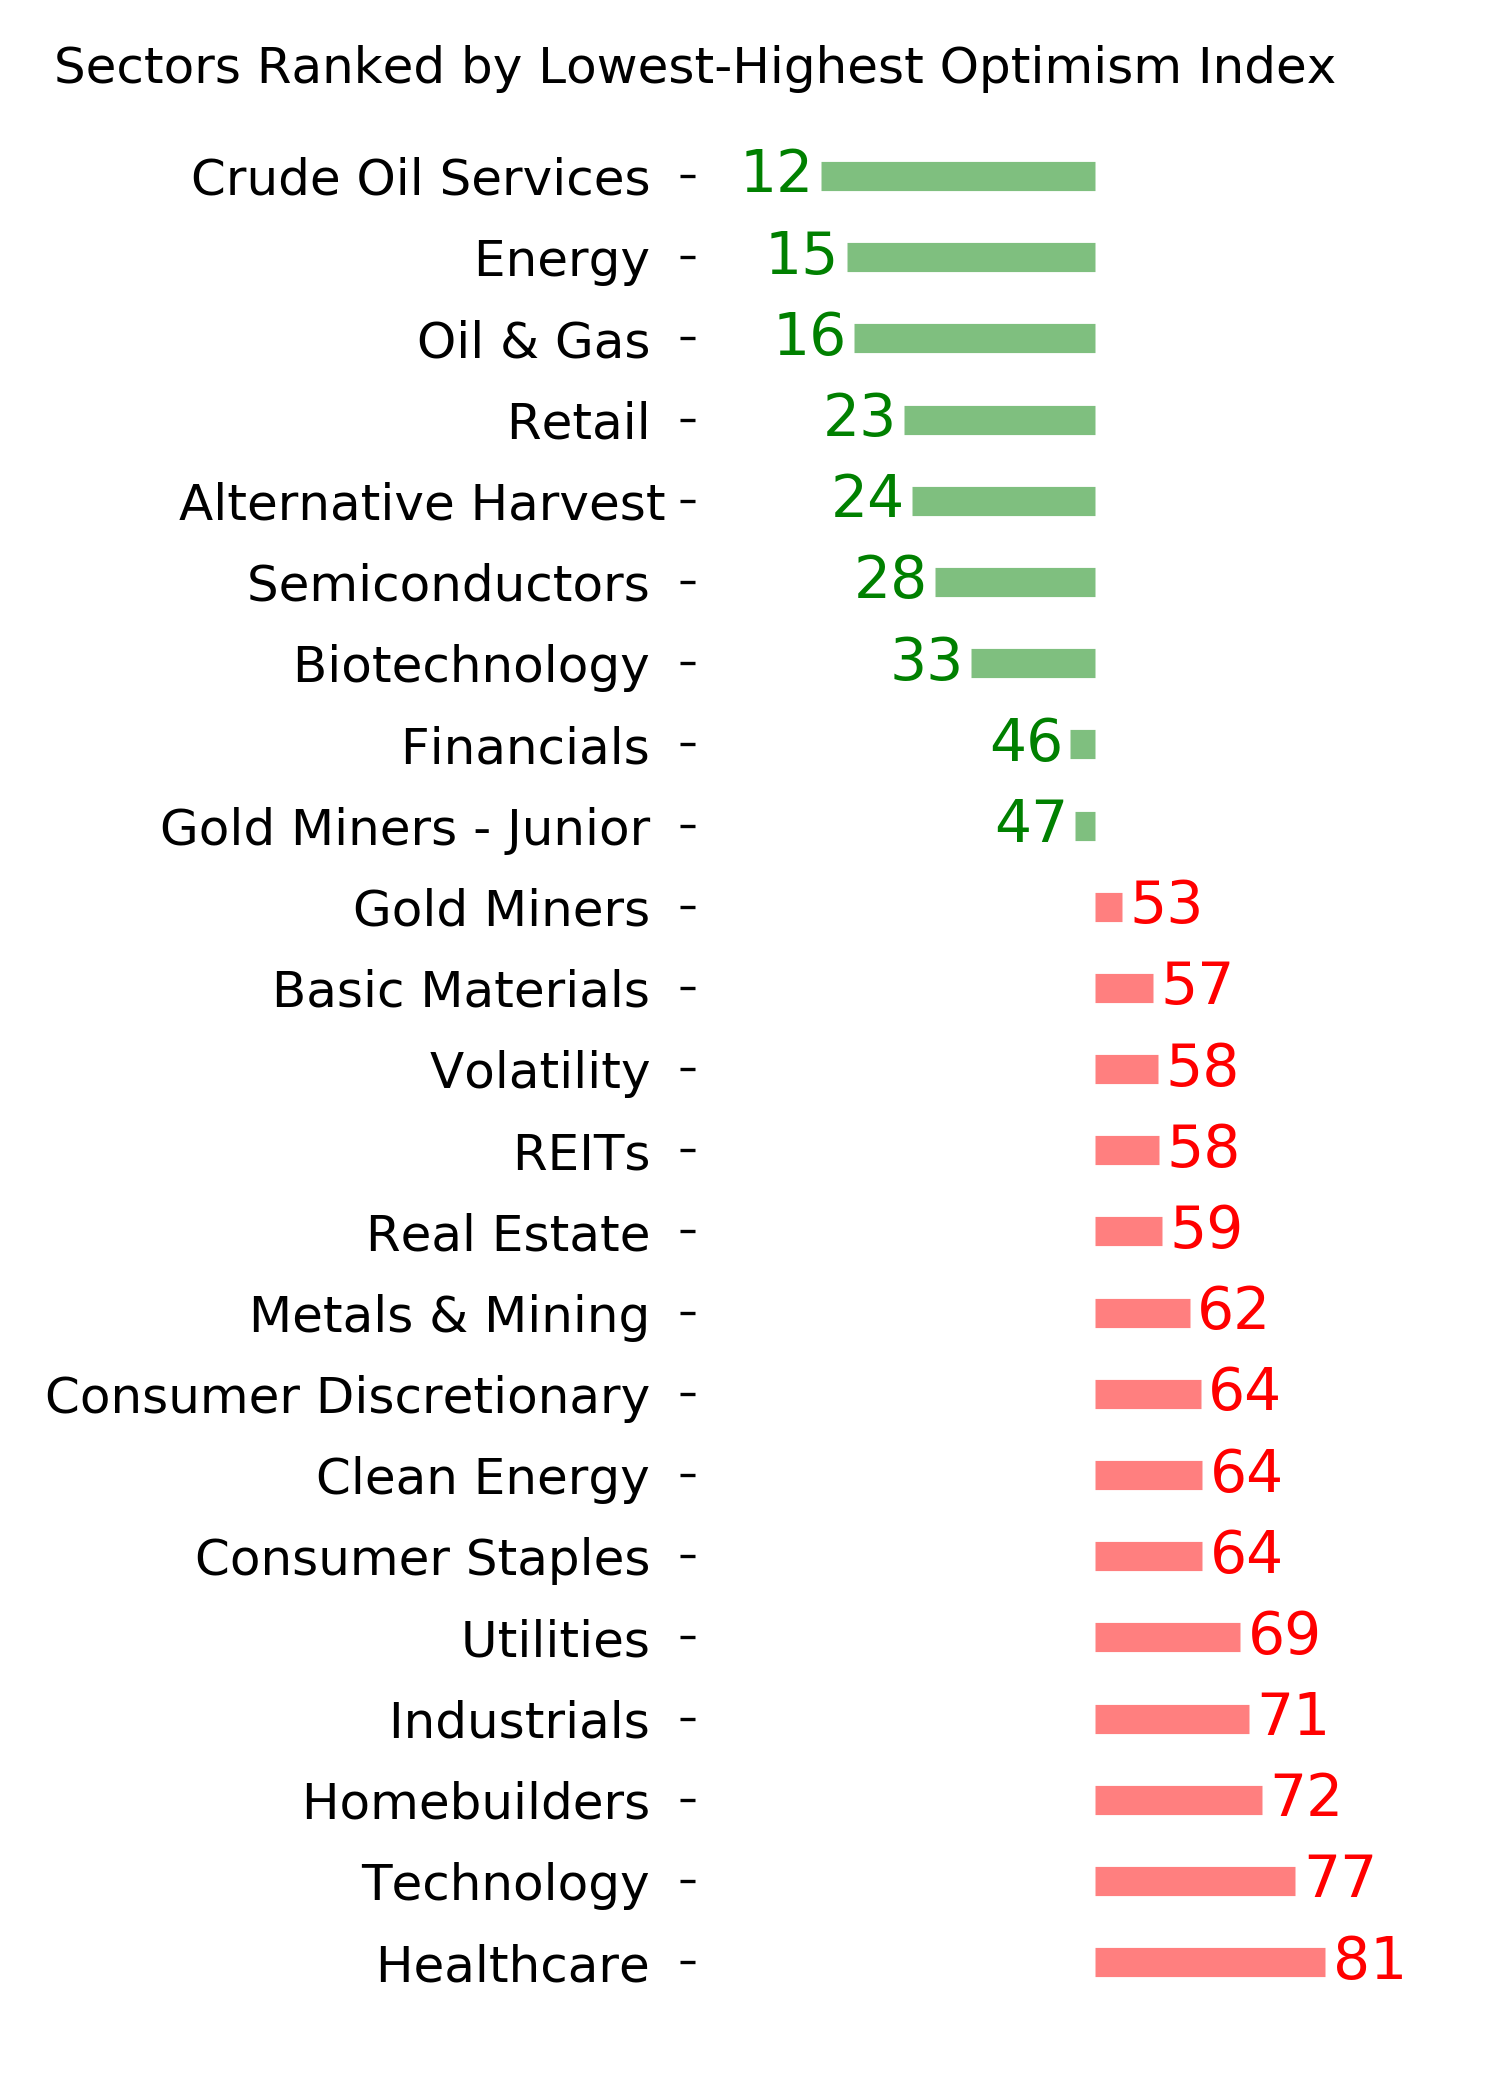
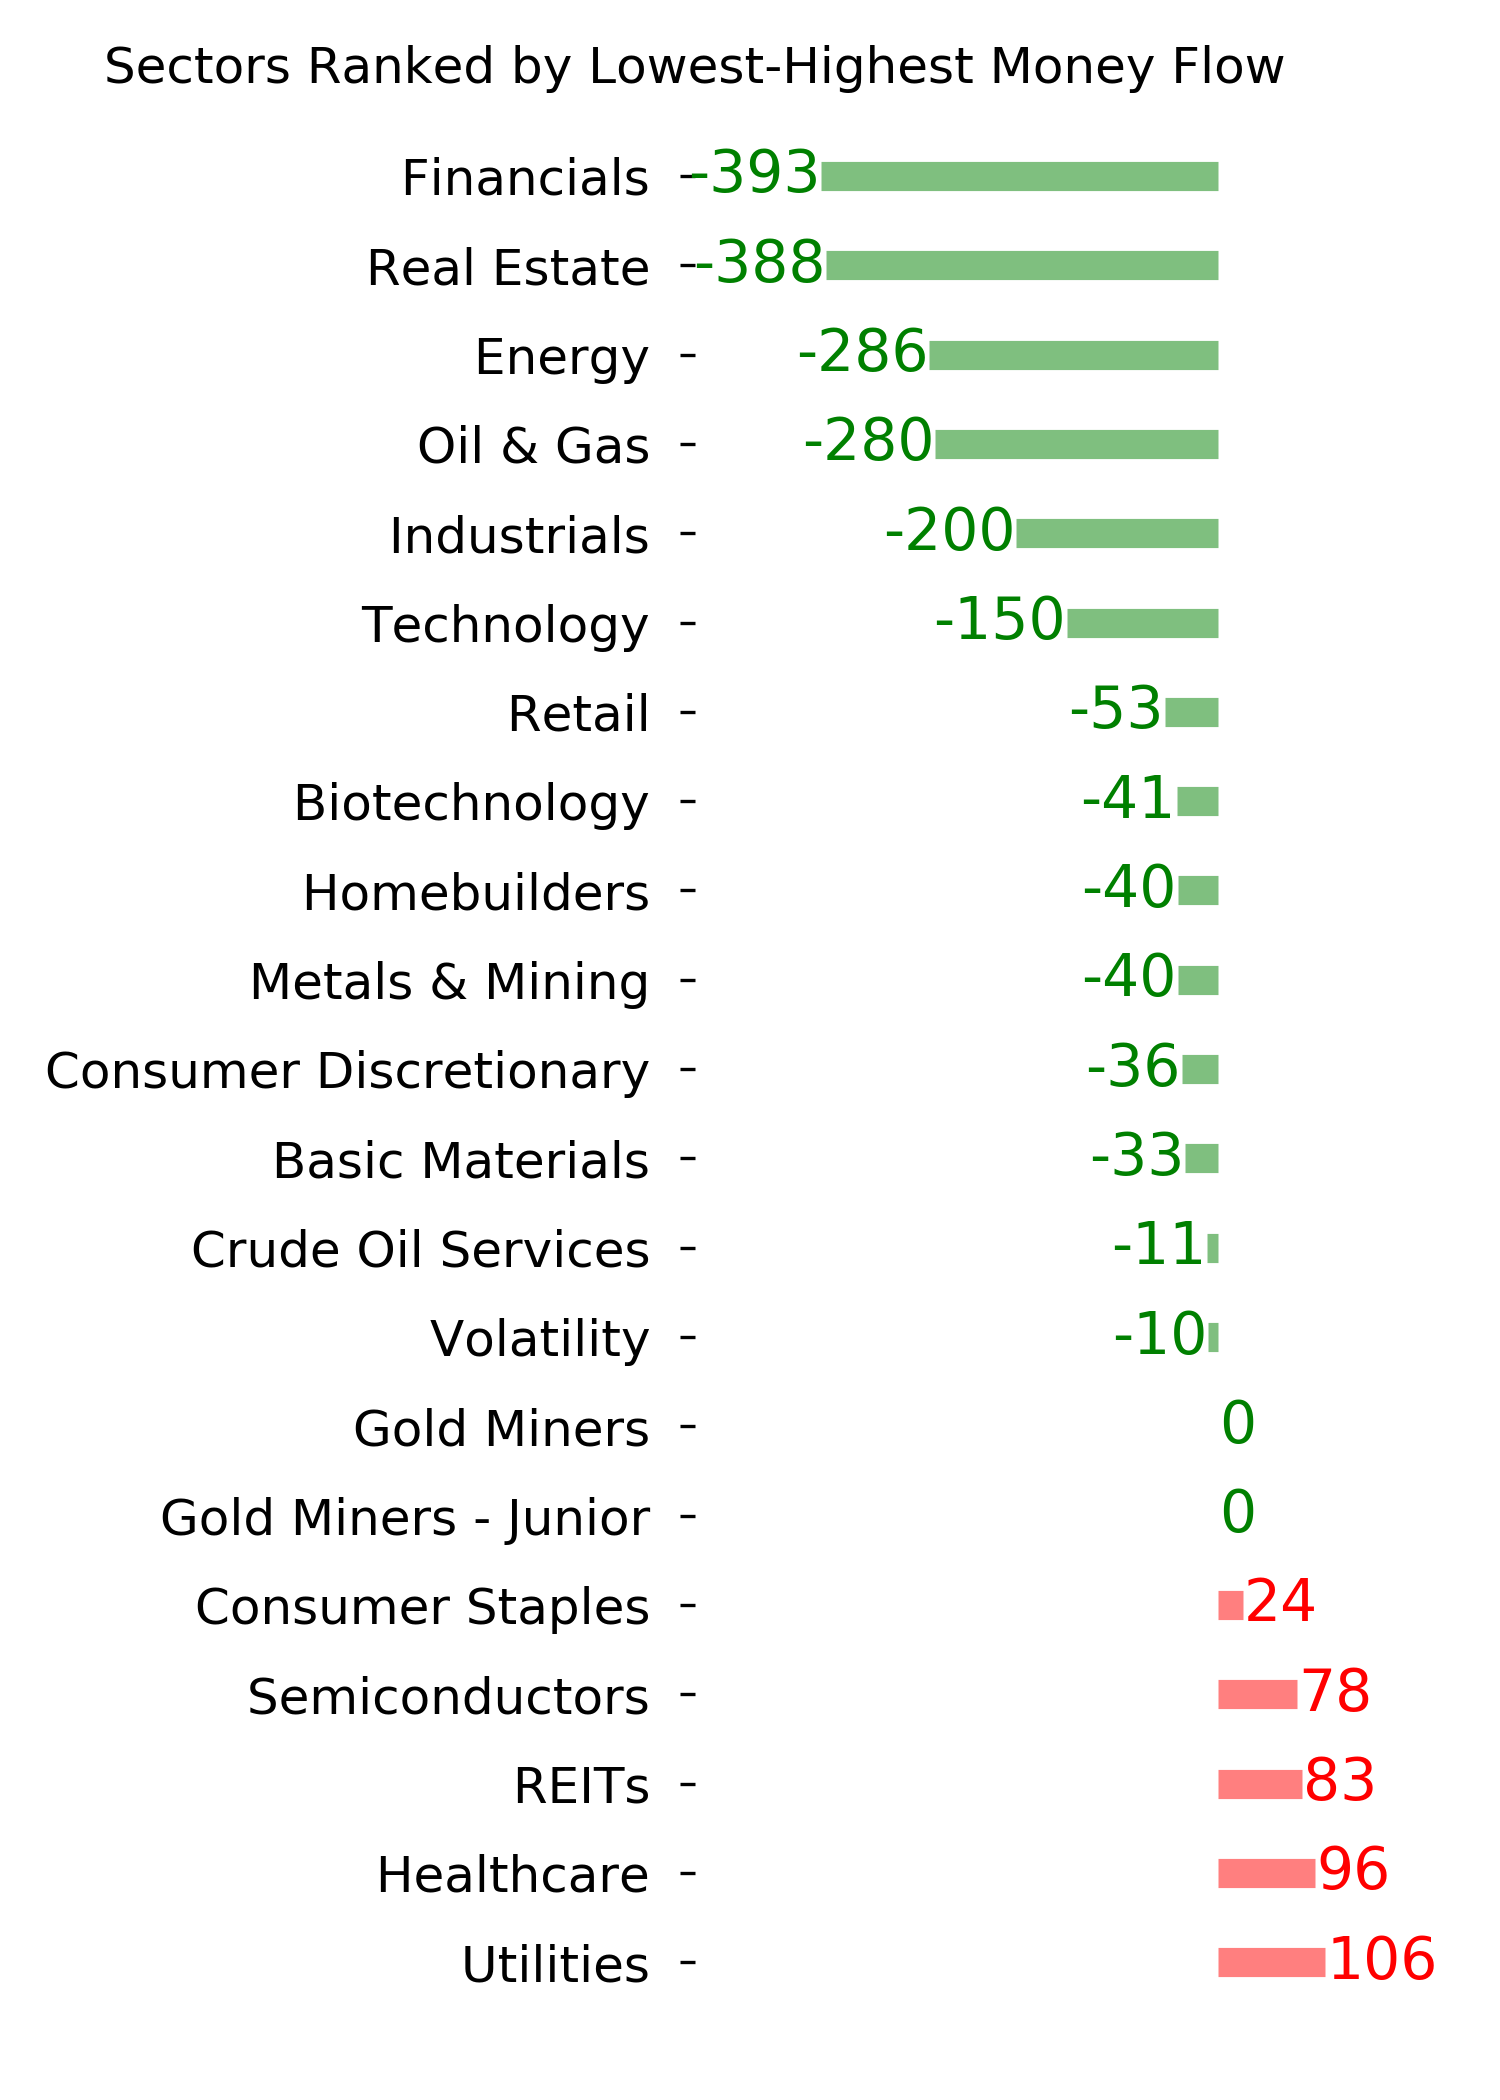
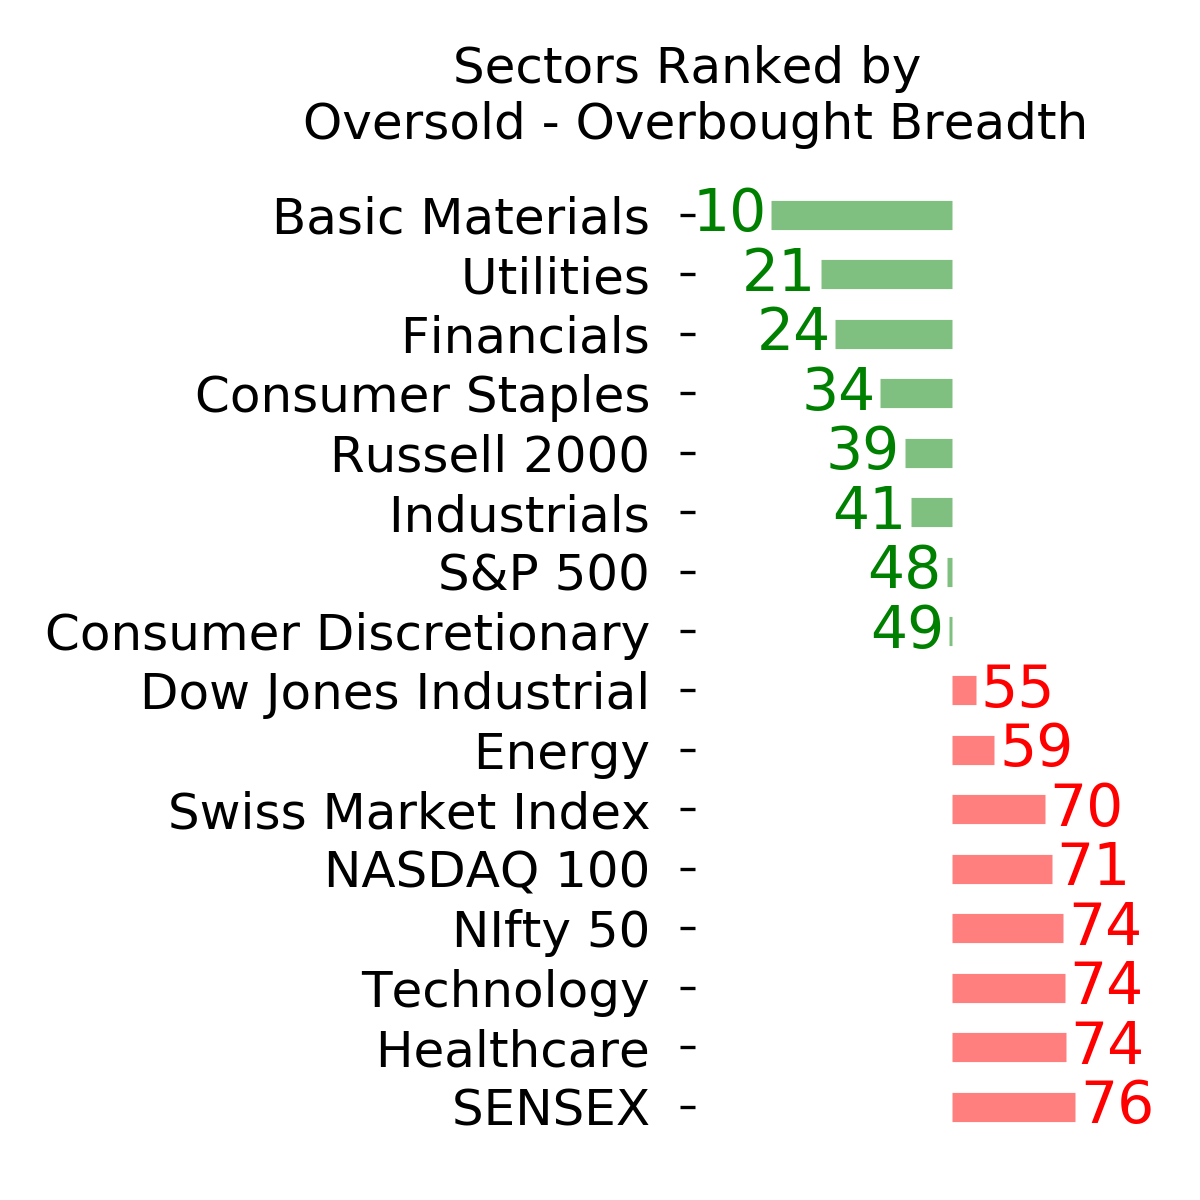
Ranks
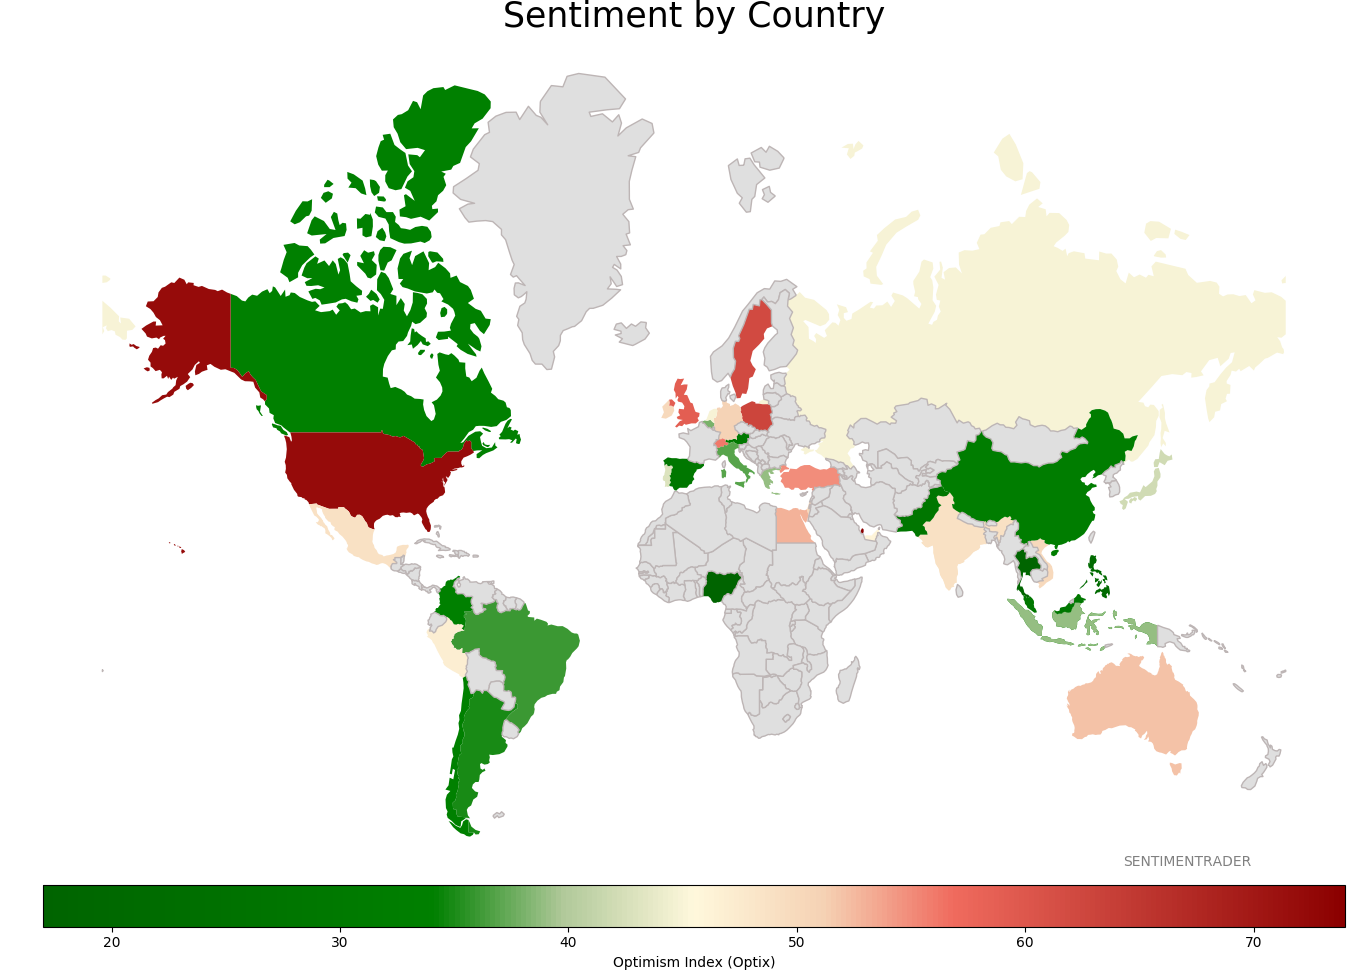
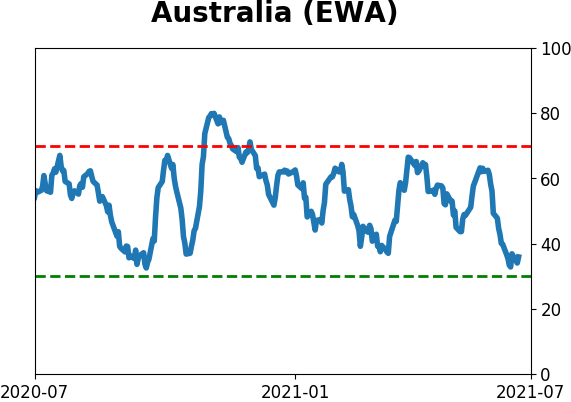
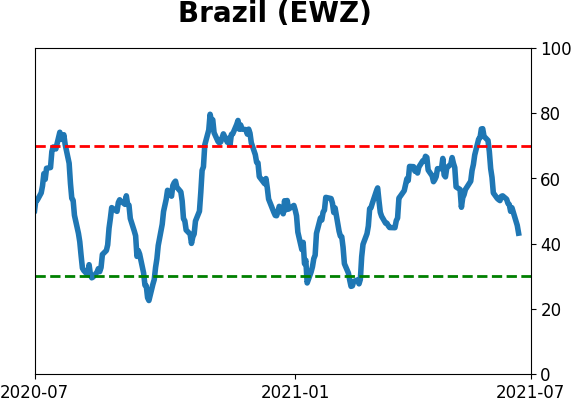
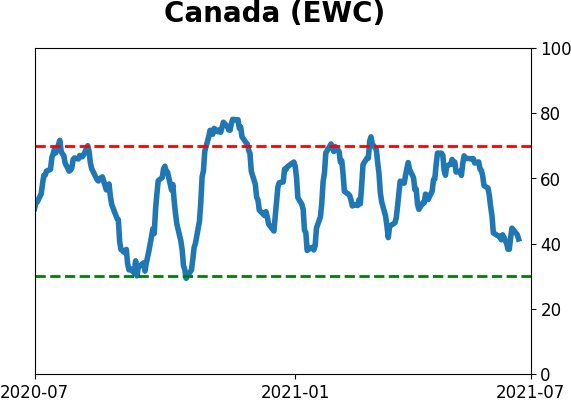
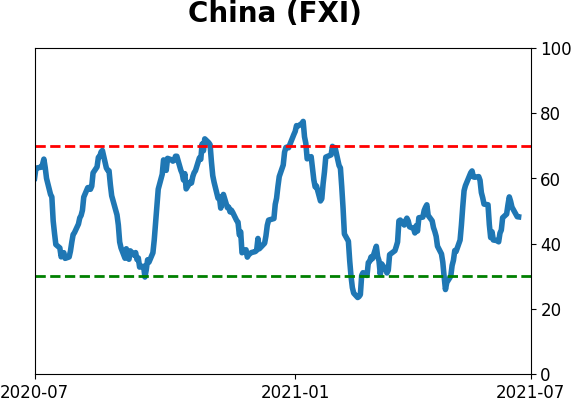
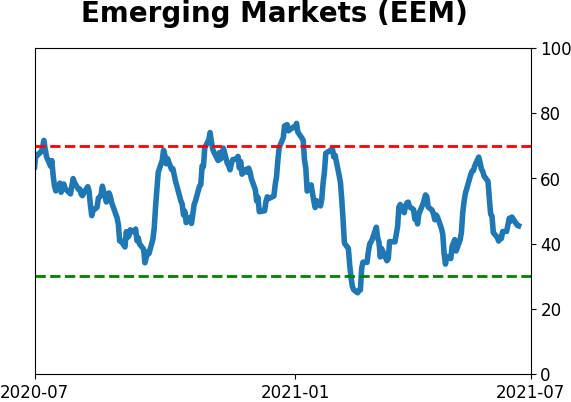
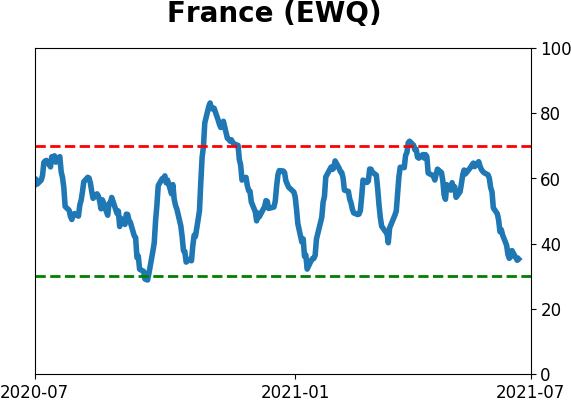
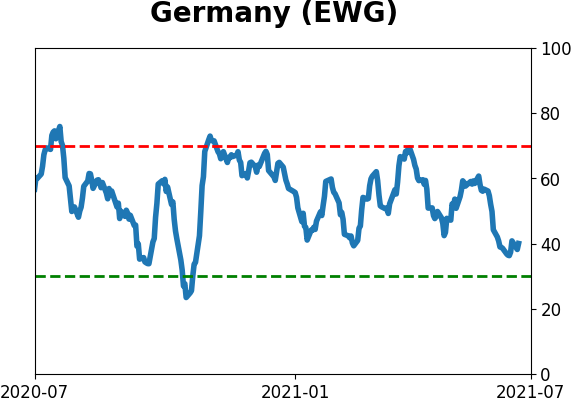
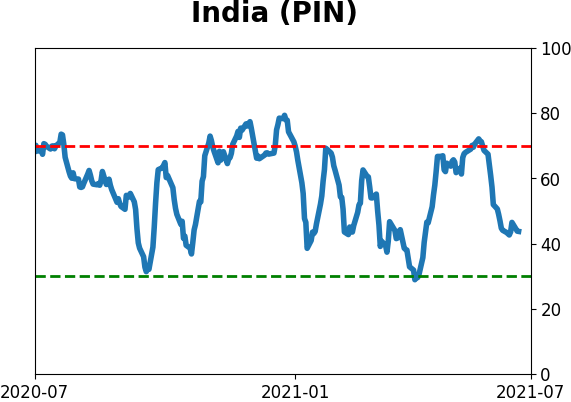
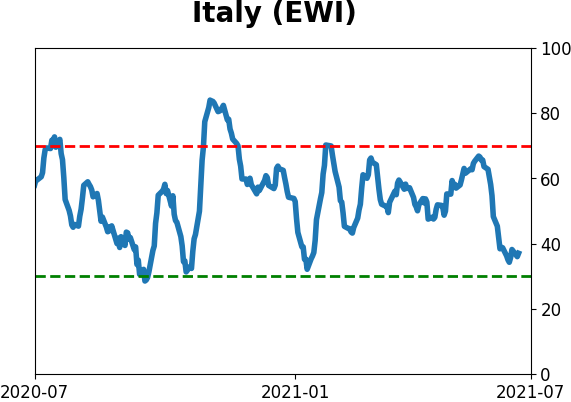
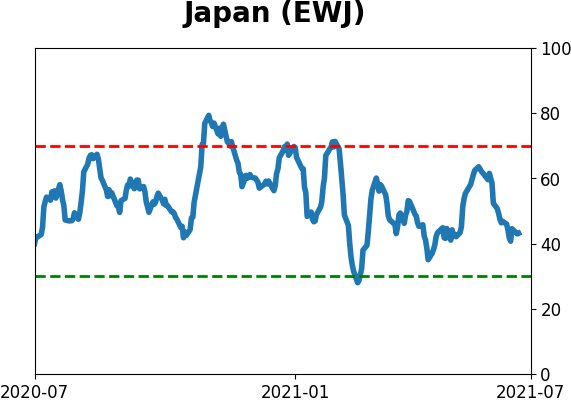
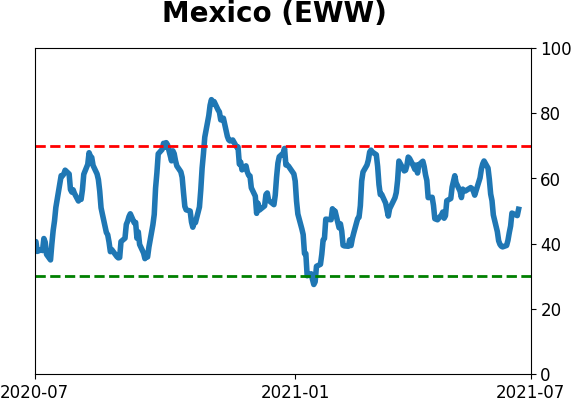
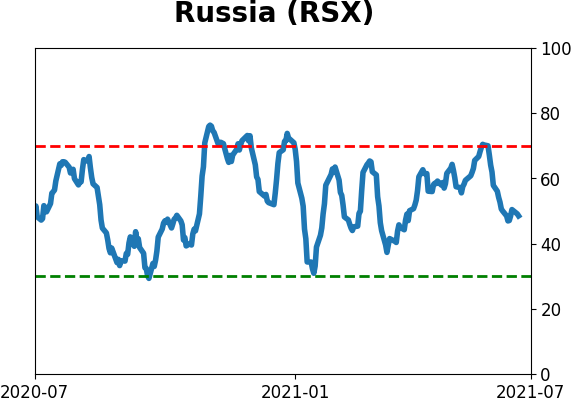
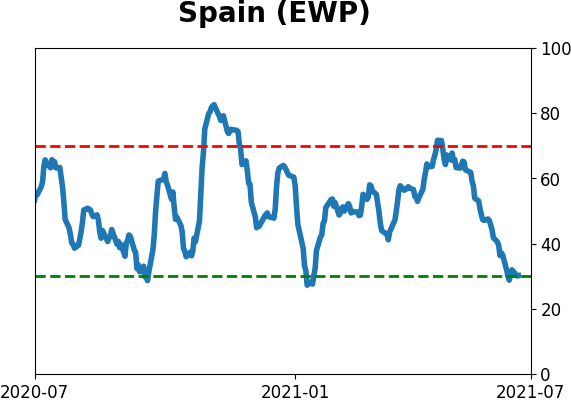
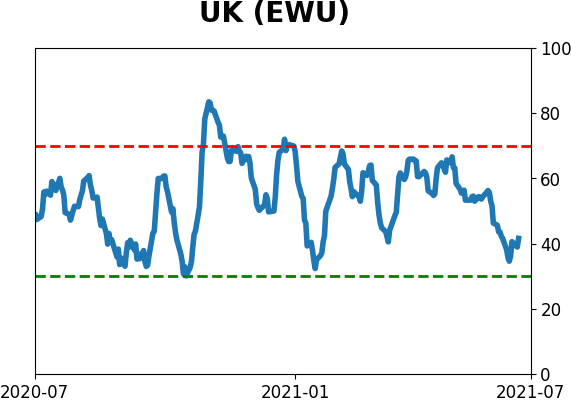
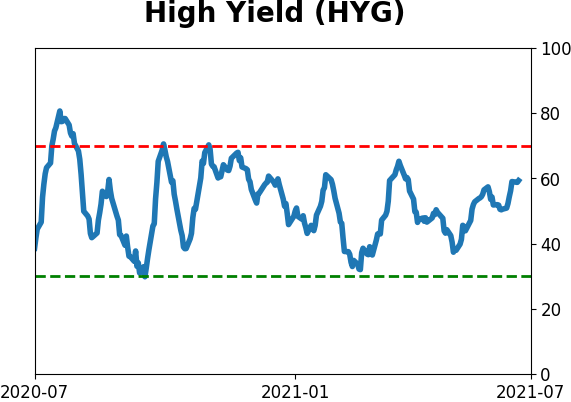
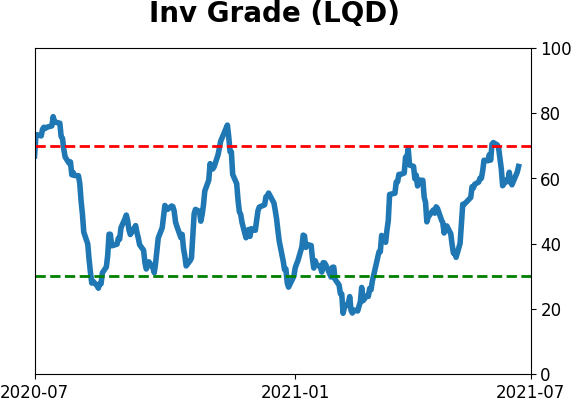
Sentiment Around The World
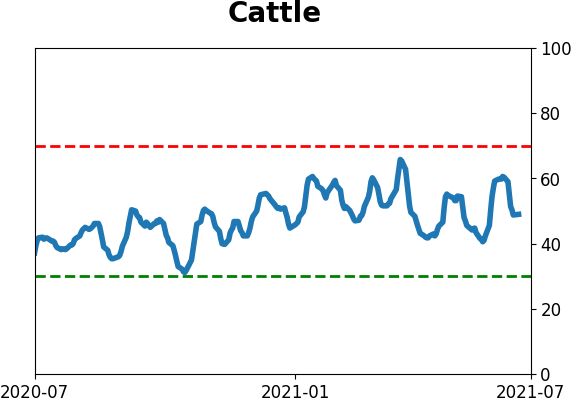
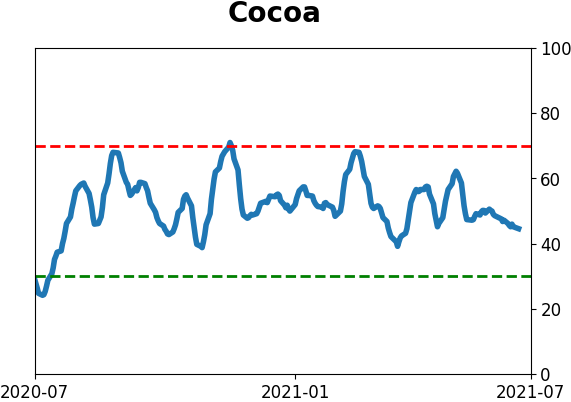
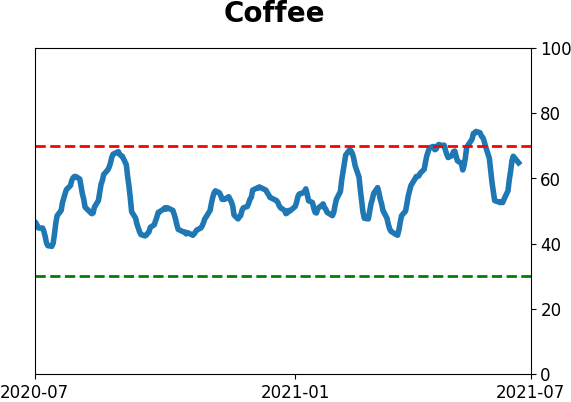
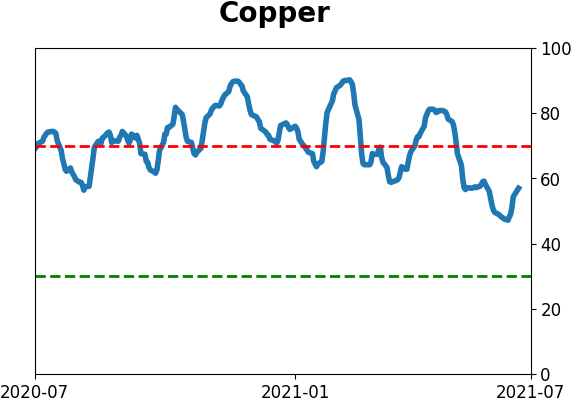
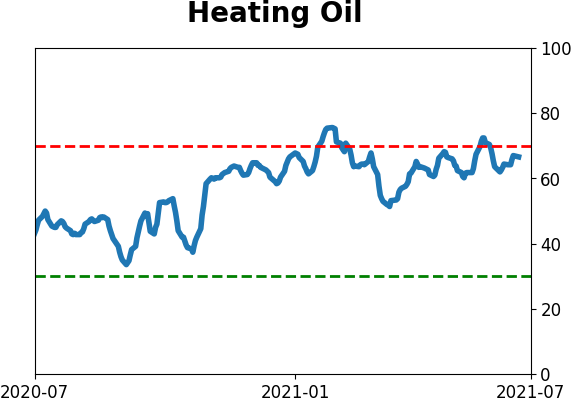
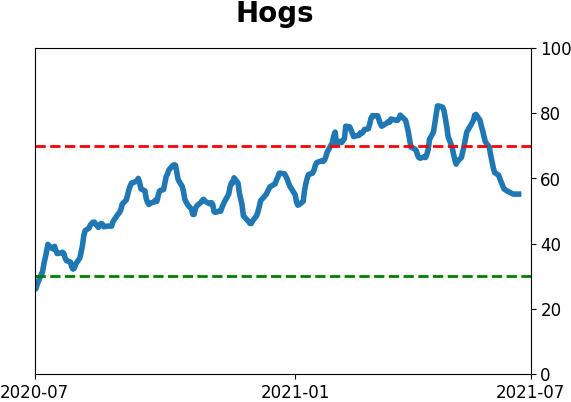
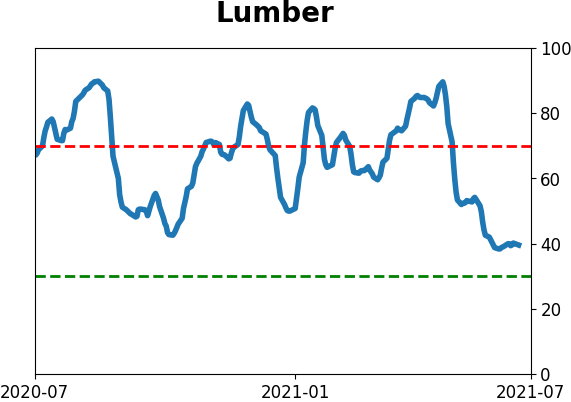
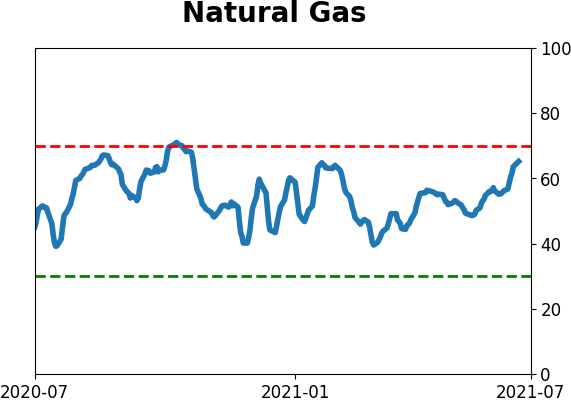
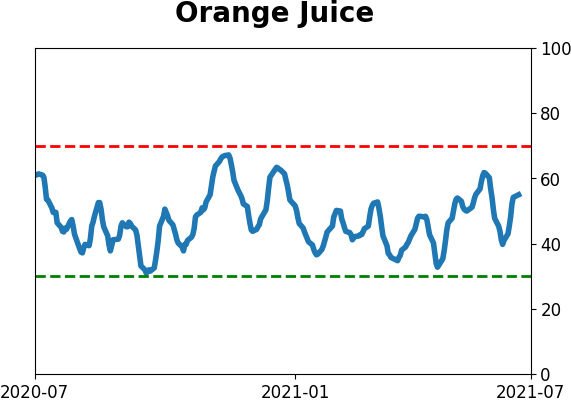
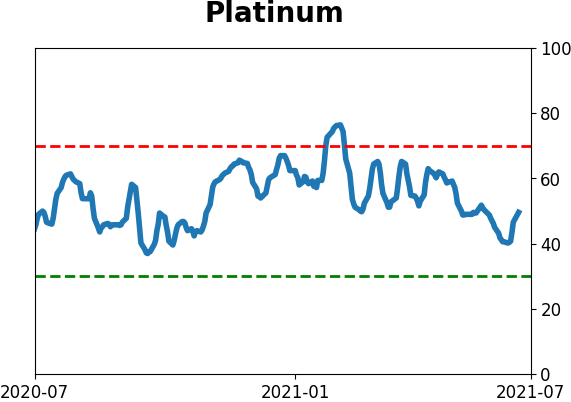
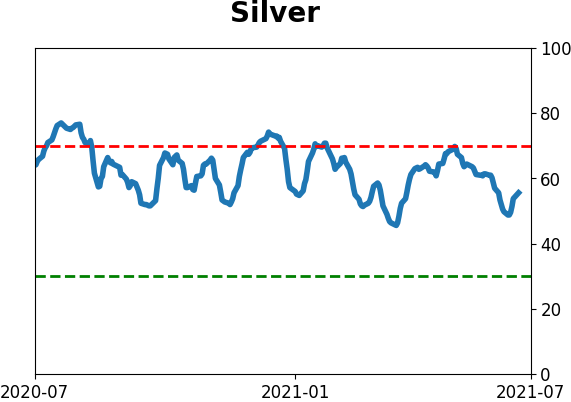
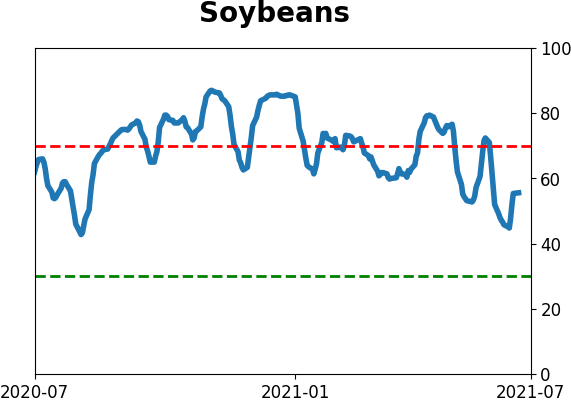
Optimism Index Thumbnails
|
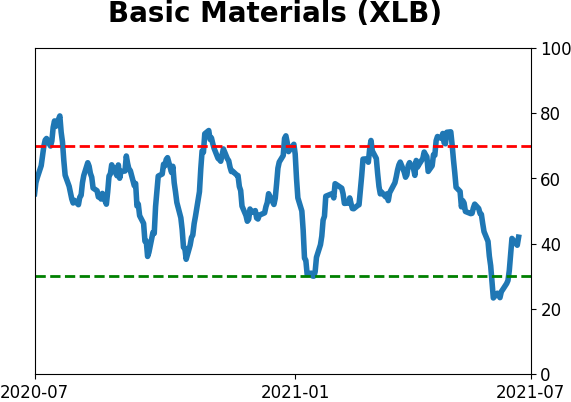
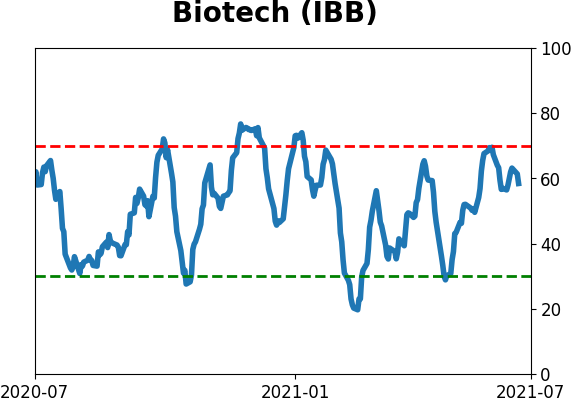
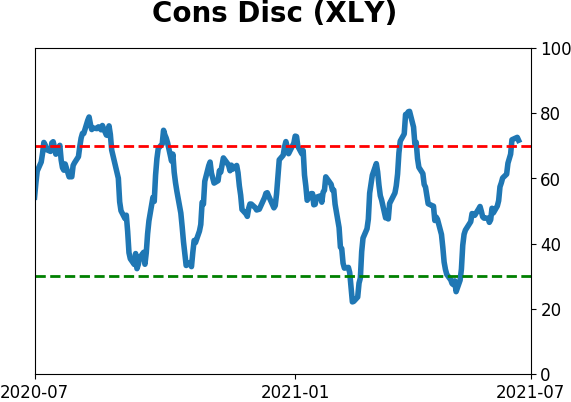
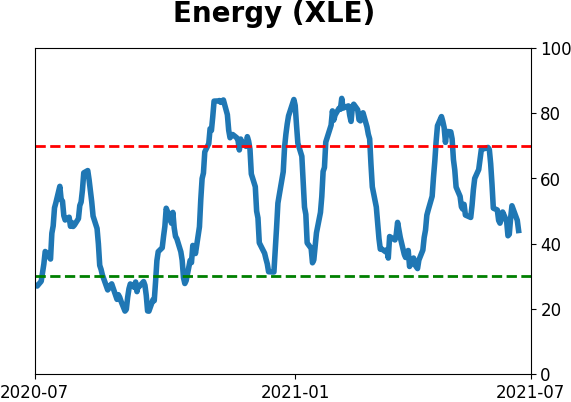
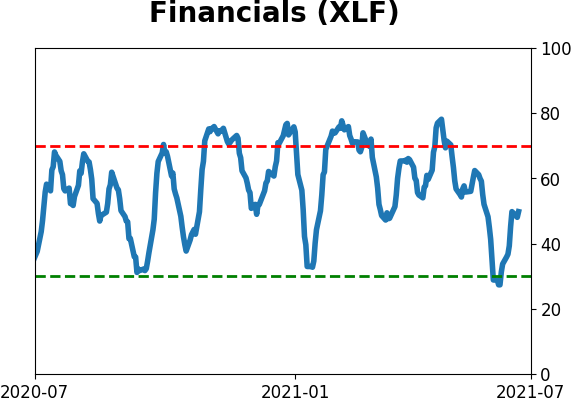
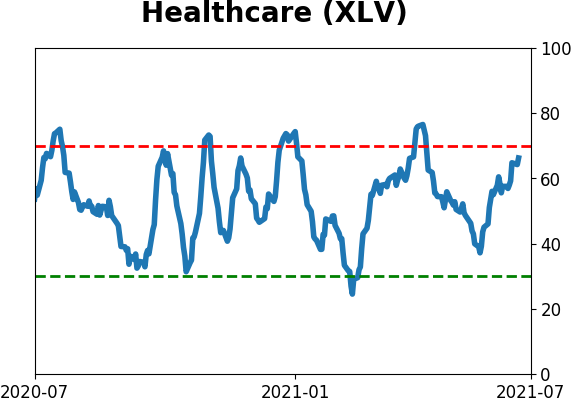
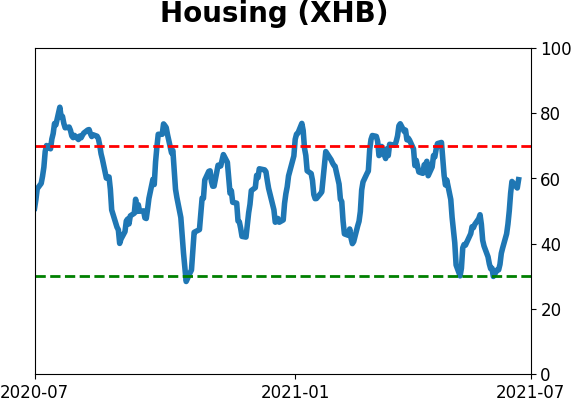
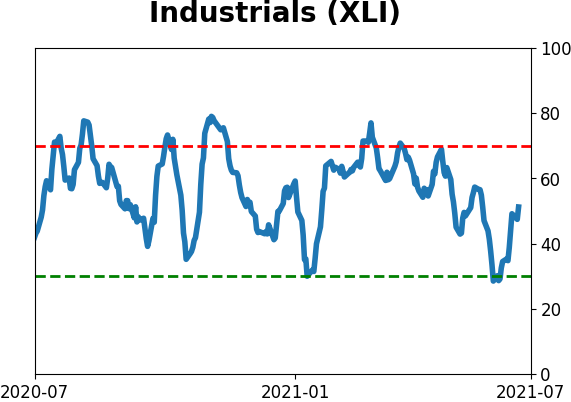
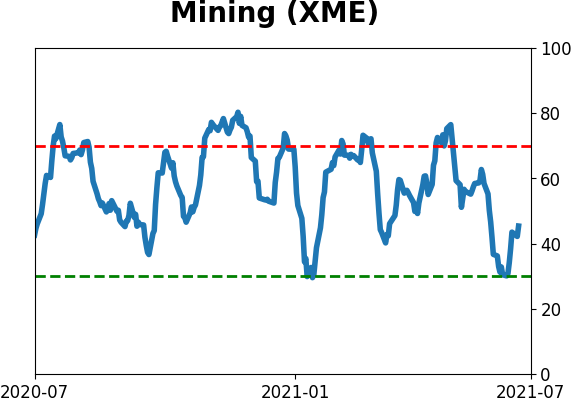
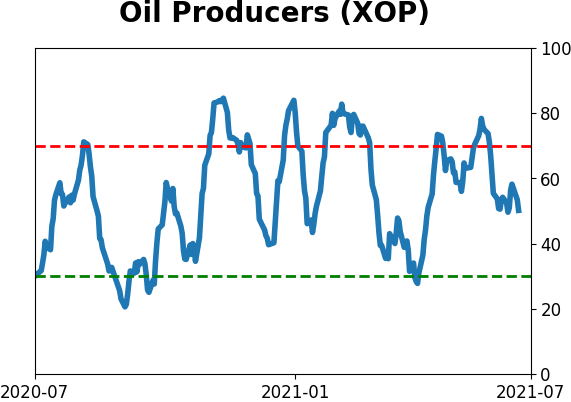
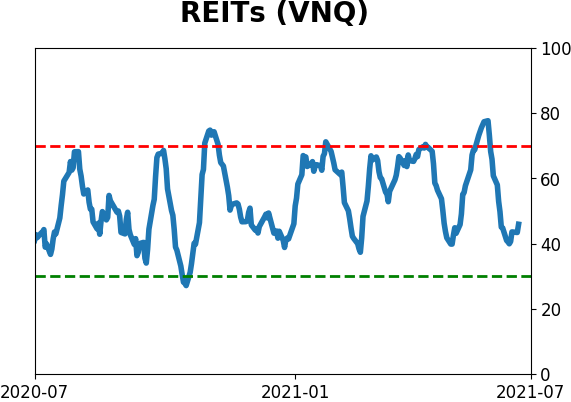
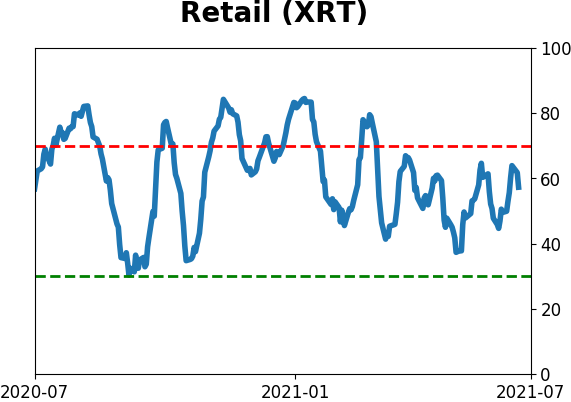
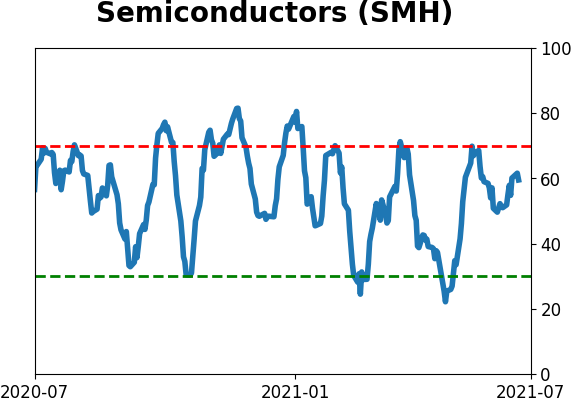
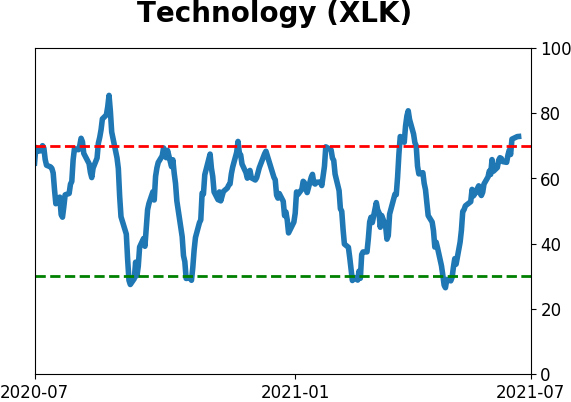
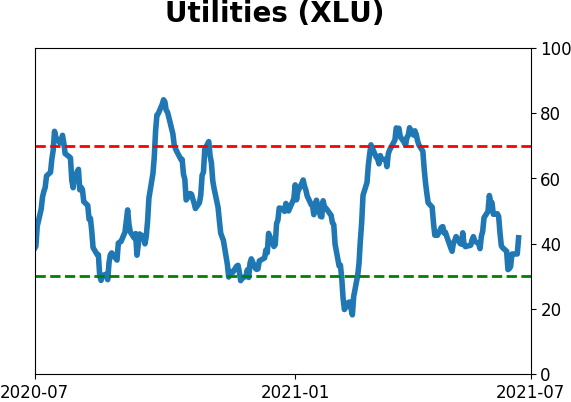
Sector ETF's - 10-Day Moving Average
|
|
|
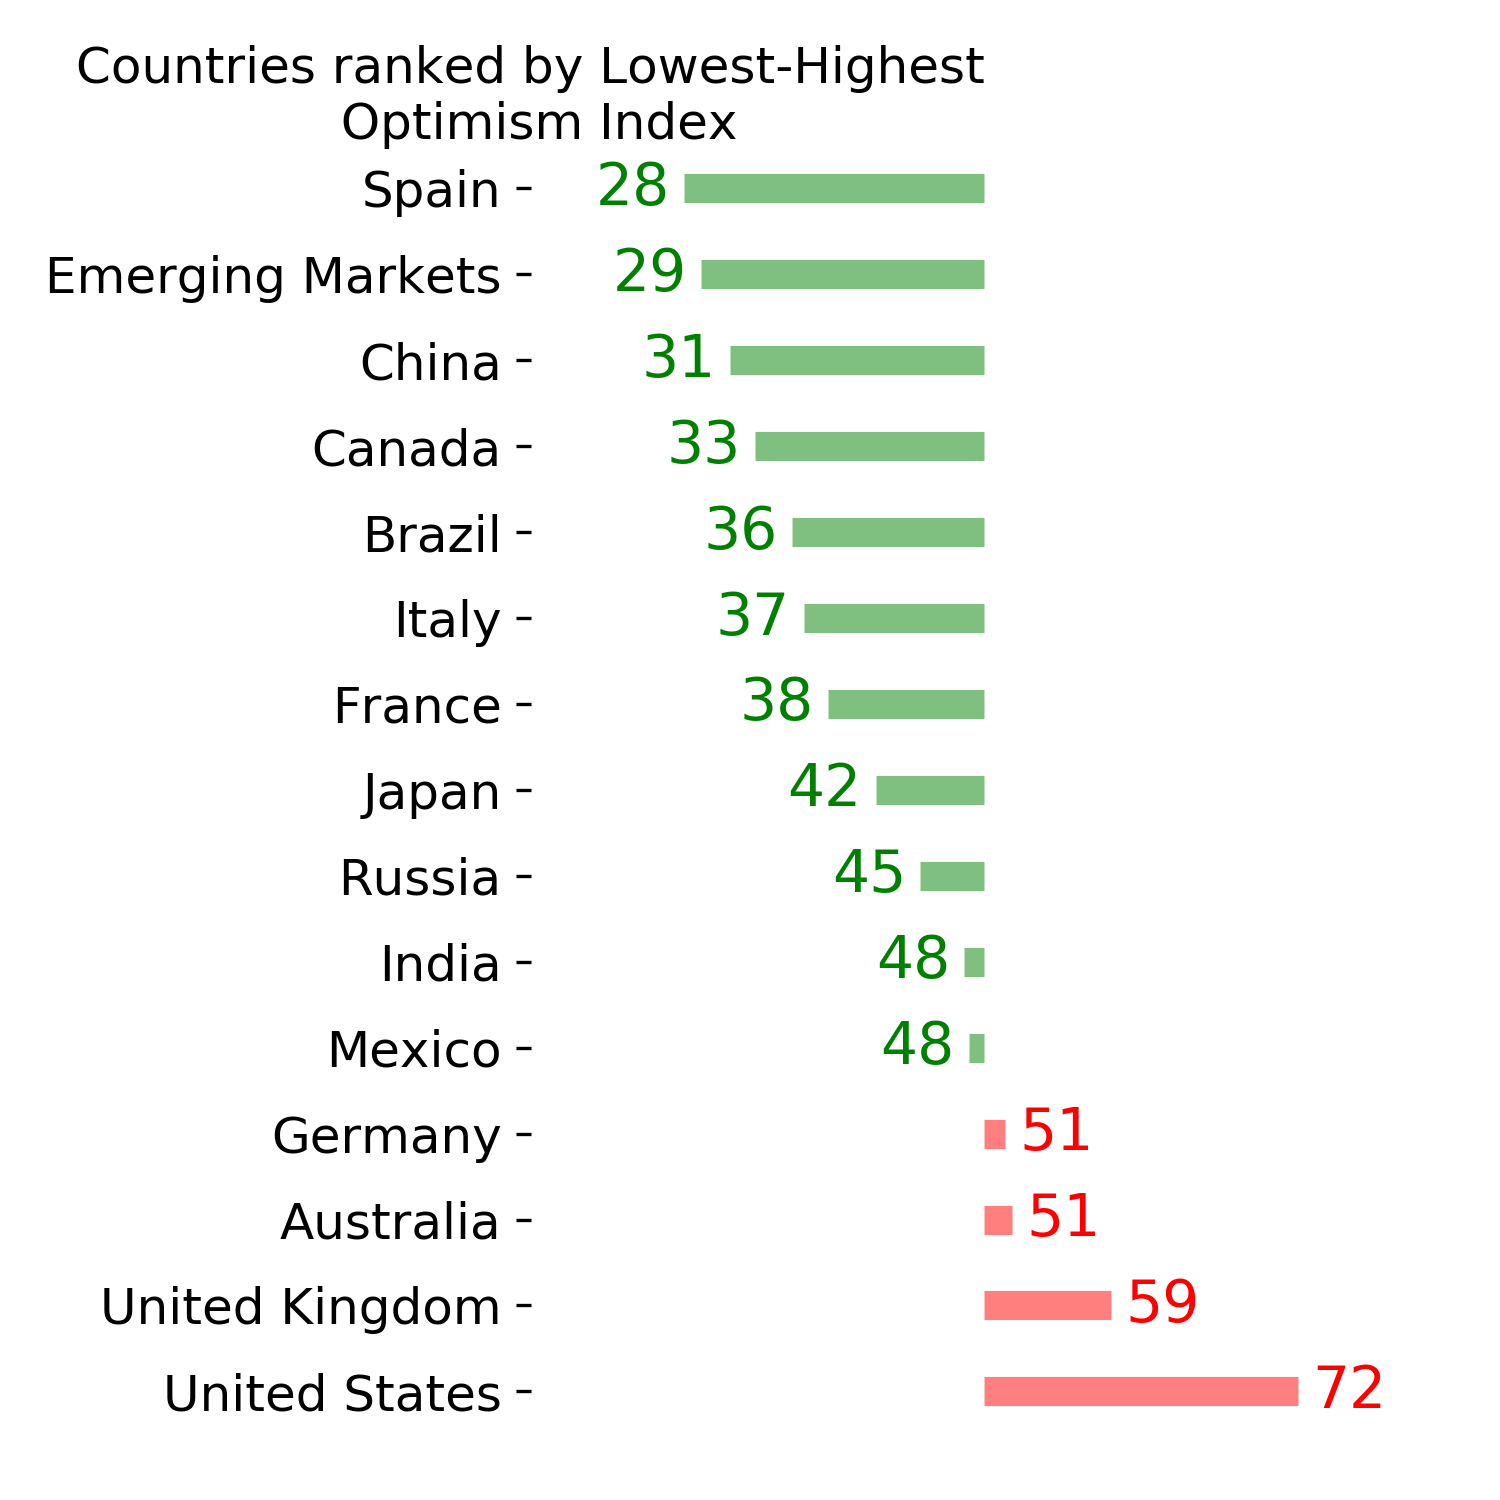
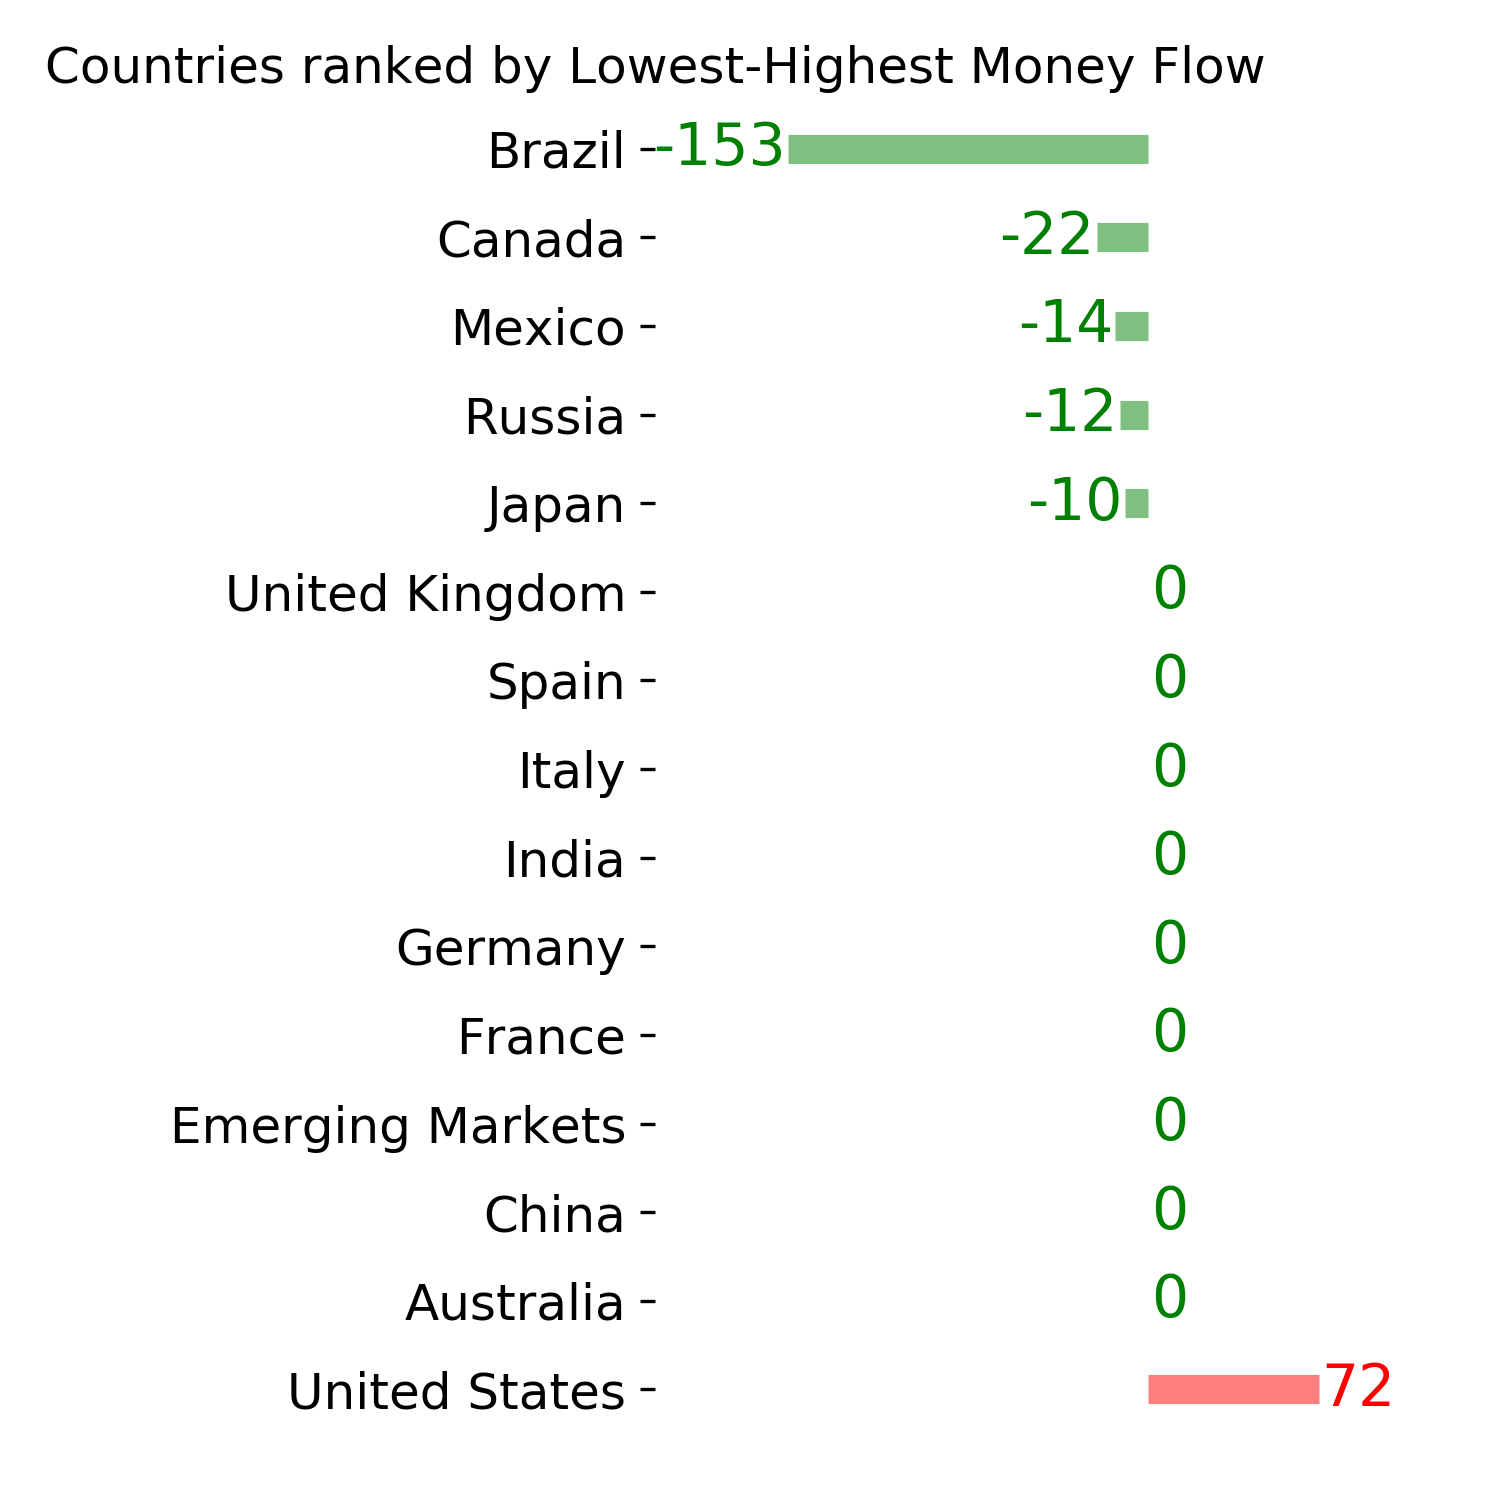
Country ETF's - 10-Day Moving Average
|
|
|
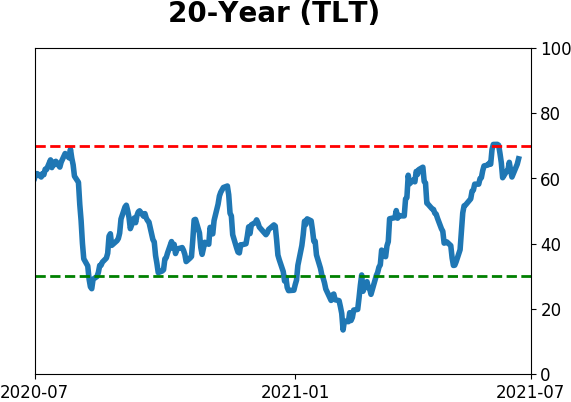
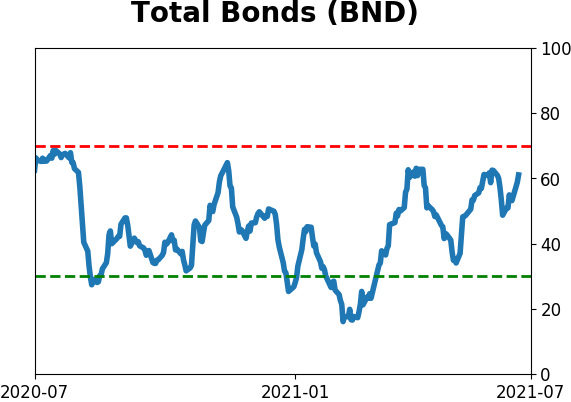
Bond ETF's - 10-Day Moving Average
|
|
|
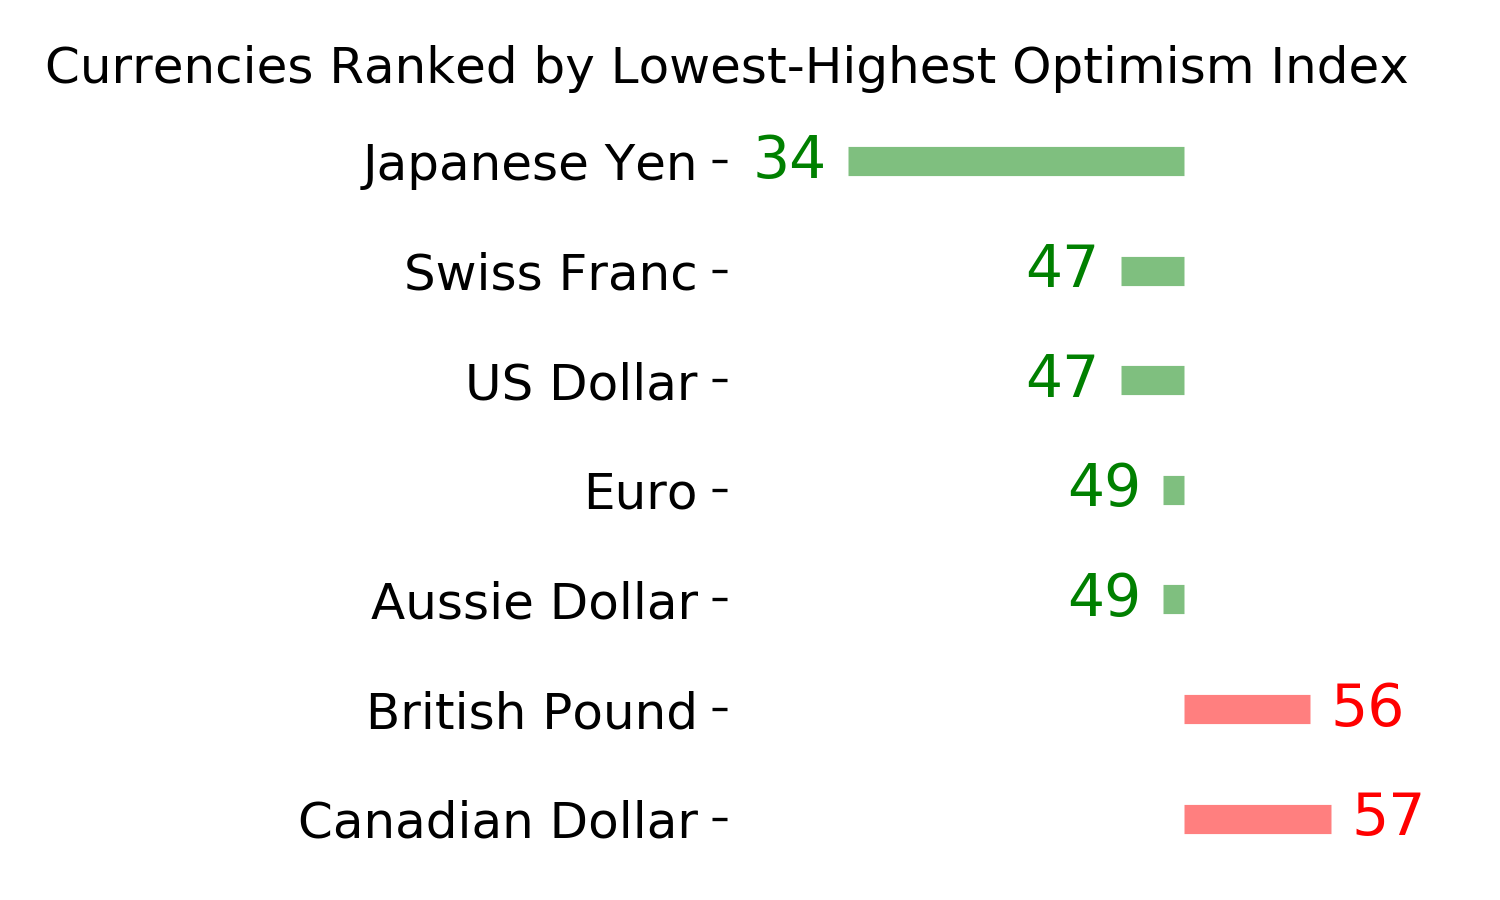
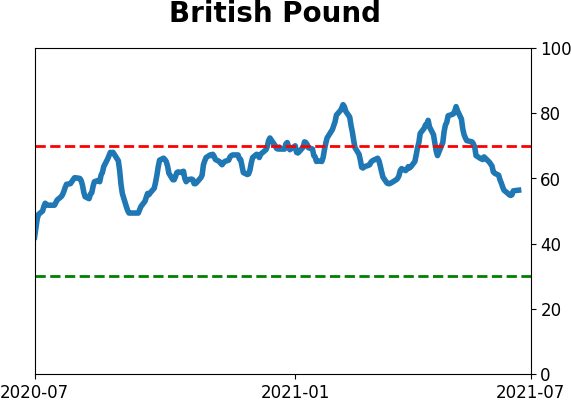
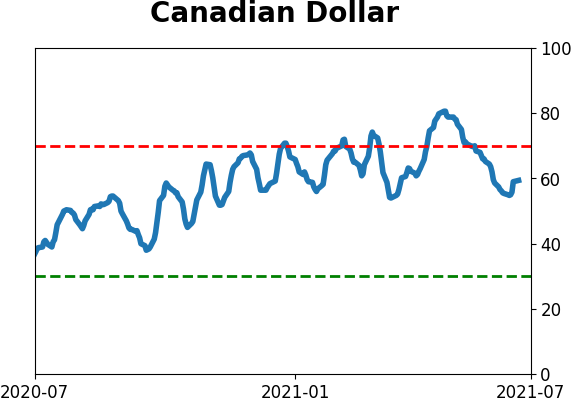
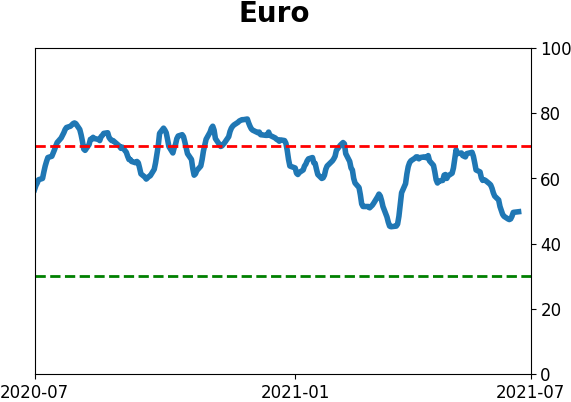
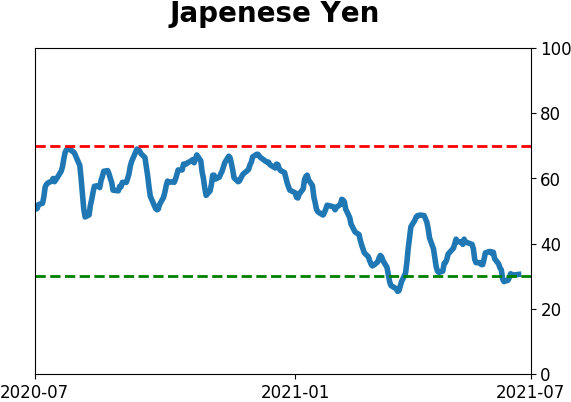
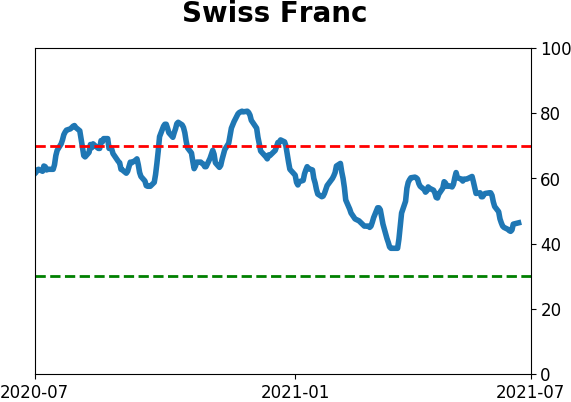
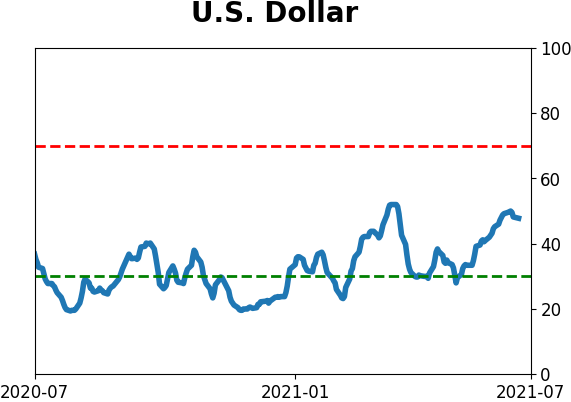
Currency ETF's - 5-Day Moving Average
|
|
|
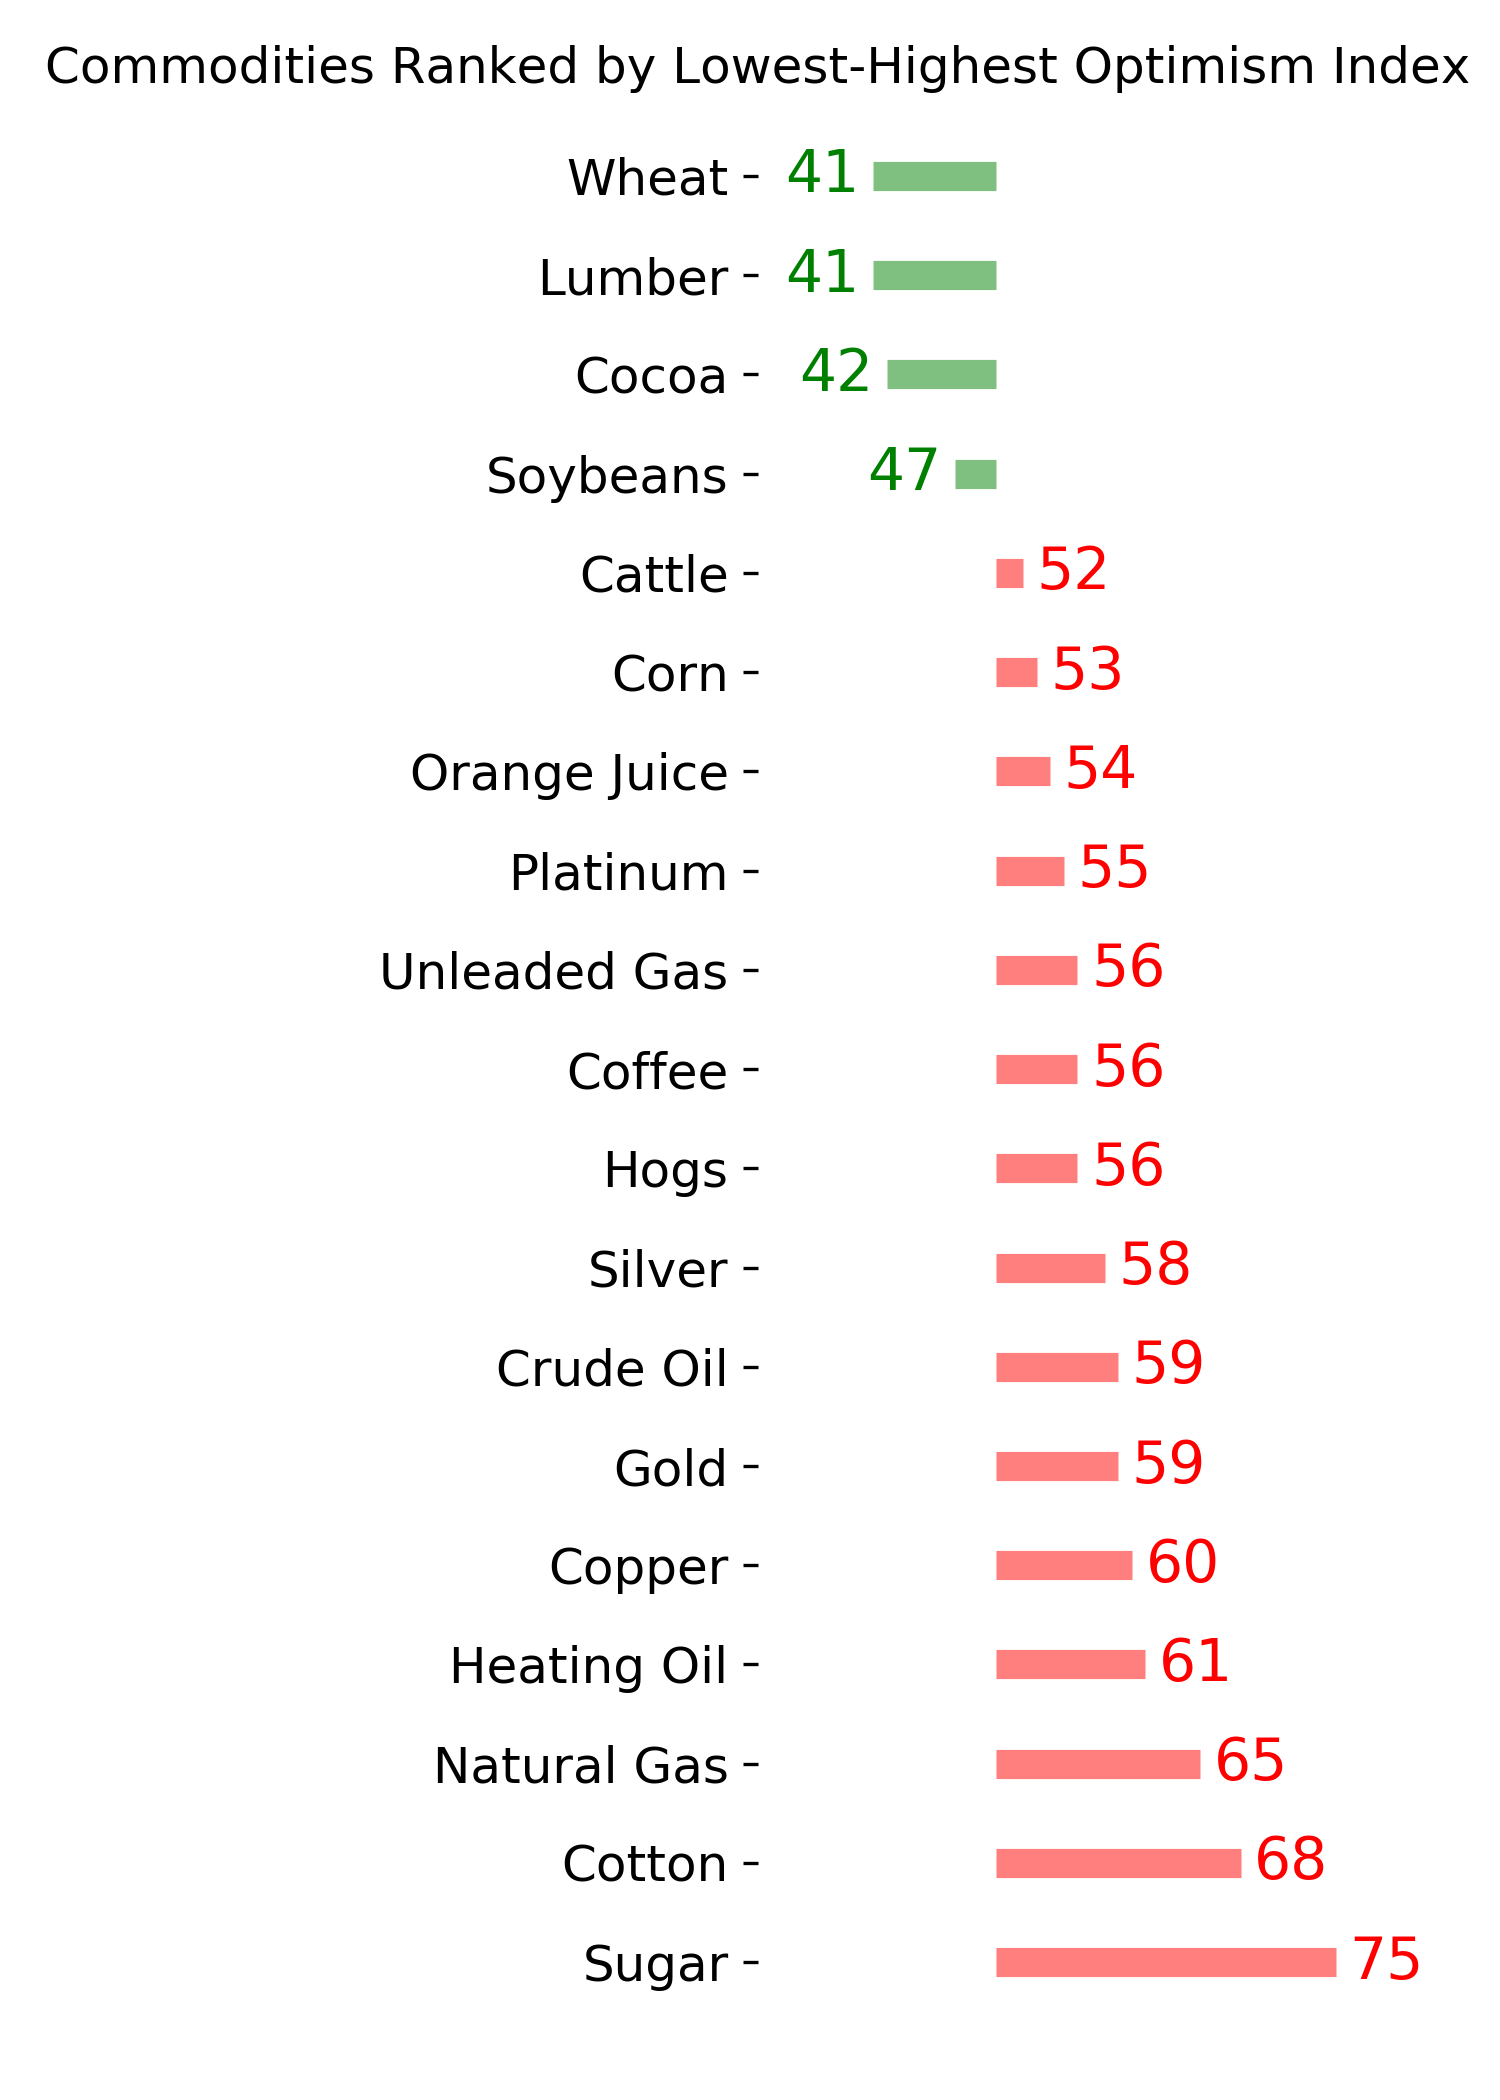
Commodity ETF's - 5-Day Moving Average
|
|