Headlines
|
|
Another 2% intraday decline triggers a historic cluster of volatility:
Over the past 50 sessions, the S&P 500 has suffered a 2% or larger intraday loss 15 times. That ranks among the largest clusters of heavy intraday selling pressure since 1962. The others occurred during times of great geopolitical or financial turmoil, and almost all of them preceded large gains for stocks.
|
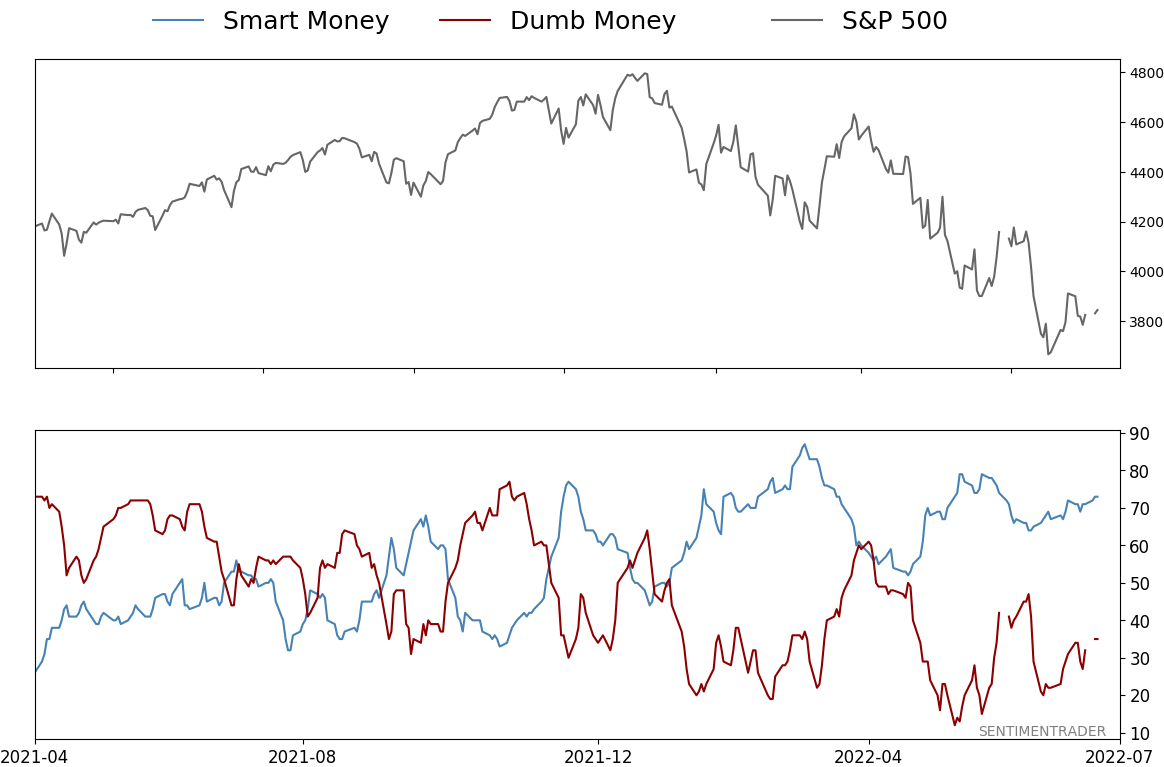
Smart / Dumb Money Confidence
|
Smart Money Confidence: 73%
Dumb Money Confidence: 35%
|
|
Risk Levels
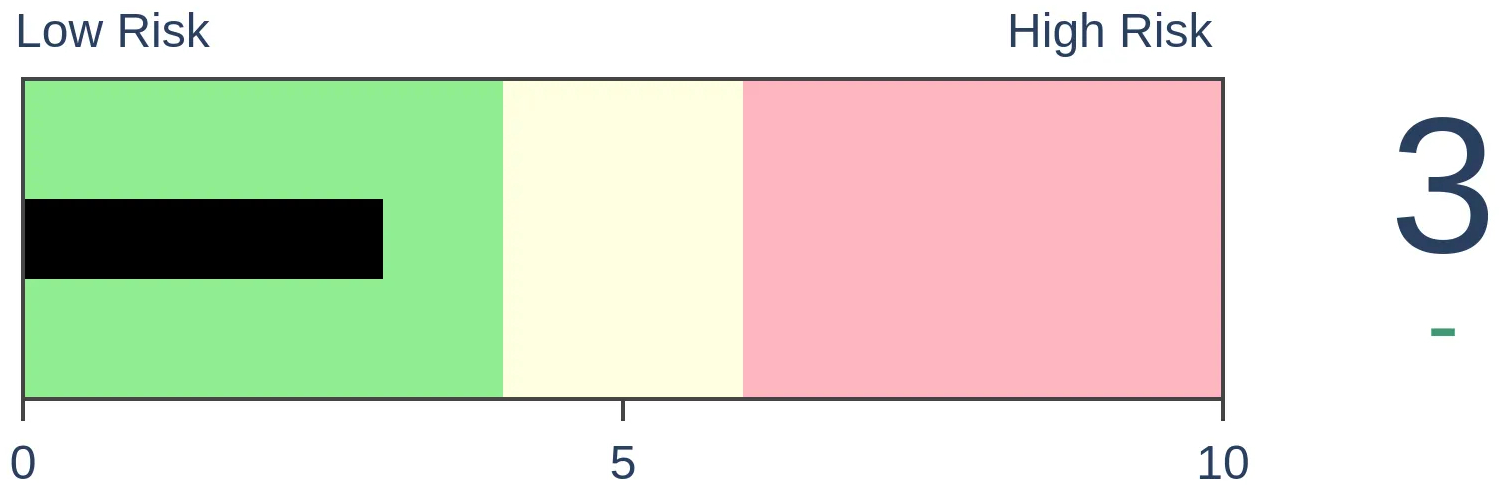
Stocks Short-Term

|
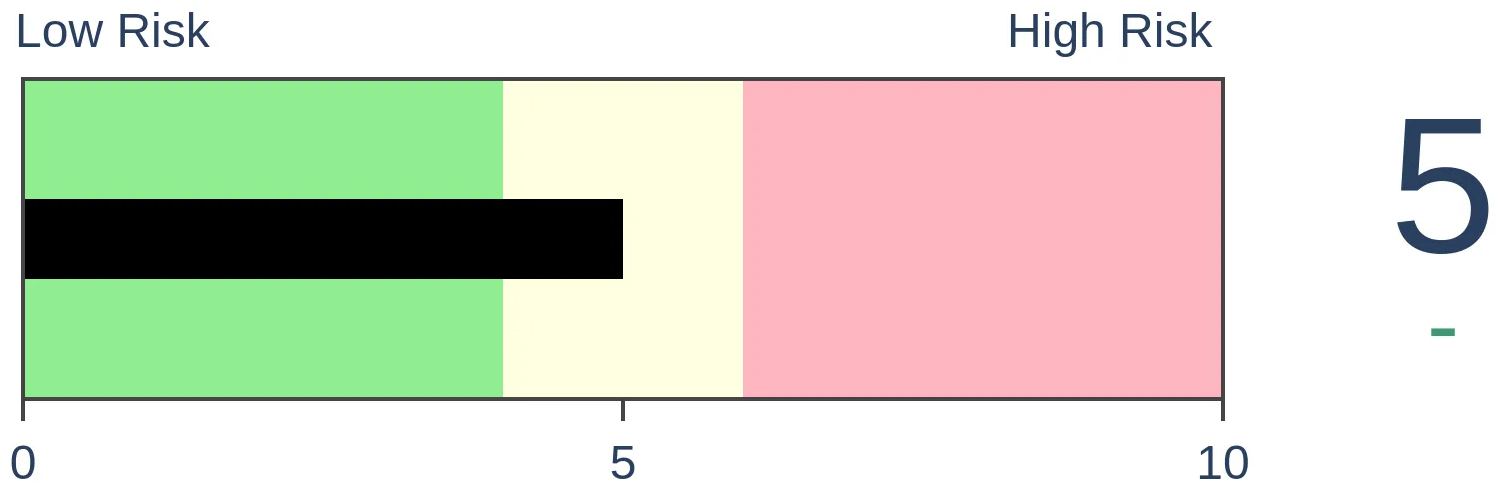
Stocks Medium-Term
|
|
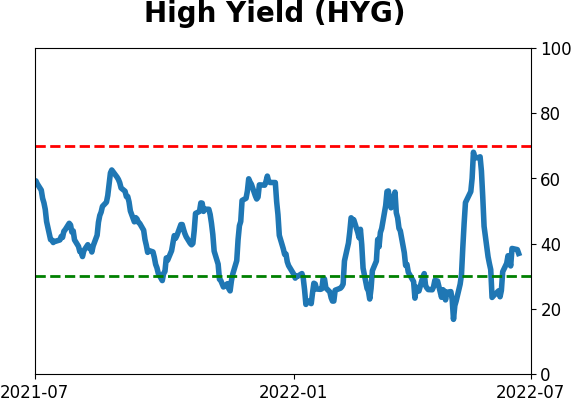
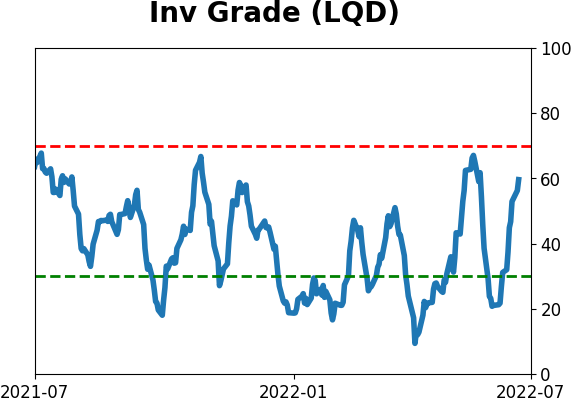
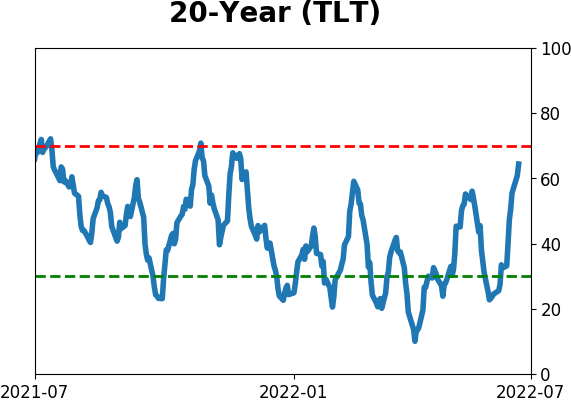
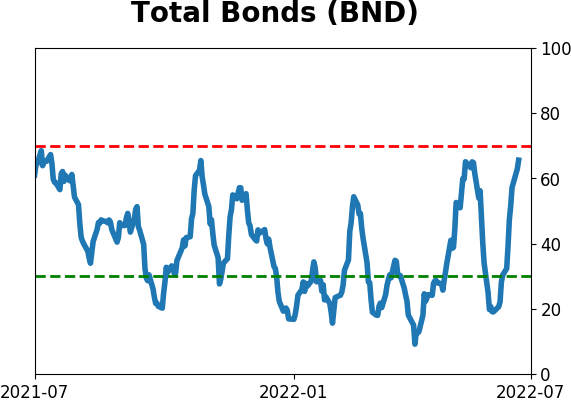
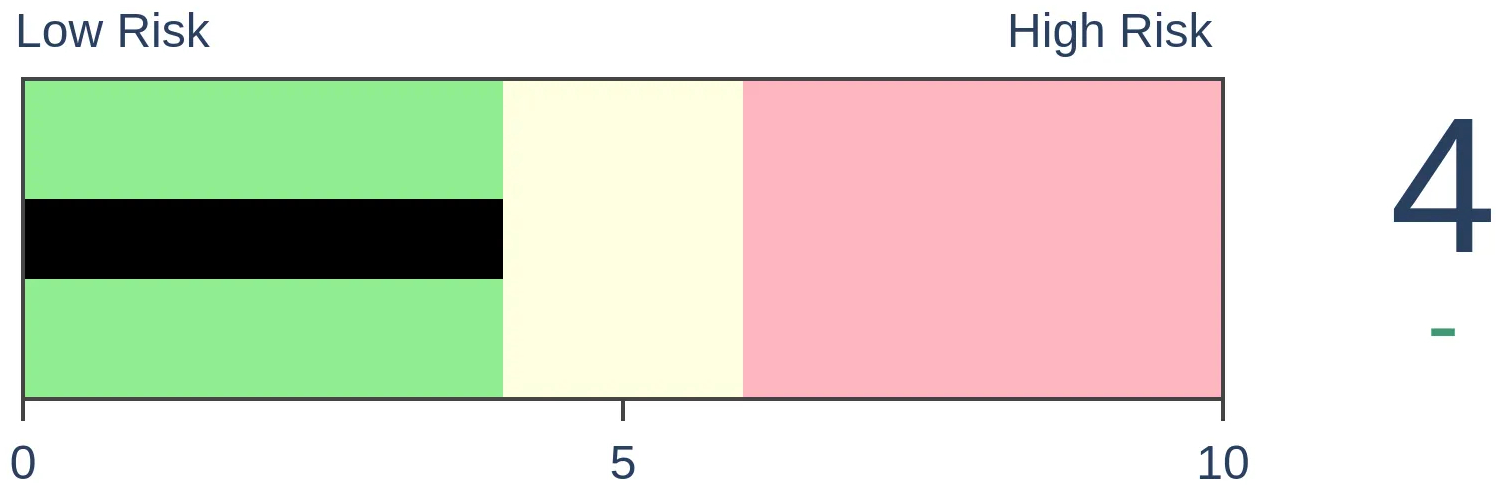
Bonds
|
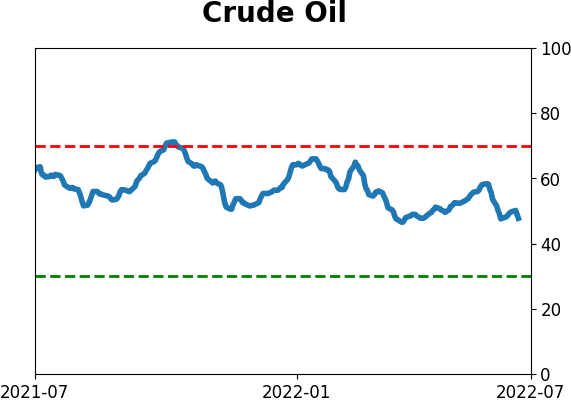
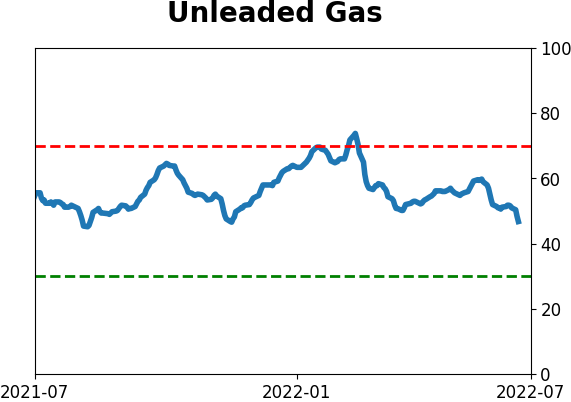
Crude Oil
|
|
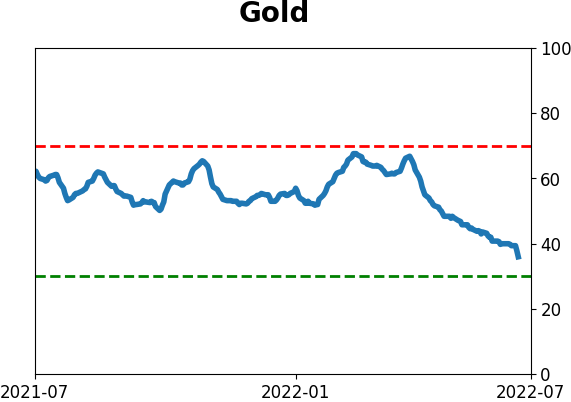
Gold

|
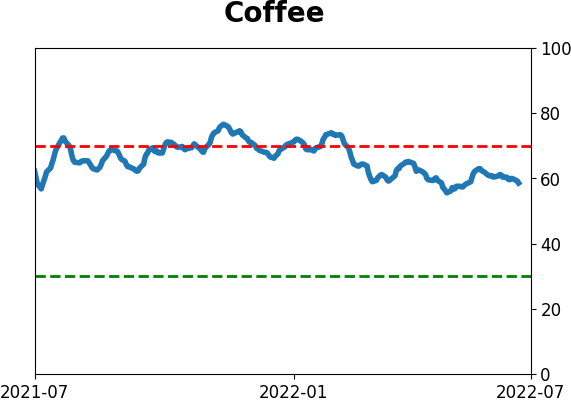
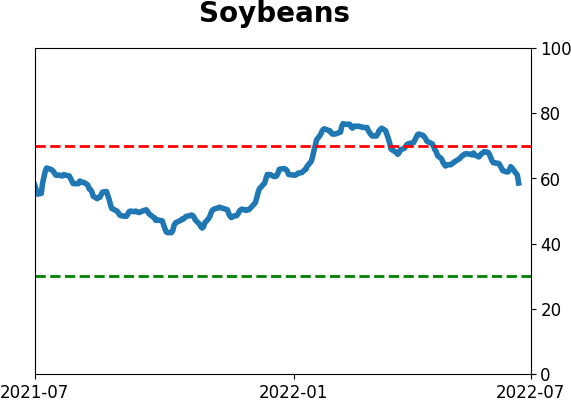
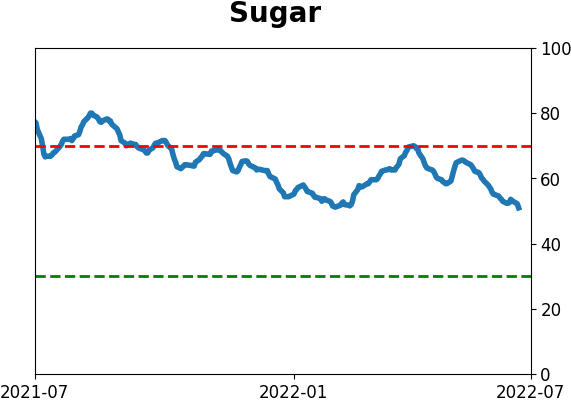
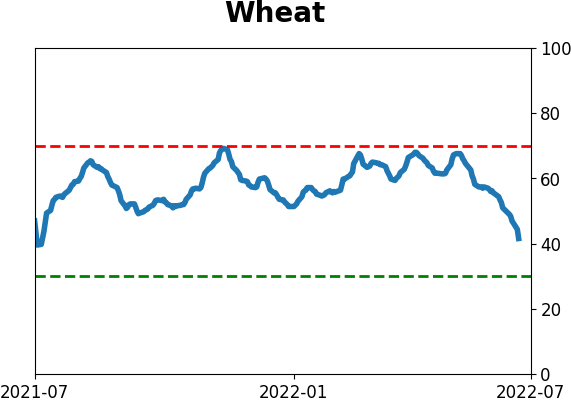
Agriculture

|
|
Research
By Jason Goepfert
BOTTOM LINE
Over the past 50 sessions, the S&P 500 has suffered a 2% or larger intraday loss 15 times. That ranks among the largest clusters of heavy intraday selling pressure since 1962. The others occurred during times of great geopolitical or financial turmoil, and almost all of them preceded large gains for stocks.
FORECAST / TIMEFRAME
None
|
Key points:
- The S&P 500 has suffered 15 days with more than a 2% intraday loss over the past 50 sessions
- That ranks among the highest bouts of heavy selling since 1962
- Previous instances occurred near the troughs of major declines, with an average one-year forward return of +21.5%
Current market joins a who's who of major financial crises
Buy-the-dip is dead, but investors keep getting their chances.
Two months ago, we saw that 2022 was the 2nd-worst buy-the-dip year since 1974. It hasn't gotten much better, and the dips are getting deeper. The S&P 500 has declined at least 2% intraday during more than two dozen days in the past 50 sessions. Tuesday was the latest example, continuing a cluster that started in April.
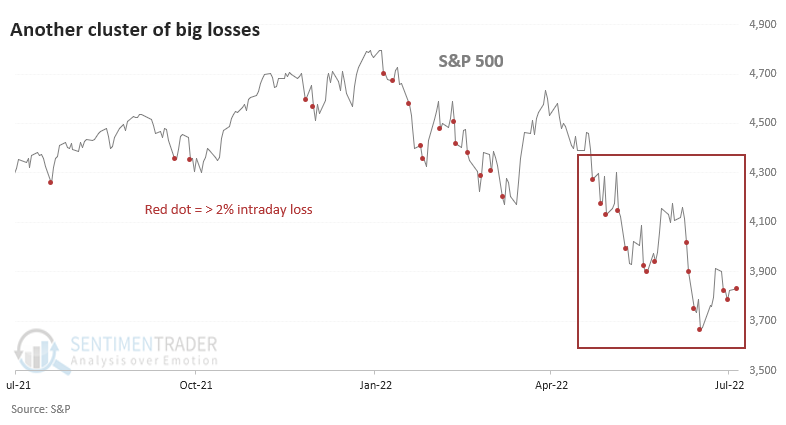
If this seems more painful than usual, that's because it is. Going back to 1962, a cluster of 15 or more days with a 2% intraday loss is rare; it's happened only a dozen distinct times in 60 years. The clusters read like a who's who of major geopolitical and financial crises.
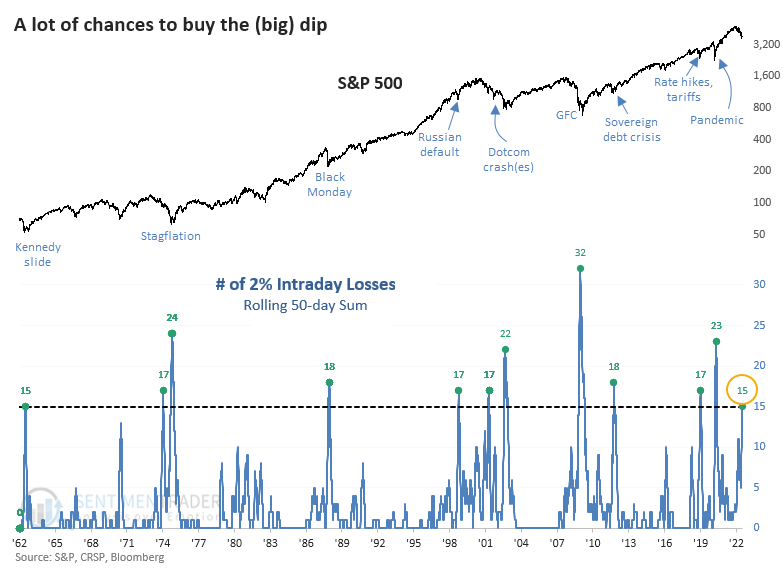
The spikes in 2% intraday losses lined up with some of the worst equity markets and most investor uncertainty. While not perfect, they also lined up with some of the best forward returns.
Of the 12 precedents, 10 preceded double-digit one-year gains, averaging more than +21%. The only one that didn't precede a double-digit gain at some point in the next six months was in 1973.
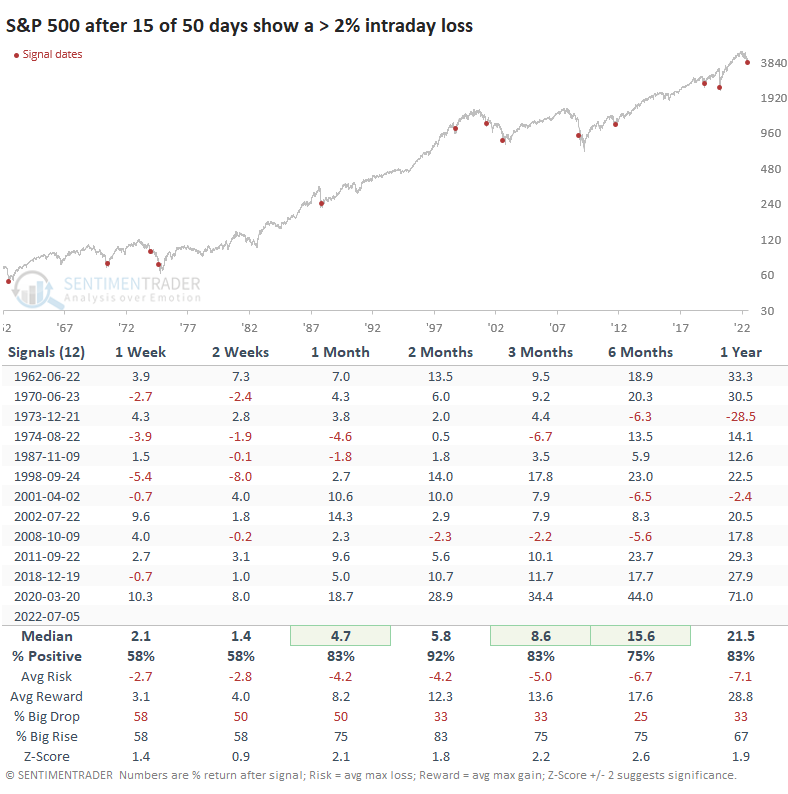
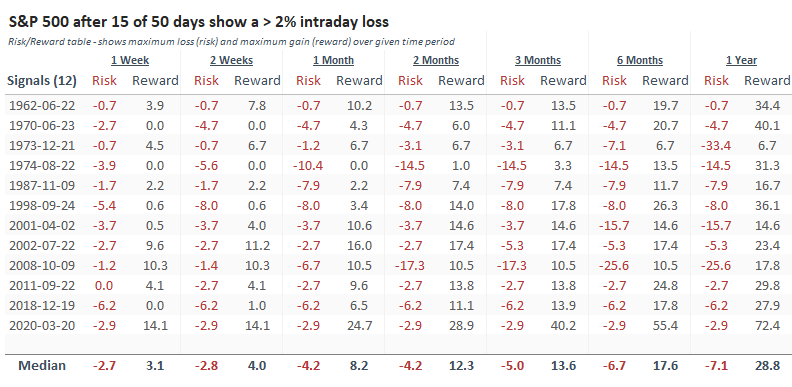
The Risk/Reward Table shows six signals suffered a maximum drawdown during the next three months worse than -5%. But all but one of them enjoyed a maximum gain of more than +5%.
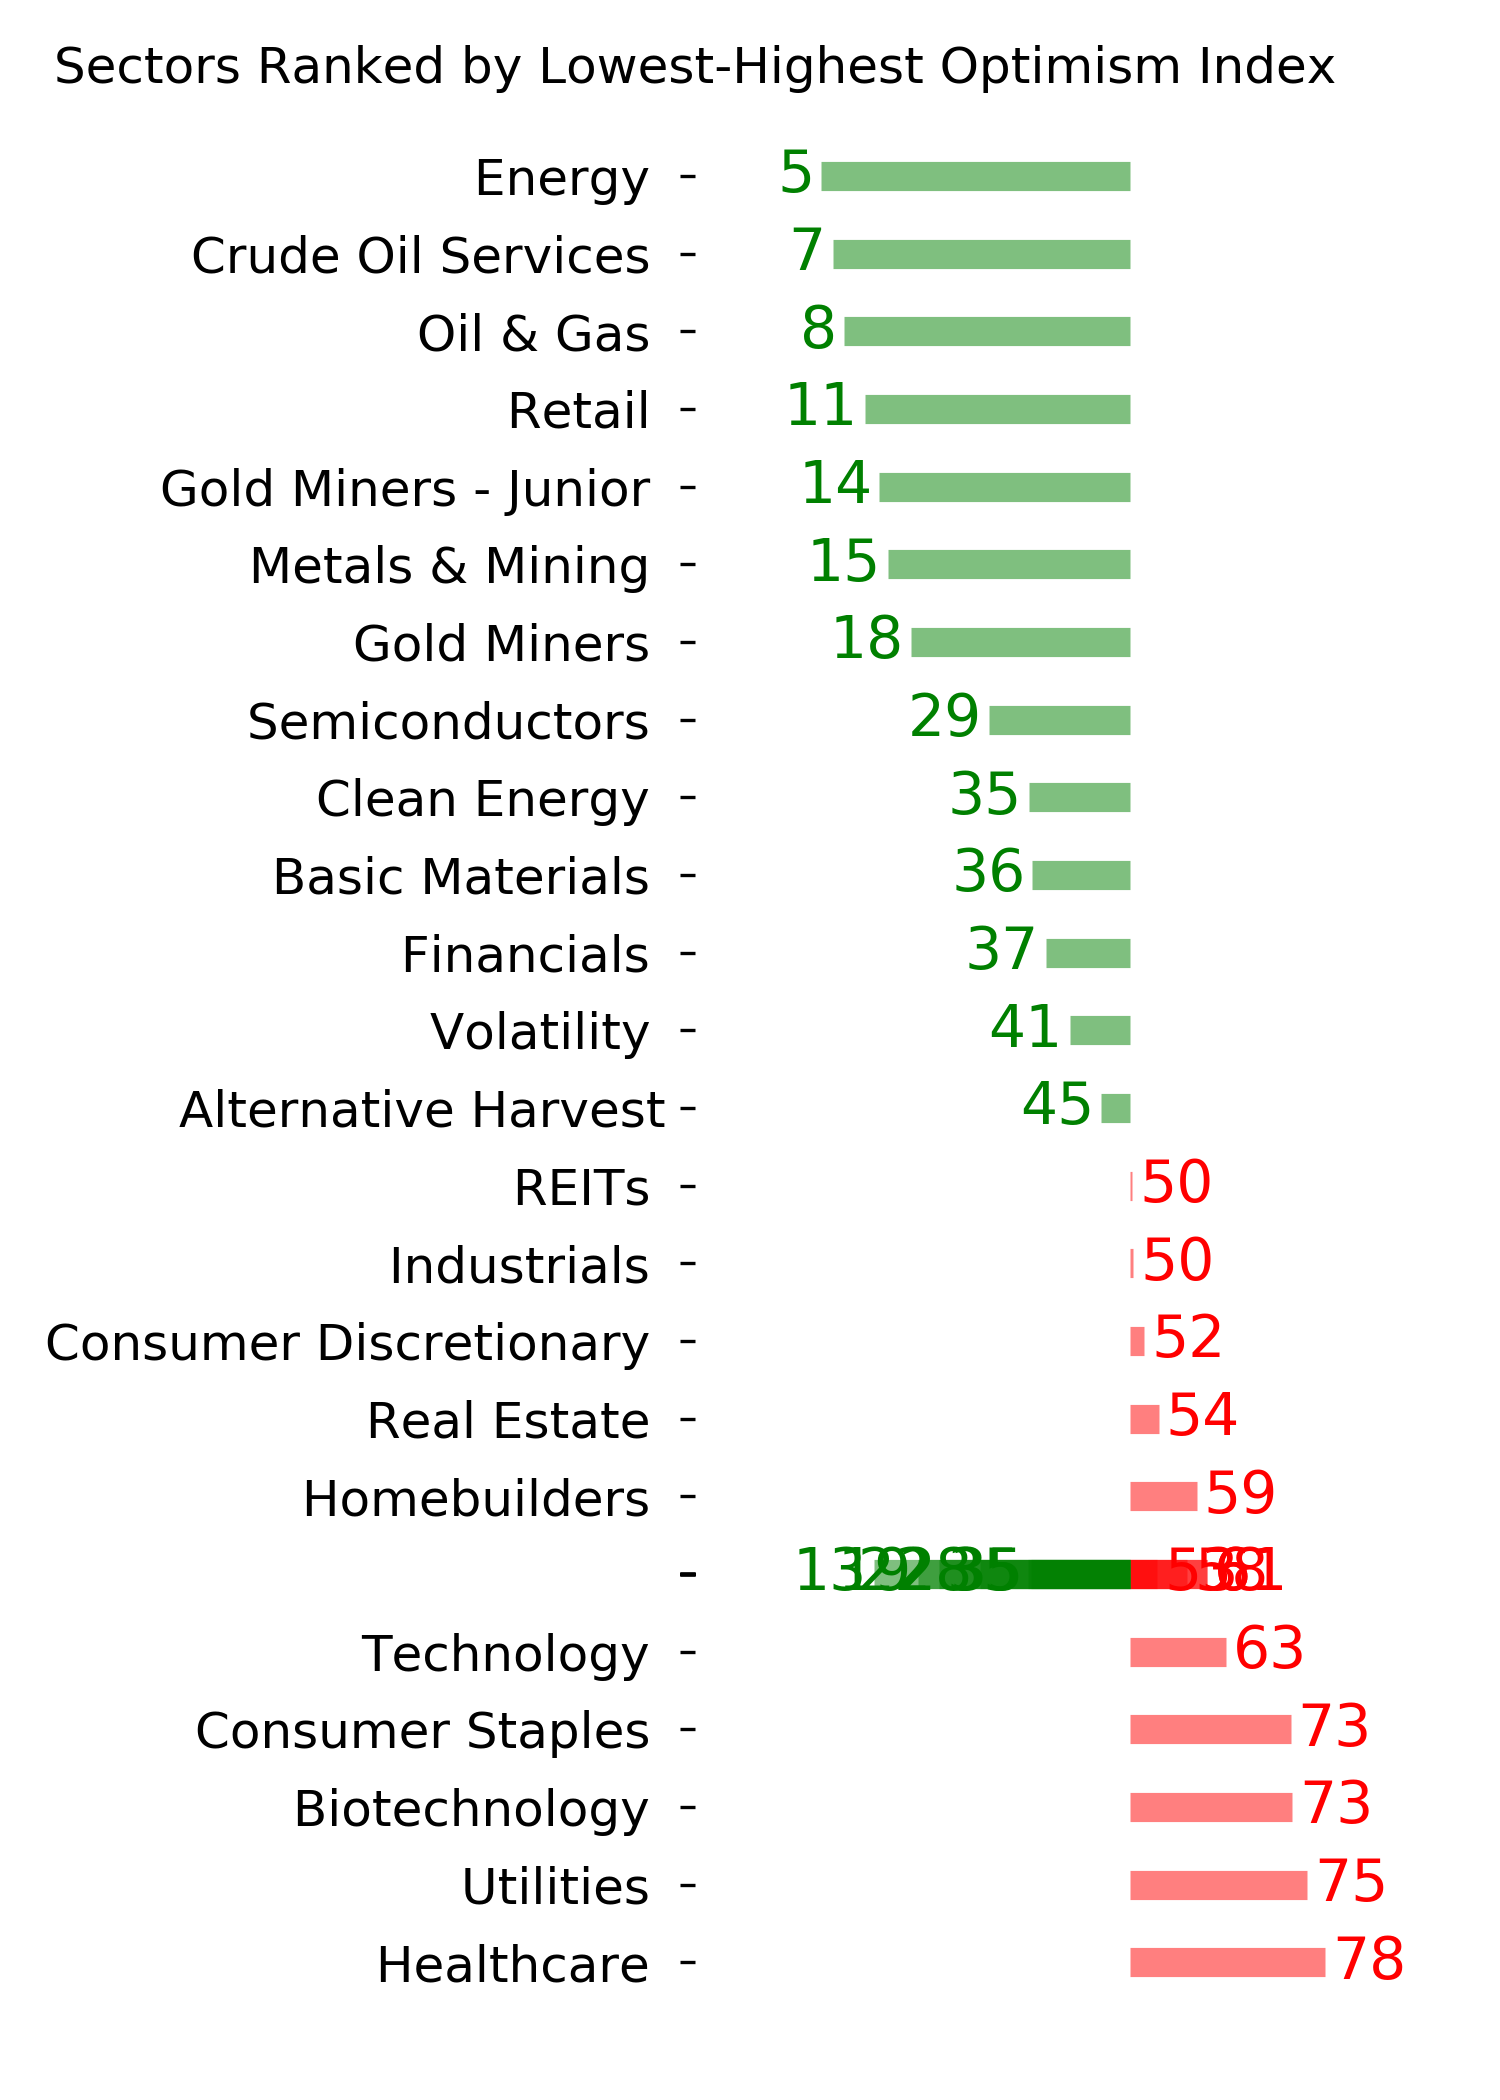
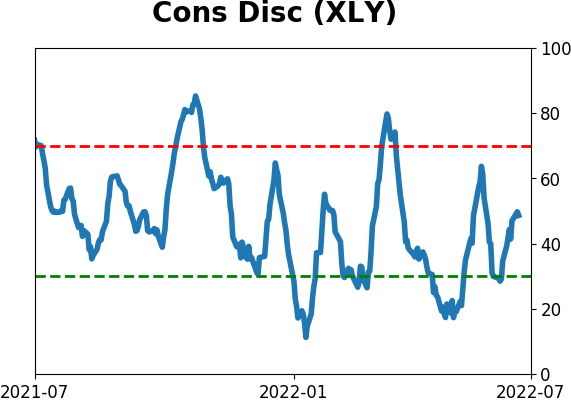
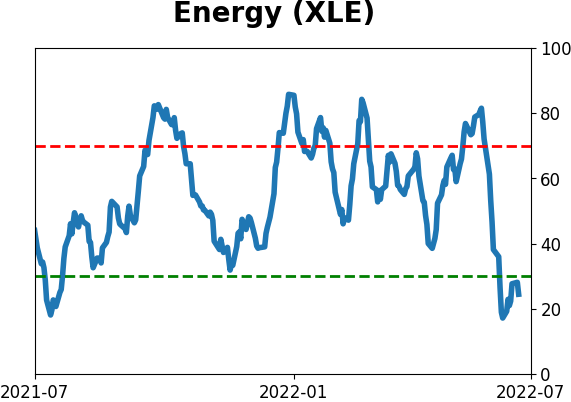
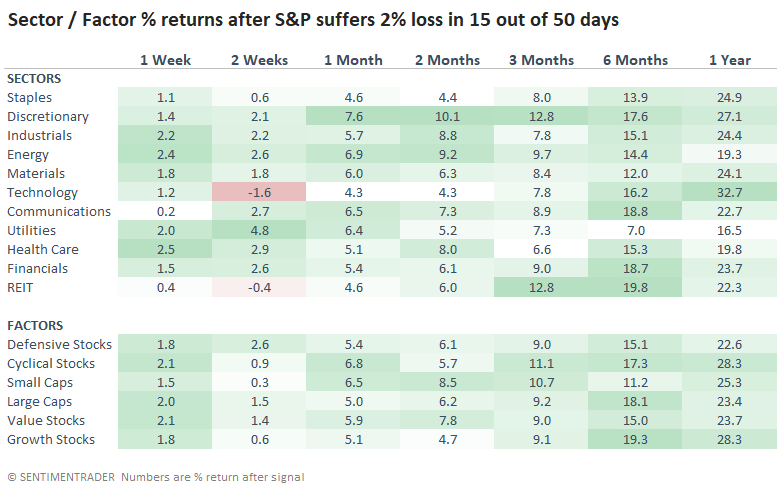
Among sectors and factors, the best one-year return went to Technology, while the worst were Utilities and Energy. It's not too much of a suprise that since many of the clusters triggered near the ends of major decines, forward returns favored recovery sectors like Discretionary and Industrial stocks.
What the research tells us...
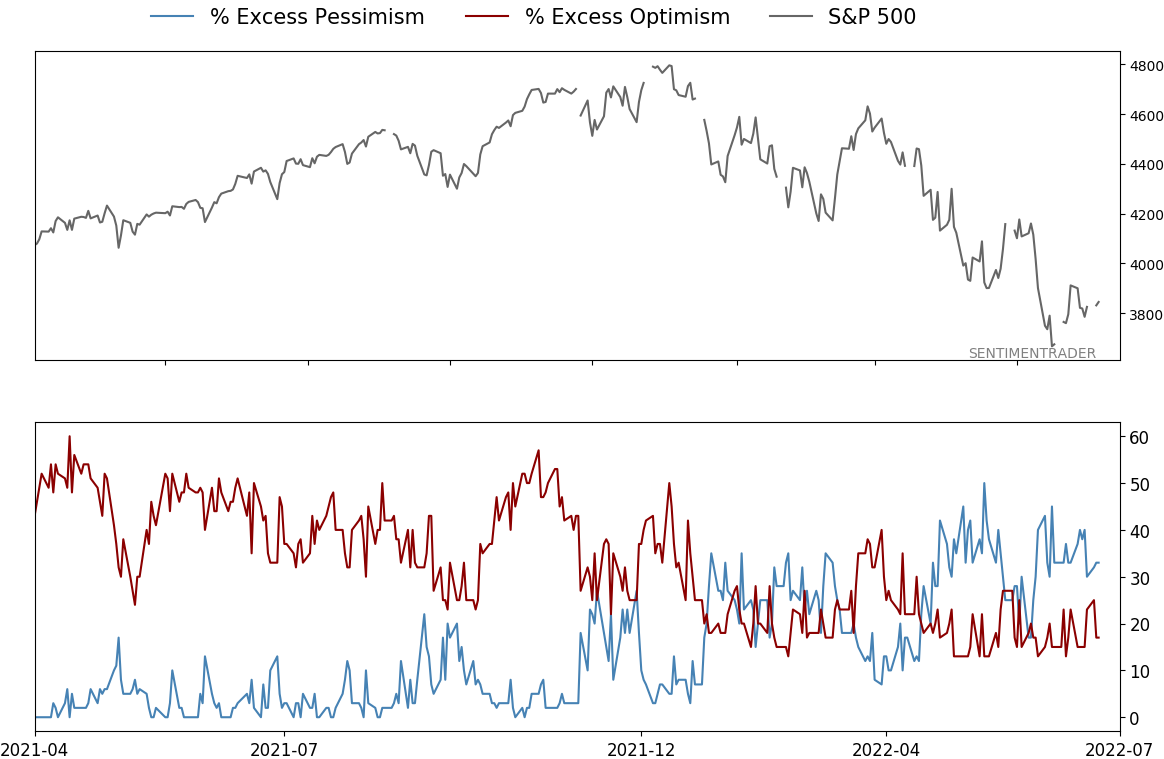
Investors have suffered wild weekly swings and some of the most concentrated selling in history. Sentiment among consumers is wretched and not much better among investors. Fundamentals are deteriorating quickly, and it's nearly impossible to find good news.
Investors discount the likelihood of future events, so the current bad news is not necessarily a reason to be bearish. But bull markets need sustained and increasing optimism, and so far, that's been decidedly lacking. About the only potential bright spot is the idea that things are so bad they're good. That's always a risky proposition in bear markets, and it hasn't been working lately. Losses have stabilized, which is a minor positive, and the cluster of heavy selling like that noted above is another reason to think that maybe, just maybe, we could be in for a few weeks or even months of a rebound.
Indicators at Extremes
Phase Table
Ranks
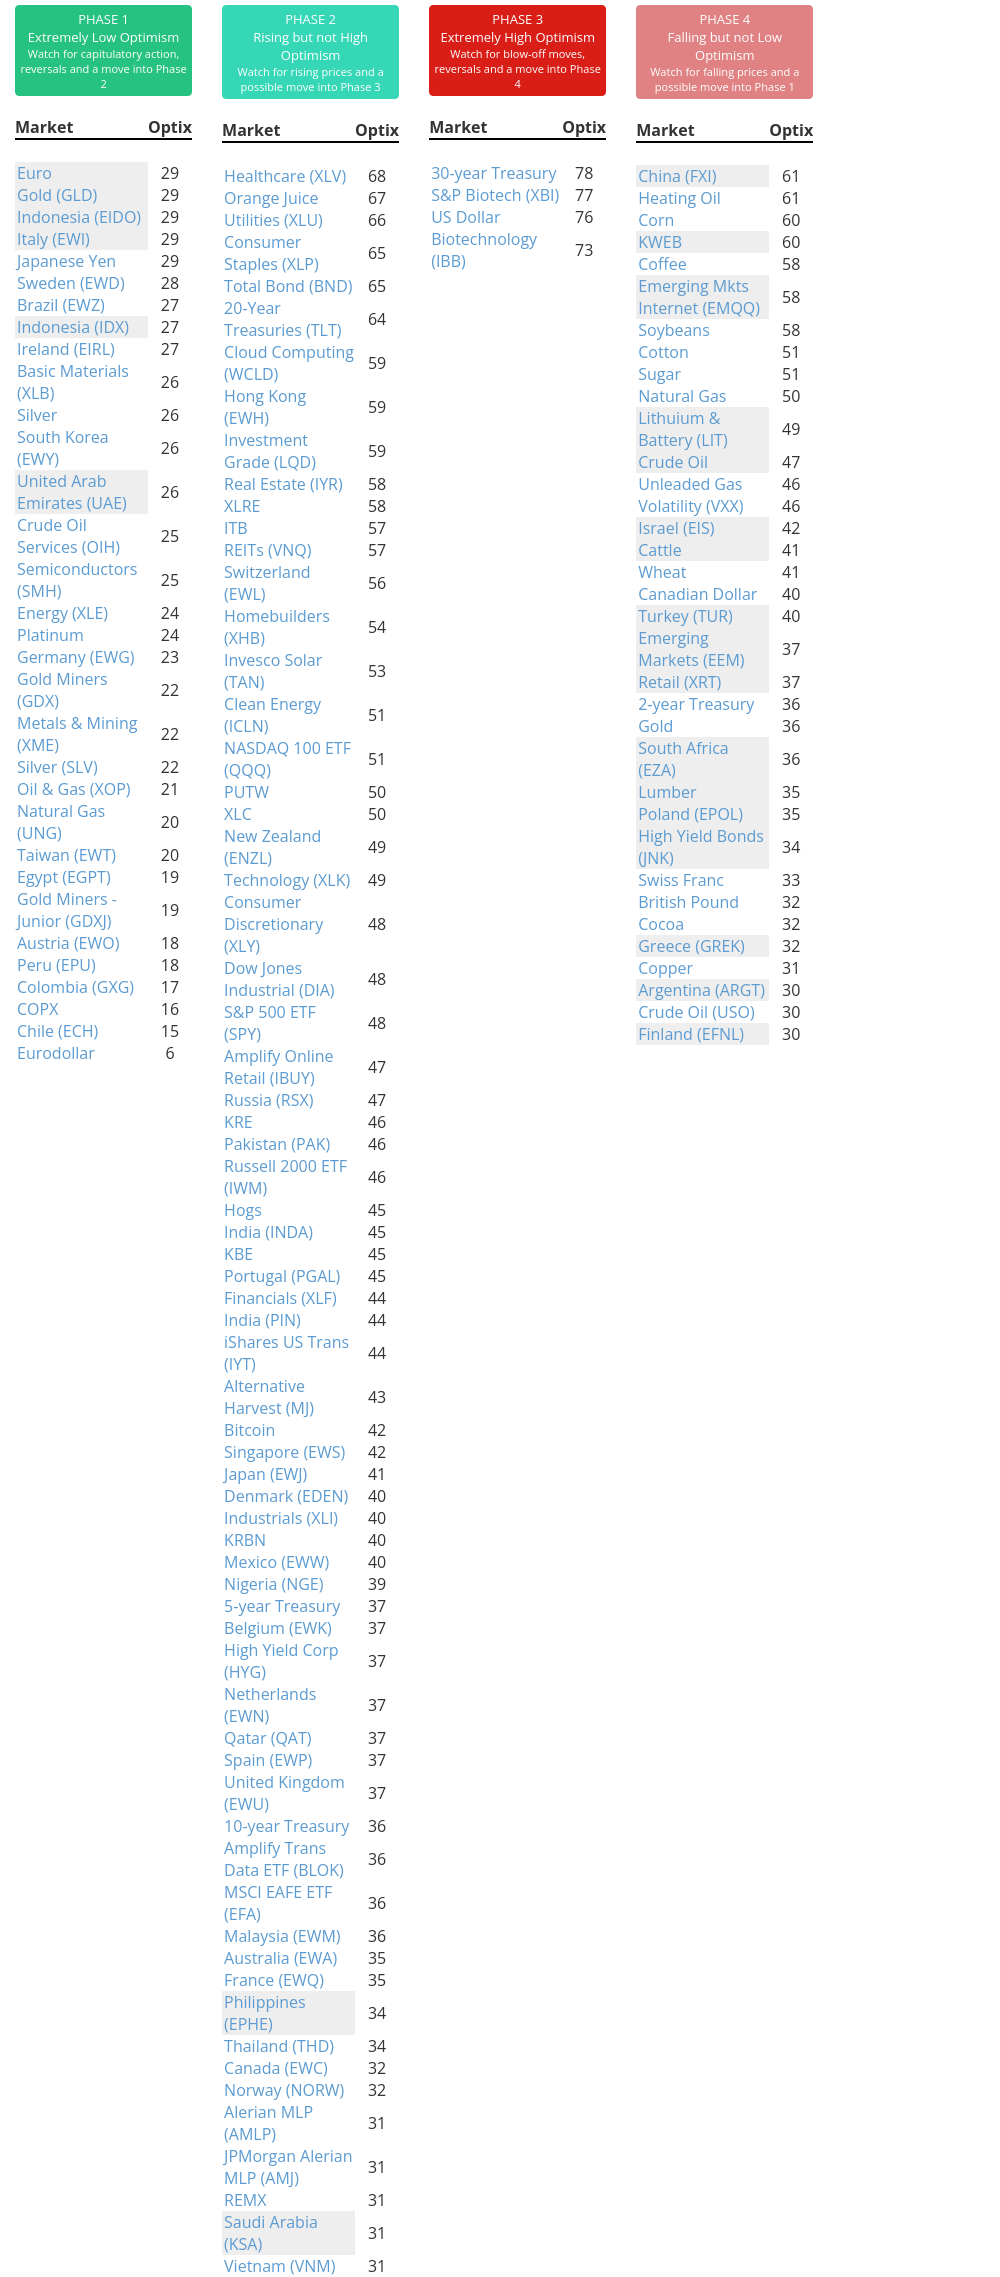
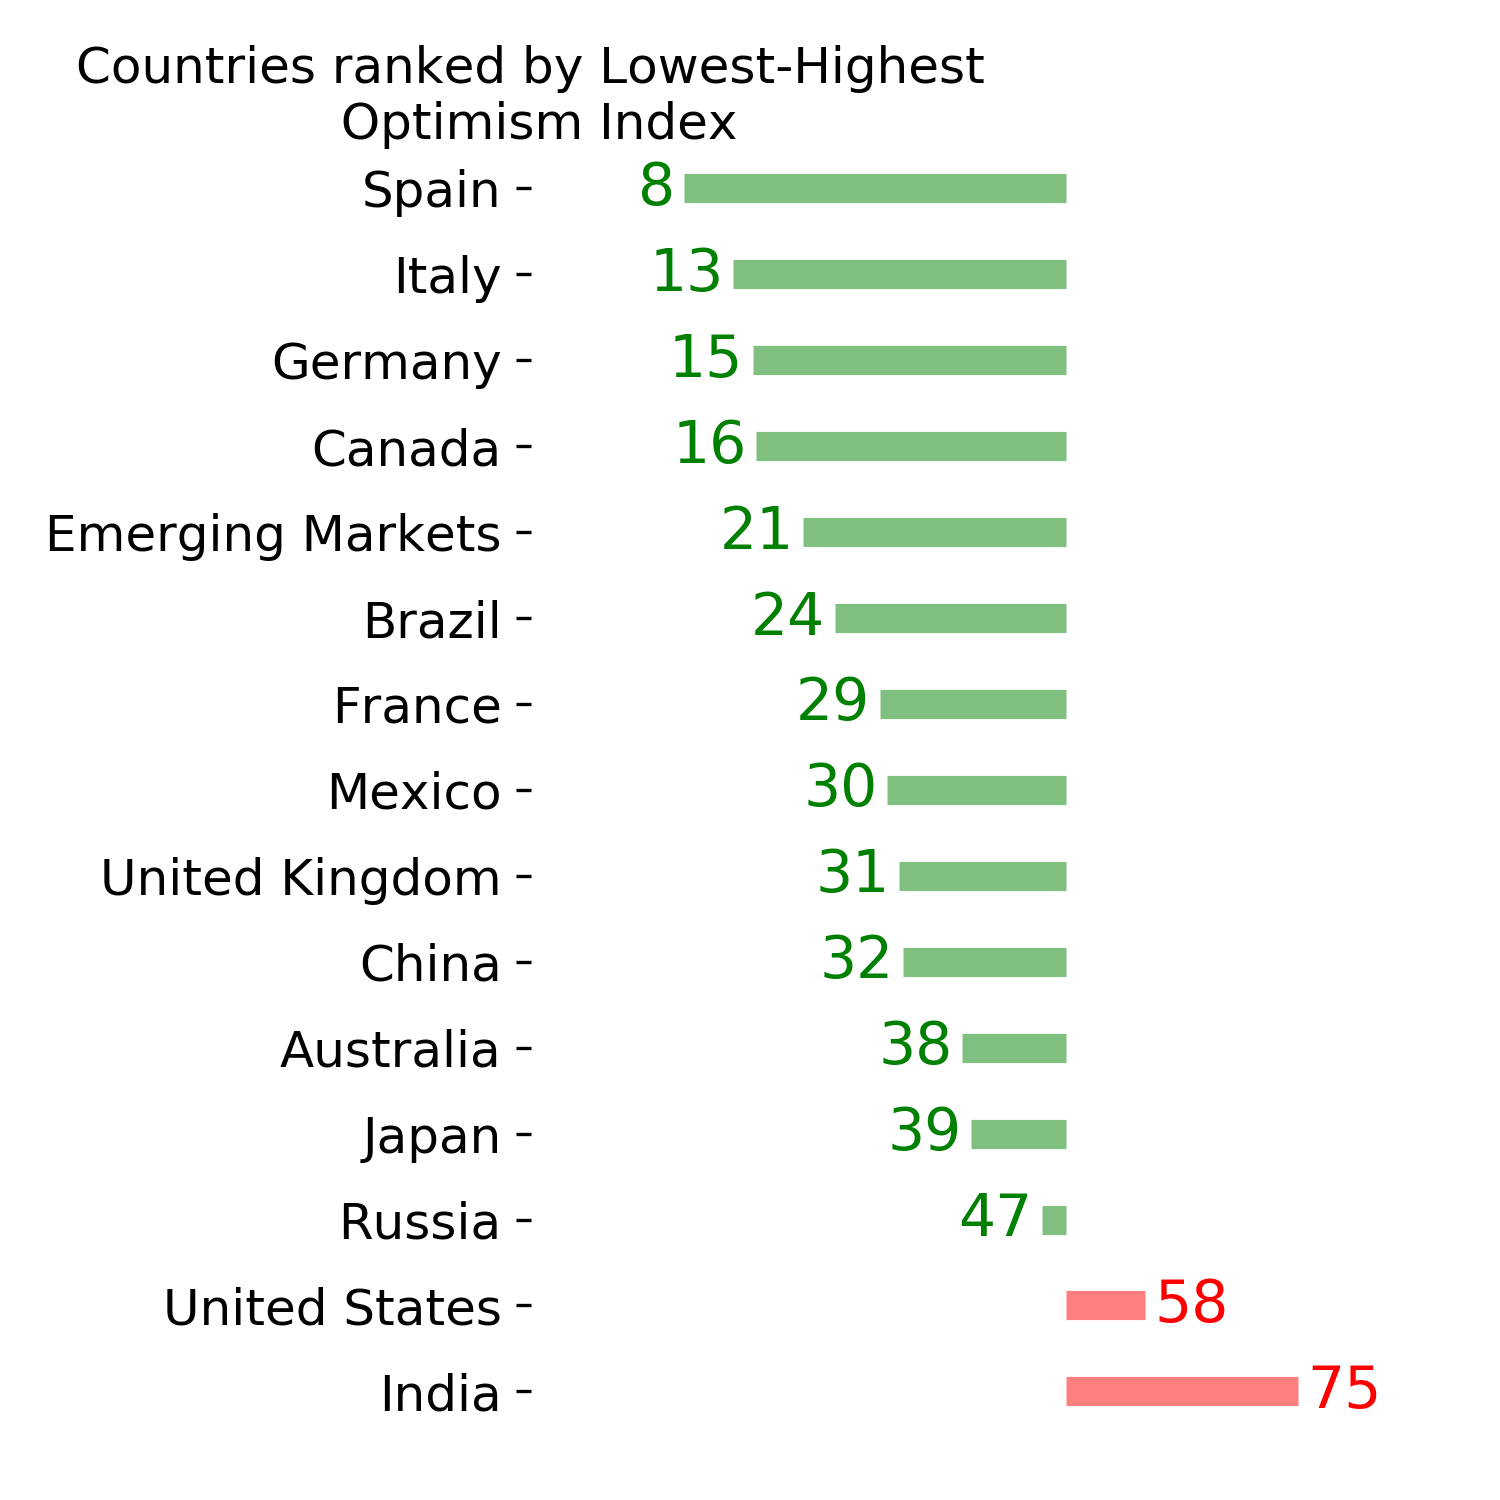
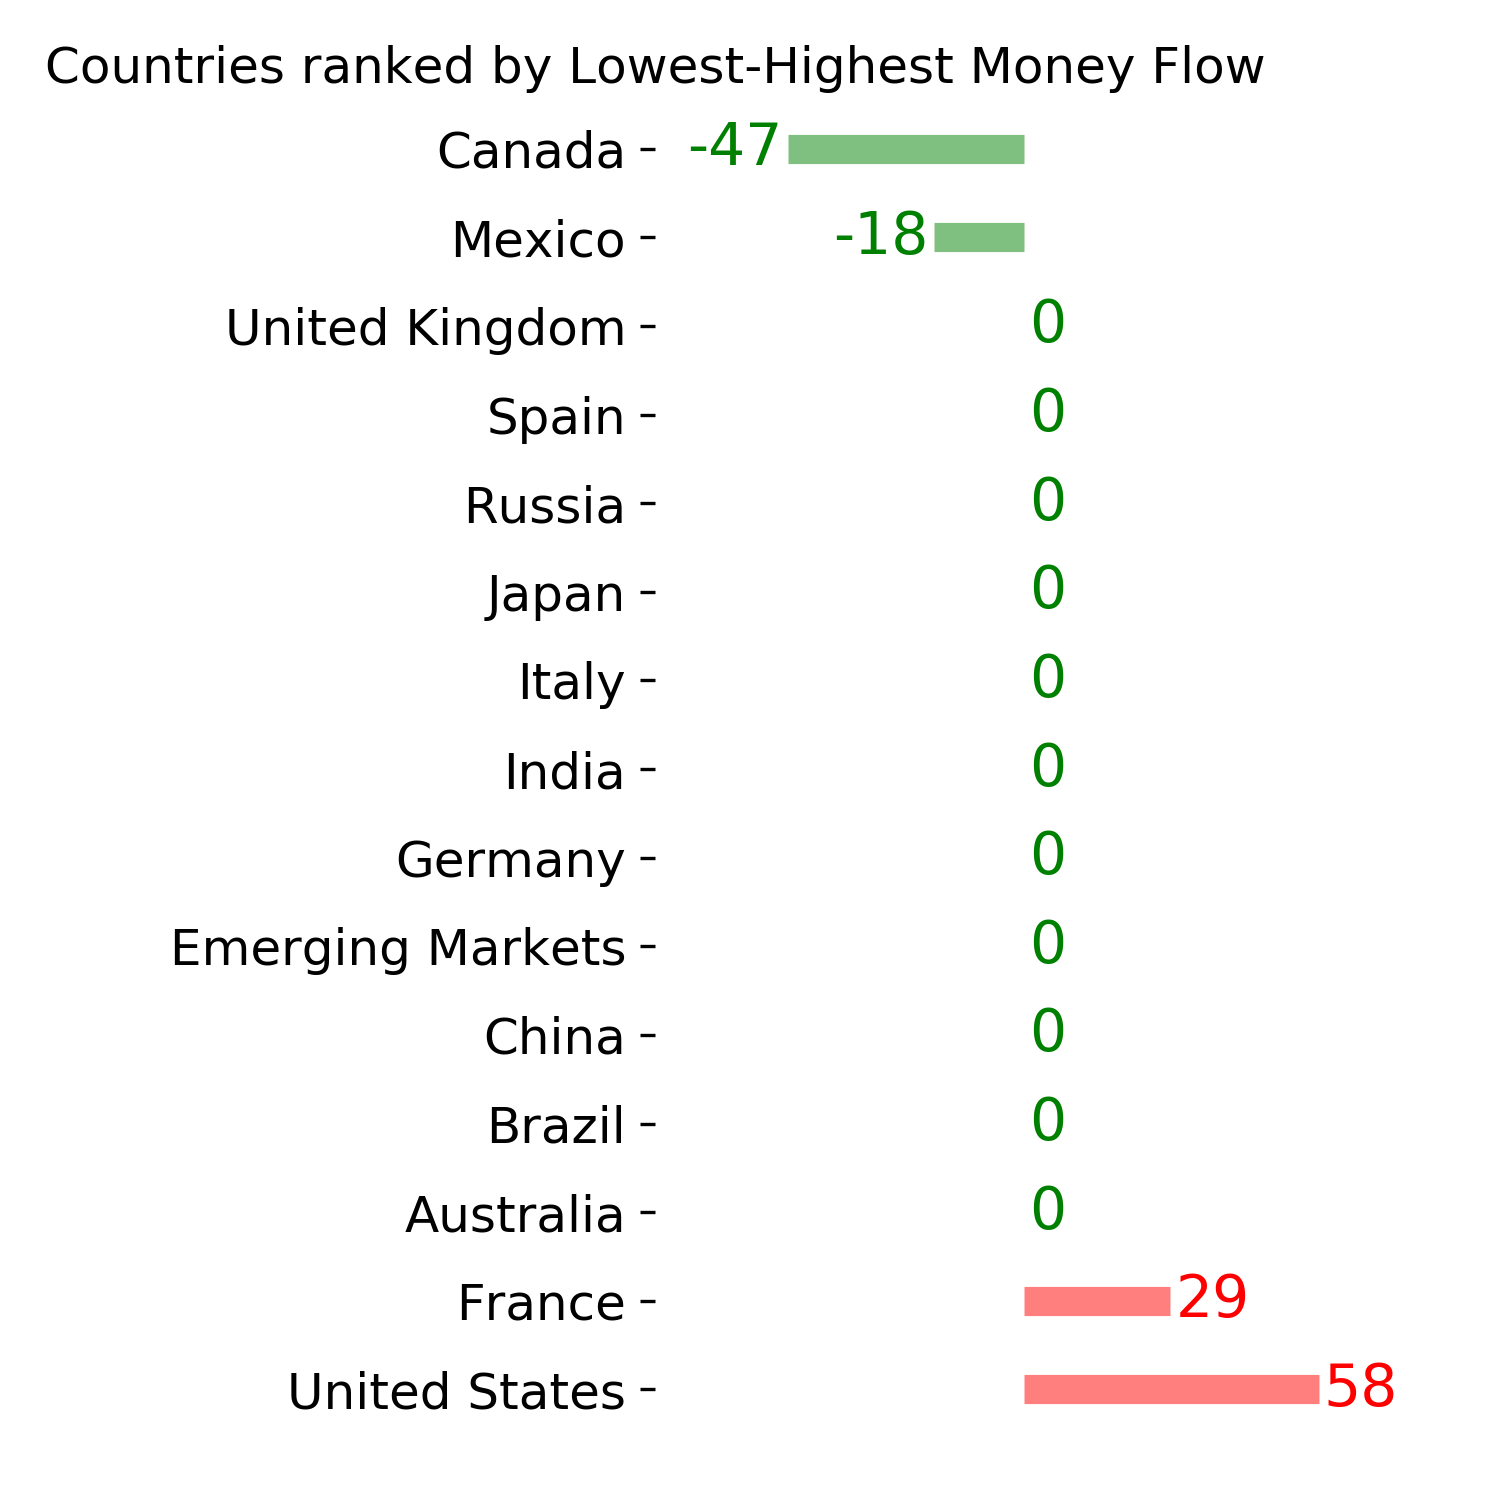
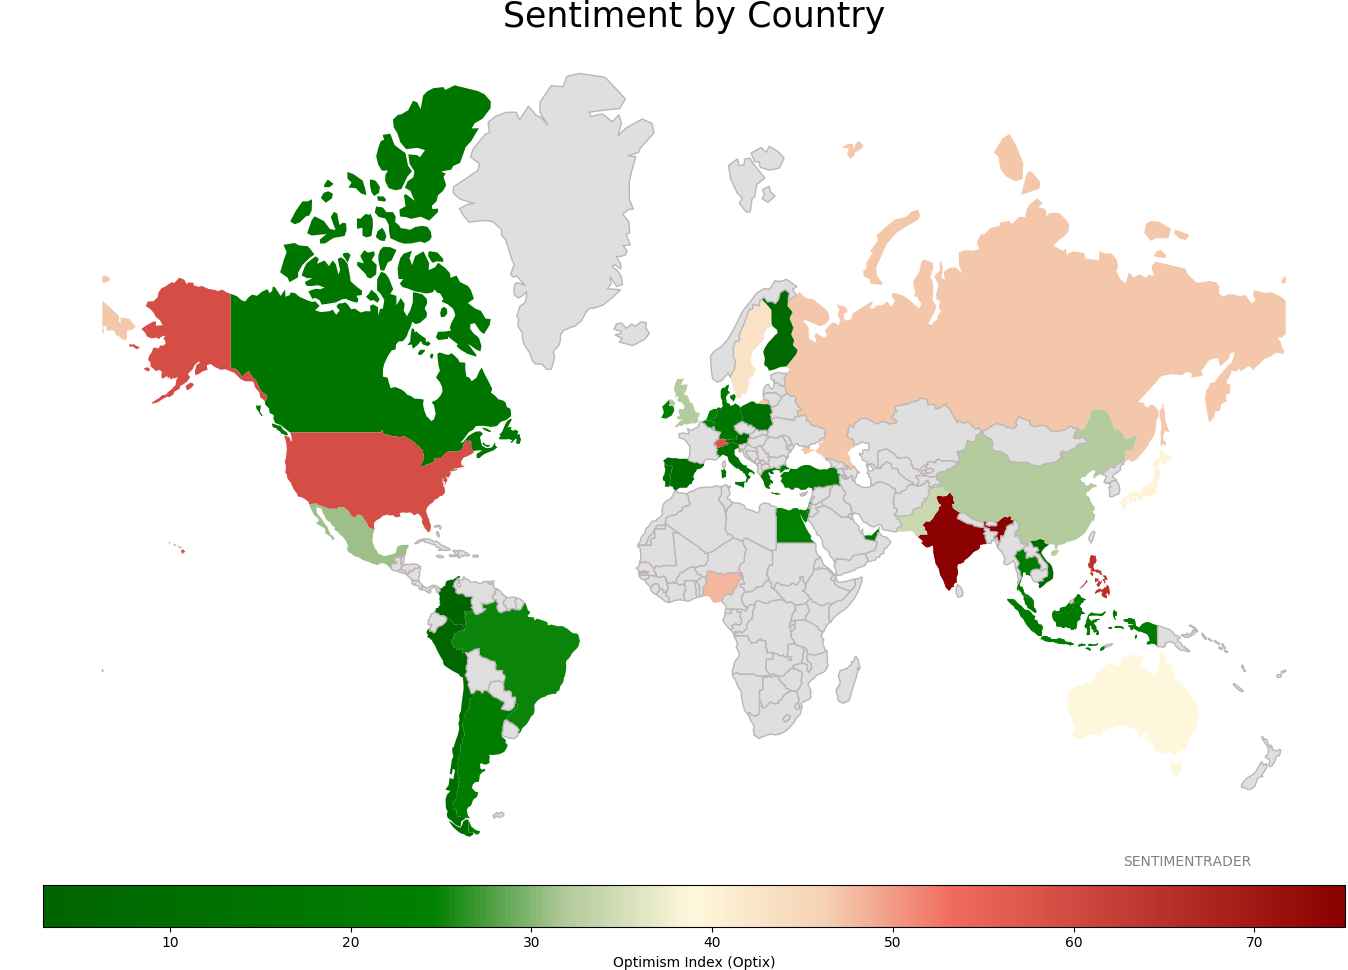
Sentiment Around The World
Optimism Index Thumbnails
|
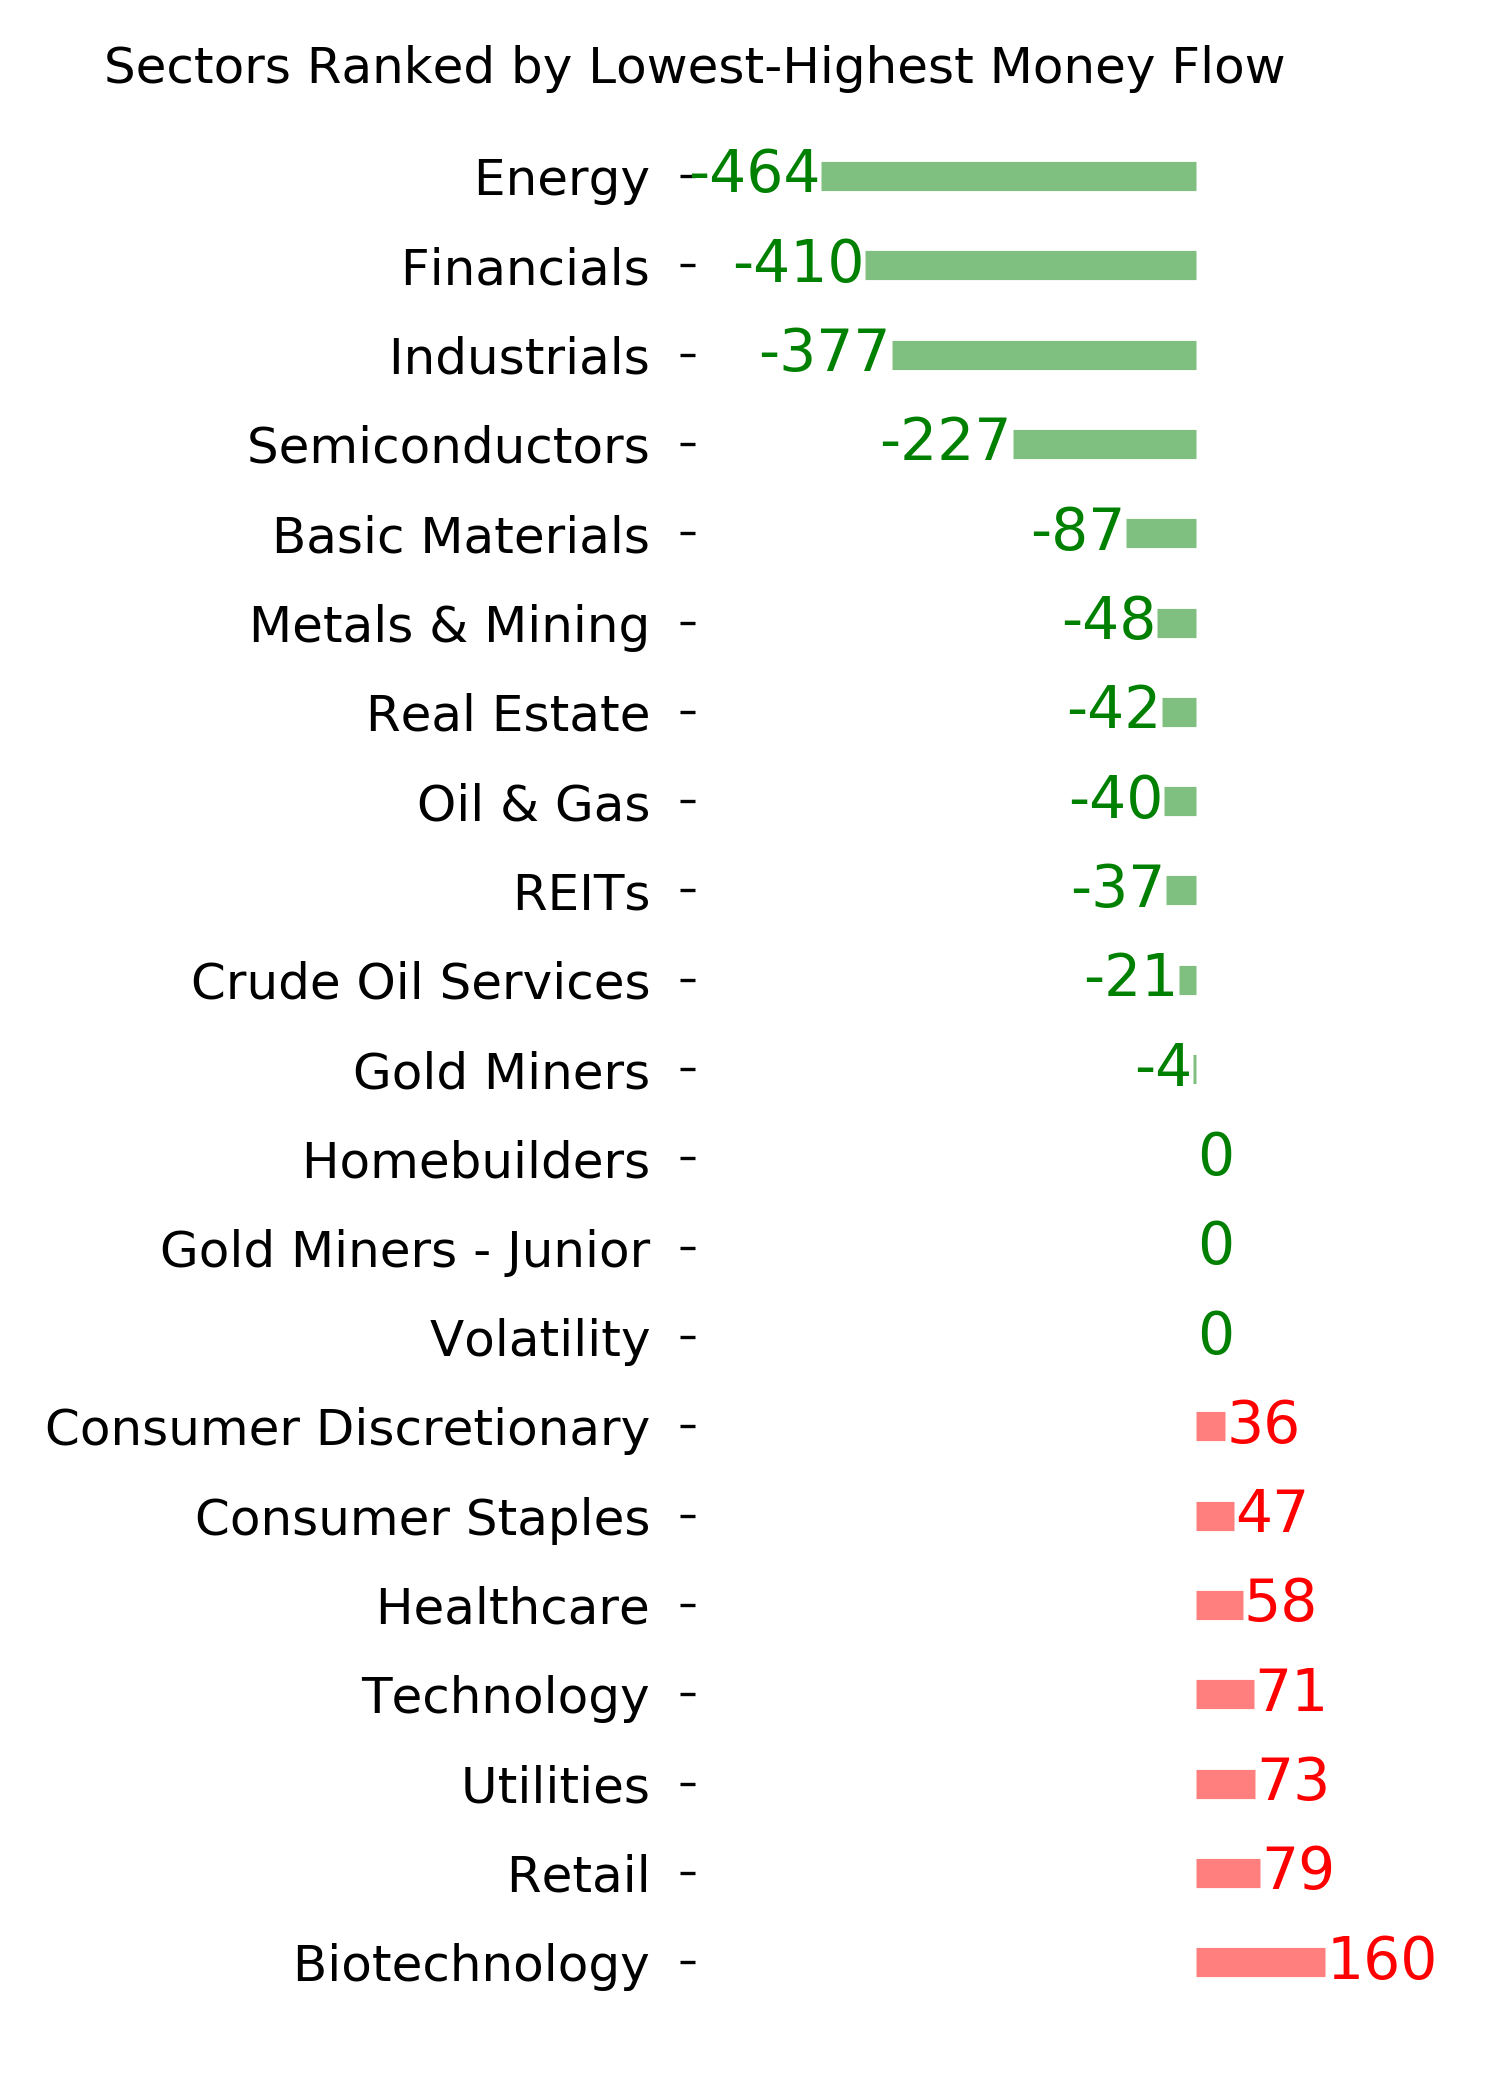
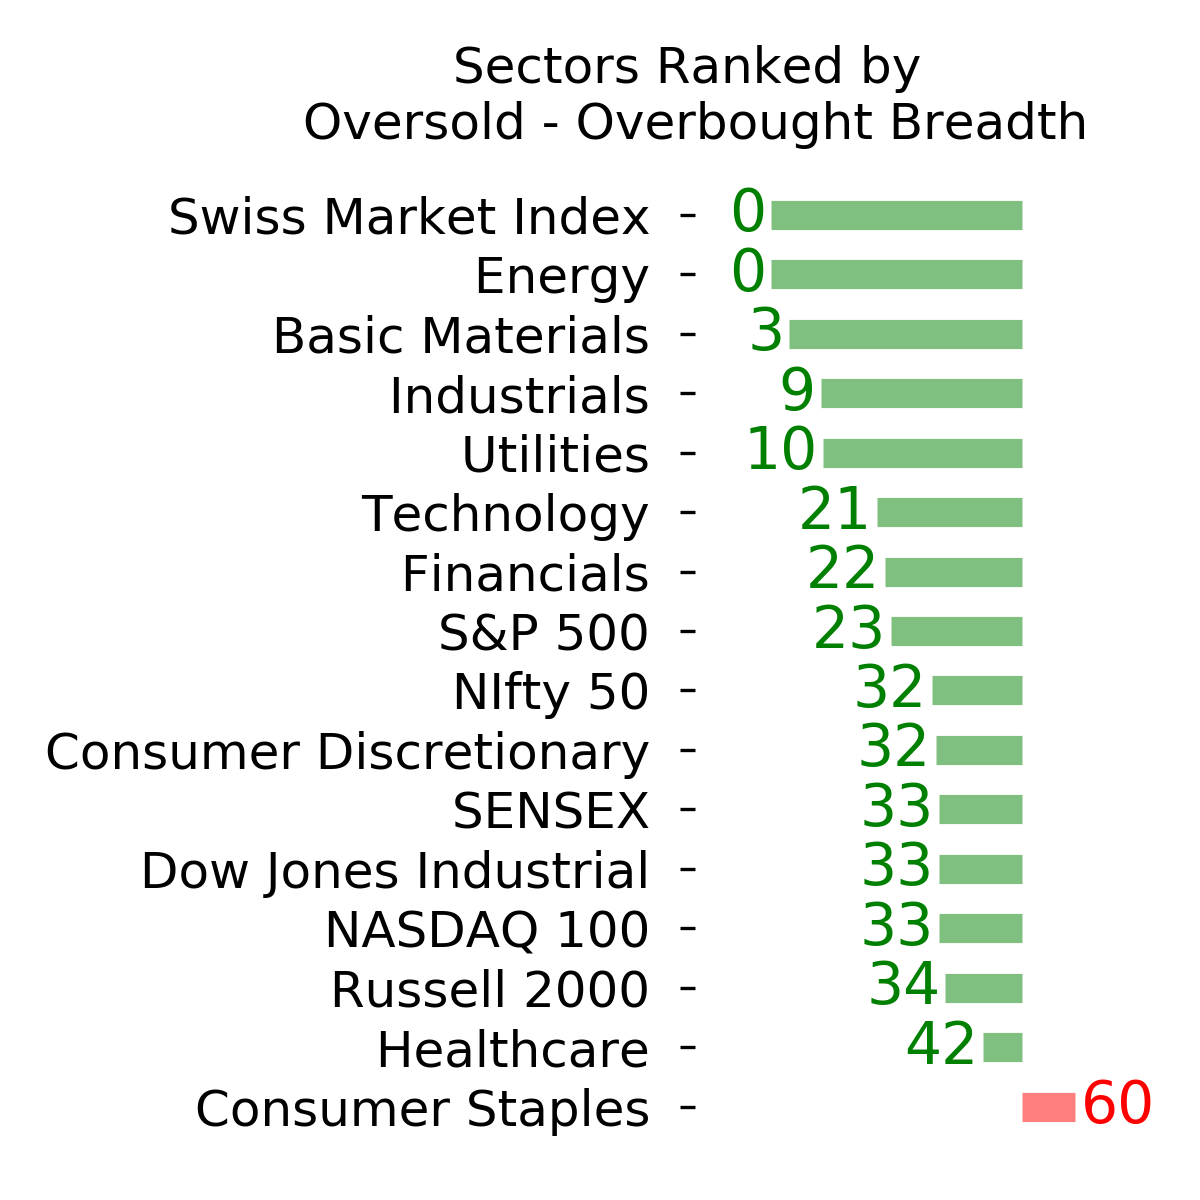
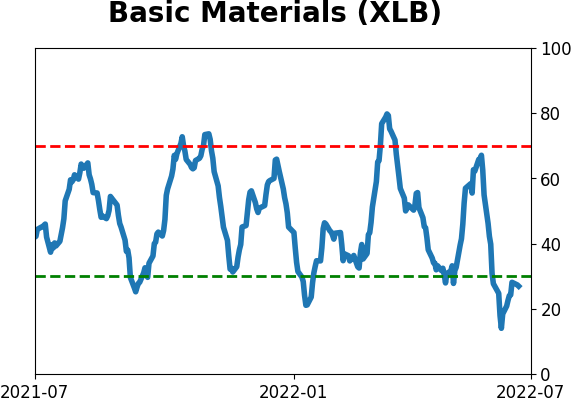
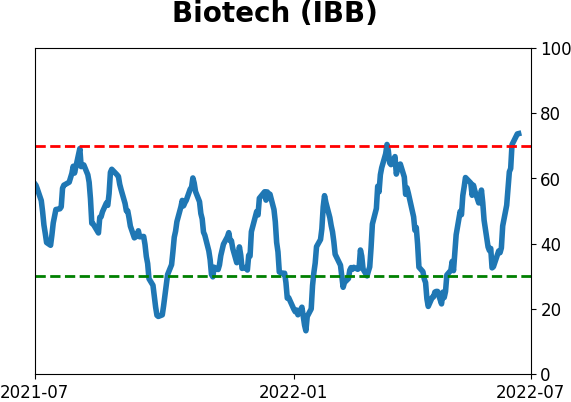
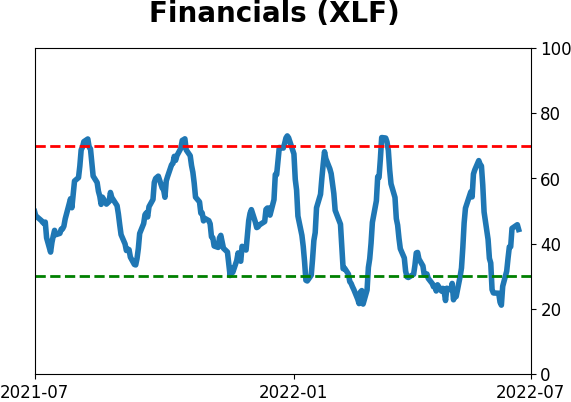
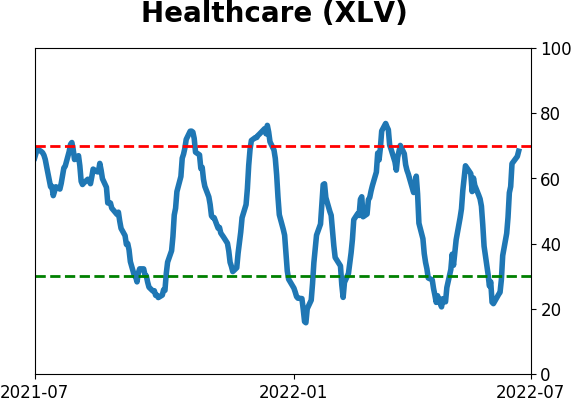
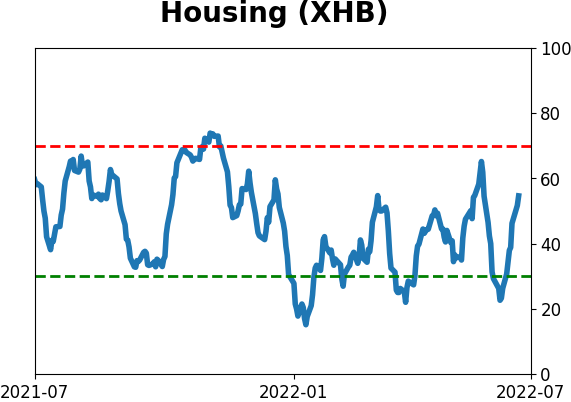
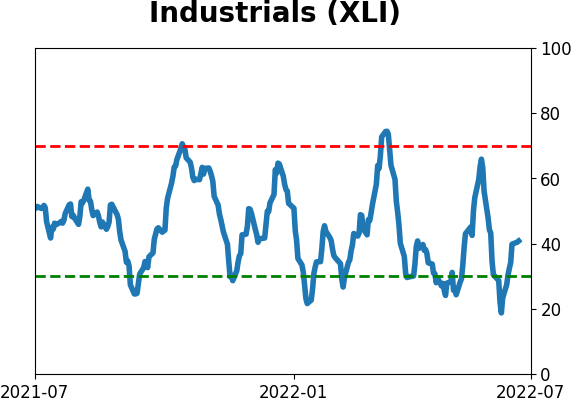
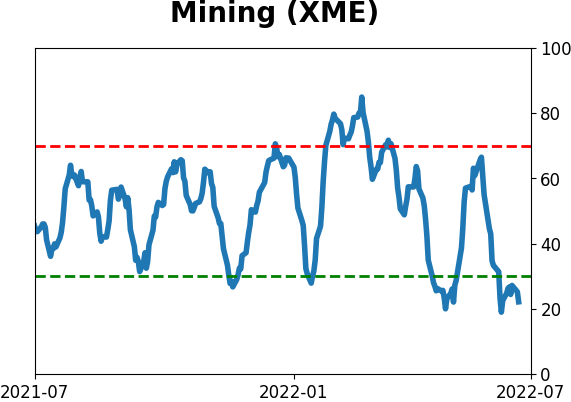
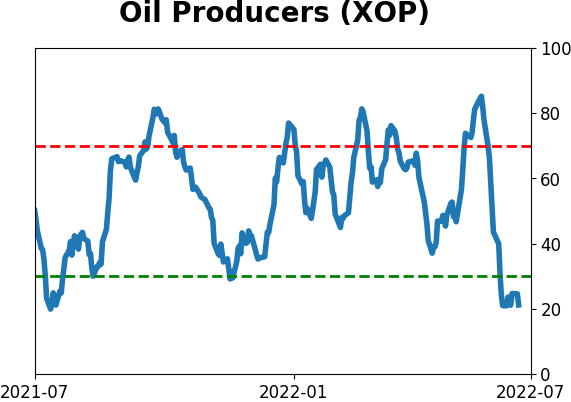
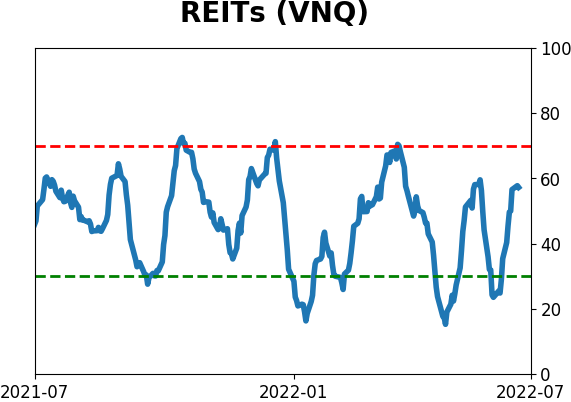
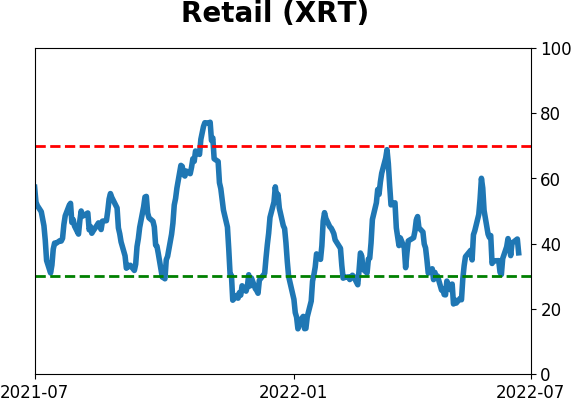
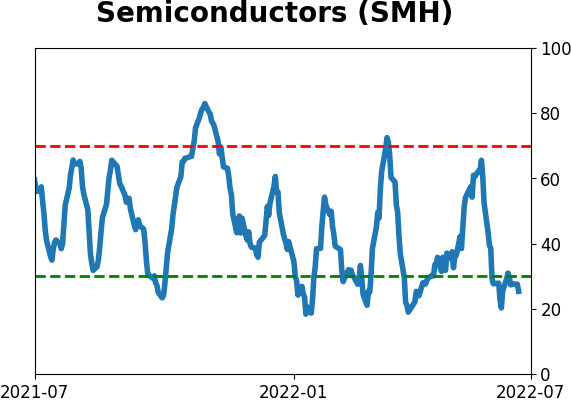
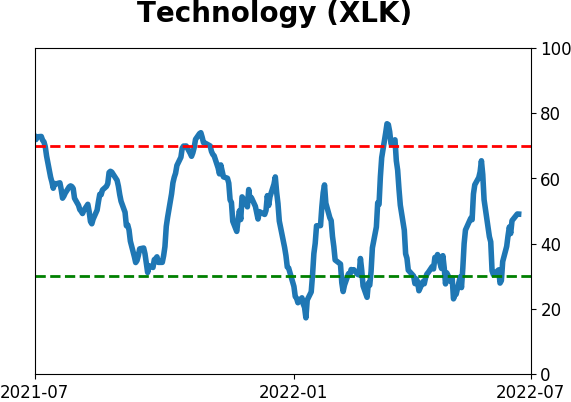
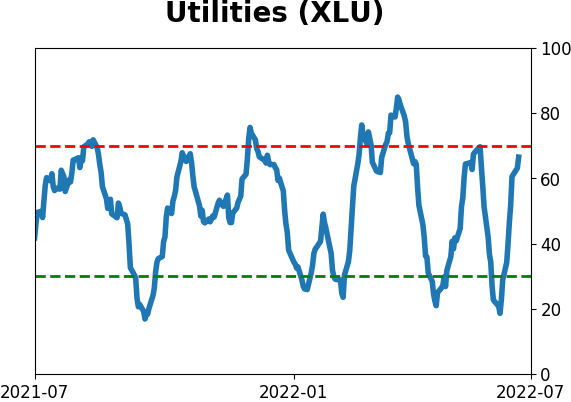
Sector ETF's - 10-Day Moving Average
|
|
|
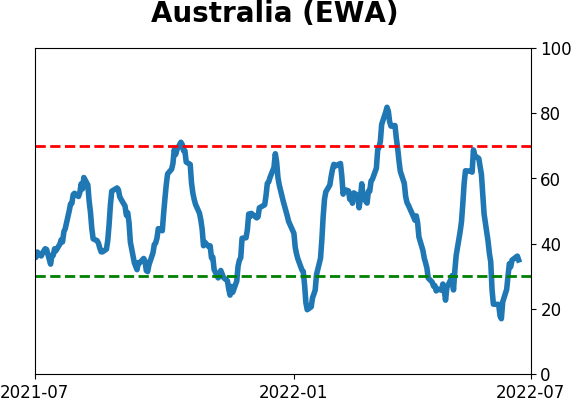
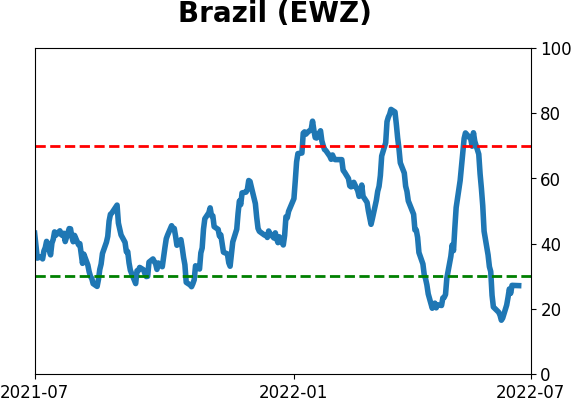
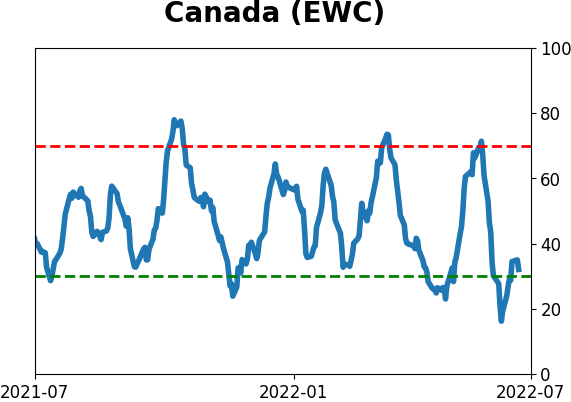
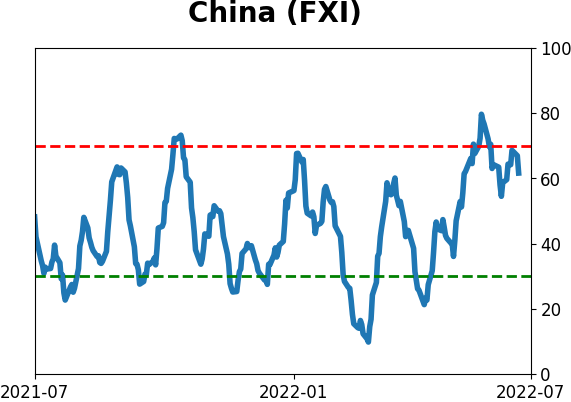
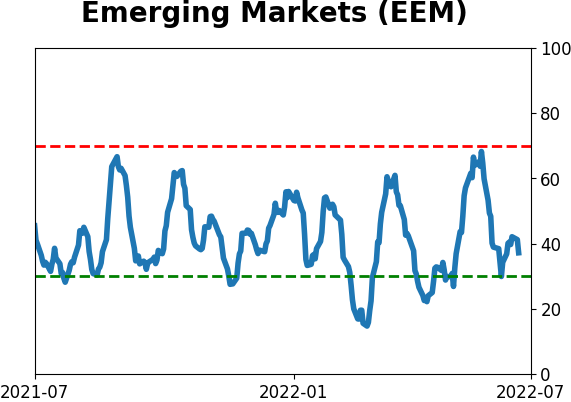
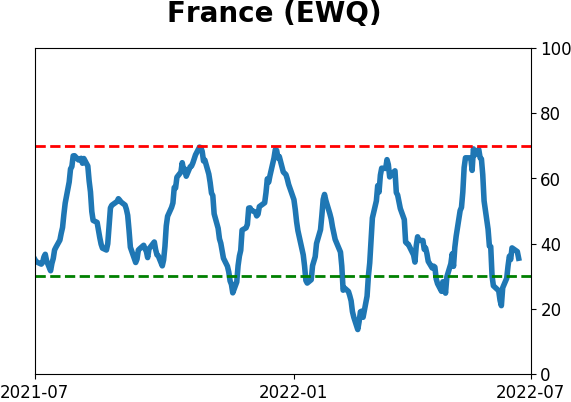
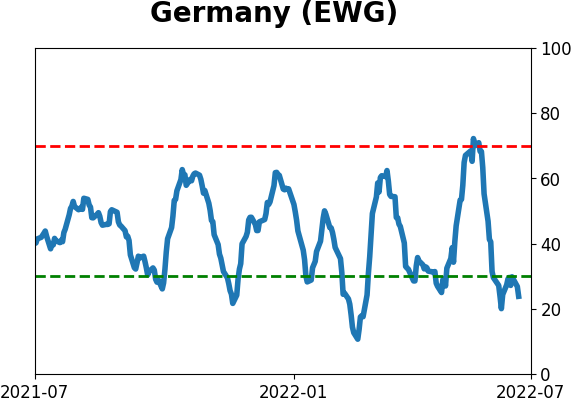
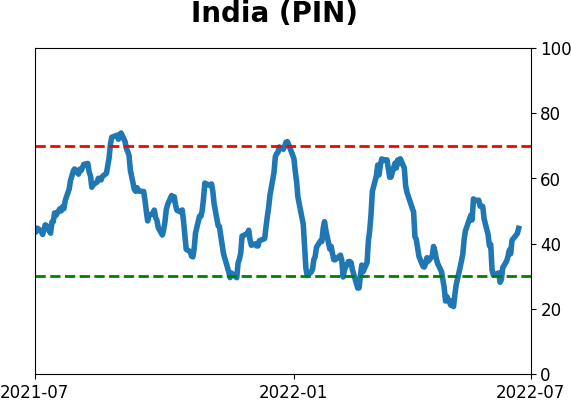
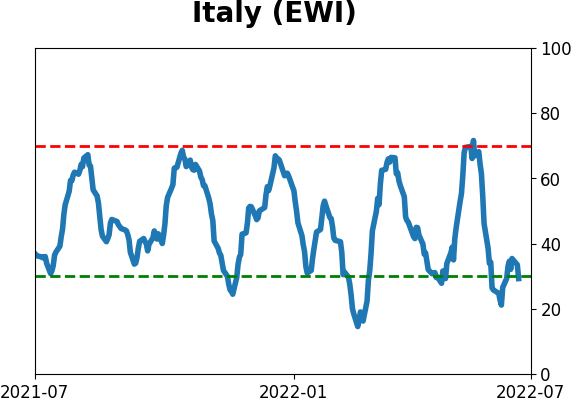
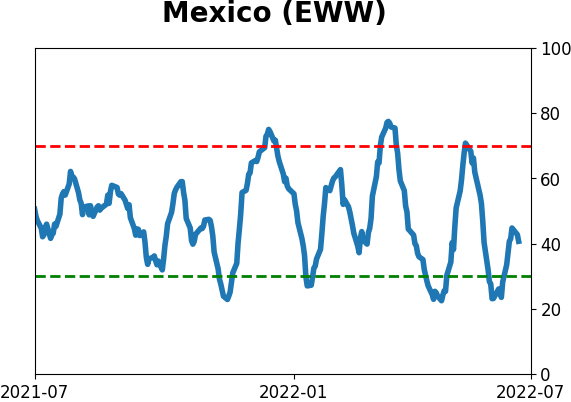
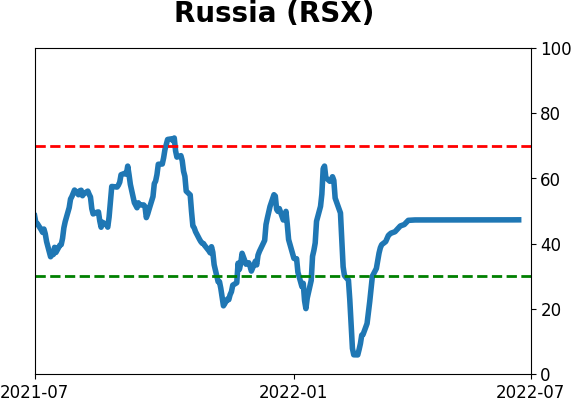
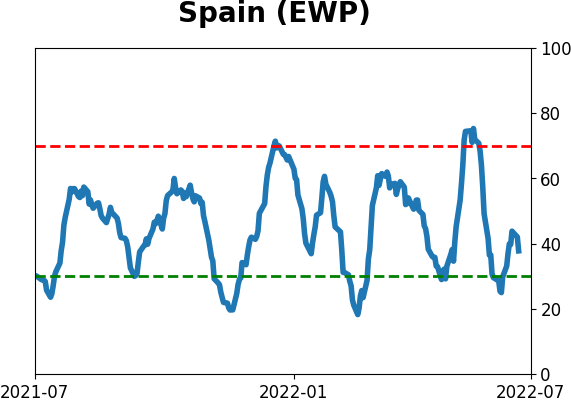
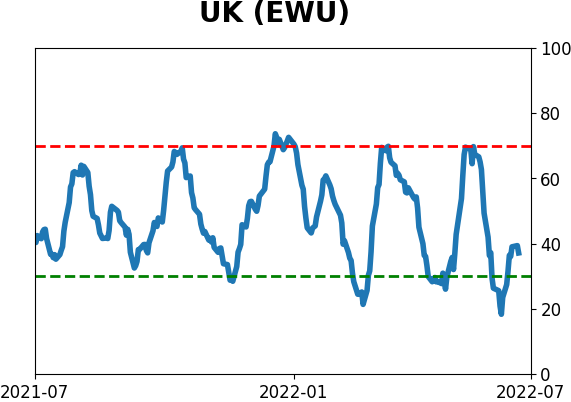
Country ETF's - 10-Day Moving Average
|
|
|
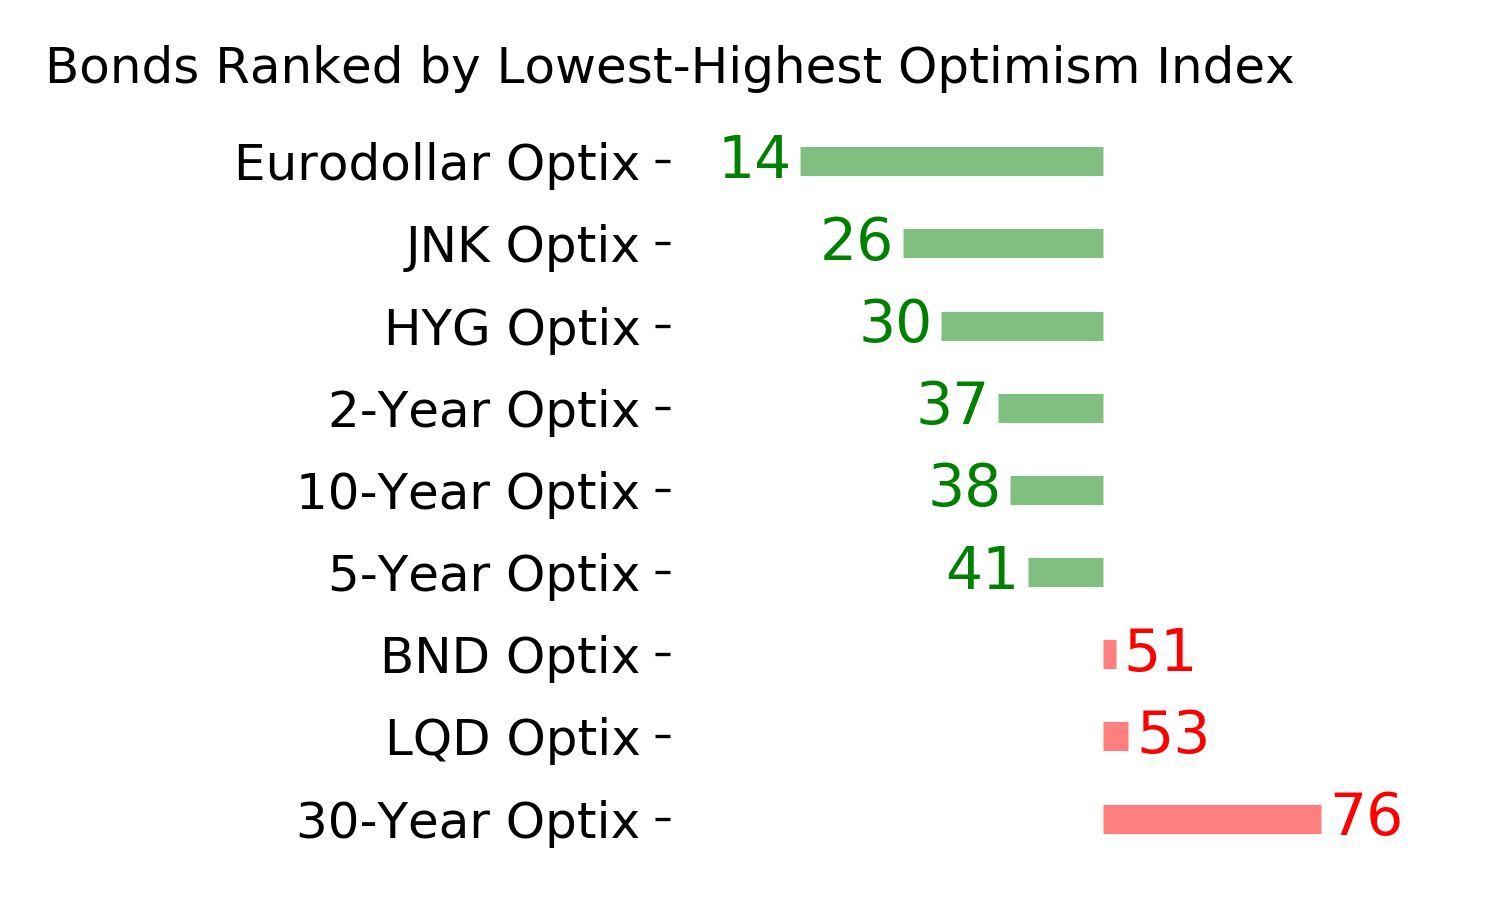
Bond ETF's - 10-Day Moving Average
|
|
|
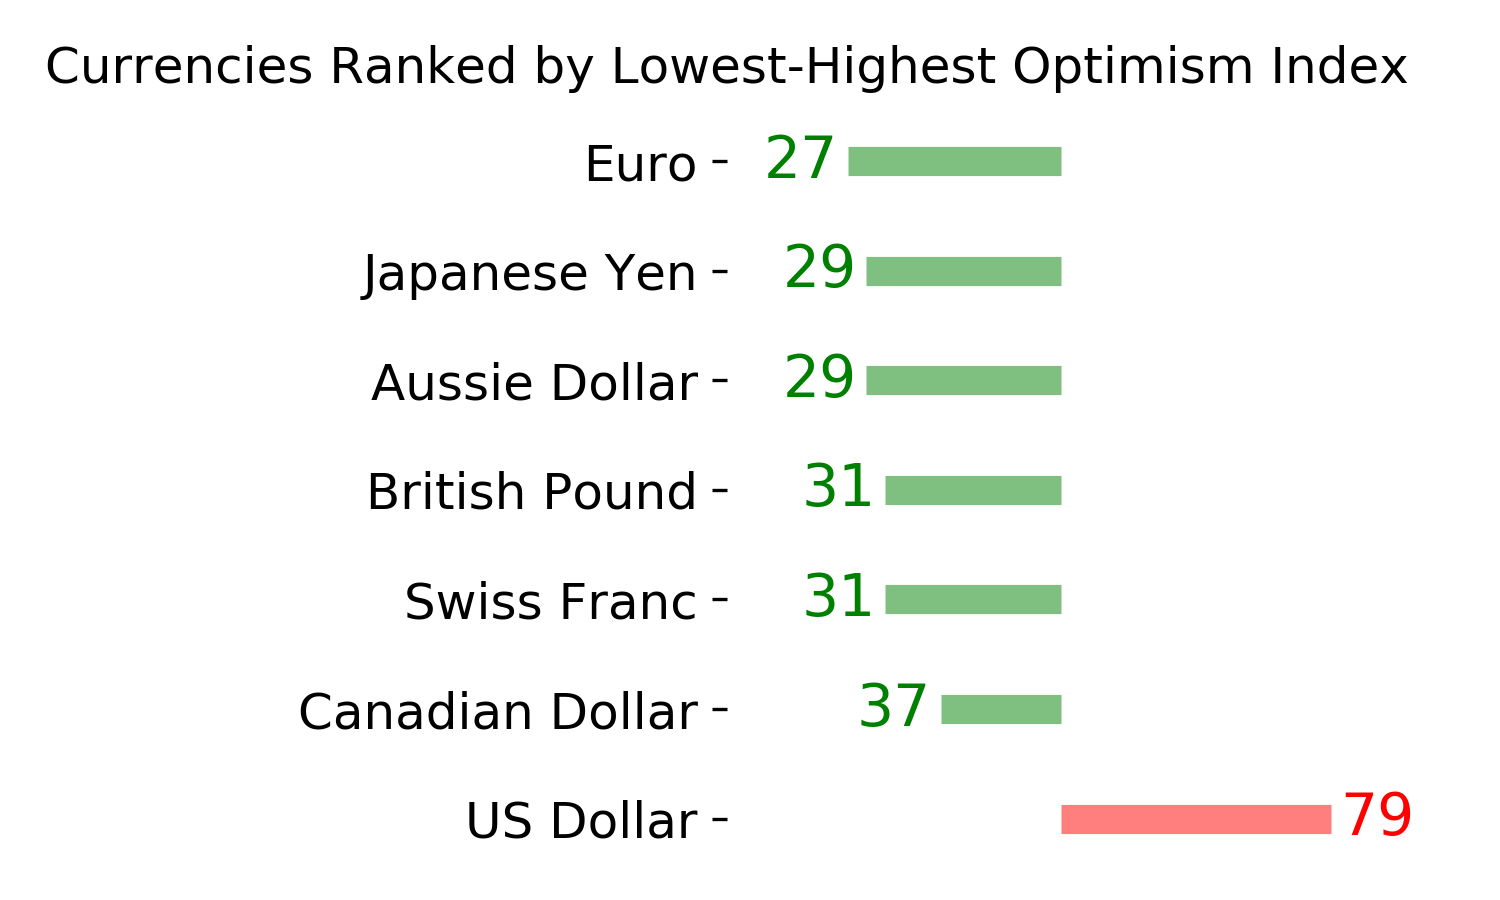
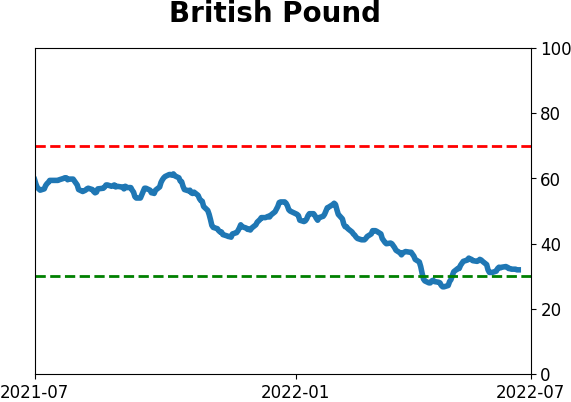
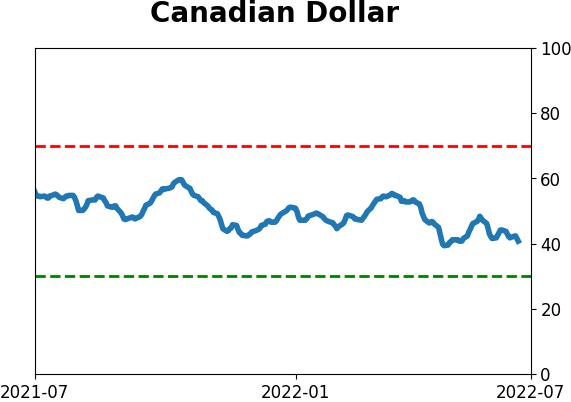
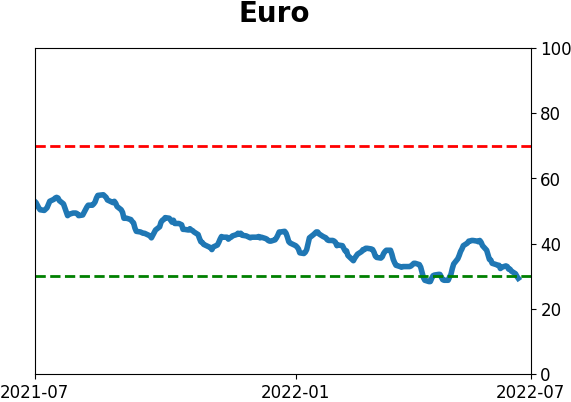
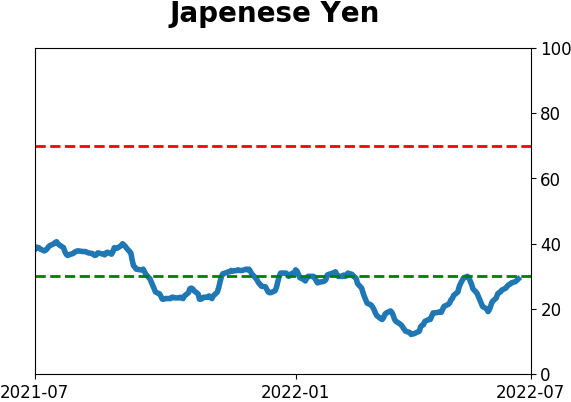
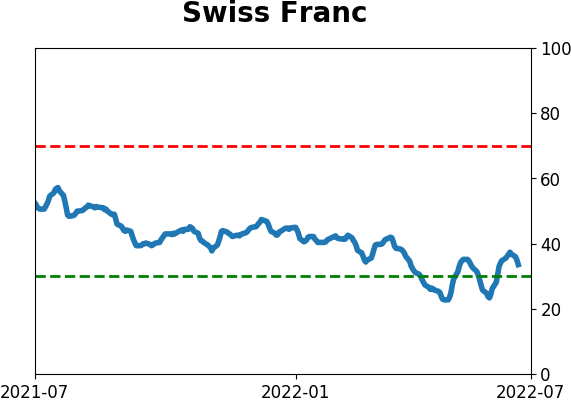
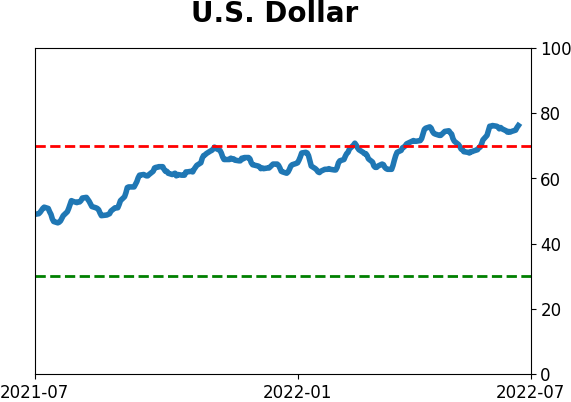
Currency ETF's - 5-Day Moving Average
|
|
|
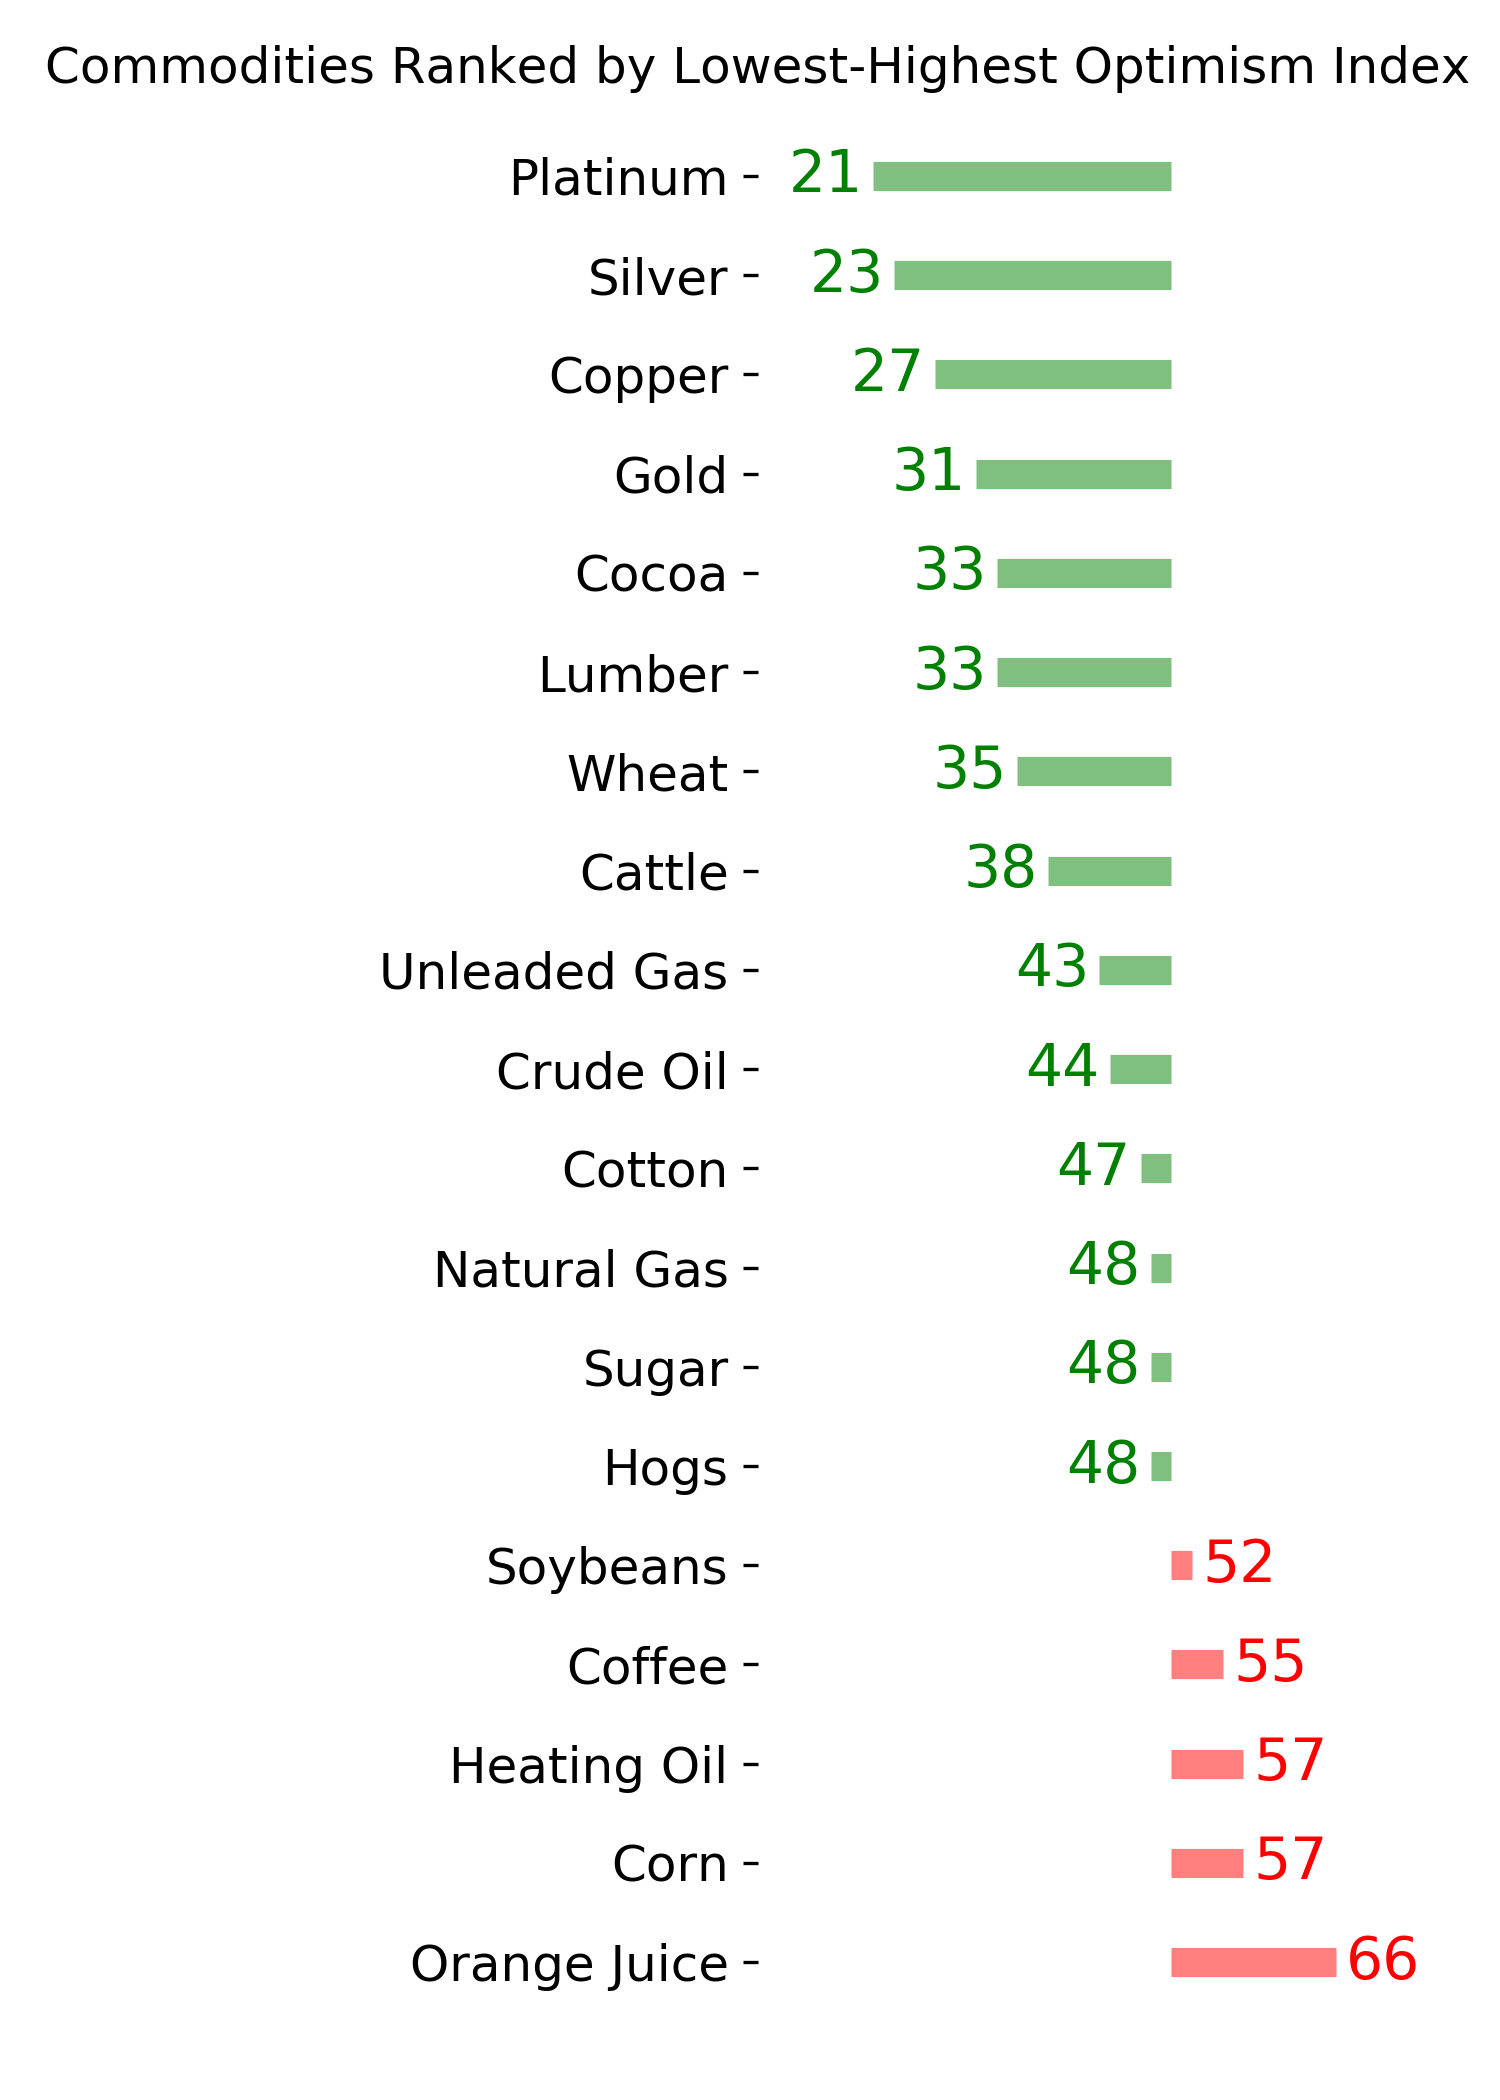
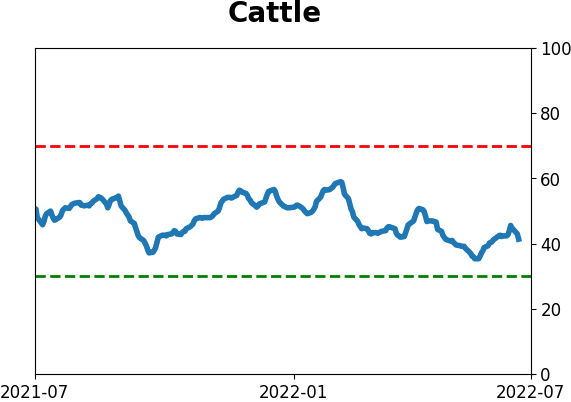
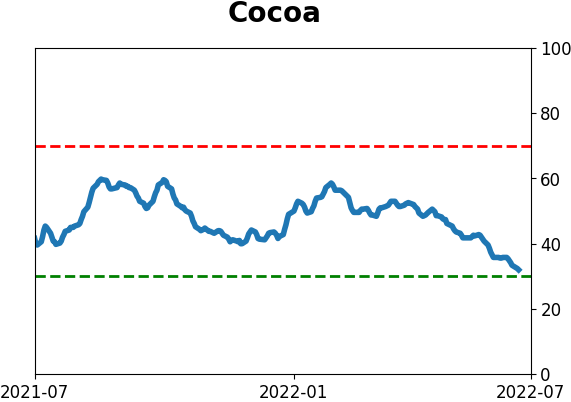
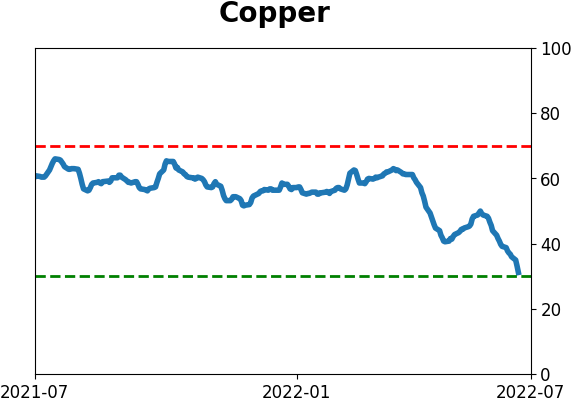
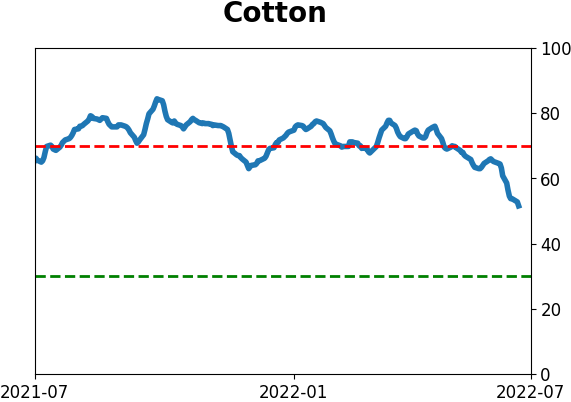
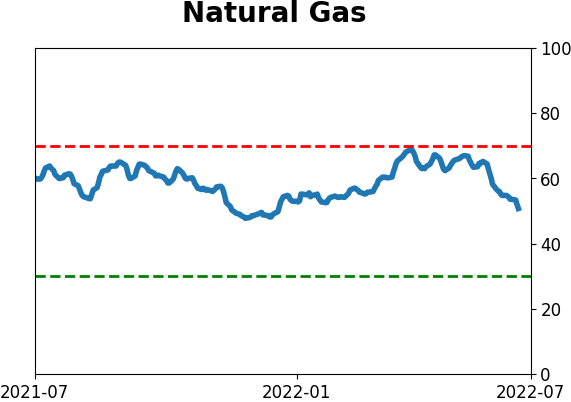
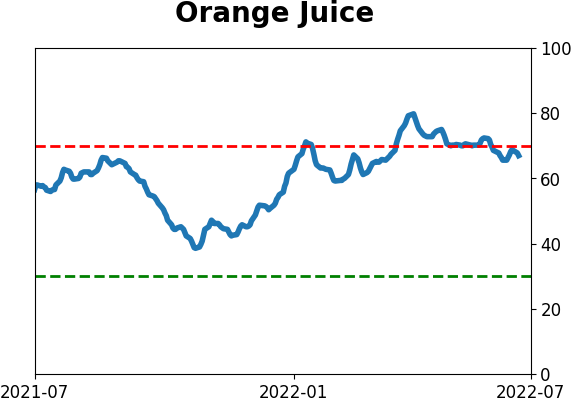
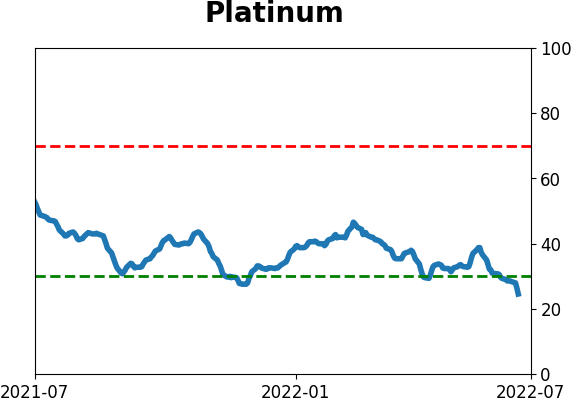
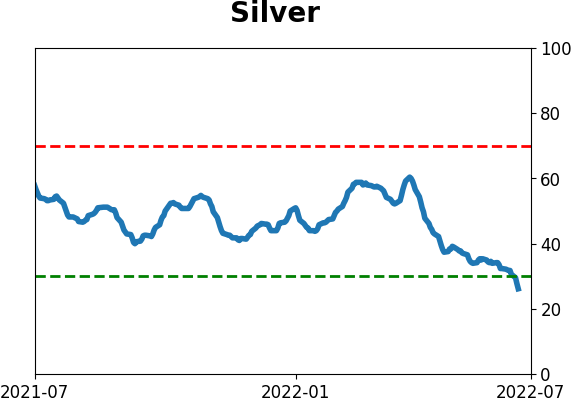
Commodity ETF's - 5-Day Moving Average
|
|