Headlines
|
|
TradingEdge Weekly for Jul 5 - Lots of optimism, bond trader skepticism, platinum problems:
This week, we saw that both Smart Money and Dumb Money Confidence are high, which is very unusual. Bond traders don't seem to be buying stock investors' rosy outlooks. Some indicators are giving readings that are relatively positive long-term. Corn and platinum are facing some sentiment and seasonality issues.
|
Smart / Dumb Money Confidence
|
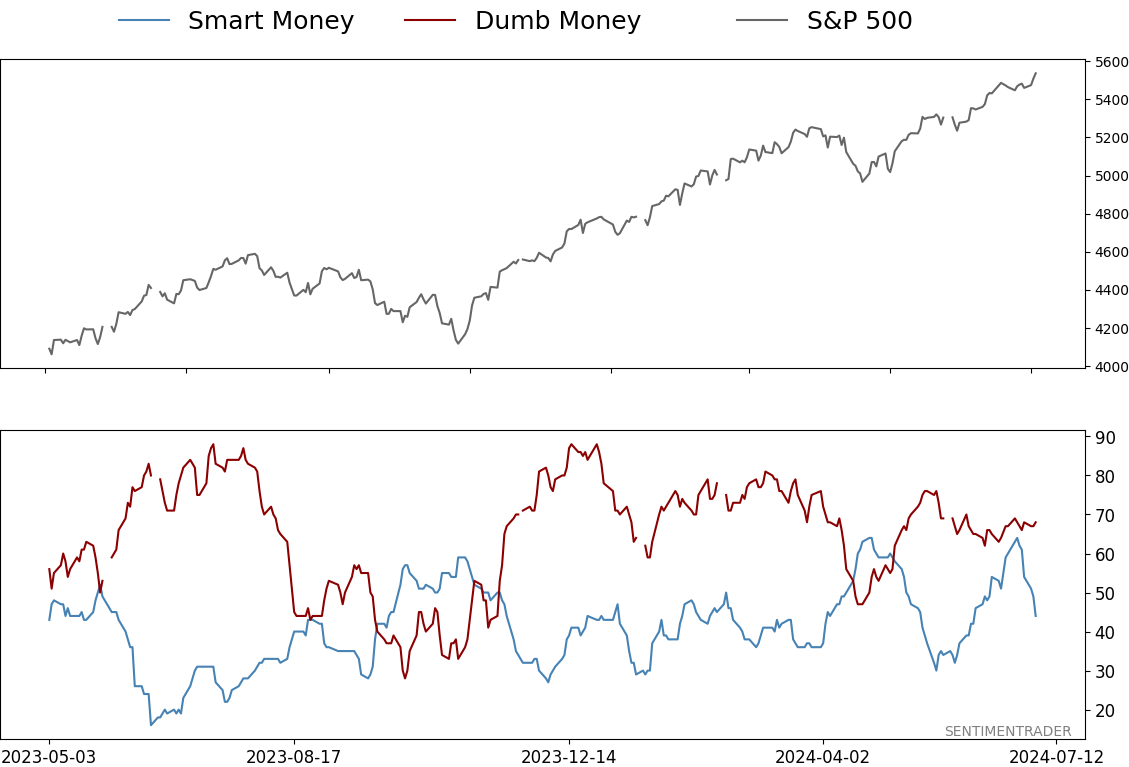
Smart Money Confidence: 44%
Dumb Money Confidence: 68%
|
|
Risk Levels
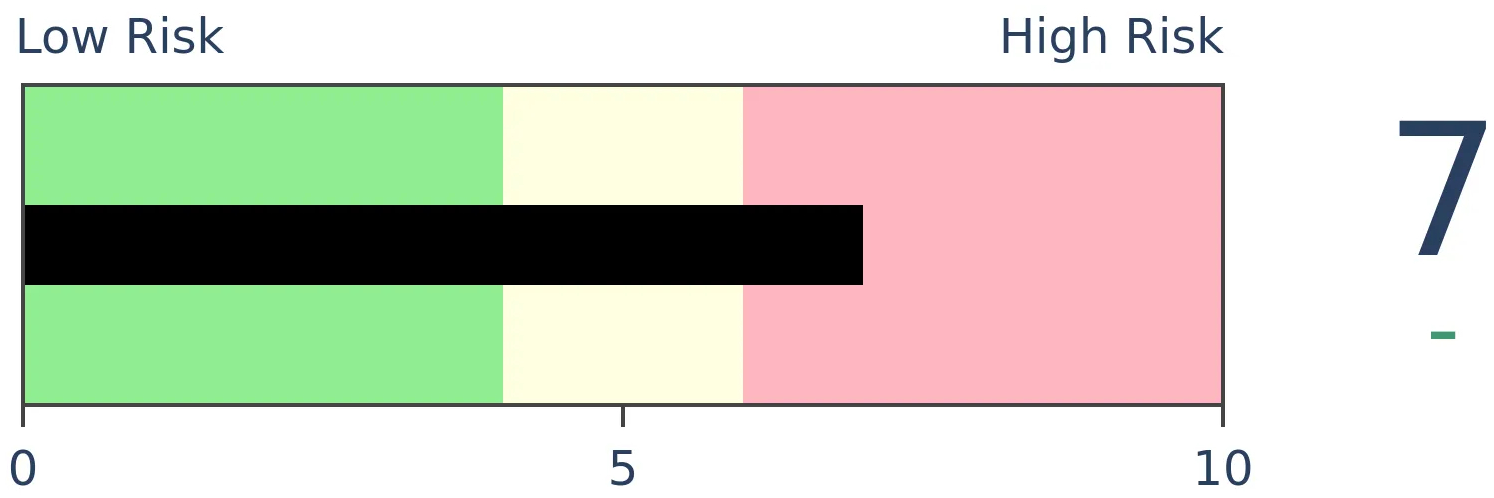
Stocks Short-Term
|
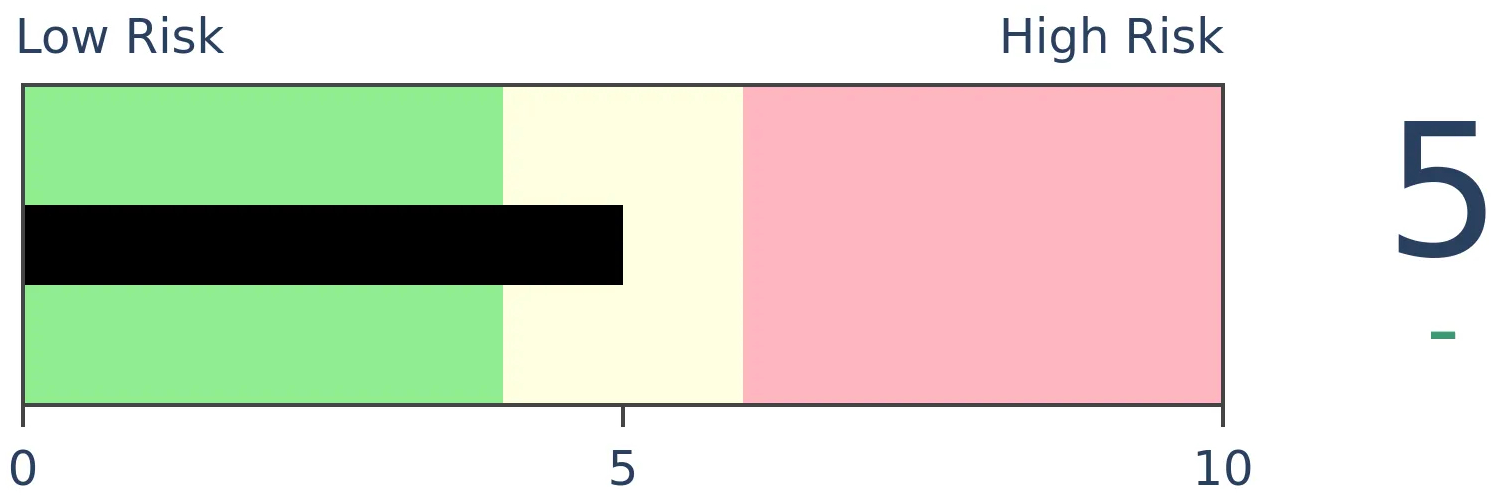
Stocks Medium-Term
|
|
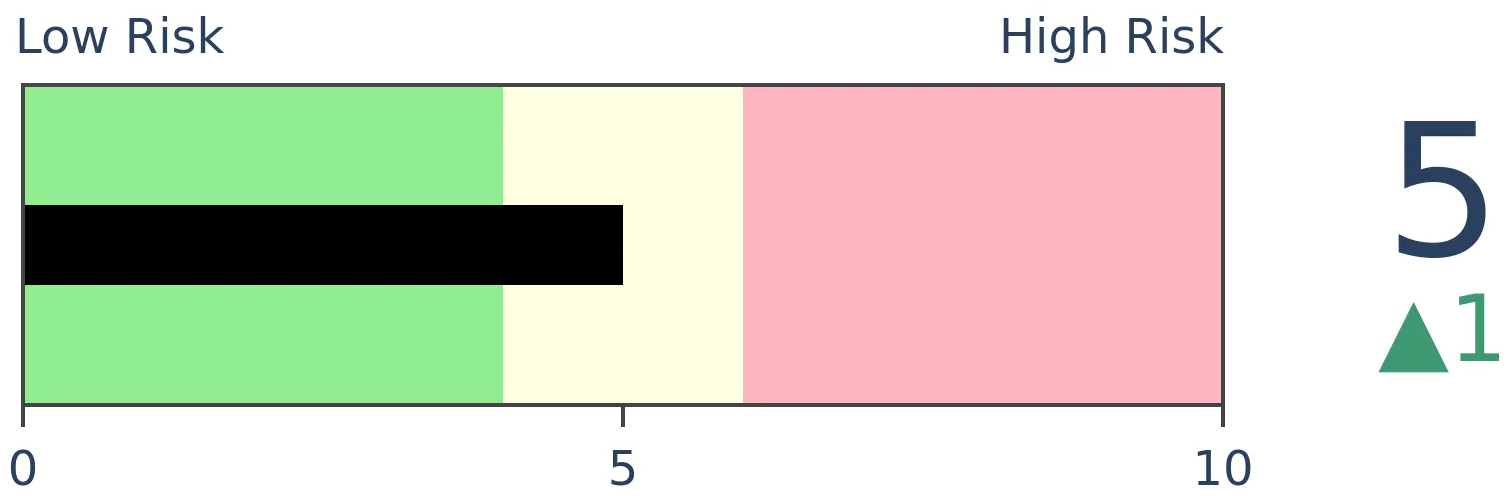
Bonds
|
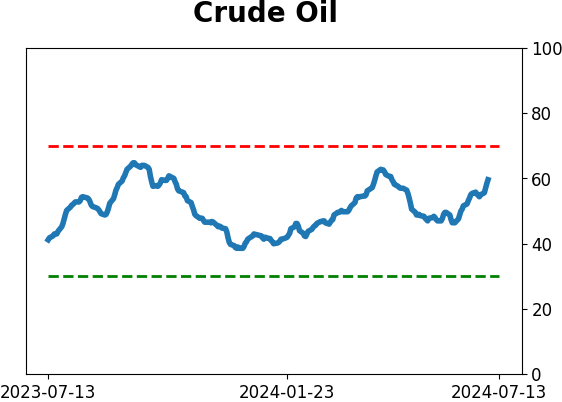
Crude Oil
|
|
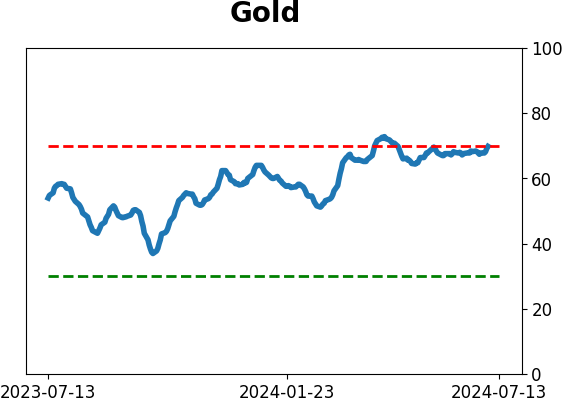
Gold

|
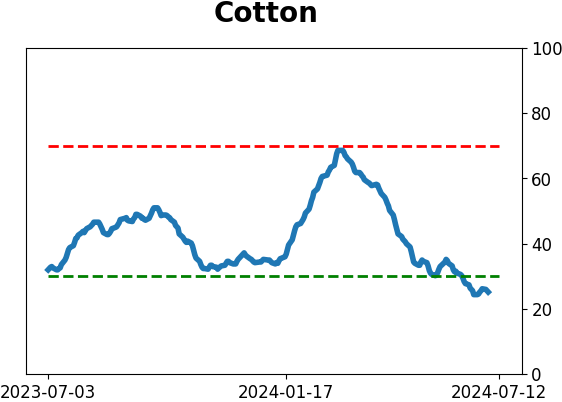
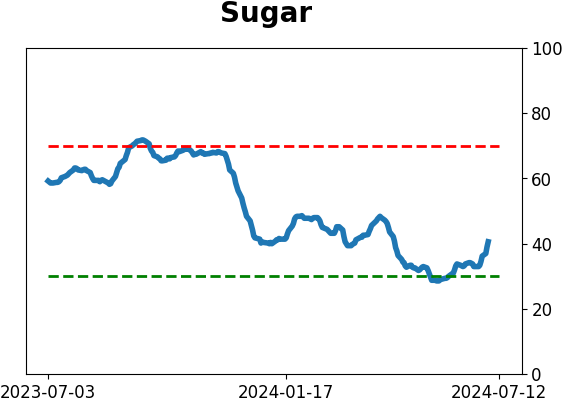
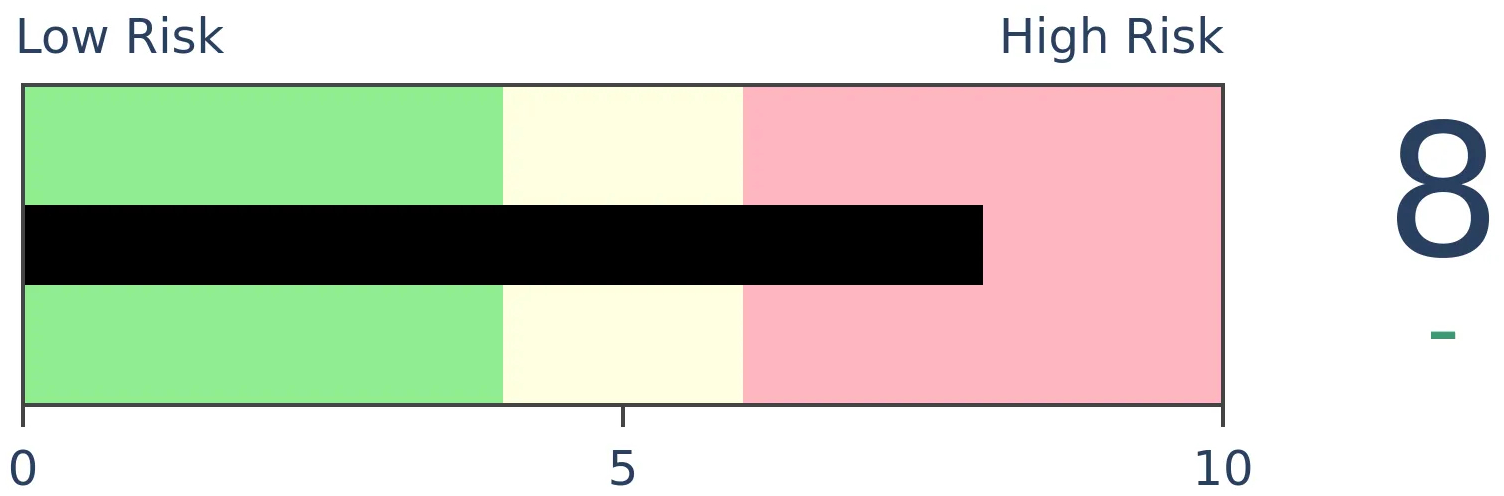
Agriculture

|
|
Research
By Jason Goepfert
BOTTOM LINE
This week, we saw that both Smart Money and Dumb Money Confidence are high, which is very unusual. Bond traders don't seem to be buying stock investors' rosy outlooks. Some indicators are giving readings that are relatively positive long-term. Corn and platinum are facing some sentiment and seasonality issues.
FORECAST / TIMEFRAME
None
|
Key points:
- Is everyone optimistic?
- Bond traders aren't - they don't seem to be buying stocks' rosy outlook
- Not all indicators are bearish
- Brazilian stocks often have a brief seasonal burst about now
- Corn and platinum are facing some issues
A sentiment conundrum
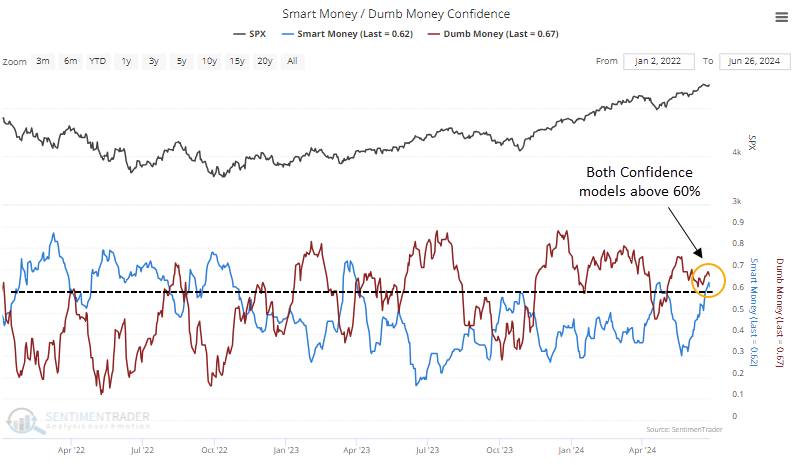
Among the several oddities happening in technicals right now is that sentiment is acting rather oddly. Dumb Money Confidence has been stagnant, but Smart Money Confidence is rising. This model comprises data that mainly reflects institutional activity, and institutions most often buy as stocks decline and vice-versa.
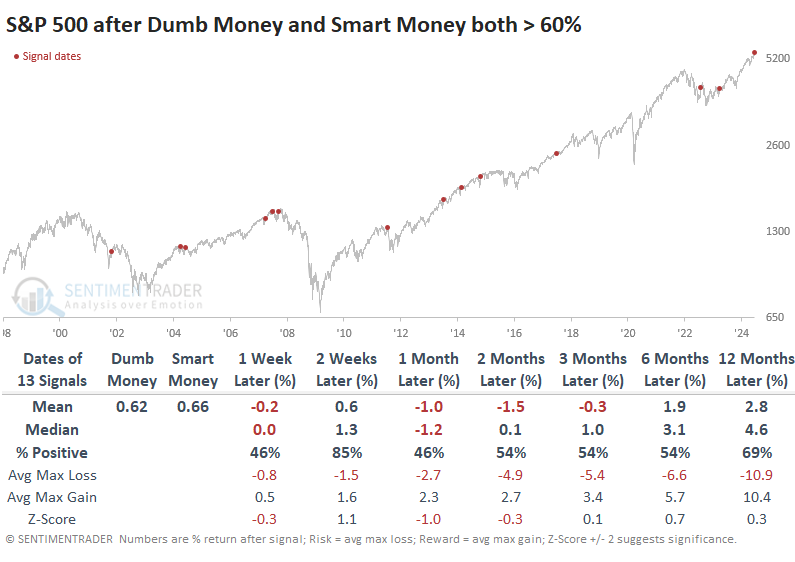
It's strange to see Smart Money rise by 10% or more during a month when the S&P 500 rose significantly. Other times it happened, the S&P showed uninspired returns up to two months later, though the last few signals were excellent.
Because Smart Money has been rising and Dumb Money is still high, both models are above the 60% confidence level at the same time. This, too, is highly unusual.
Since the models' inception in 1998, this is the highest Smart Money Confidence reading when Dumb Money was above 65%. If we relax the parameters to 60%, we get the results in the table below.
Up to three months later, the mean return was negative, and the median was just barely positive. Risk outweighed reward across time frames, even up to a year later, even though the win rate improved.
We don't like "odd." It's better when markets do what they should be doing, and investors behave like they should be behaving. That's been the case, with few exceptions, since the fall of 2022. It started to change in January of this year and quickly corrected itself. Then, about a month ago, we began to see oddities pile up in a more worrisome manner, and it continues today.
Bond traders aren't buying stocks' rosy outlook
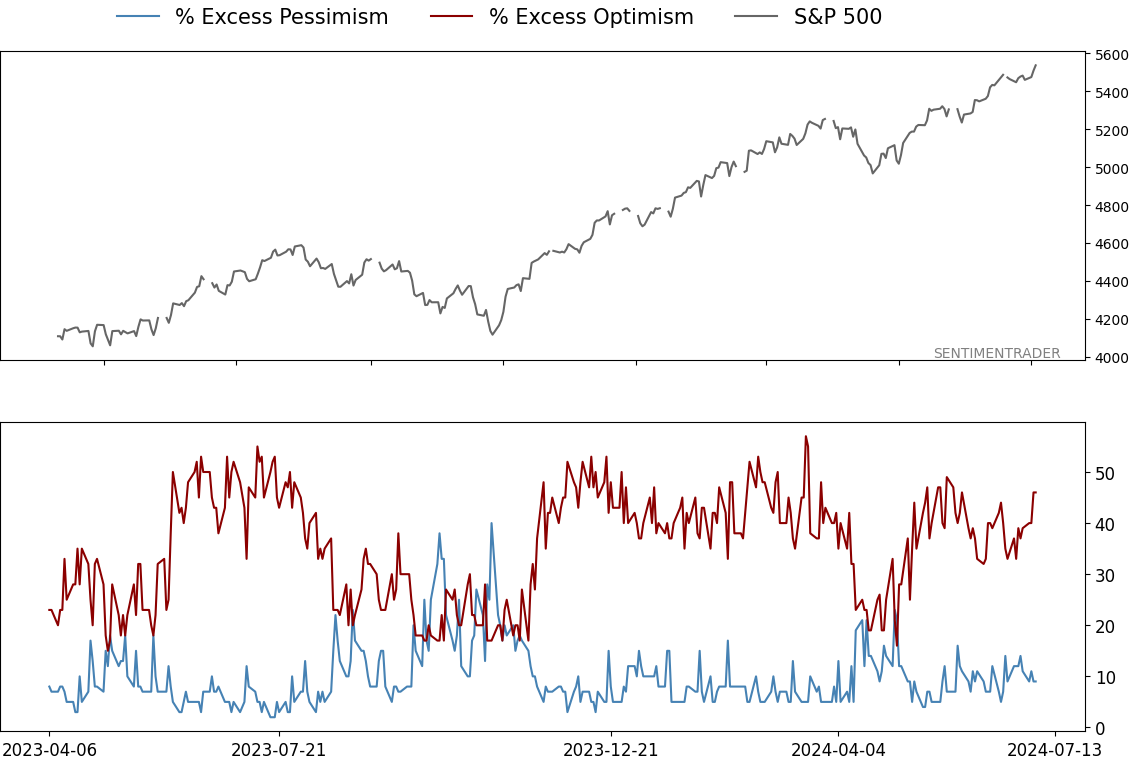
We've been seeing many divergences in breadth and sentiment.
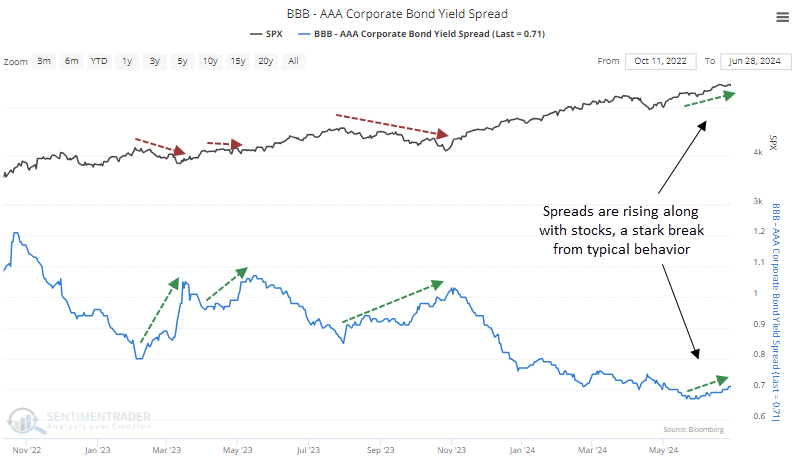
Perhaps more troubling is that divergences are also showing up in credit. Divergences between the two can hold some information, and we're seeing that now. In a stark change from the past couple of years, the spread between the riskiest and safest investment-grade credits bottomed about two months ago and is nearing a two-month high, even as stocks rally. The spread usually only rises as stocks fall.
When the S&P 500 was hovering within spitting distance of a new high, and the BBB/AAA spread was at least at a 35-day high, the S&P's returns going forward were poor across most time frames. The next one to two months were especially unappetizing.
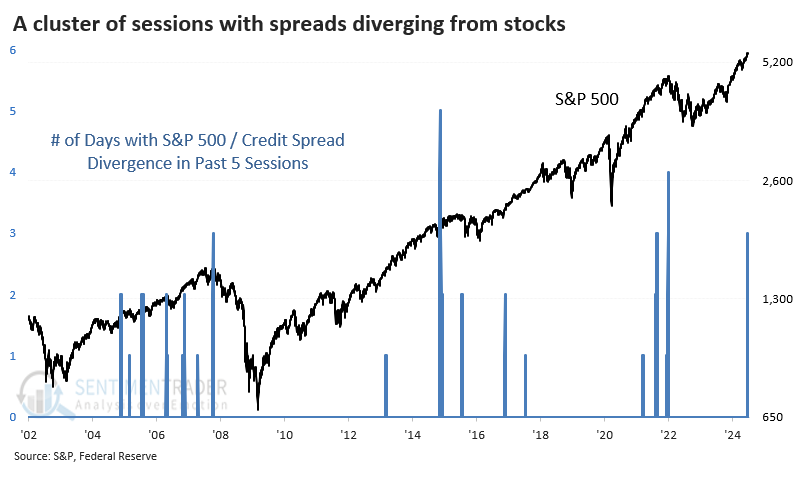
A bigger problem is that we're seeing a cluster of readings, not just a one-off. The divergence has been evident for three of the past five sessions, rivaling the largest clusters in 22 years.
The table below shows S&P 500 returns after clusters of at least three divergences in five sessions. These are times when the S&P was hovering at or very near a new high, but credit spreads were either widening or holding near (almost) two-month highs. Each time, it signaled that most of the upside in stocks was in the rearview mirror and risk was high.
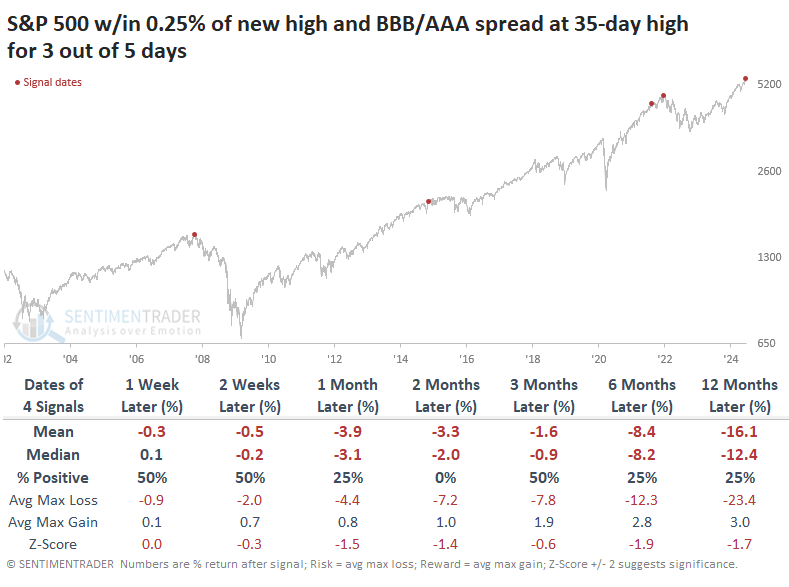
The table of maximum gains and losses across time frames shows that each signal suffered significantly larger maximum losses over the next year than enjoyed maximum rewards.
Not every indicator is sending a warning
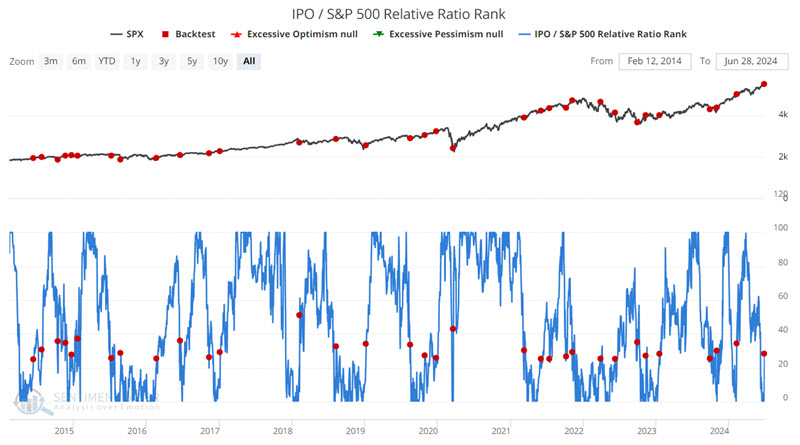
Some indicator signals are best used not as a standalone trading system but as weight of the evidence. Jay noted that the IPO / S&P 500 Relative Ratio Rank, OEX Open Interest Ratio, and Dumb Money Confidence indicators have all given recent favorable signals.
The IPO / S&P 500 Relative Ratio Rank indicator shows where the ratio is relative to its range over the past four months. When the relative ratio is high, investors are showing risk-on behavior. When the ratio drops to a low level, they exhibit risk-off behavior. One signal that can be useful is when there is a reversal off of a low level.
The chart below highlights those dates when the IPO / S&P 500 Relative Ratio Rank crossed above 25%. The most recent signal occurred on 2023-06-27.
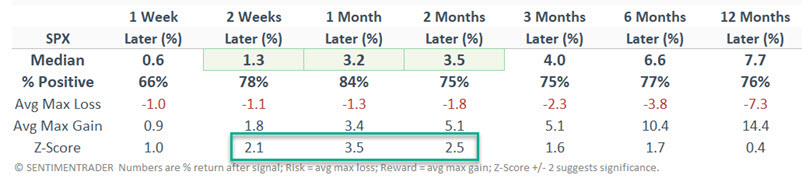
Jay also looked at readings in the OEX putc/call open interest ratio and a long-term moving average of Dumb Money Confidence, which have preceded mostly positive returns longer-term.
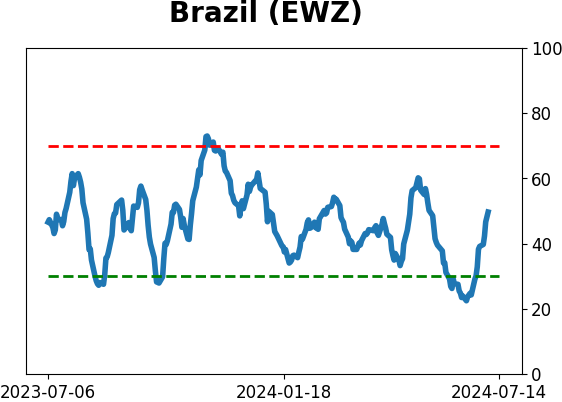
Betting on Brazil
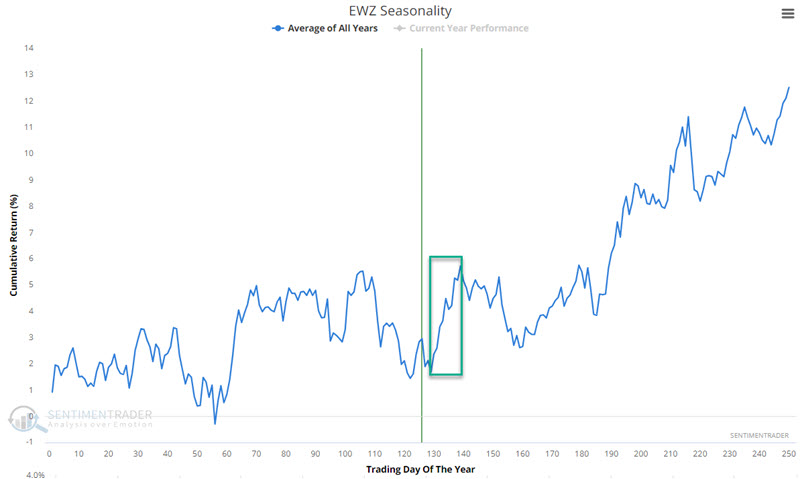
The Brazilian stock market has not participated in the global bull market, with EWZ unchanged over the last sixteen years. It has lost almost 18% in the previous twelve months, but brief short-term trading opportunity may be forming for speculative traders.
In the Annual Seasonal Trend chart below for EWZ, we see a brief favorable period that extends from the close of Trading Day of the Year (TDY) #129 through TDY #139. For 2024, this period extends from the close on 2024-07-08 through 2024-07-22.
The chart below displays the hypothetical growth of $1 invested in EWZ only during this 10-day trading period every year since 2001.
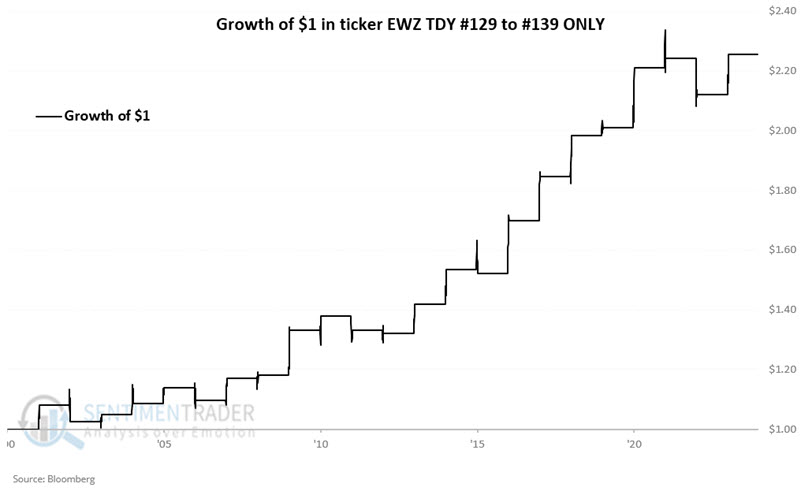
This period has seen higher prices roughly three out of every four years. The worst loss was -5.4% (a reasonable risk for many short-term traders), and 6% or more gains have occurred ten times in 23 years.
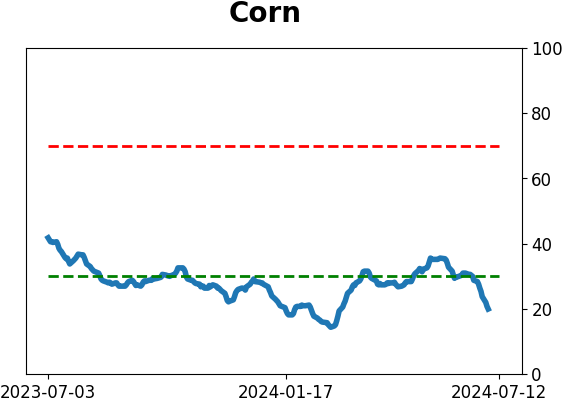
Corn and platinum worries
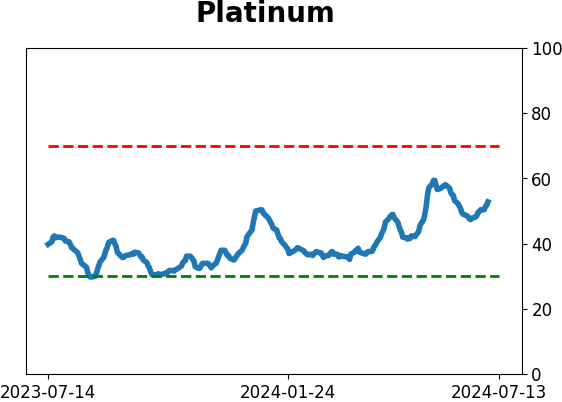
Jay showed that corn is trending lower in line with seasonal expectations - however, sentiment has already gotten overdone to a bearish extreme. Platinum sentiment became overly bullish, with the seasonally weak months of August and September looming.
Corn has demonstrated a strong tendency to show weakness from mid-June into early August.
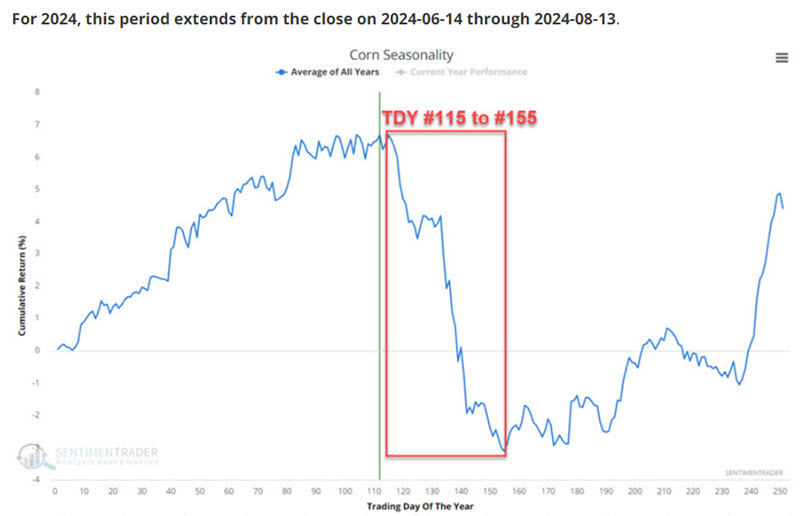
July tends to be the worst month, so the potential for further downside action remains high. So, it makes sense to continue to give the bearish case the benefit of the doubt if price action continues to confirm the trend. However, bearish traders should be on heightened alert for a profit-taking opportunity.
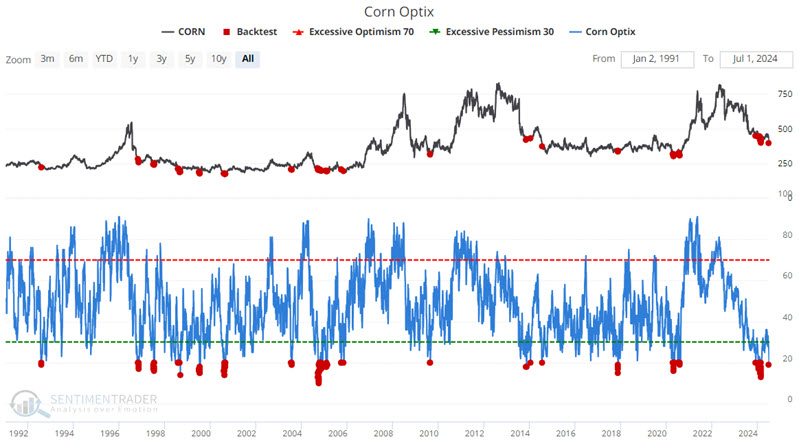
The chart below highlights all dates when Corn Optix was below 19%. The most recent period began on 2024-06-28. As you can see, it doesn't happen often and often occurs near market lows.
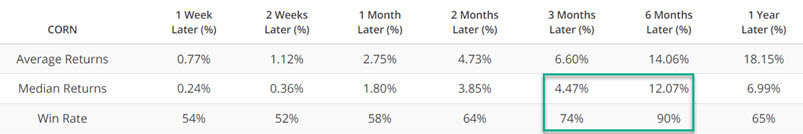
The key results to consider are the 90% Win Rate and 12% Median Gain after six months. Corn traders holding a short position are encouraged to carefully consider and monitor their trailing stops to lock in profits before they get away.
The chart below highlights those dates when the 50-day moving average of Platinum Optix crossed above 50 while Platinum futures were above their 150-day moving average. The most recent signal occurred on 2026-06-26.
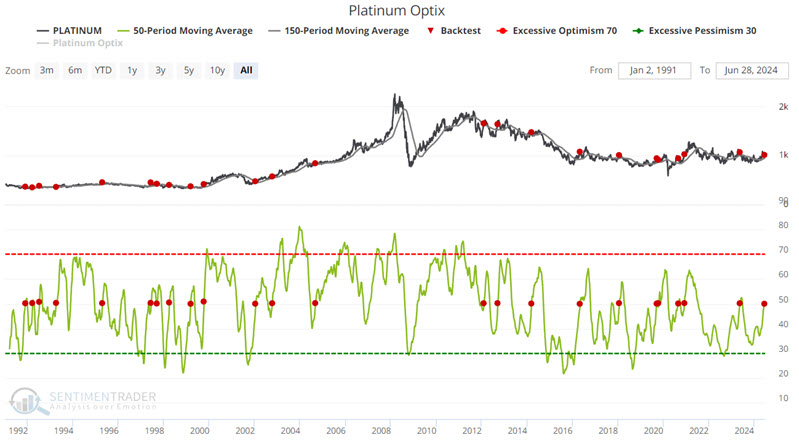
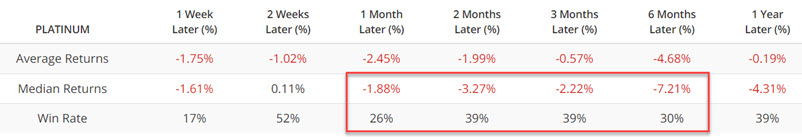
There has been a definite bias to the downside following previous signals.
Alos, the chart below displays the Annual Seasonal Trend for Platinum. Note that while July has a slight historical upside bias, August has tended to be weak, and September has been the worst month historically for Platinum.
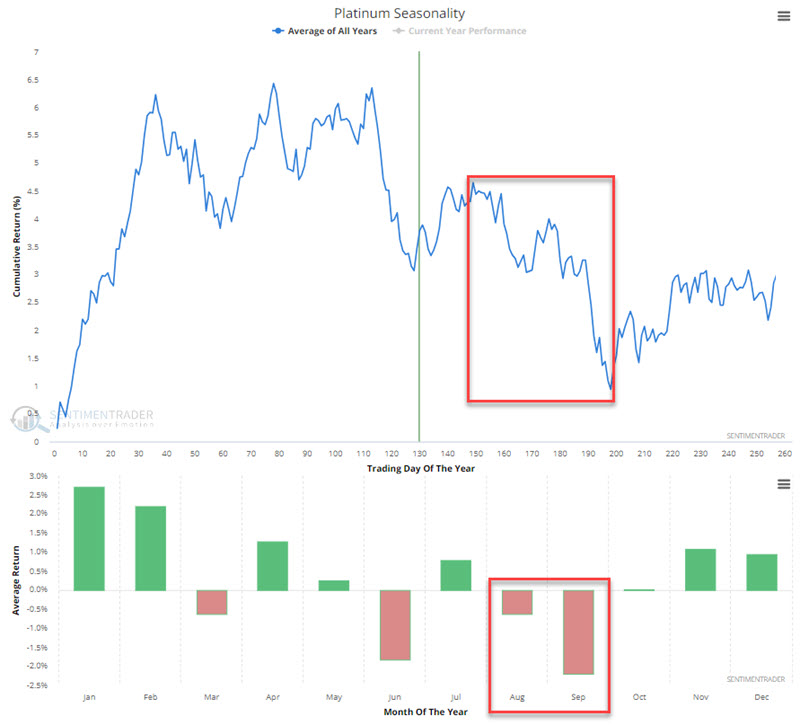
This combination of overly bullish sentiment, impending unfavorable seasonals, and recently weakening price action suggests that traders look for opportunities to play the short side of the Platinum market in the months ahead.
About TradingEdge Weekly...
The goal of TradingEdge Weekly is to summarize some of the research published to SentimenTrader over the past week. Sometimes there is a lot to digest, and this summary highlights the highest conviction or most compelling ideas we discussed. This is NOT the published research; rather, it pulls out some of the most relevant parts. It includes links to the published research for convenience, and if you don't subscribe to those products, it will present the options for access.
Indicators at Extremes
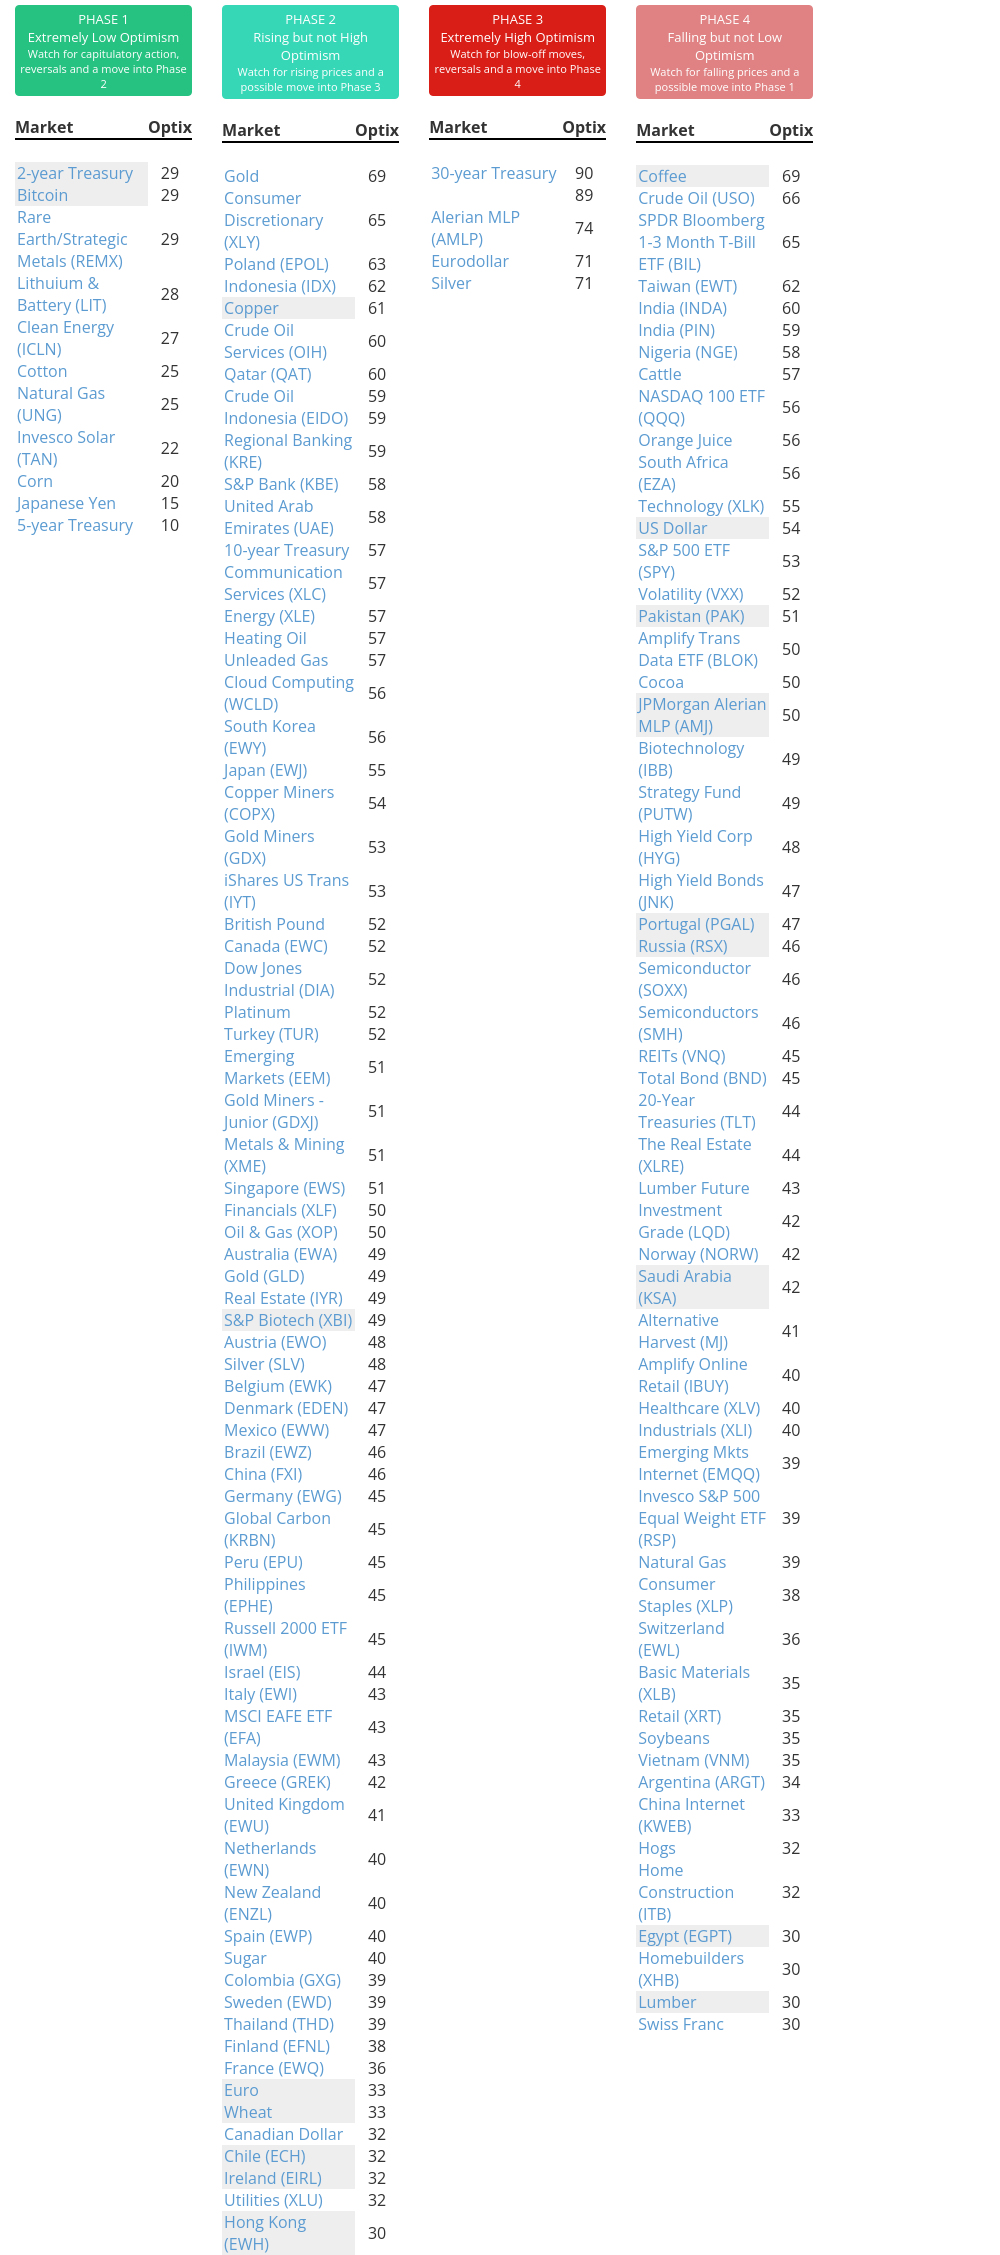
Phase Table
Ranks
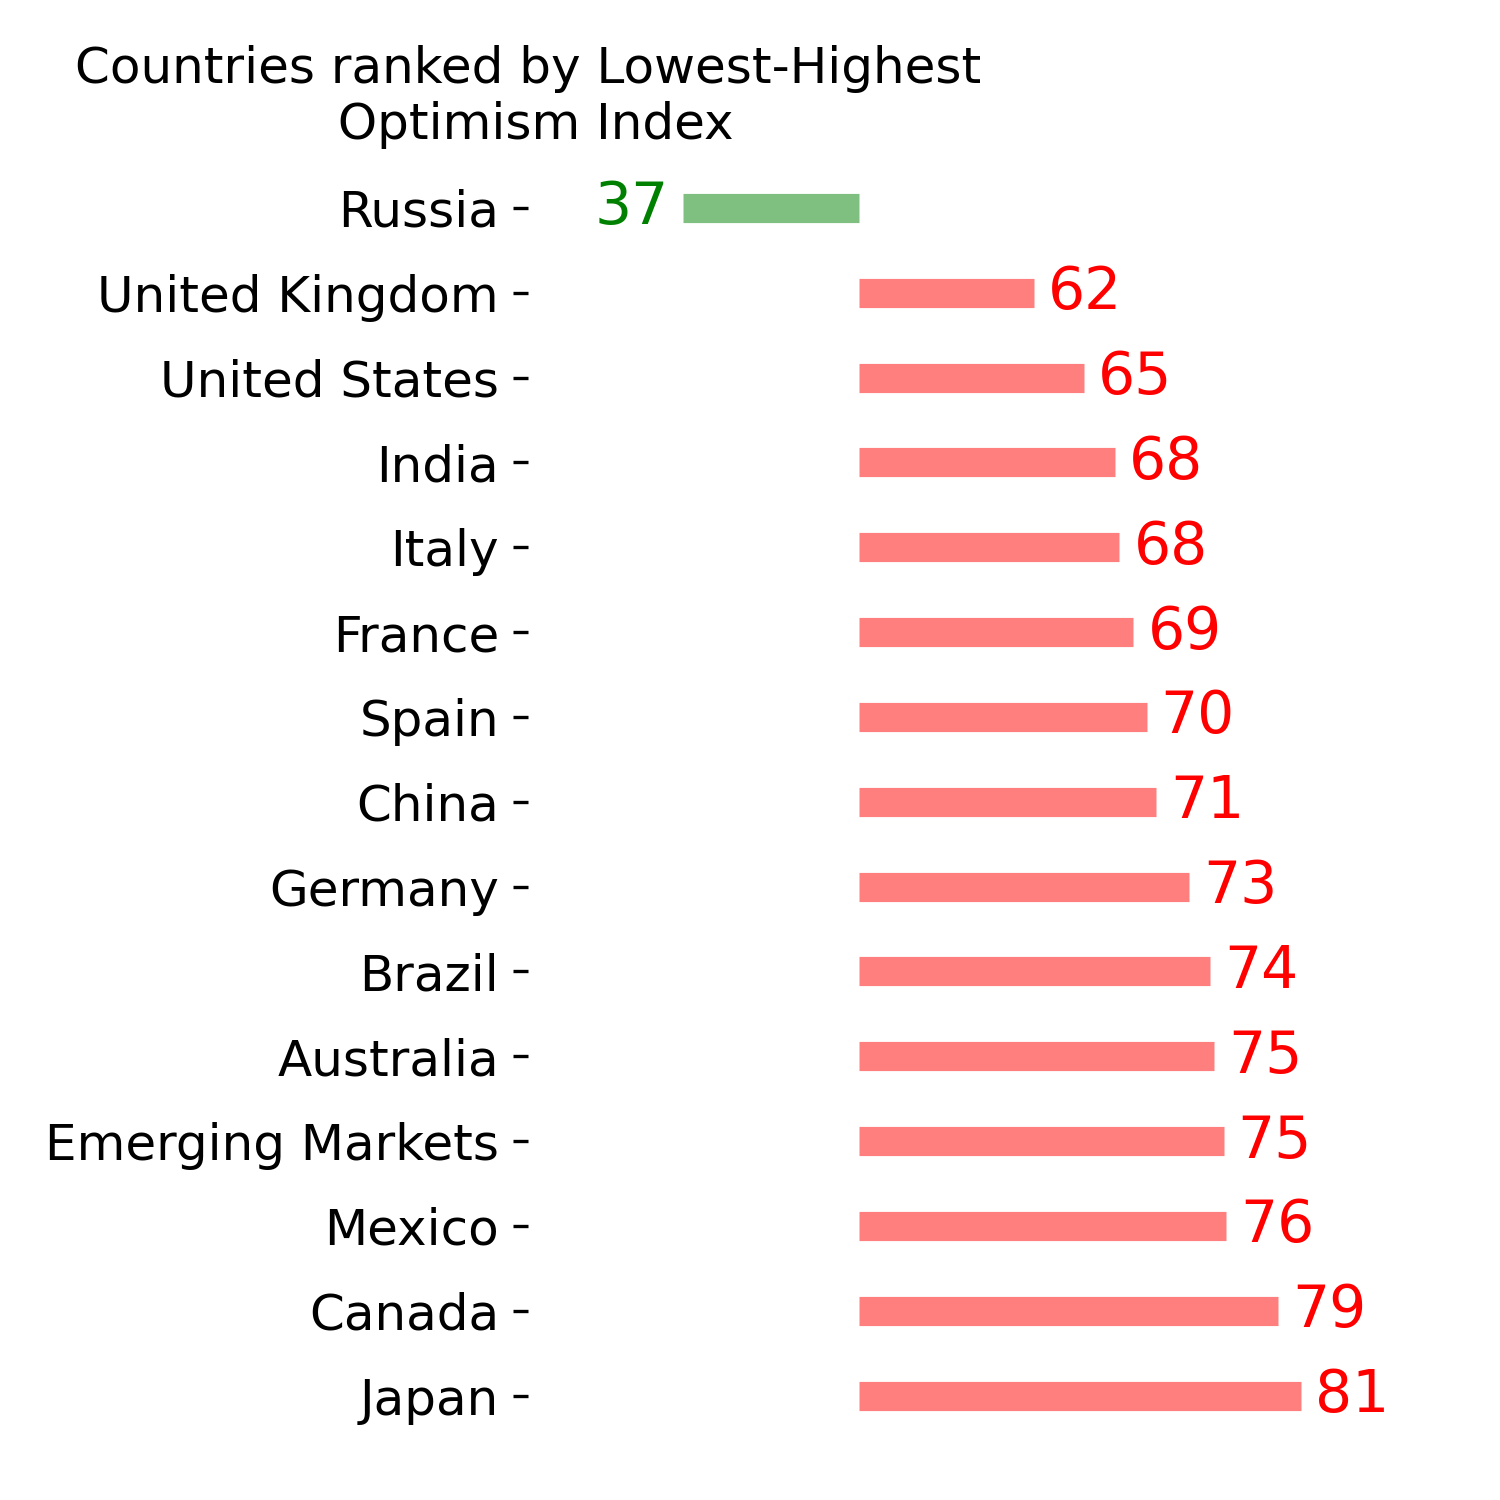
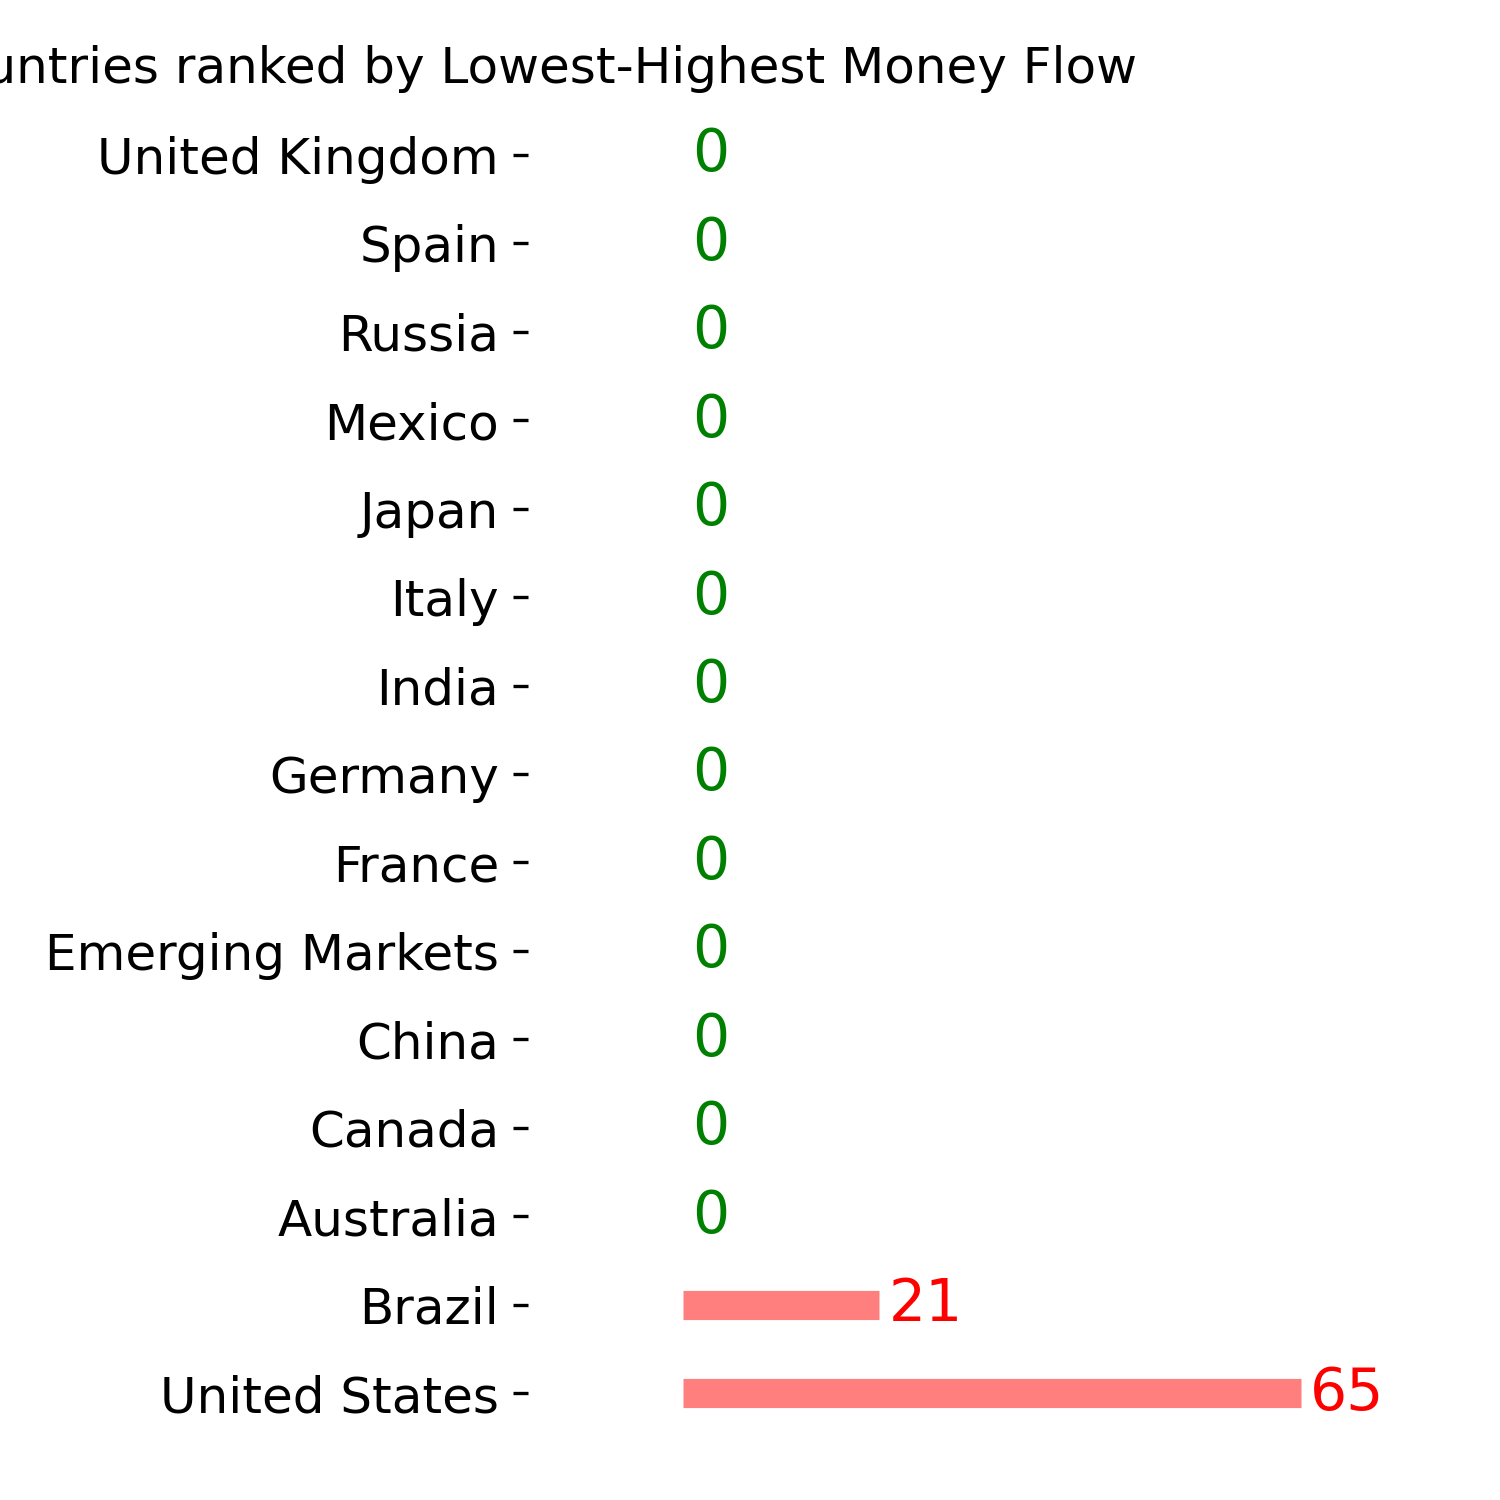
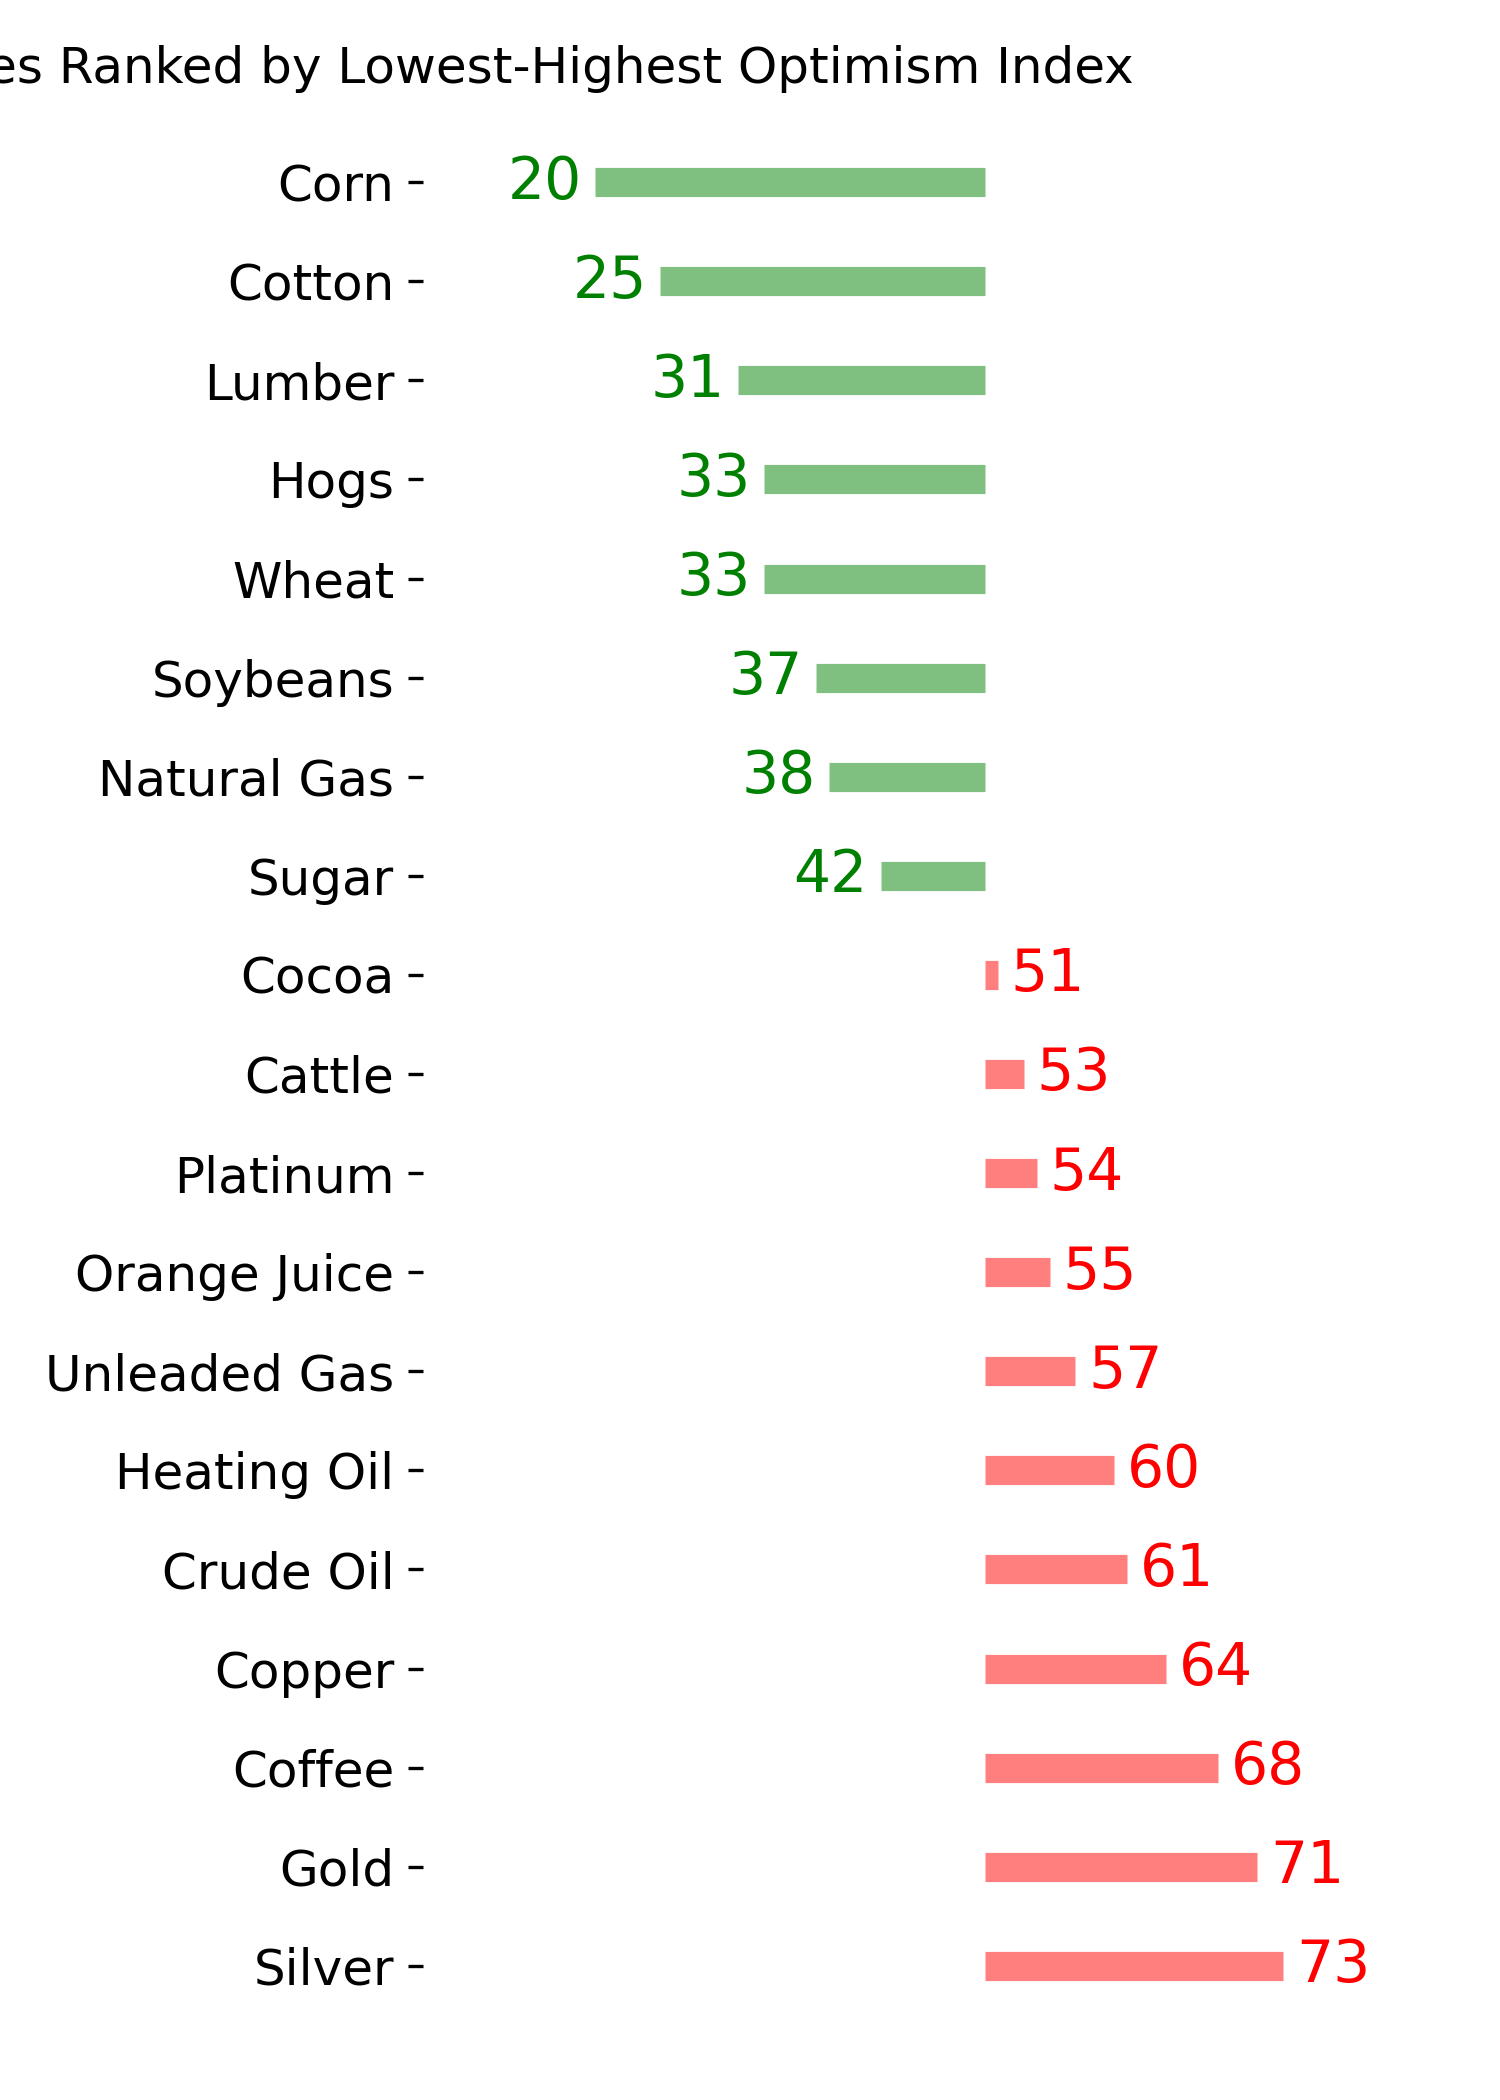
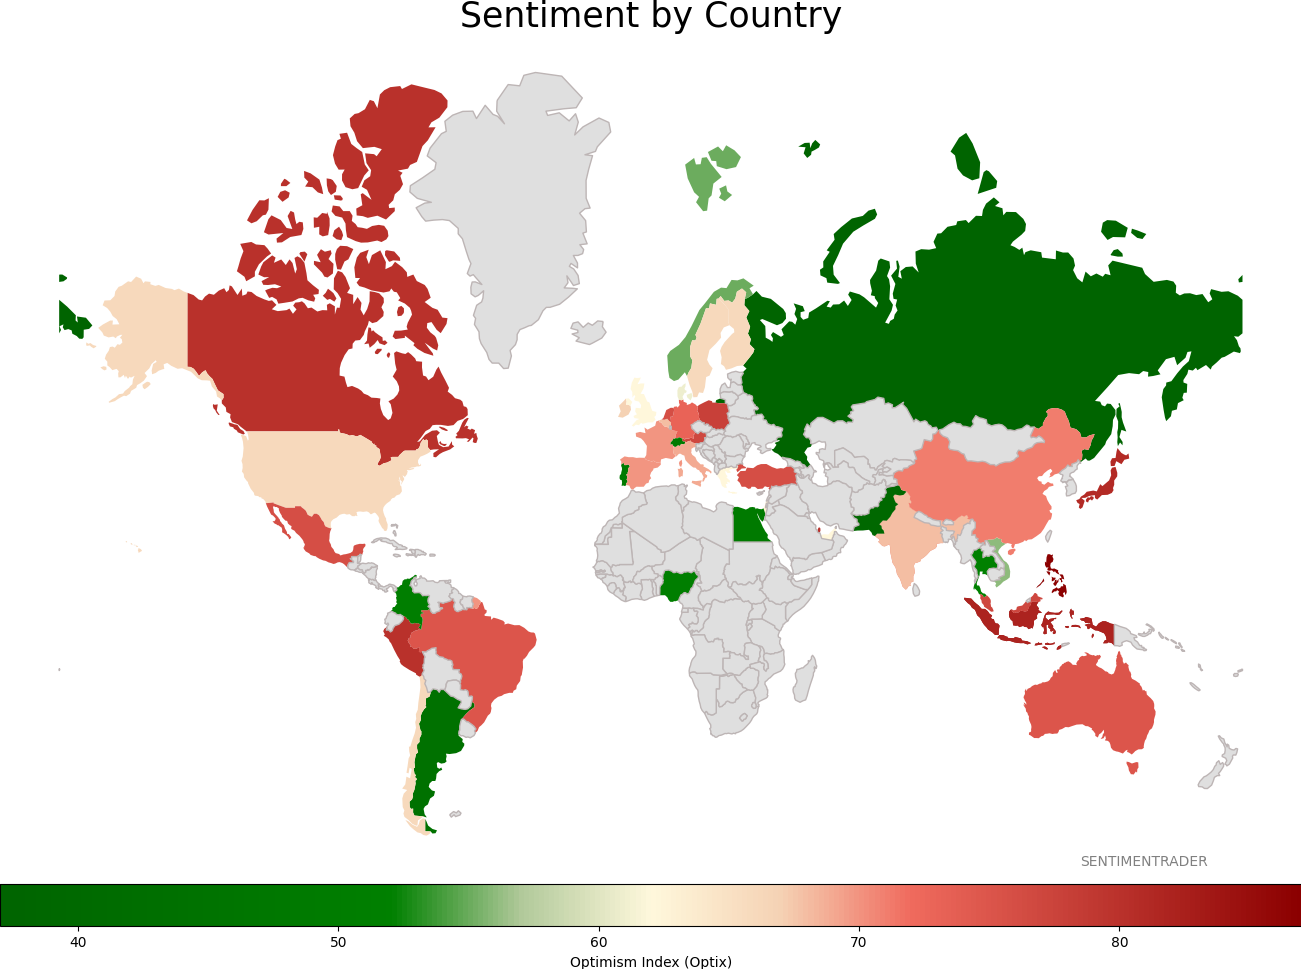
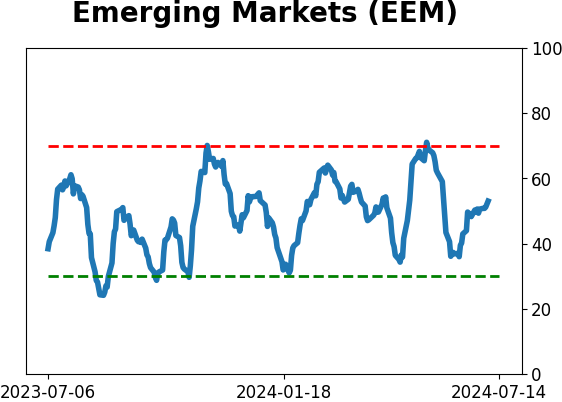
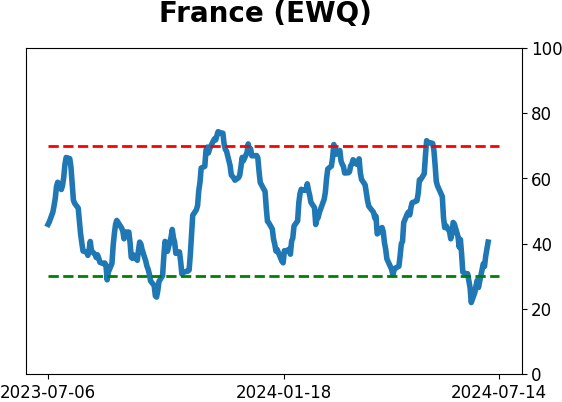
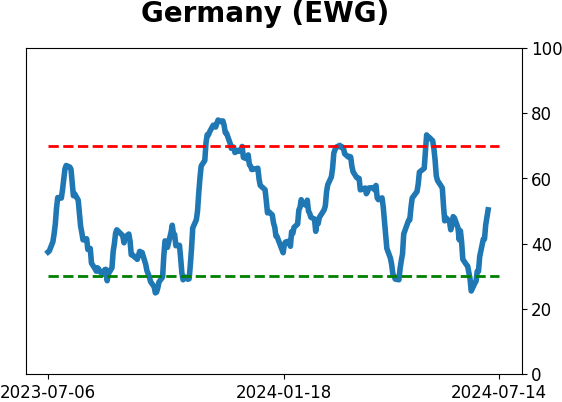
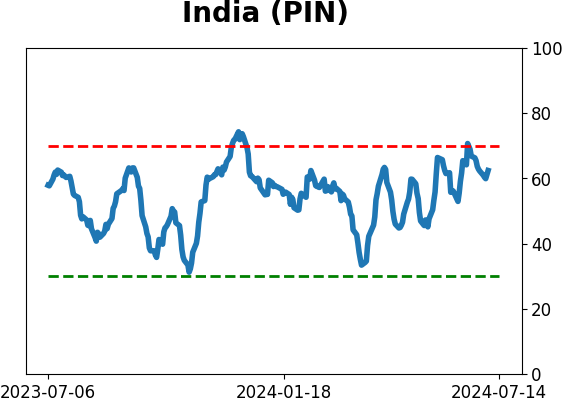
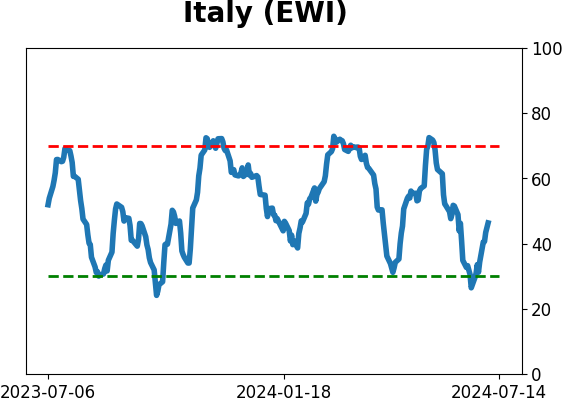
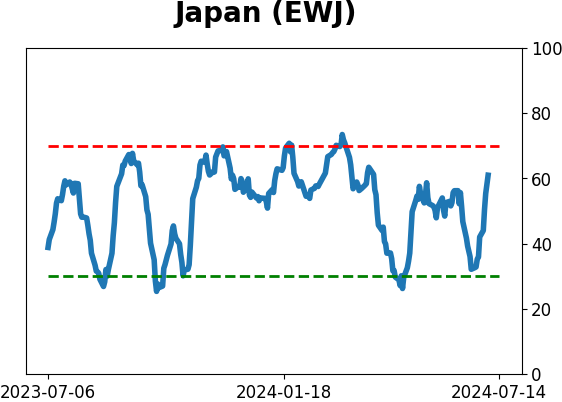
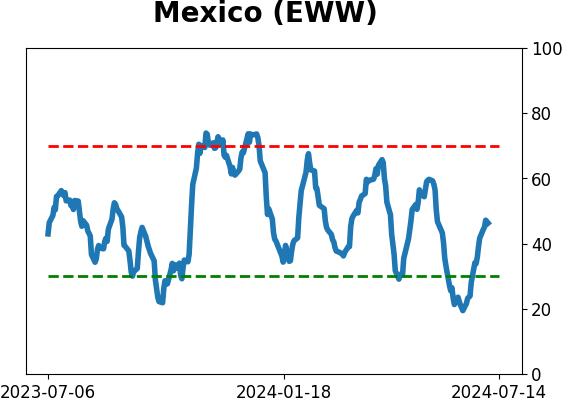
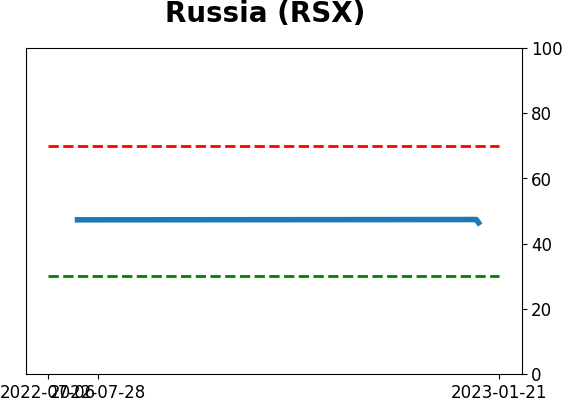
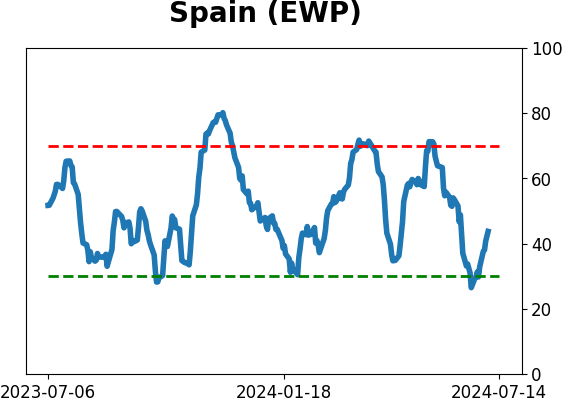
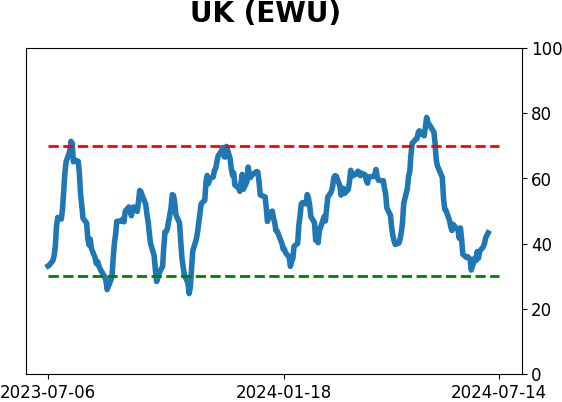
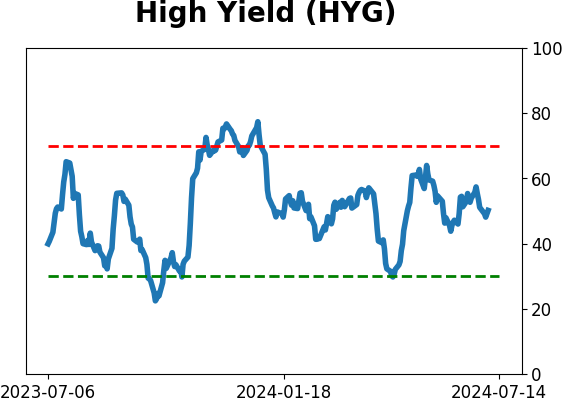
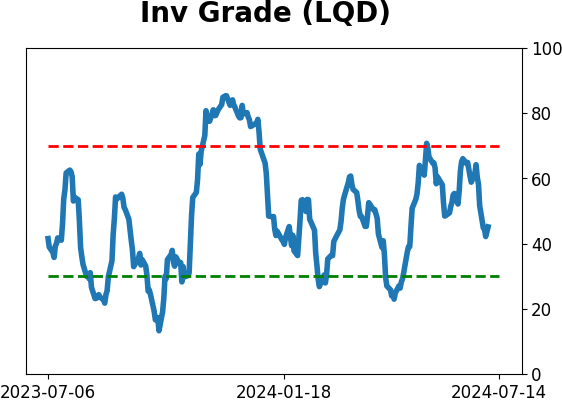
Sentiment Around The World
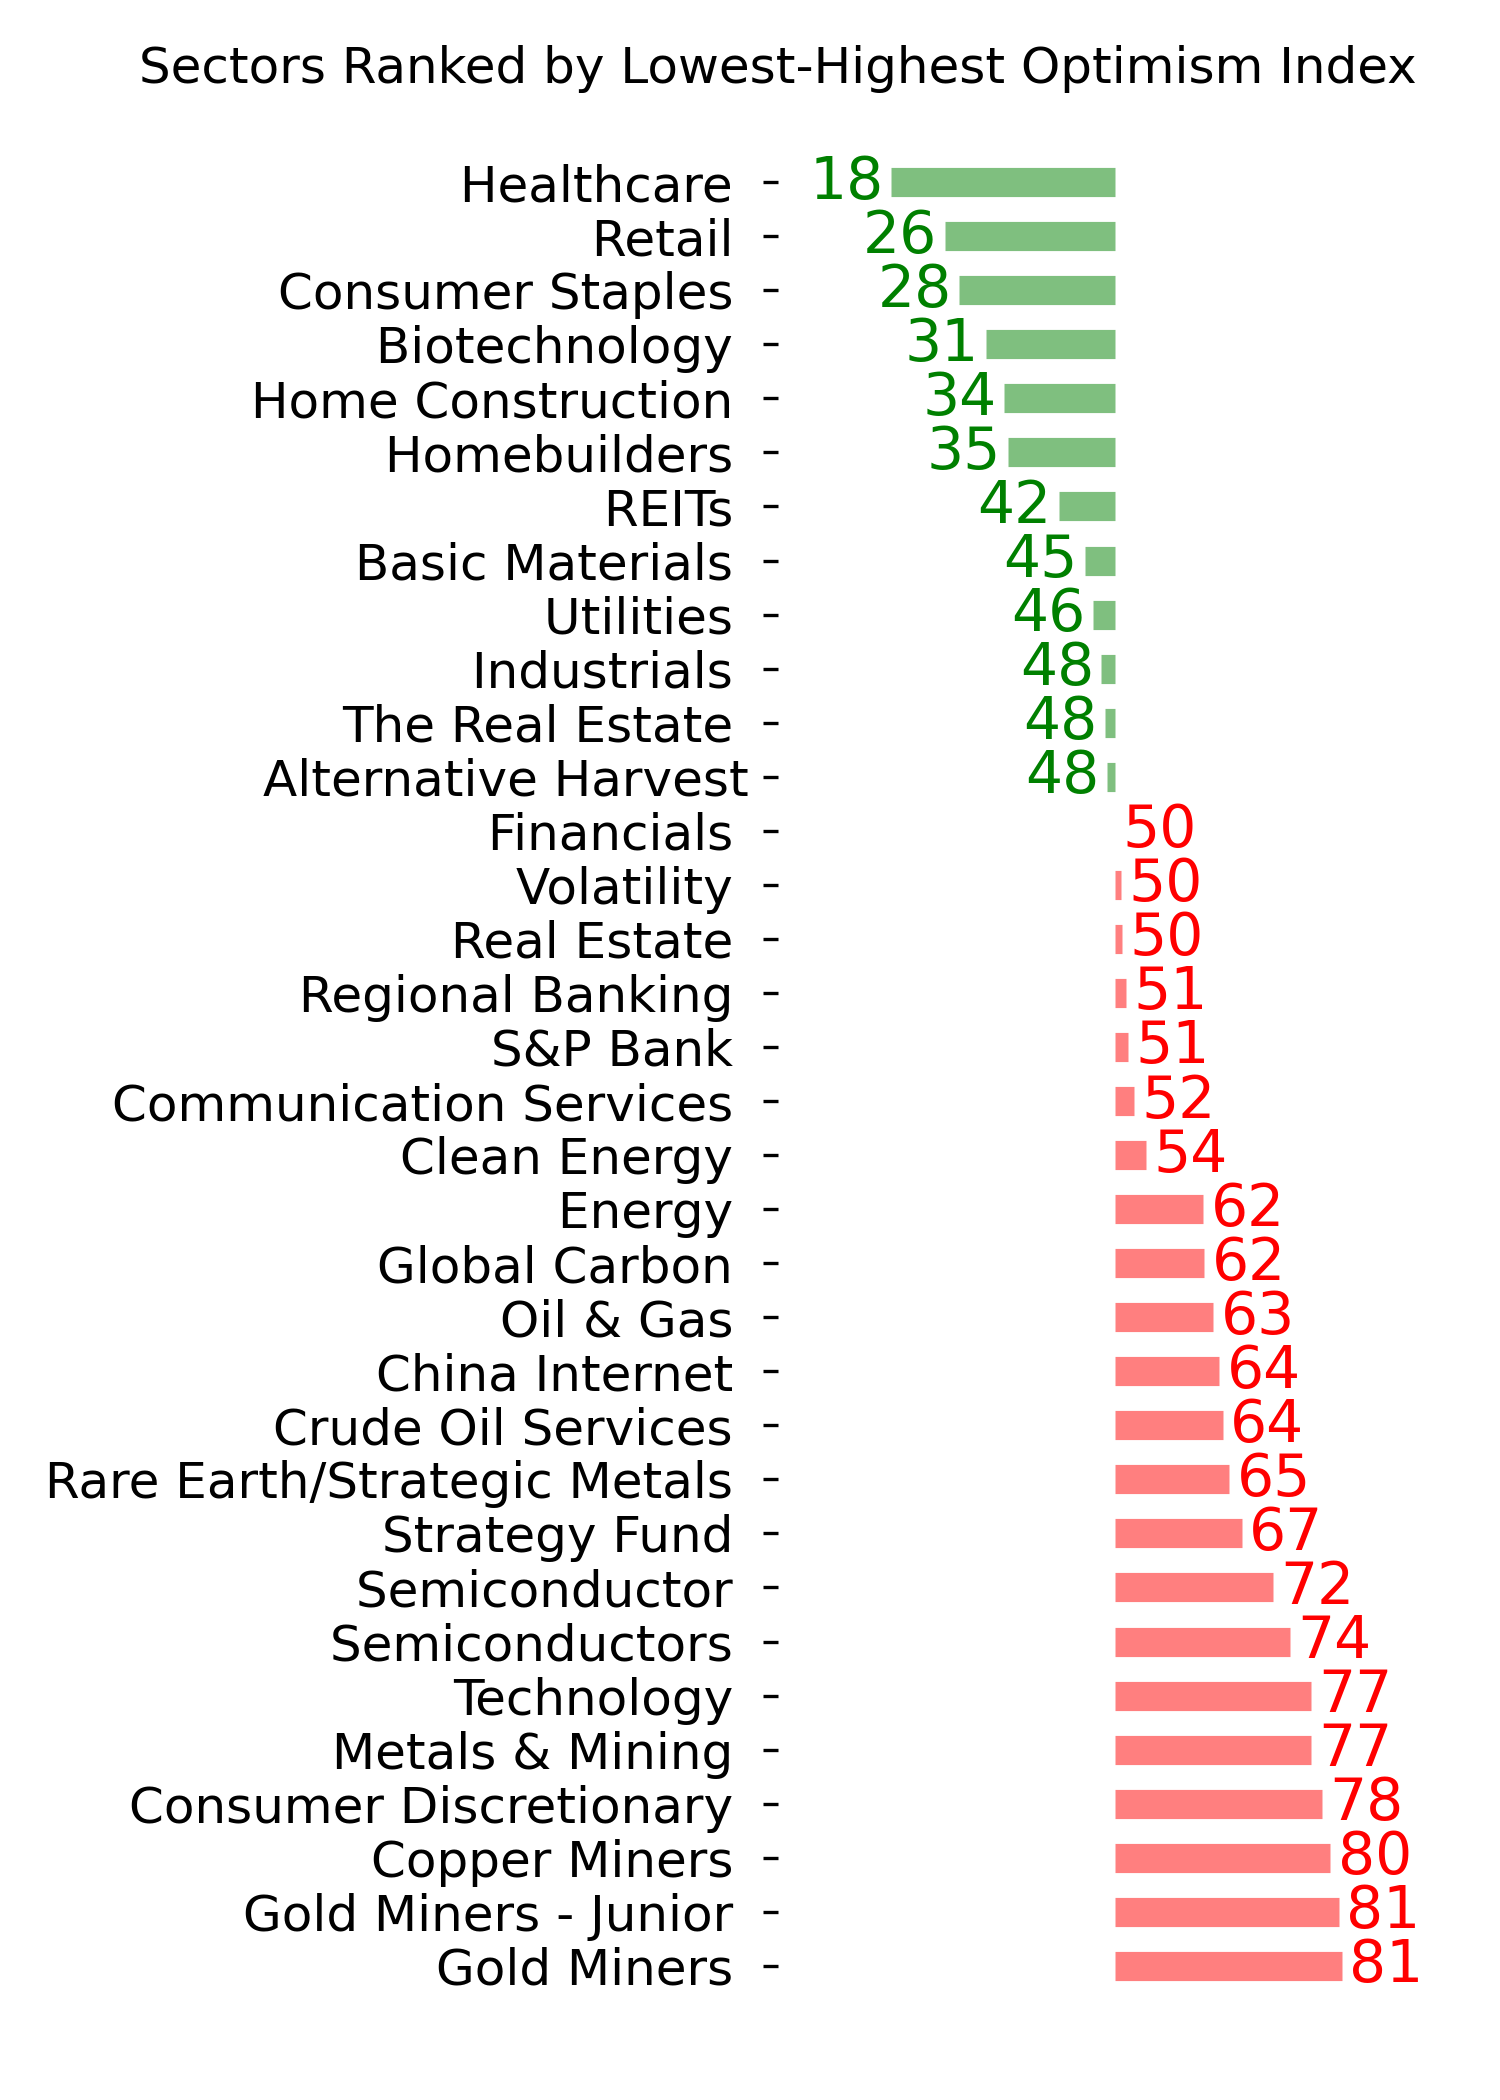
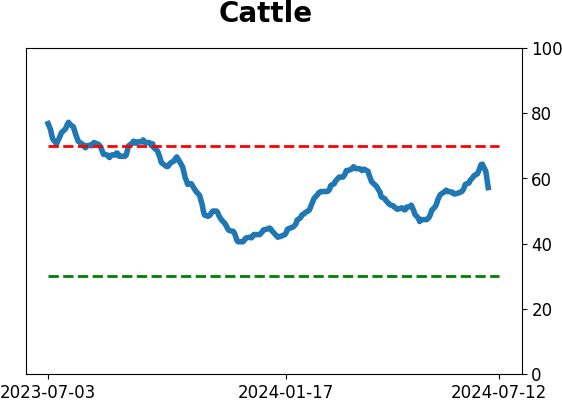
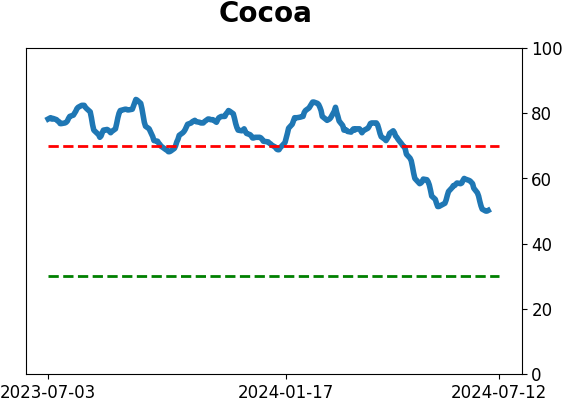
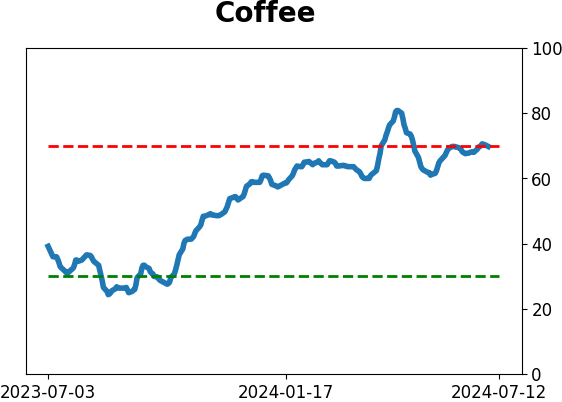
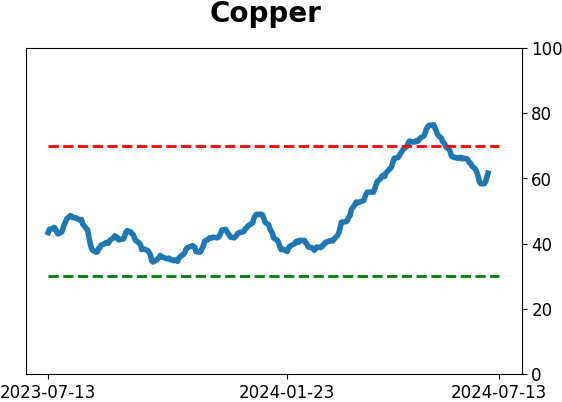
Optimism Index Thumbnails
|
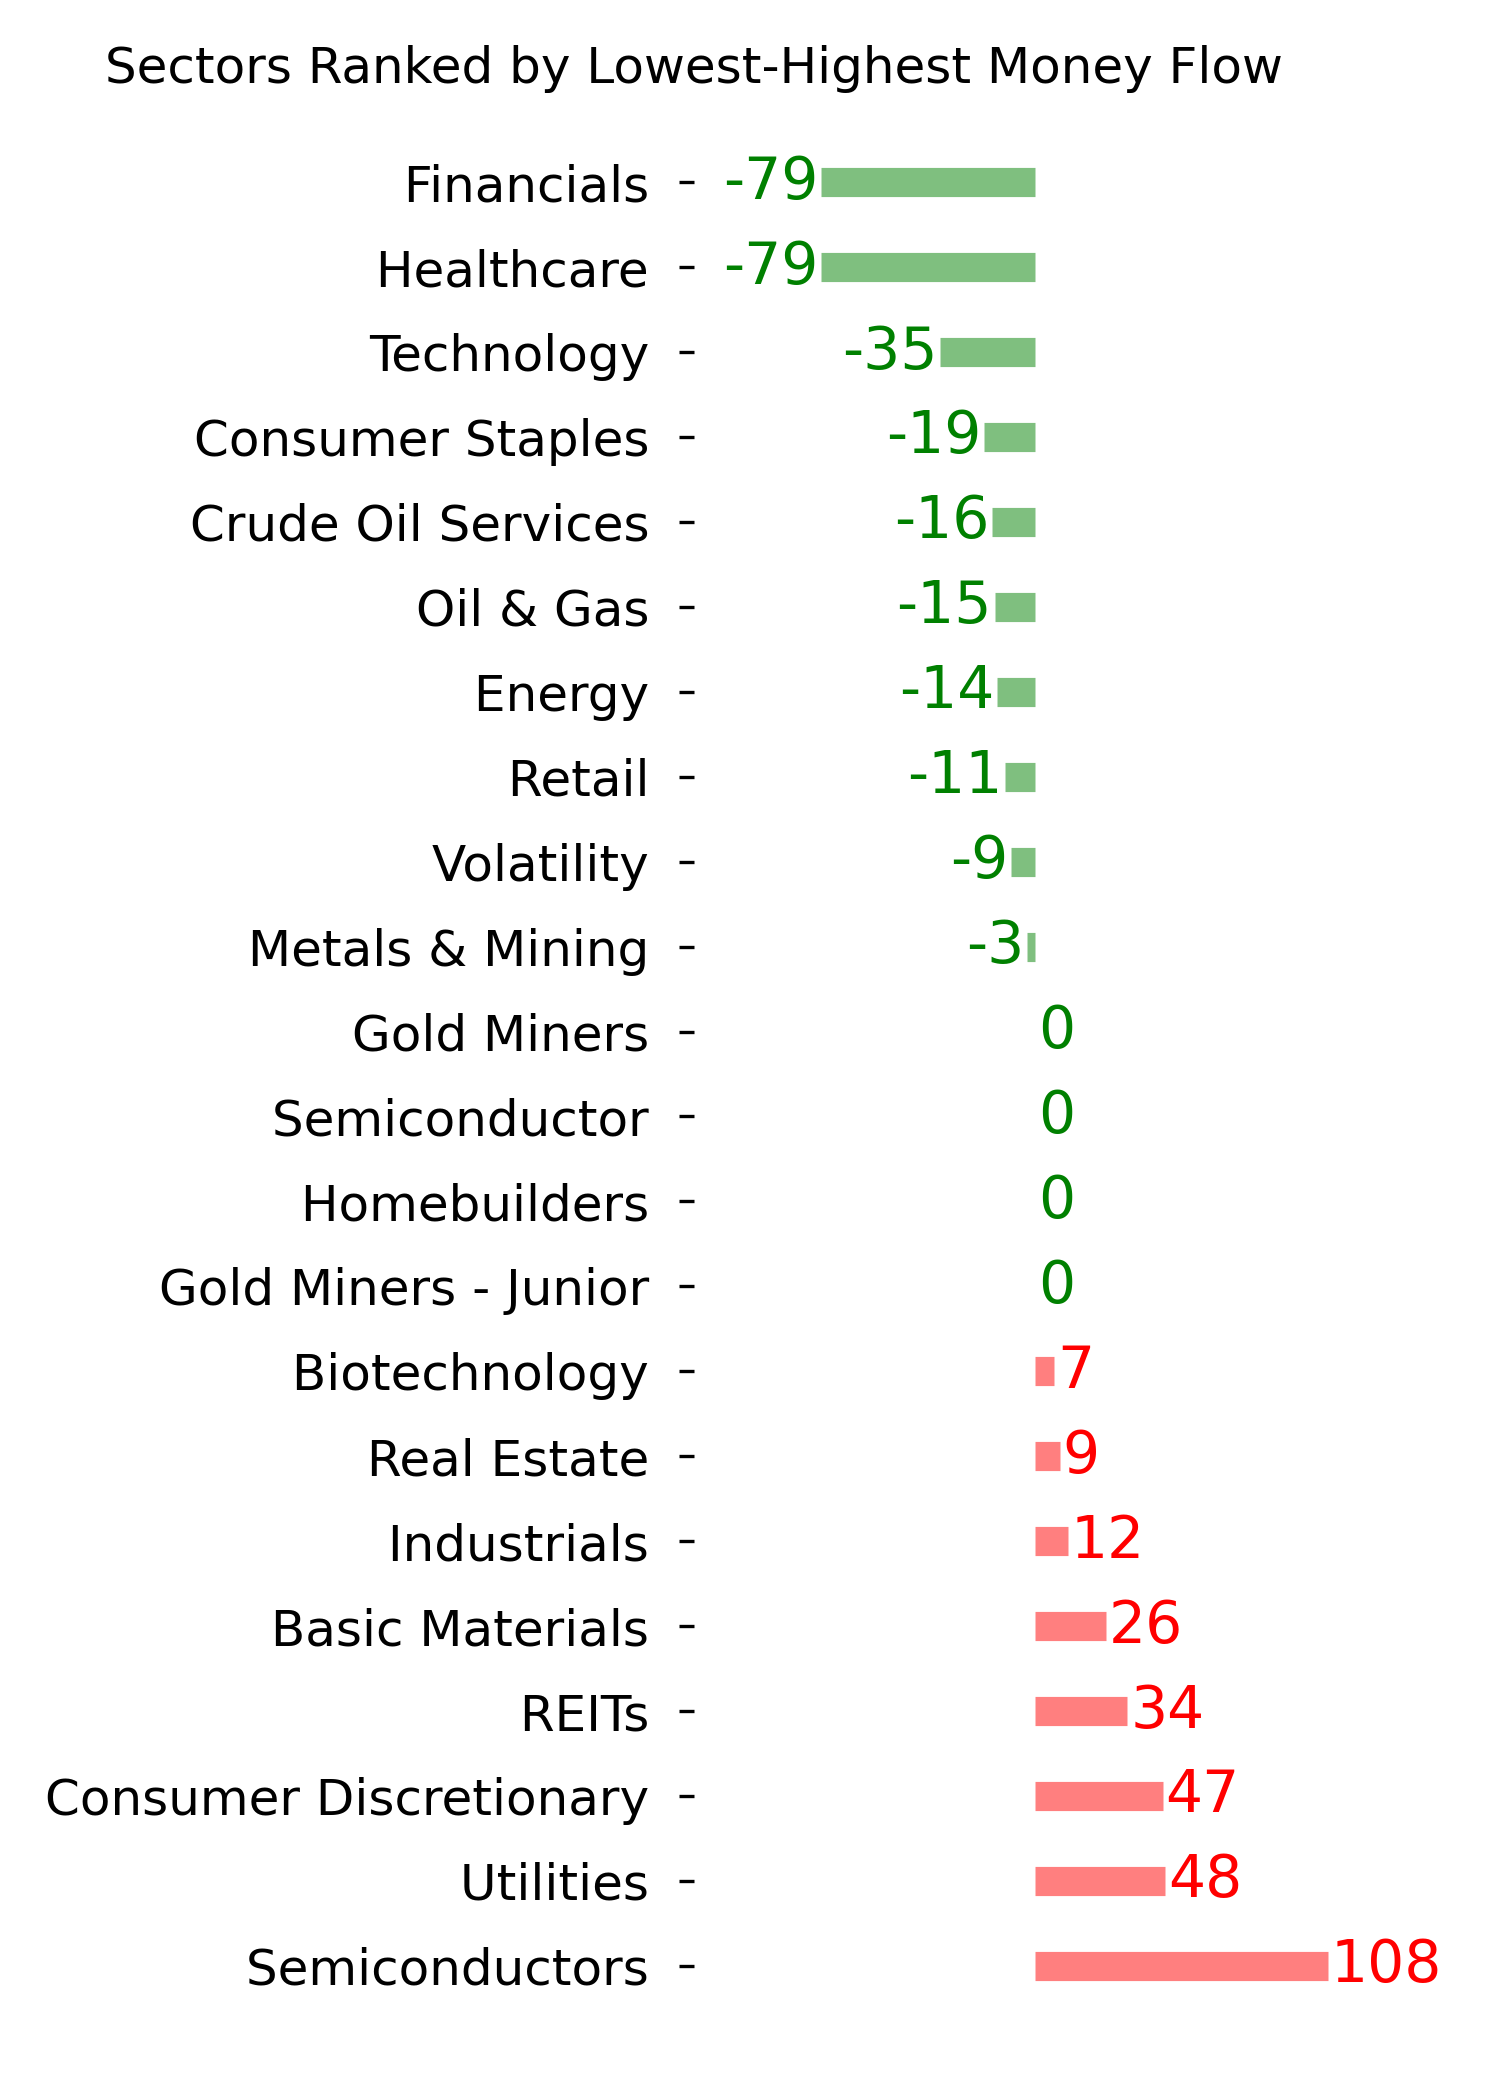
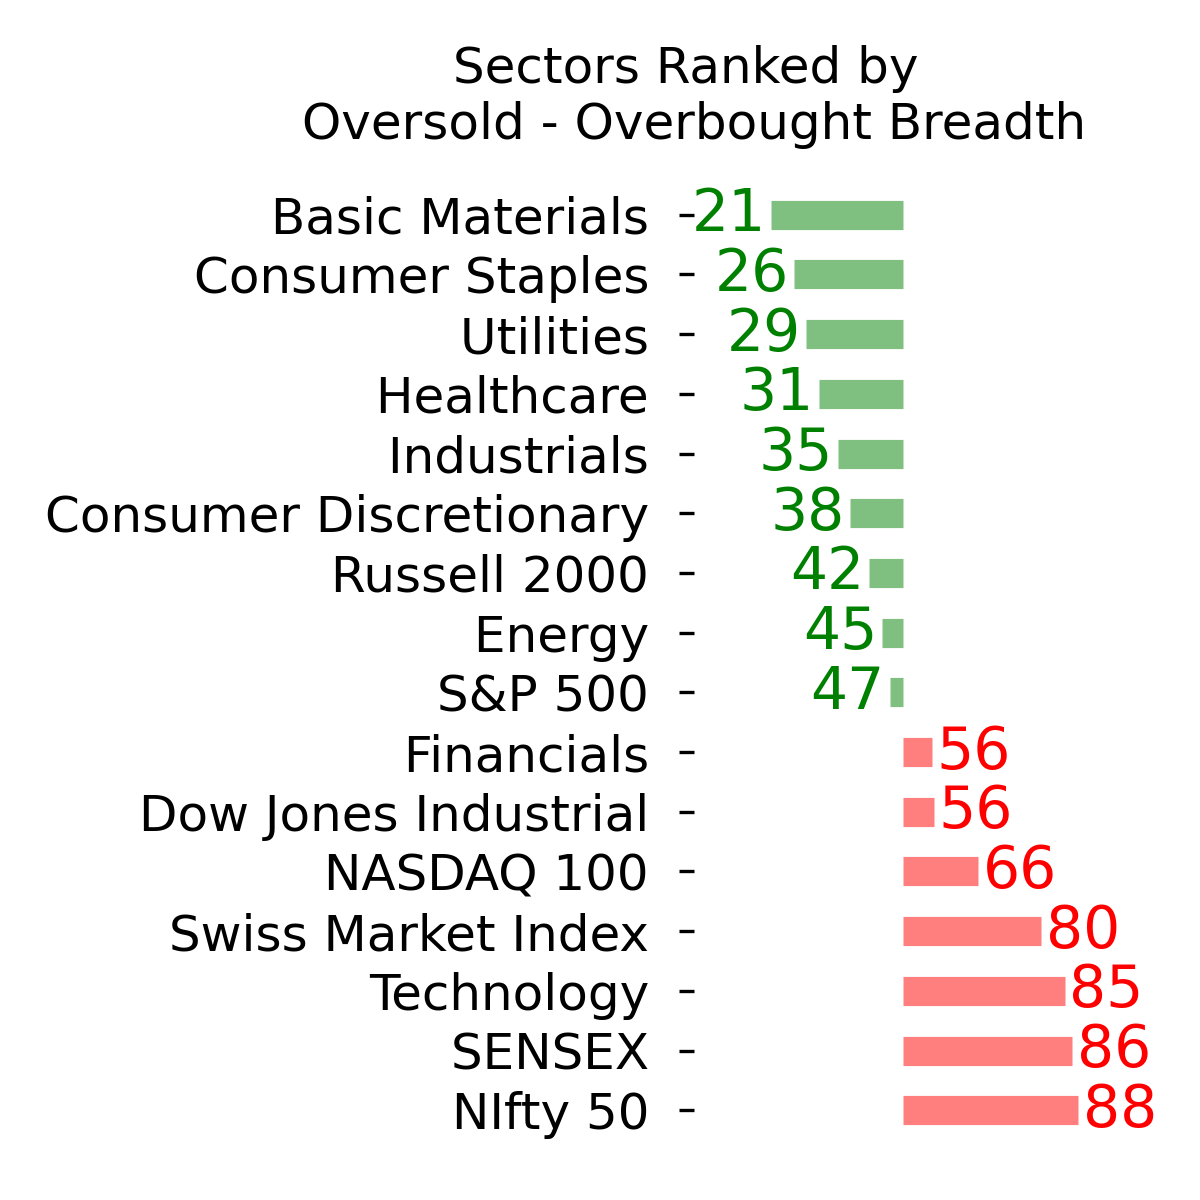
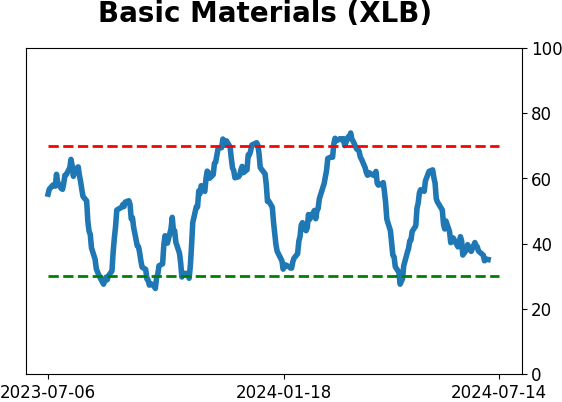
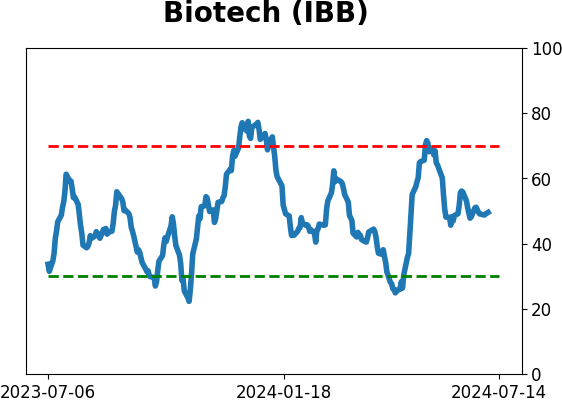
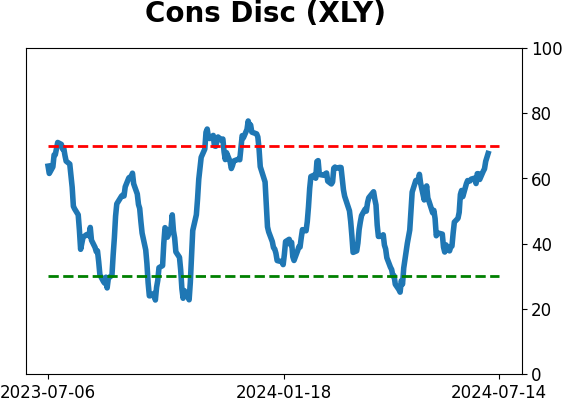
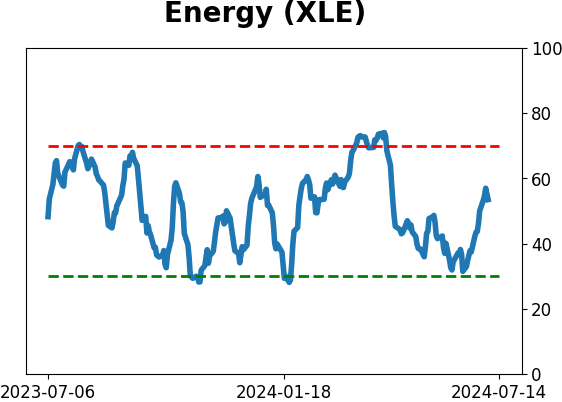
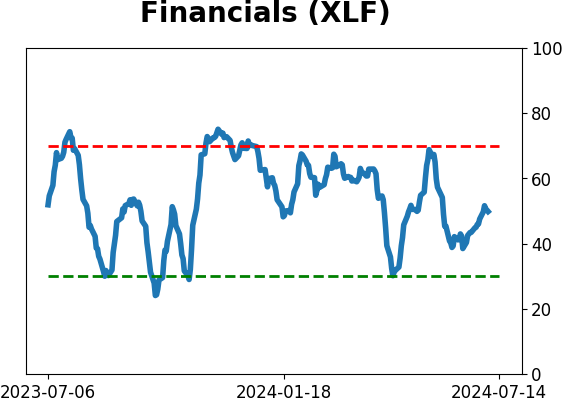
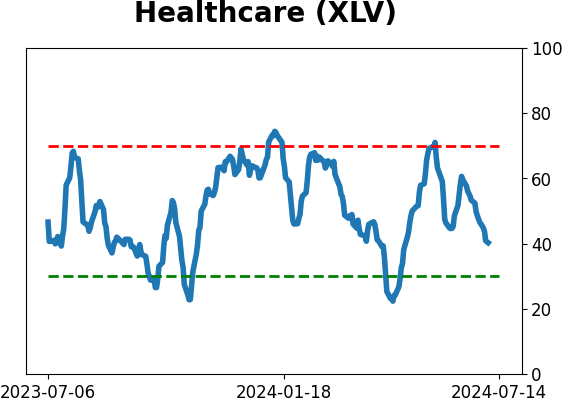
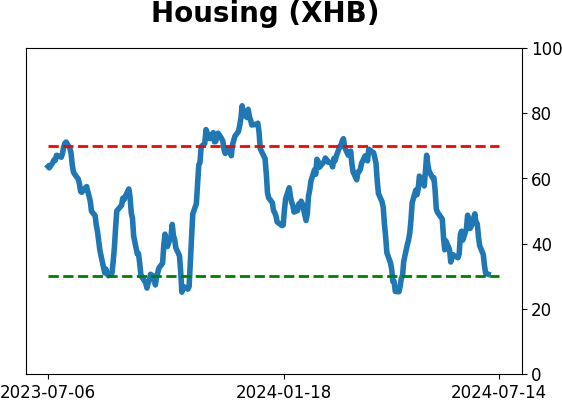
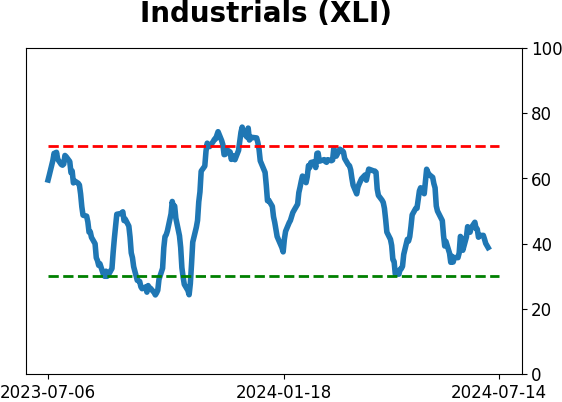
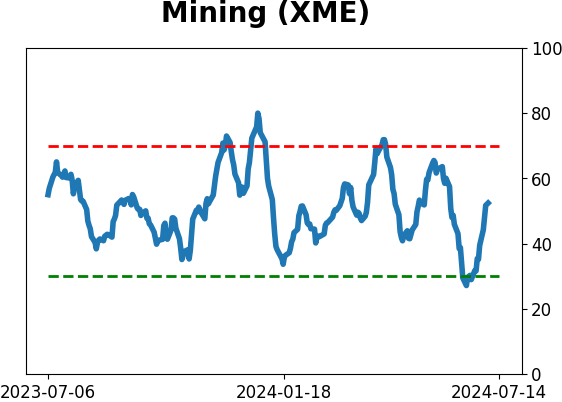
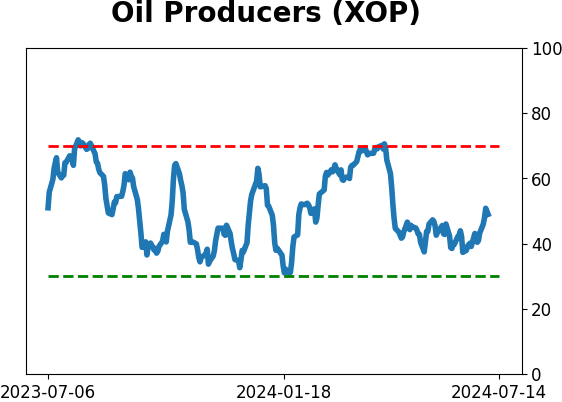
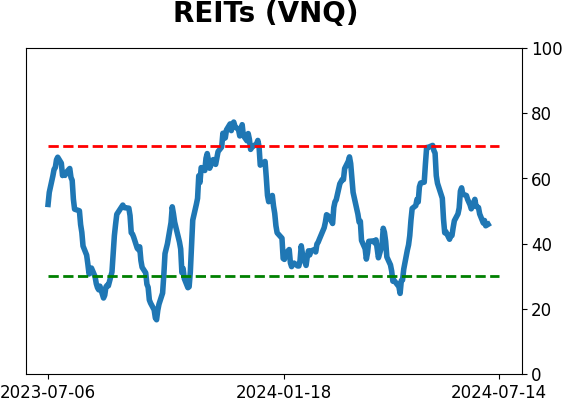
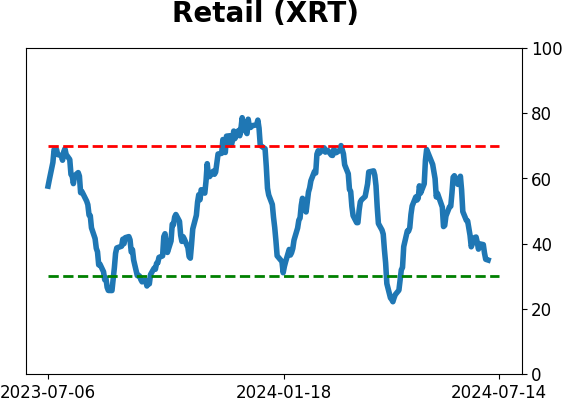
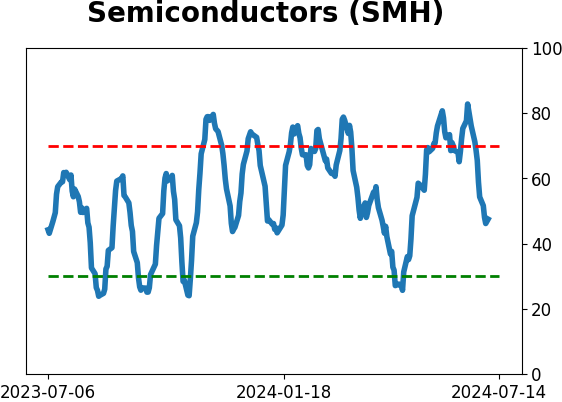
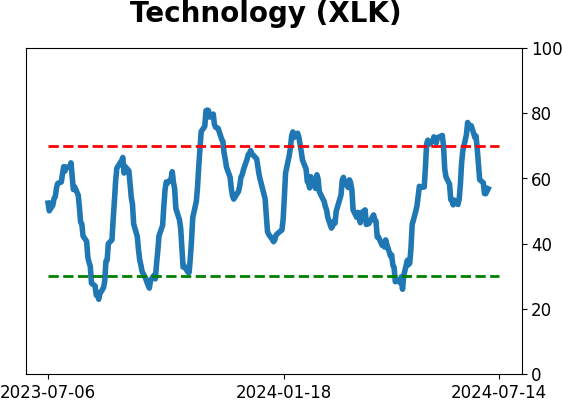
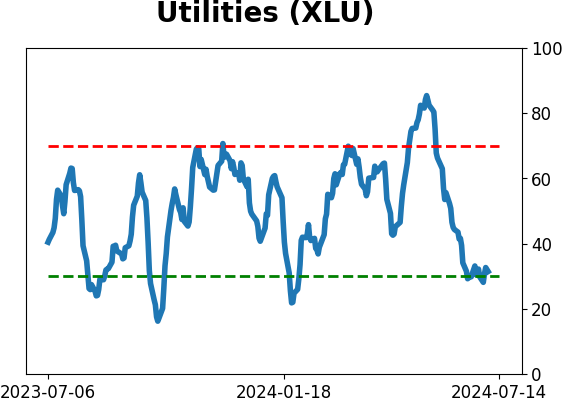
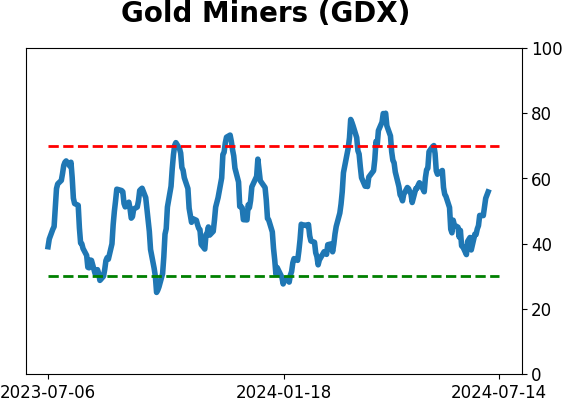
Sector ETF's - 10-Day Moving Average
|
|
|
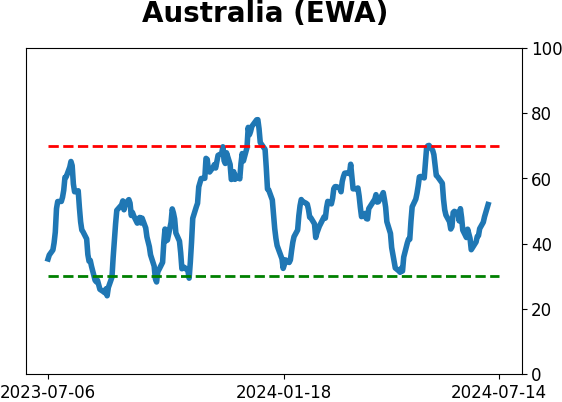
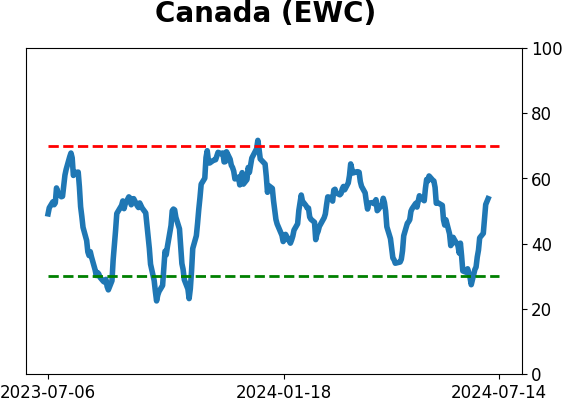
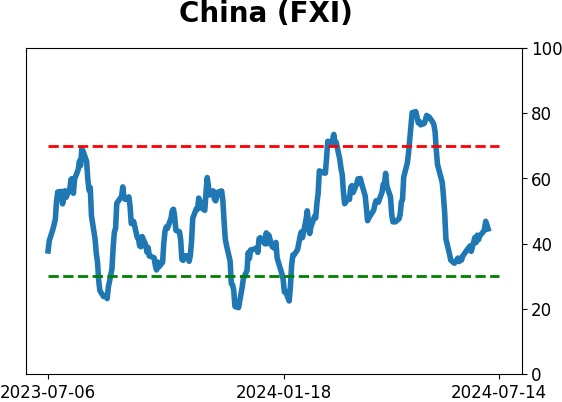
Country ETF's - 10-Day Moving Average
|
|
|
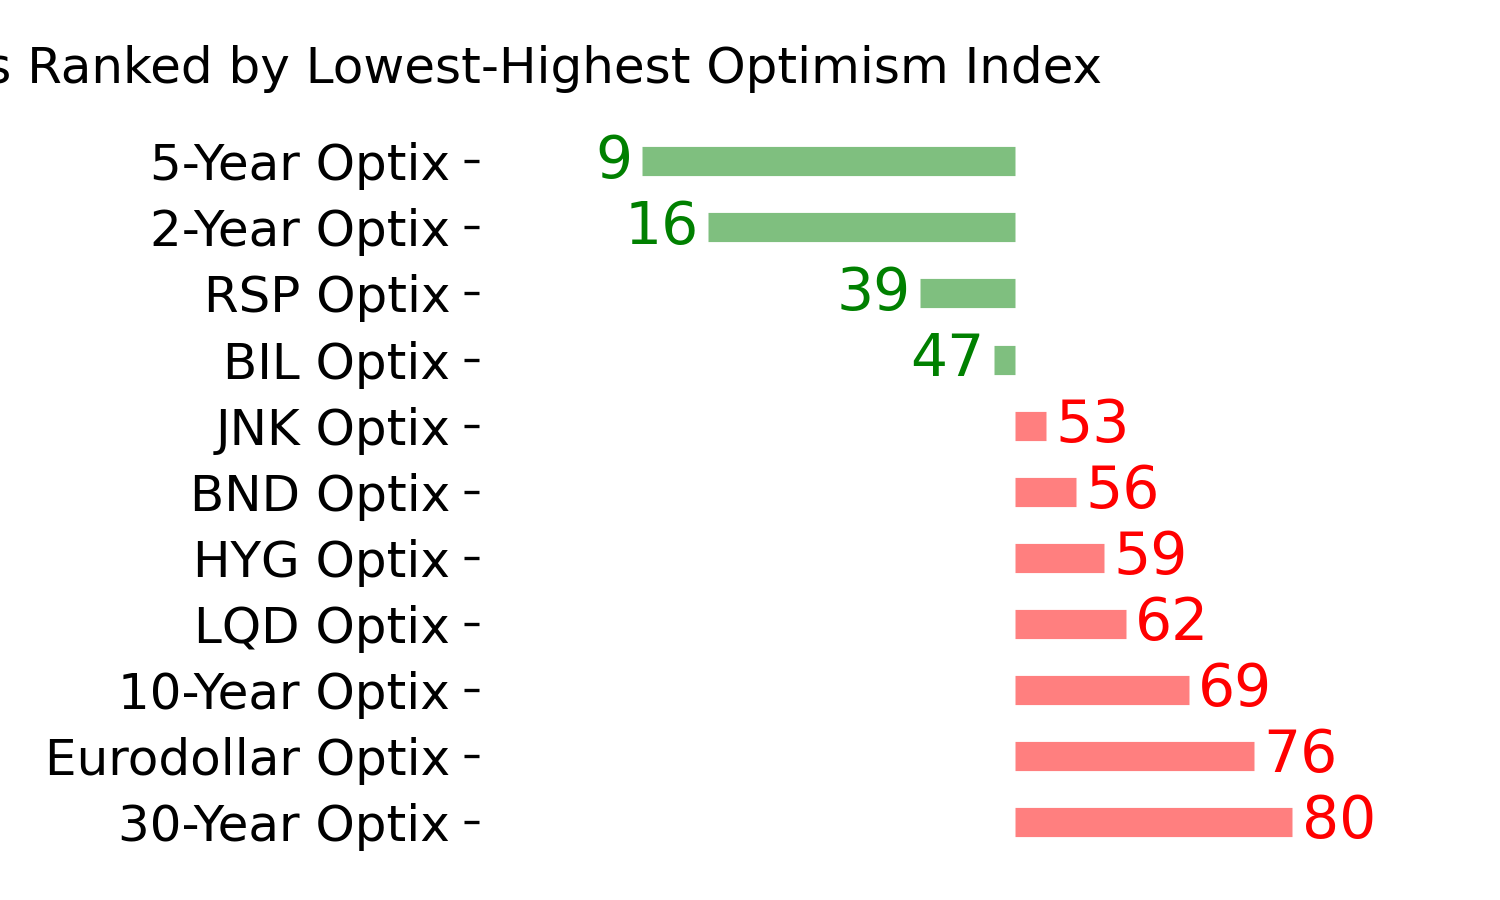
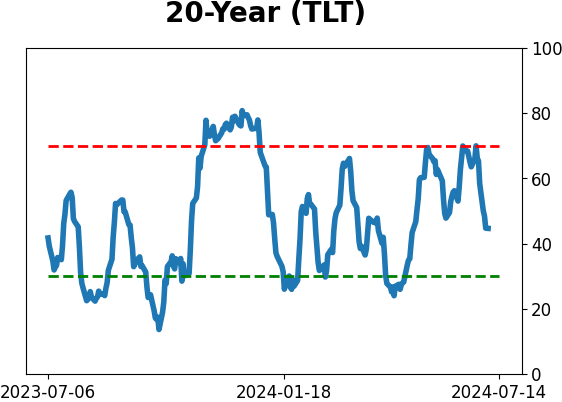
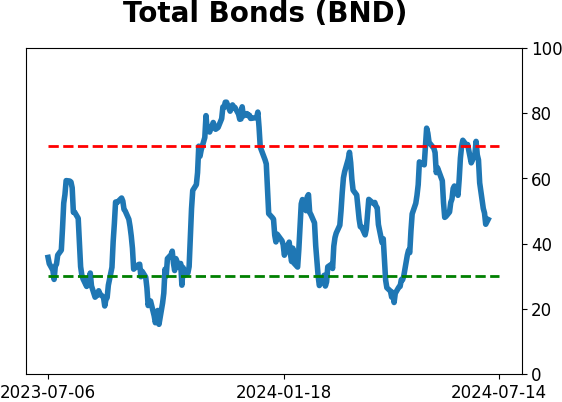
Bond ETF's - 10-Day Moving Average
|
|
|
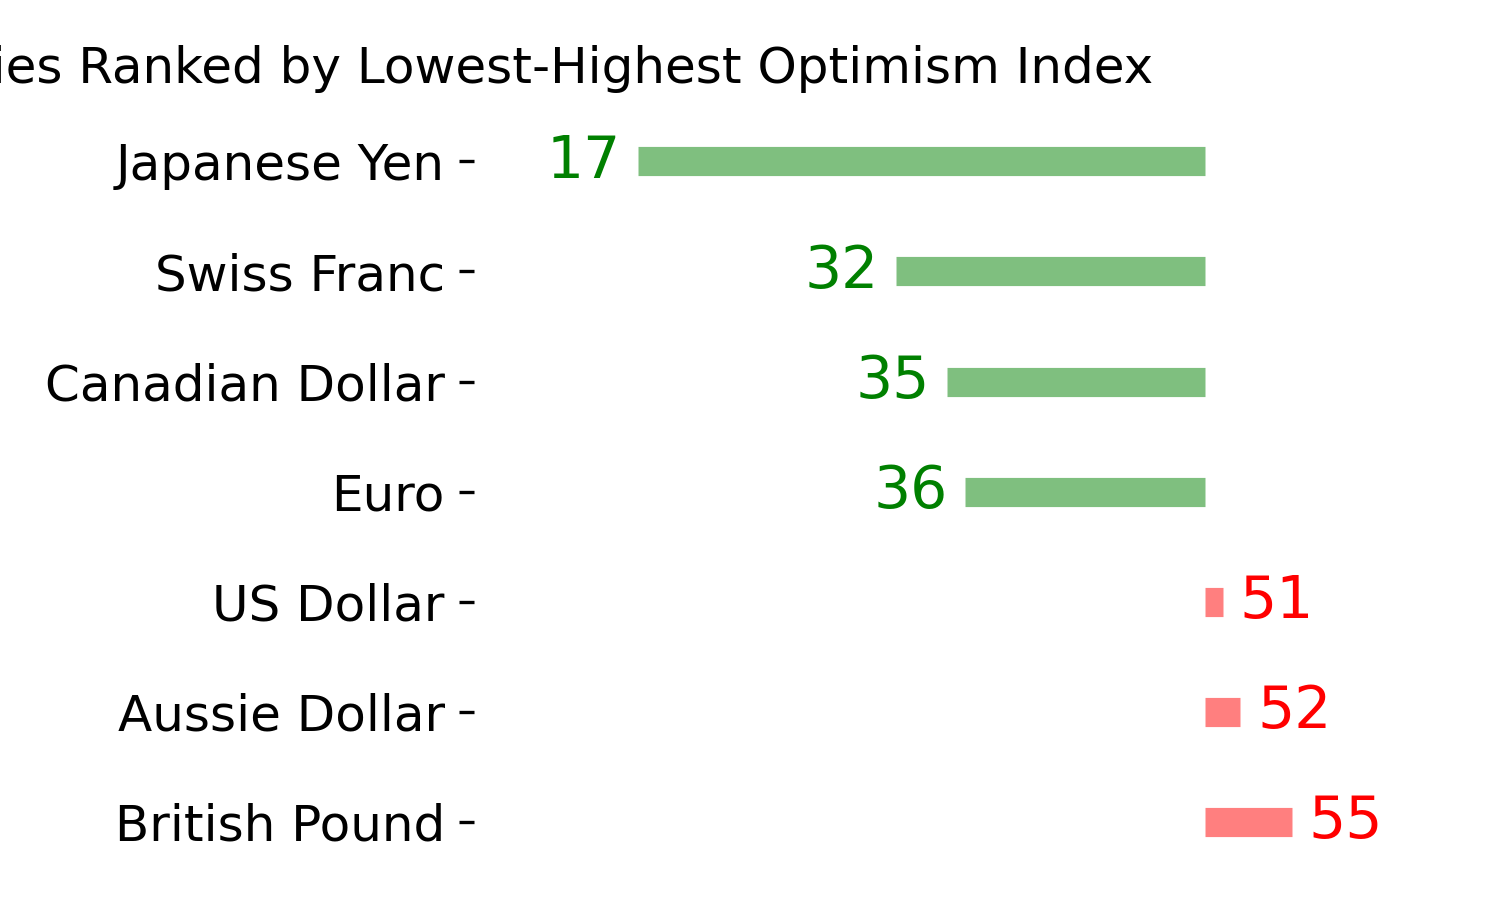
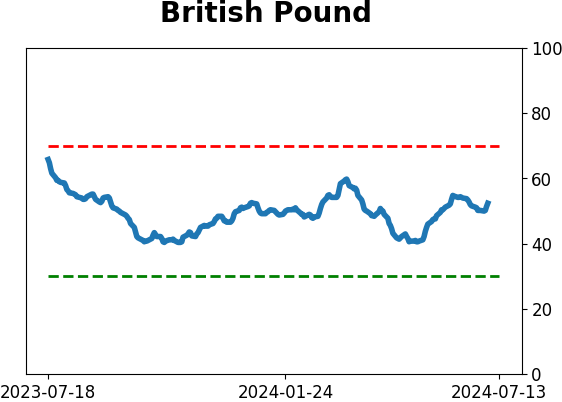
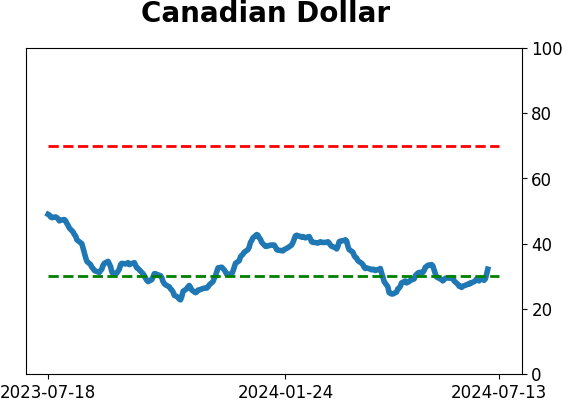
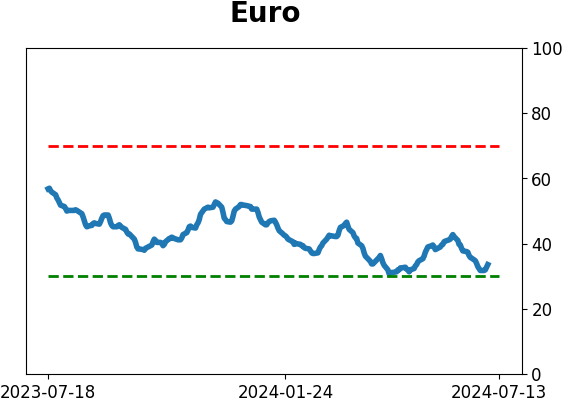
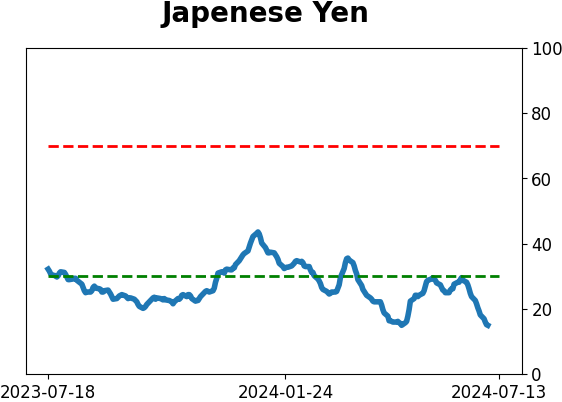
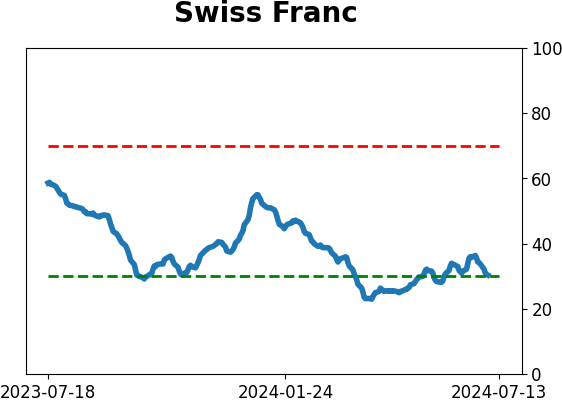
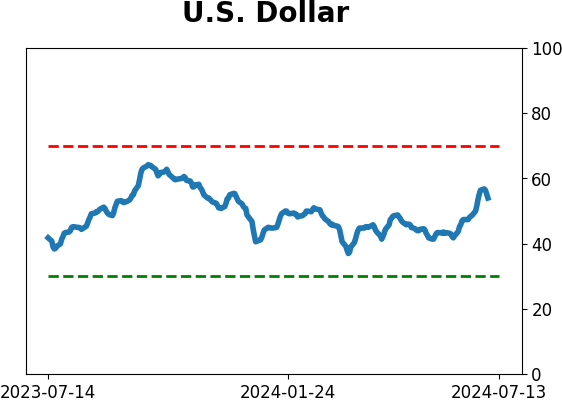
Currency ETF's - 5-Day Moving Average
|
|
|
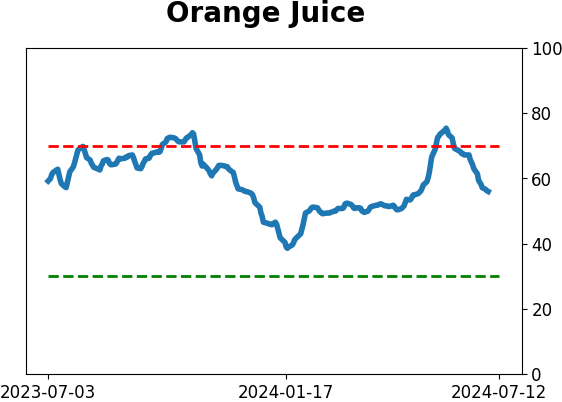
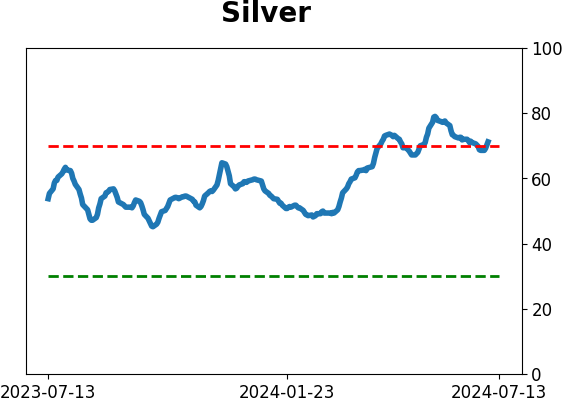
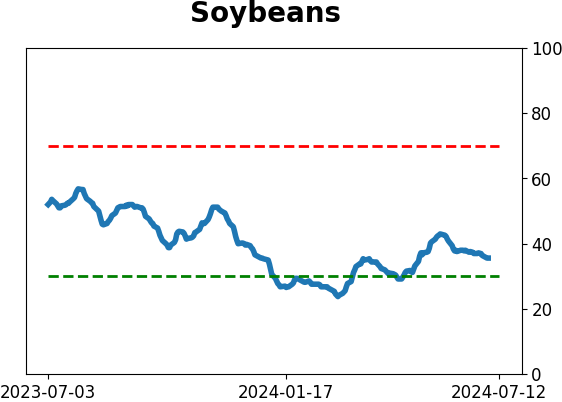
Commodity ETF's - 5-Day Moving Average
|
|