Headlines
|
|
Investor behavior keeps pushing volatility lower:
A recent media article suggested that stock market volatility is being suppressed by numerous factors, including decreased correlation among stocks and selling of call options. Even if true, the assertions haven't had much success in suggesting that volatility will rebound imminently or that stocks will decline.
|
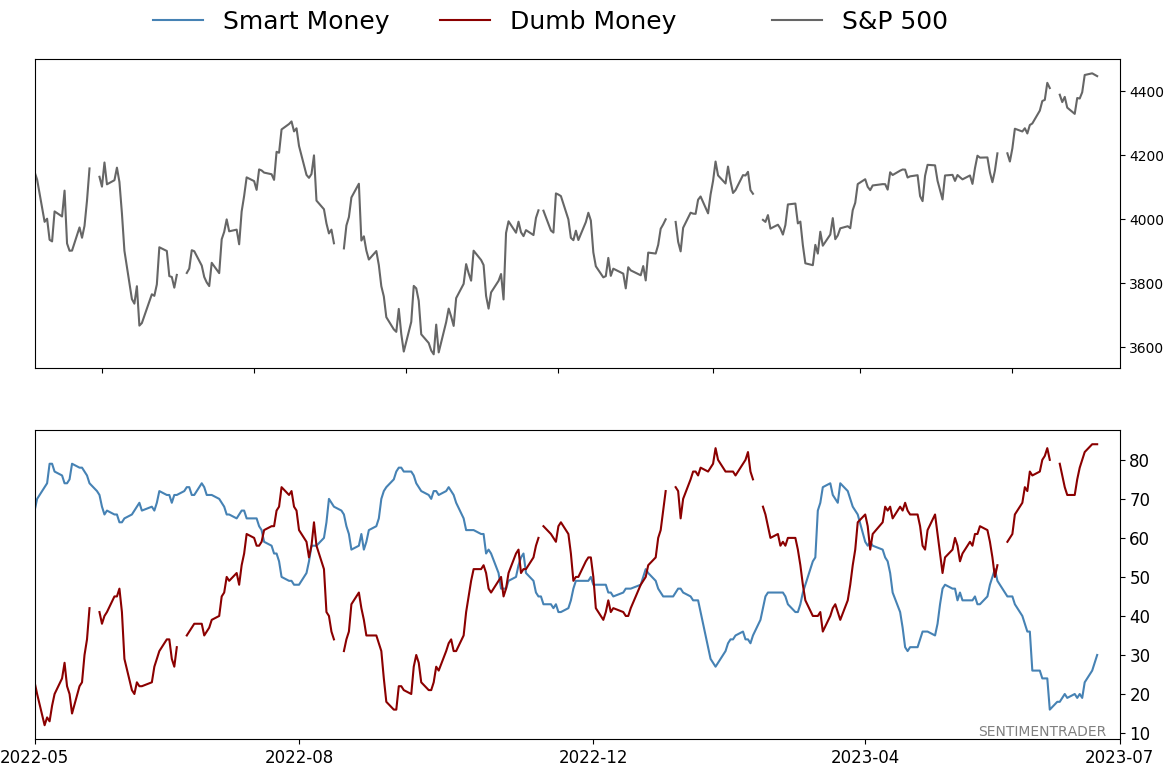
Smart / Dumb Money Confidence
|
Smart Money Confidence: 30%
Dumb Money Confidence: 84%
|
|
Risk Levels
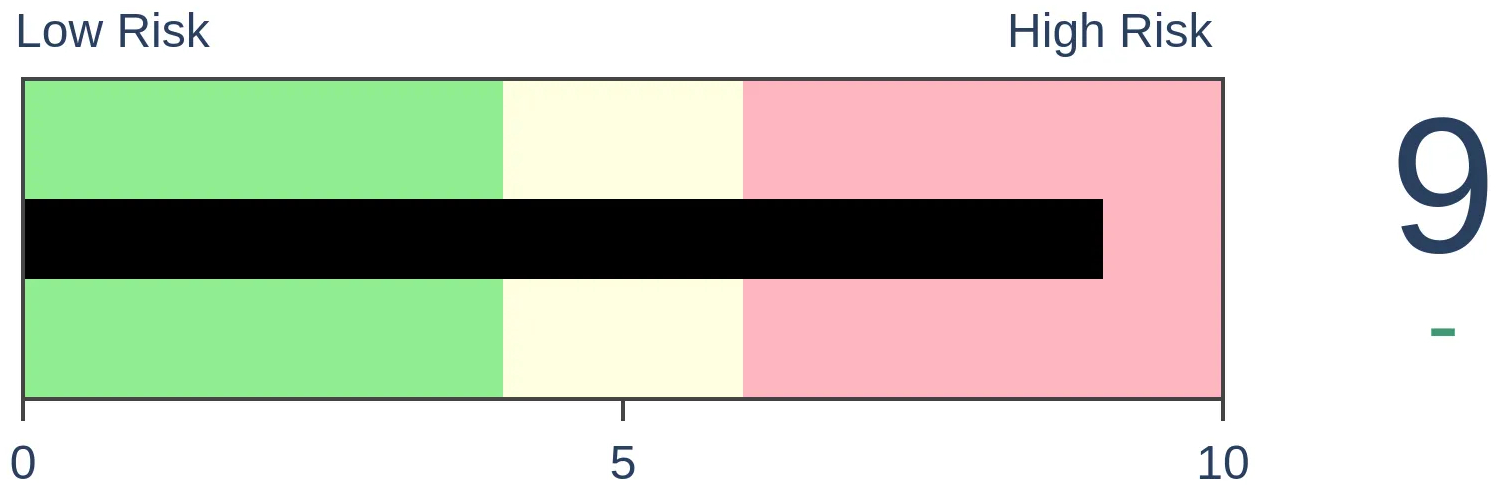
Stocks Short-Term
|
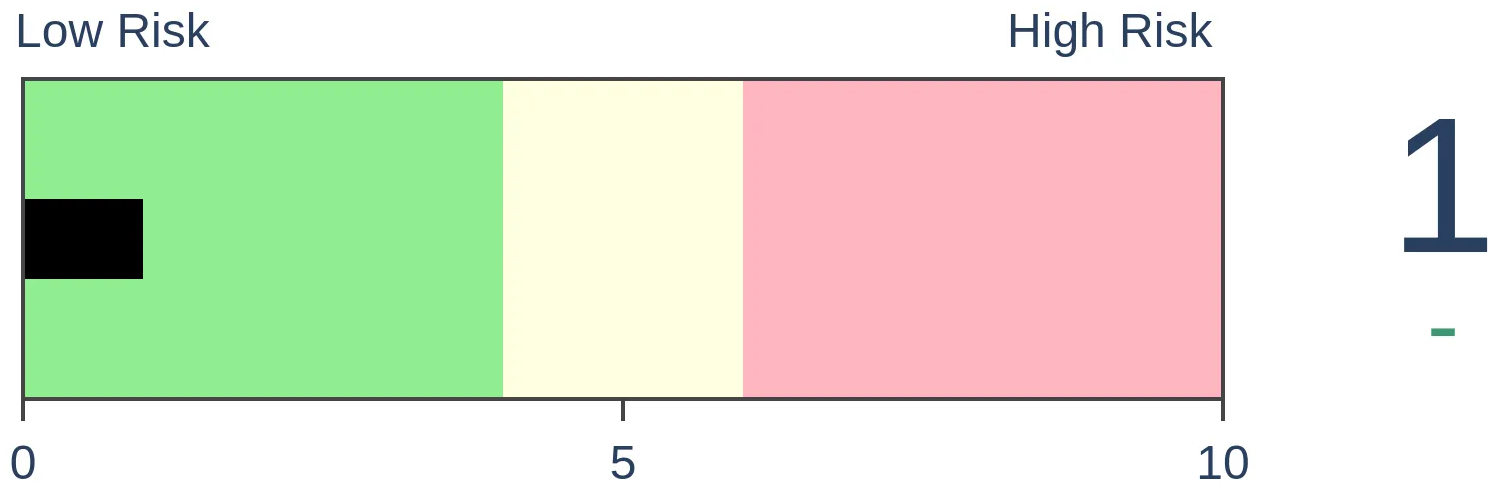
Stocks Medium-Term
|
|
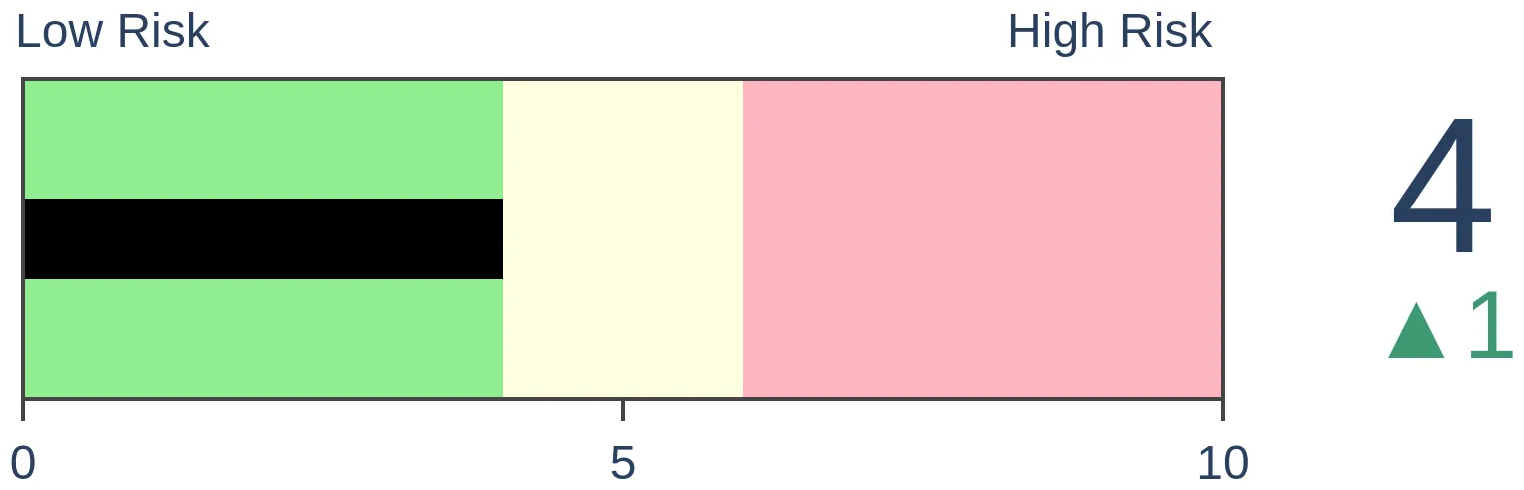
Bonds
|
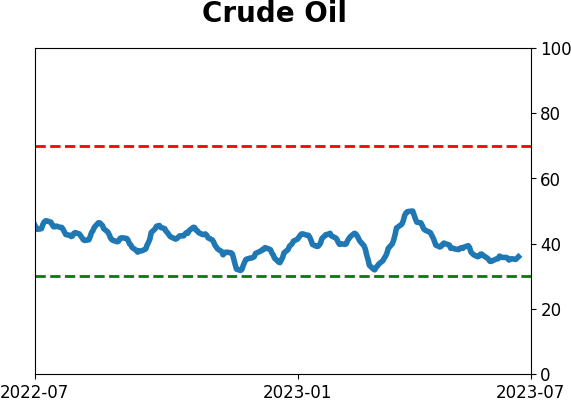
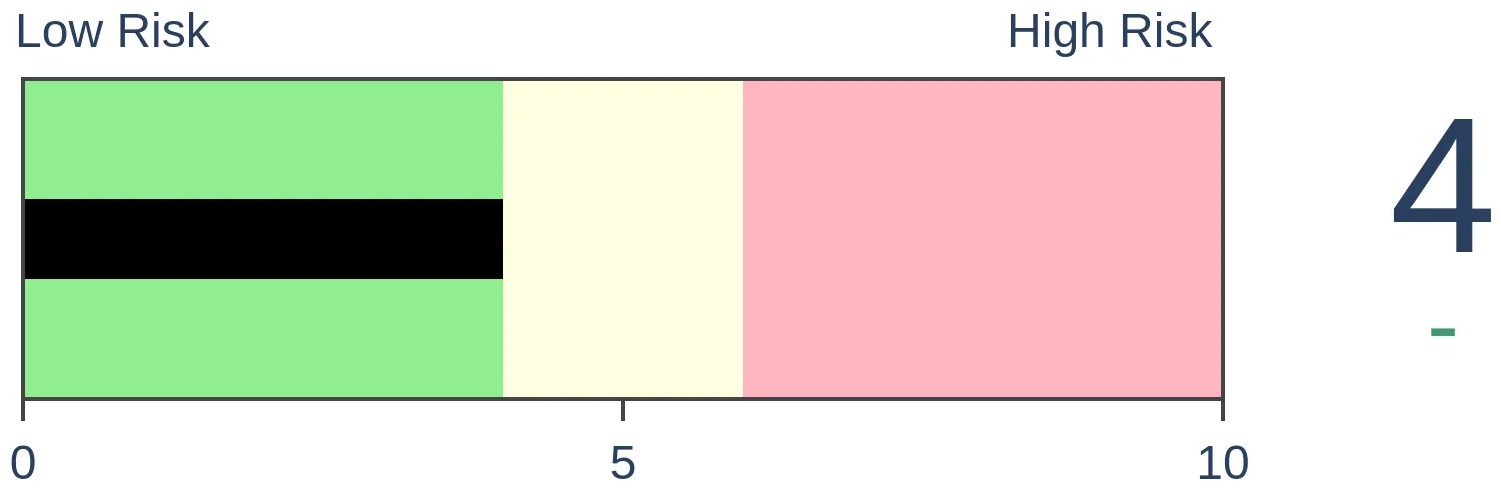
Crude Oil
|
|
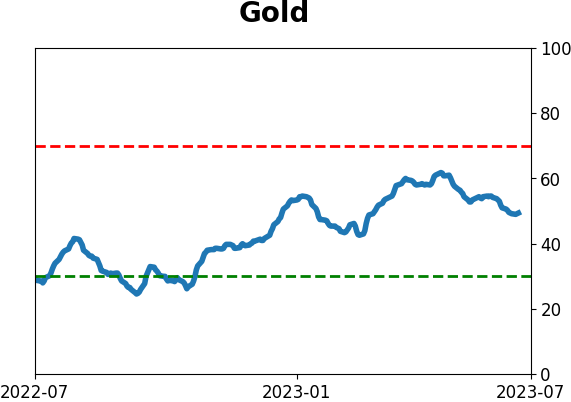
Gold
|
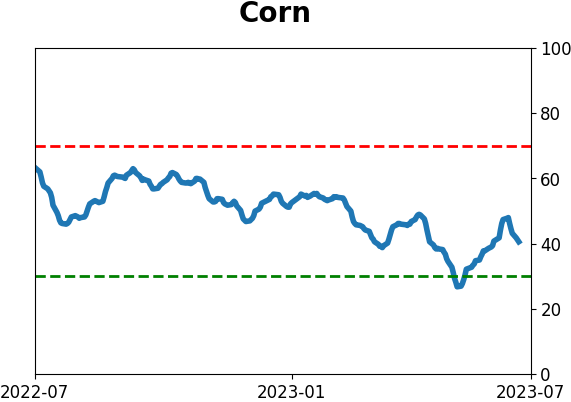
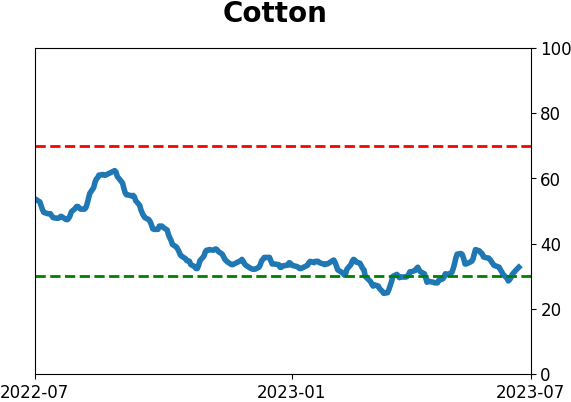
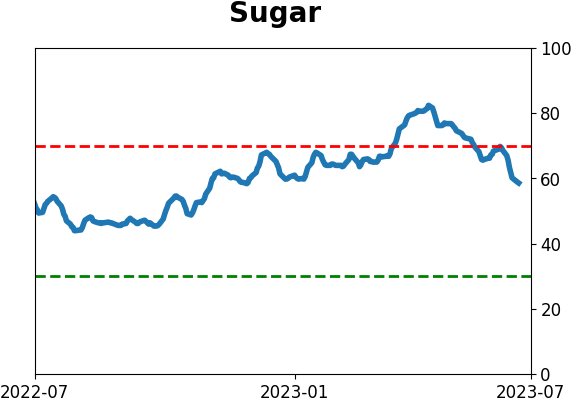
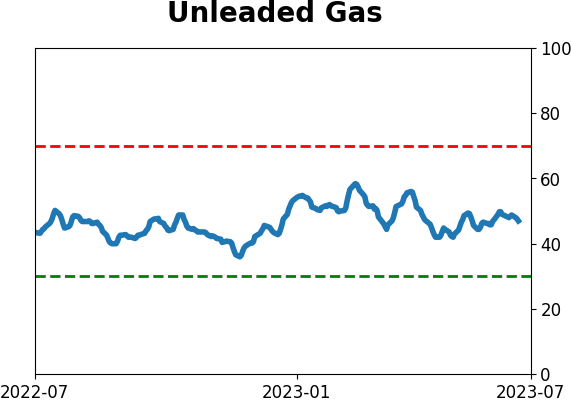
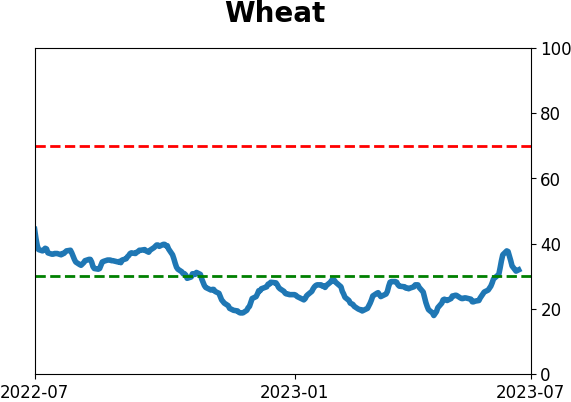
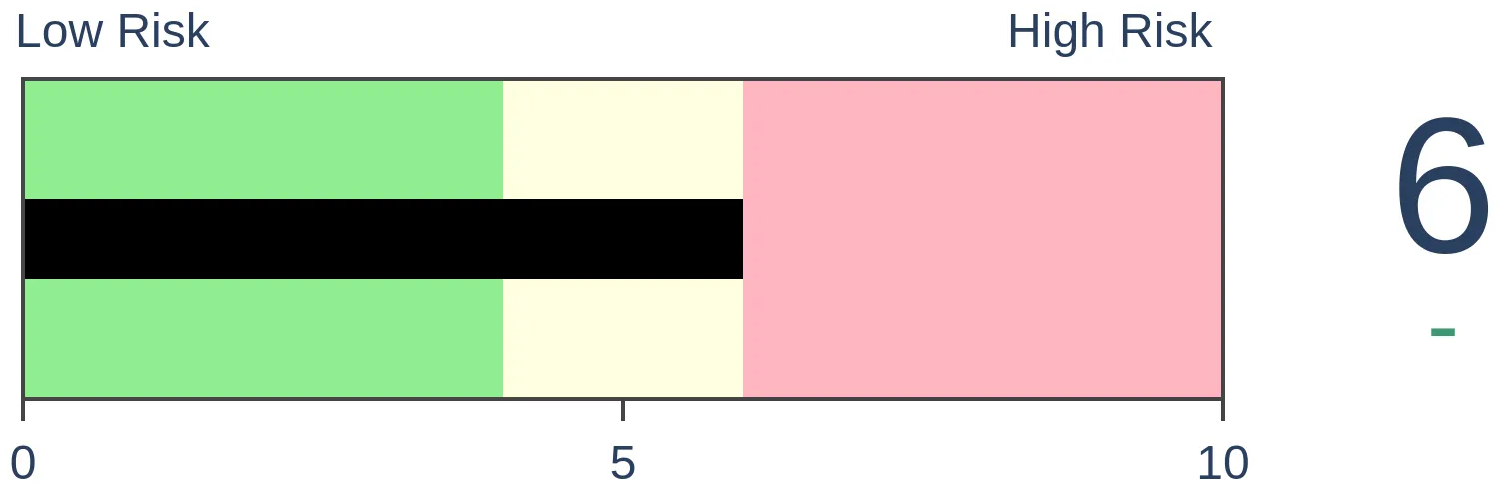
Agriculture
|
|
Research
By Jason Goepfert
BOTTOM LINE
A recent media article suggested that stock market volatility is being suppressed by numerous factors, including decreased correlation among stocks and selling of call options. Even if true, the assertions haven't had much success in suggesting that volatility will rebound imminently or that stocks will decline.
FORECAST / TIMEFRAME
None
|
Key points:
- Over the past few months, correlations among individual stocks have fallen, signaling confidence among investors
- Premiums for selling calls have also increased, which may put a lid on volatility
- Those are assertions in the media, but even if true, they have limited historical value
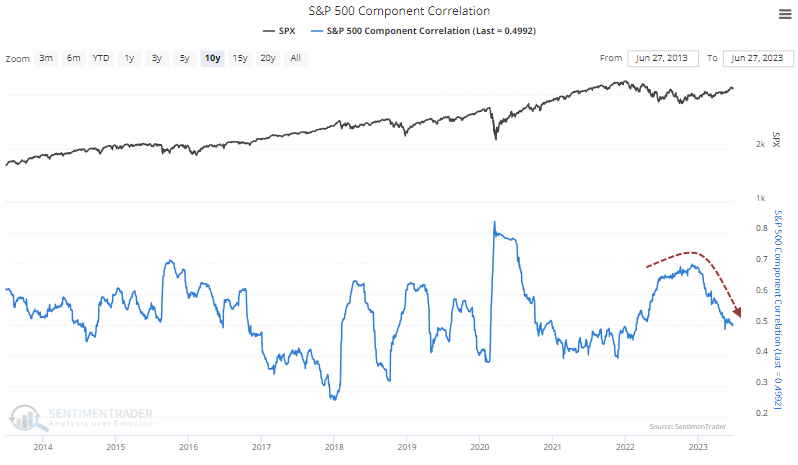
Correlations among stocks are falling
Investors have become overconfident, trading stocks on their own merits, and they expect volatility to remain subdued. That sentiment has helped to push volatility lower, but it likely won't last. At least, that's the assumption by investment banks and other analysts.
The Wall Street Journal noted that investors have become more comfortable with stocks, and their correlation has dropped.
One measure of how tightly stocks within the S&P 500 are moving together, known as correlation, has fallen to some of the lowest levels on record in the past three months, according to Deutsche Bank, a sign that stocks and sectors are moving in dramatically different directions. Correlations within stocks haven't been this low since late 2017 and early 2018, around the time a burst of volatility known as "Volmageddon" jolted markets. If stocks across the S&P 500 start moving in lockstep once again, that would drive volatility higher.
Since Jay noted the spike in correlations last September, they have, indeed, fallen significantly. More and more stocks are moving independently, a sign of confidence among investors.
Over the past 40 years, the current level of correlation between stocks in the S&P 500 is only average, however. It hasn't declined to a level indicating extreme overconfidence, nor is it still signaling panic, with investors buying and selling everything simultaneously regardless of individual merit. This isn't anywhere near a level that would suggest a warning sign.
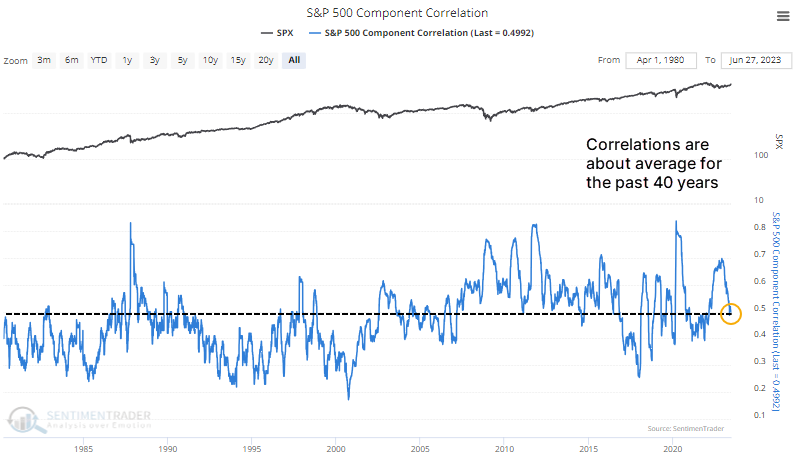
Even though correlations have been higher over the past 20 years, the current level is still above what it was at recent major market peaks. Typically, it got to 0.40 or below.
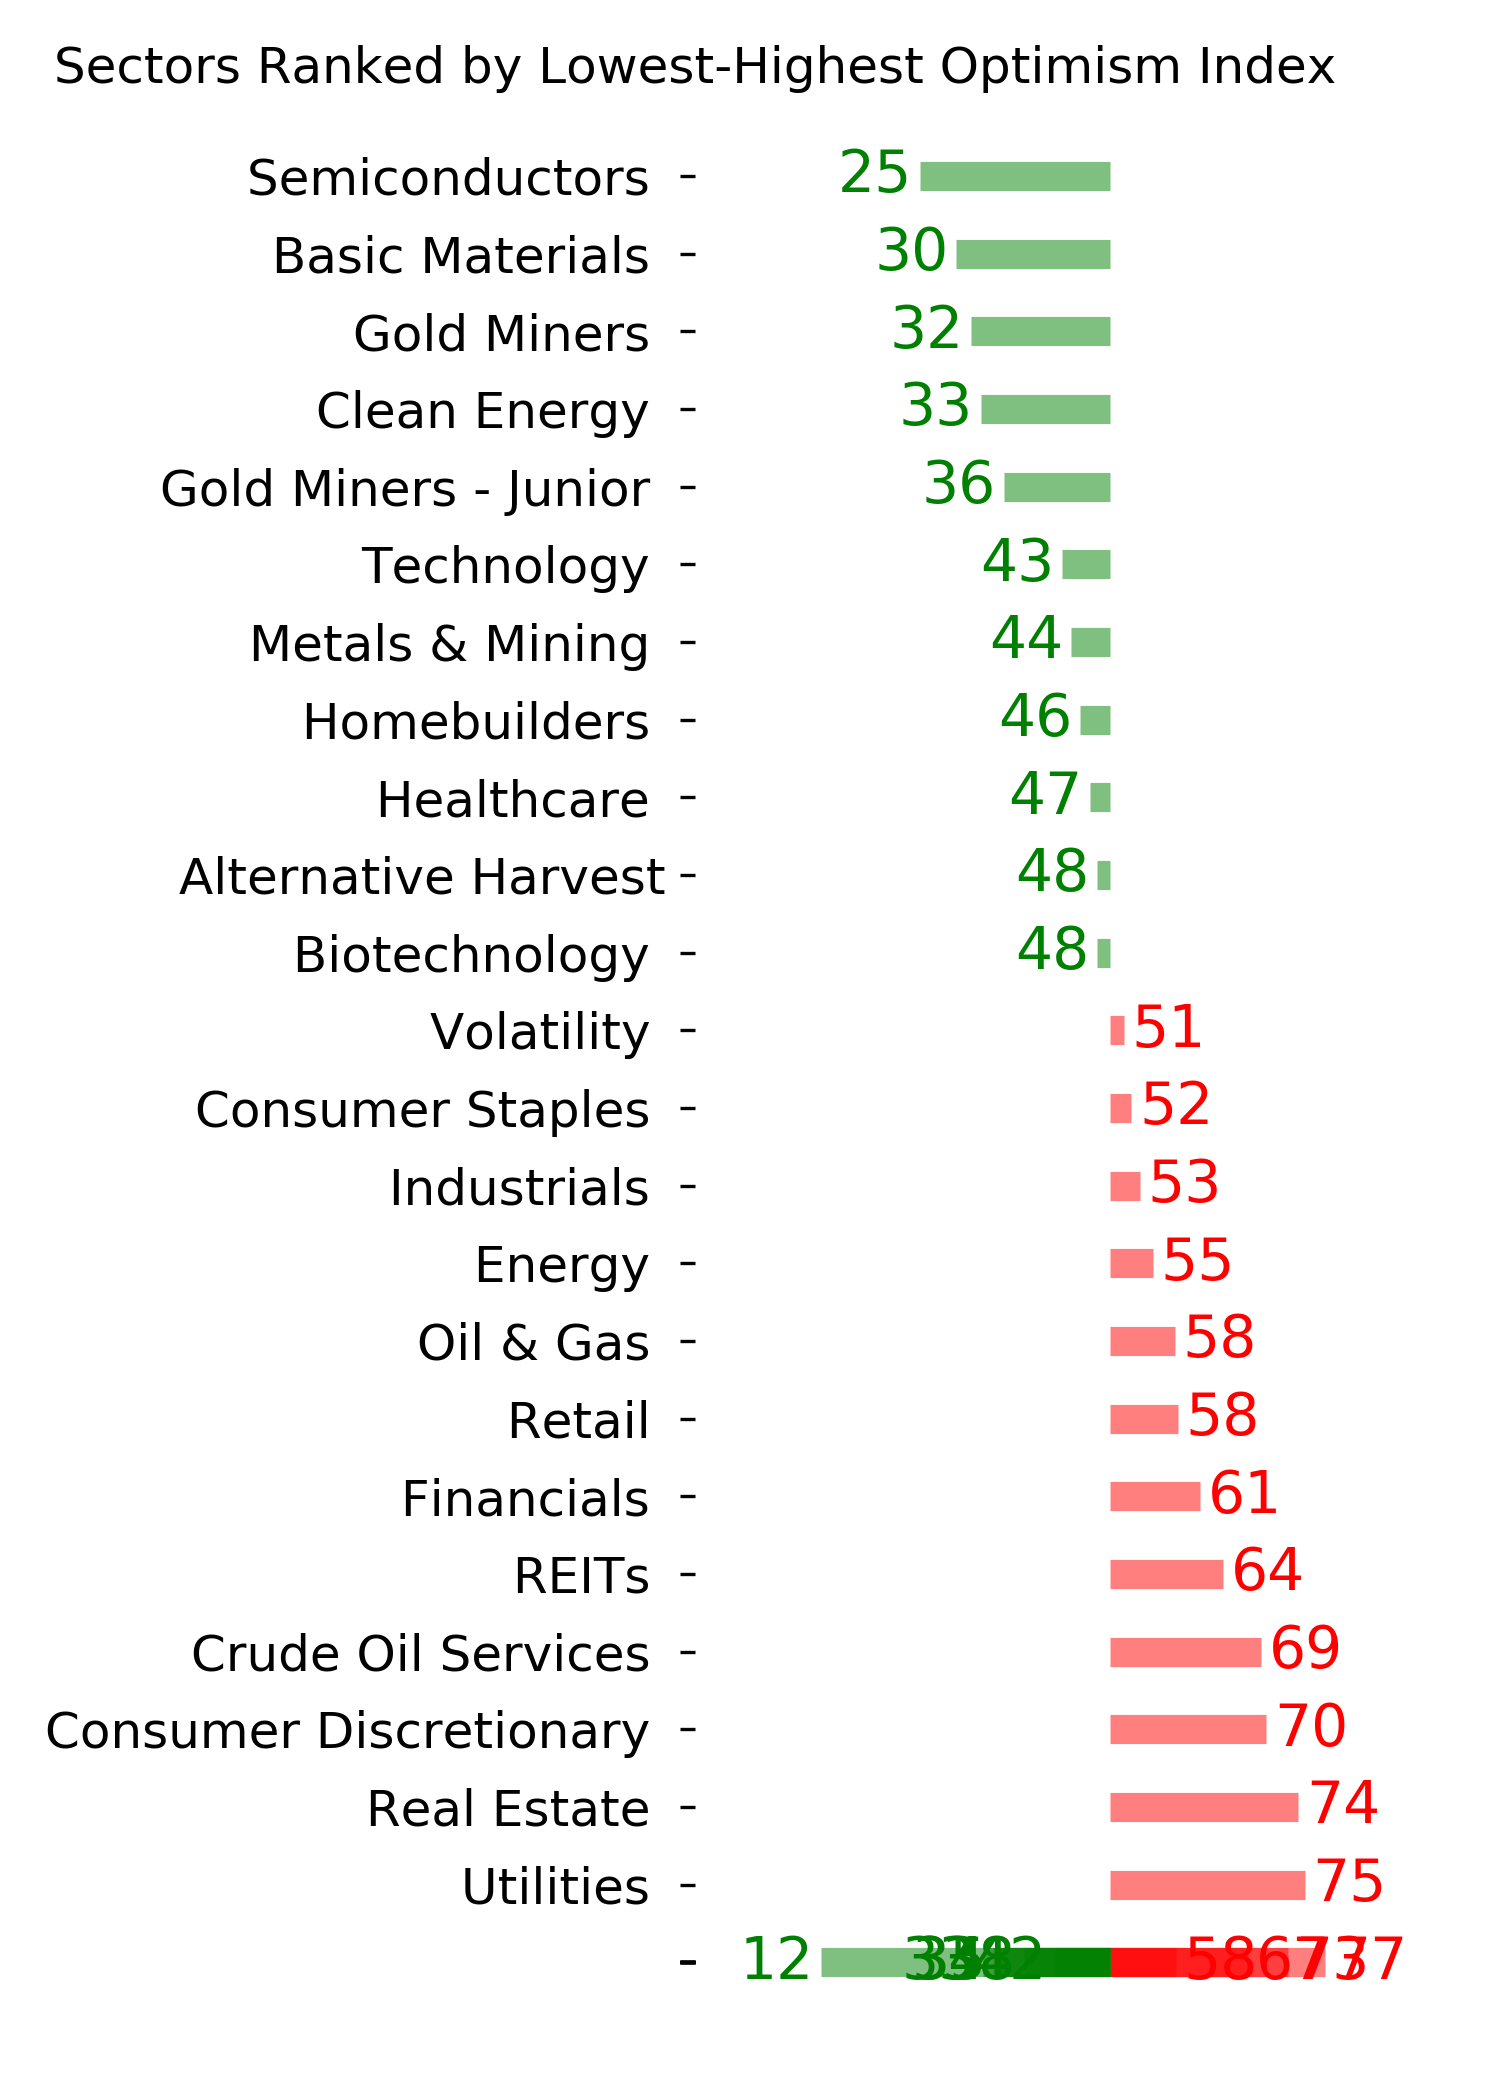
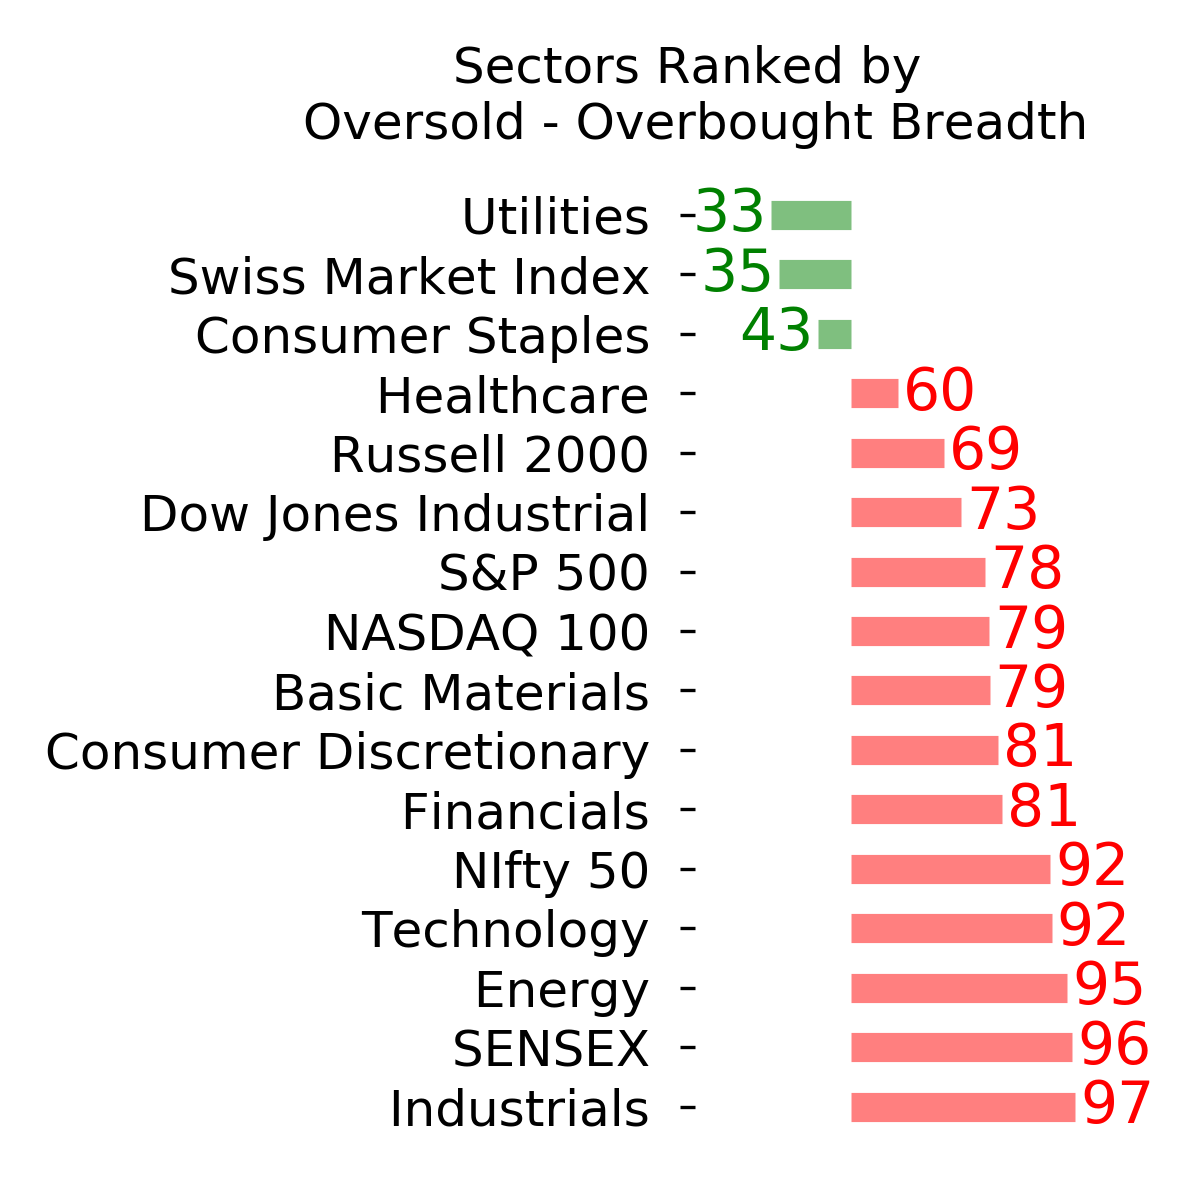
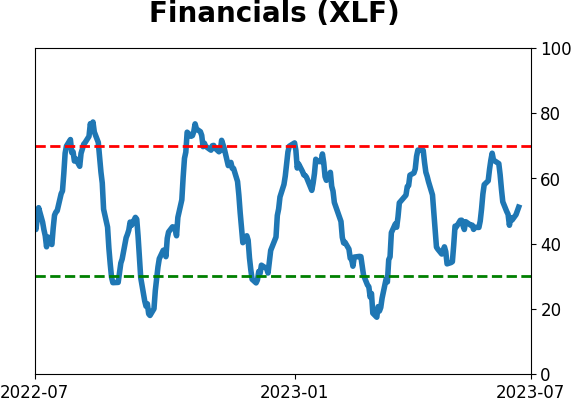
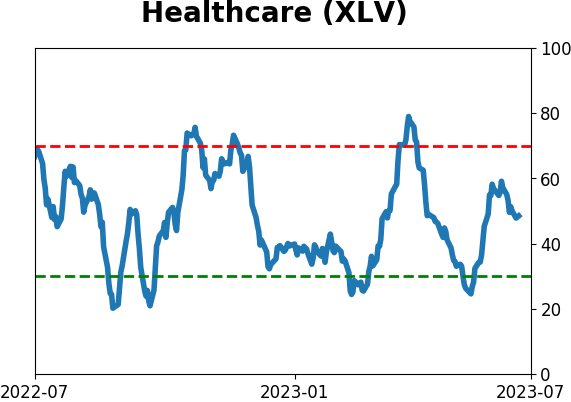
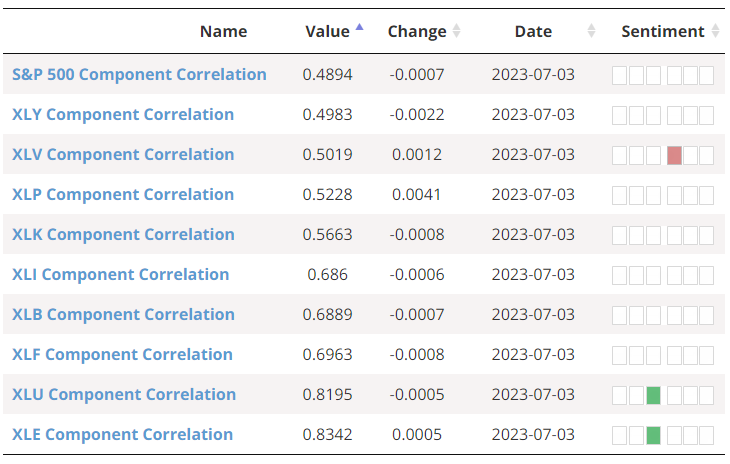
Out of the various sector correlations that we track, only that for Health Care (XLV) is barely in extreme territory relative to its history.
Traders are selling too many calls (?)
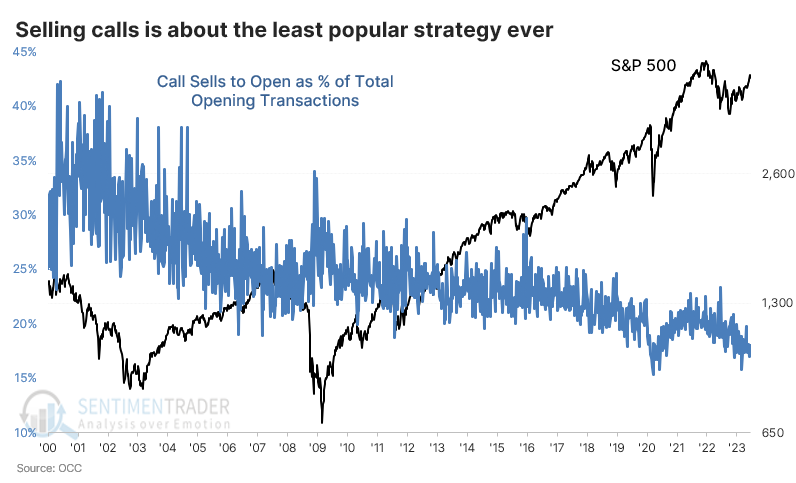
The Journal also noted that volatility is being driven lower by traders selling call options to open.
Daily market moves might also be blunted by an income-generation strategy that has grown on Wall Street. Investors are heavily selling call contracts, known as overwriting, to pocket premiums while giving buyers the right to buy shares at a specific price, by a specific date. The trading forces options dealers-Wall Street firms that profit from market-making fees-to hedge their exposure by selling shares. Quiet markets have driven more interest in the strategy, perpetuating the calm, according to traders. "There's massive, really relentless call overwriting in the market right now-maybe the most extreme I've seen in my career," said Alex Kosoglyadov, managing director of global equity derivatives at Nomura.
Ummm...what? This one is tough to verify, given the available data.
Looking at trades across all U.S. exchanges, the strategy of selling calls to open is about as unpopular as it has ever been. Call selling to open recently accounted for about 17% of all opening transactions. It got slightly lower during bouts of investor panic over the past few years but remains on the bottom end of its range over the past 23 years.
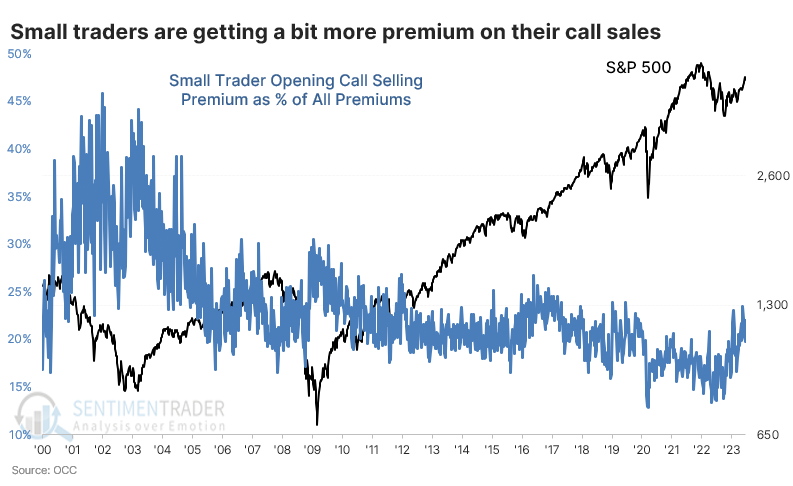
Among the smallest options traders, the strategy accounted for only 16% of total open transactions. That's the 3rd-lowest percentage next to March and June 2020. Looking only at contract volume can be a bit misleading, so the chart below looks at the smallest traders and the premium they collected by selling call options to open relative to total premiums collected by buying or selling calls or puts to open.
Looking at it this way, the indicator has increased somewhat in recent months, but it's also hard to glean any relevant information from that fact. Unlike the typical ways we look at this data, there was no clear pattern of extremes in the indicator coinciding with periods of extreme confidence or a lack of it.
What the research tells us...
When it comes to sentiment, investors seem to have a strong desire to consider everything to be a contrary indicator. And often, the financial press will accommodate that desire by highlighting one side of a trade without giving much ink to the opposing side, which may be even stronger. And sometimes, sources are quoted simply for their opinion with nothing to back it. That seems to be the case with the idea that investors should be cautious because correlations are falling and traders are writing too many calls. Even if that data is accurate (not really), it doesn't have much support historically for being a reliable sell signal.
Indicators at Extremes
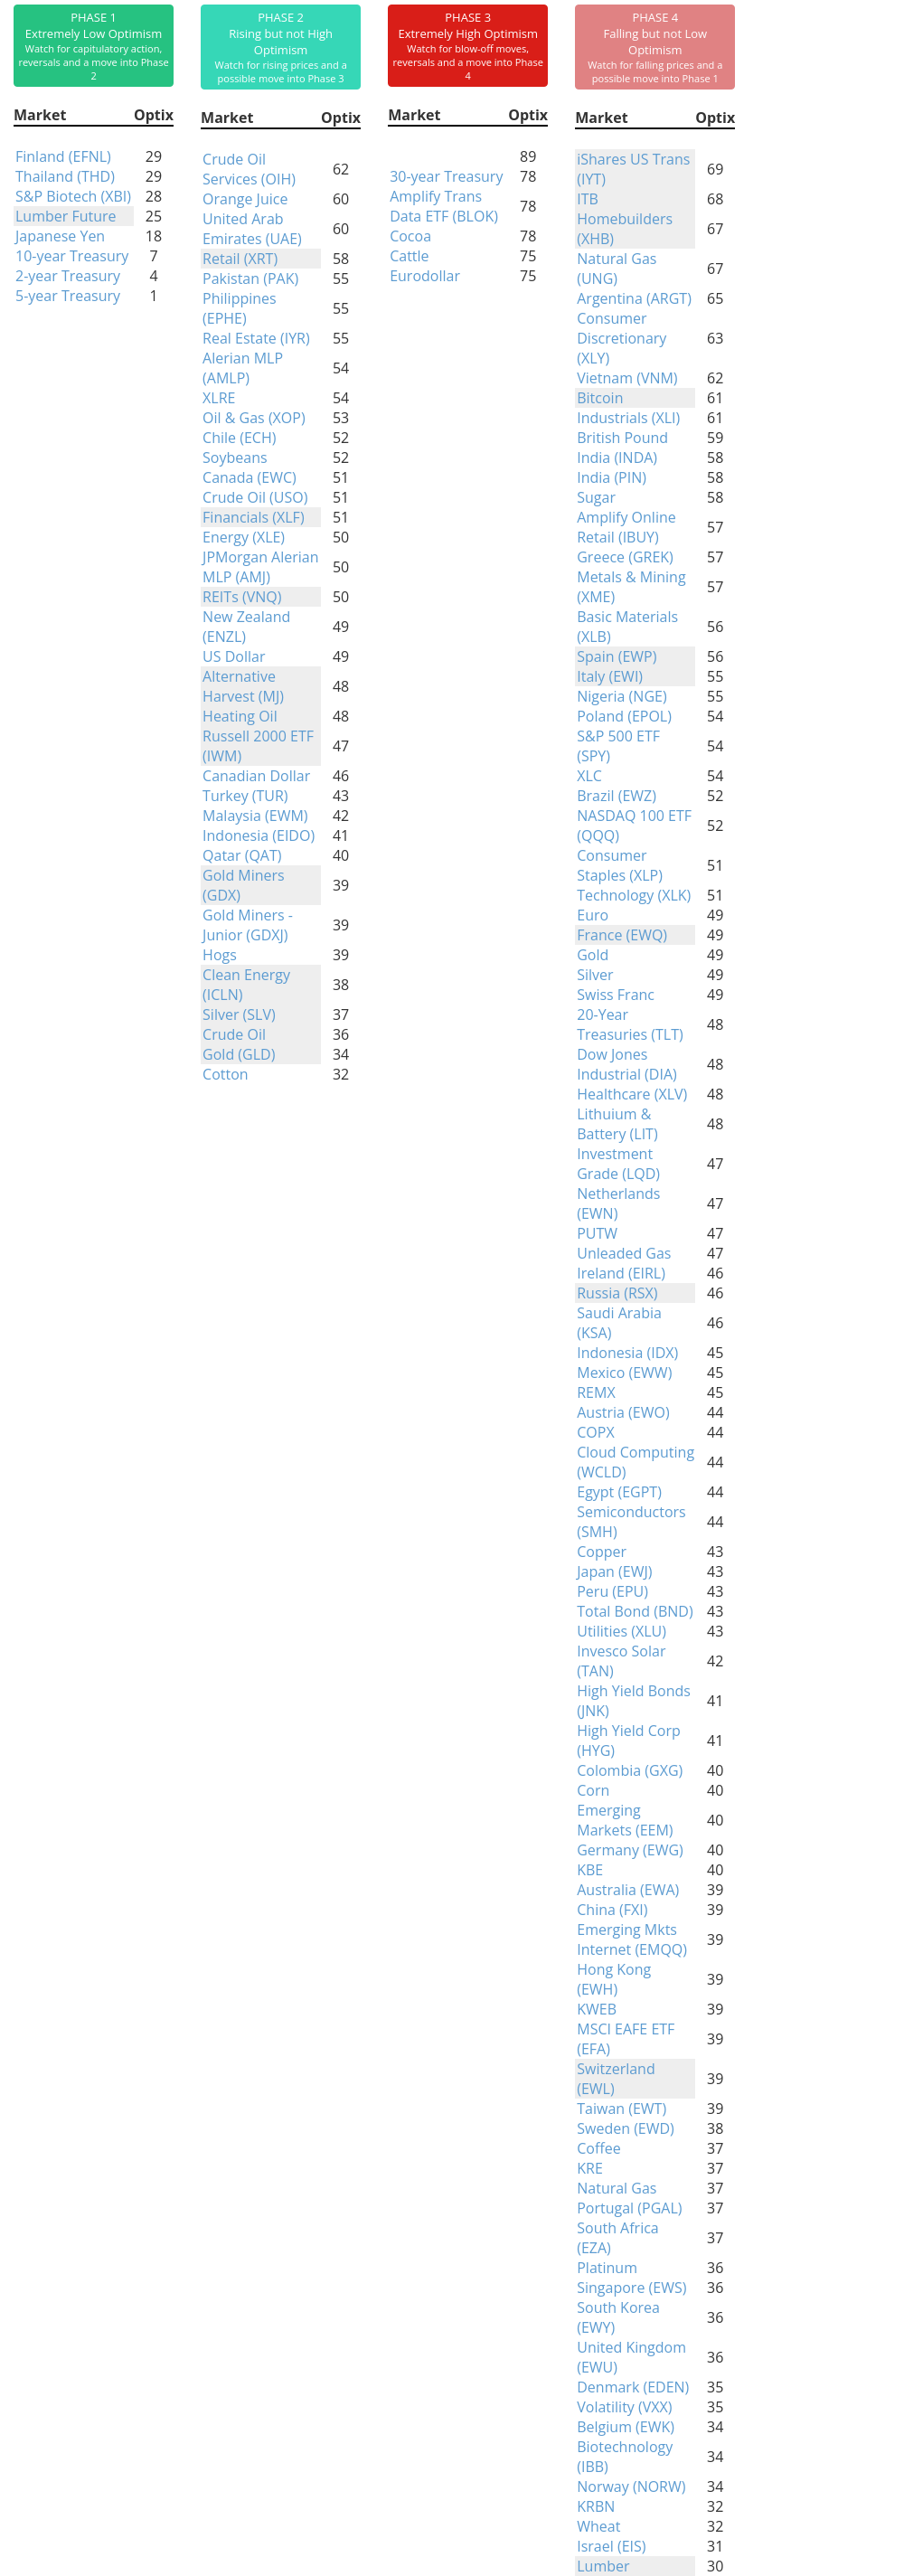
Phase Table
Ranks
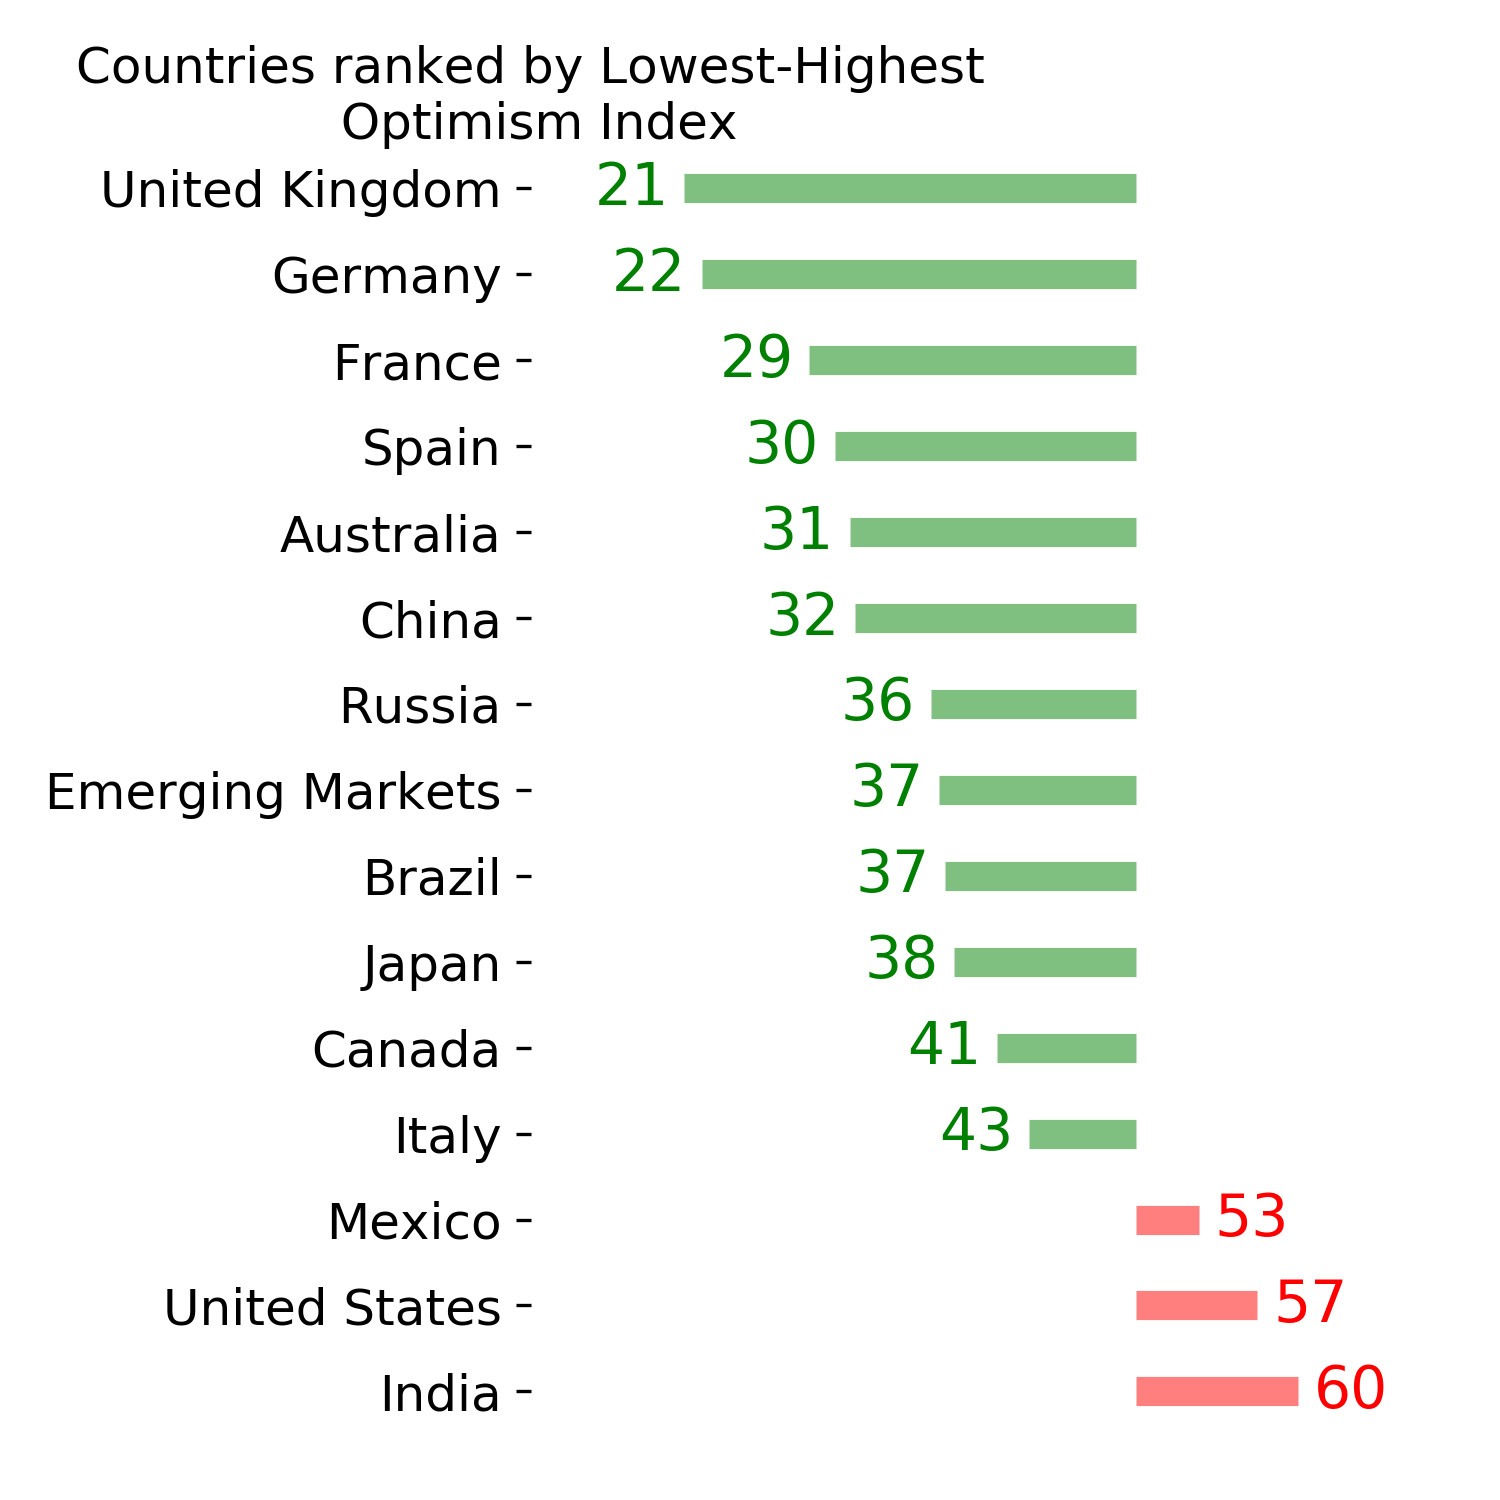
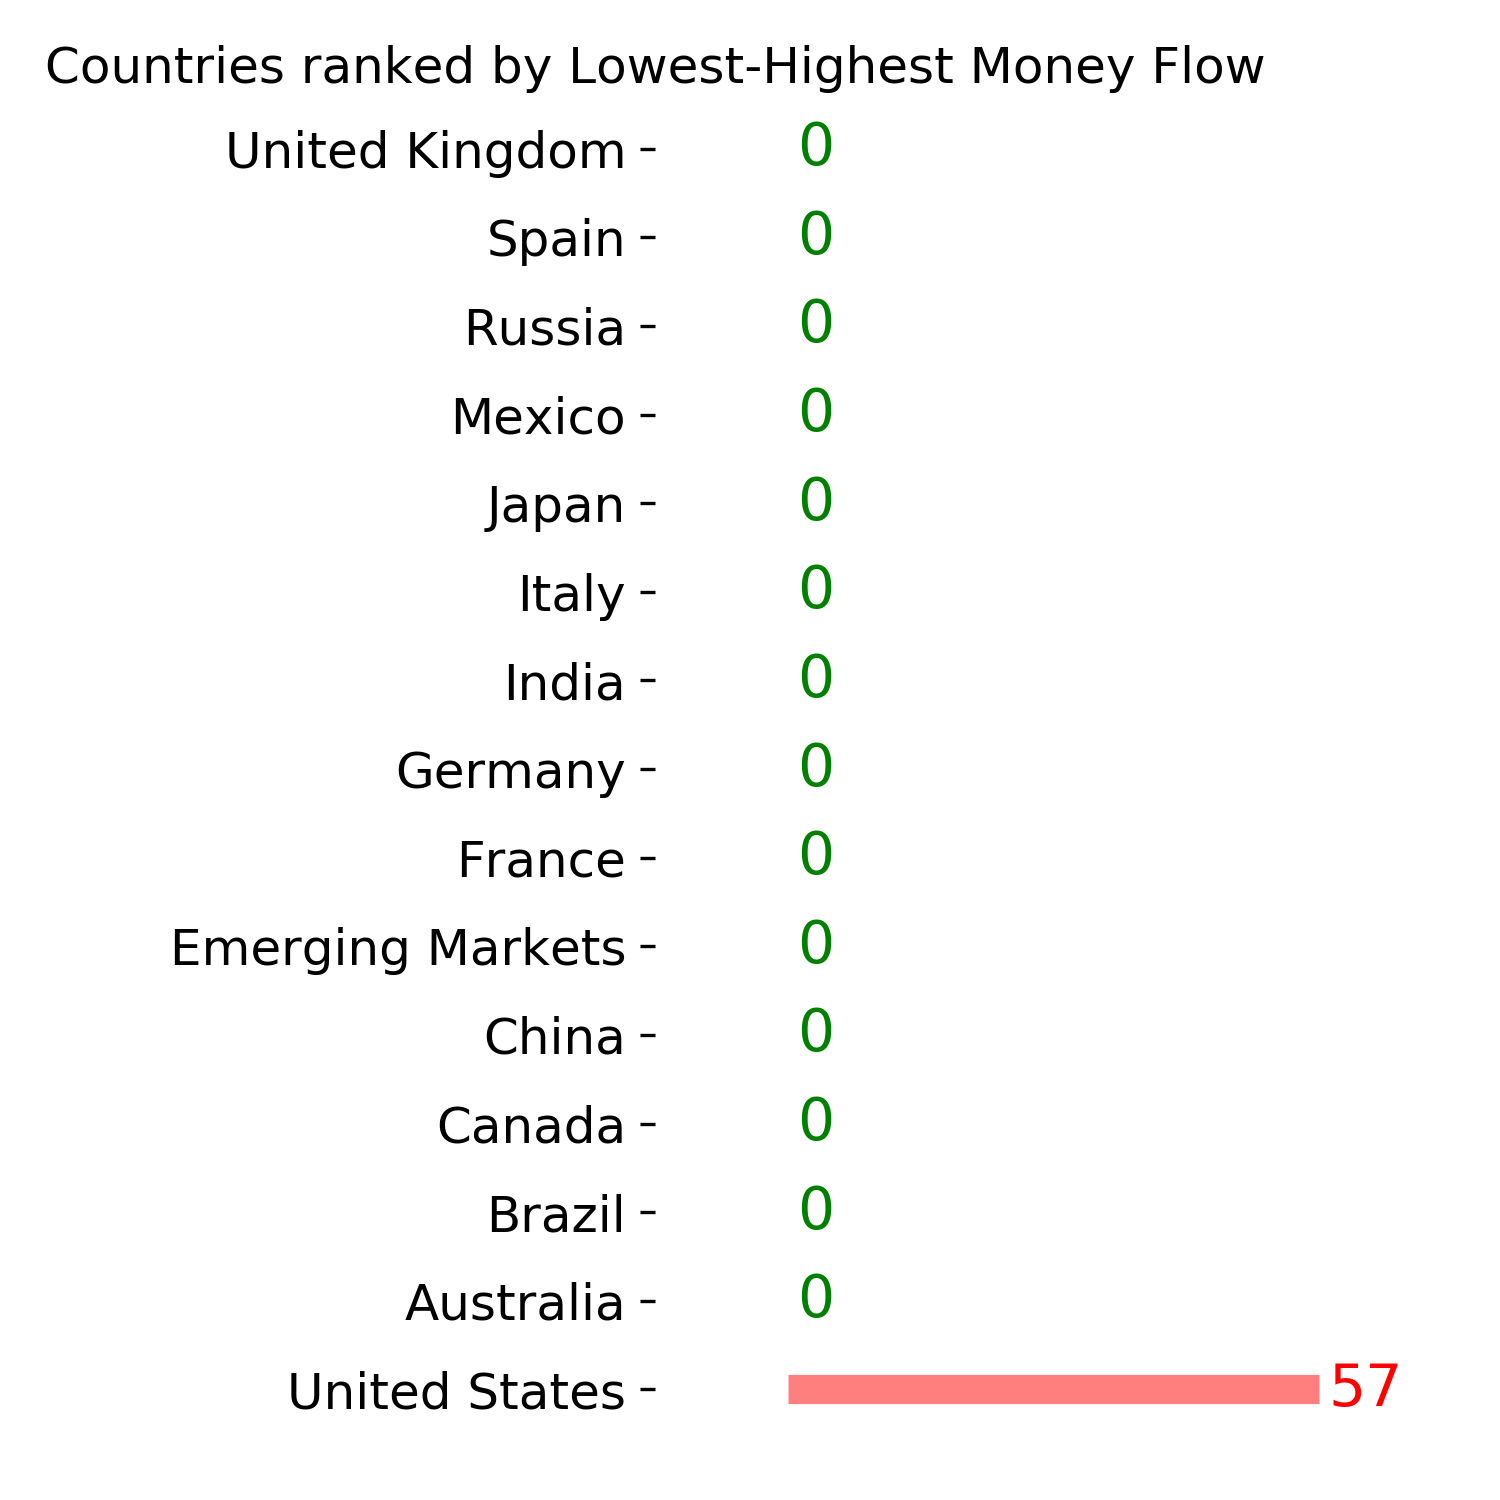
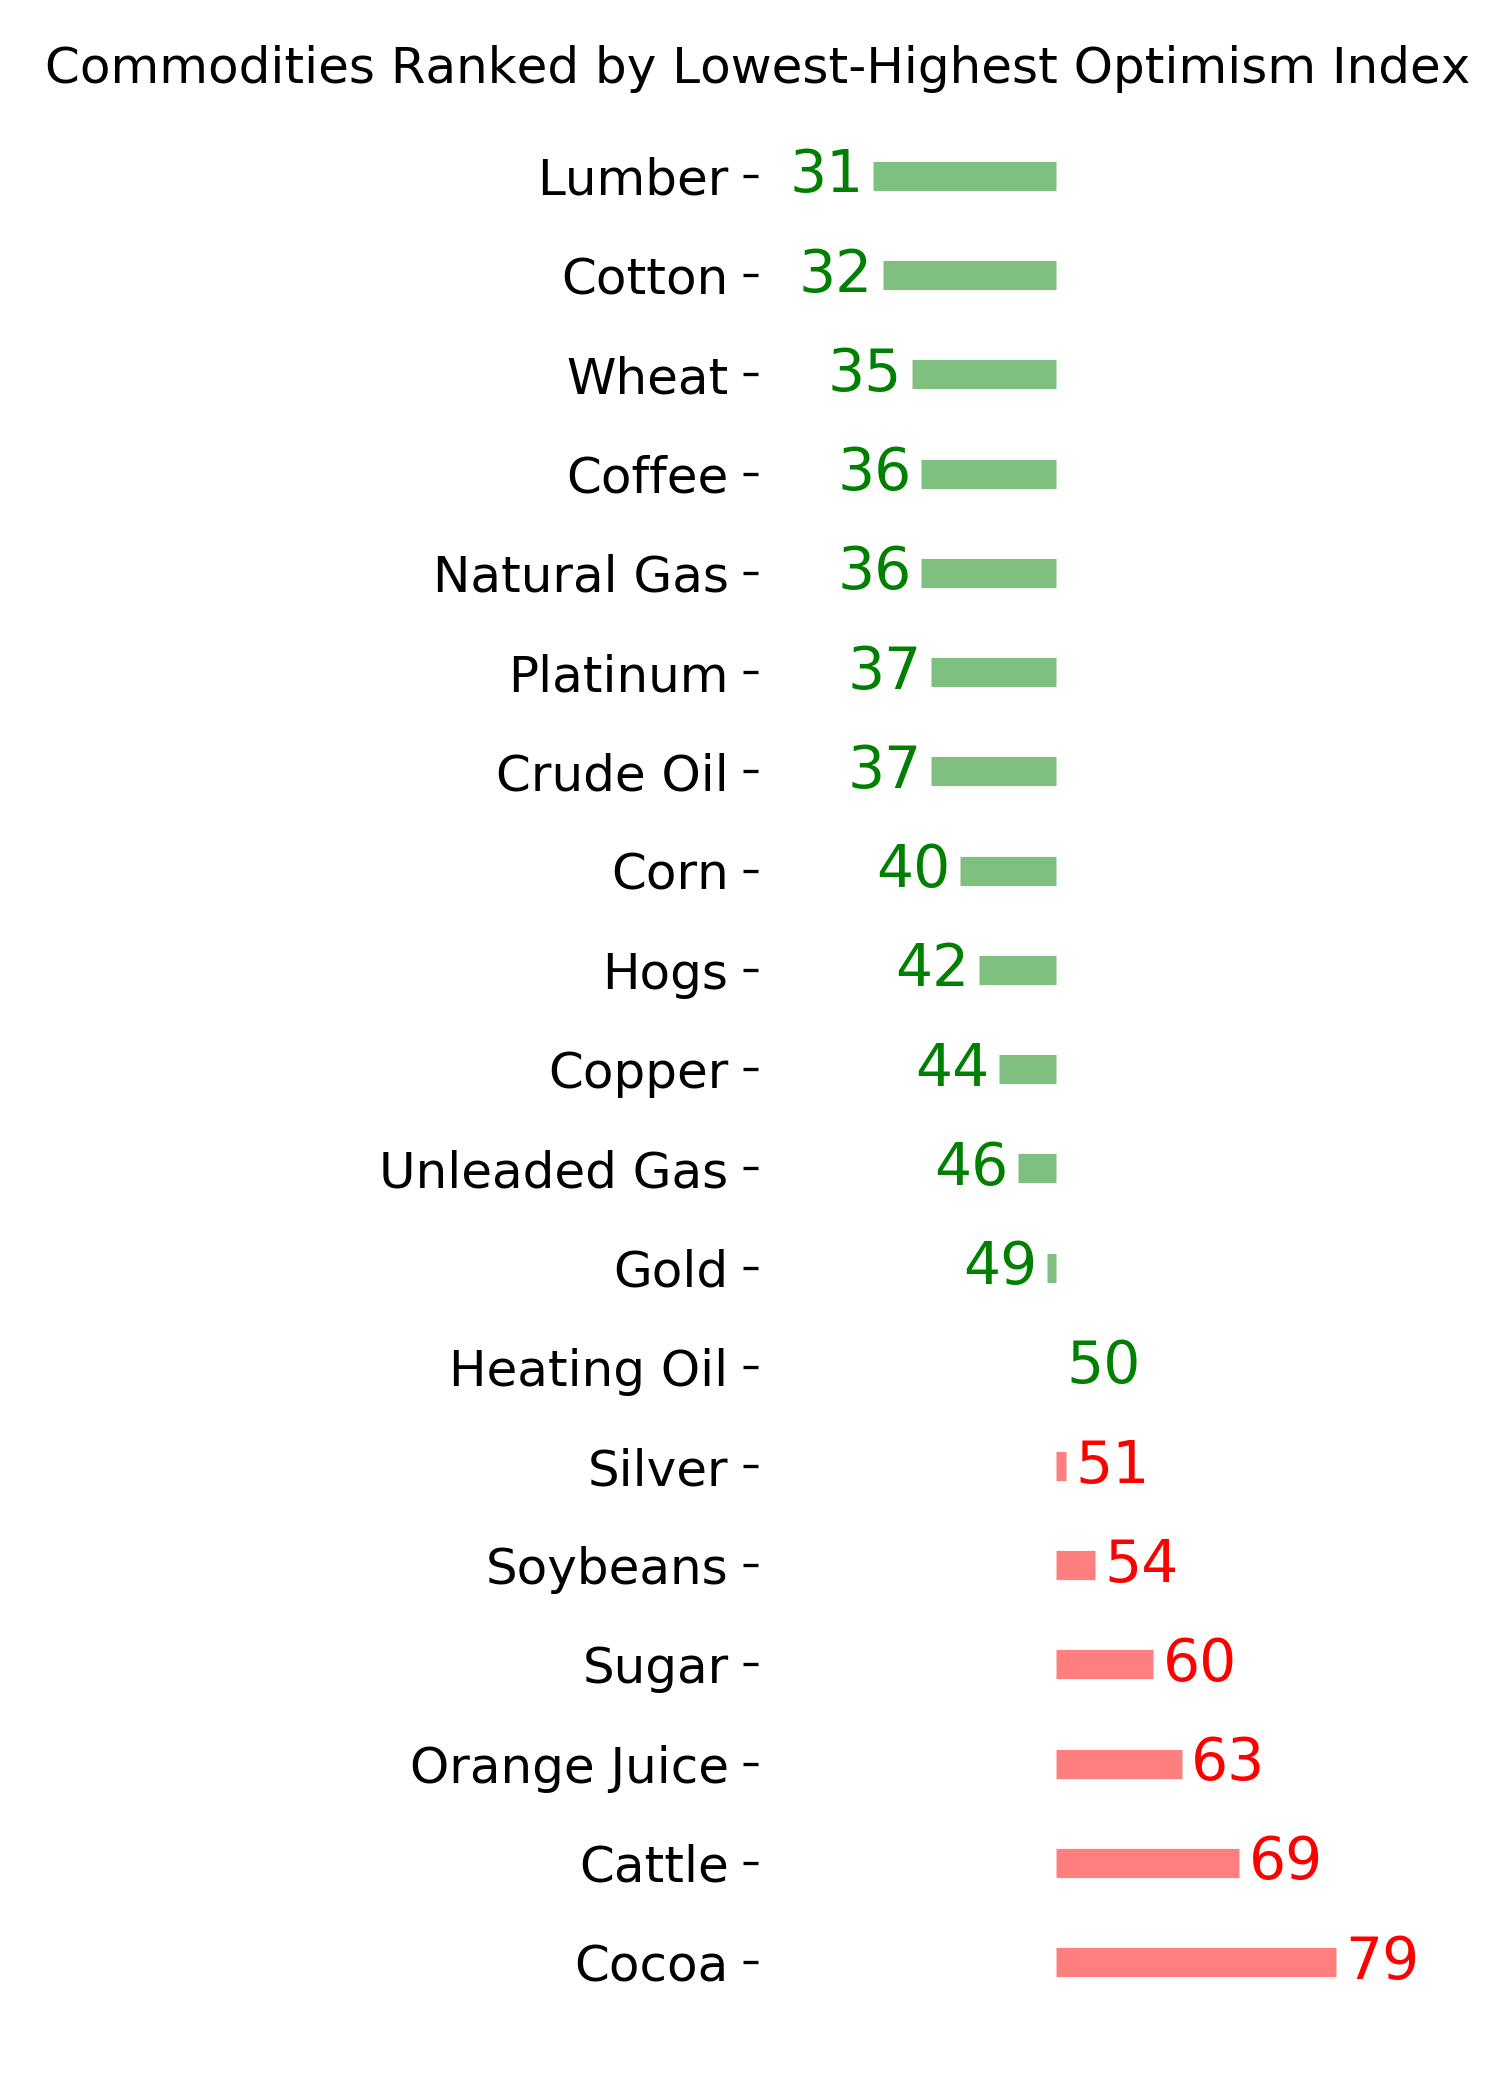
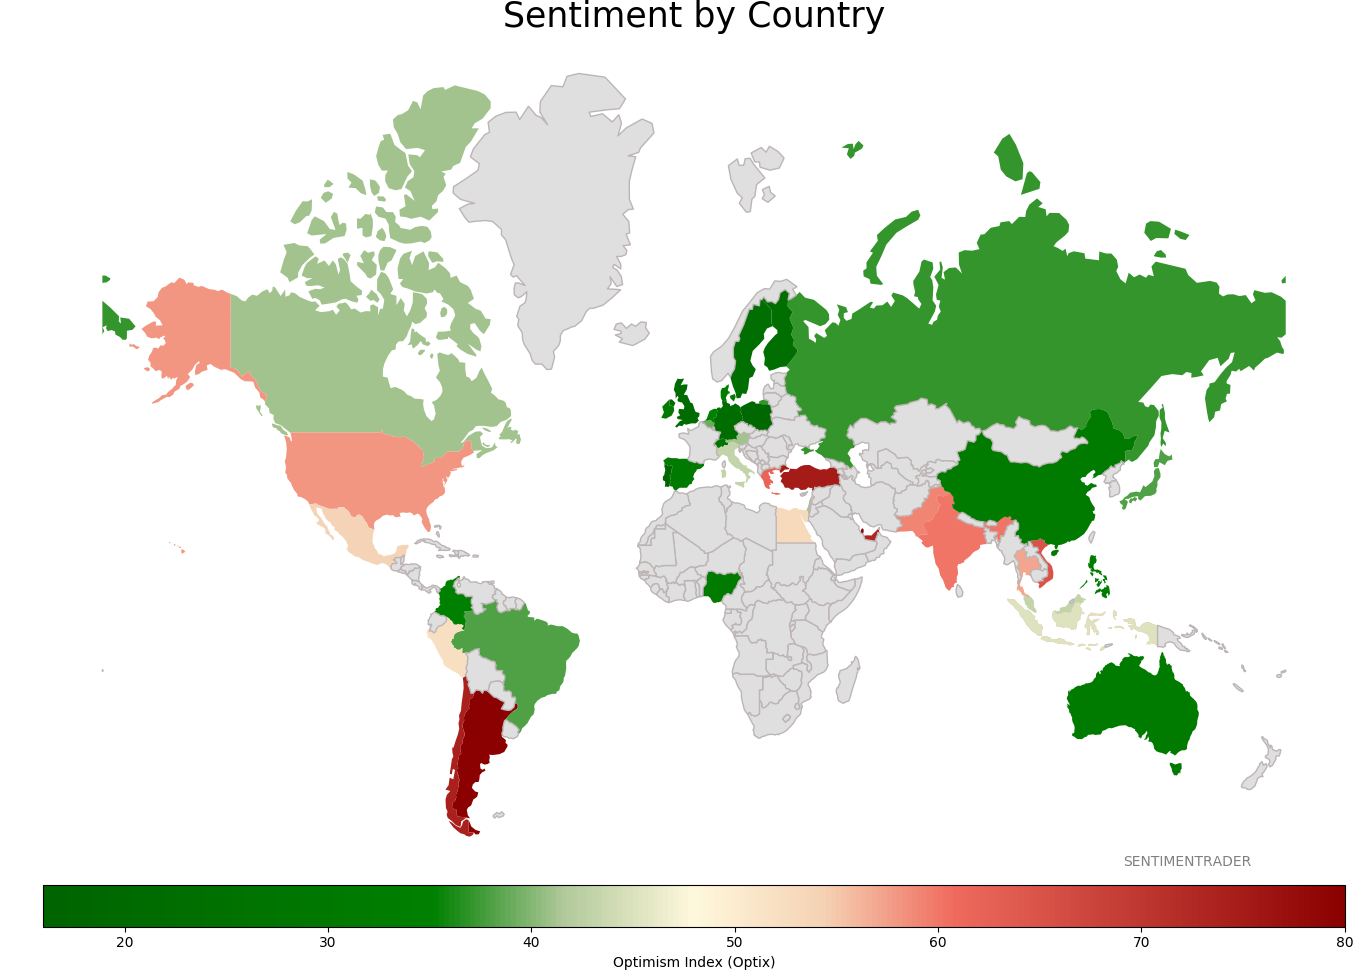
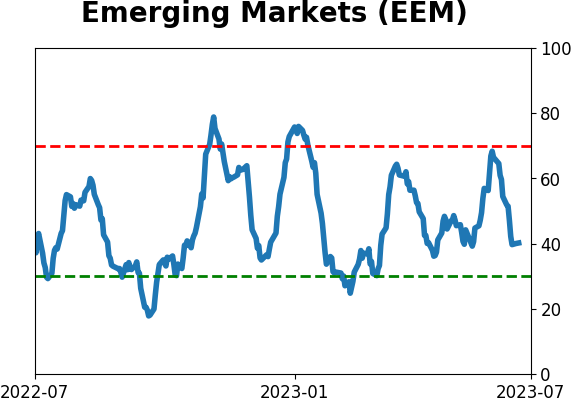
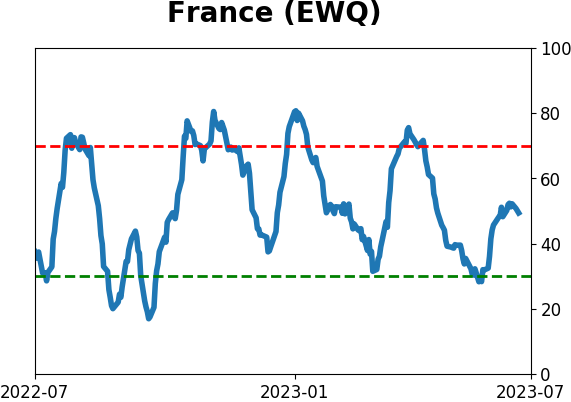
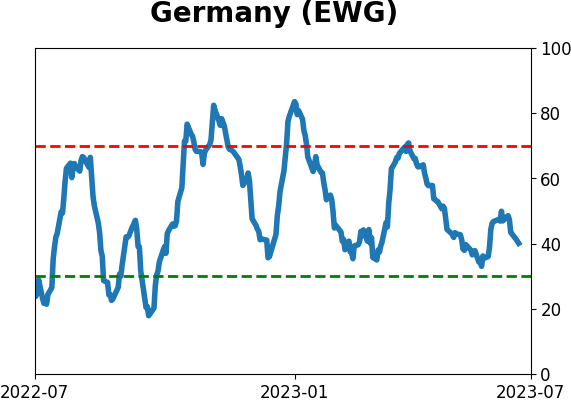
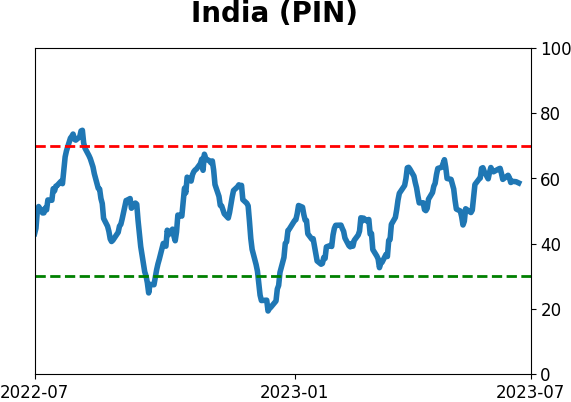
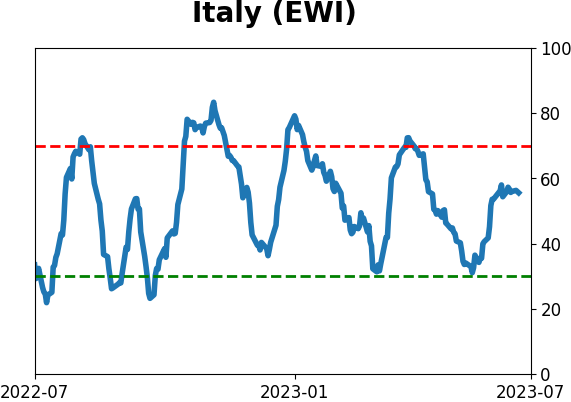
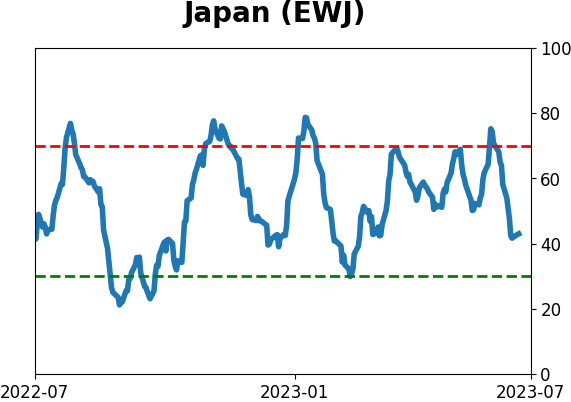
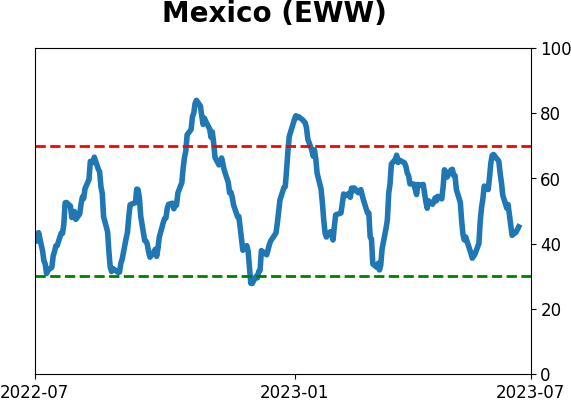
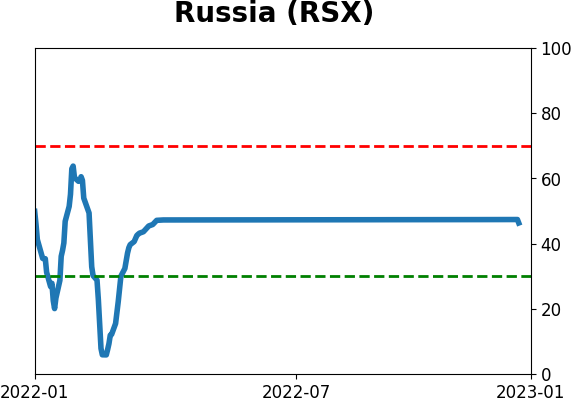
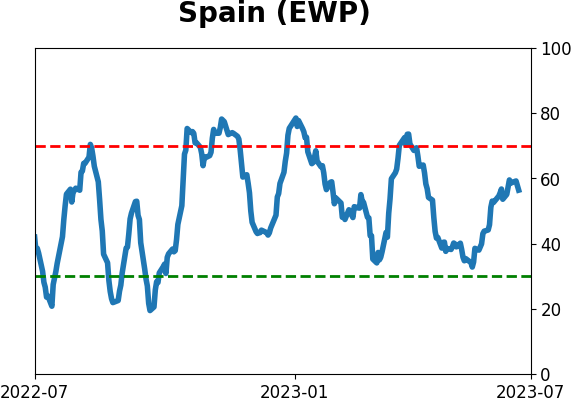
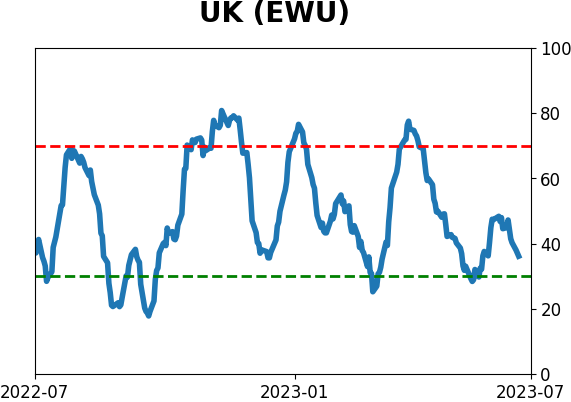
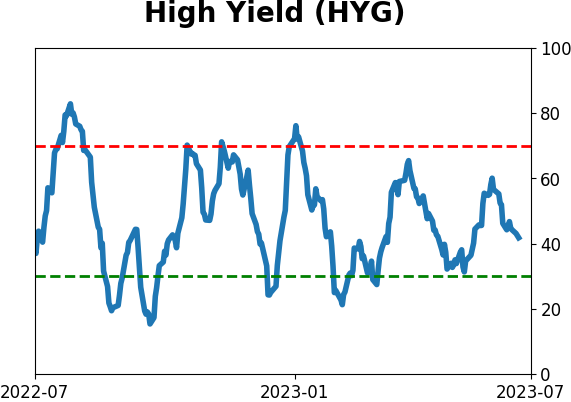
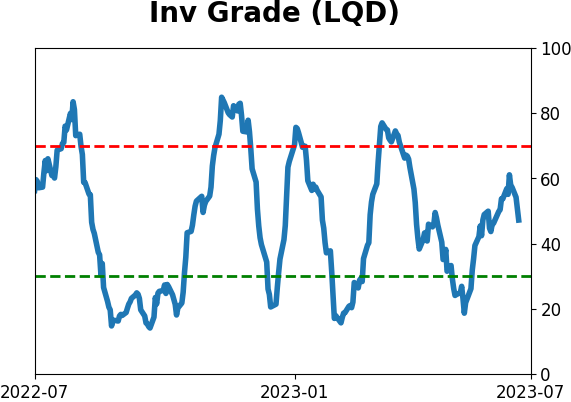
Sentiment Around The World
Optimism Index Thumbnails
|
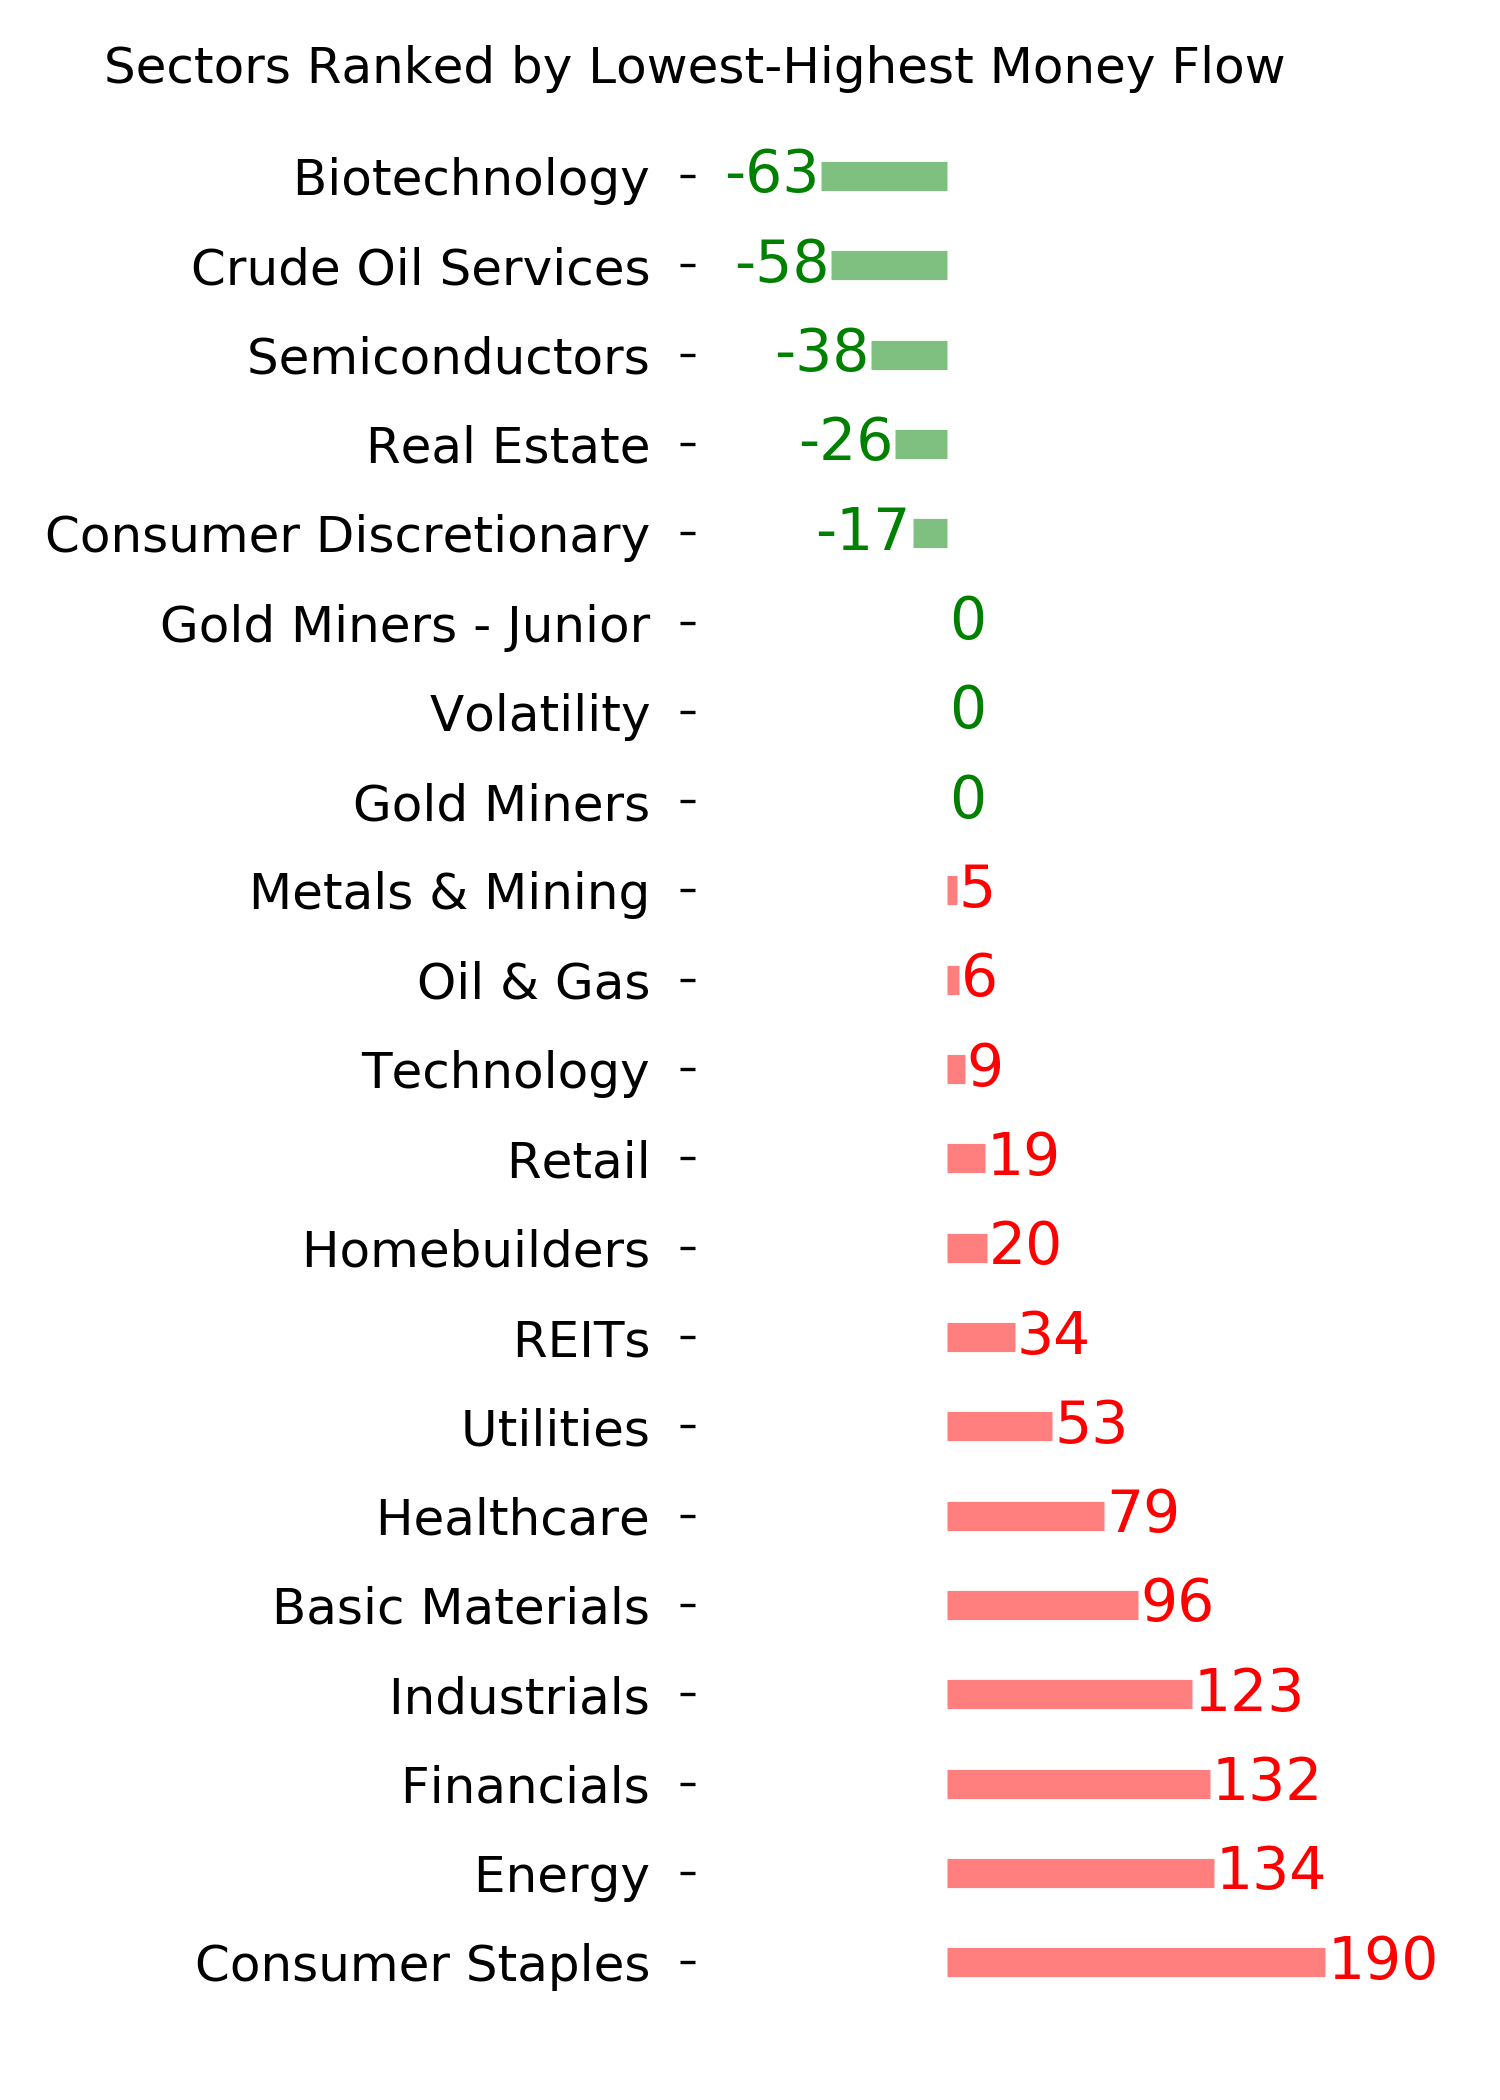
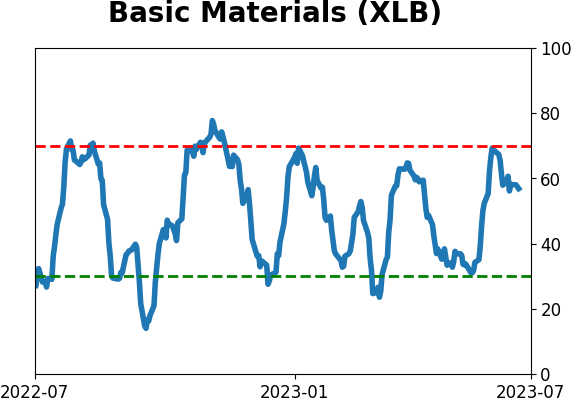
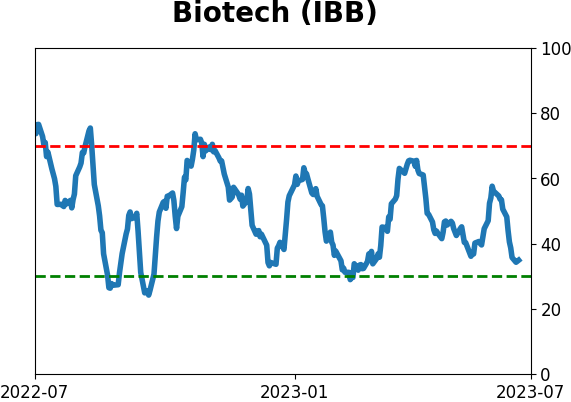
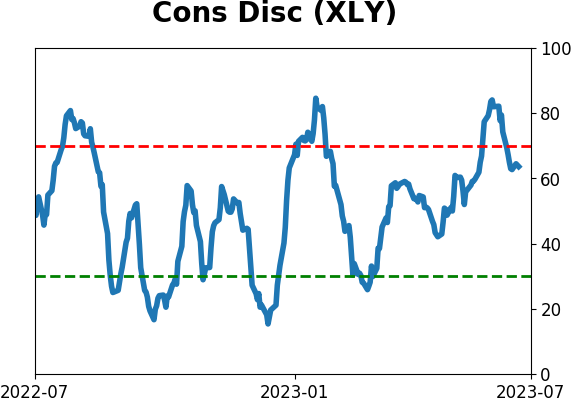
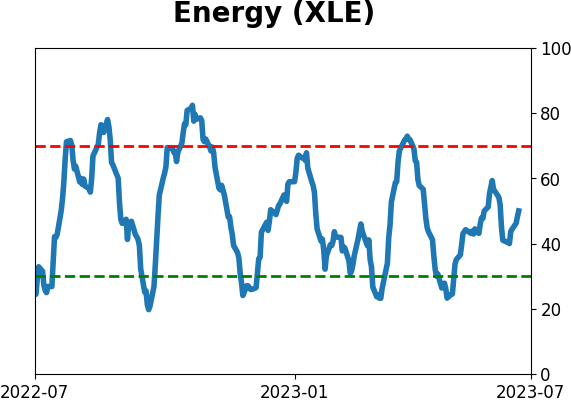
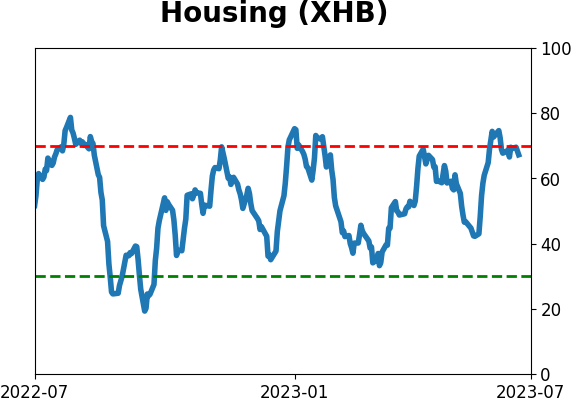
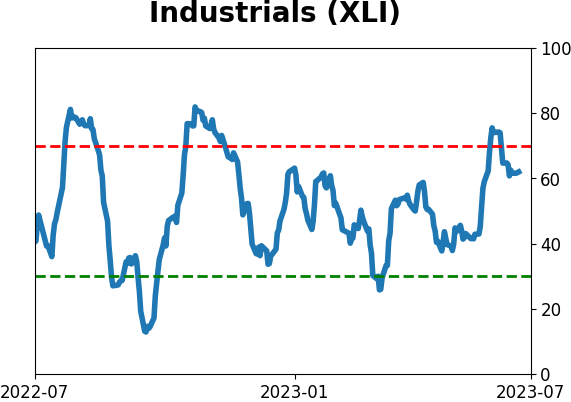
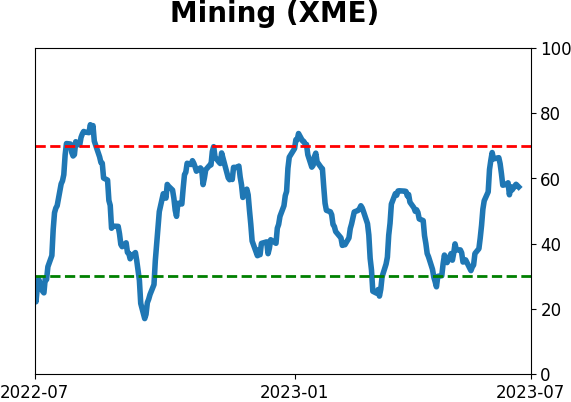
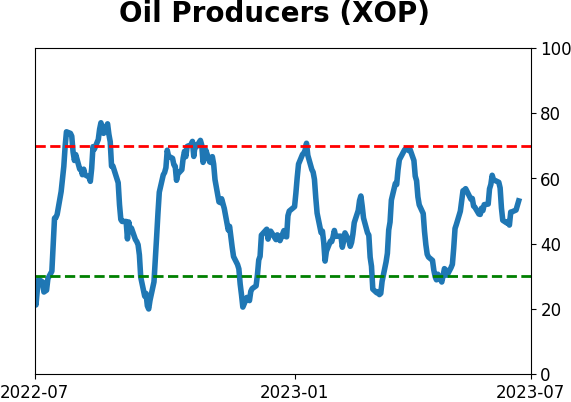
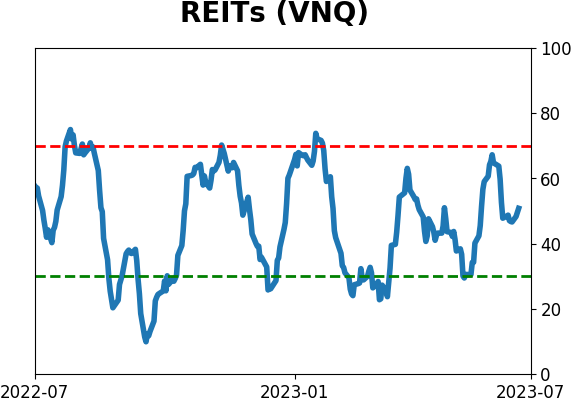
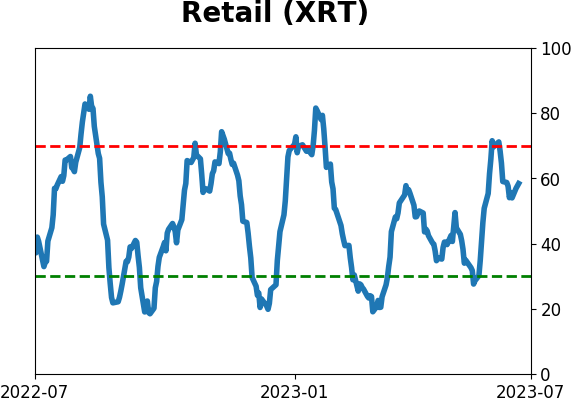
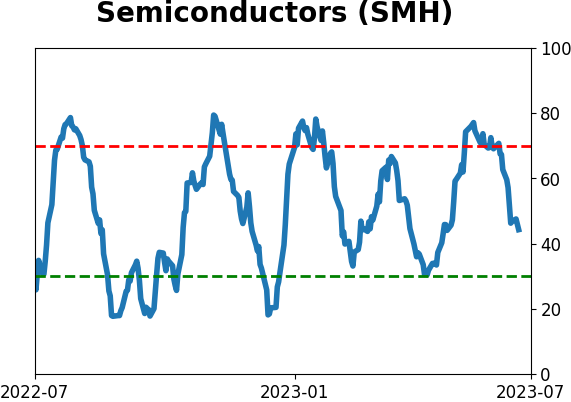
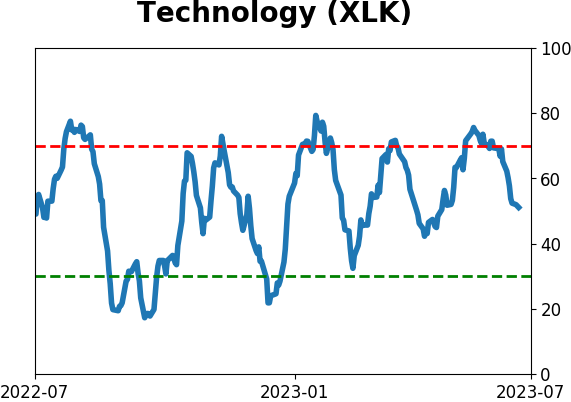
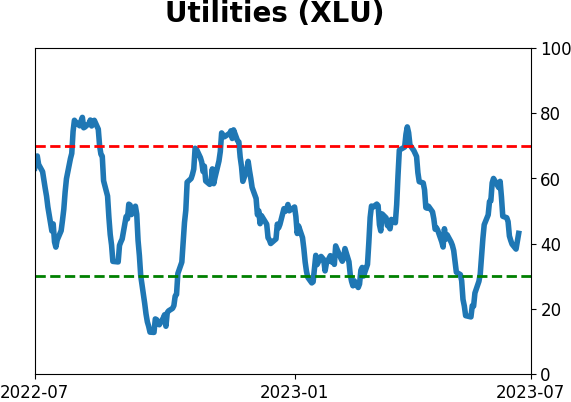
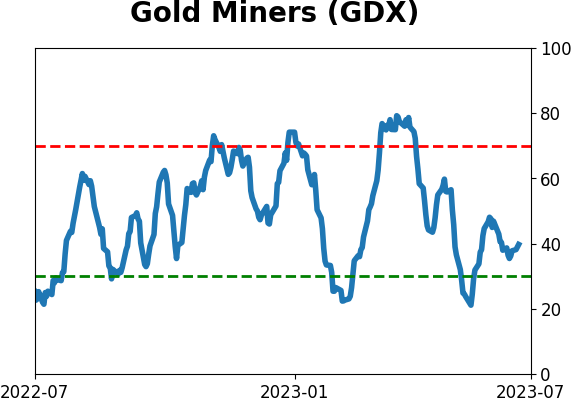
Sector ETF's - 10-Day Moving Average
|
|
|
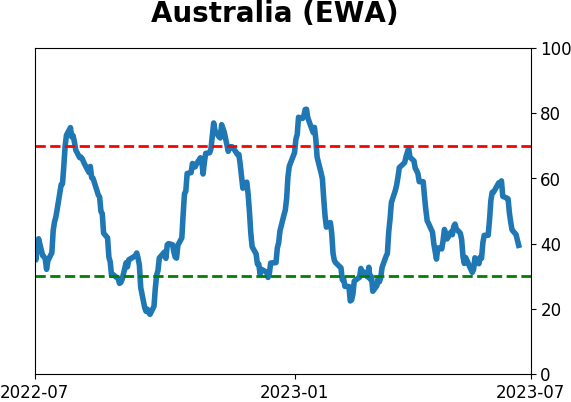
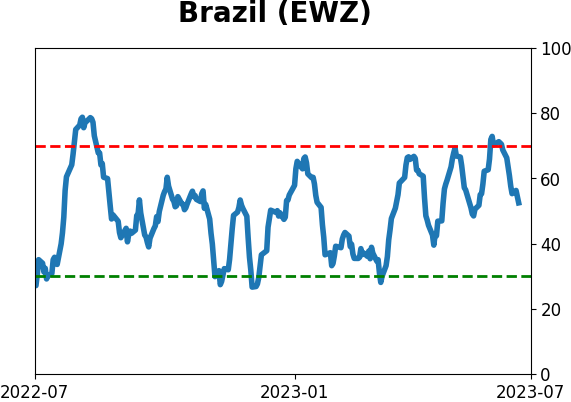
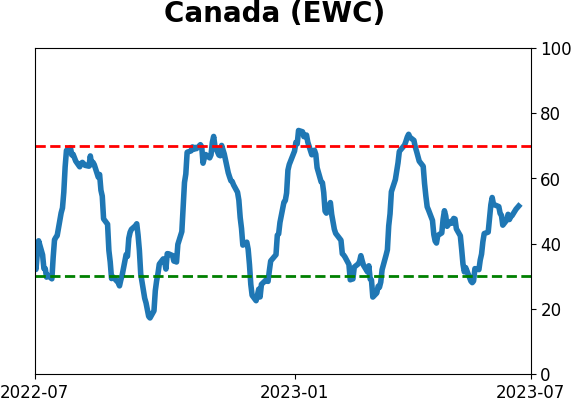
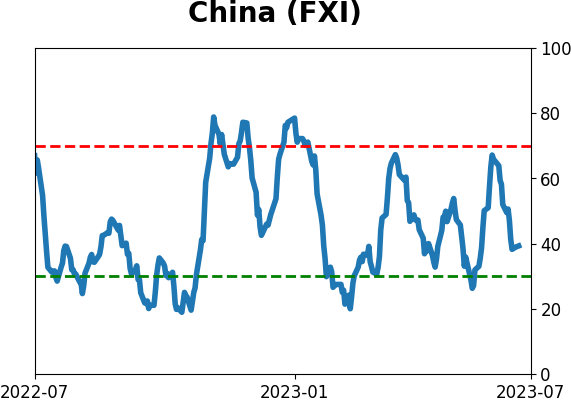
Country ETF's - 10-Day Moving Average
|
|
|
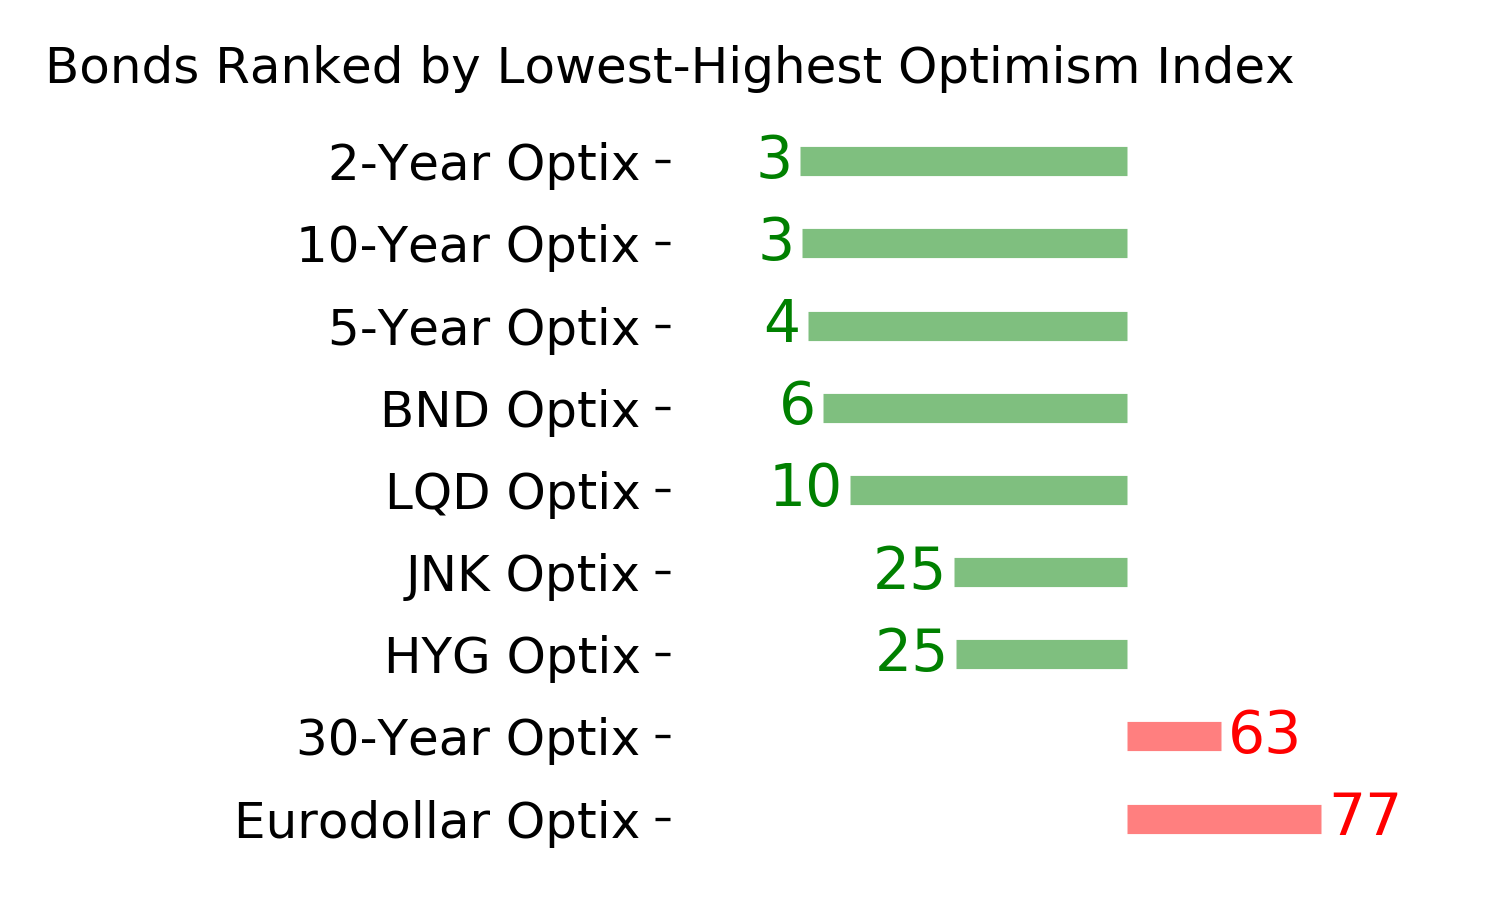
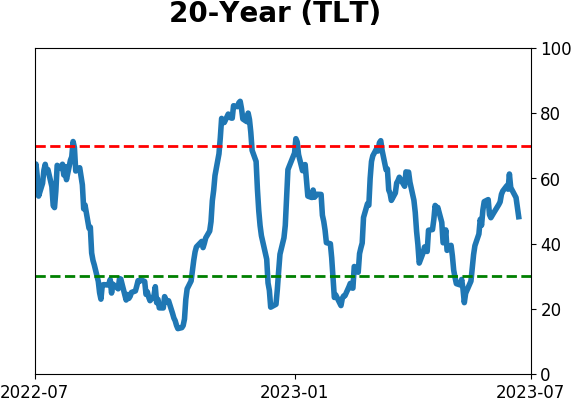
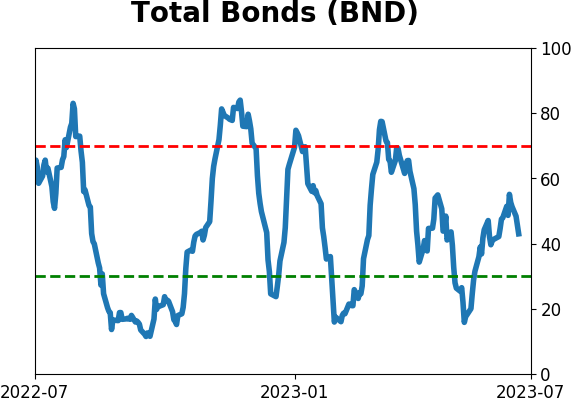
Bond ETF's - 10-Day Moving Average
|
|
|
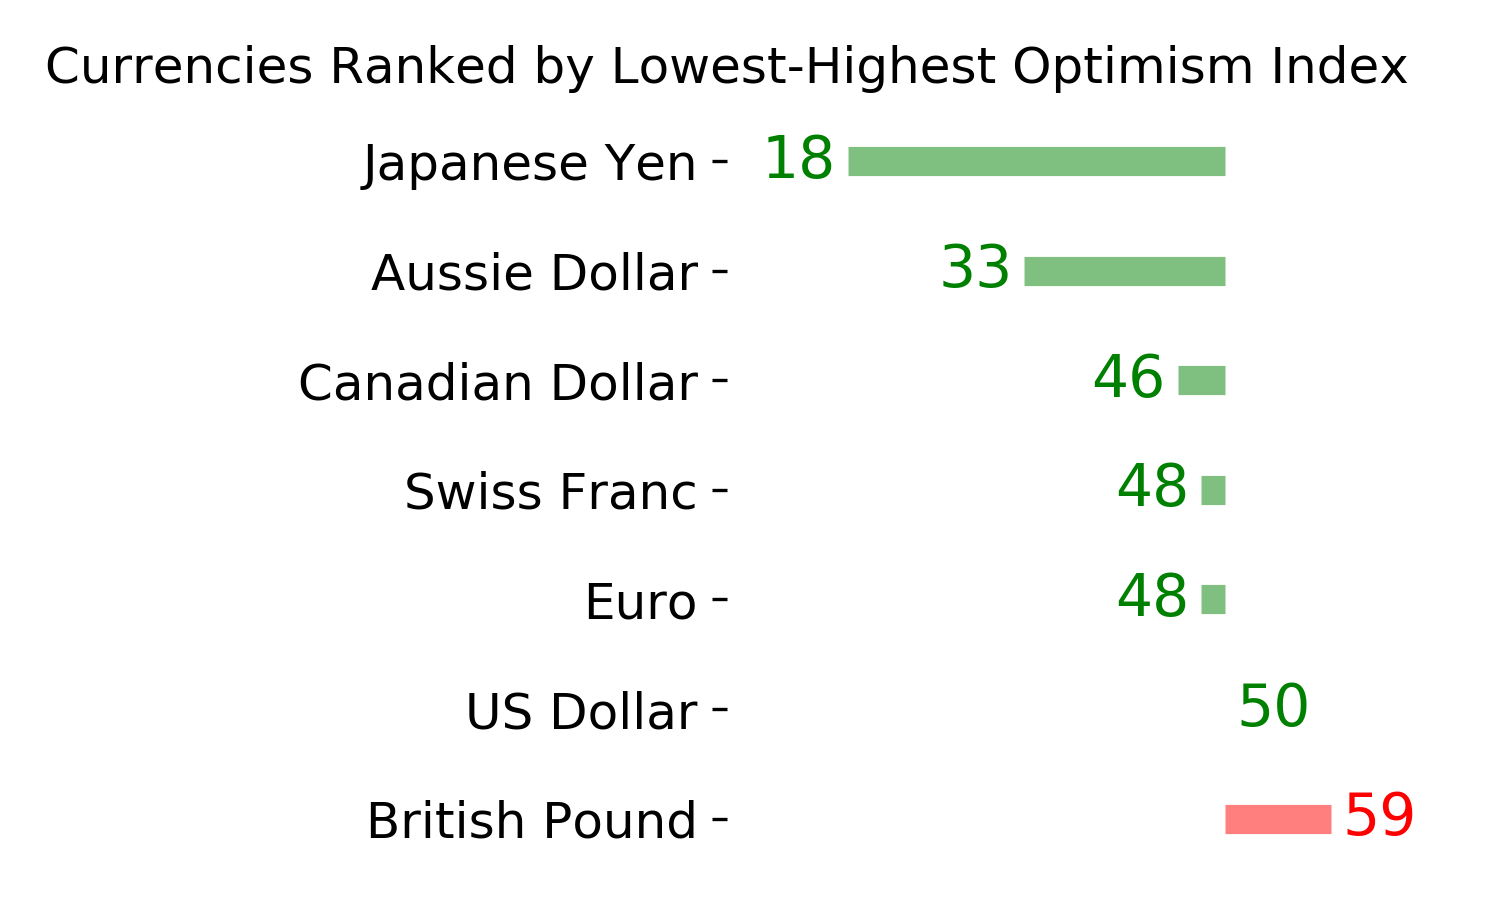
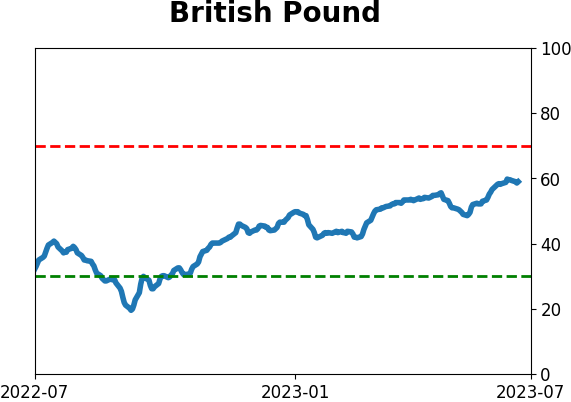
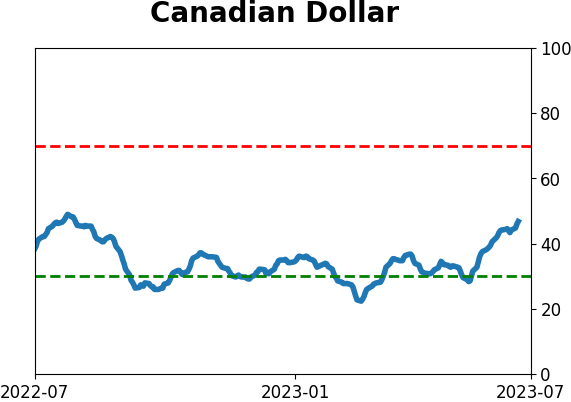
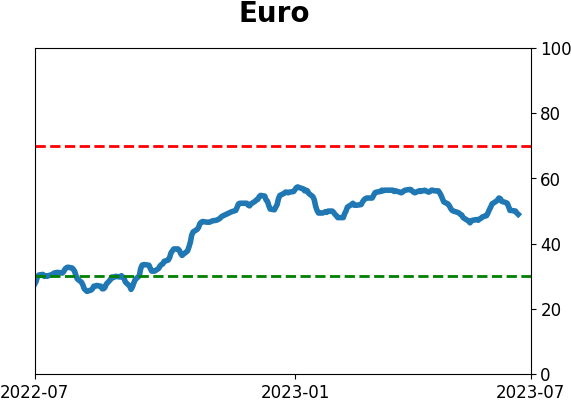
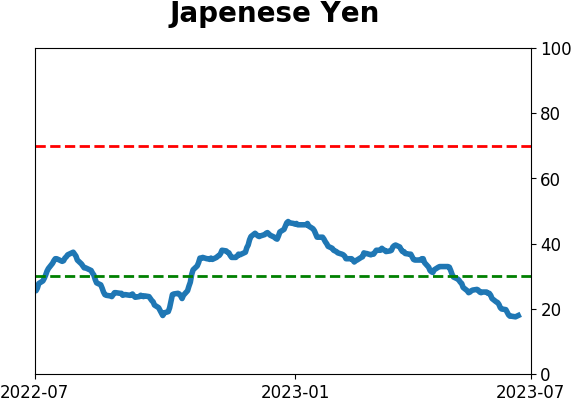
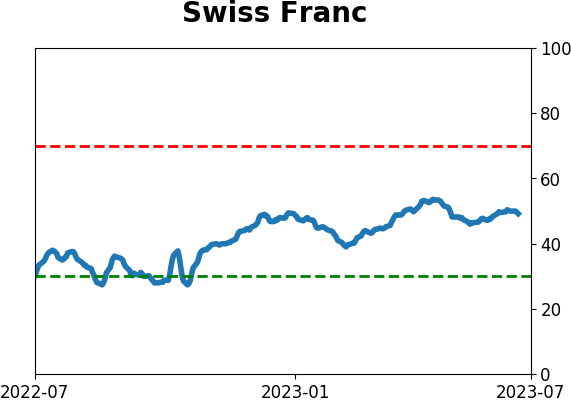
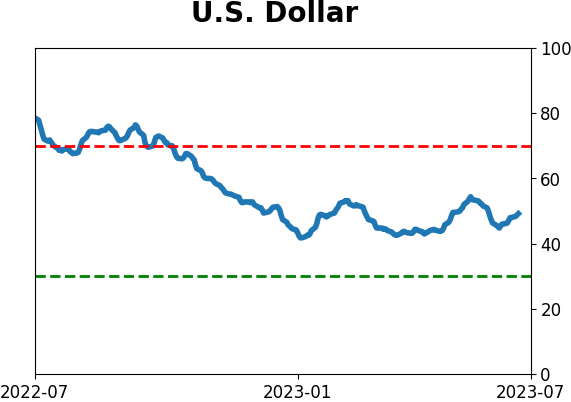
Currency ETF's - 5-Day Moving Average
|
|
|
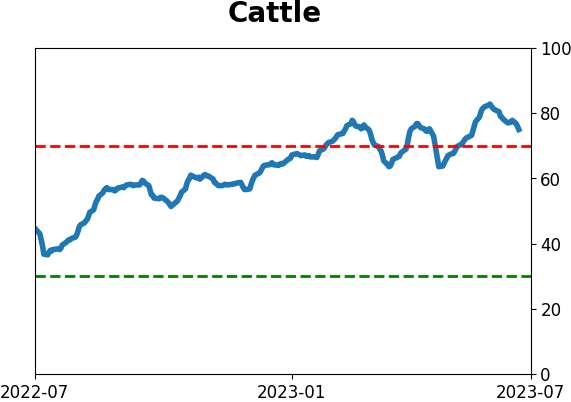
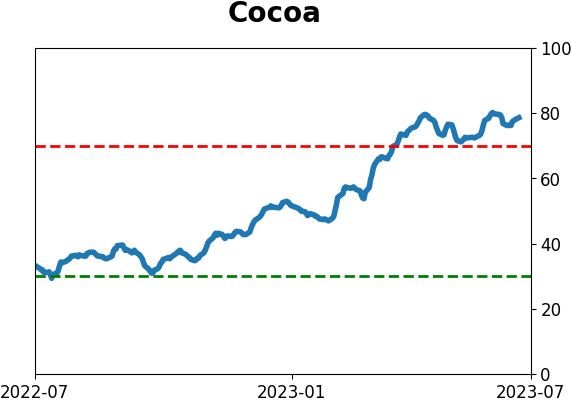
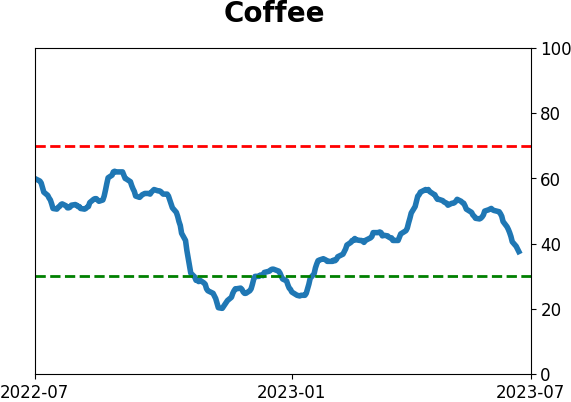
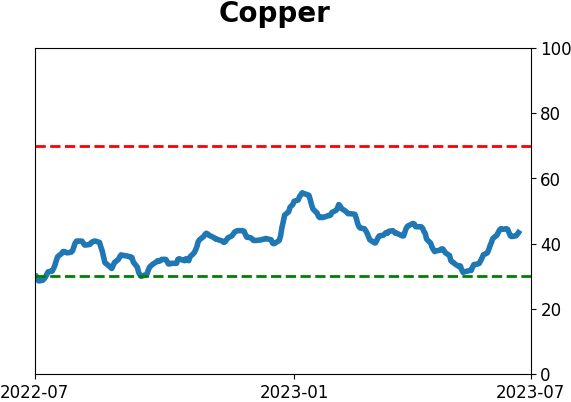
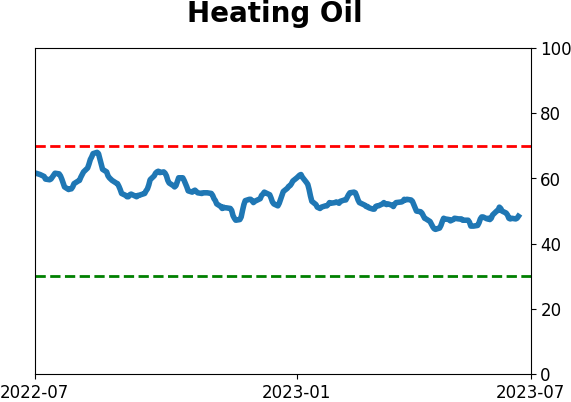
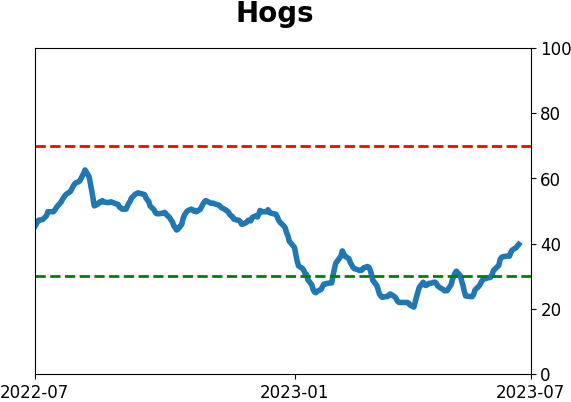
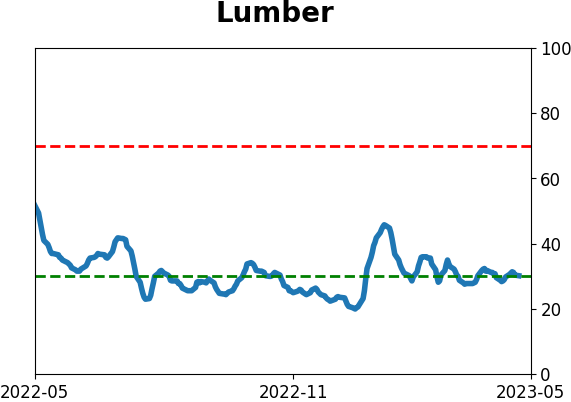
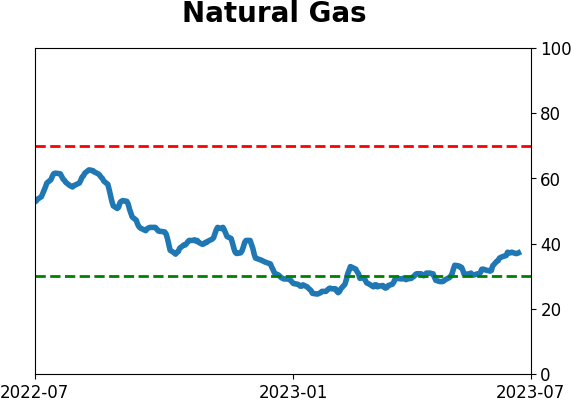
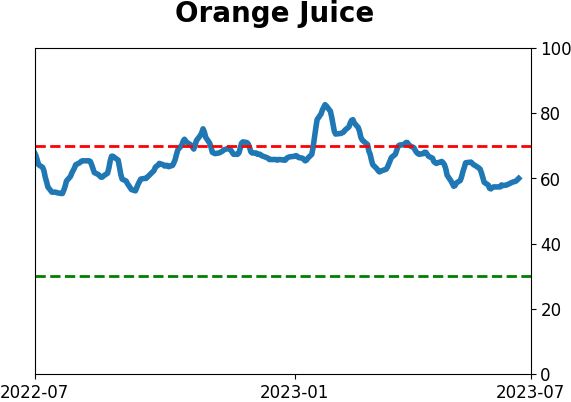
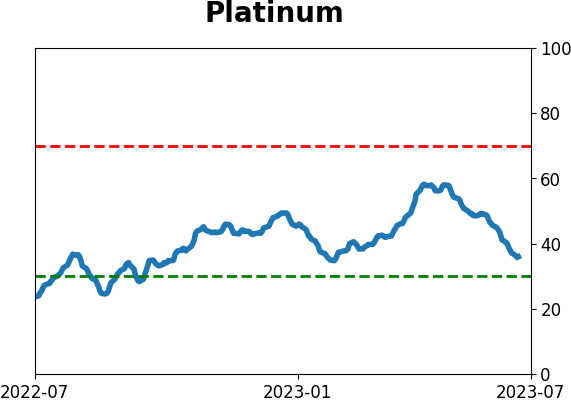
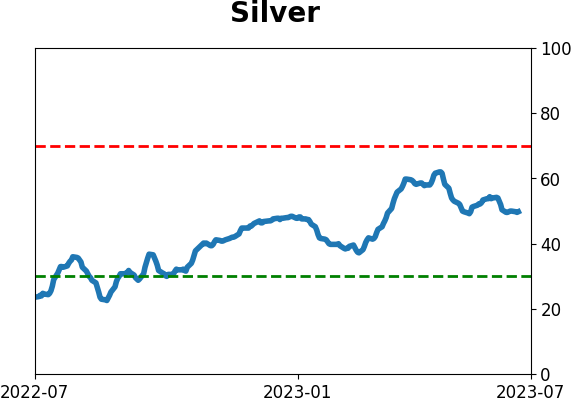
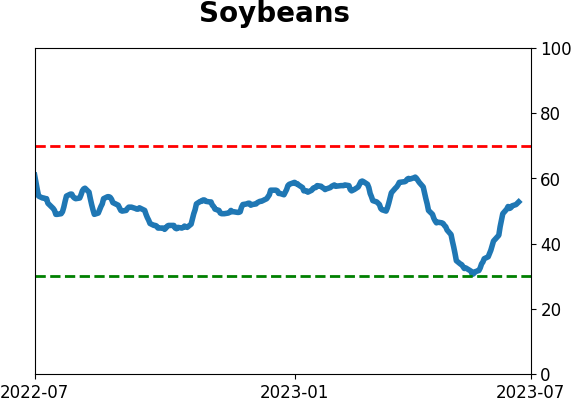
Commodity ETF's - 5-Day Moving Average
|
|