Headlines
|
|
A potential trading opportunity in beaten down Brazil:
Few markets have performed worse than the Brazilian stock market. Unchanged since 2008 and down almost 18% in the last year, investors have been wise to stay away. But opportunity is where you find it. And a short-term trading opportunity may be shaping up in the weeks ahead. We detail the setup herein.
|
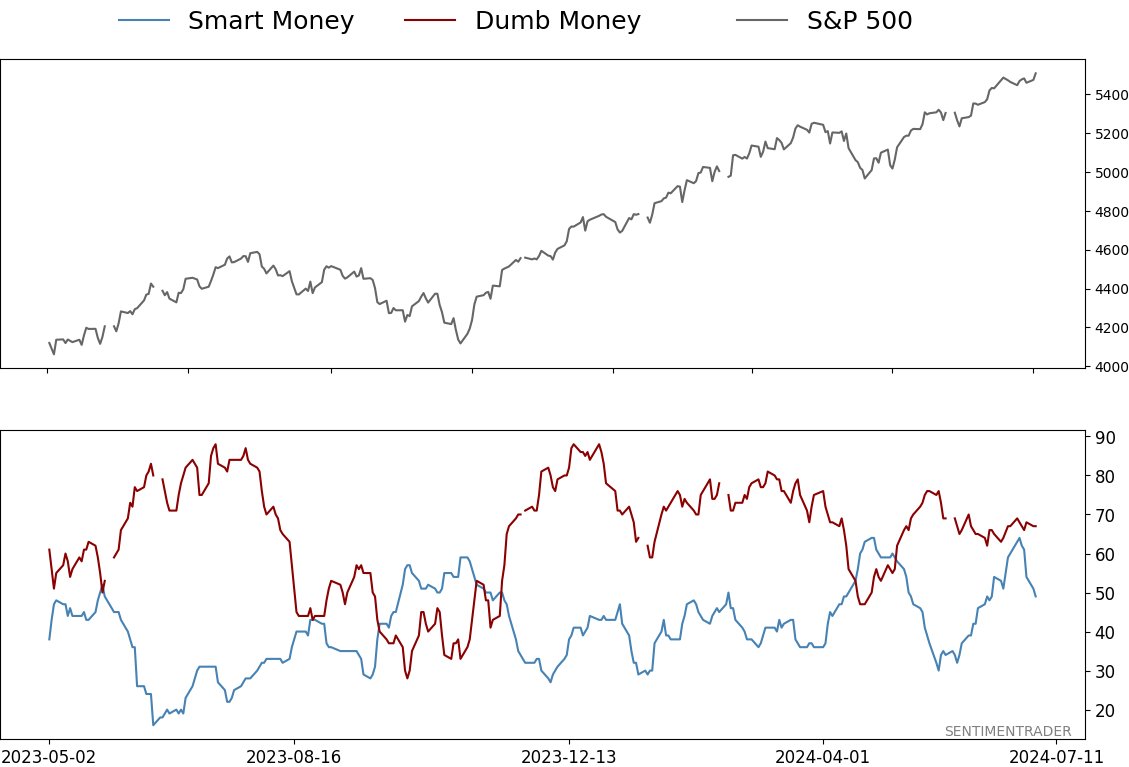
Smart / Dumb Money Confidence
|
Smart Money Confidence: 49%
Dumb Money Confidence: 67%
|
|
Risk Levels
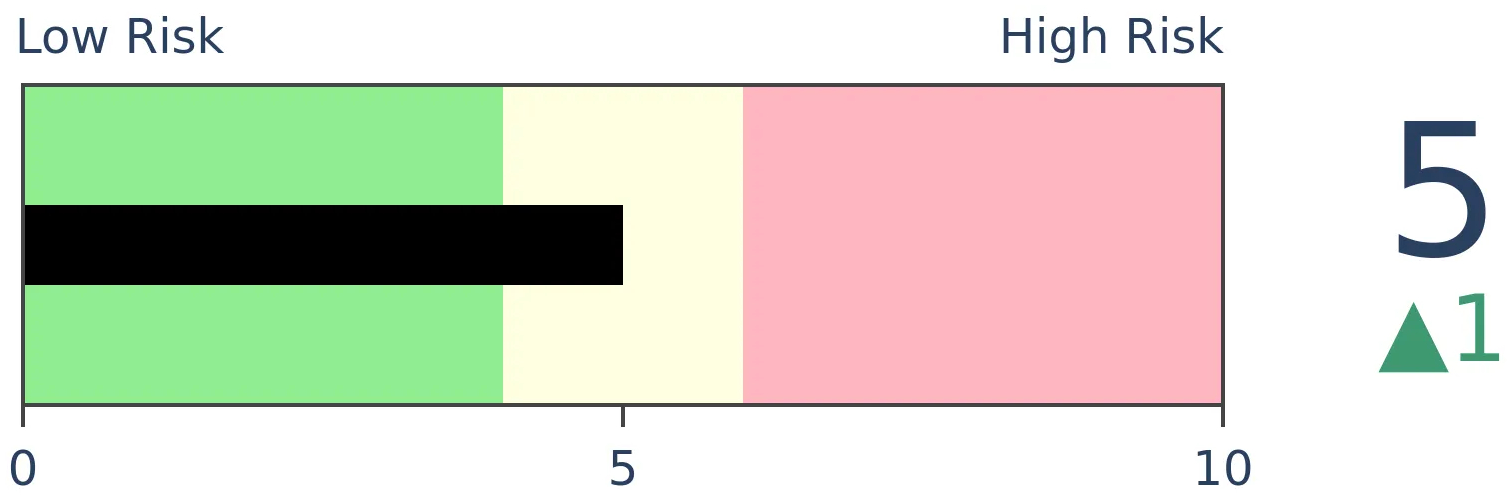
Stocks Short-Term

|
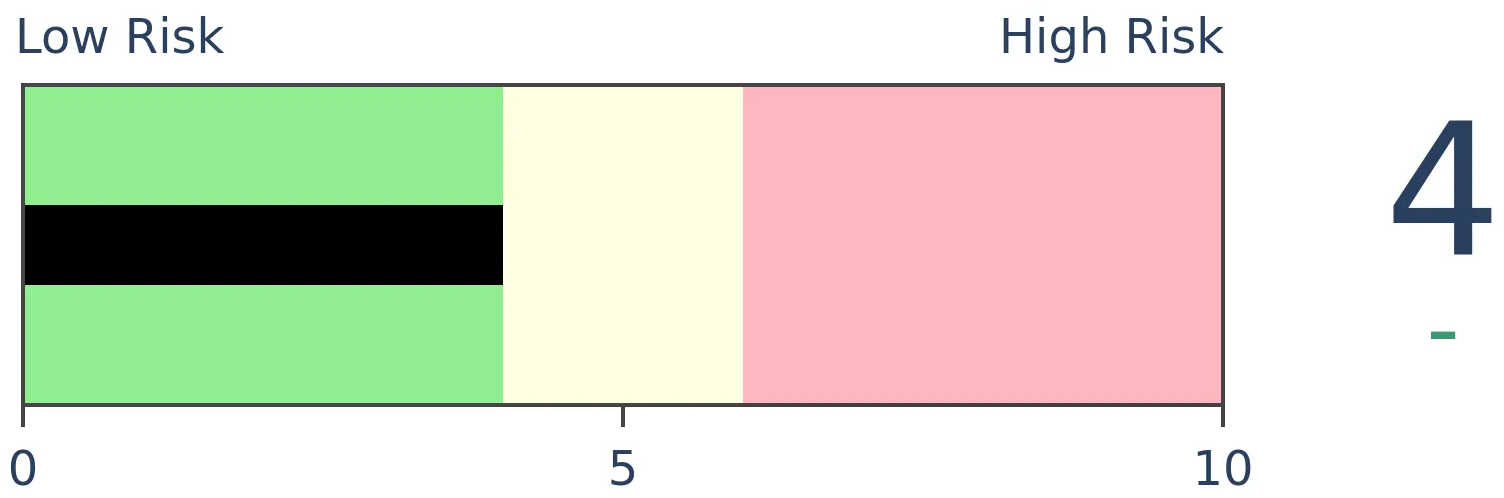
Stocks Medium-Term
|
|
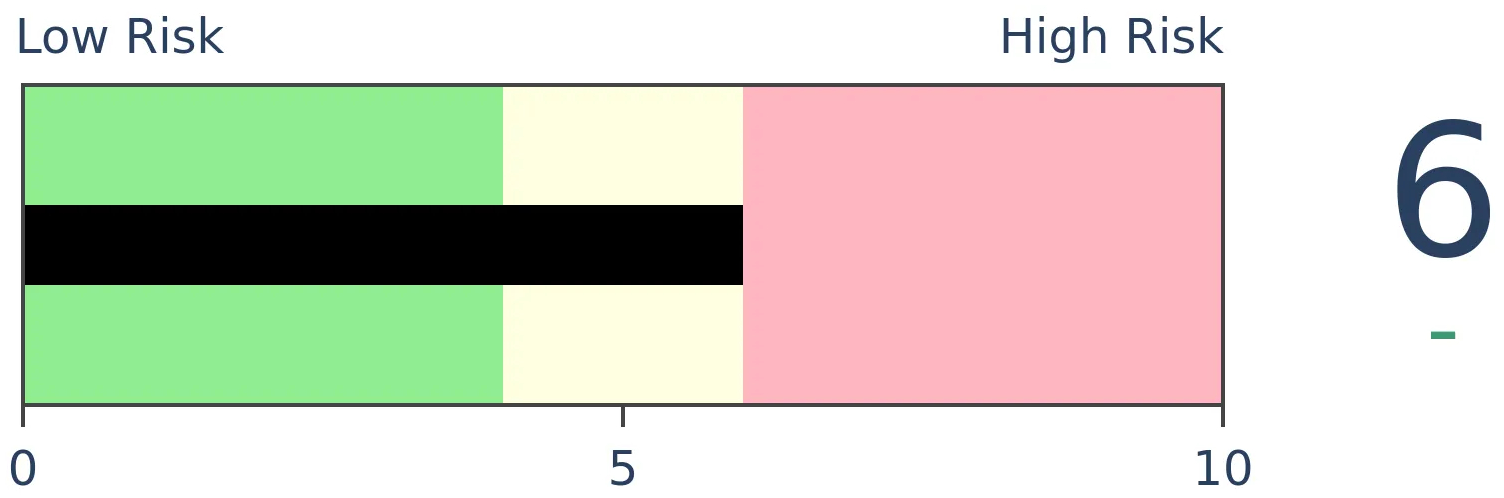
Bonds
|
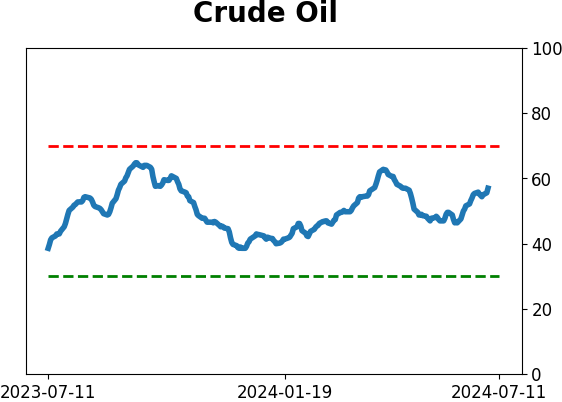
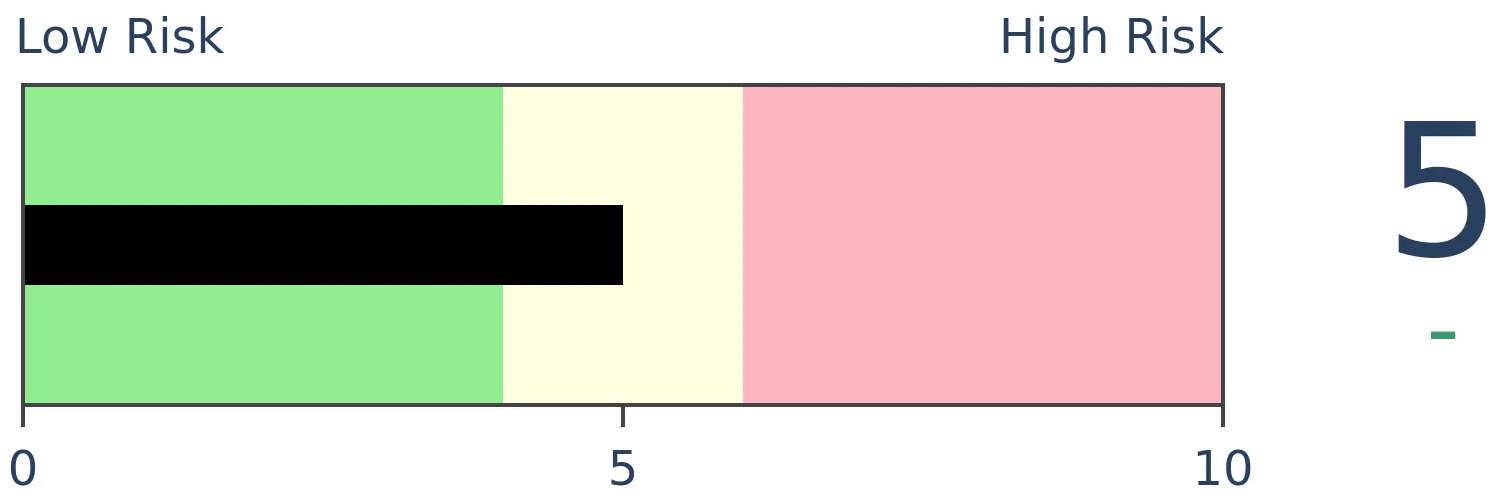
Crude Oil
|
|
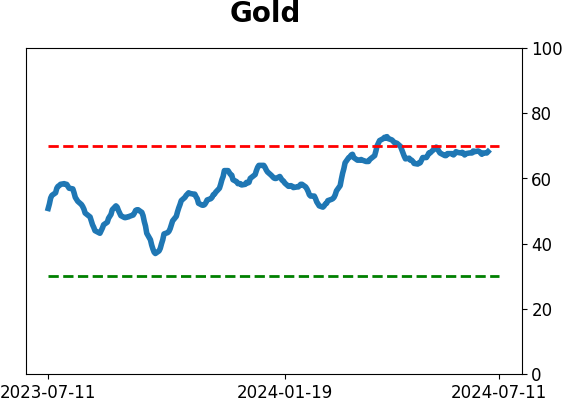
Gold
|
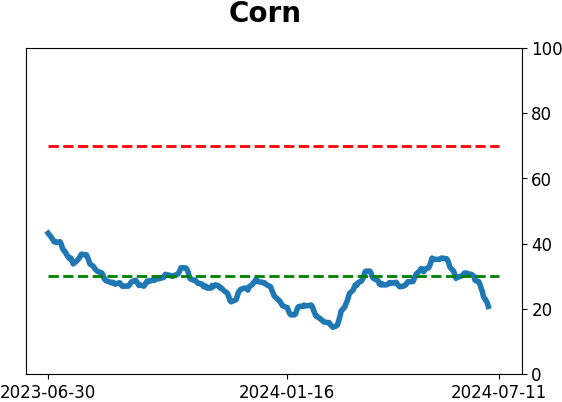
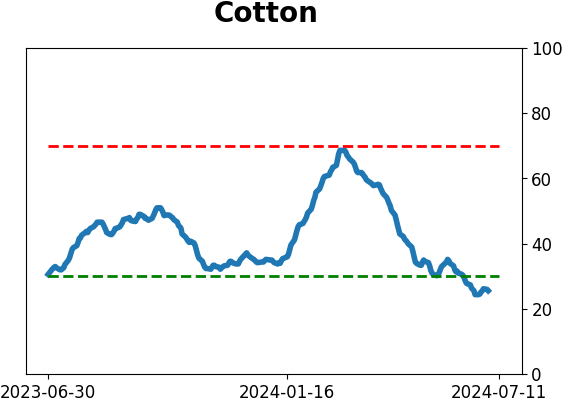
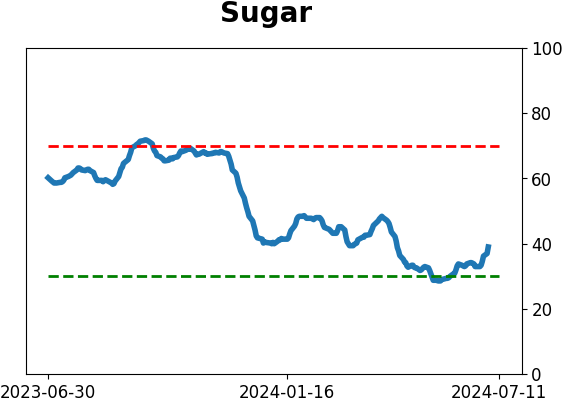
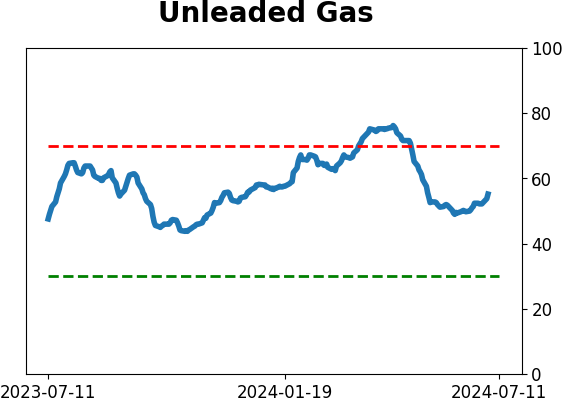
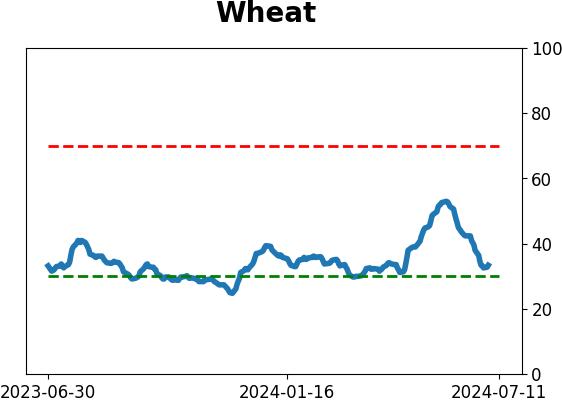
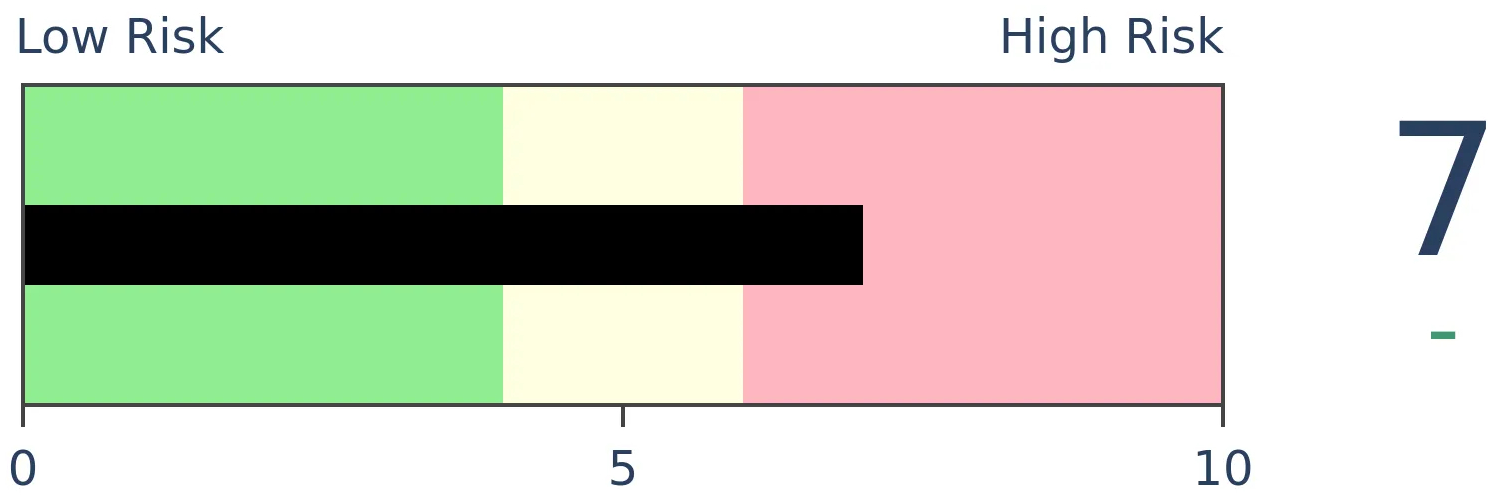
Agriculture
|
|
Research
By Jay Kaeppel
BOTTOM LINE
Few markets have performed worse than the Brazilian stock market. Unchanged since 2008 and down almost 18% in the last year, investors have been wise to stay away. But opportunity is where you find it. And a short-term trading opportunity may be shaping up in the weeks ahead. We detail the setup herein.
FORECAST / TIMEFRAME
None
|
Key points
- The Brazilian stock market has not participated in the global bull market
- Ticker EWZ has been unchanged over the last sixteen years and has lost almost 18% in the previous twelve months
- Despite all this, a brief short-term trading opportunity may be forming for speculative traders
It's not been a good year (or decade and a half) for Brazilian stocks
The chart below shows that the Ishares Msci Brazil ETF (ticker EWZ) has struggled mightily despite generally higher stock prices around the globe.
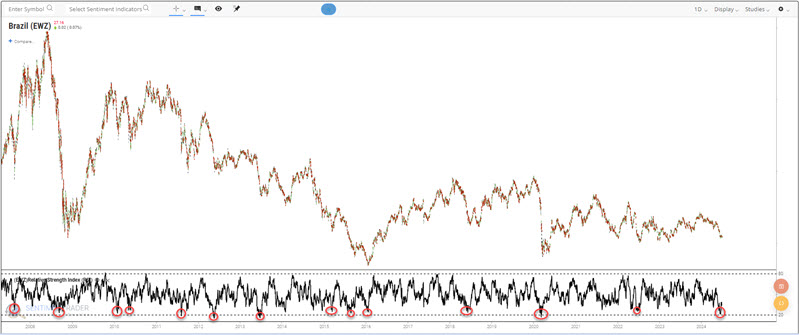
EWZ has been "dead money" for the past sixteen years. Ticker EWZ is unchanged from November 2008, a period that has seen the S&P 500 Index rally over 640%. On a slightly more hopeful note, the 4-period RSI for ticker EWZ recently reached an extremely oversold level that has often marked a short-term bottom in price action (see the red circles in the bottom clip of the chart above).
Is this any reason to consider a bullish position in EWZ? When combined with seasonality, perhaps, but only briefly and strictly for short-term traders.
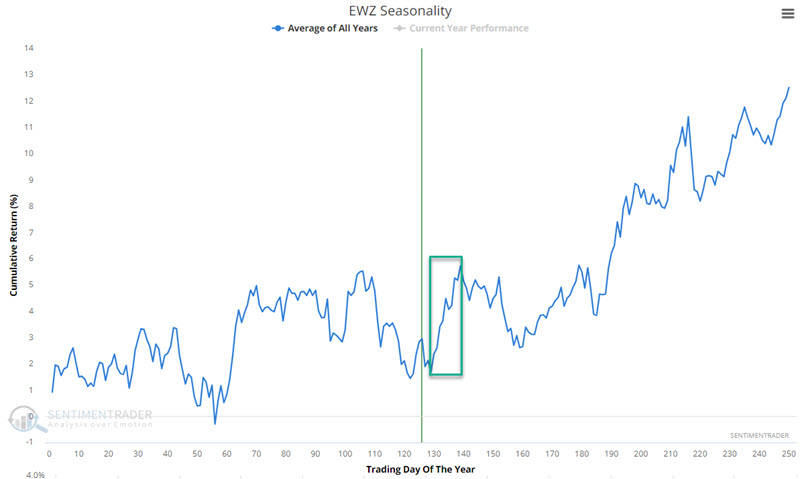
A brief favorable seasonal with as a possible port in the storm
In the Annual Seasonal Trend chart below for EWZ, we see a brief favorable period that extends from the close of Trading Day of the Year (TDY) #129 through TDY #139. For 2024, this period extends from the close on 2024-07-08 through 2024-07-22.
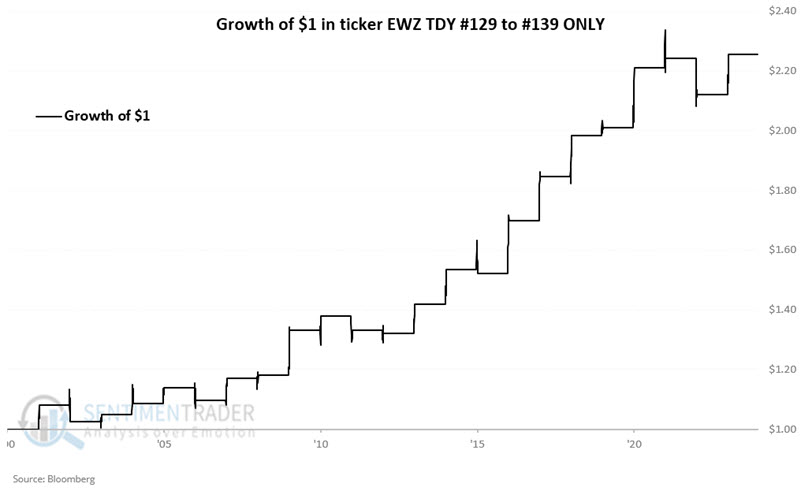
The chart below displays the hypothetical growth of $1 invested in EWZ only during this 10-day trading period every year since 2001.
The table below summarizes EWZ's performance during this period.
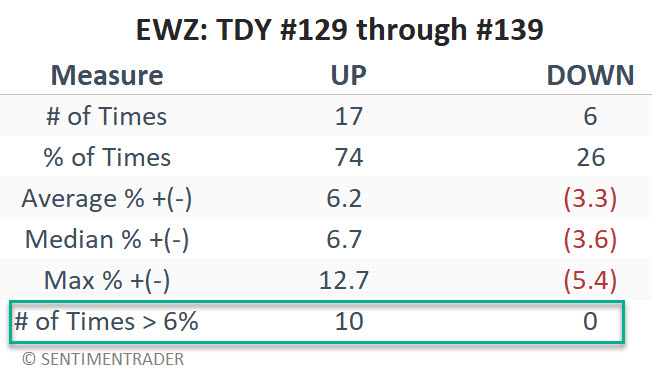
This period has seen higher prices roughly three out of every four years. The worst loss was -5.4% (a reasonable risk for many short-term traders), and 6% or more gains have occurred ten times in 23 years.
What the research tells us…
Is this a great "investment opportunity?" Not by most investors' definition. Could the Brazilian stock market be "undervalued" and offer an excellent long-term buying opportunity? Anything is possible, but that is absolutely not the argument being made here. The information above suggests nothing more than a potential opportunity for short-term traders willing to speculate that a beaten-down security may experience a brief respite. The bottom line is that a short "pop" from an oversold level in the Brazilian stock market is possible in the next several weeks. But speculative traders only need apply.
Indicators at Extremes
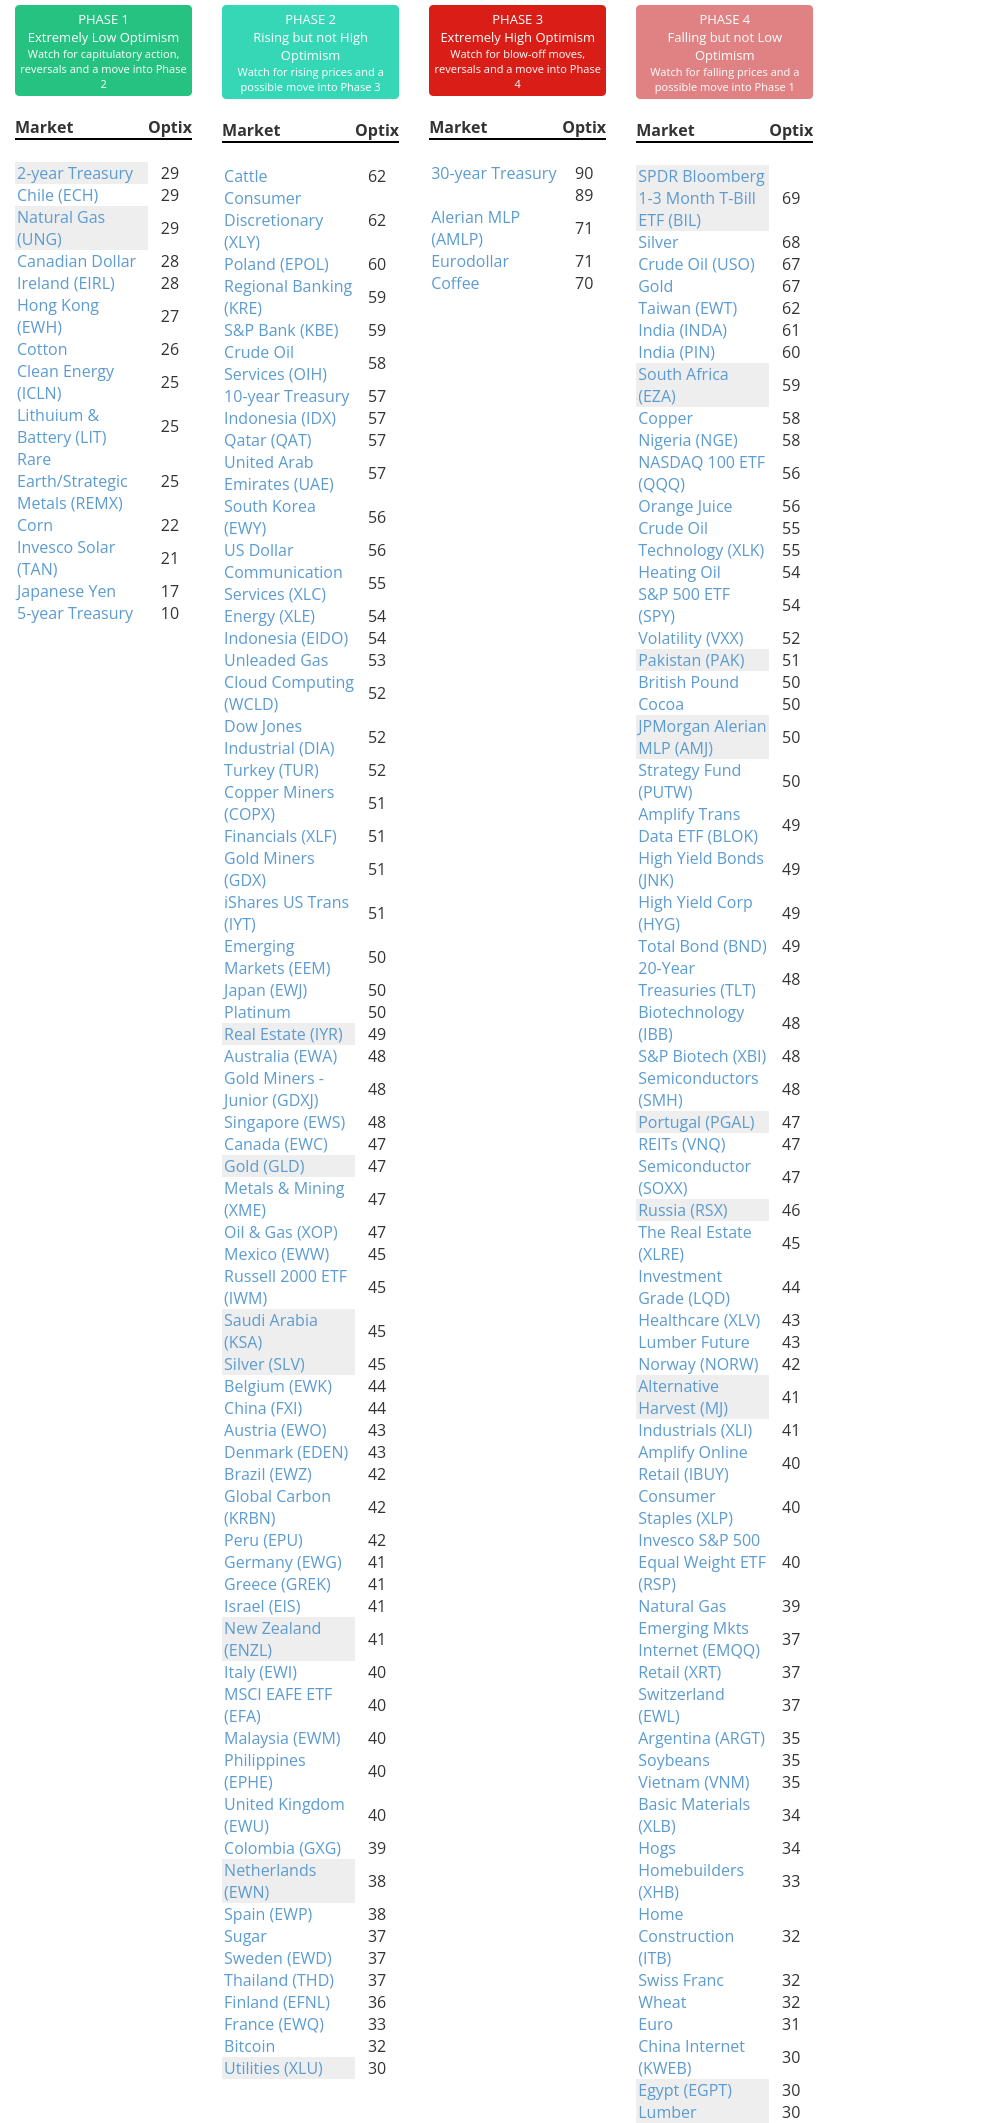
Phase Table
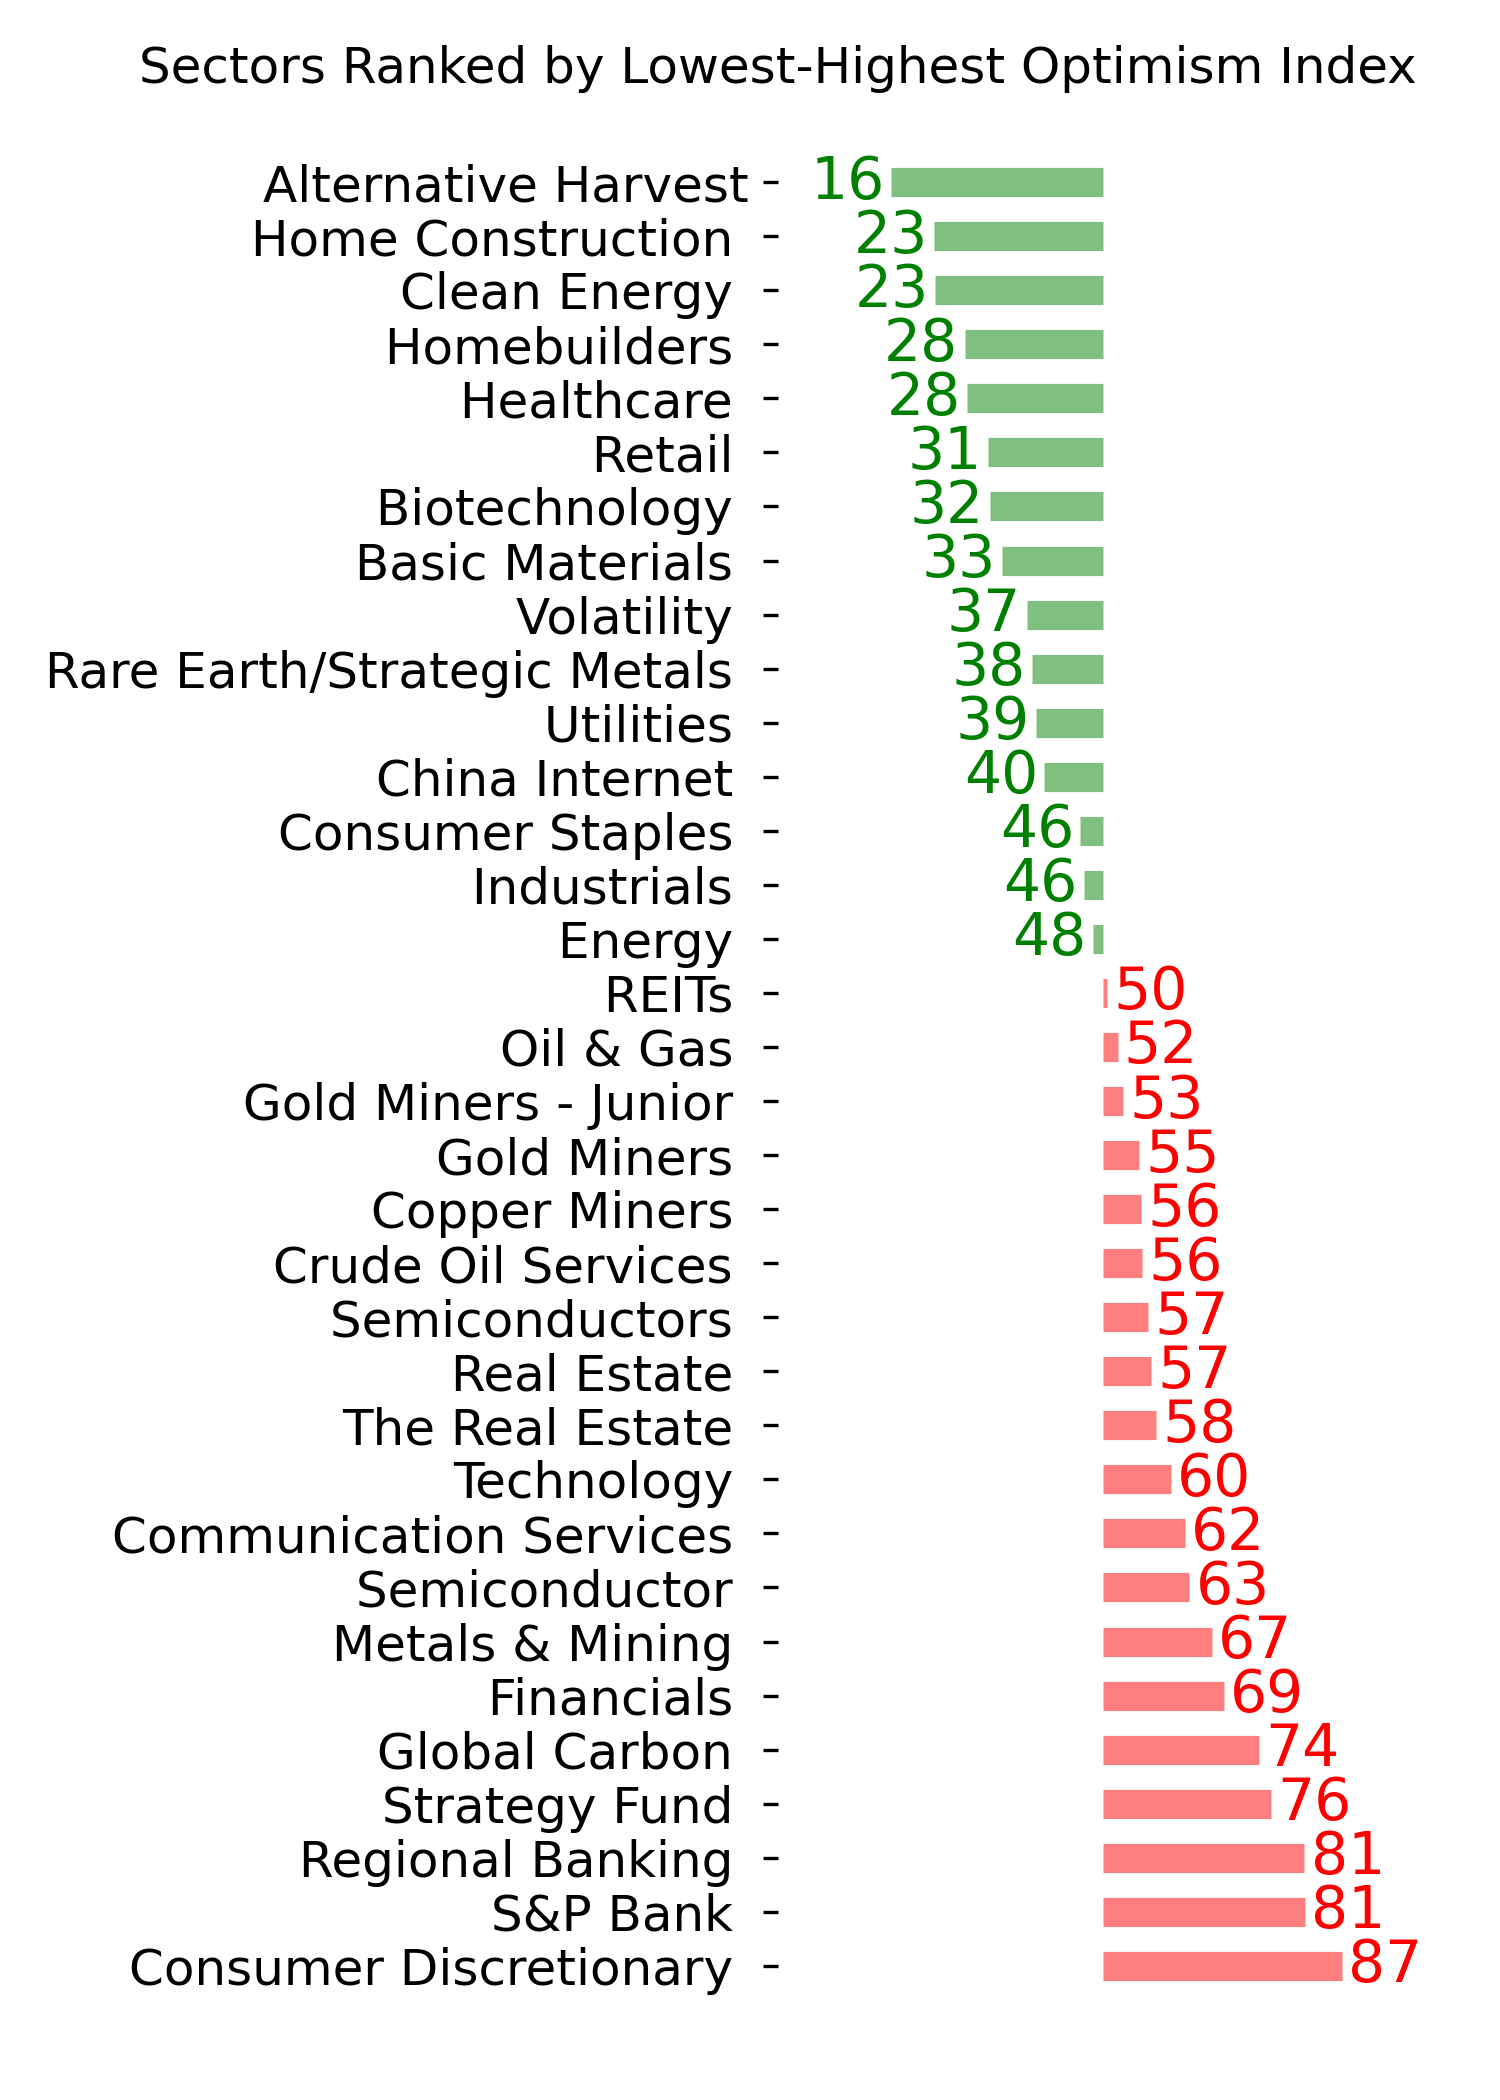
Ranks
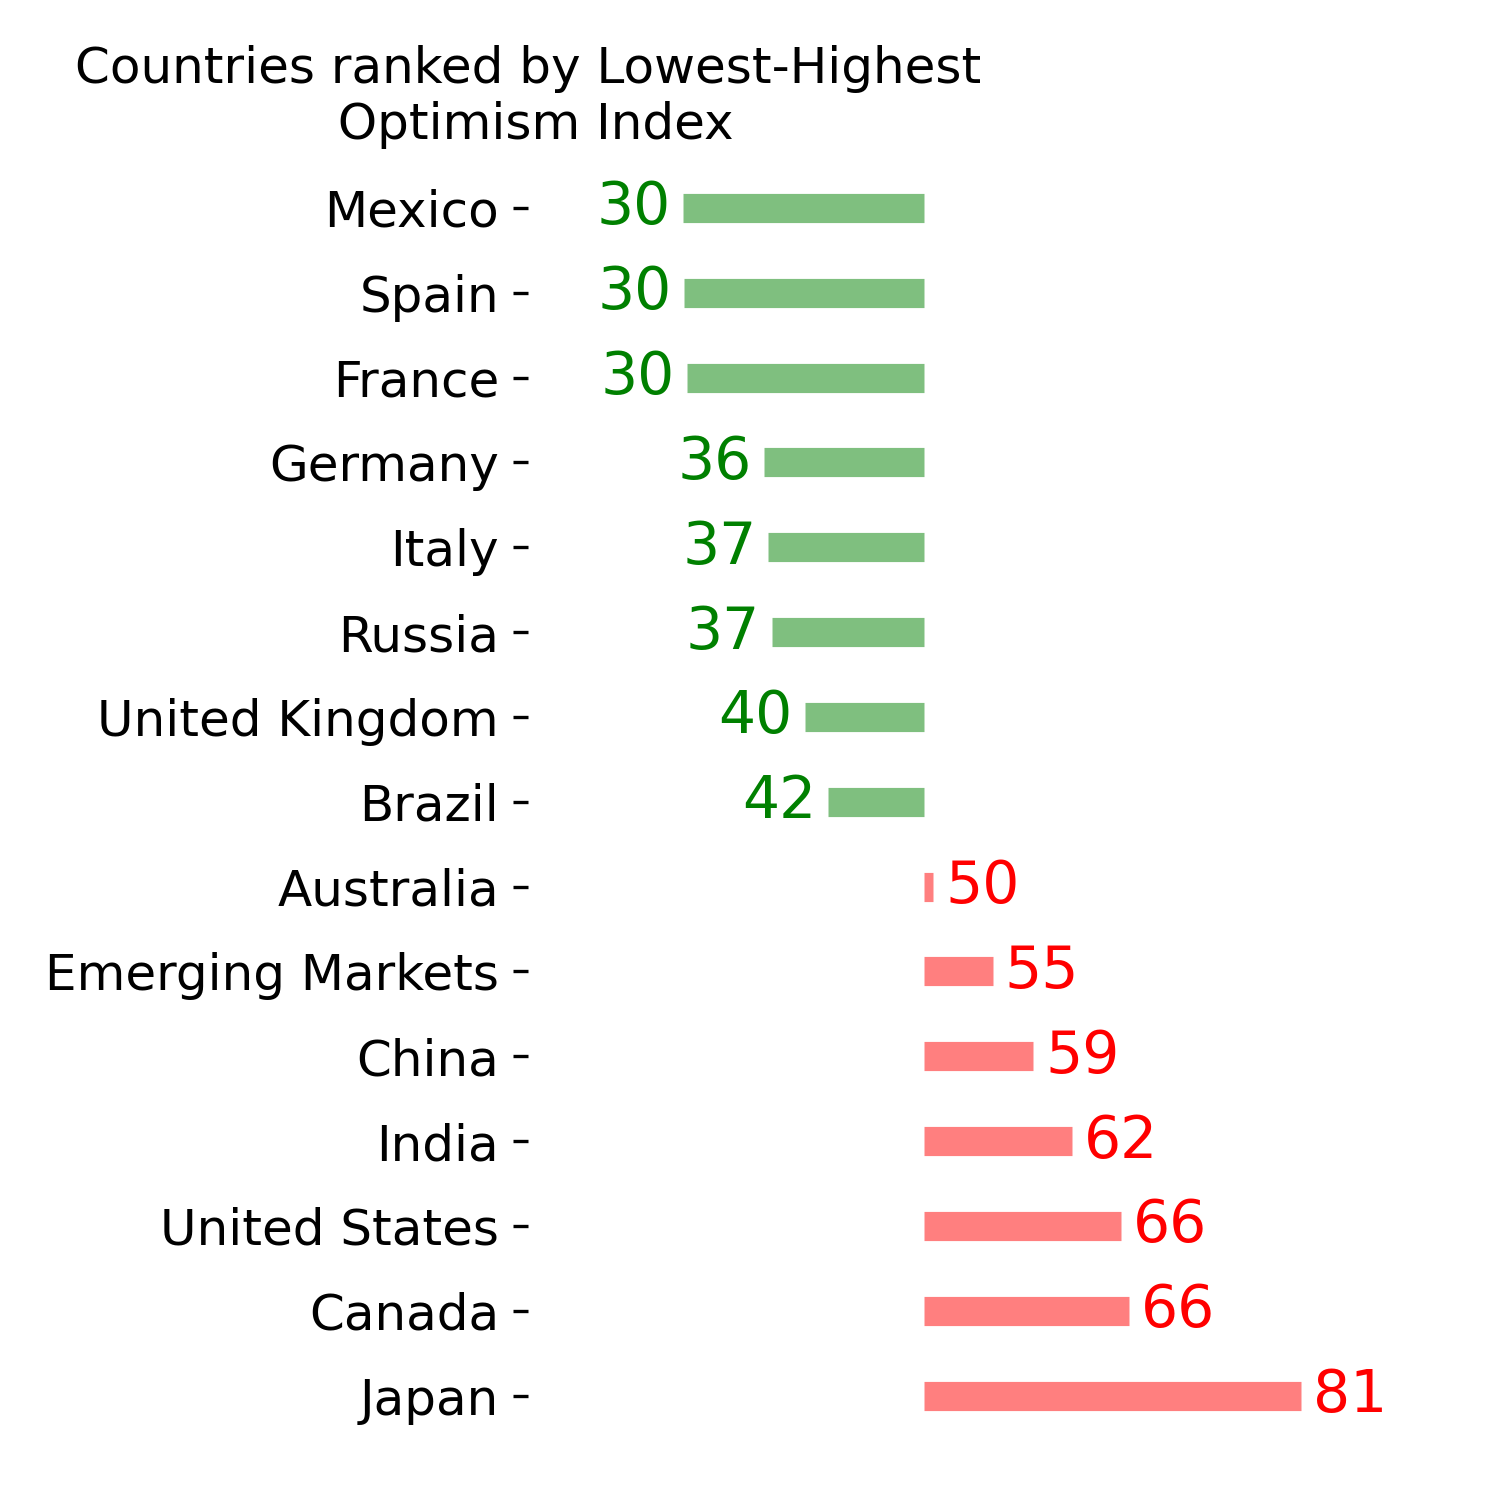
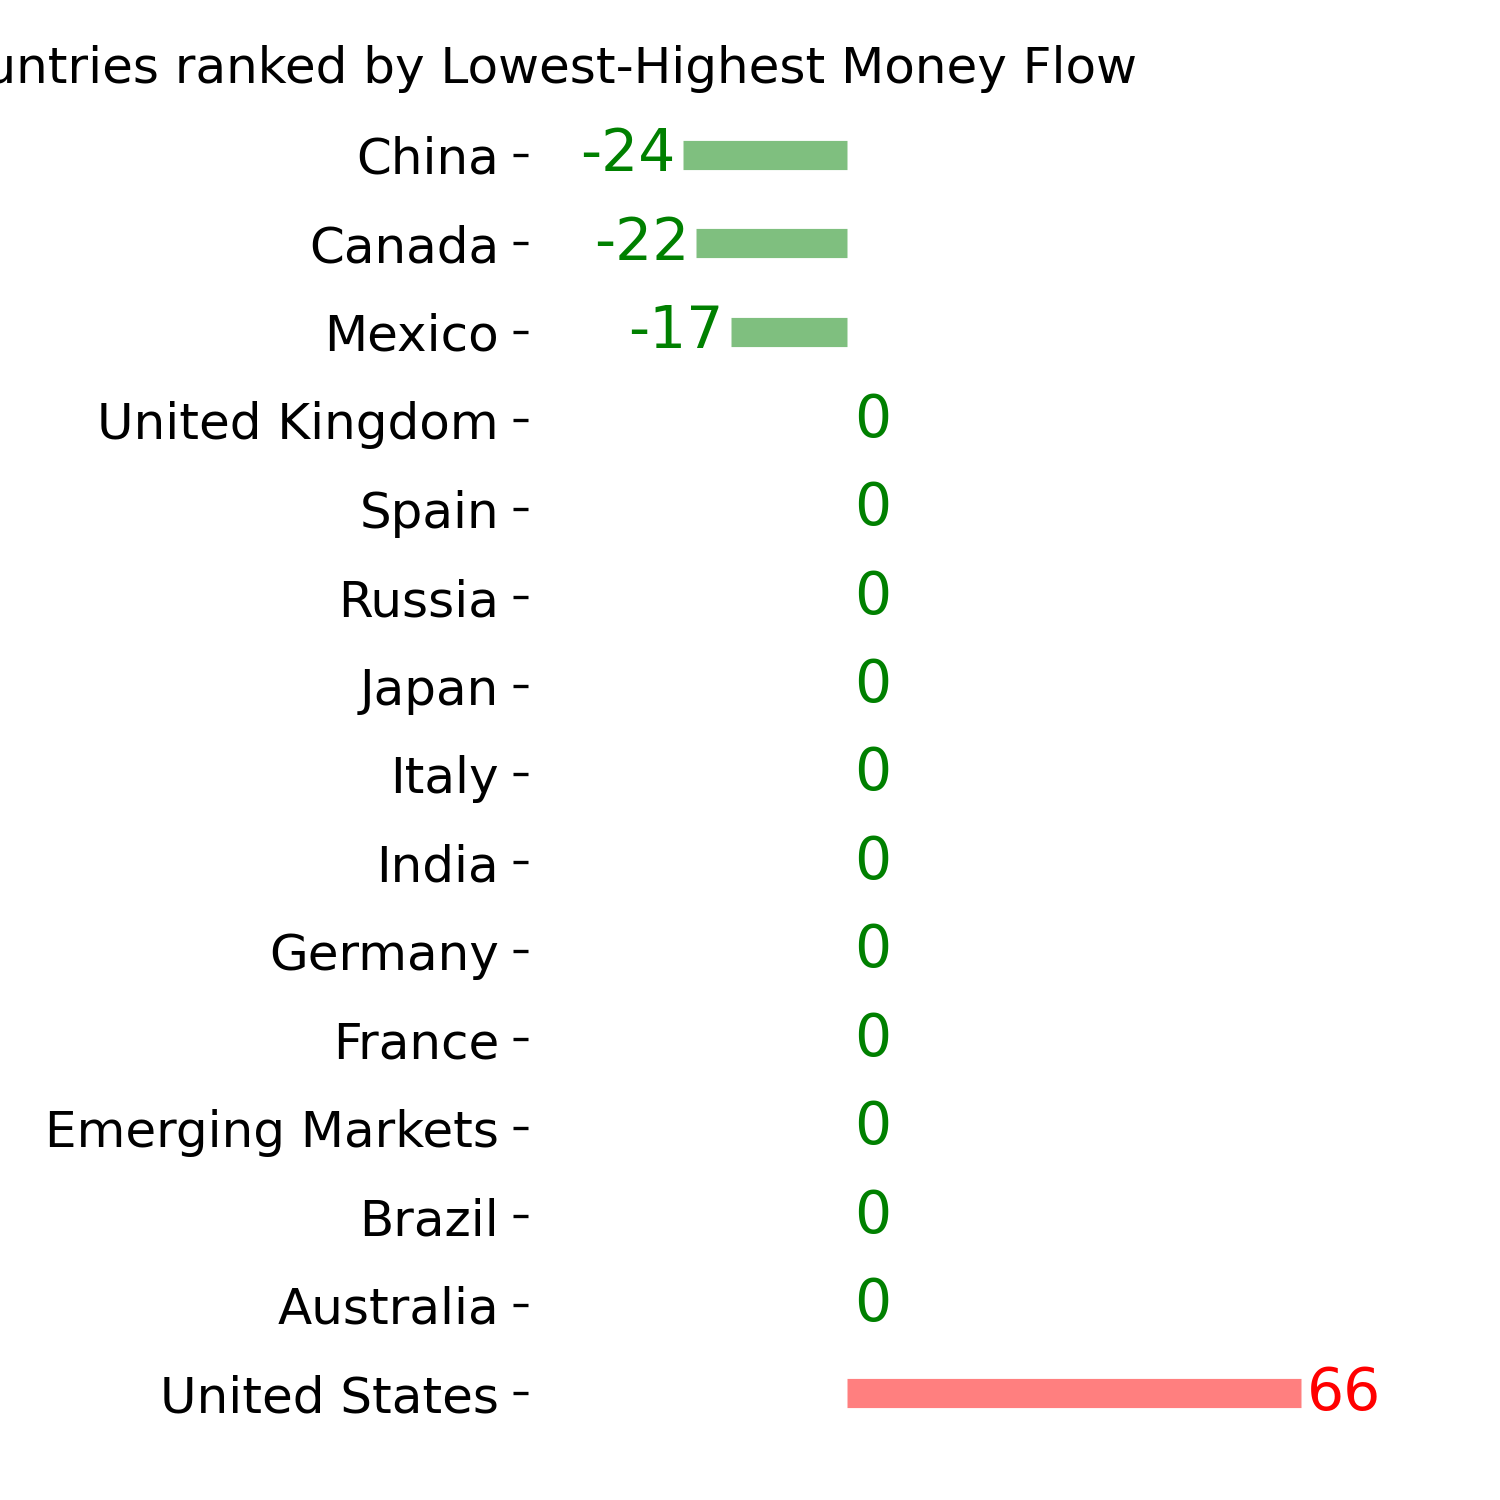
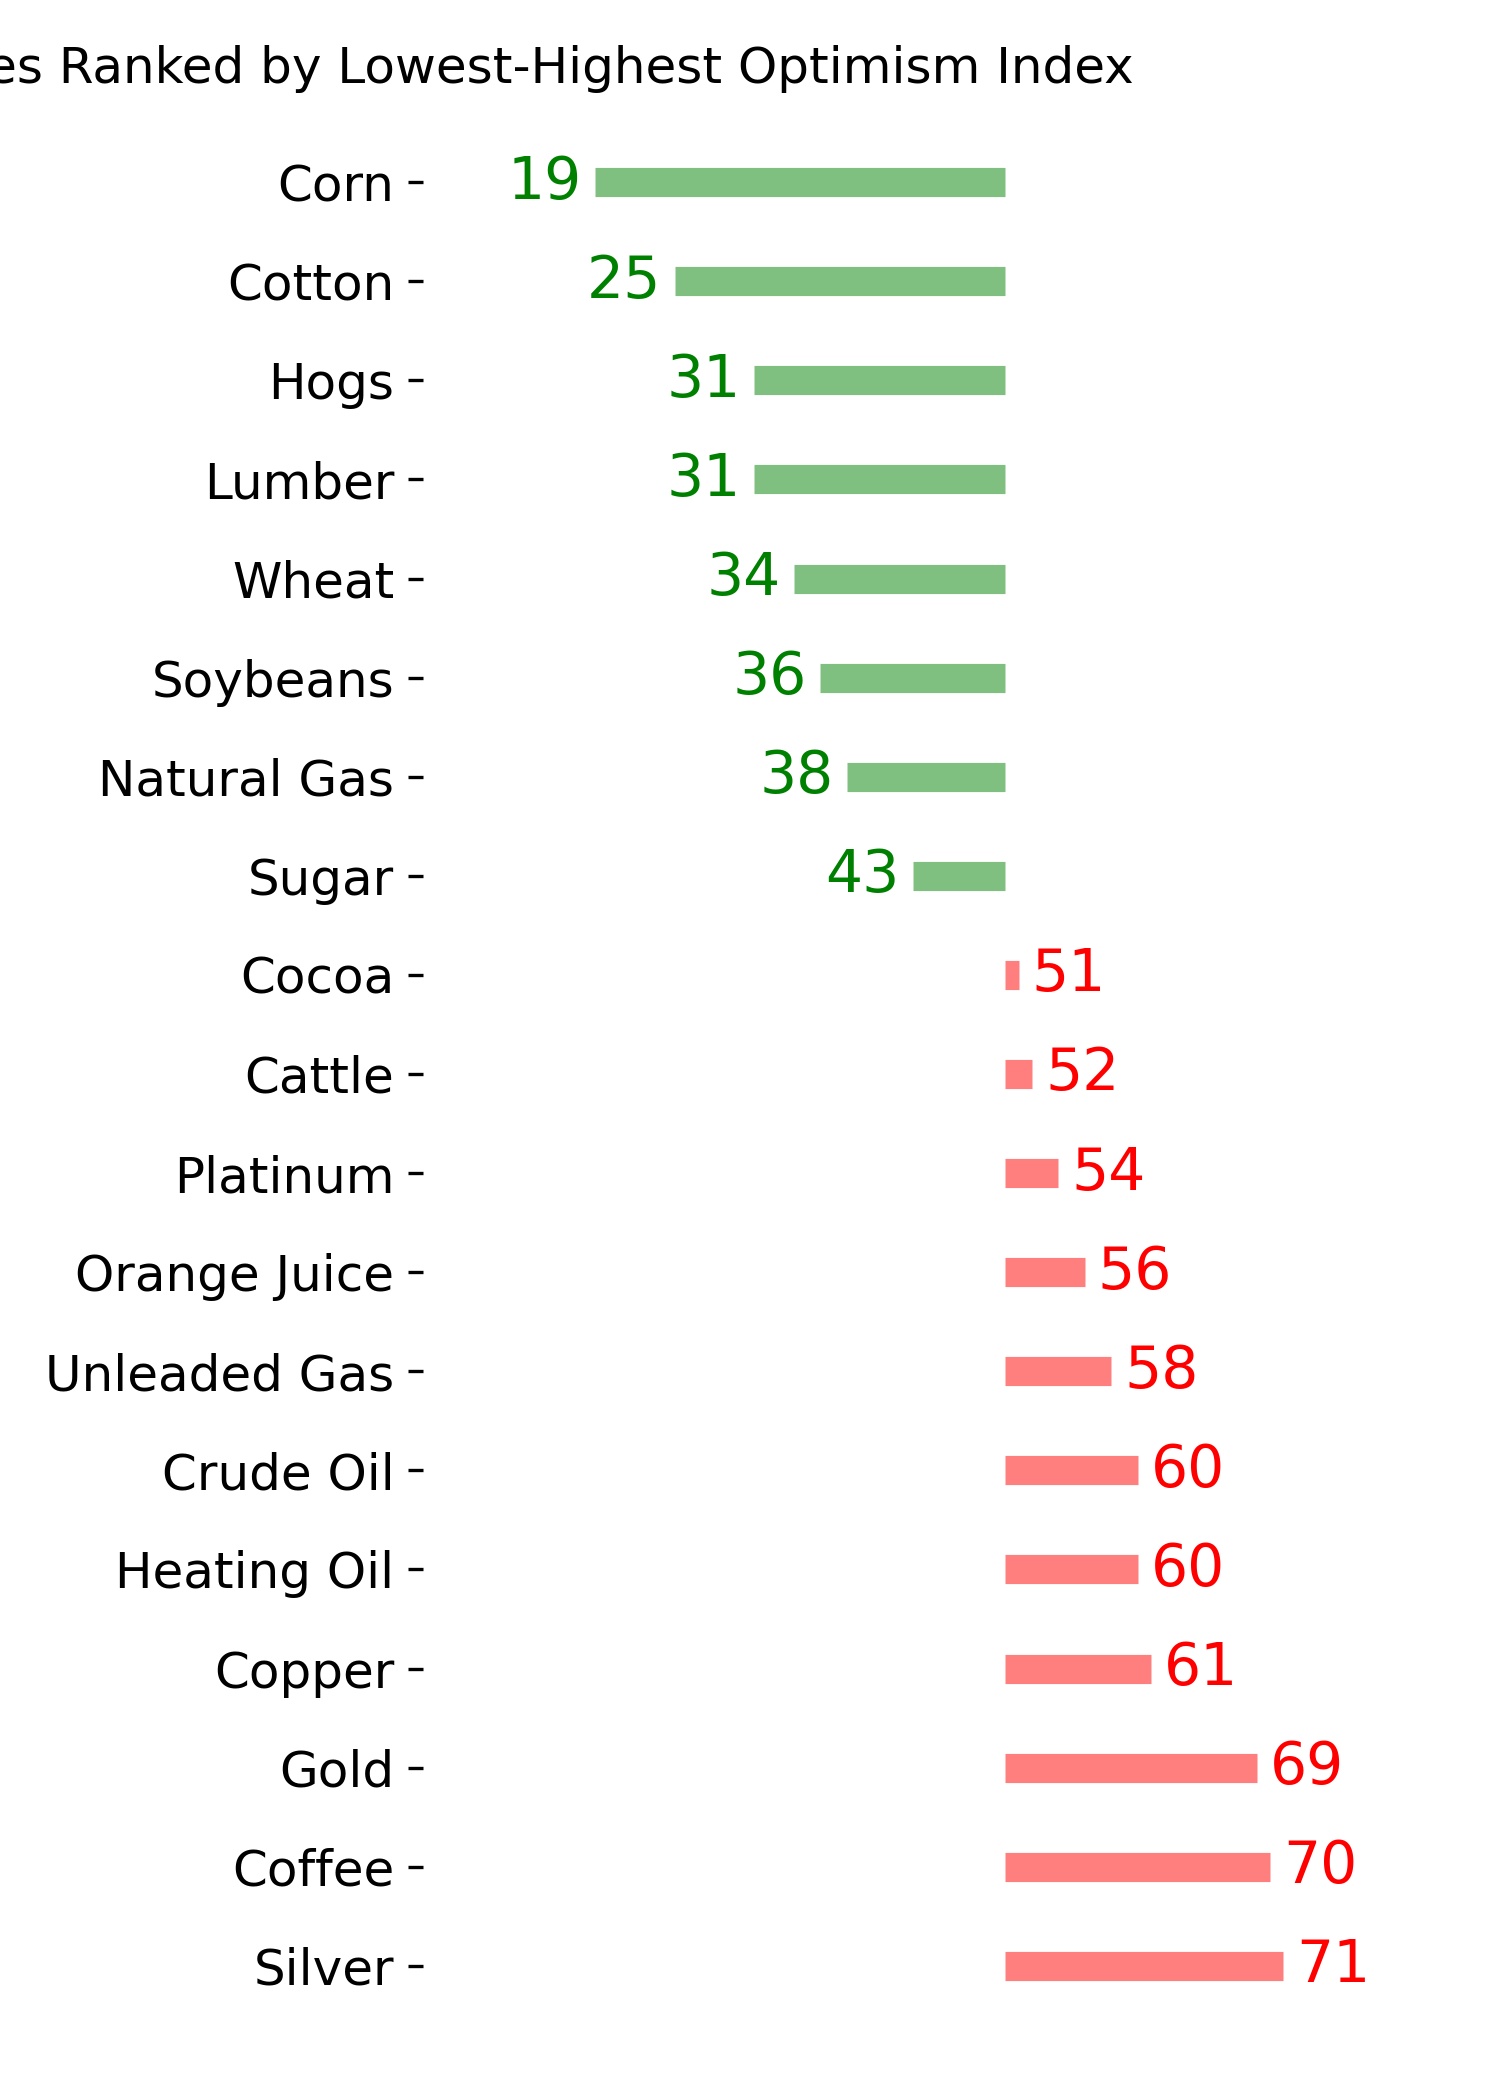
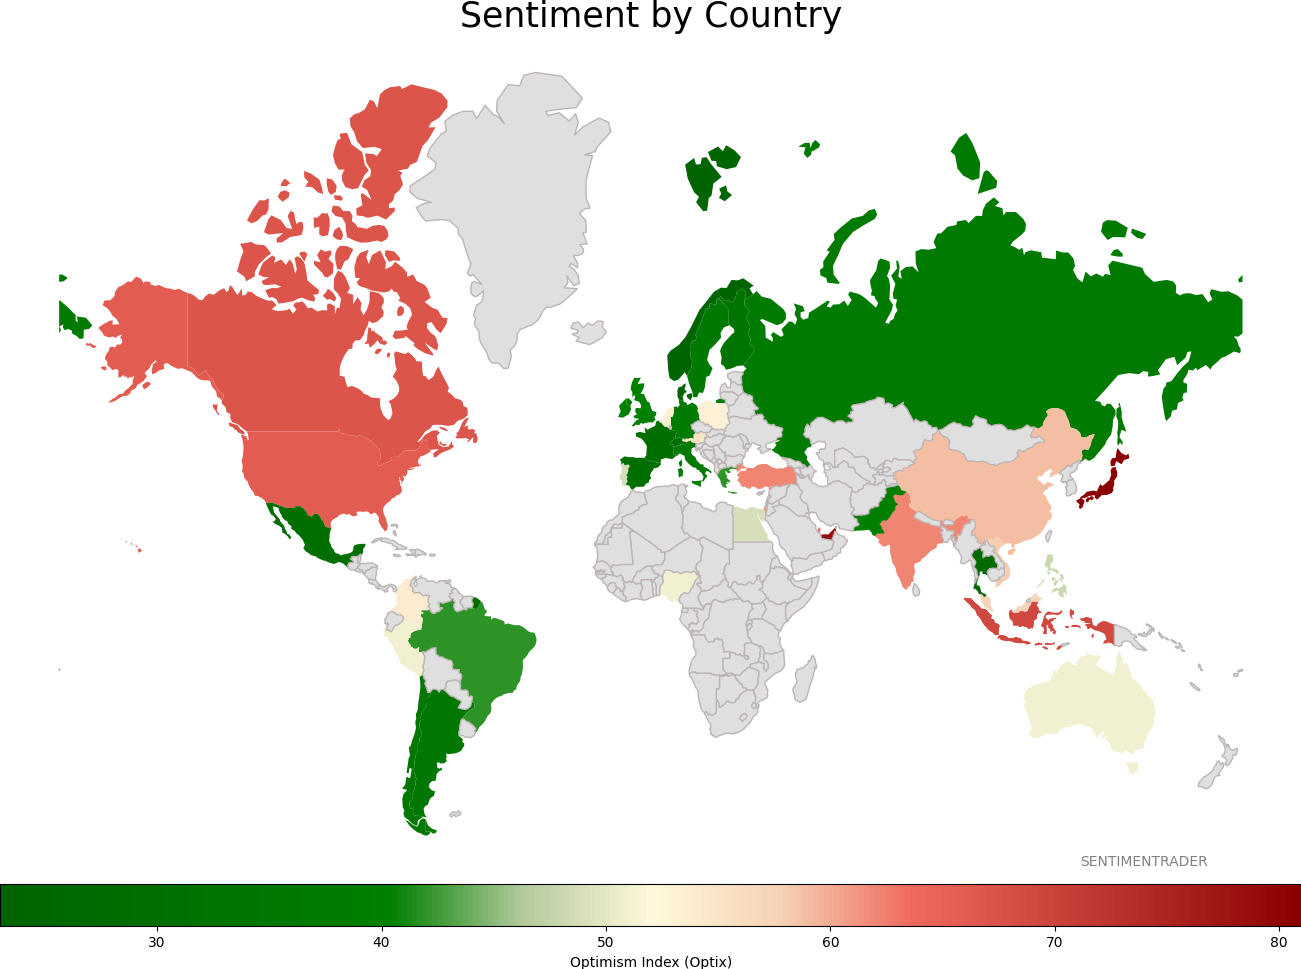
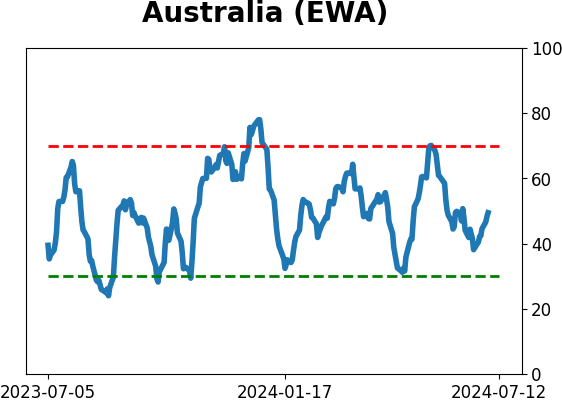
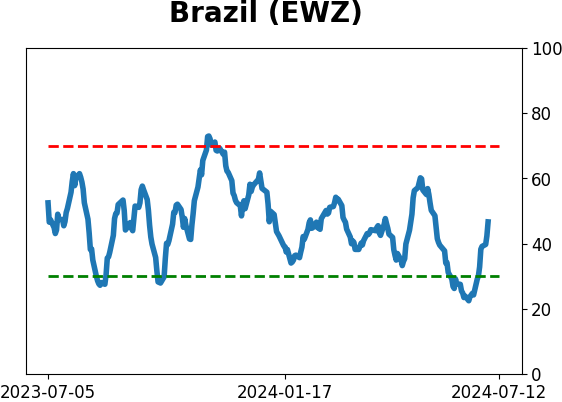
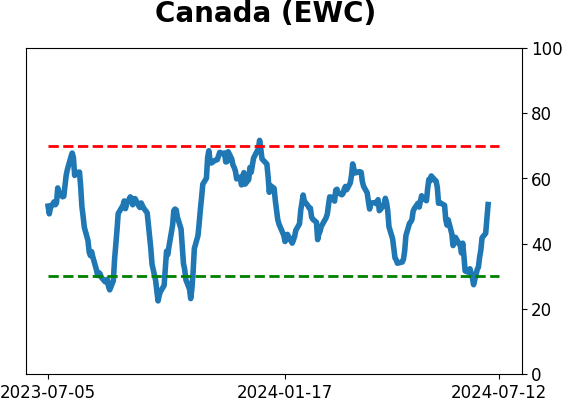
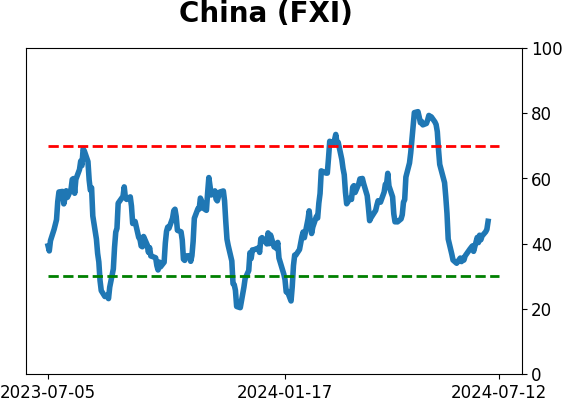
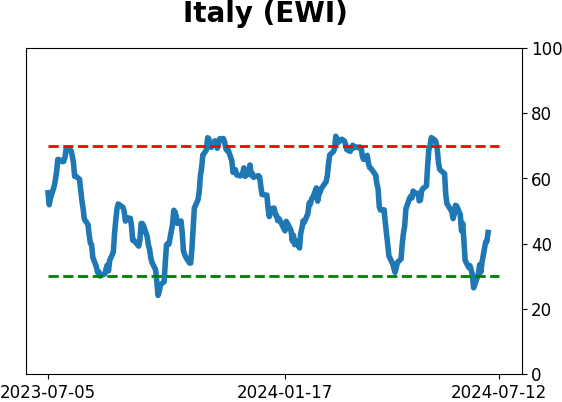
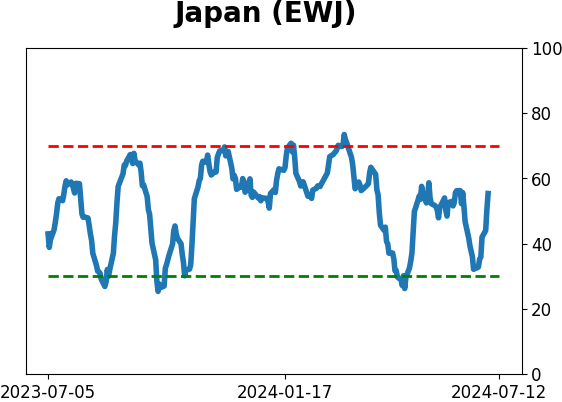
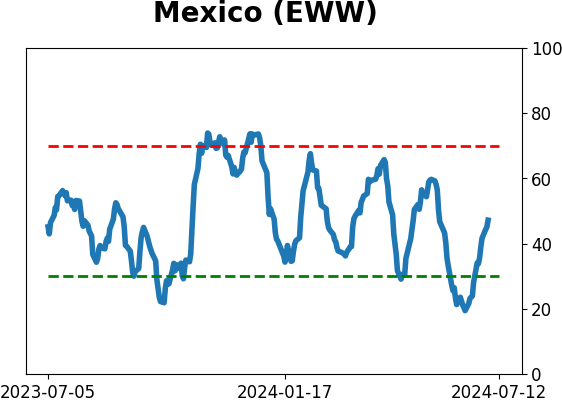
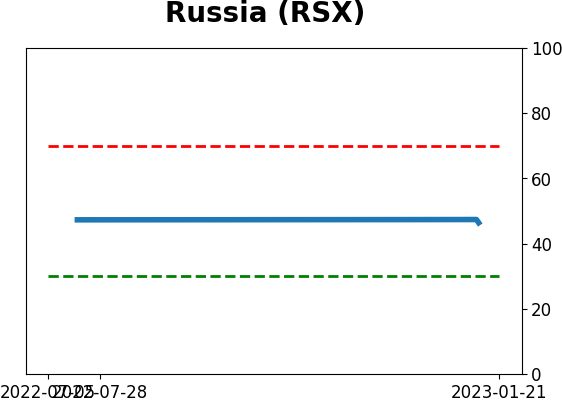
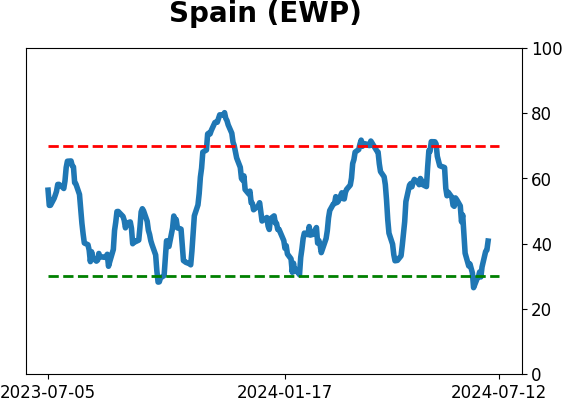
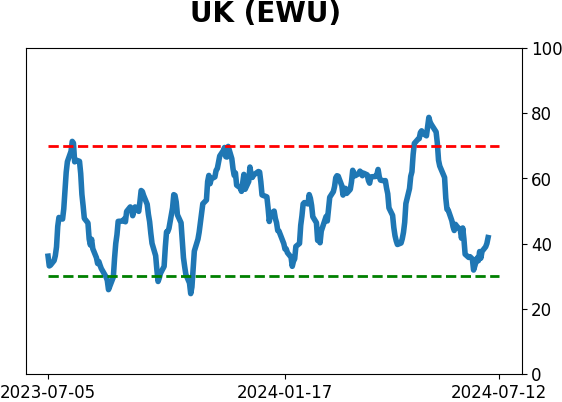
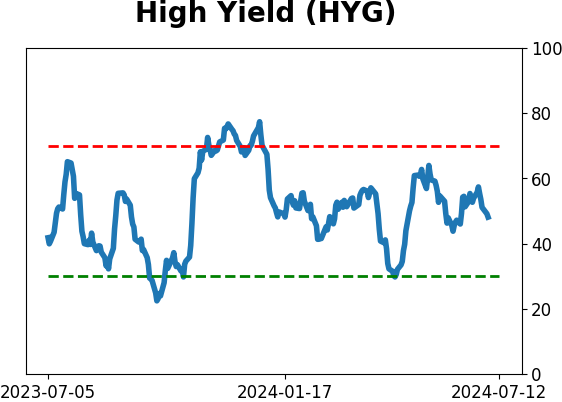
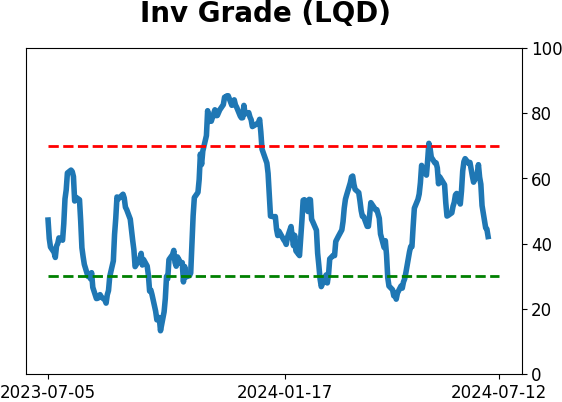
Sentiment Around The World
Optimism Index Thumbnails
|
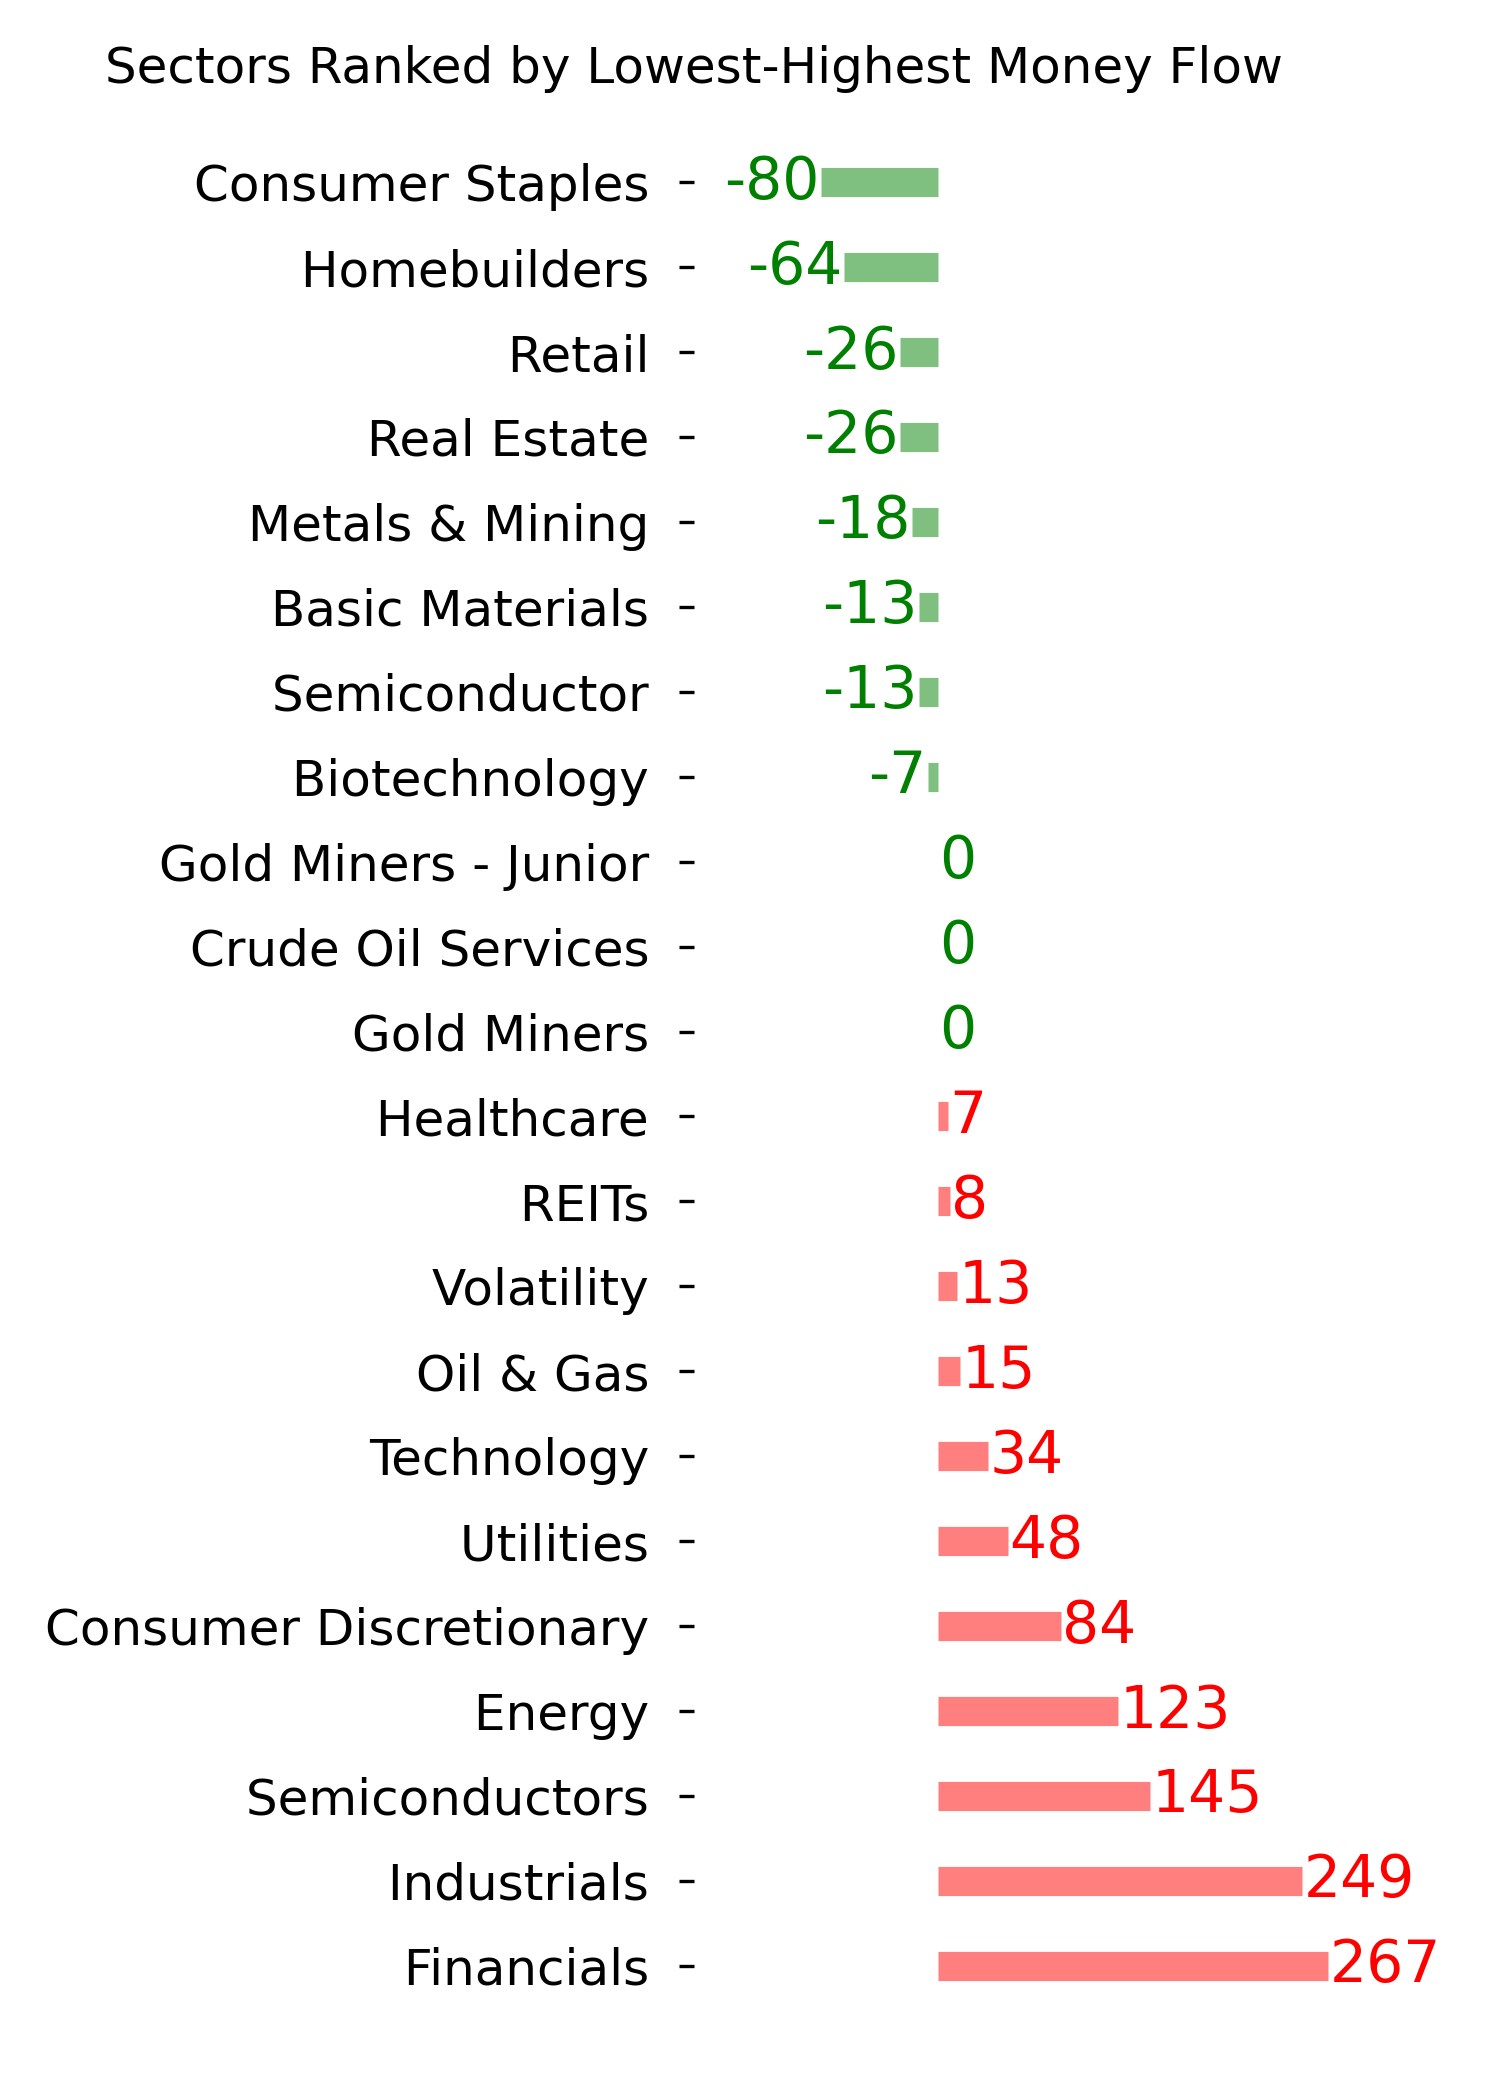
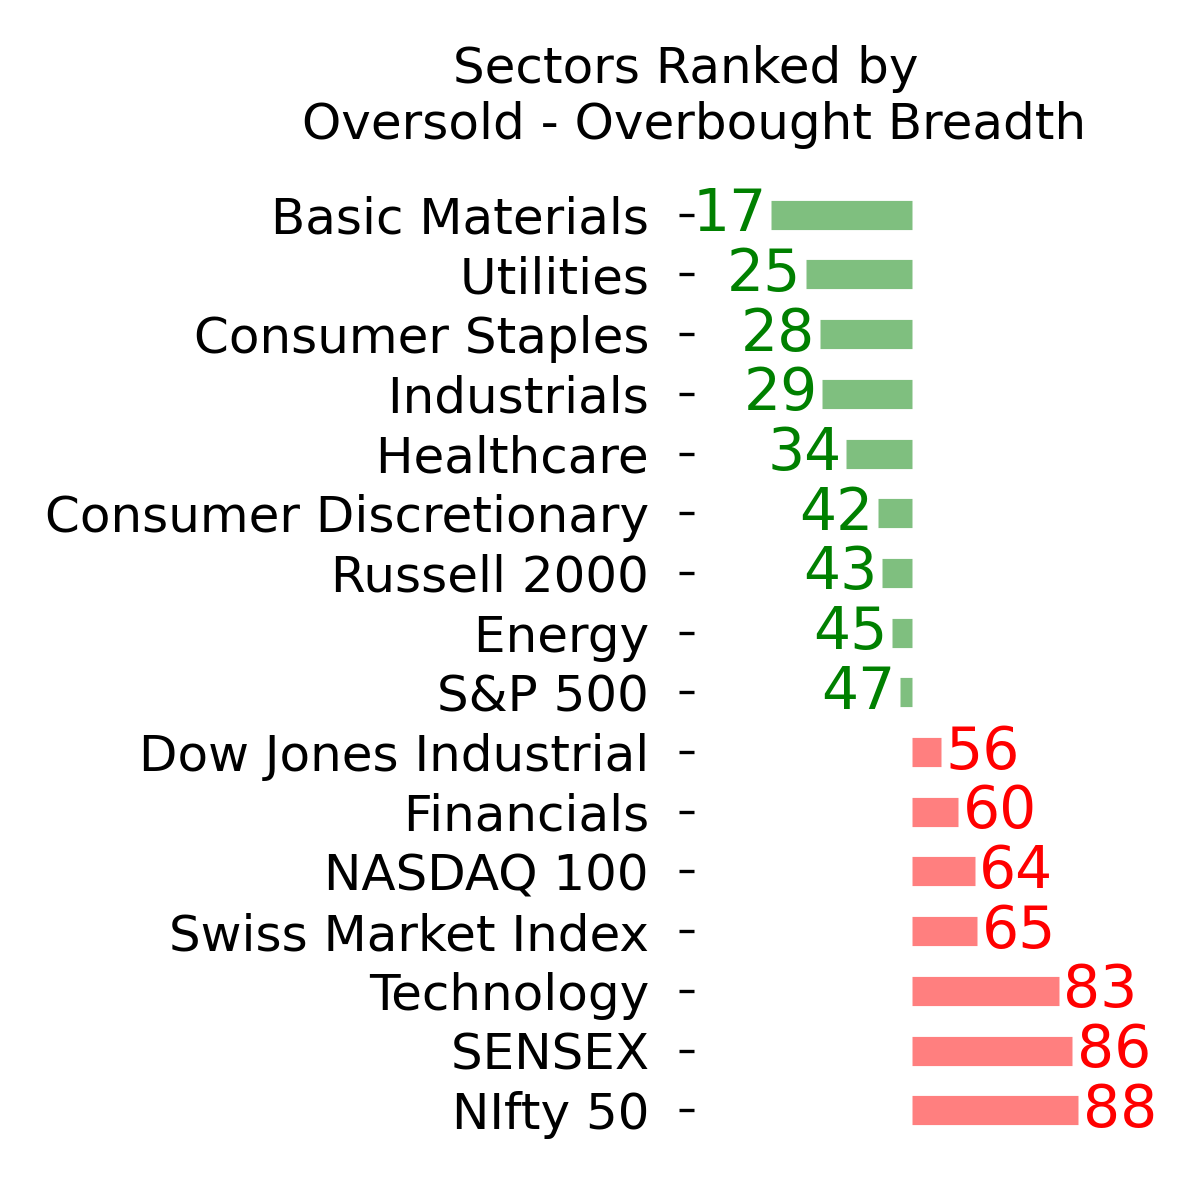
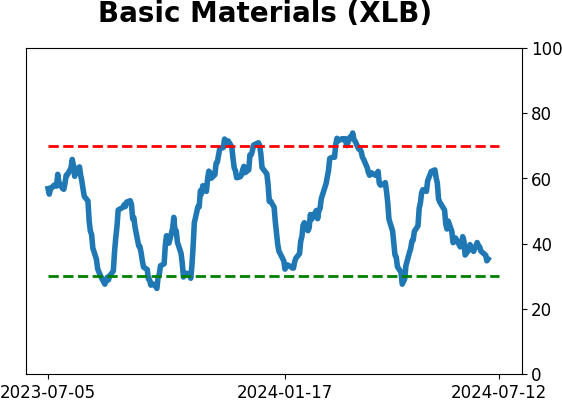
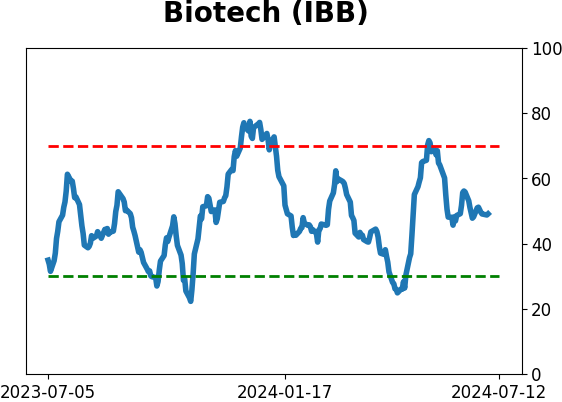
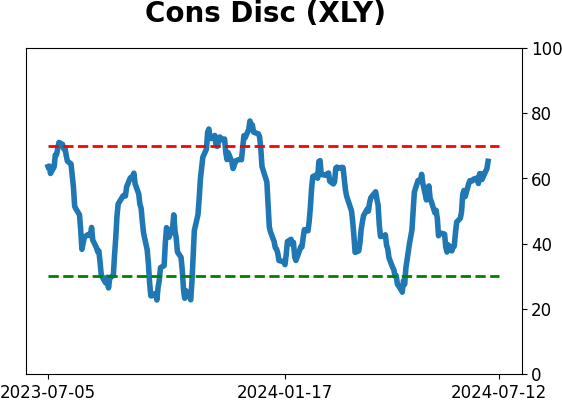
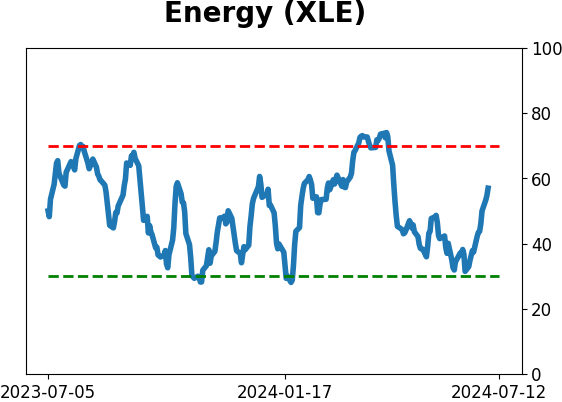
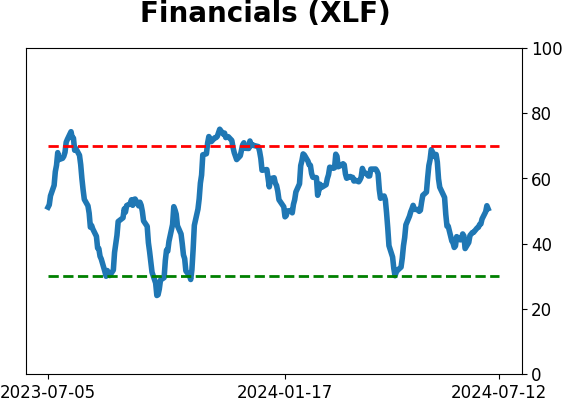
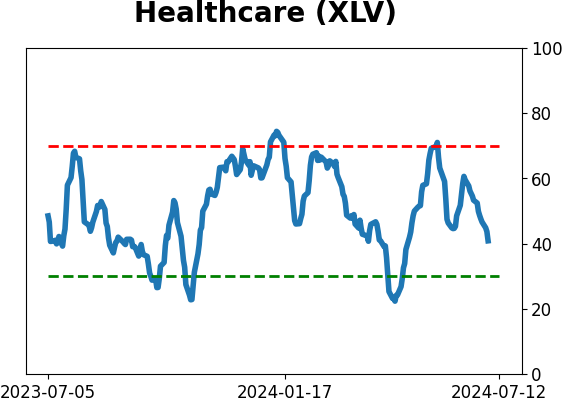
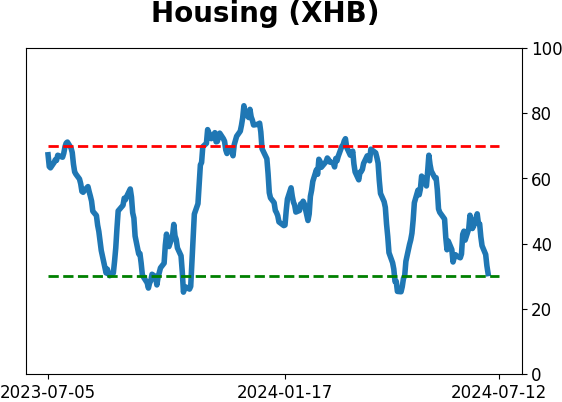
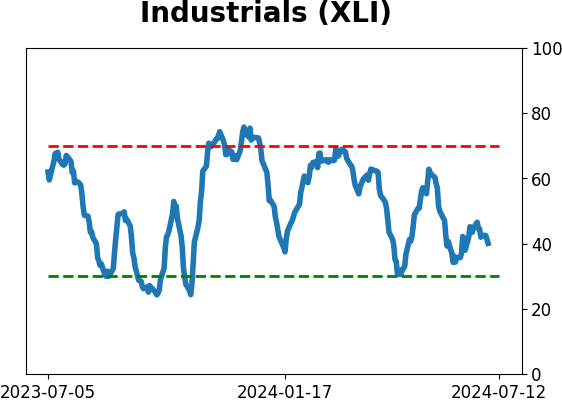
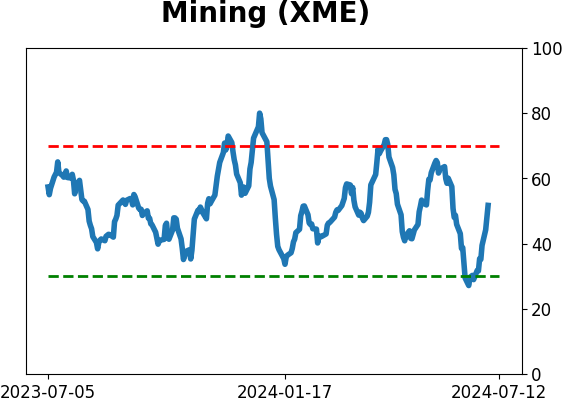
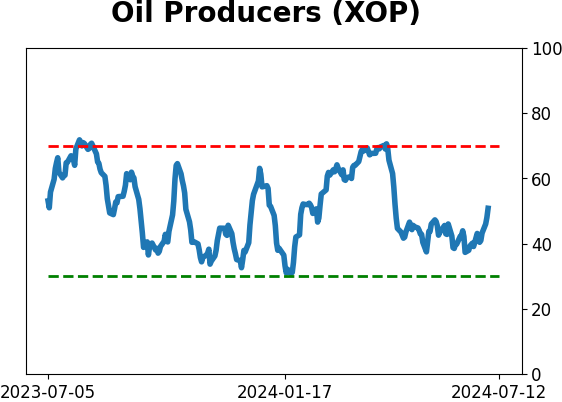
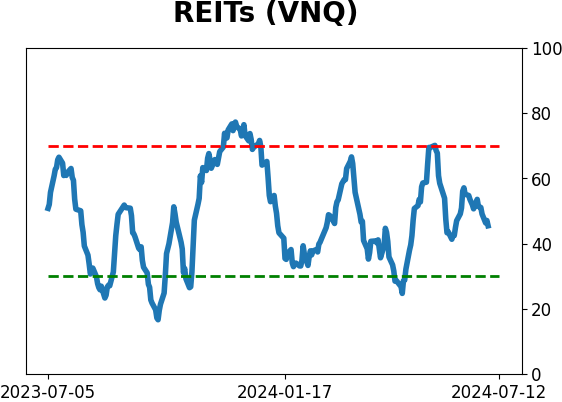
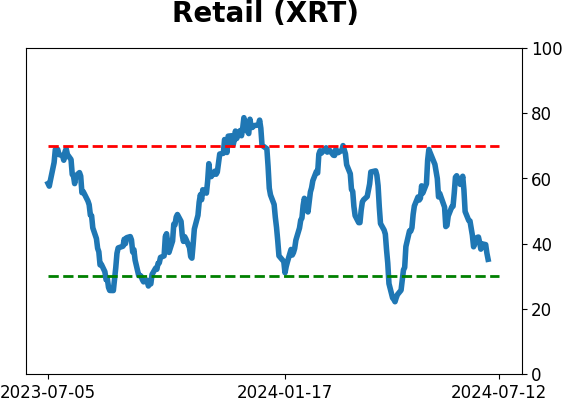
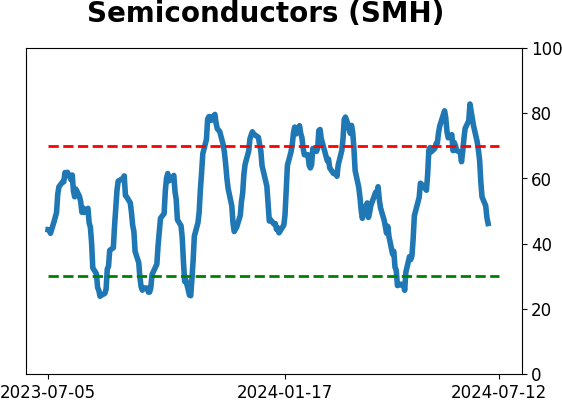
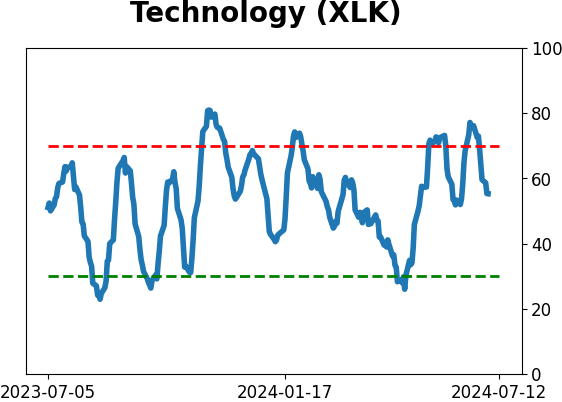
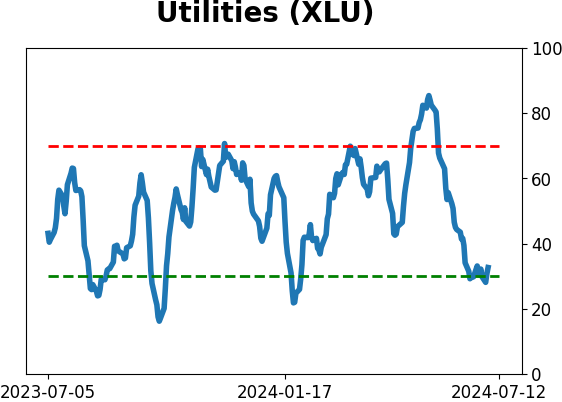
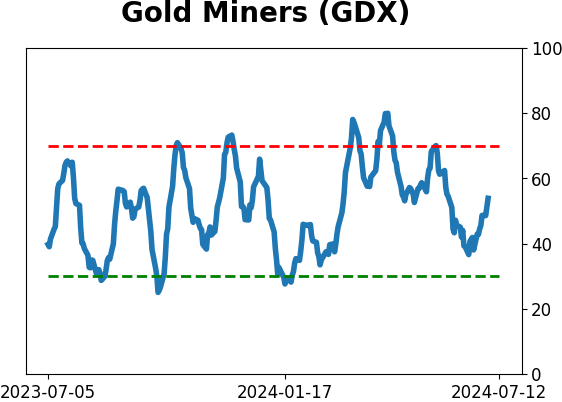
Sector ETF's - 10-Day Moving Average
|
|
|
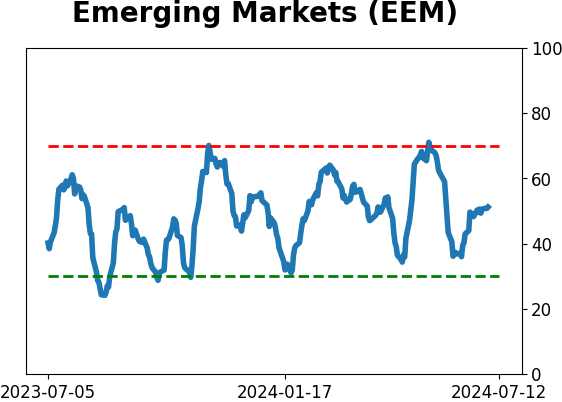
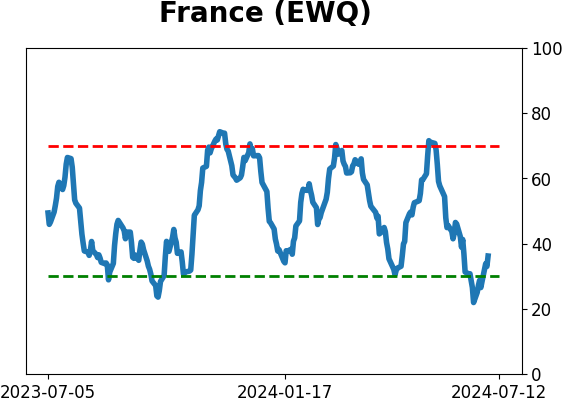
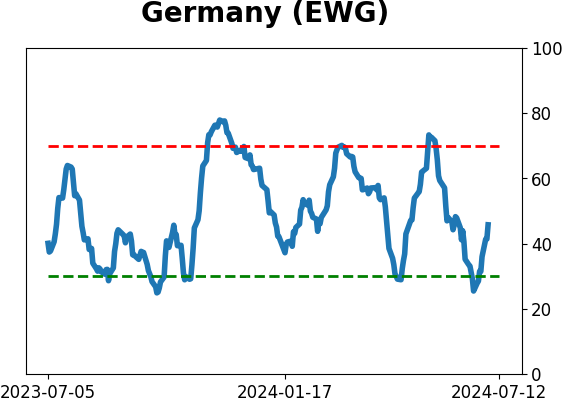
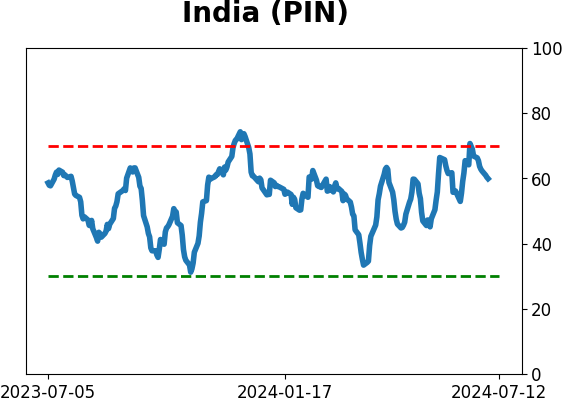
Country ETF's - 10-Day Moving Average
|
|
|
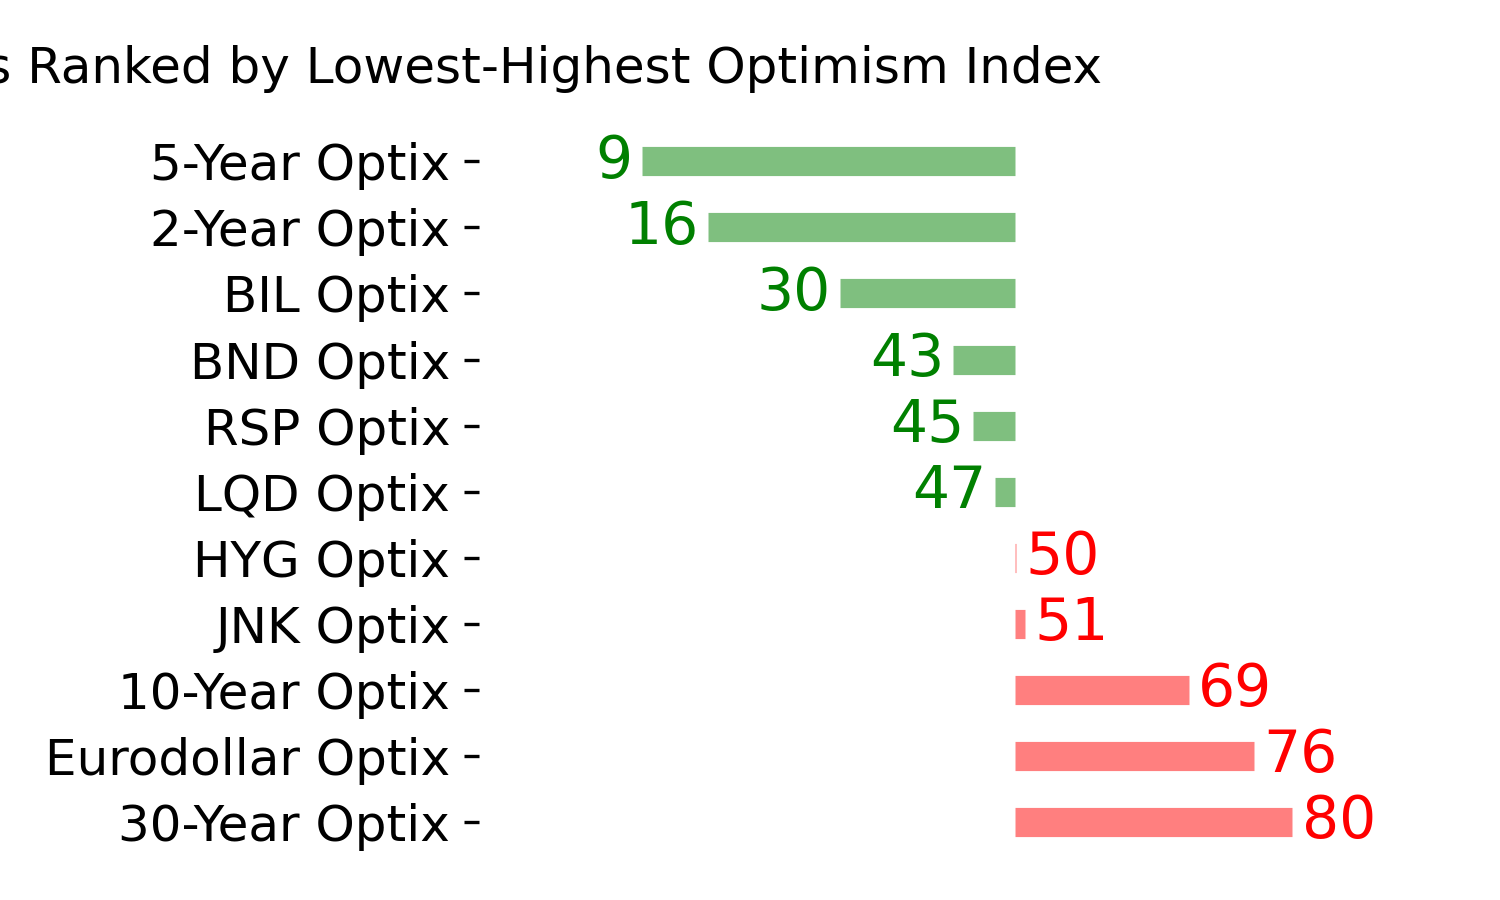
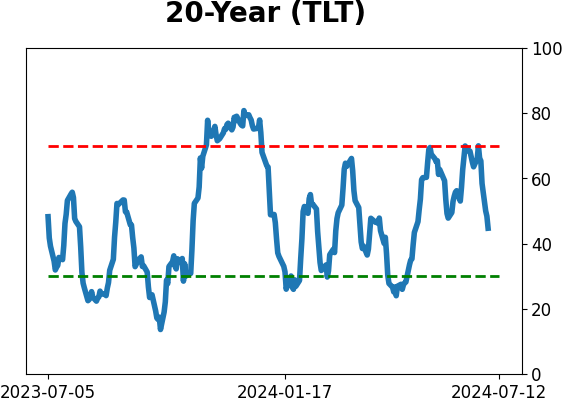
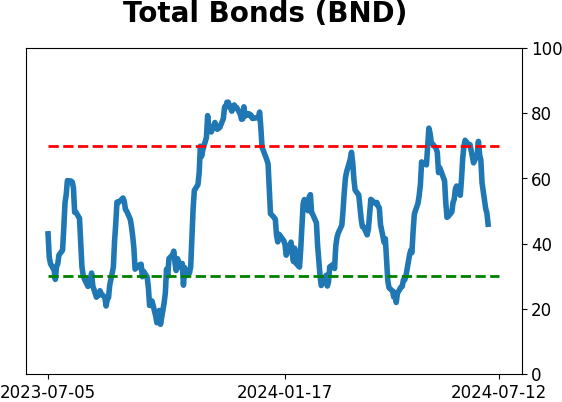
Bond ETF's - 10-Day Moving Average
|
|
|
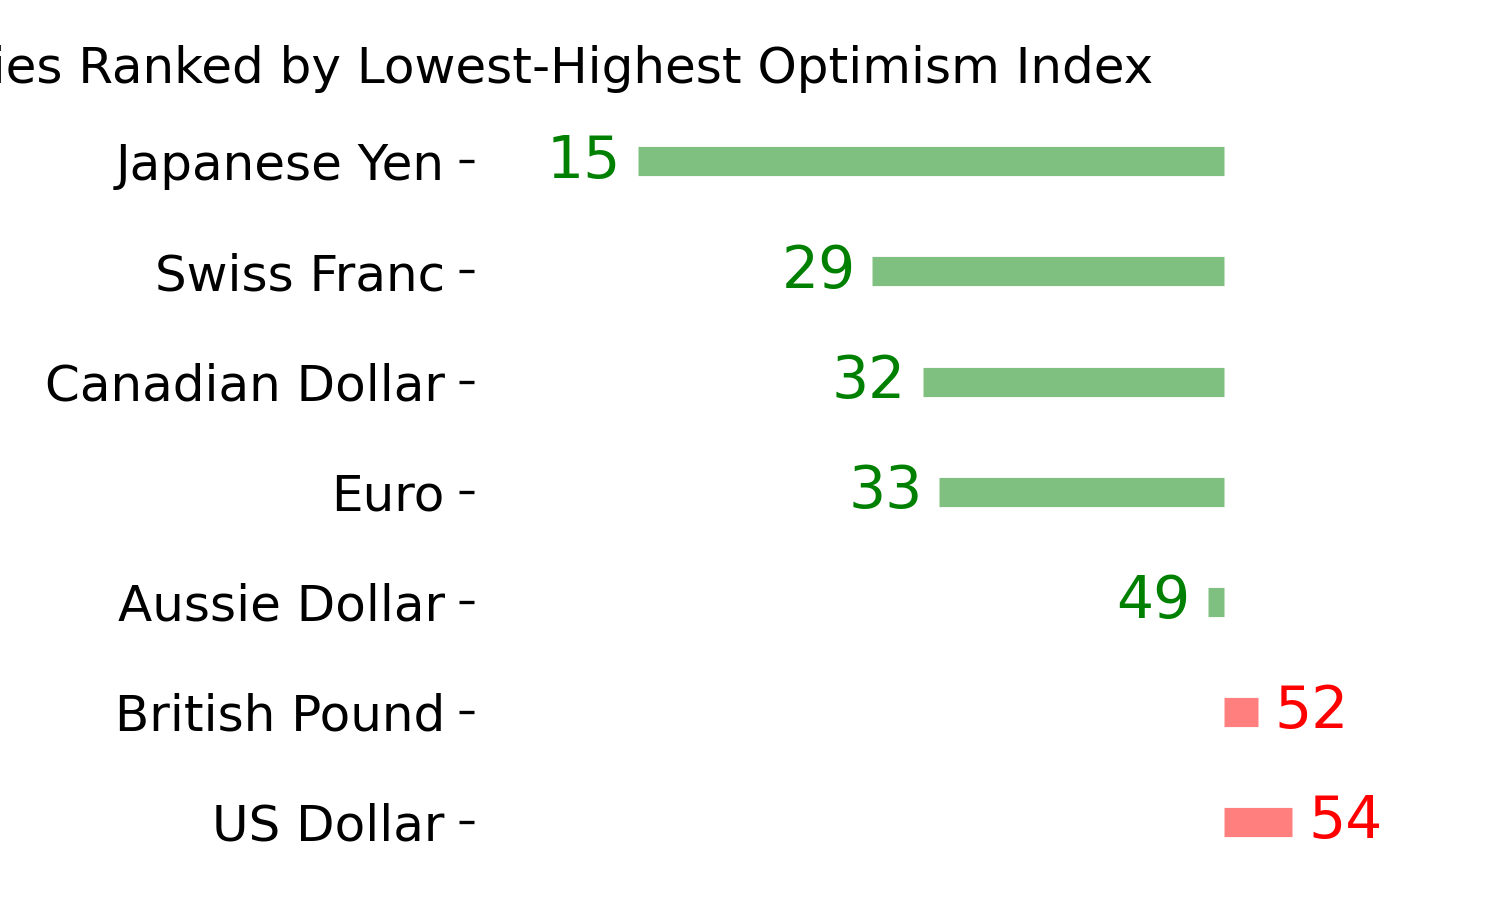
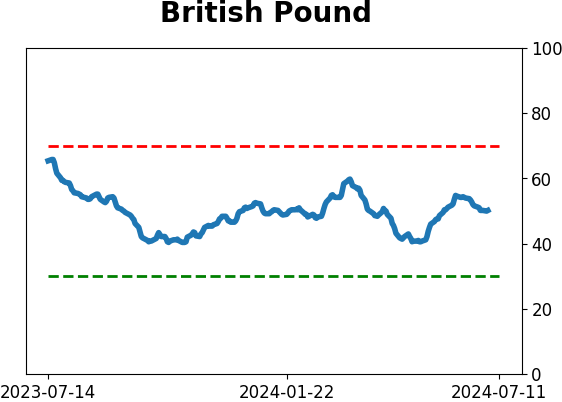
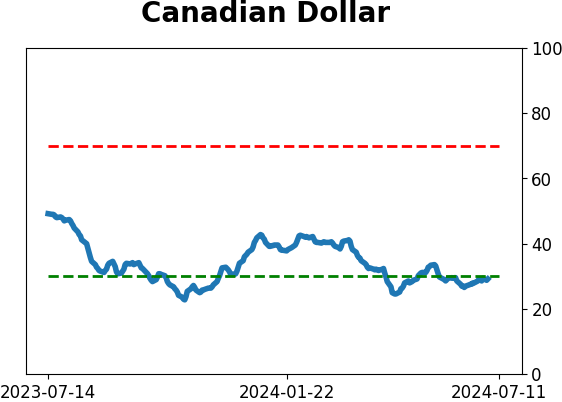
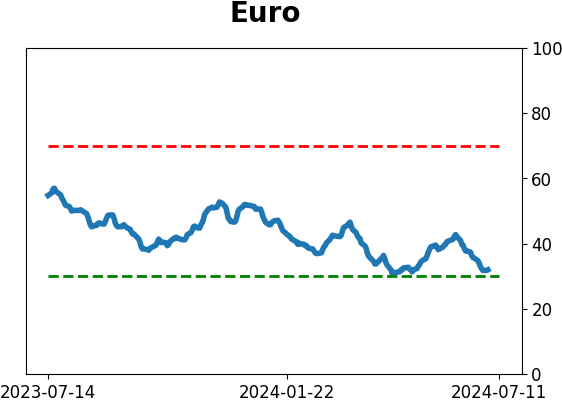
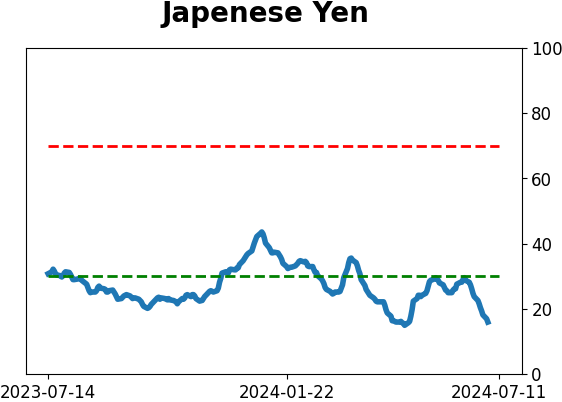
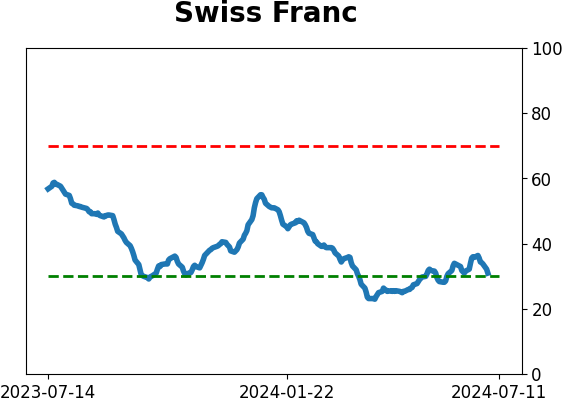
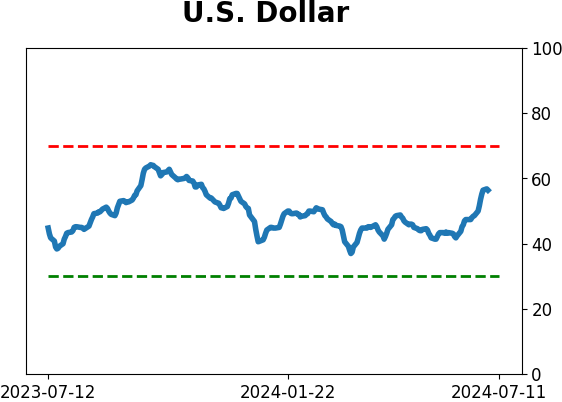
Currency ETF's - 5-Day Moving Average
|
|
|
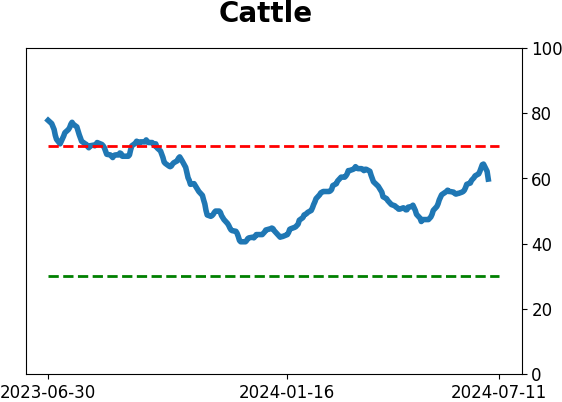
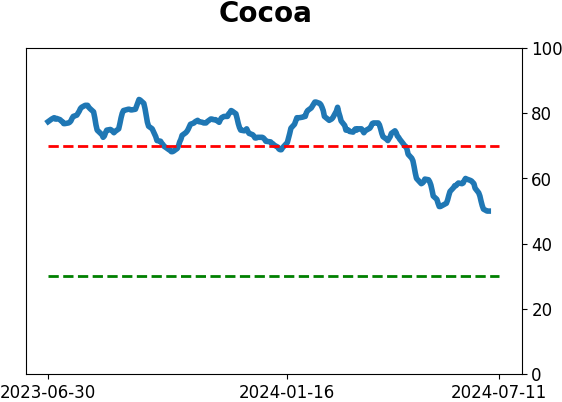
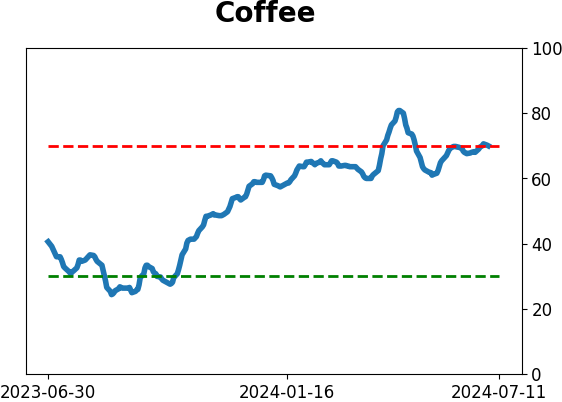
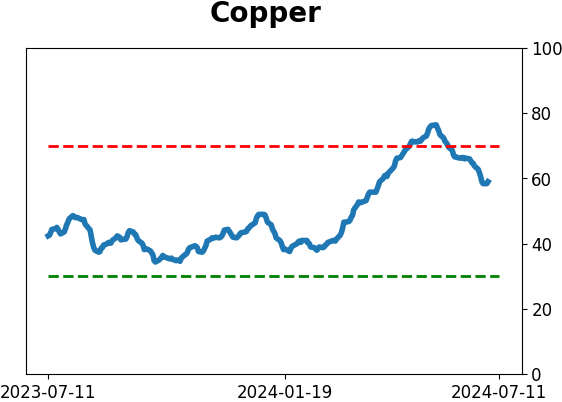
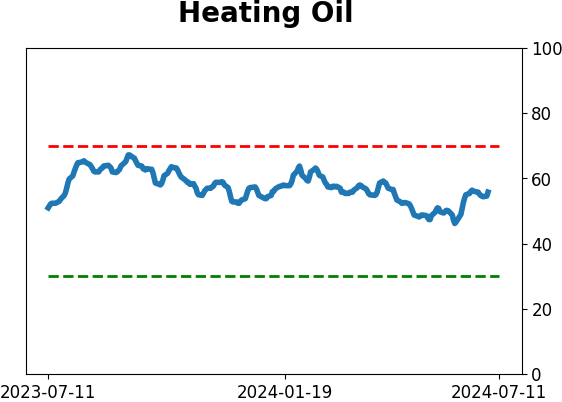
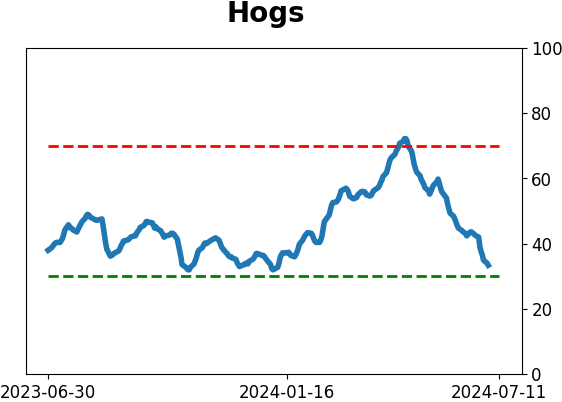
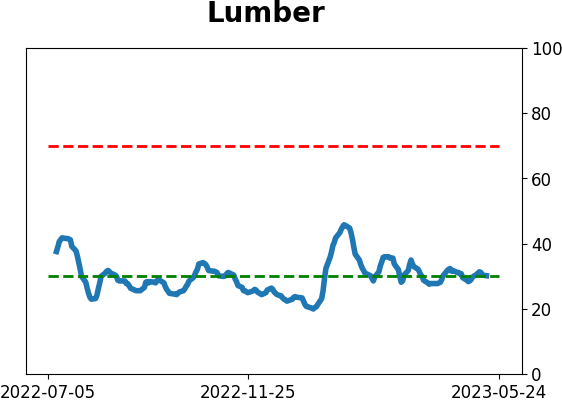
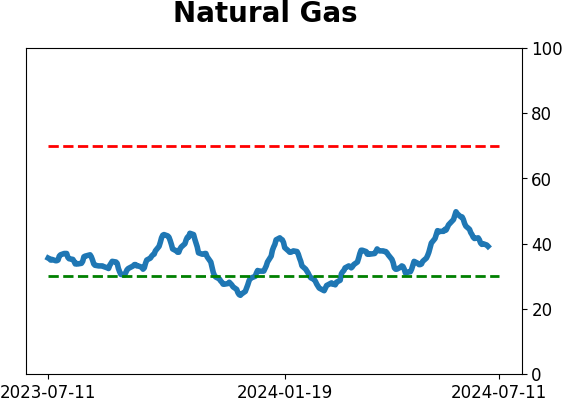
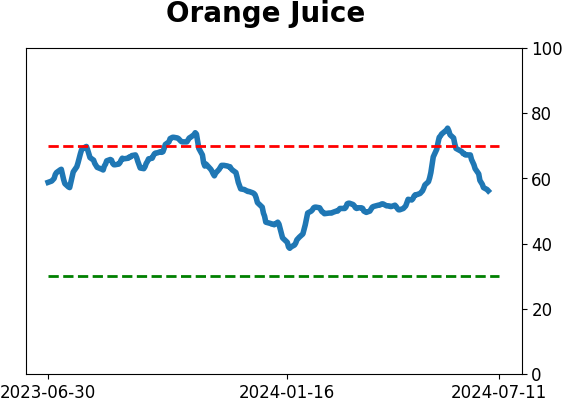
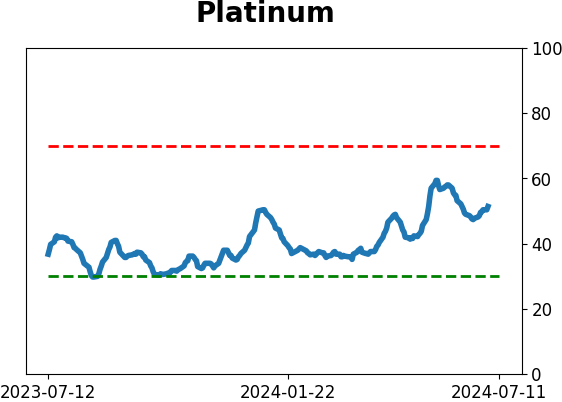
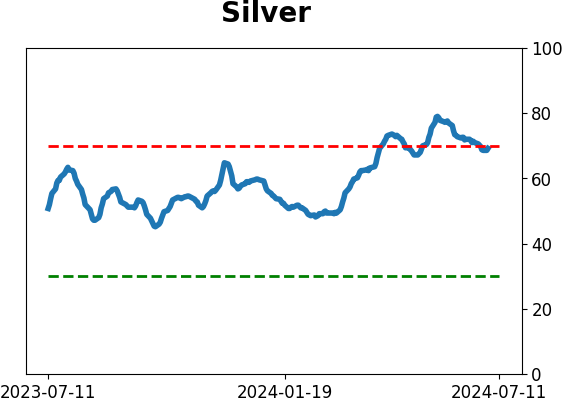
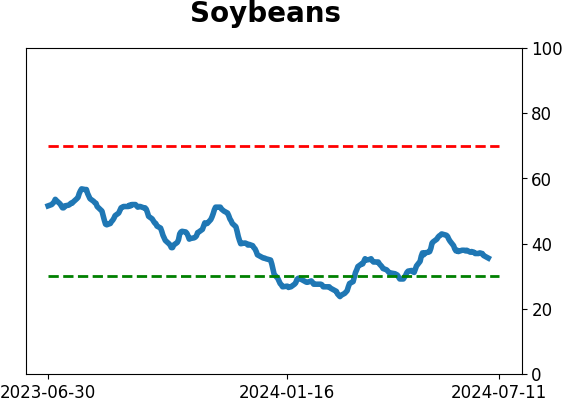
Commodity ETF's - 5-Day Moving Average
|
|