Headlines
|
|
It's time to put commodities back on the radar - Part IV:
In this final chapter, we highlight a strategy that switches between stocks and commodities based on the pattern detailed in the first three chapters.
|
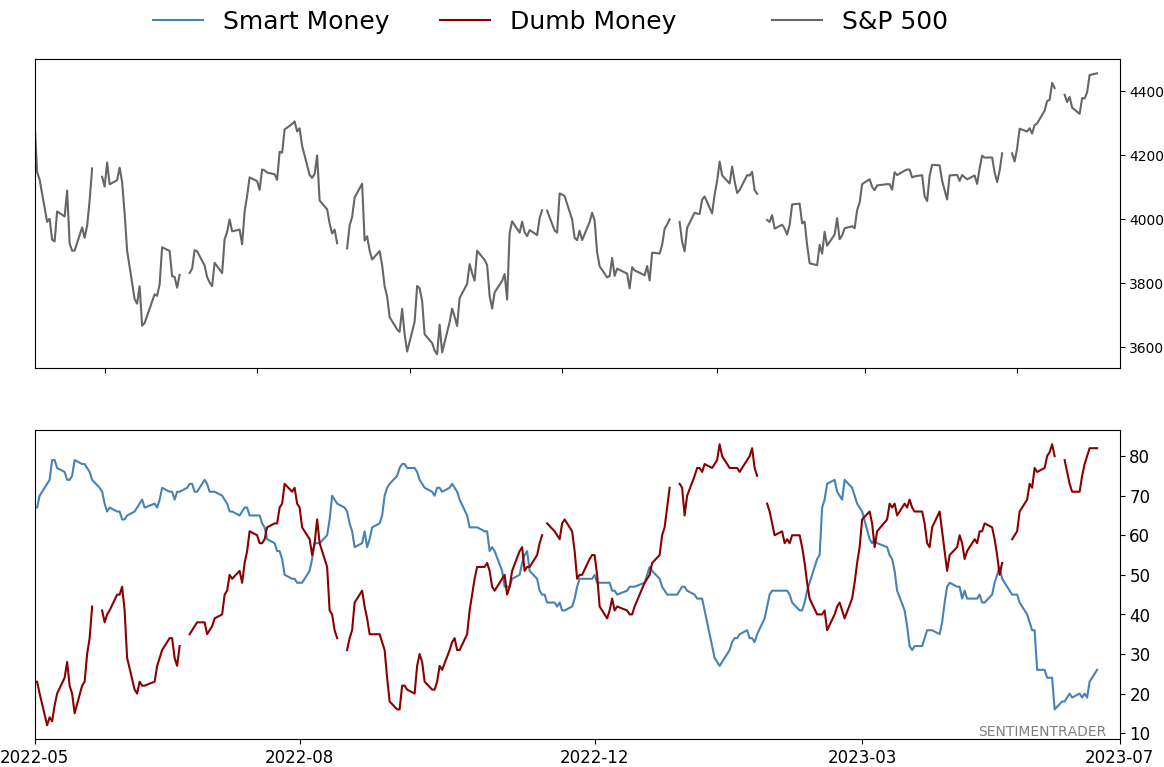
Smart / Dumb Money Confidence
|
Smart Money Confidence: 26%
Dumb Money Confidence: 82%
|
|
Risk Levels
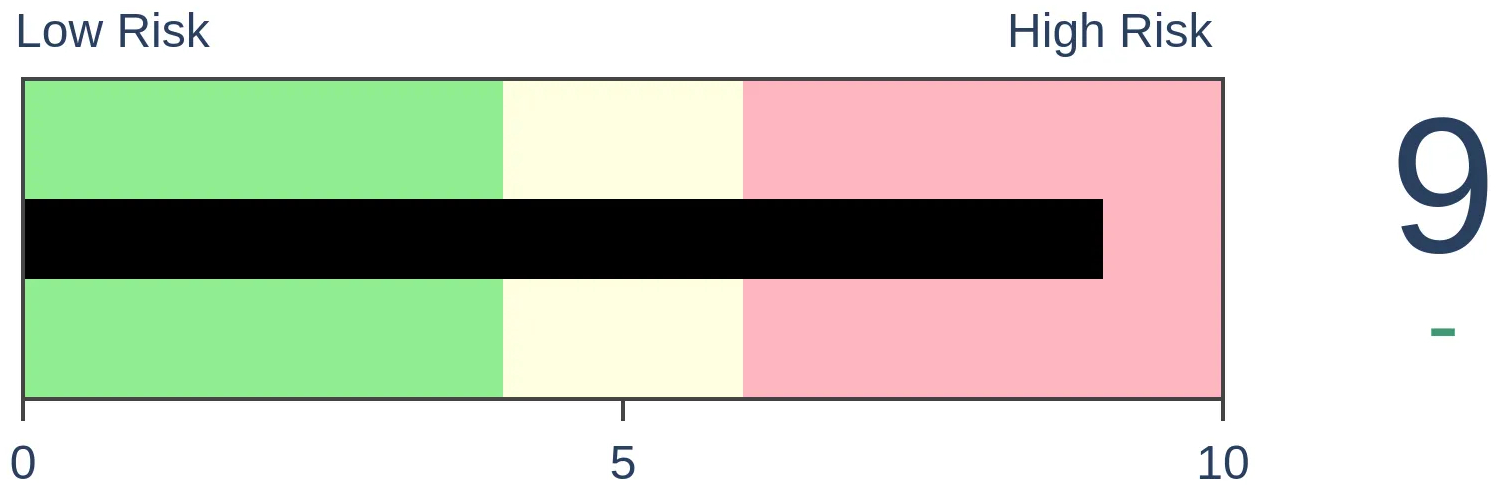
Stocks Short-Term
|
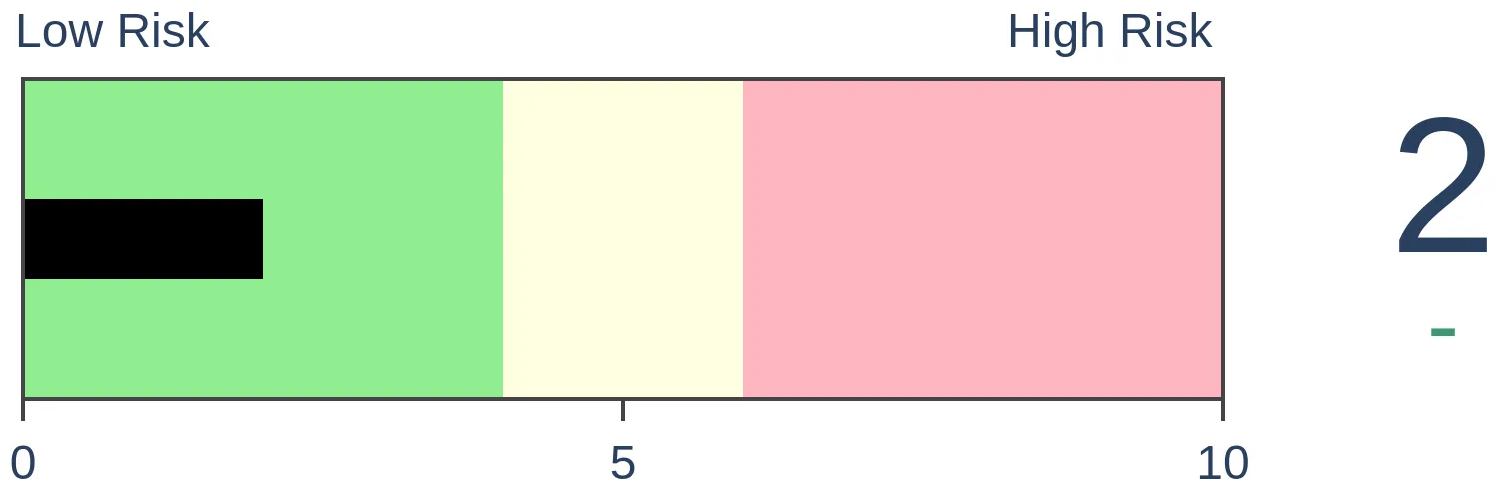
Stocks Medium-Term
|
|
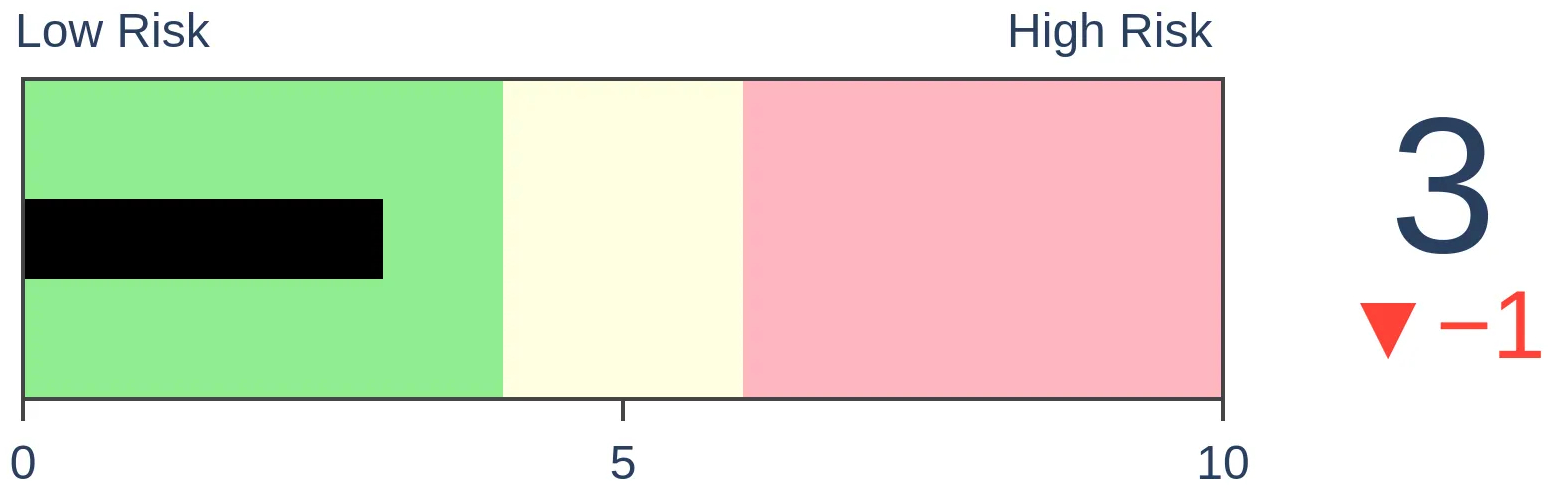
Bonds
|
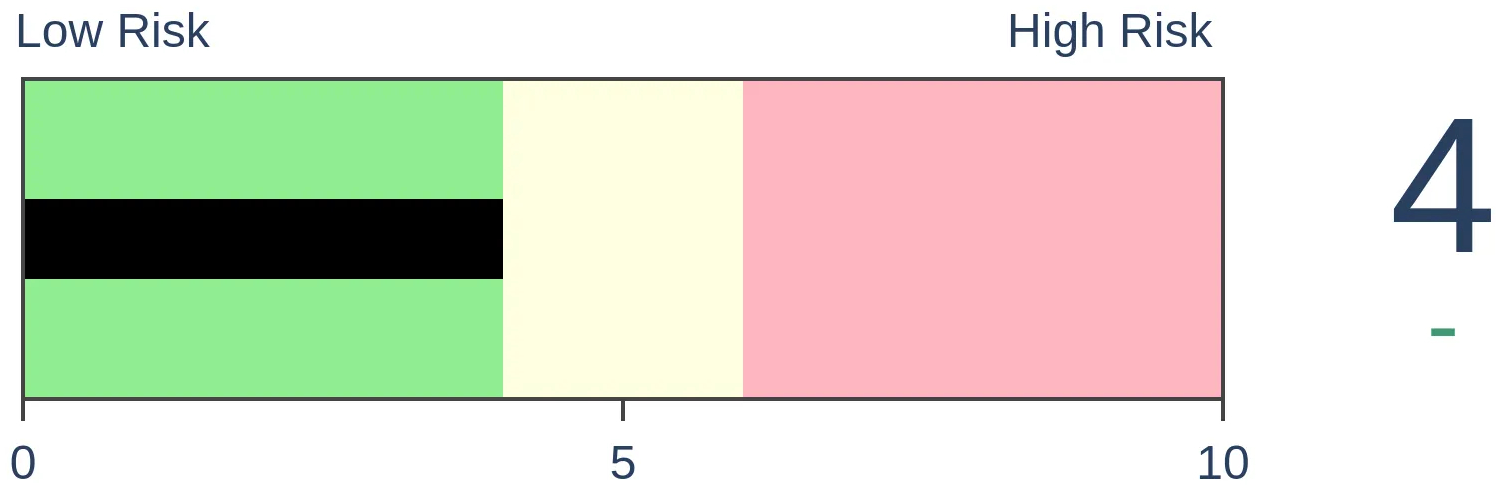
Crude Oil
|
|
Gold
|
Agriculture
|
|
Research
By Jay Kaeppel
BOTTOM LINE
In this final chapter, we highlight a strategy that switches between stocks and commodities based on the pattern detailed in the first three chapters.
FORECAST / TIMEFRAME
None
|
Key points
- In Part I, we highlighted a 30-yr cycle that typically sees commodities significantly outperform stocks during the first 15 years and vice versa during the last 15 years
- A new 30-yr cycle begins at the end of June 2023
- Part II looked at commodity and stock performance during the first 15 years of previous cycles, and Part III looked at commodity and stock performance during the last 15 years of previous cycles
- In Part IV, we consider a strategy that switches between commodities and stocks every 15 years
A quick review
As a quick refresher, to measure commodity returns, we use the following month-end prices for the following indexes:
- For commodities, we use the Bloomberg futures index from 1933 to1960 and the Bloomberg Spot Commodity Index from 1960 to the present
- For stocks, we use the monthly closing price for the S&P 500 Index
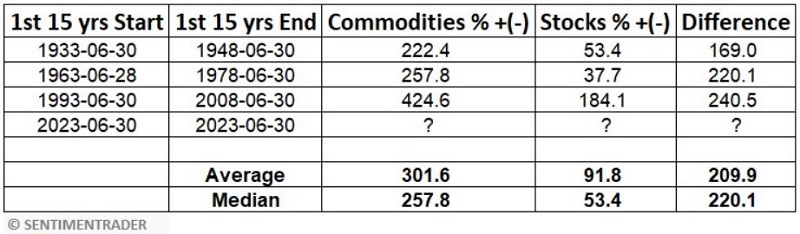
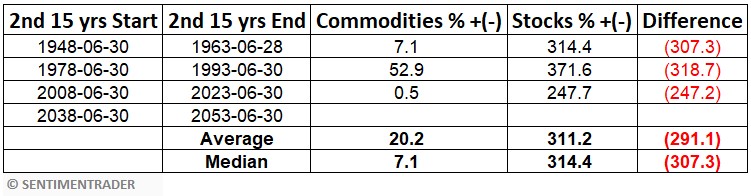
In Part I, we included the tables below. The first displays commodity and stock market performance during the first 15 years of each 30-year cycle since 1933. The second displays commodity and stock market performance during the last 15 years of each 30-year cycle since 1933 (this table is updated from the one in Part I to reflect performance through 2023-06-30).
A new 30-year cycle began at the close on 2023-06-30. The implication is that commodities will outperform stocks significantly over the next 15 years. There are, however, some real-world considerations to take into account upfront:
- There is no guarantee that the pattern (commodities better during the first 15 years and stocks better during the last 15 years) will repeat over the next 30 years
- Even if the pattern does hold, it should not be assumed that commodities will immediately begin to outperform stocks just because the calendar has passed 20230-06-30
- Even if commodities do outperform stocks over the next 15 years, there will almost certainly be a great deal of volatility involved, and large drawdowns should be expected along the way
- There is no inference being made that investors should dump and never hold stocks during the next 15 years, nor that anyone should concentrate 100% of their capital on commodities
With all of those caveats in mind - and for the sake of argument - let's consider a strategy that does, in fact, hold 100% commodities during the first 15 years of each 30-year cycle and 100% stocks during the second 15 years.
The baselines
The chart below displays separately the growth of $1 invested in commodities and $1 invested in stocks since June 1933.
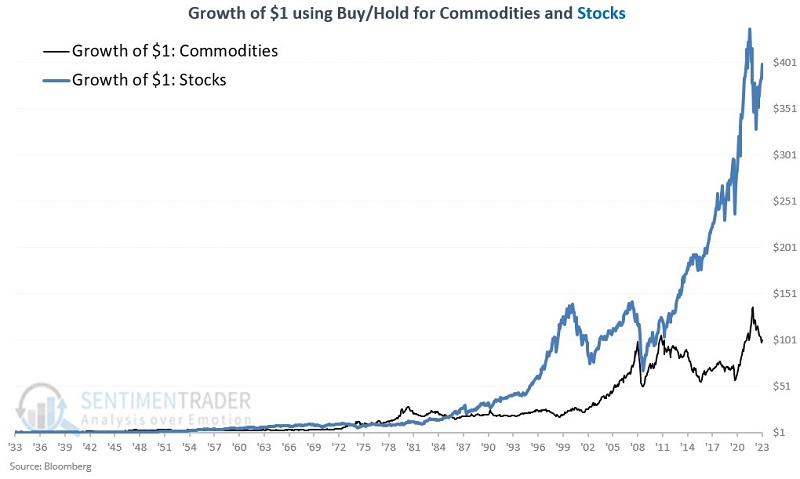
$1 in commodities grew to $100, and $1 in stocks grew to $408. From this, one might conclude that stocks "outperformed." And over the entire period, this is true. But a different picture emerges if we draw the same chart on a logarithmic scale.
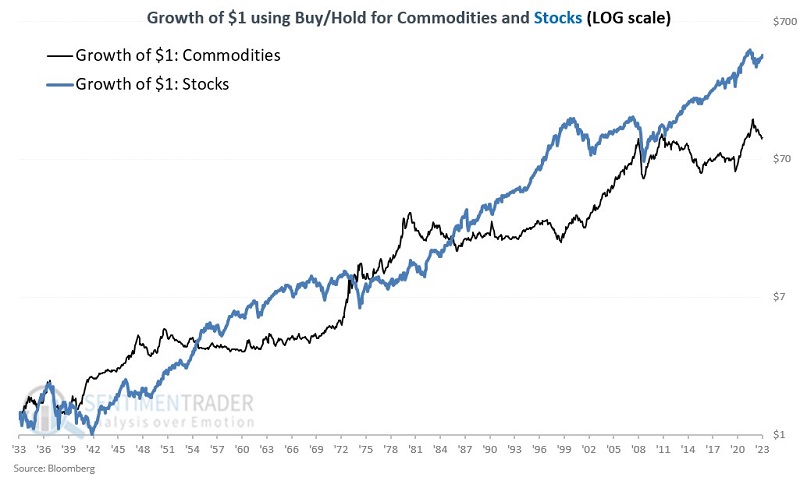
In the logarithmic chart above, we see the back-and-forth nature of performance much more clearly. We can also note that stock and commodity performance was roughly even as late as early 2009. So most of the "vast outperformance" for stocks over the entire 90-year period occurred in the last 15 years.
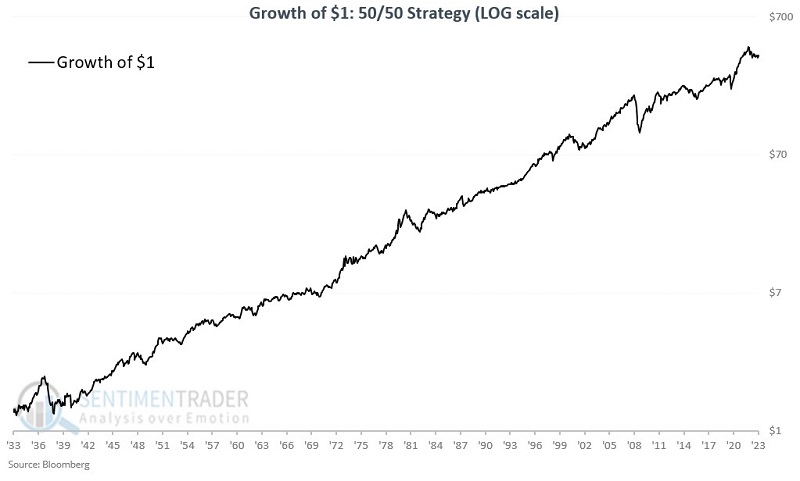
As our primary baseline, we will buy-and-hold commodities and stocks on a 50/50 basis and rebalance to 50/50 at the end of each calendar year. This approach saw $1 grow to $371, as shown in the chart below.
The switching strategy
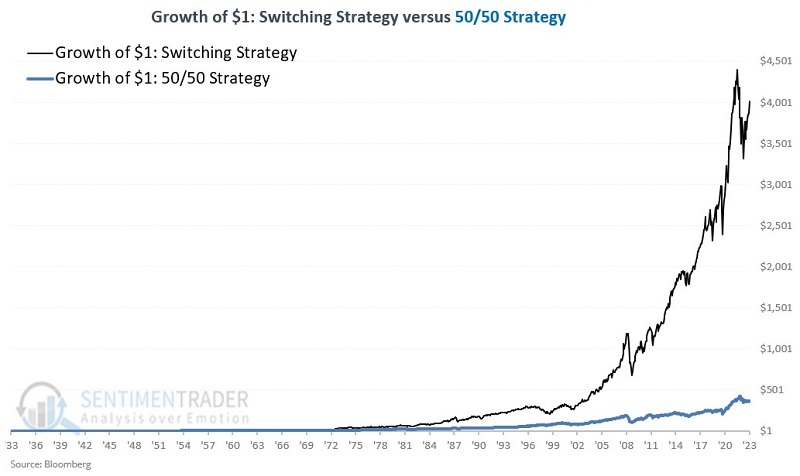
Our test begins on 1933-06-30. We will hold commodities for 15 years and then stocks for 15 years, and so on. The chart below displays the growth of $1 using this Switching Strategy (black line) versus the growth of $1 using the 50/50 strategy (blue line).
The chart below displays the same data as the chart above on a logarithmic scale.
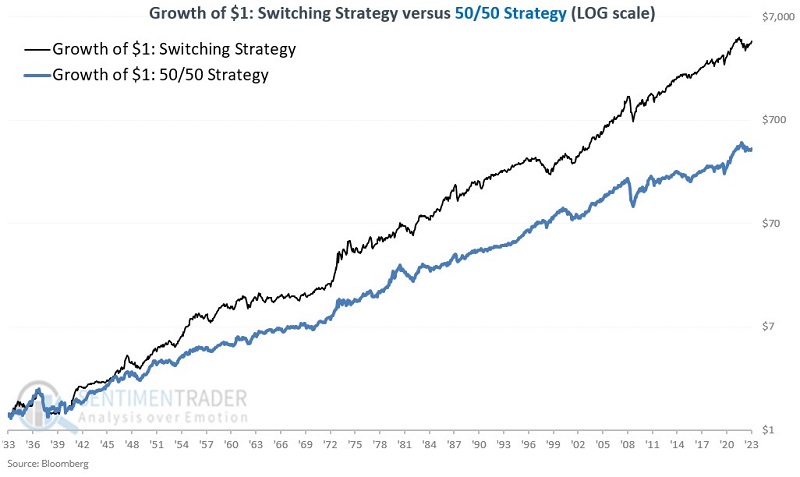
From 1933 through June 2023, the hypothetical value of $1 invested using the Switching Strategy is $4,113. The hypothetical value of $1 invested using the 50/50 Strategy is $371.
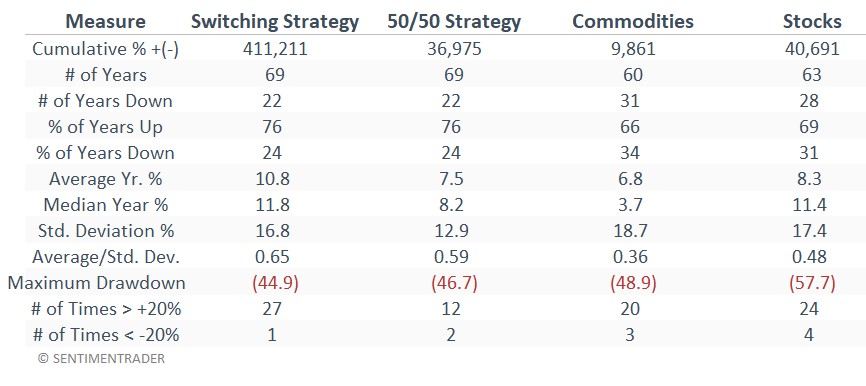
Comparing performance stats
The table below displays a variety of relevant facts and figures for:
- The Switching Strategy
- The 50/50 Strategy
- Buying and holding commodities
- Buying and holding stocks
All results are based on monthly data. Intra-month fluctuations may be more significant than what is reflected here.
One way to play
Most individual investors will never (and probably should never) trade commodity futures or attempt to trade in the cash markets. A straightforward alternative is to buy an ETF or ETN that tracks a basket of commodities. Many choices include the following tickers: PDBC, DBC, GSG, GCC, and others. Each has its unique set of holdings, and investors should do their research. Of those I tested, the Invesco Optimum Yield Diversified Commodity Strategy No K-1 ETF (ticker PDBC) has a few advantages. It has a higher correlation to the Bloomberg Spot Commodity Index used in testing the past 90 years of performance than the others, it is heavily traded, it has a lower expense ratio than most of the others, and it does not issue a K-1 form at tax time as do most of the other more heavily traded commodity index related ETFs. It should be noted, however, that PDBC does not track a particular index but rather is actively managed.
Per www.ETFDB.com:
The Invesco Optimum Yield Diversified Commodity Strategy No K-1 ETF (PDBC), as the name implies, offers exposure to commodity futures without the tax hassle of a K-1, which some investors avoid. The fund is actively managed and tries to avoid "negative roll yield," a well-known problem of passive commodity funds that can substantially erode returns over time. There are several similar strategies on the market, including some that charge a lower fee, but PDBC has by far the most assets and trading volume.
What the research tells us…
Ninety years of history suggest that commodities should outperform stocks by a significant margin over the next 15 years. "Should" is the important word in the previous sentence. There is no guarantee that the pattern that has played out over the past 90 years will continue ad infinitum into the future. Just as importantly, on a relative basis, there can be no argument that stocks are presently outperforming commodities. So, just because a new first 15 years has begun does not mean the current trend will reverse anytime soon. It does mean that investors may be wise to open their minds to the prospect of investing in commodities as an asset class in the years ahead.
Indicators at Extremes
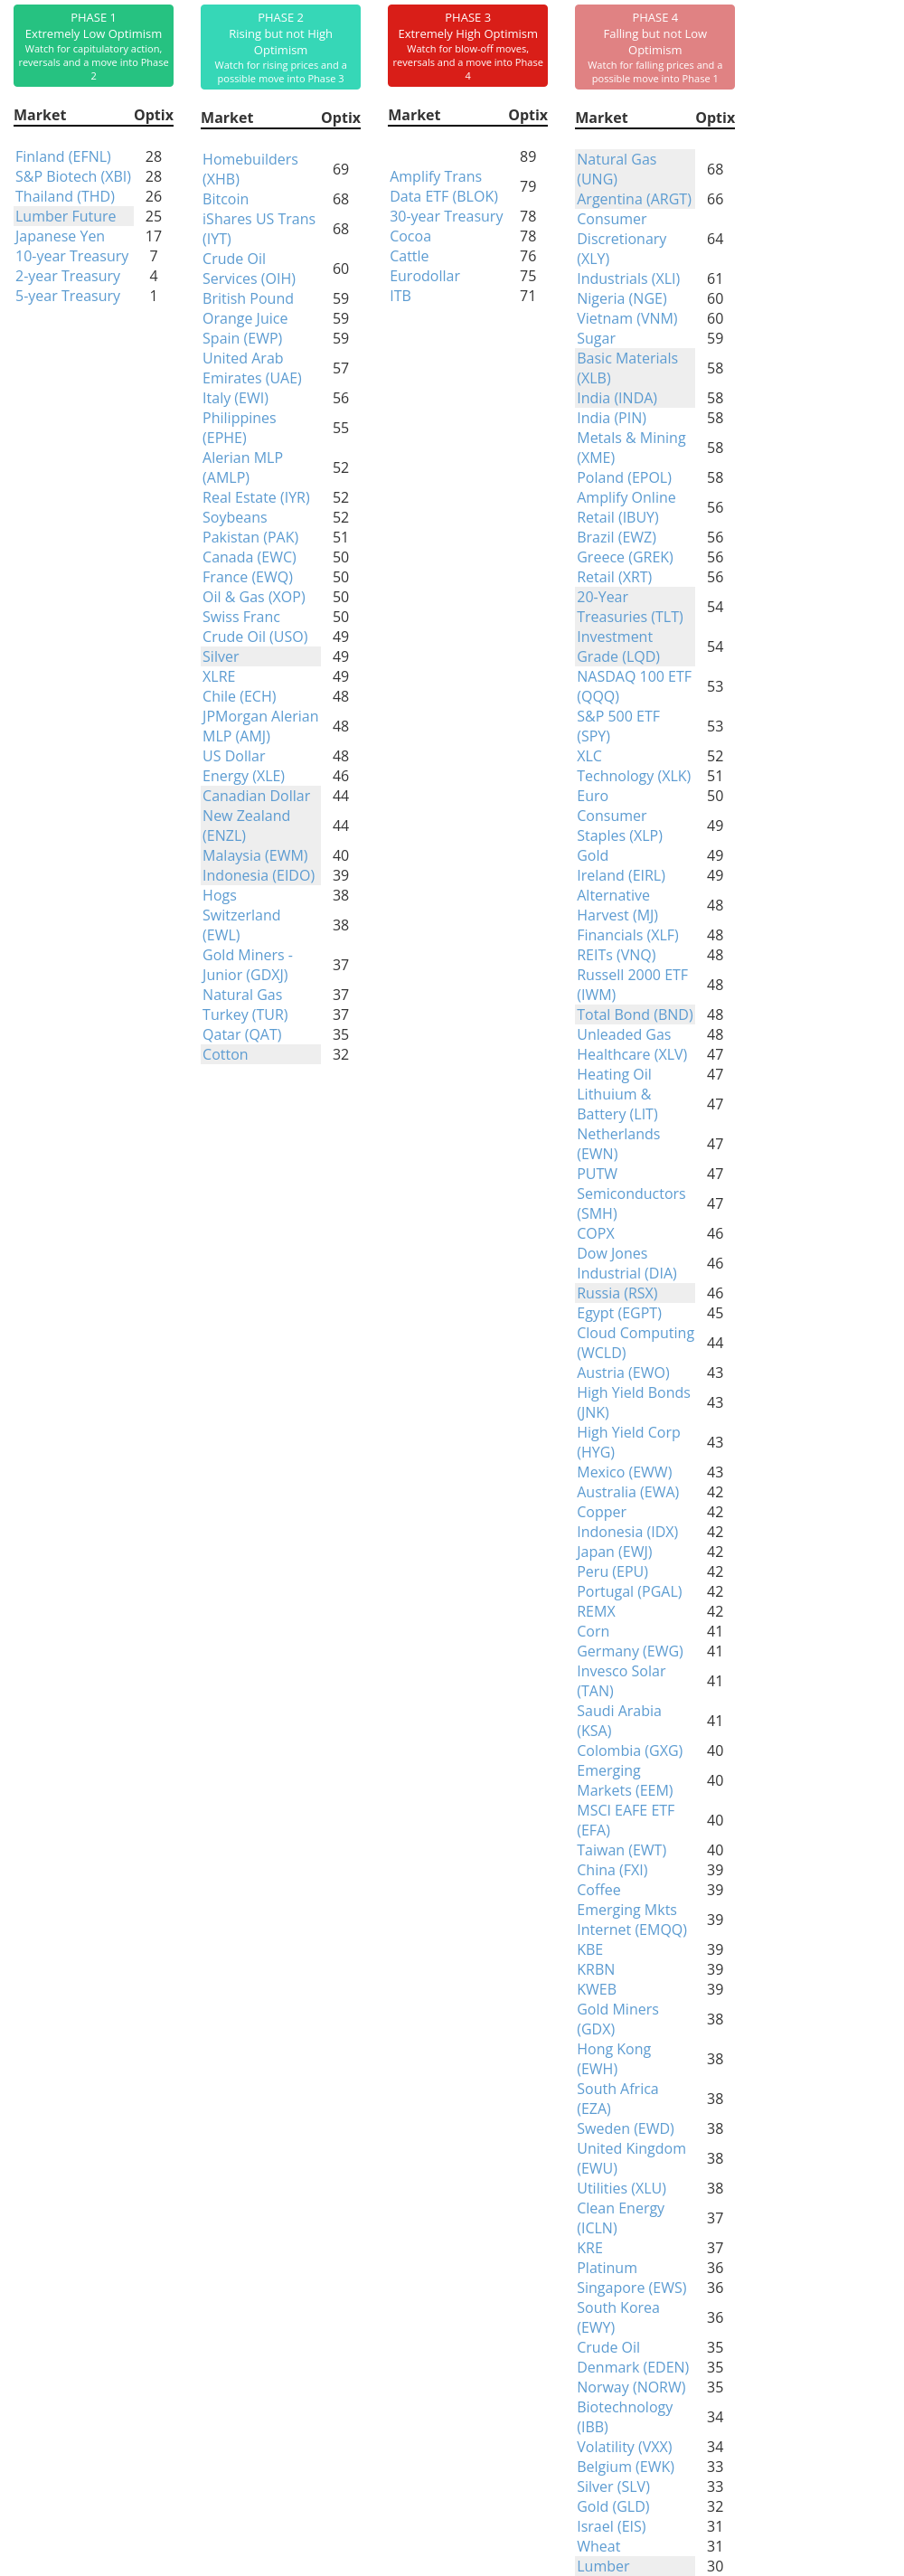
Phase Table
Ranks
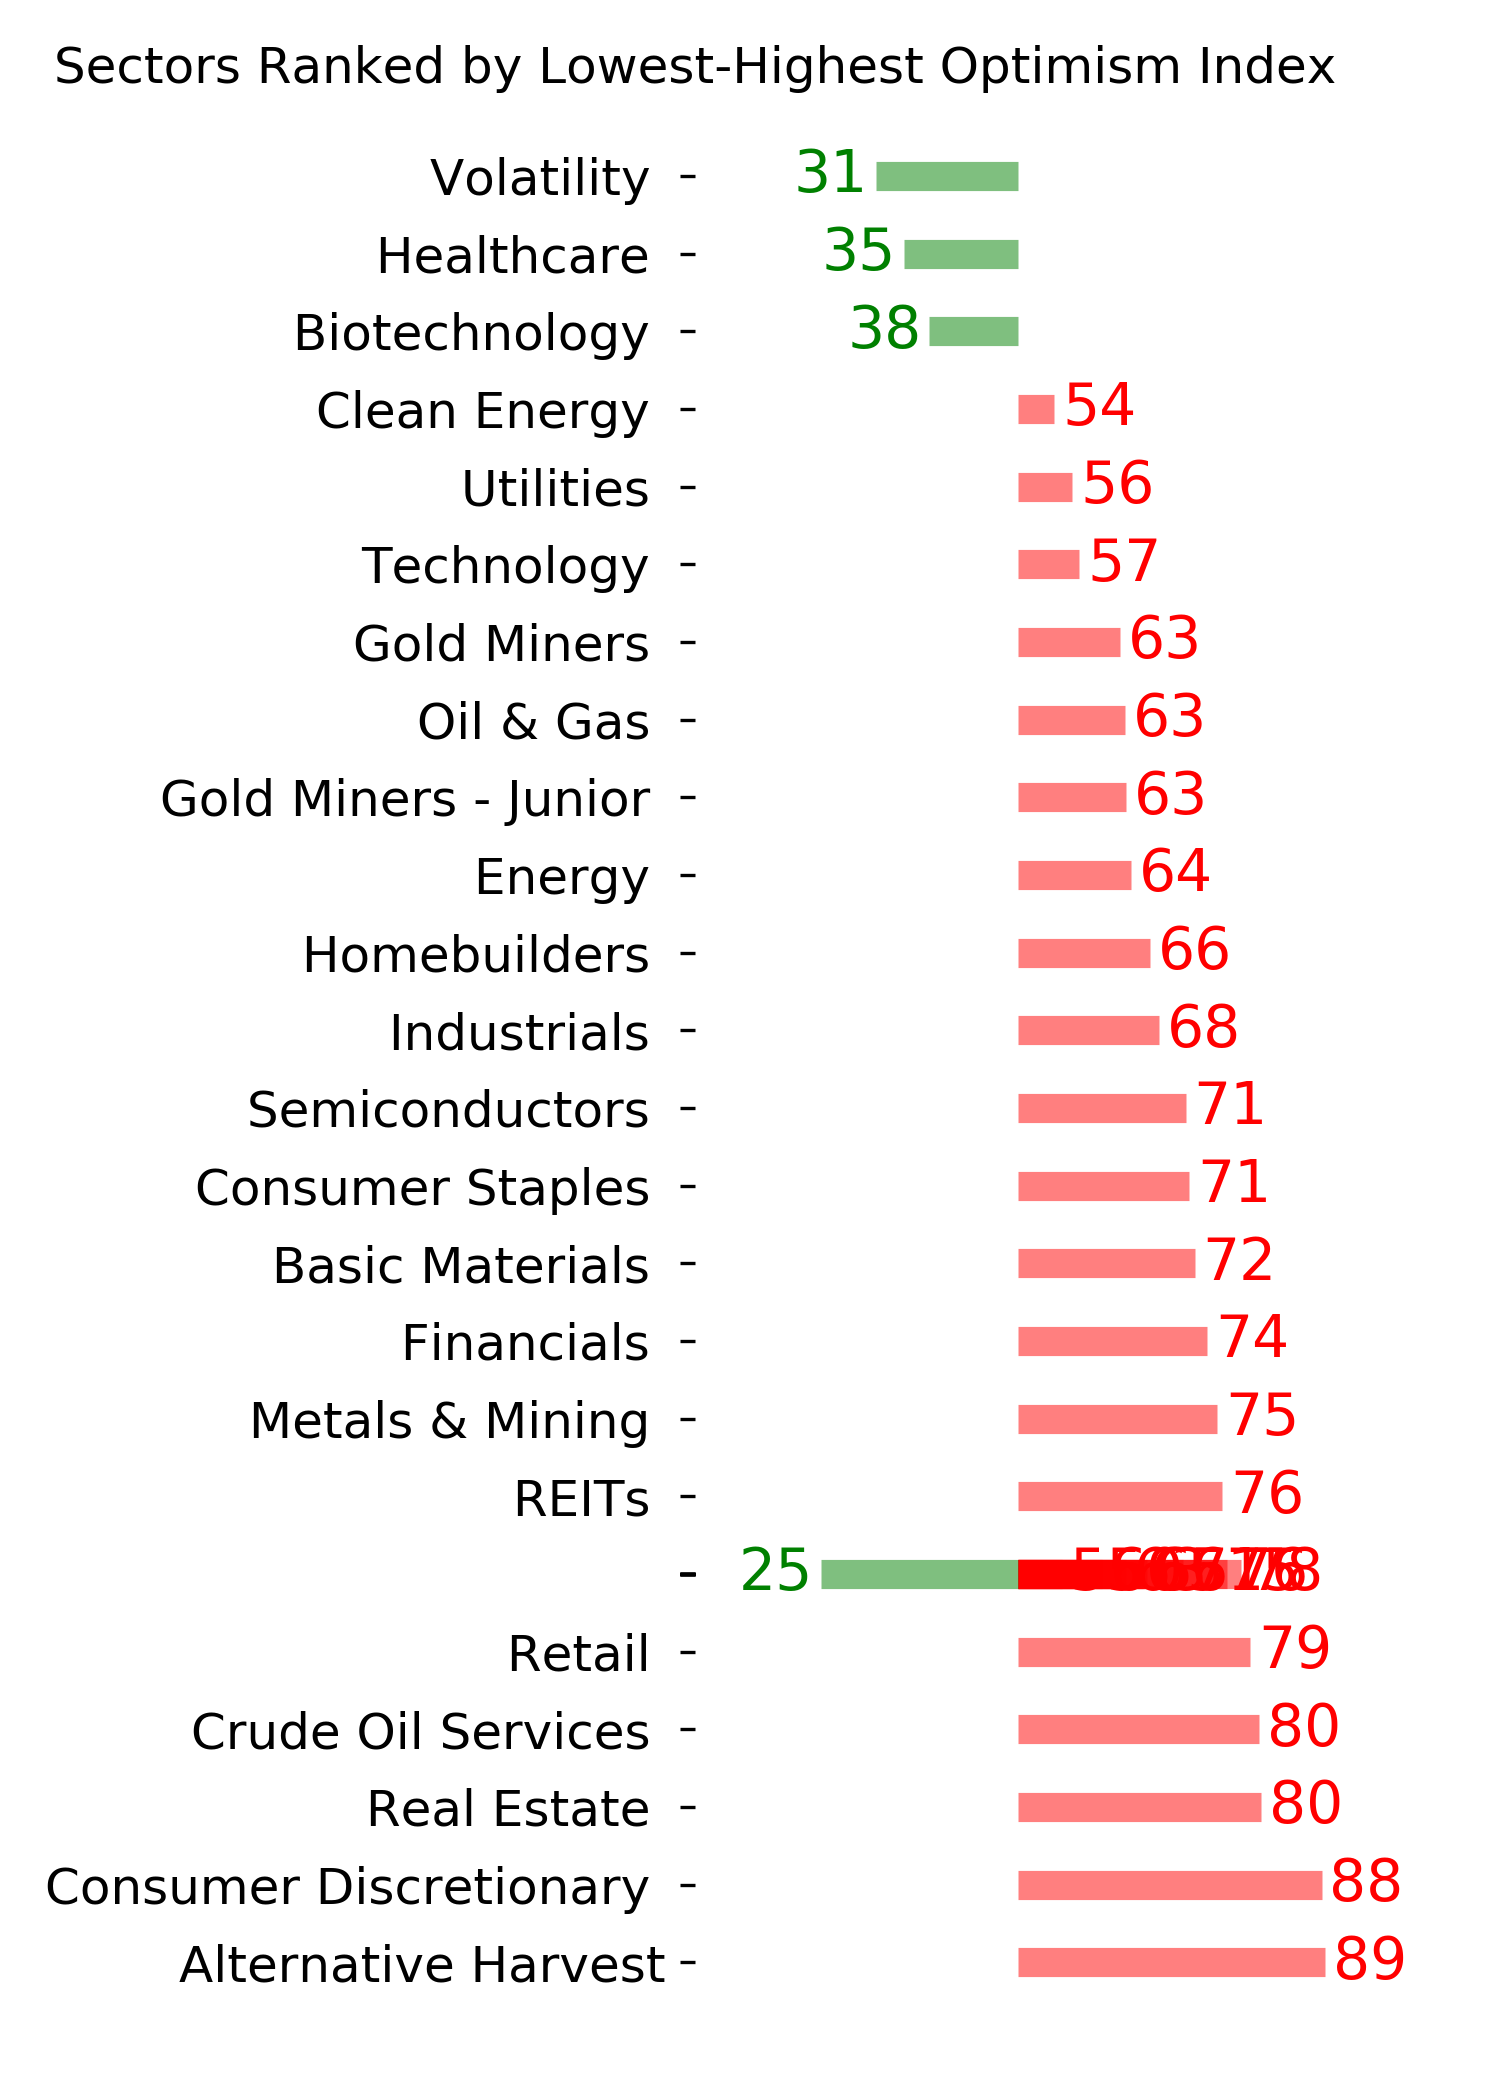
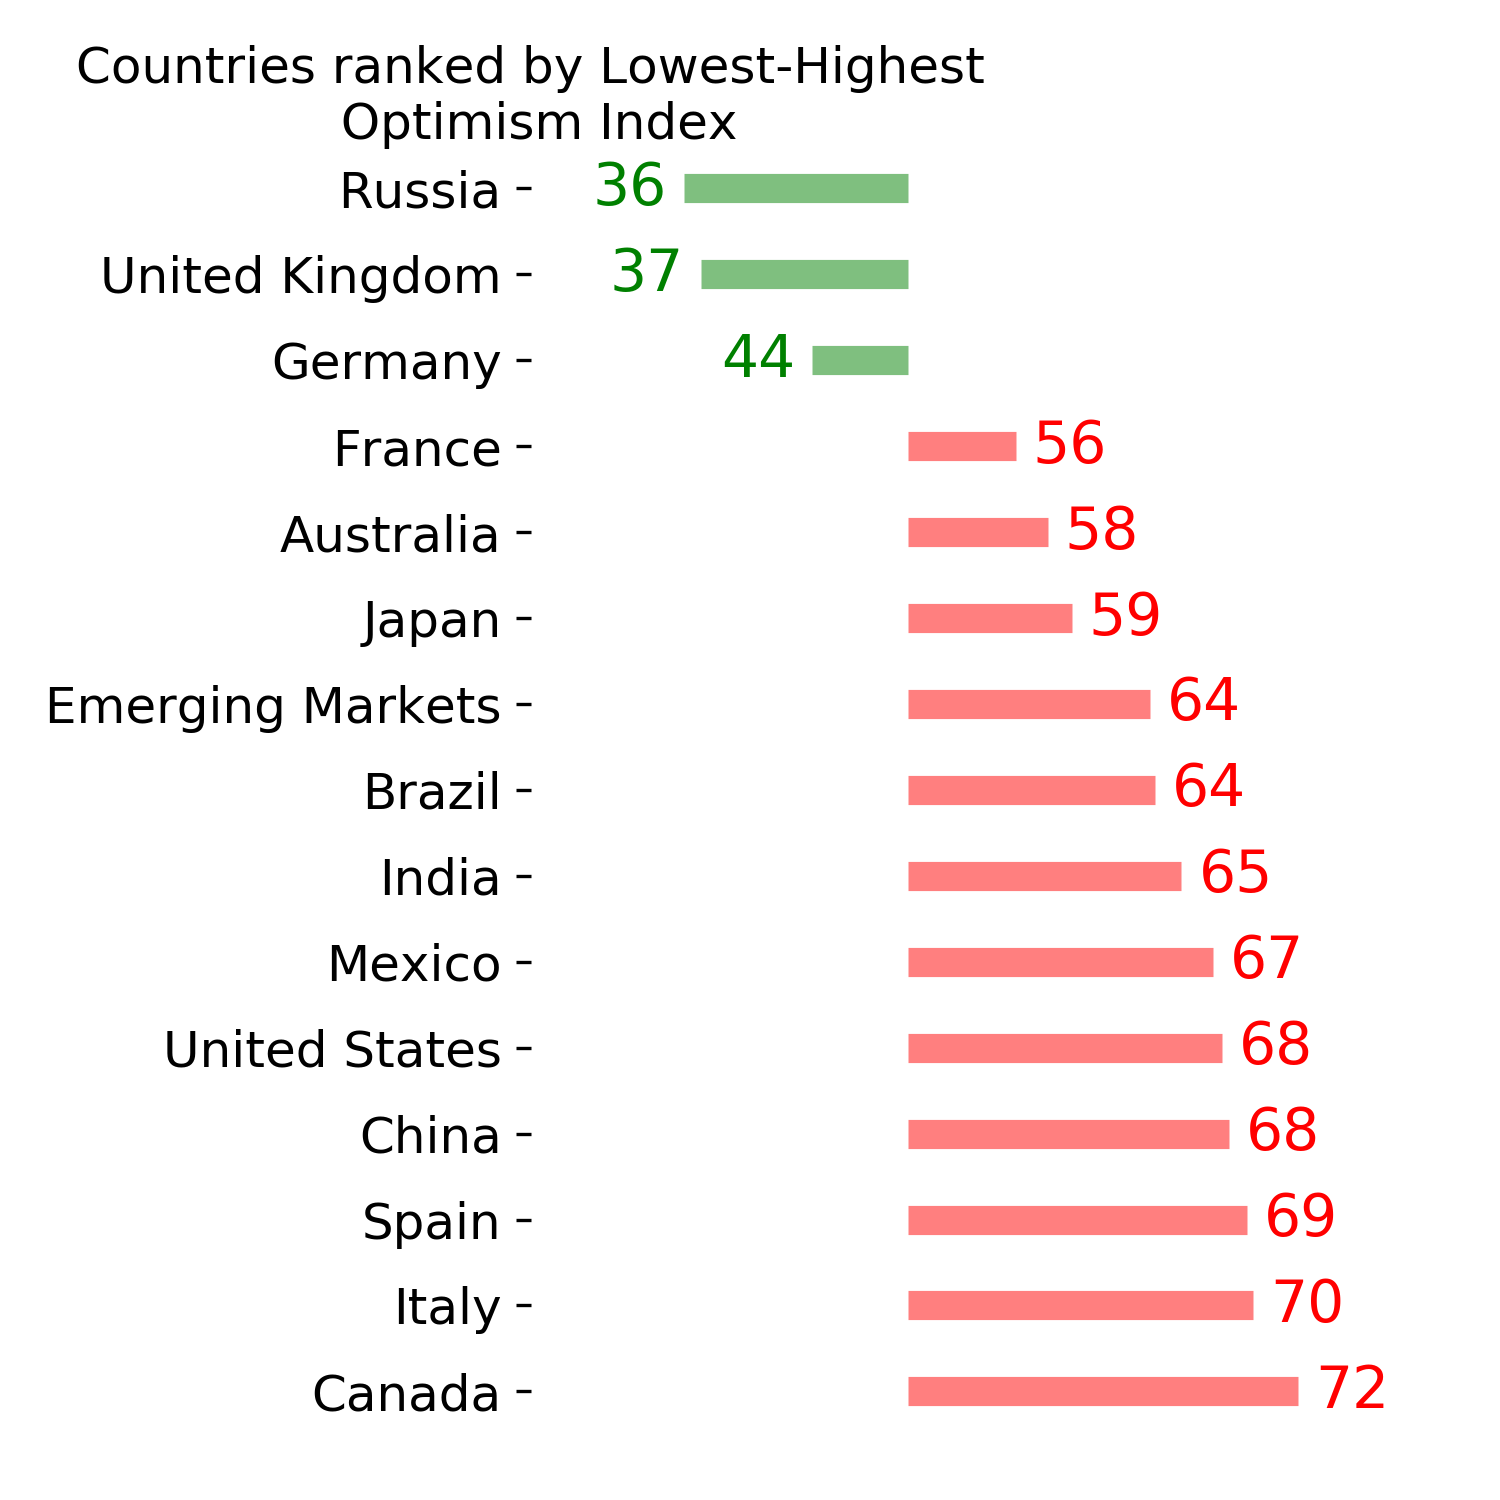
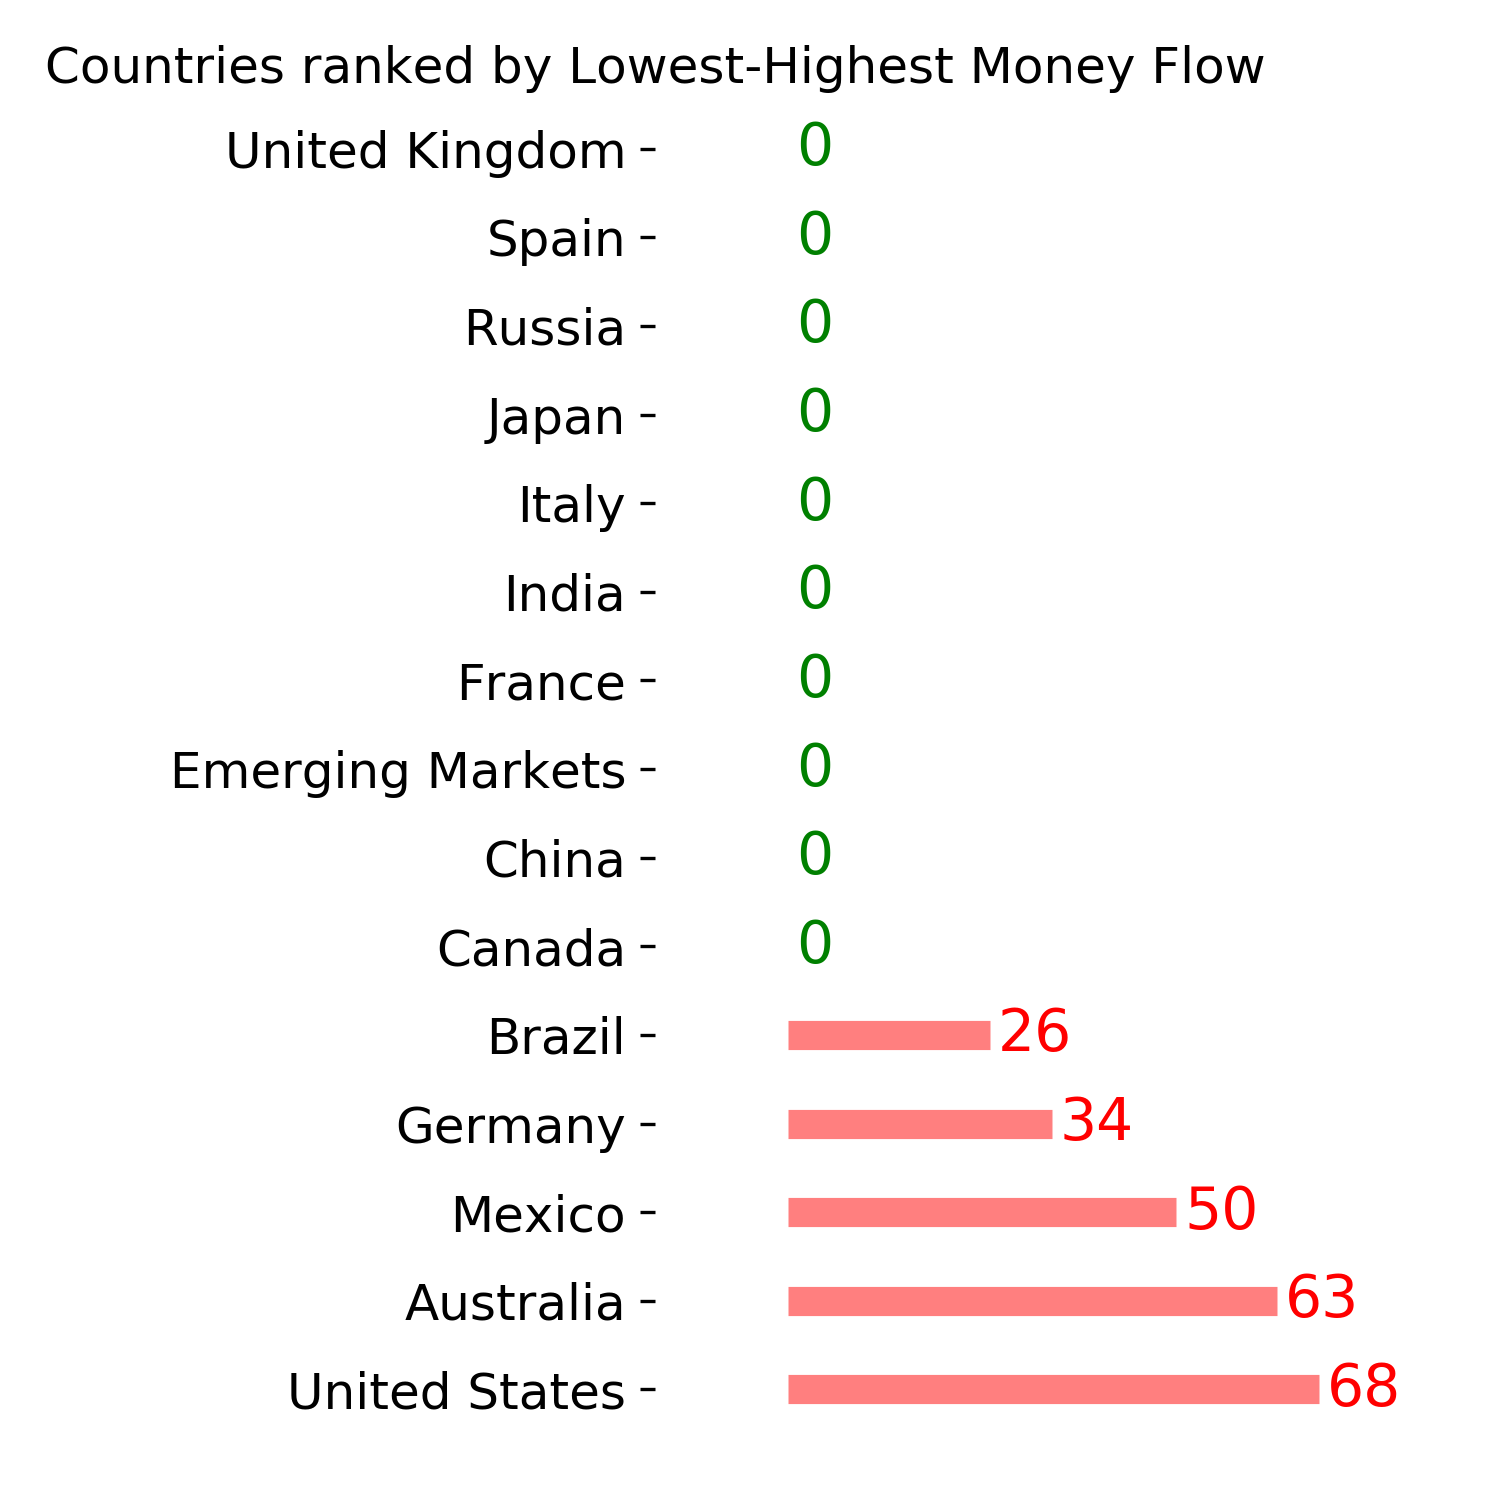
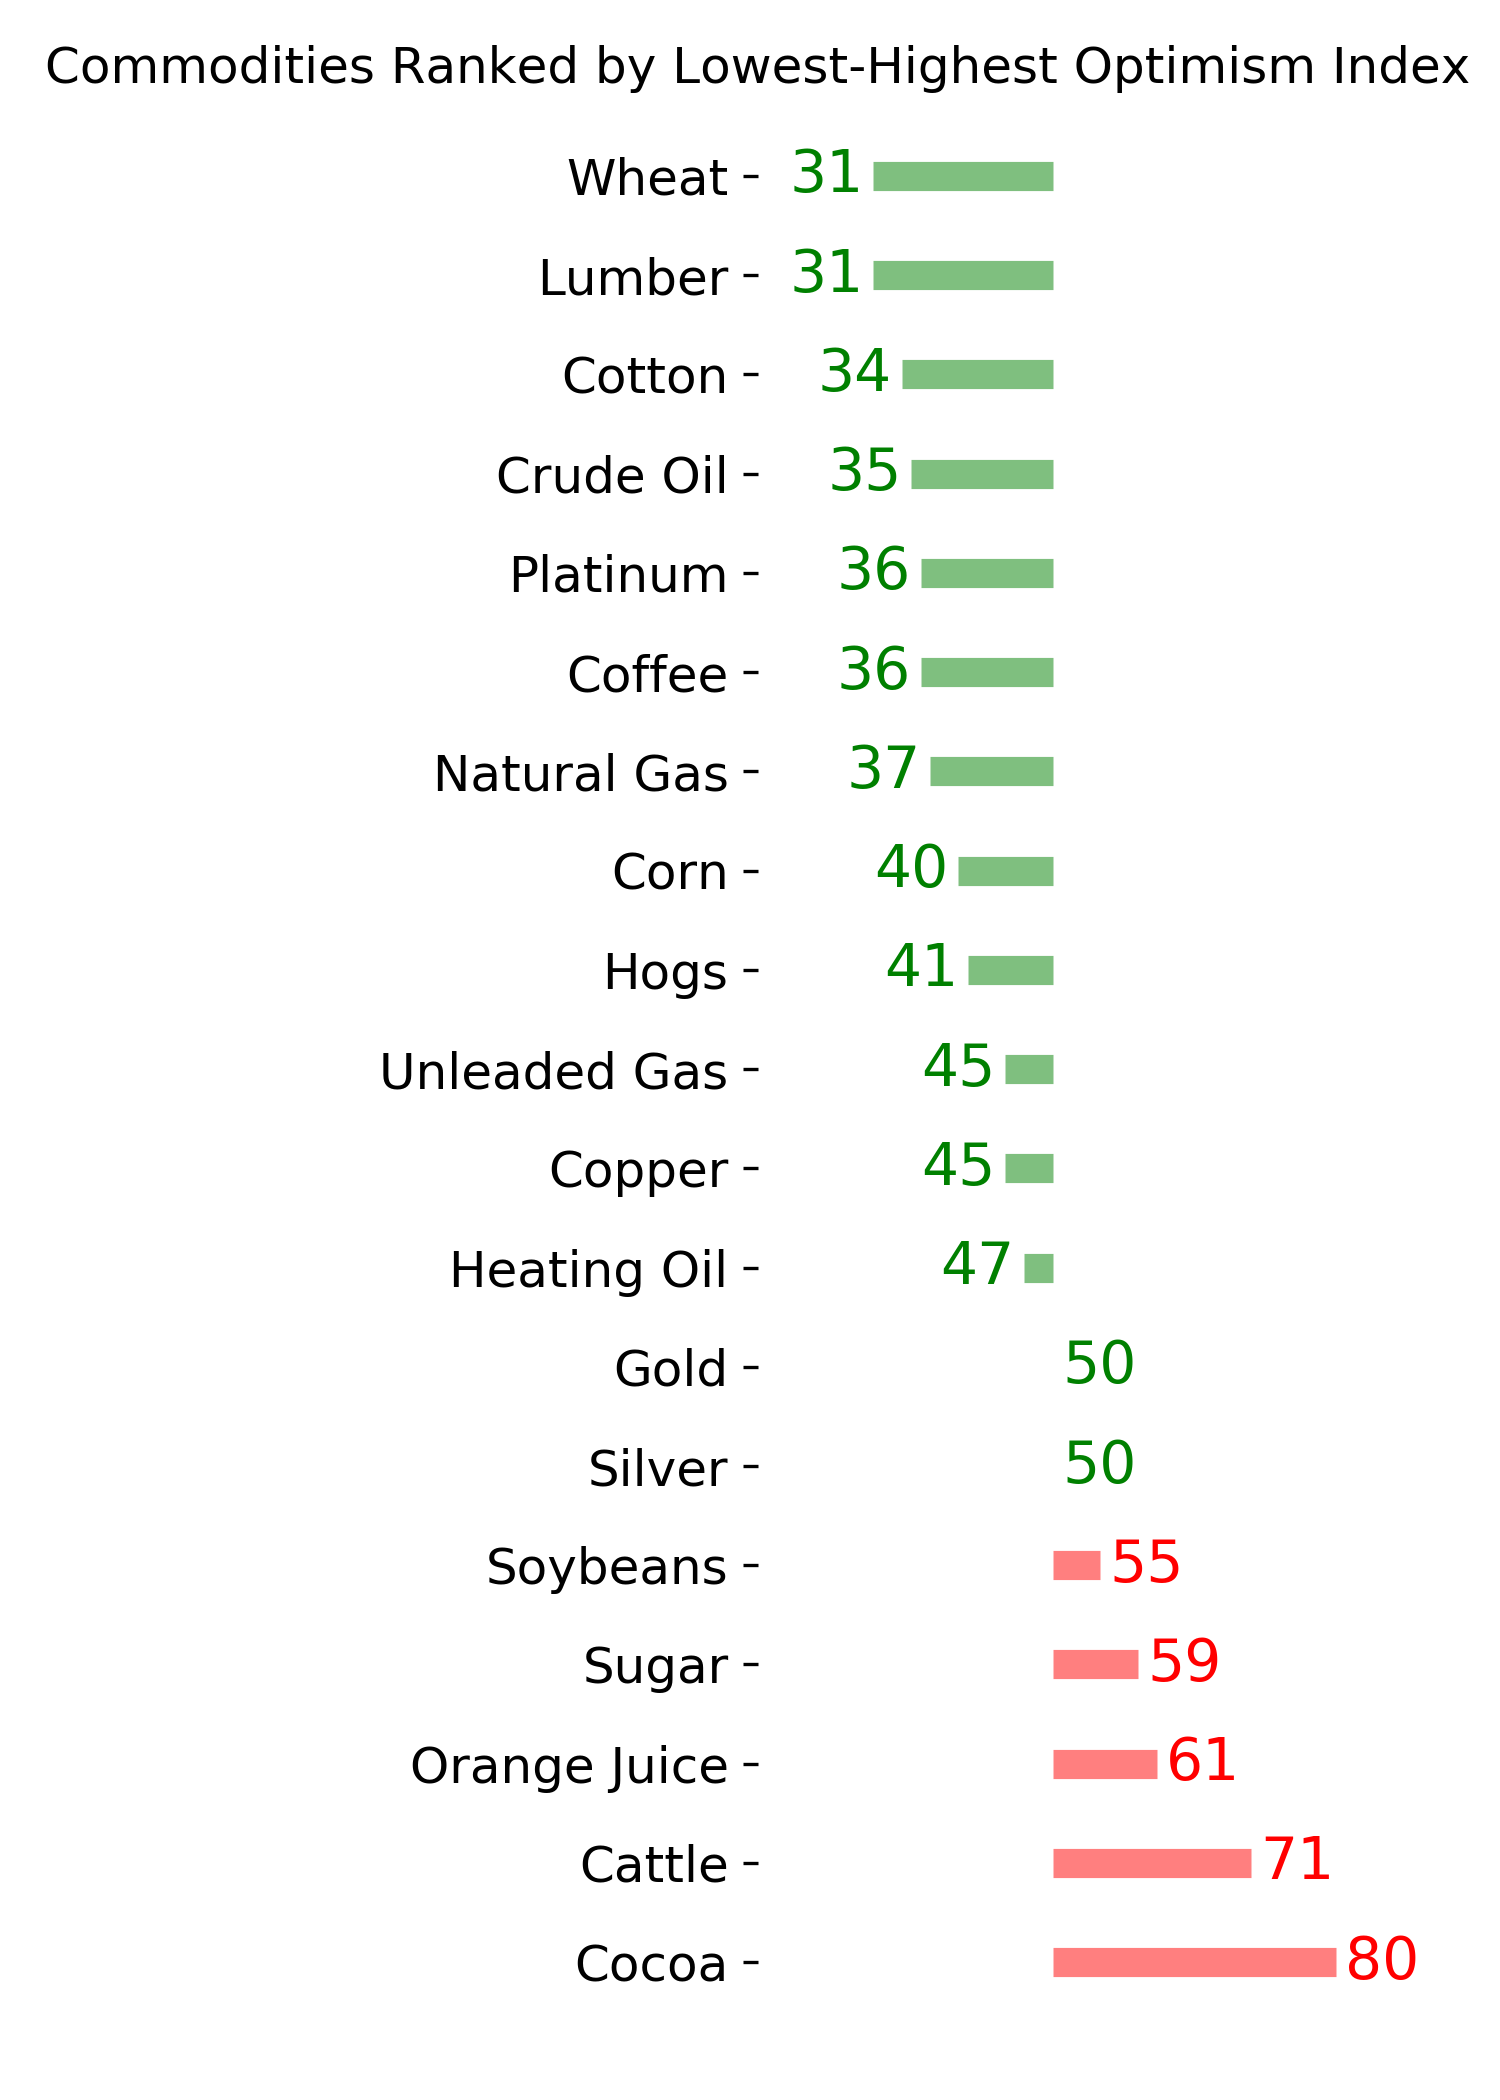
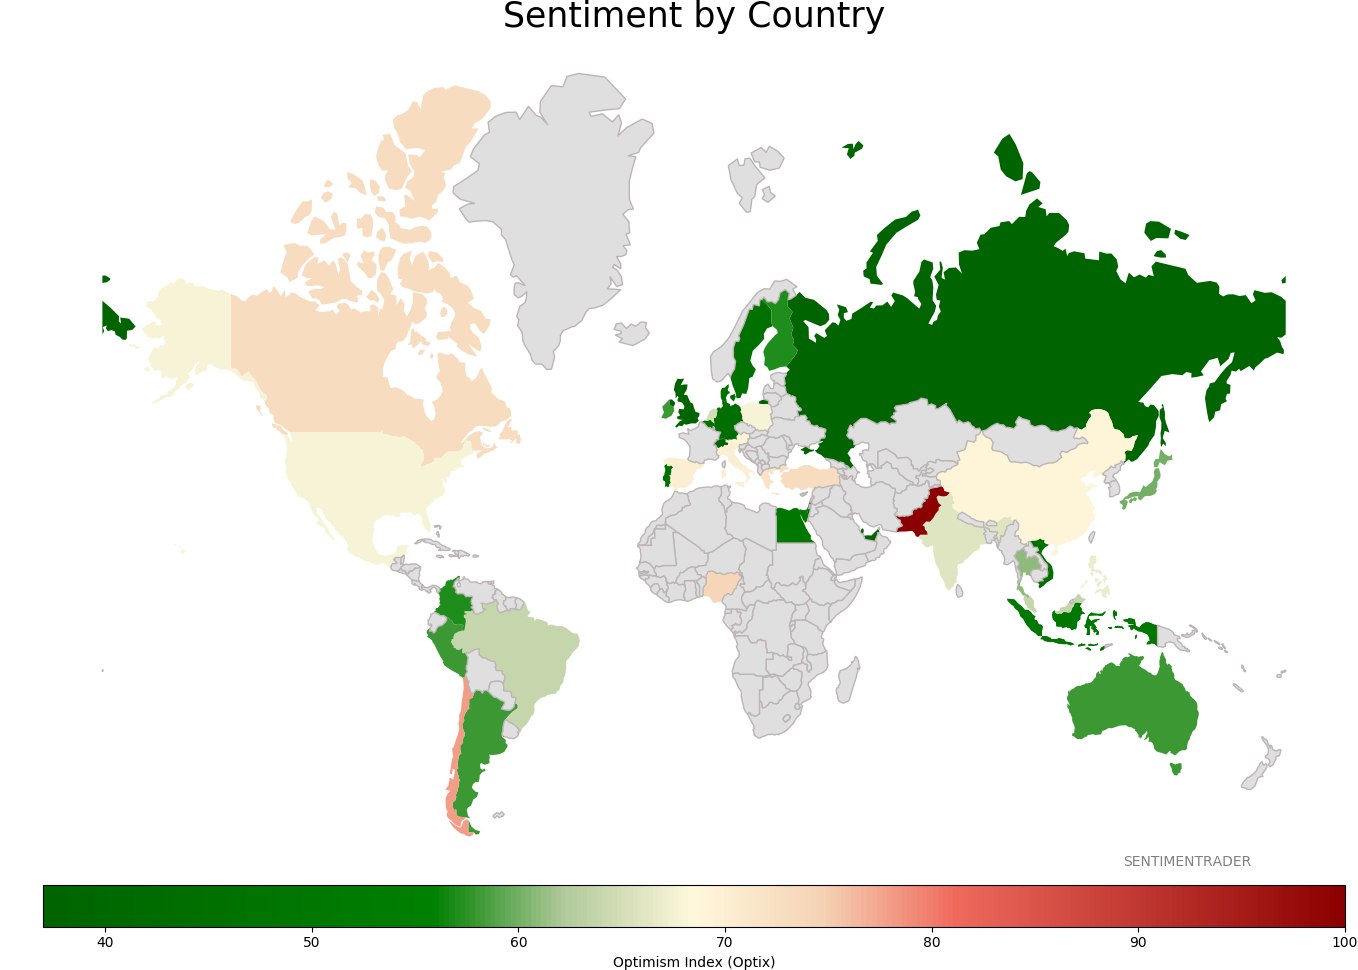
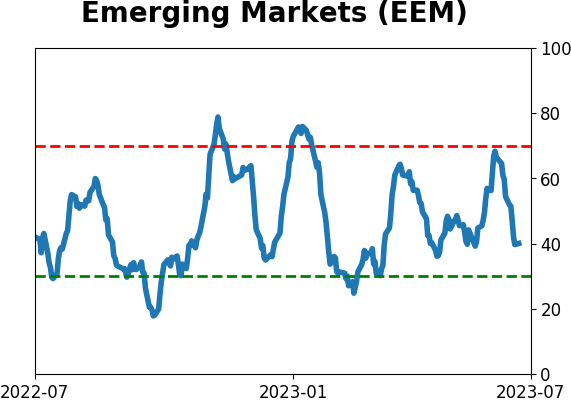
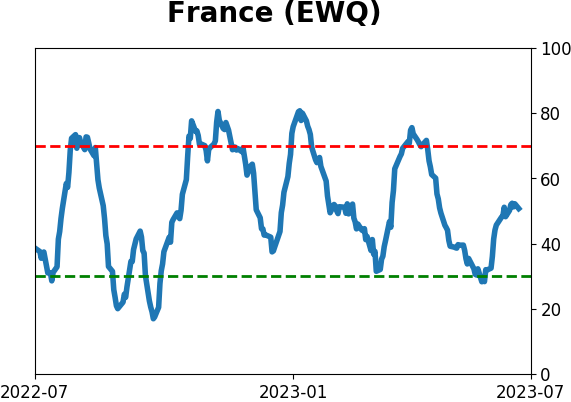
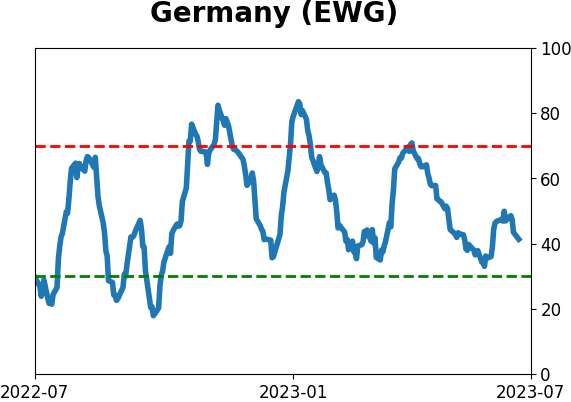
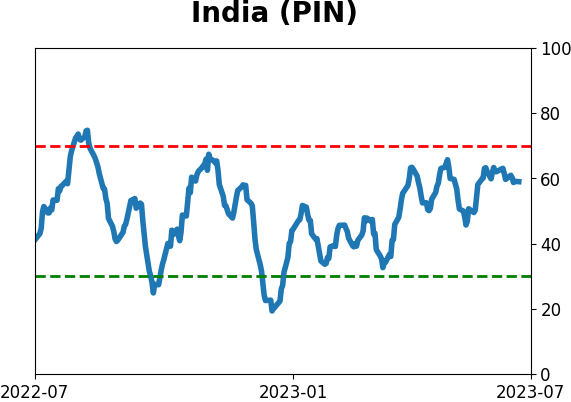
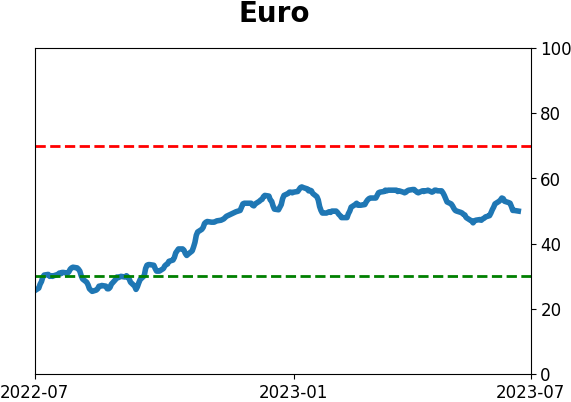
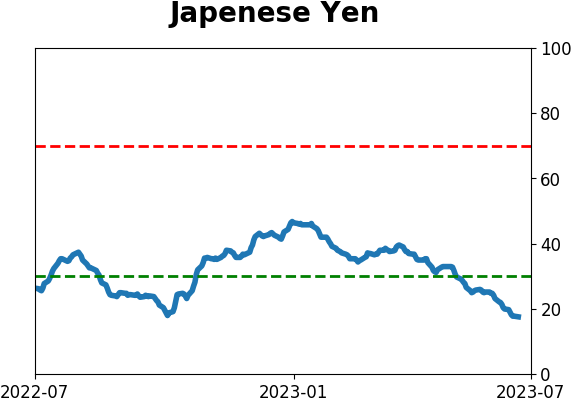
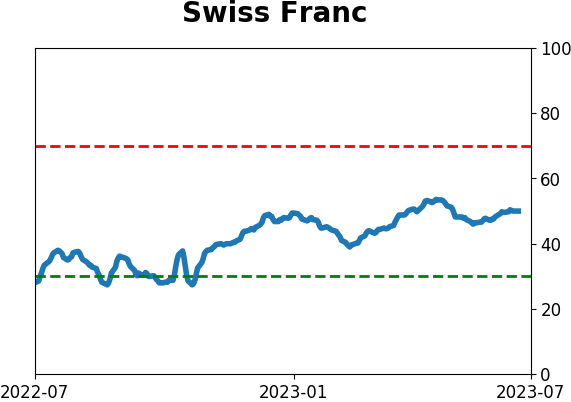
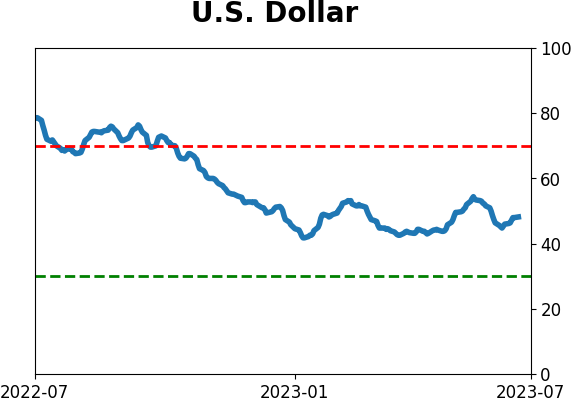
Sentiment Around The World
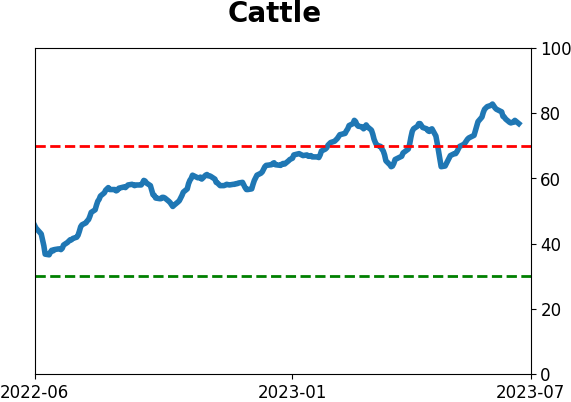
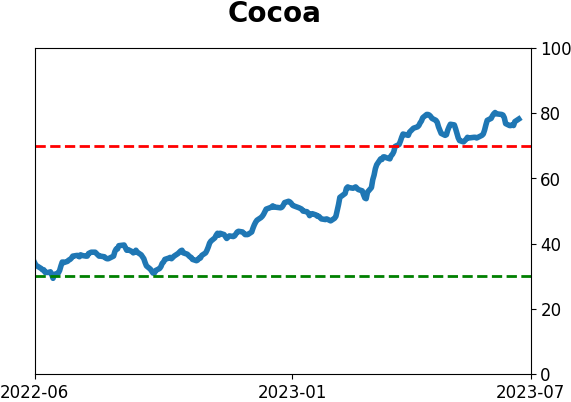
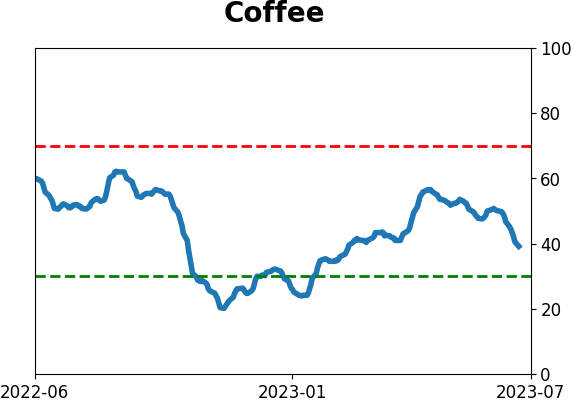
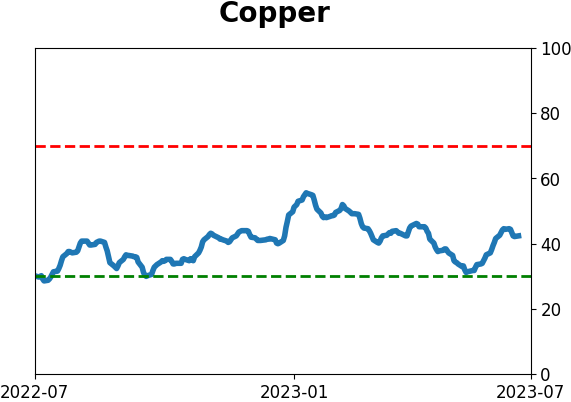
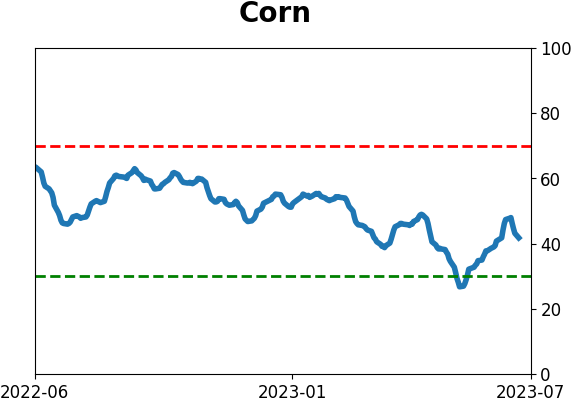
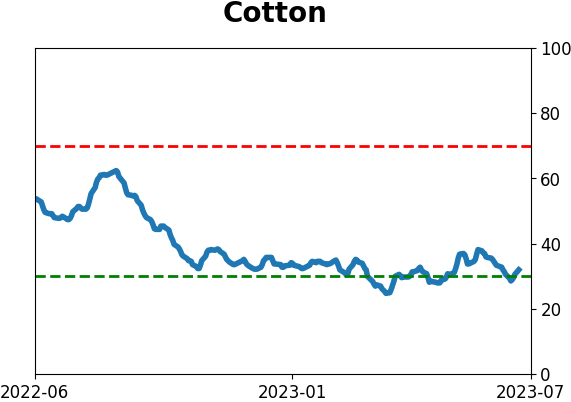
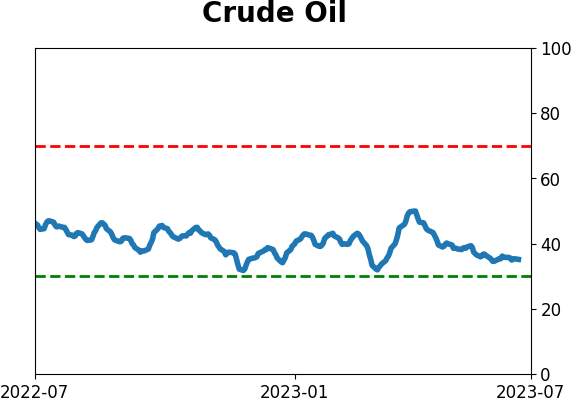
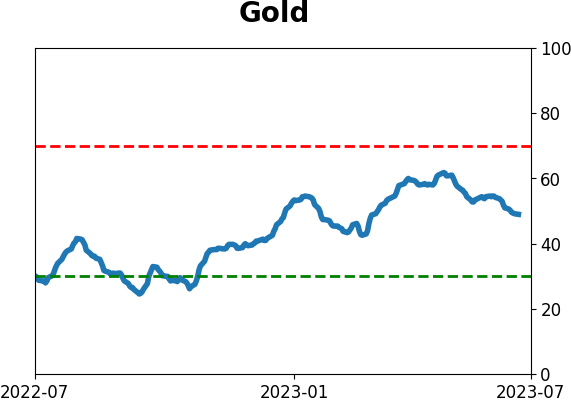
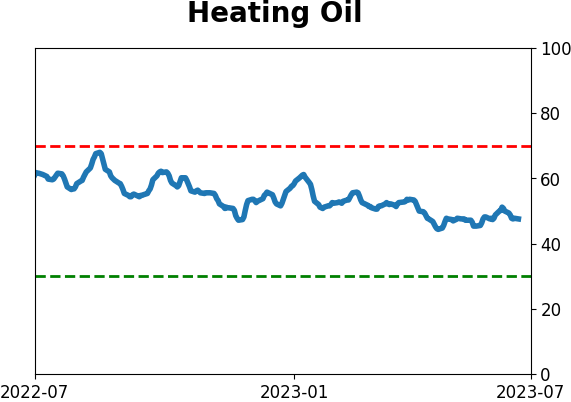
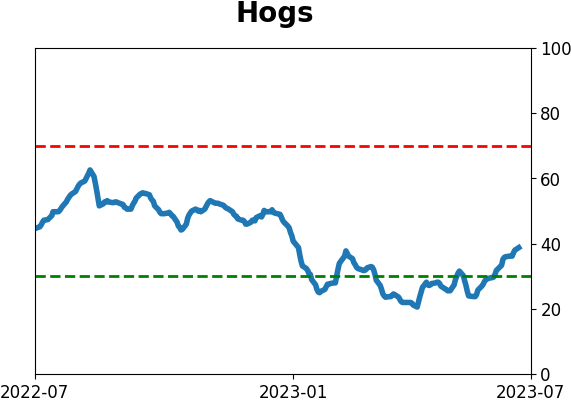
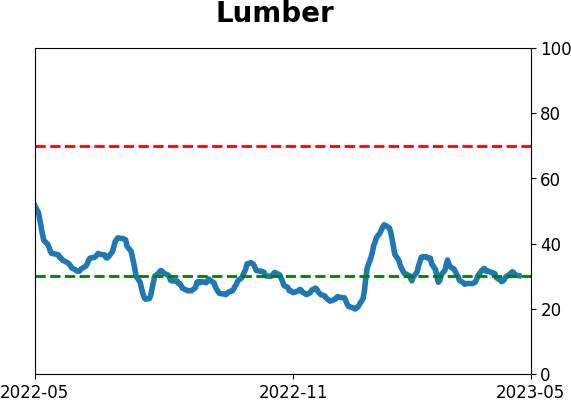
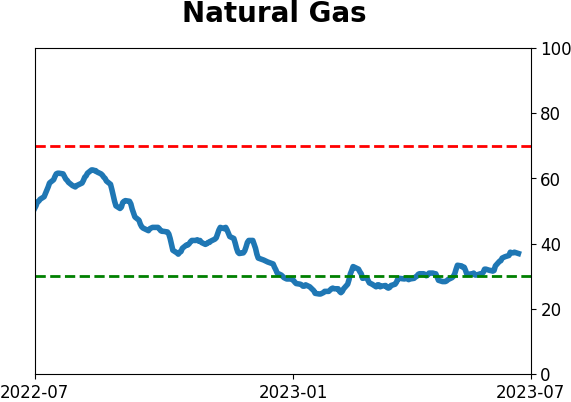
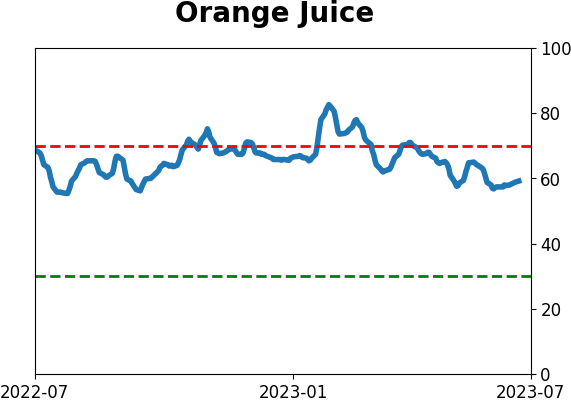
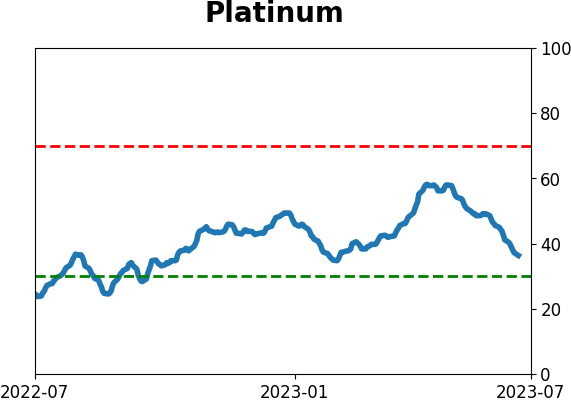
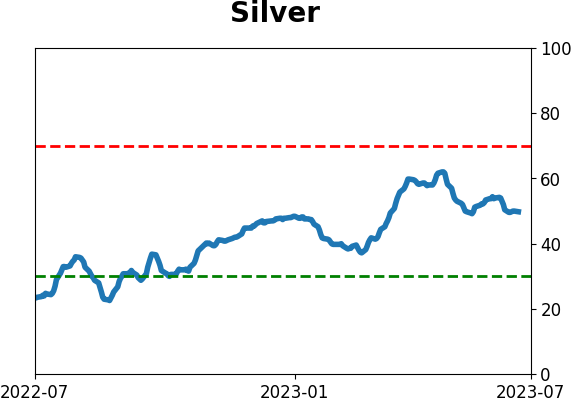
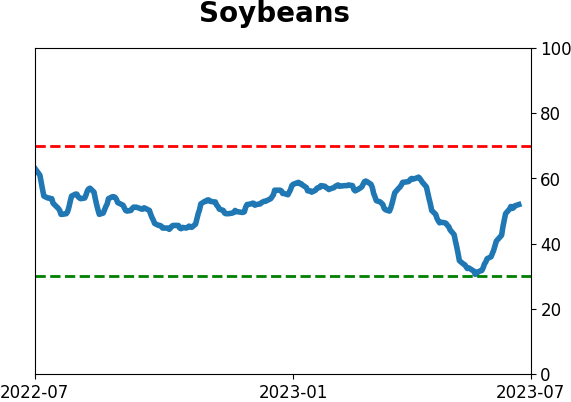
Optimism Index Thumbnails
|
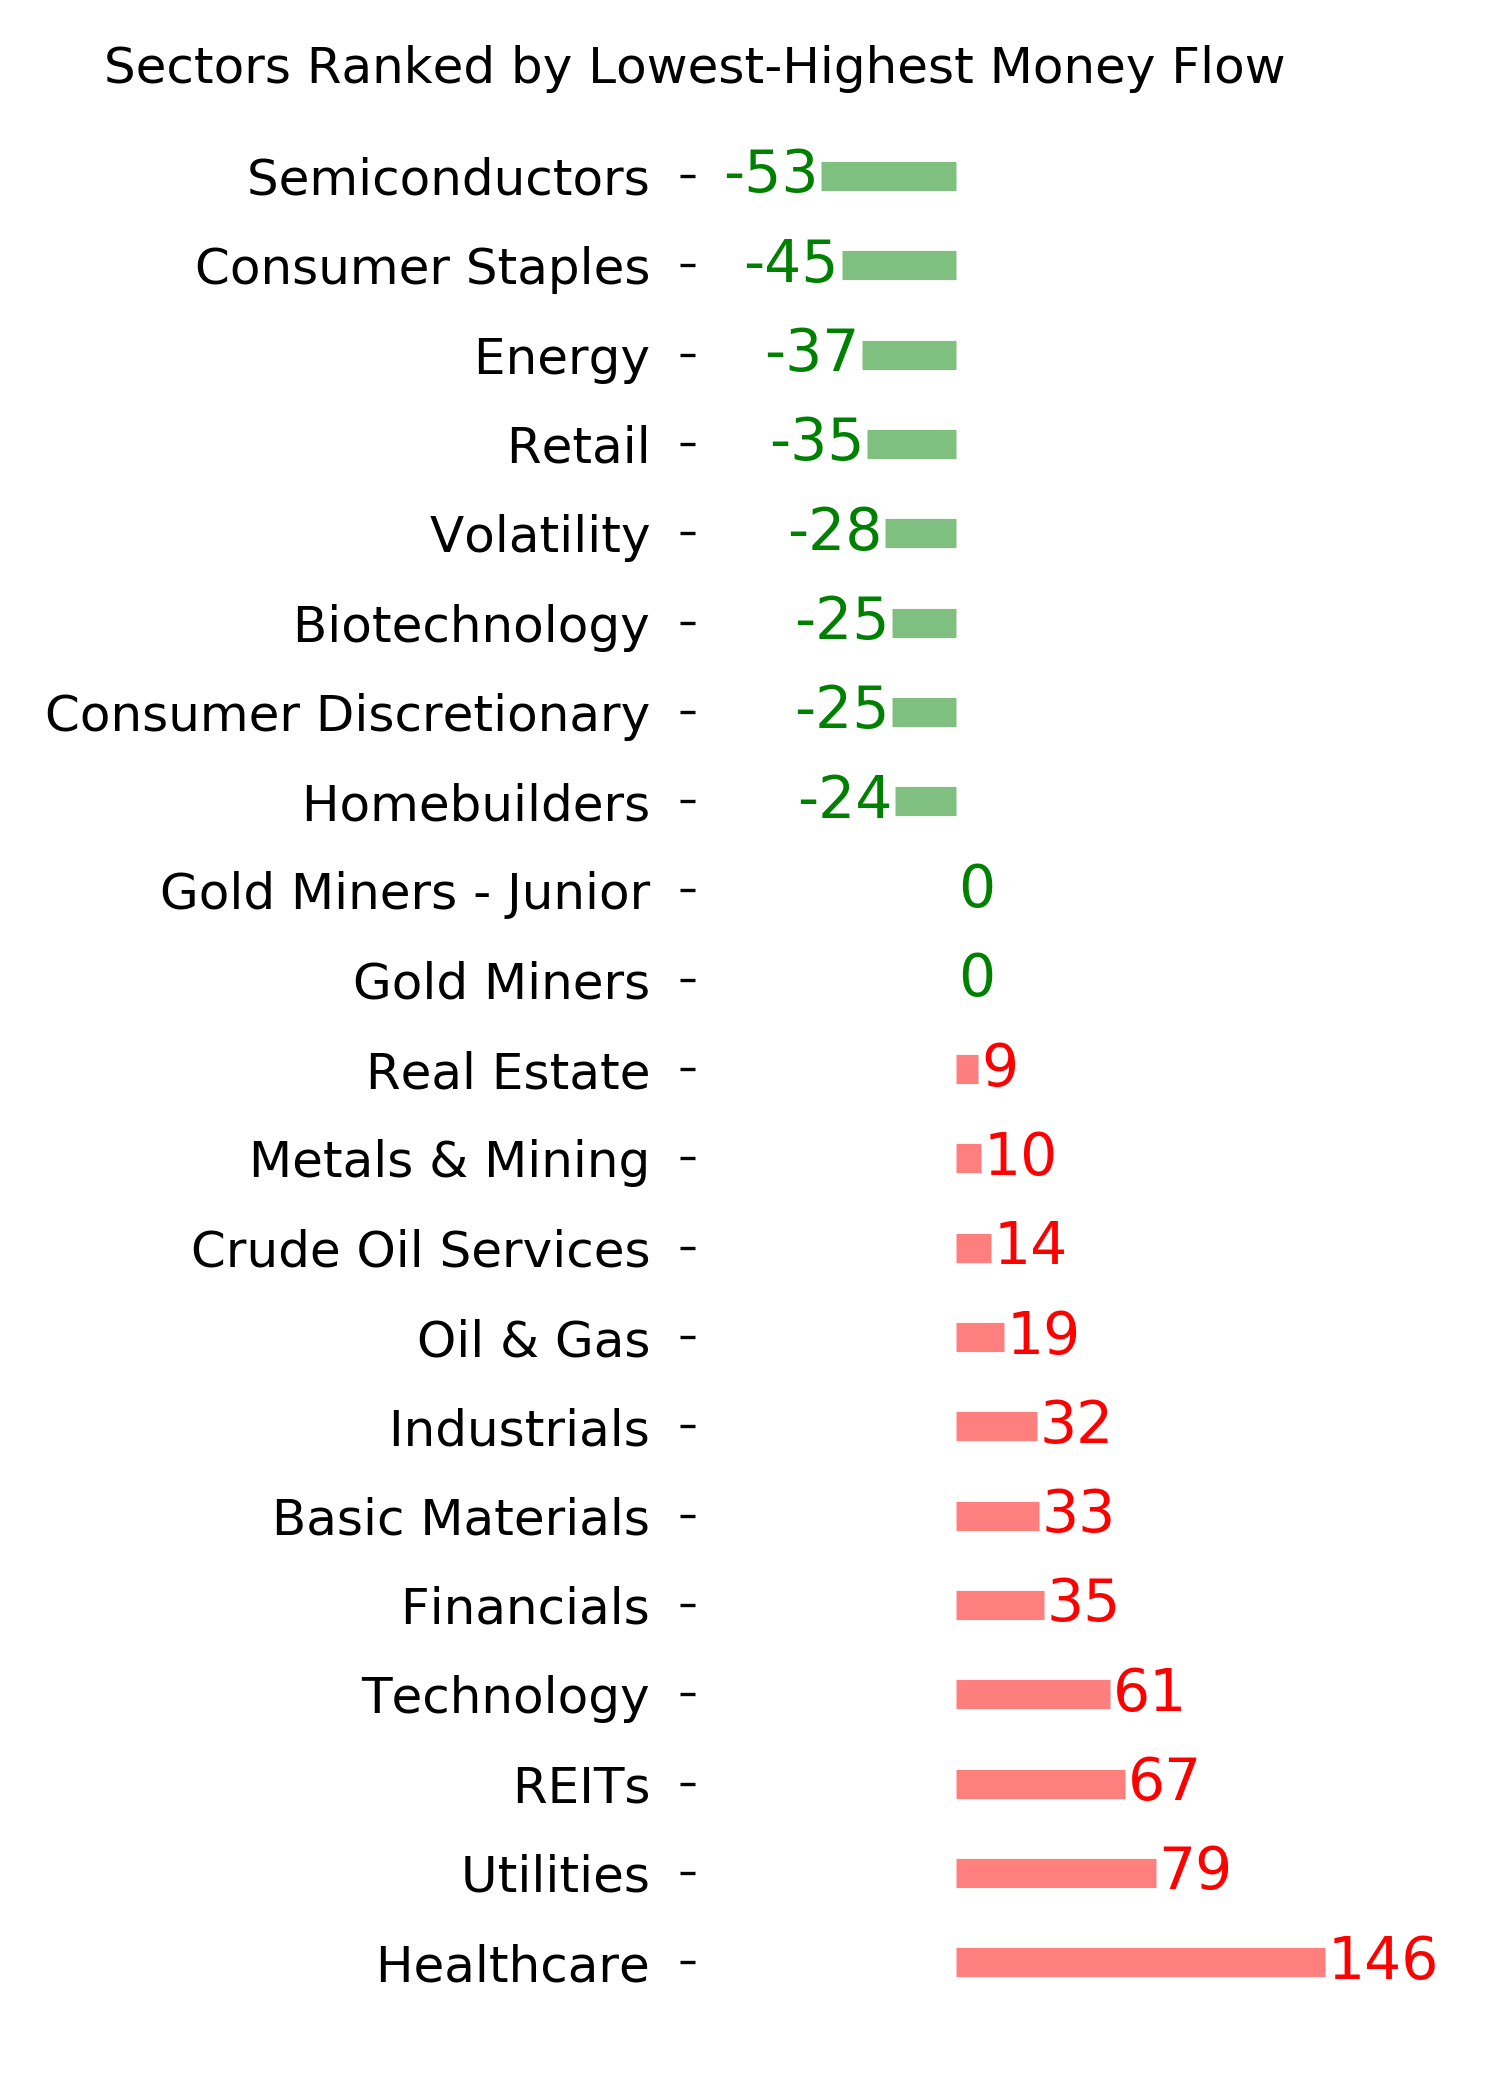
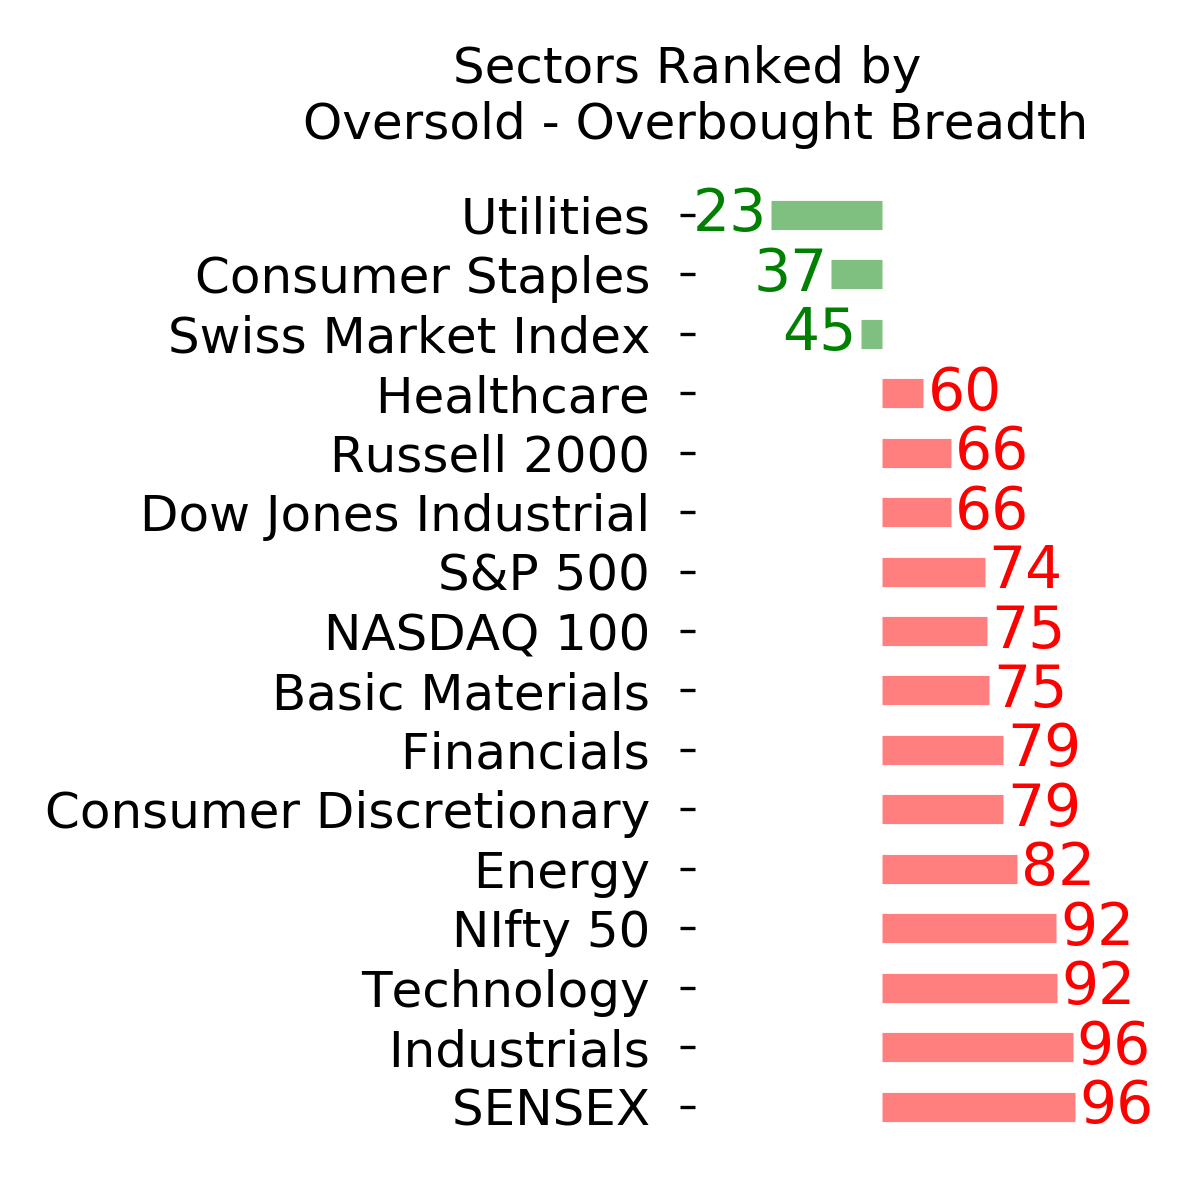
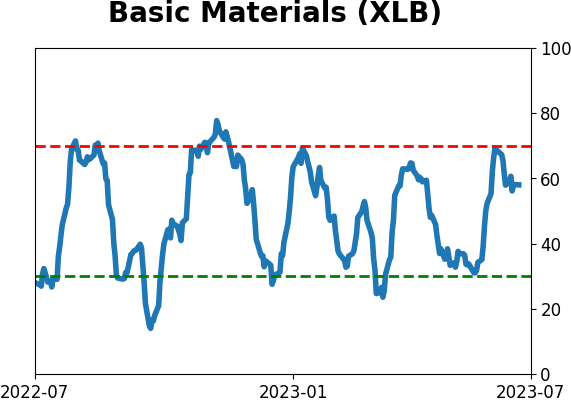
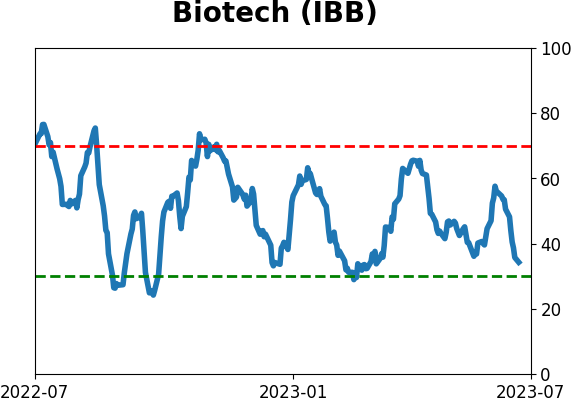
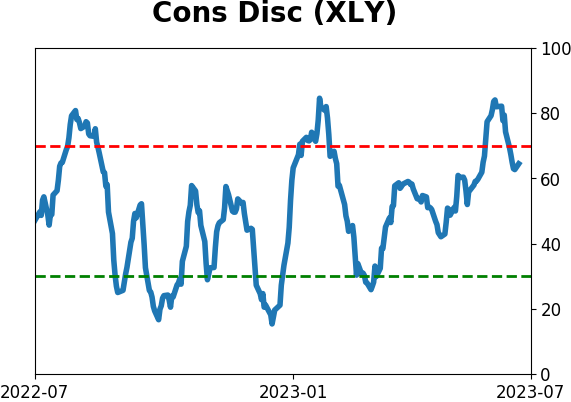
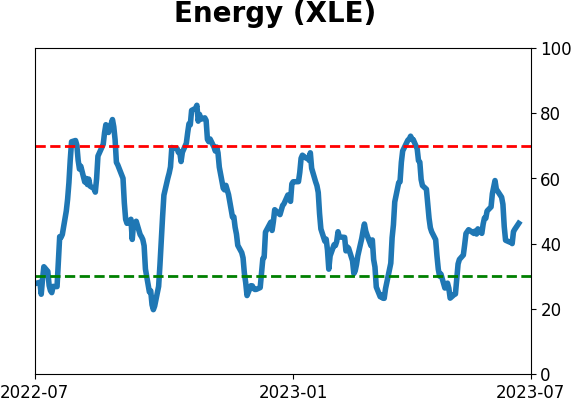
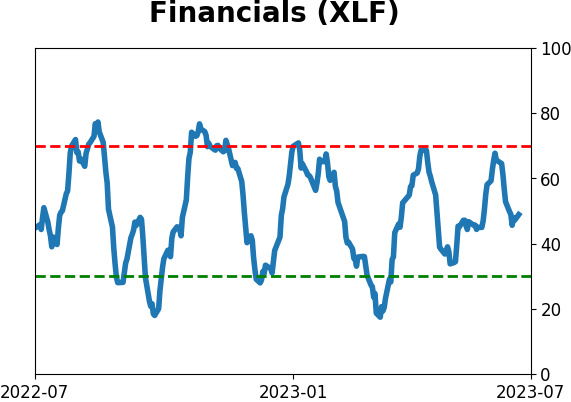
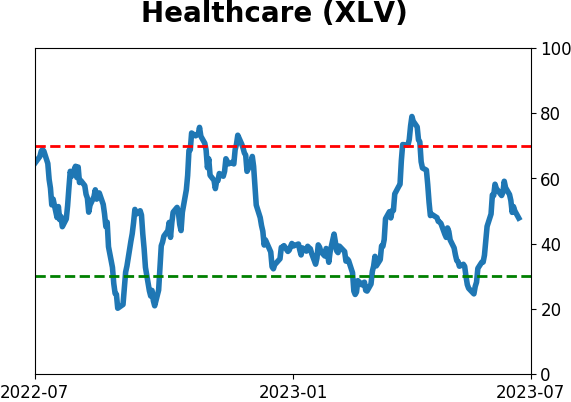
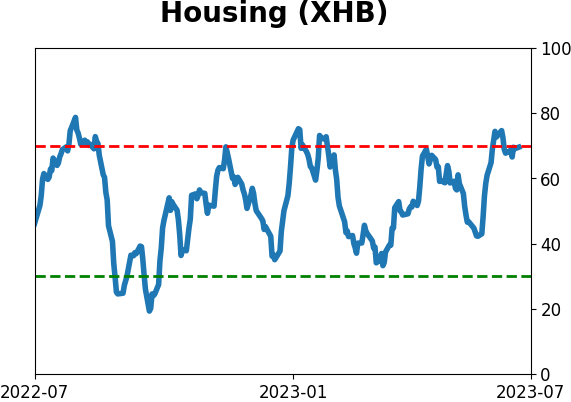
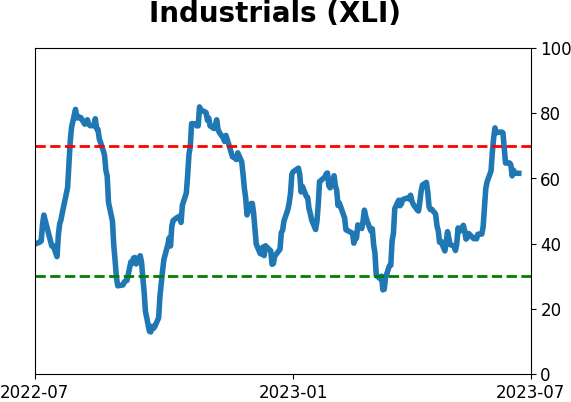
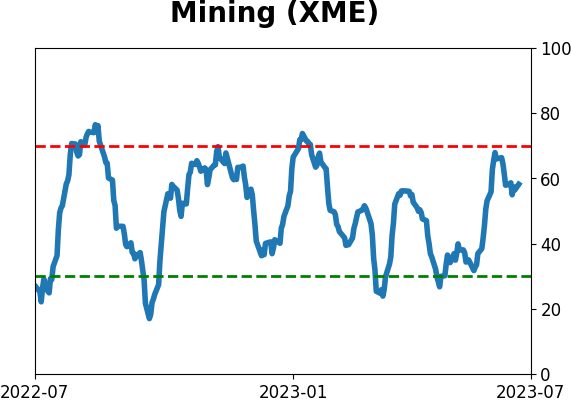
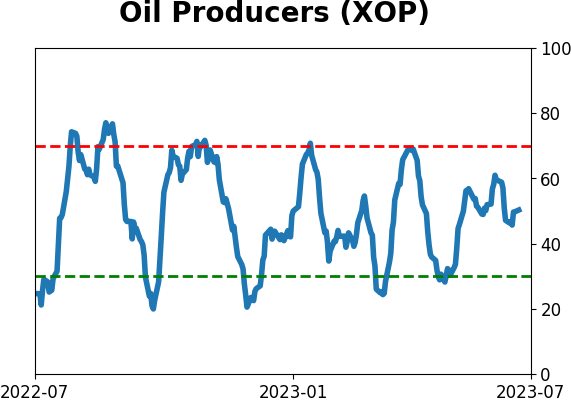
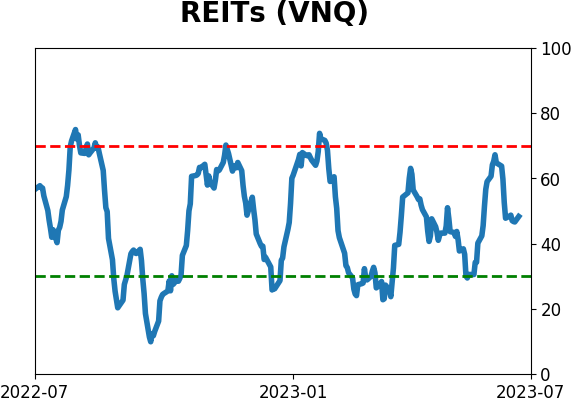
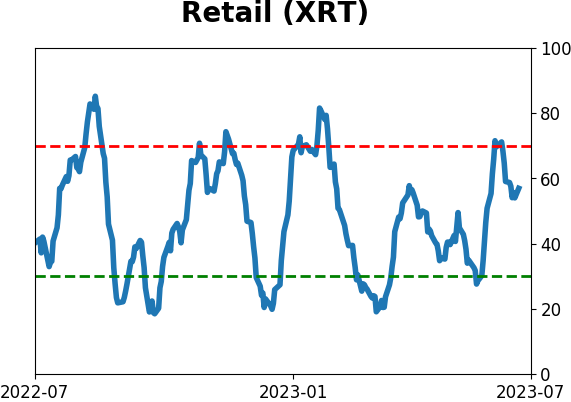
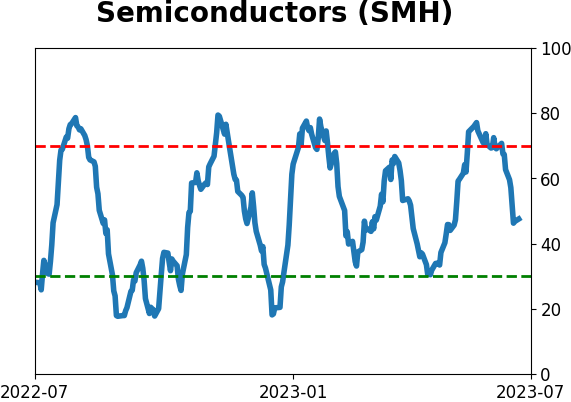
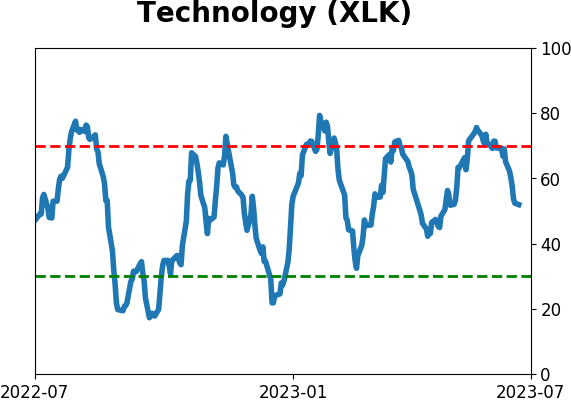
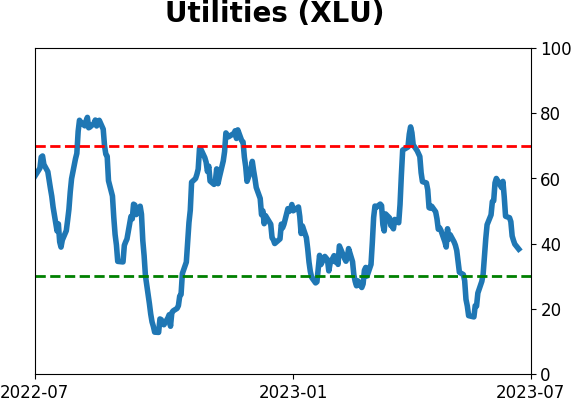
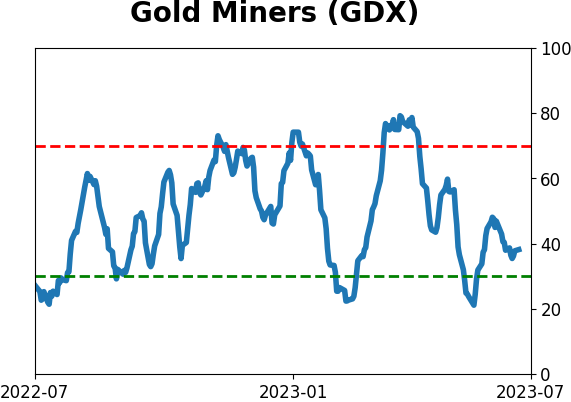
Sector ETF's - 10-Day Moving Average
|
|
|
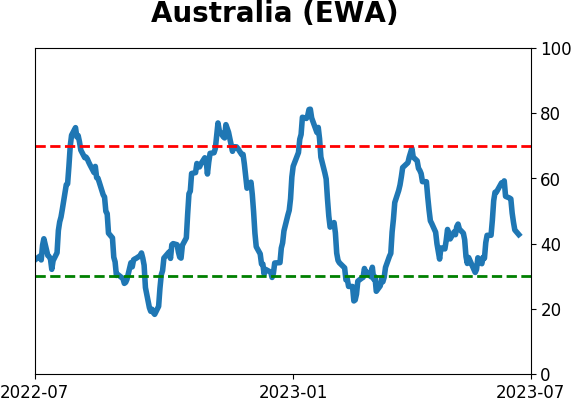
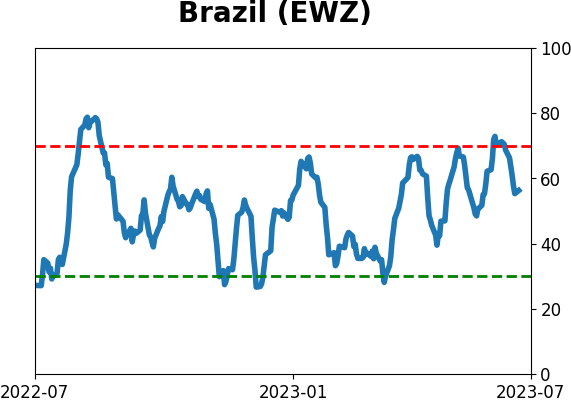
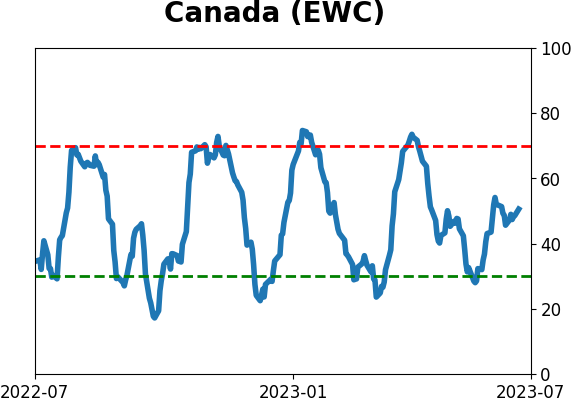
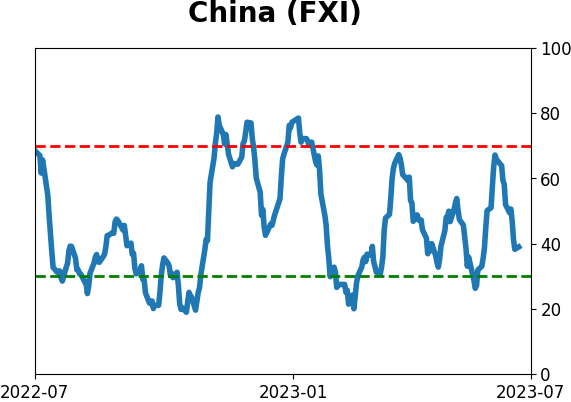
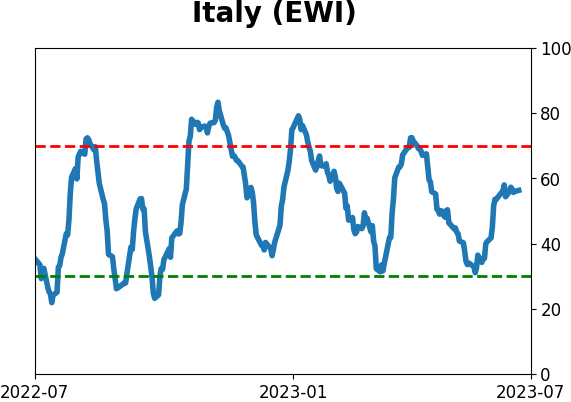
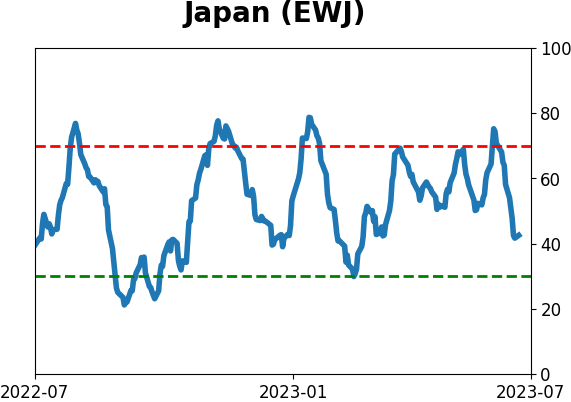
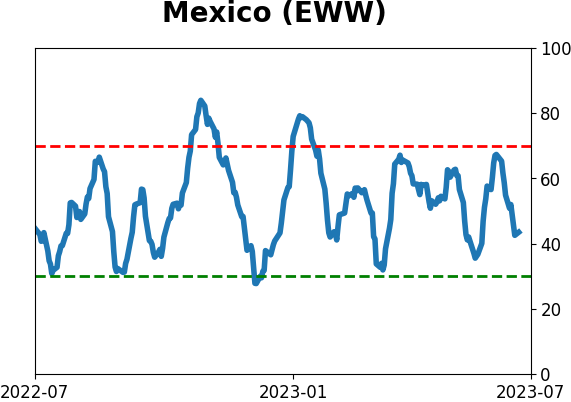
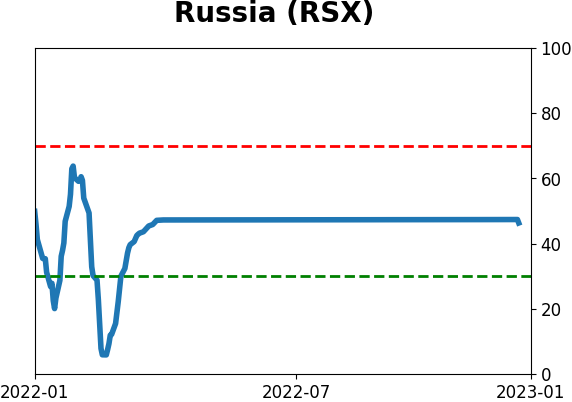
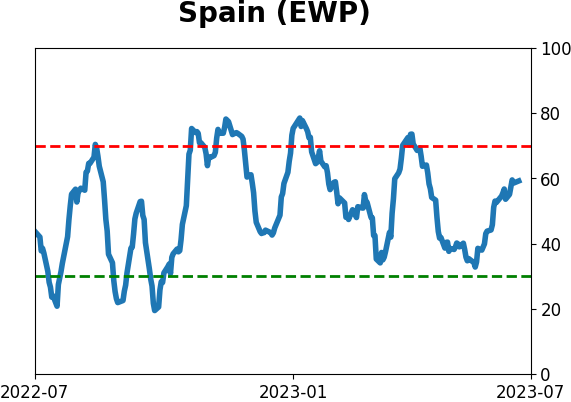
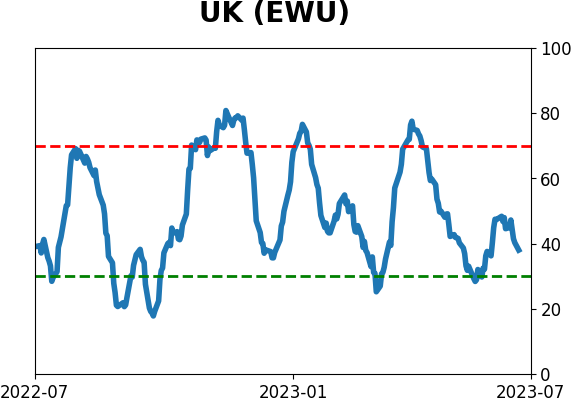
Country ETF's - 10-Day Moving Average
|
|
|
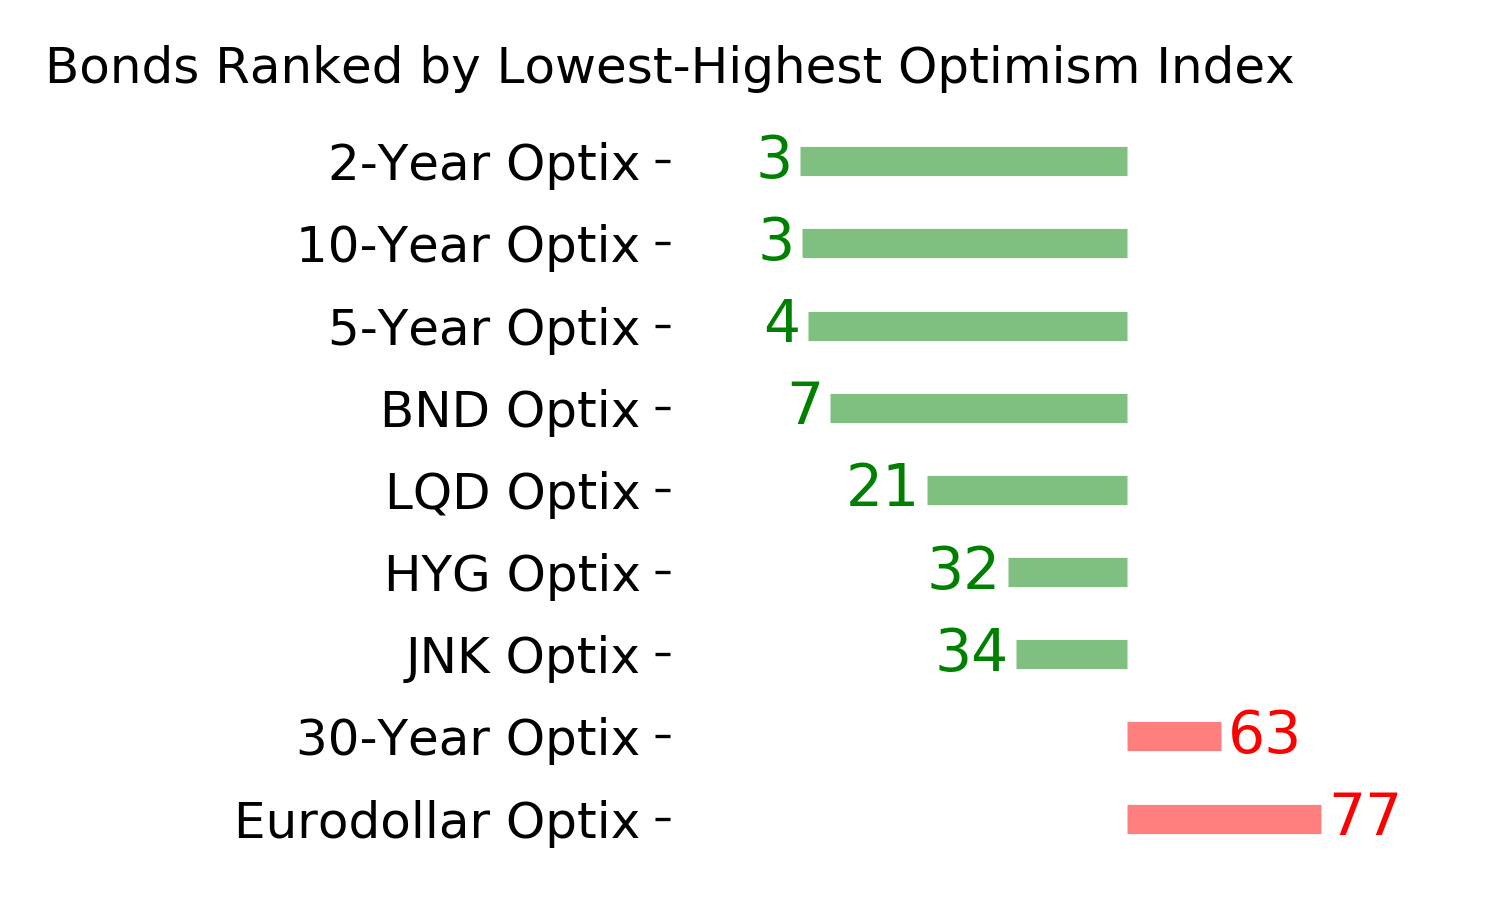
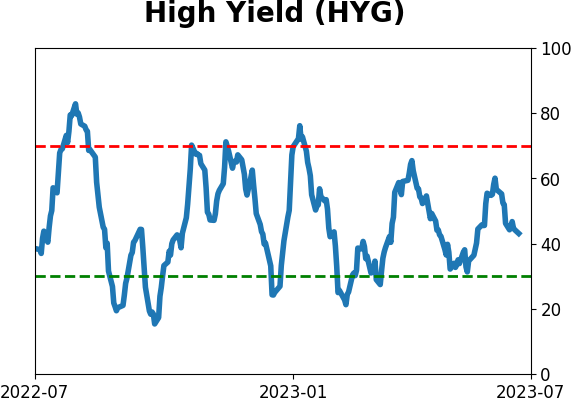
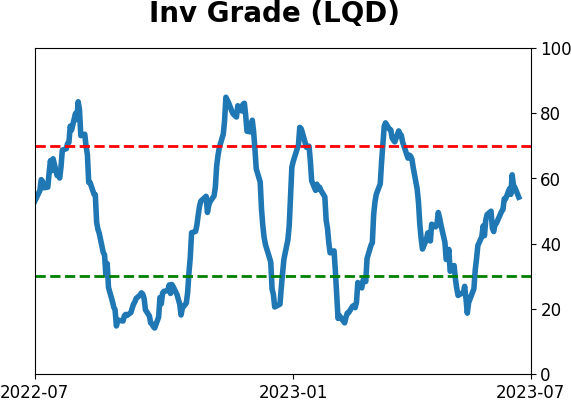
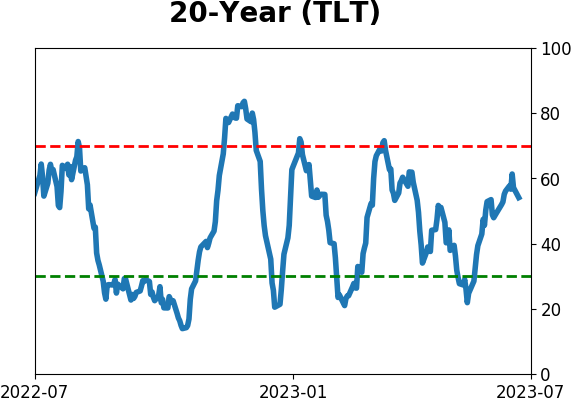
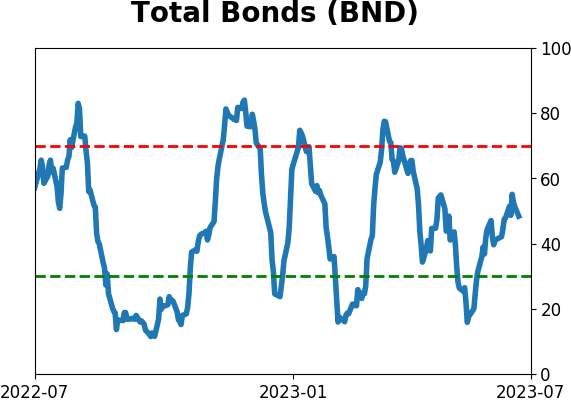
Bond ETF's - 10-Day Moving Average
|
|
|
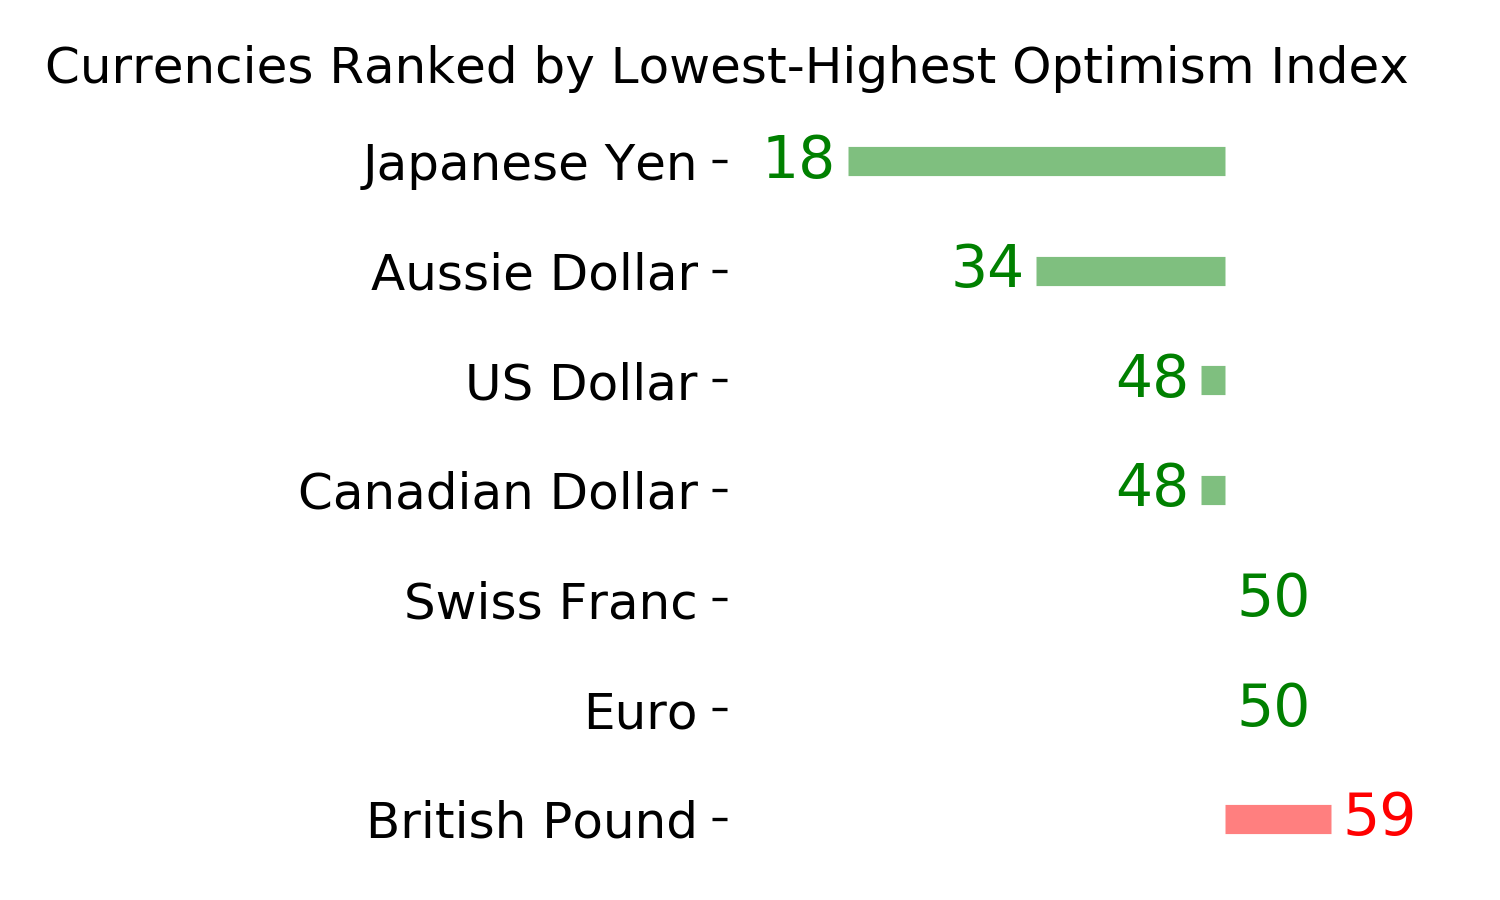
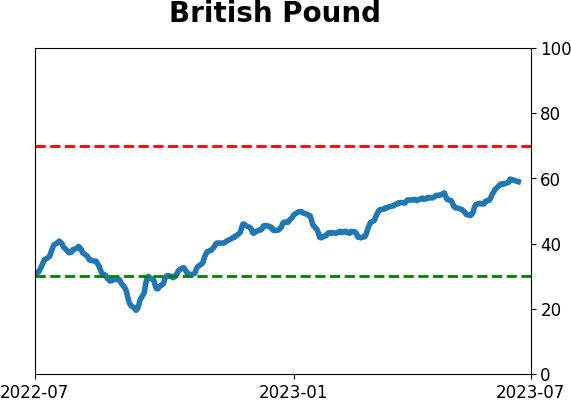
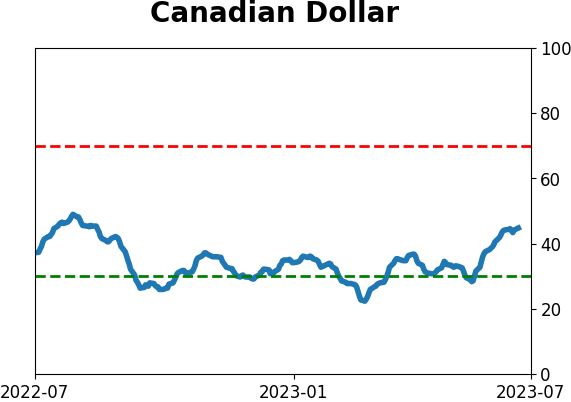
Currency ETF's - 5-Day Moving Average
|
|
|
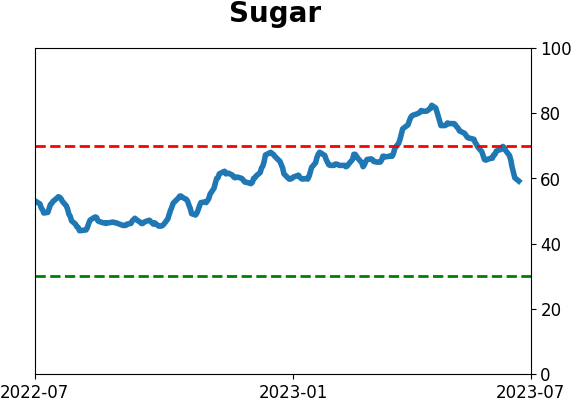
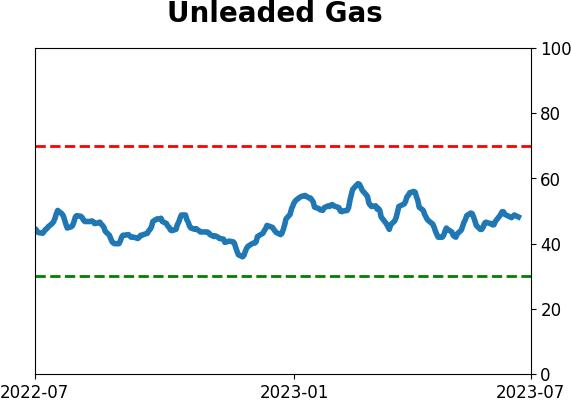
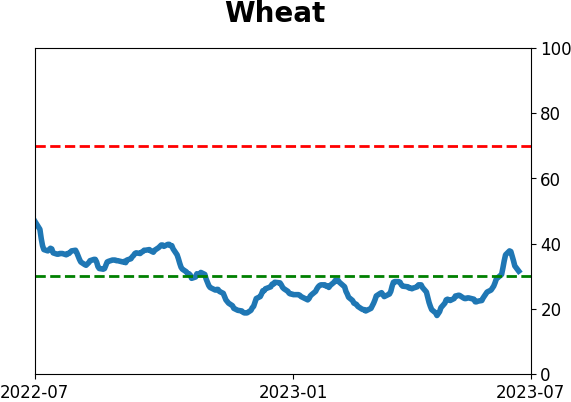
Commodity ETF's - 5-Day Moving Average
|
|