Headlines
|
|
Bond traders aren't buying the rosy stock outlook:
As the S&P 500 hovers near record territory, the spread between BBB and AAA investment-grade credits has widened to the worst level in nearly two months. That shows that bond investors are a tad skeptical of the rosy outlook professed by stock investors. After similar divergences, bond investors had the edge, as stocks mostly showed weak returns.
|
Smart / Dumb Money Confidence
|
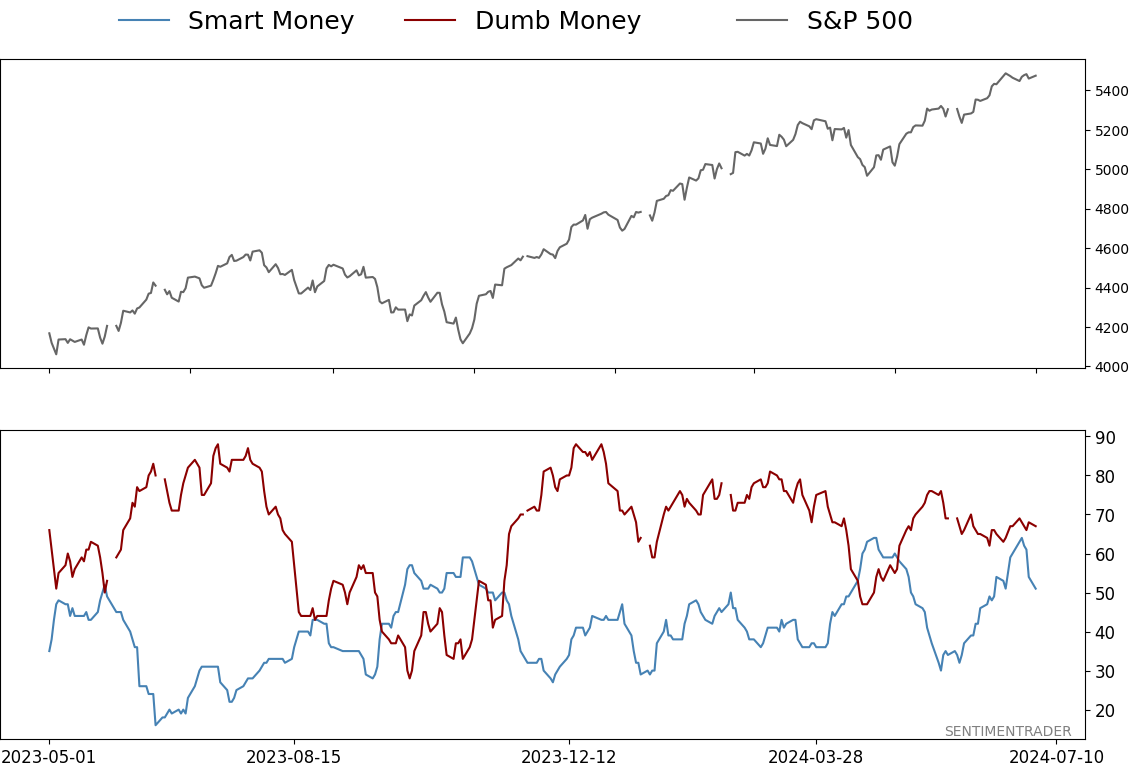
Smart Money Confidence: 51%
Dumb Money Confidence: 67%
|
|
Risk Levels
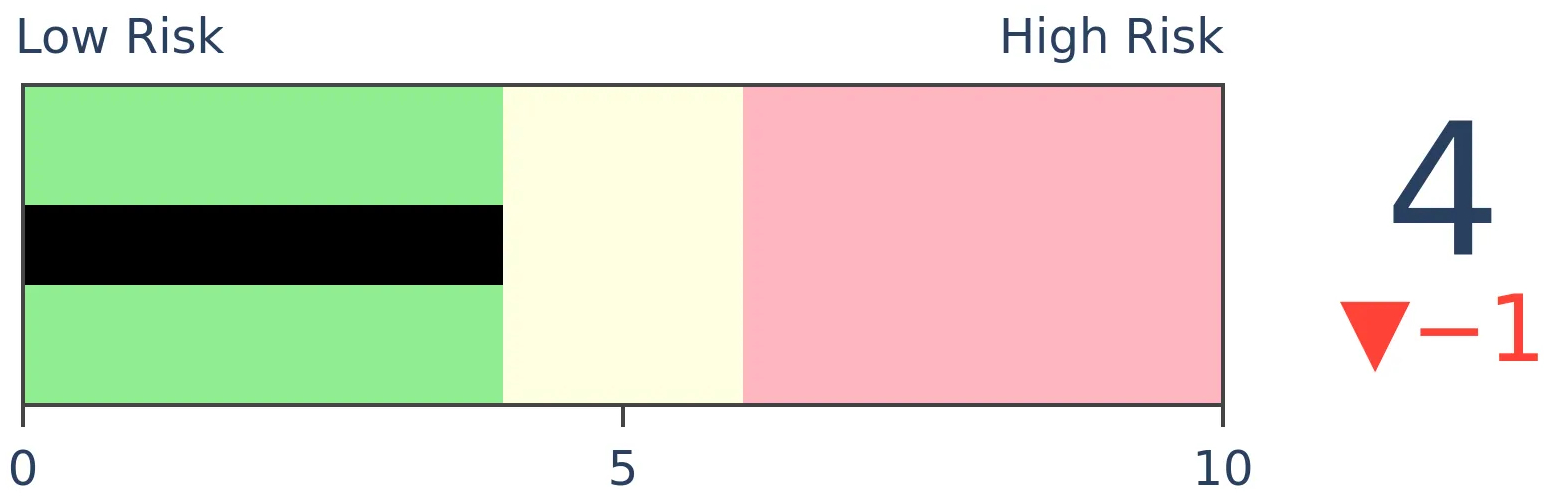
Stocks Short-Term
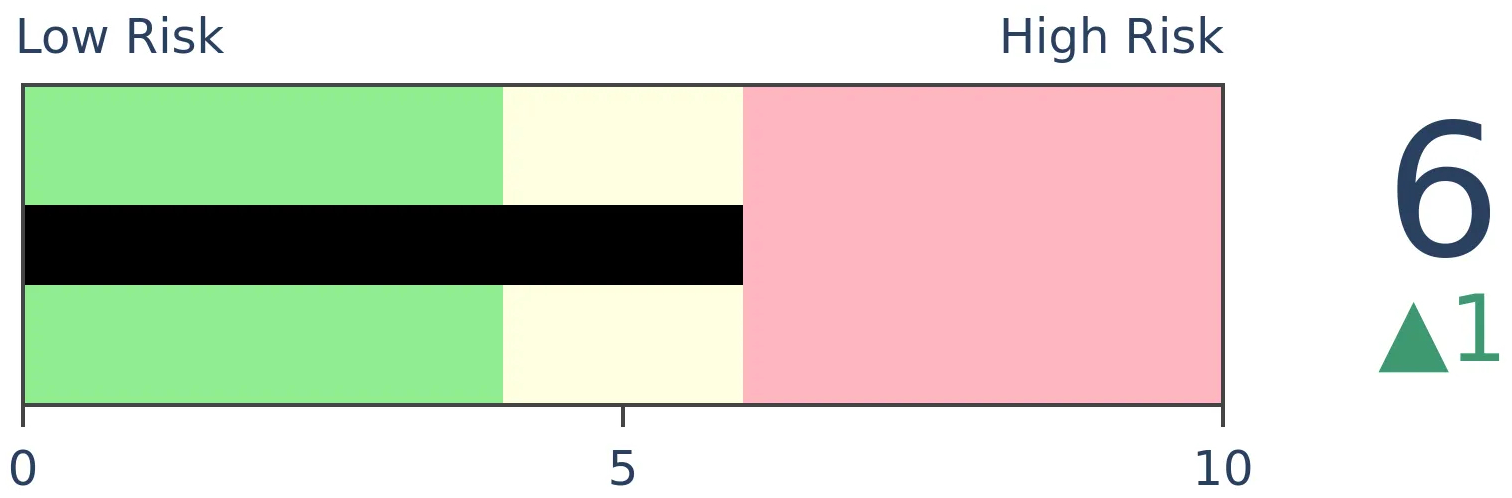
|
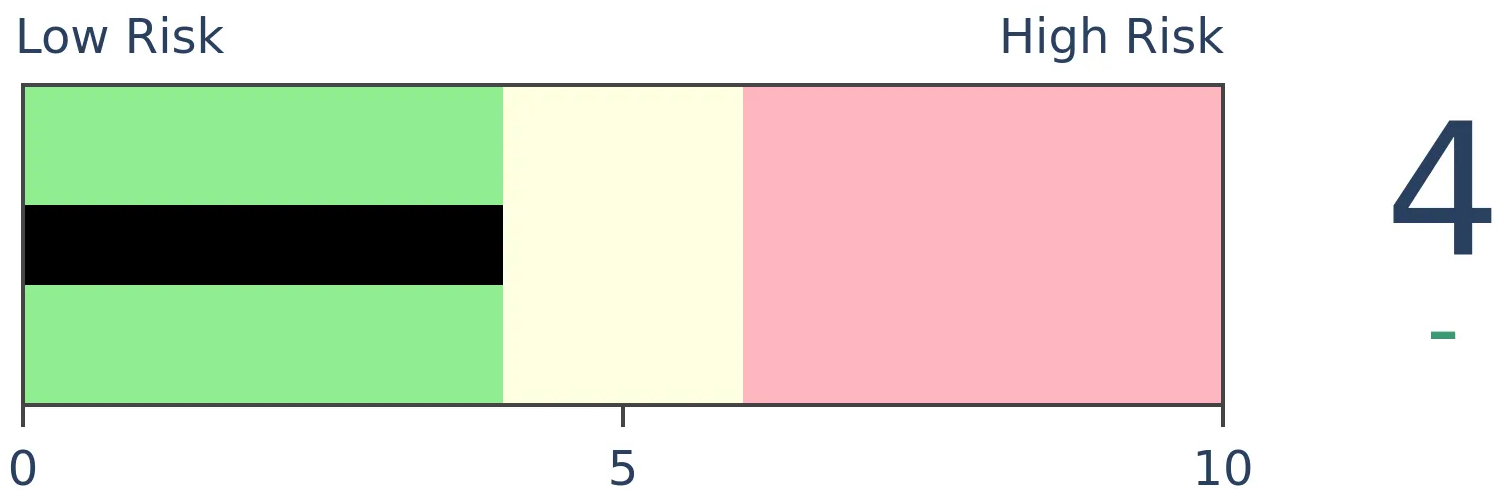
Stocks Medium-Term
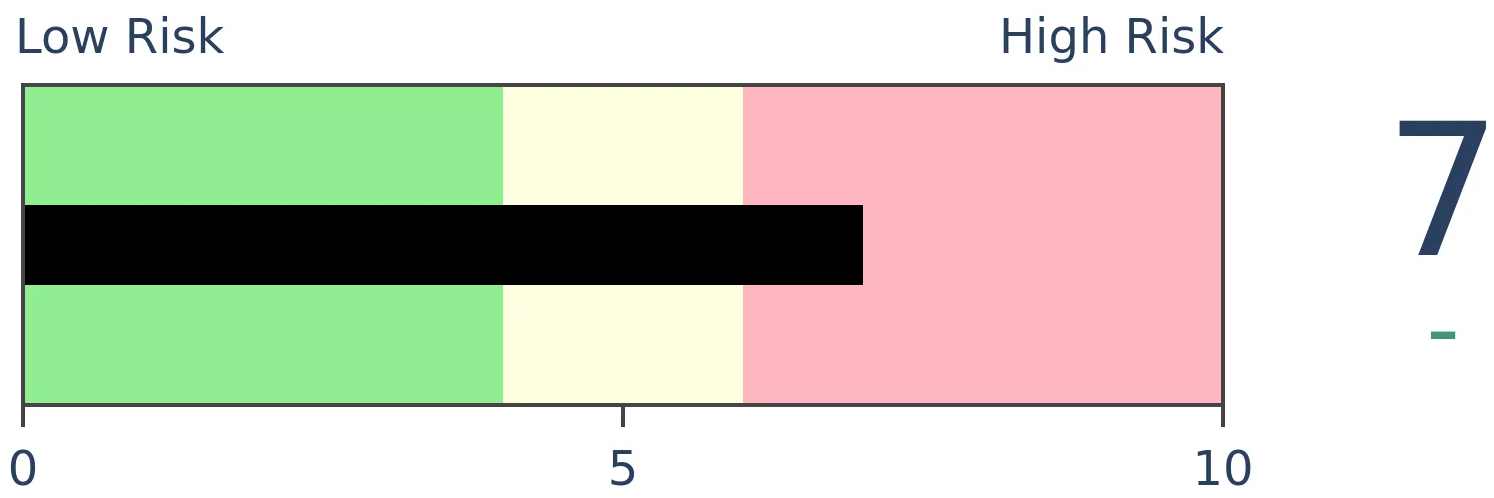
|
|
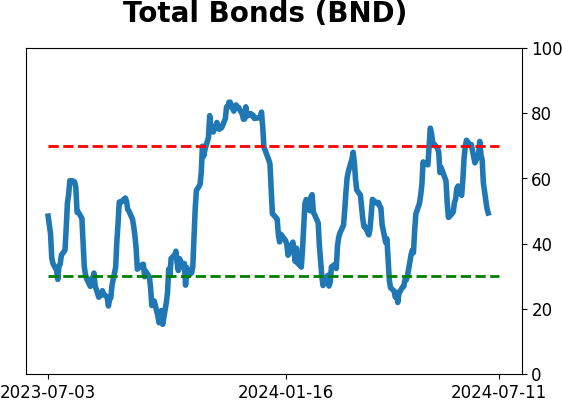
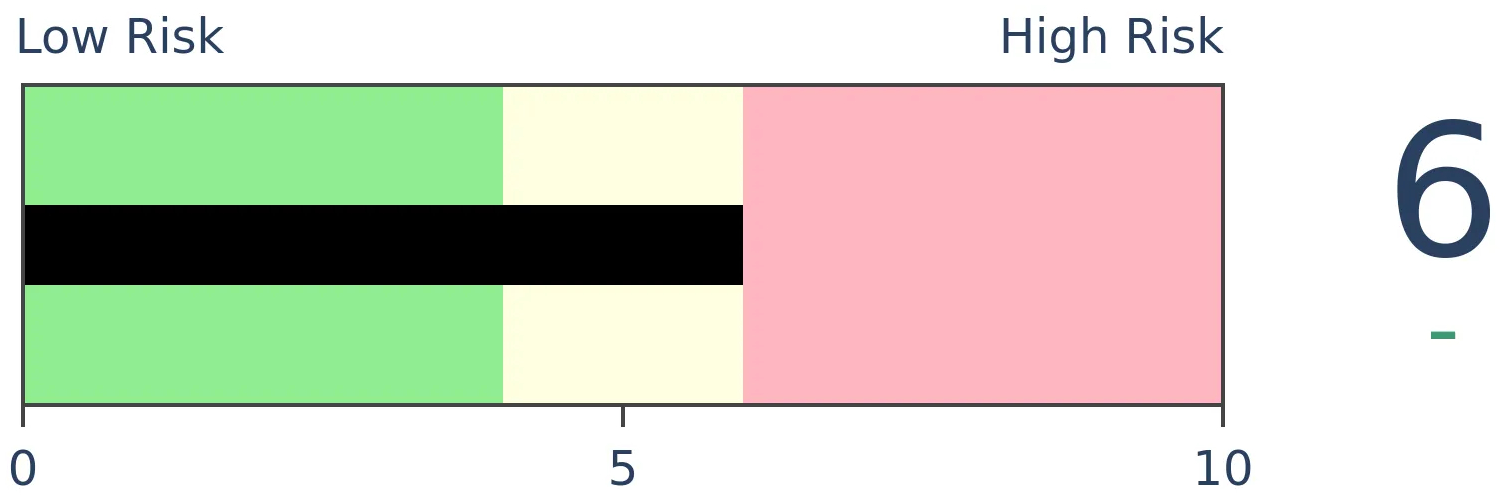
Bonds
|
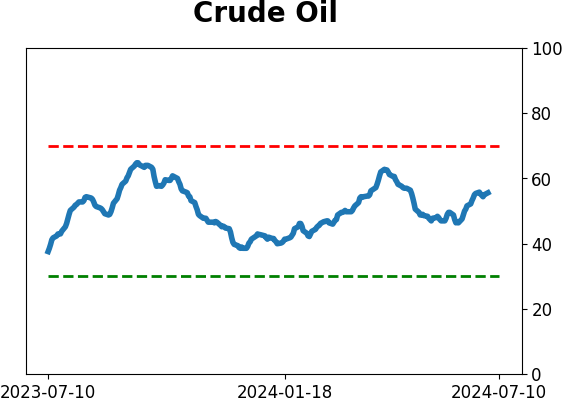
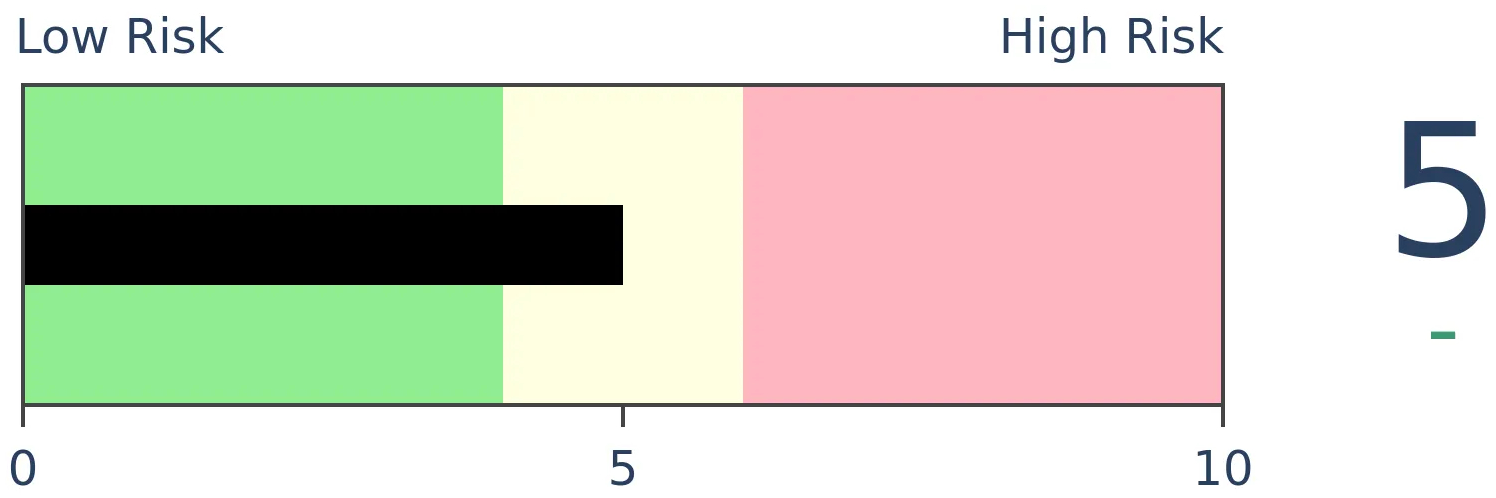
Crude Oil
|
|
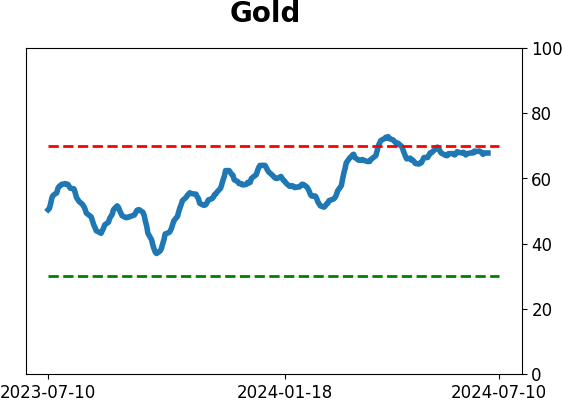
Gold
|
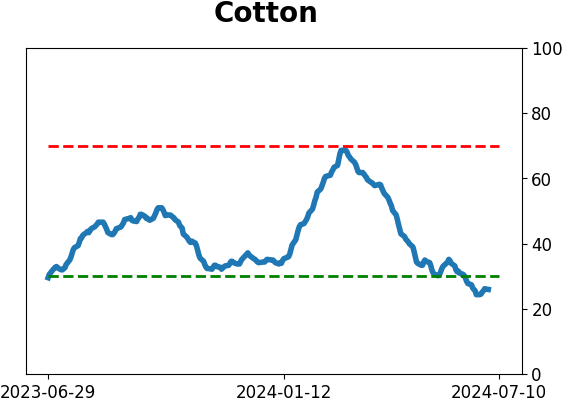
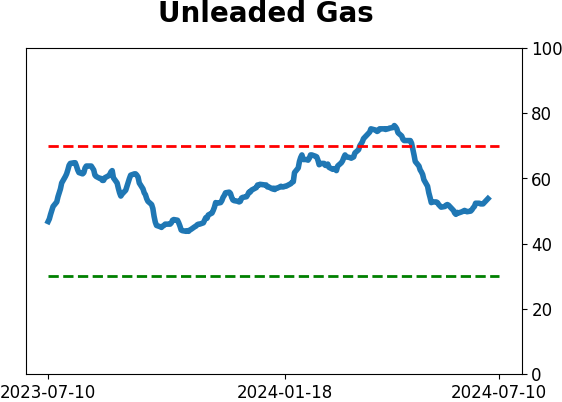
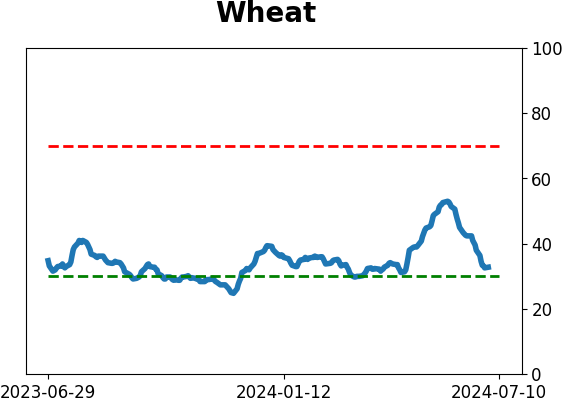
Agriculture
|
|
Research
By Jason Goepfert
BOTTOM LINE
As the S&P 500 hovers near record territory, the spread between BBB and AAA investment-grade credits has widened to the worst level in nearly two months. That shows that bond investors are a tad skeptical of the rosy outlook professed by stock investors. After similar divergences, bond investors had the edge, as stocks mostly showed weak returns.
FORECAST / TIMEFRAME
None
|
Key points:
- As the S&P 500 hovers near record territory, bond spreads are widening
- The spread between the riskiest and safest investment-grade credits is hitting its widest level in nearly 2 months
- After similar differences of opinion, bond traders had the edge, as stocks tended to show weak returns
Bond traders seem to be a bit skeptical
Nvidia saved the market again on Monday. That's not the whole story, but it's close. That single stock, with maybe a few compatriots, has done the heavy lifting for weeks, if not months. It's the primary reason we're seeing so many divergences in breadth and sentiment.
Perhaps more troubling is that divergences are also showing up in credit. We've poo-pooed the idea that the bond market is always smarter than the stock market and continue to hold that belief. Still, divergences between the two can hold some information, and we're seeing that now.
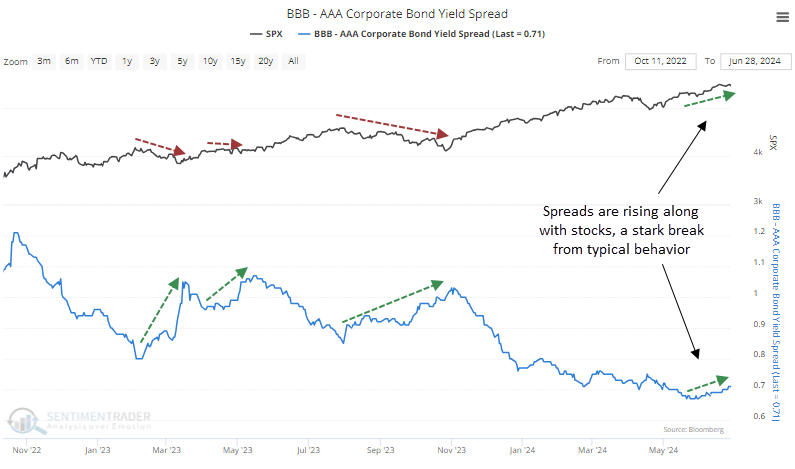
In a stark change from the past couple of years, the spread between the riskiest and safest investment-grade credits bottomed about two months ago and is nearing a two-month high, even as stocks rally. The spread usually only rises as stocks fall.
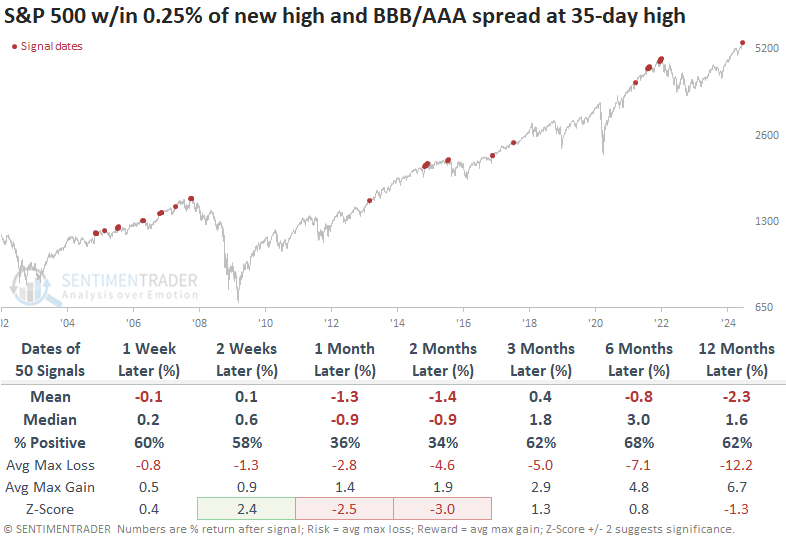
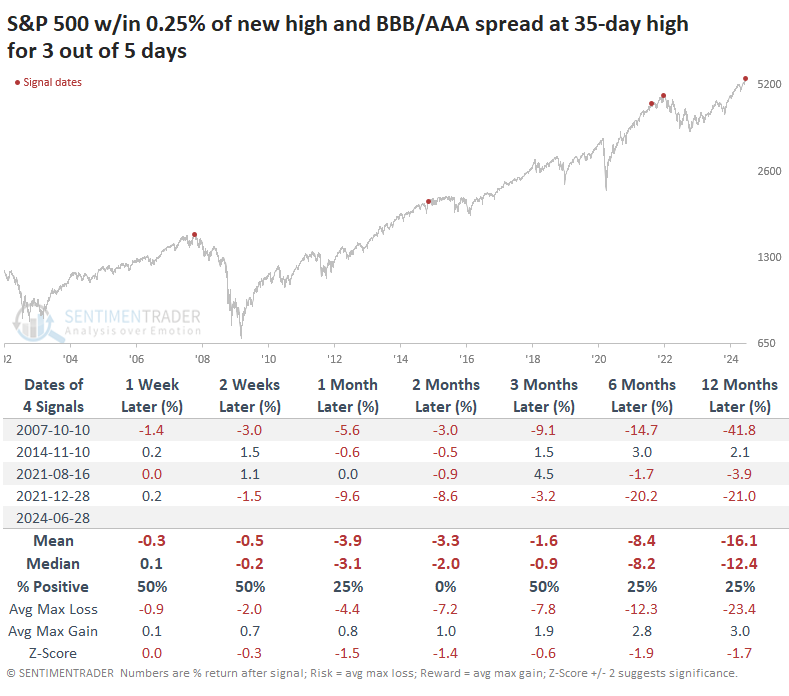
When the S&P 500 was hovering within spitting distance of a new high, and the BBB/AAA spread was at least at a 35-day high, the S&P's returns going forward were poor across most time frames. The next one to two months were especially unappetizing.
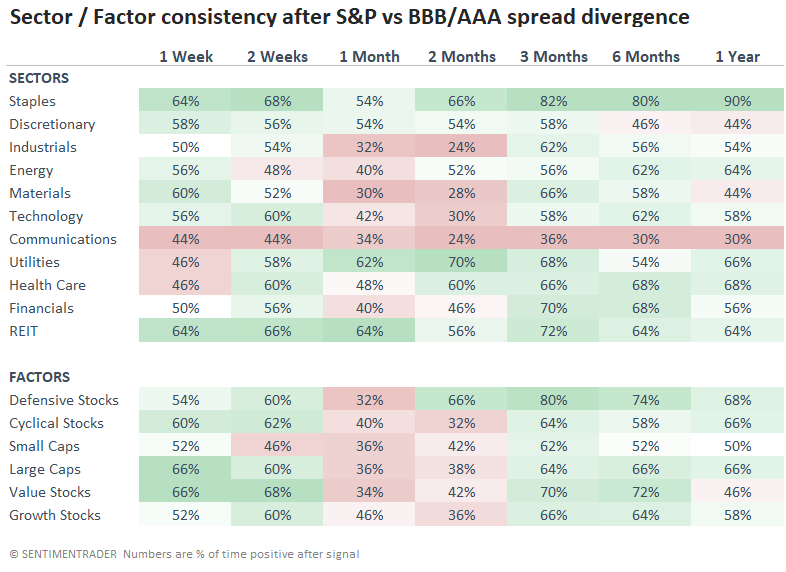
Among sectors and factors, it's not surprising that defensive groups performed the best. Over the next two months, the defensive factor rallied 66% of the time, while cyclical stocks rallied only 32% of the time. Staples, utilities, and health care held up quite well.
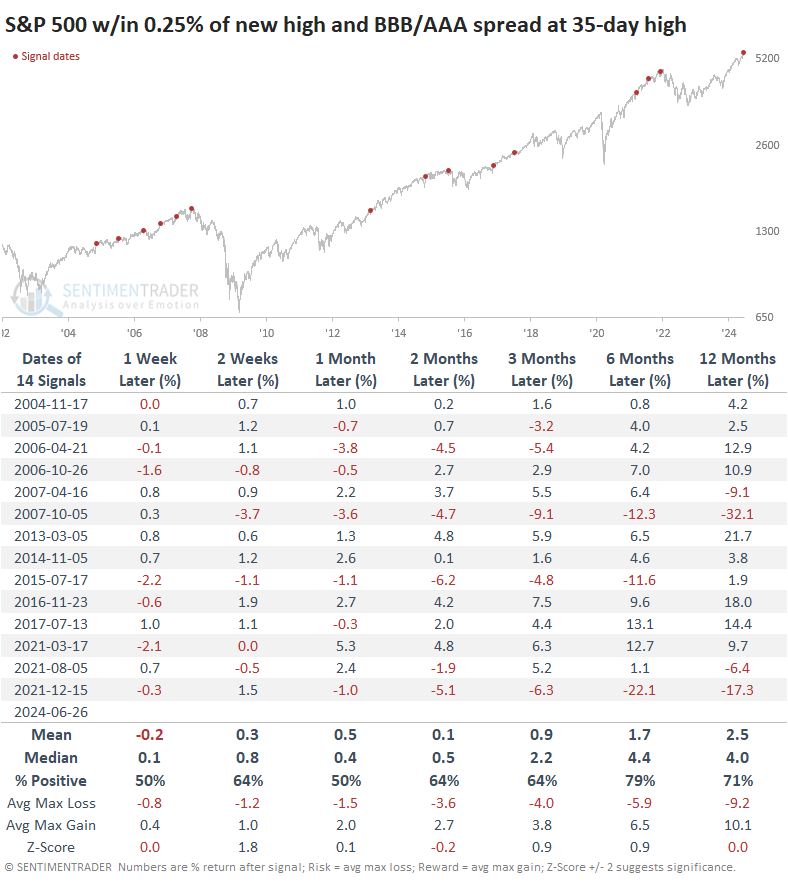
There was a strong cluster of these divergences in 2014, which skewed the results. So, the table below separates the instances and includes only the first one in at least three months. This alleviated the negatives to a large extent, with S&P 500 performance about in line with random across most time frames.
The divergence is persistent
The problem is that we're seeing a cluster of readings, not just a one-off. The divergence has been evident for three of the past five sessions, rivaling the largest clusters in 22 years.
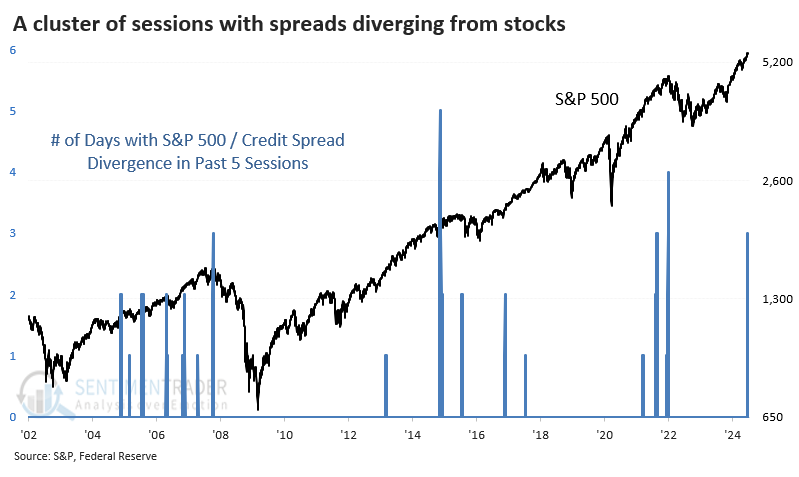
The table below shows S&P 500 returns after clusters of at least three divergences in five sessions. Again, these are times when the S&P was hovering at or very near a new high, but credit spreads were either widening or holding near (almost) two-month highs. Each time, it signaled that most of the upside in stocks was in the rearview mirror and risk was high.
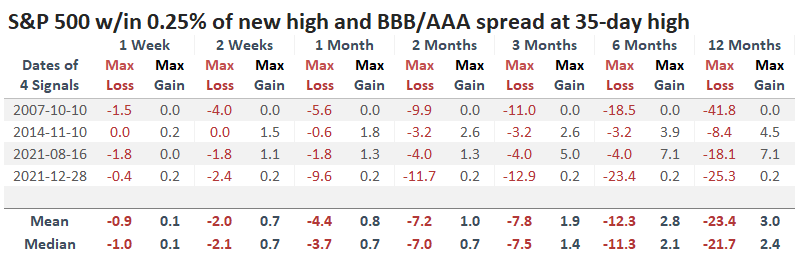
The table of maximum gains and losses across time frames shows that each signal suffered significantly larger maximum losses over the next year than enjoyed maximum rewards.
The tech and data team have improved the new backtest engine to allow us to share tests on the site more easily. Clicking this link should load the settings used for this test. Once it loads, you only have to click the Run Backtest button.
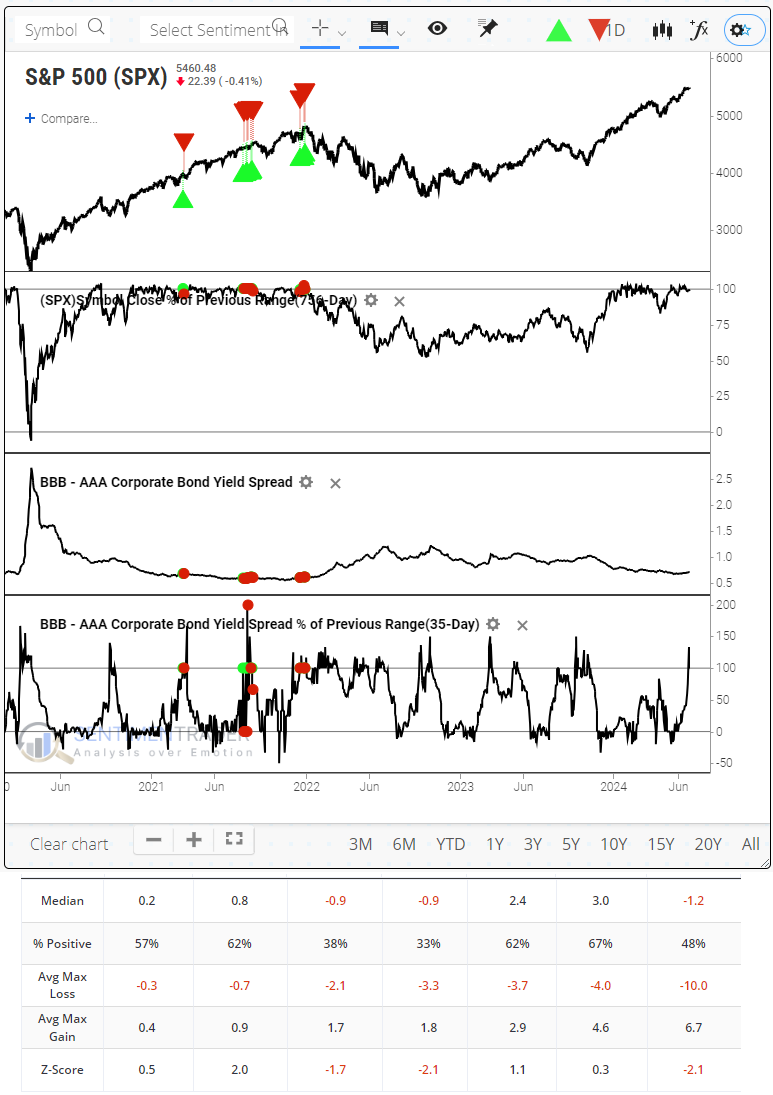
Note that the results will not exactly match the above since the Backtest Engine is geared more toward realistic trading strategies when you have to hold a position for at least a day and cannot pyramid positions. Still, the results mostly align with the above, and you can change whatever parameters you would like.
What the research tells us...
Most of the developments we've looked at in recent weeks that had a bearish tilt tended to show the weakest results over a medium-term time frame of one to three months. Depending on how one wishes to look at it, the current widening of some credit spreads can be counted among those concerns, though this one has also preceded significant long-term weakness in stocks.
For traders, and perhaps even investors with longer time frames, it pays to watch this spread and see if it continues to widen in the days and weeks ahead, especially if stocks follow through on the short-term positive window they're in now and for the next couple of weeks. If so, this data will morph from a yellow flag to a red one.
Indicators at Extremes
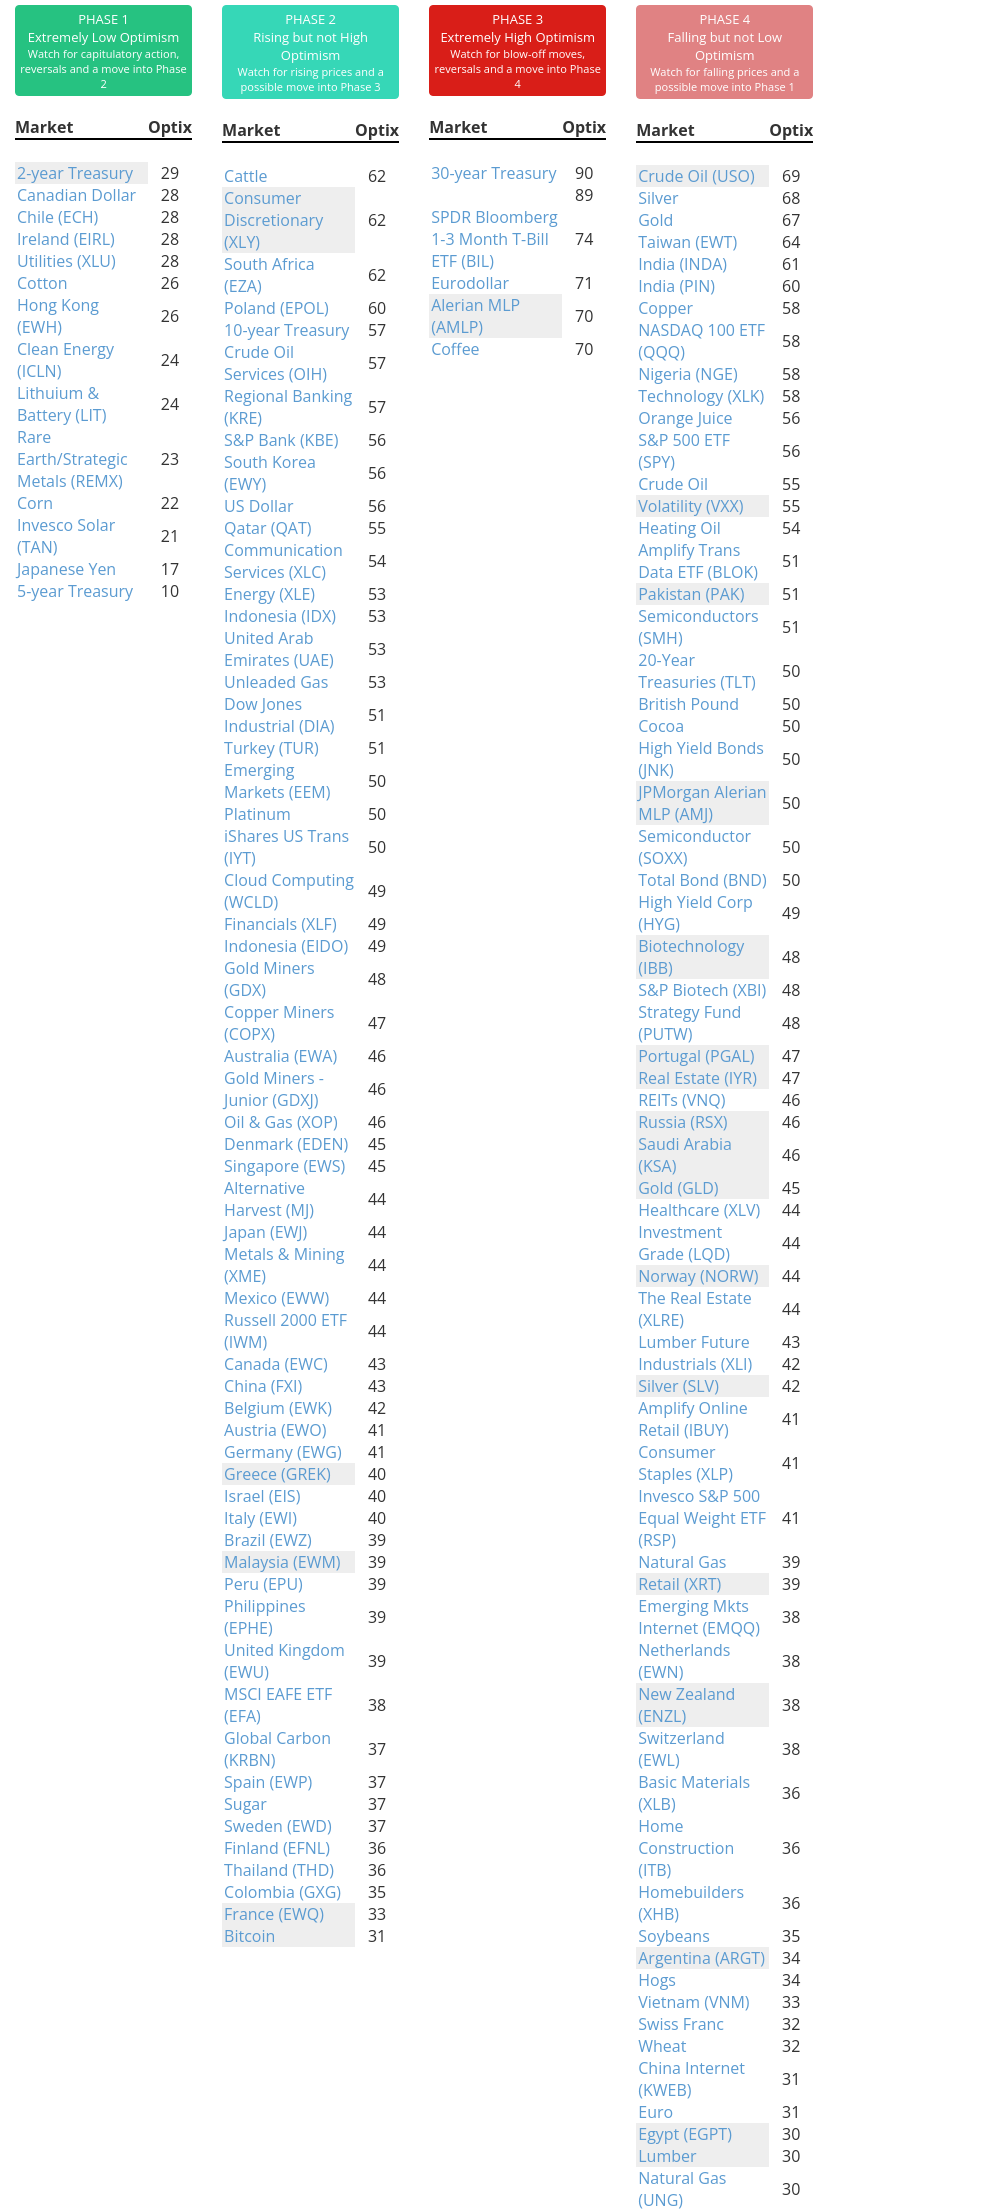
Phase Table
Ranks
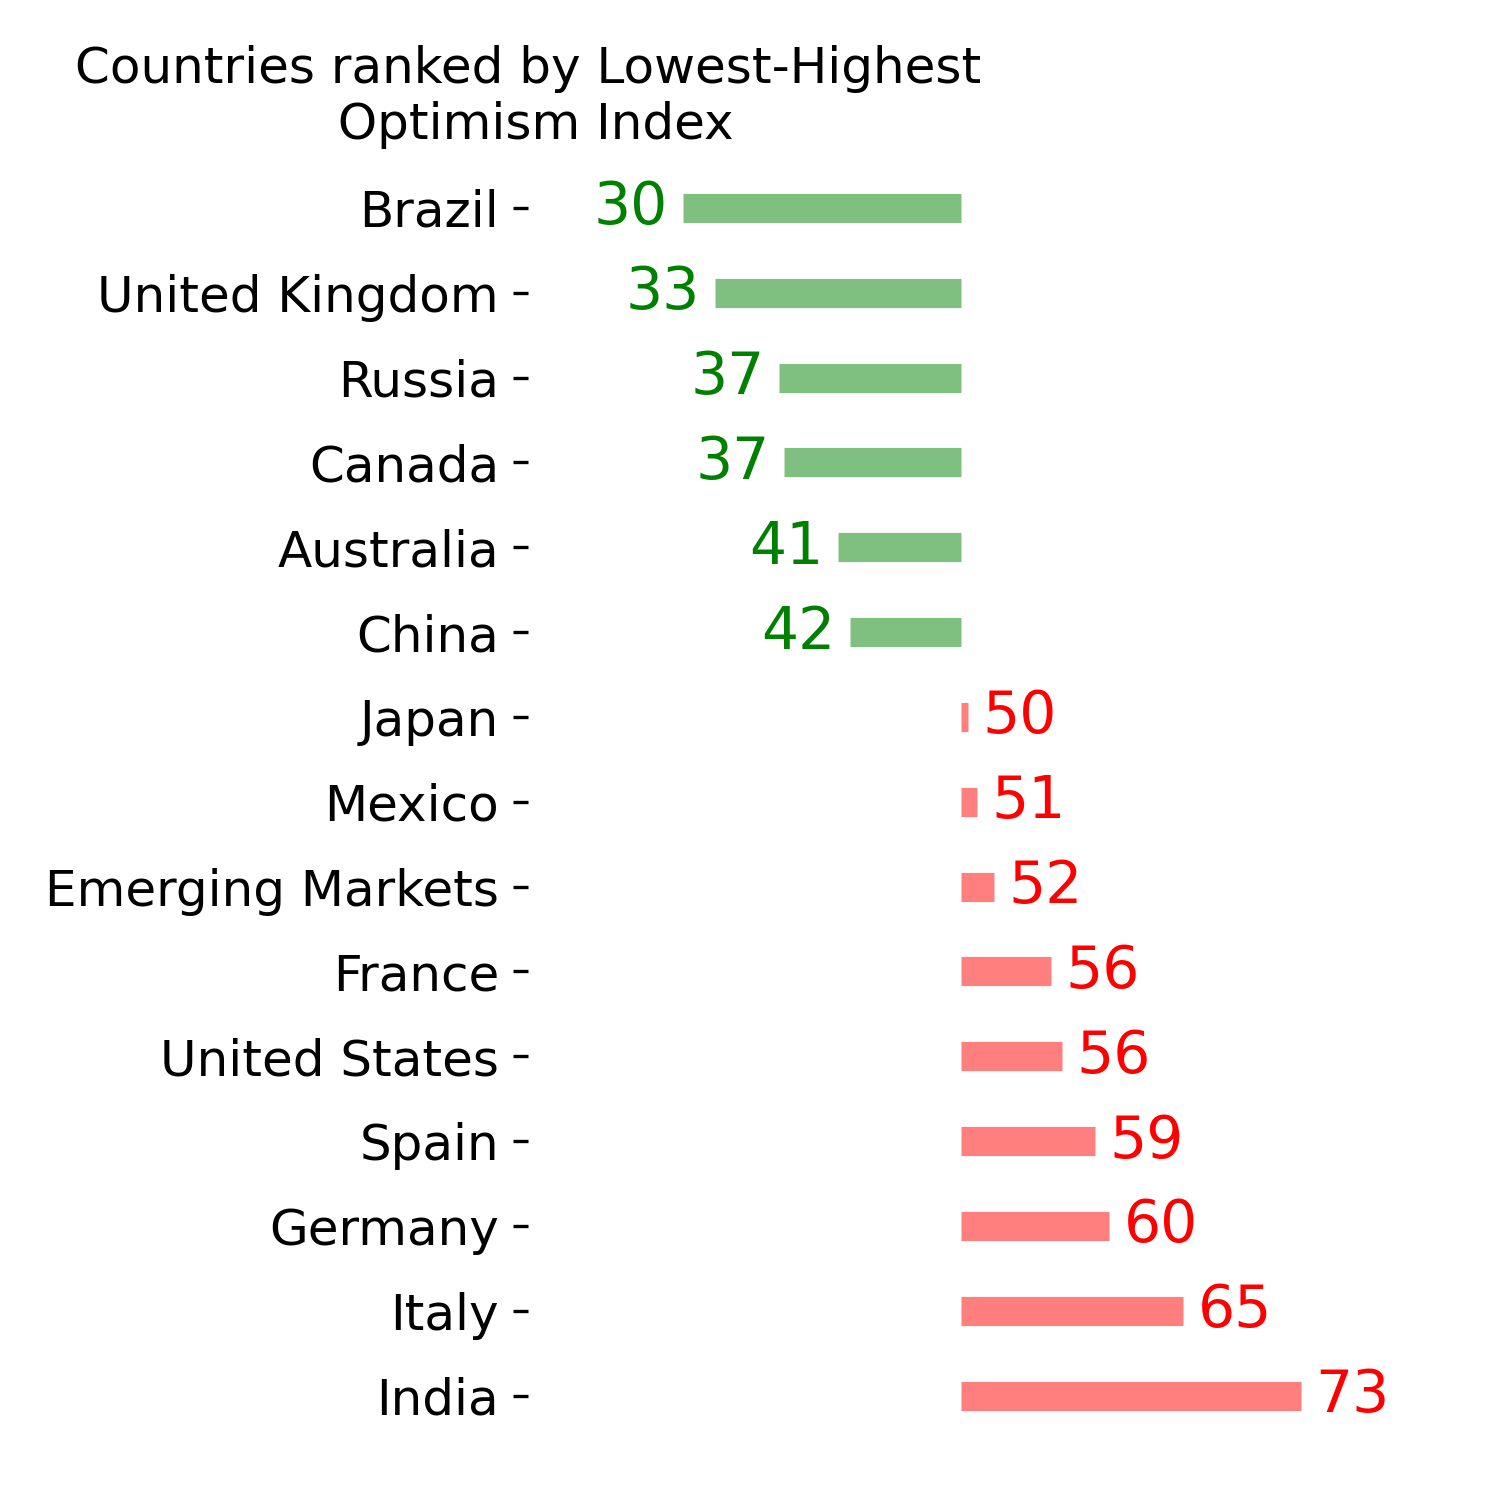
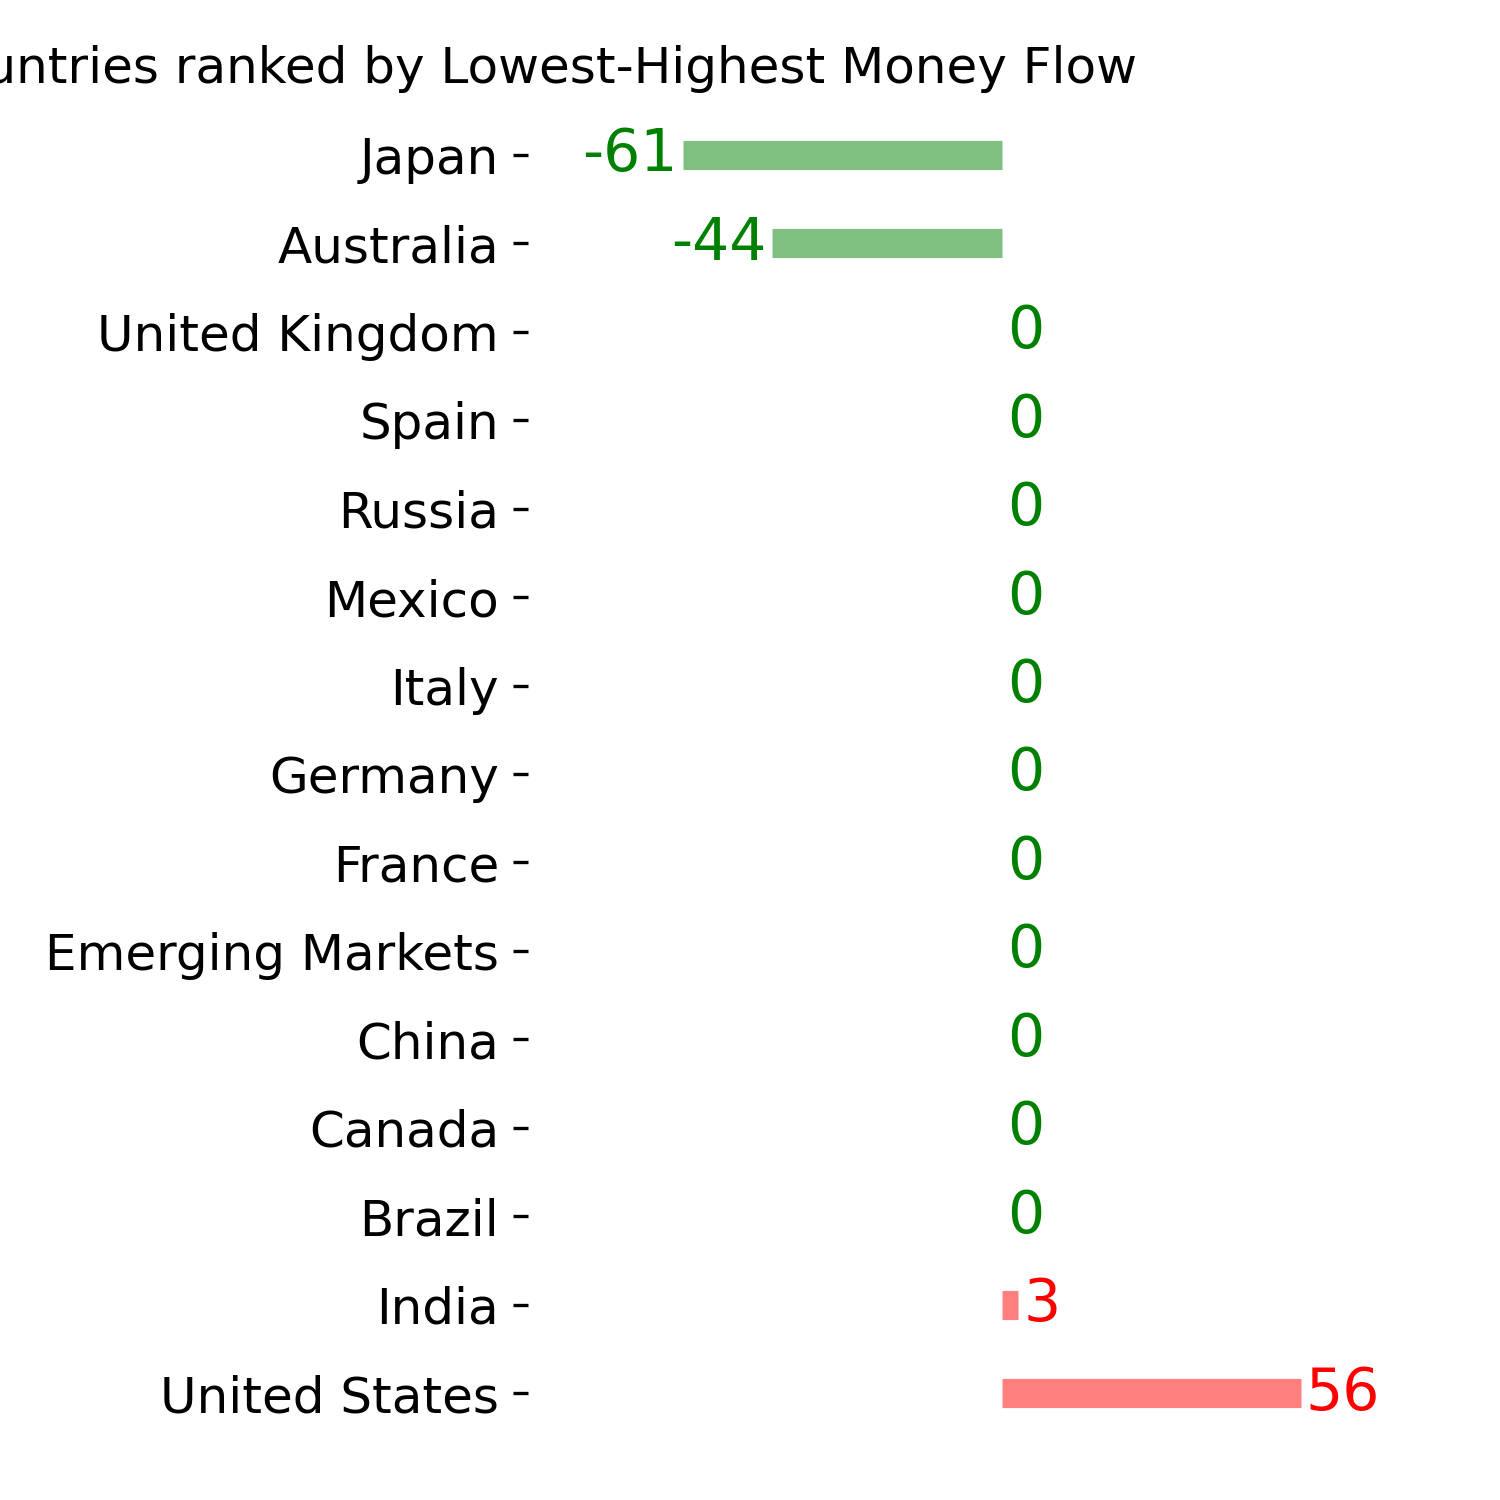
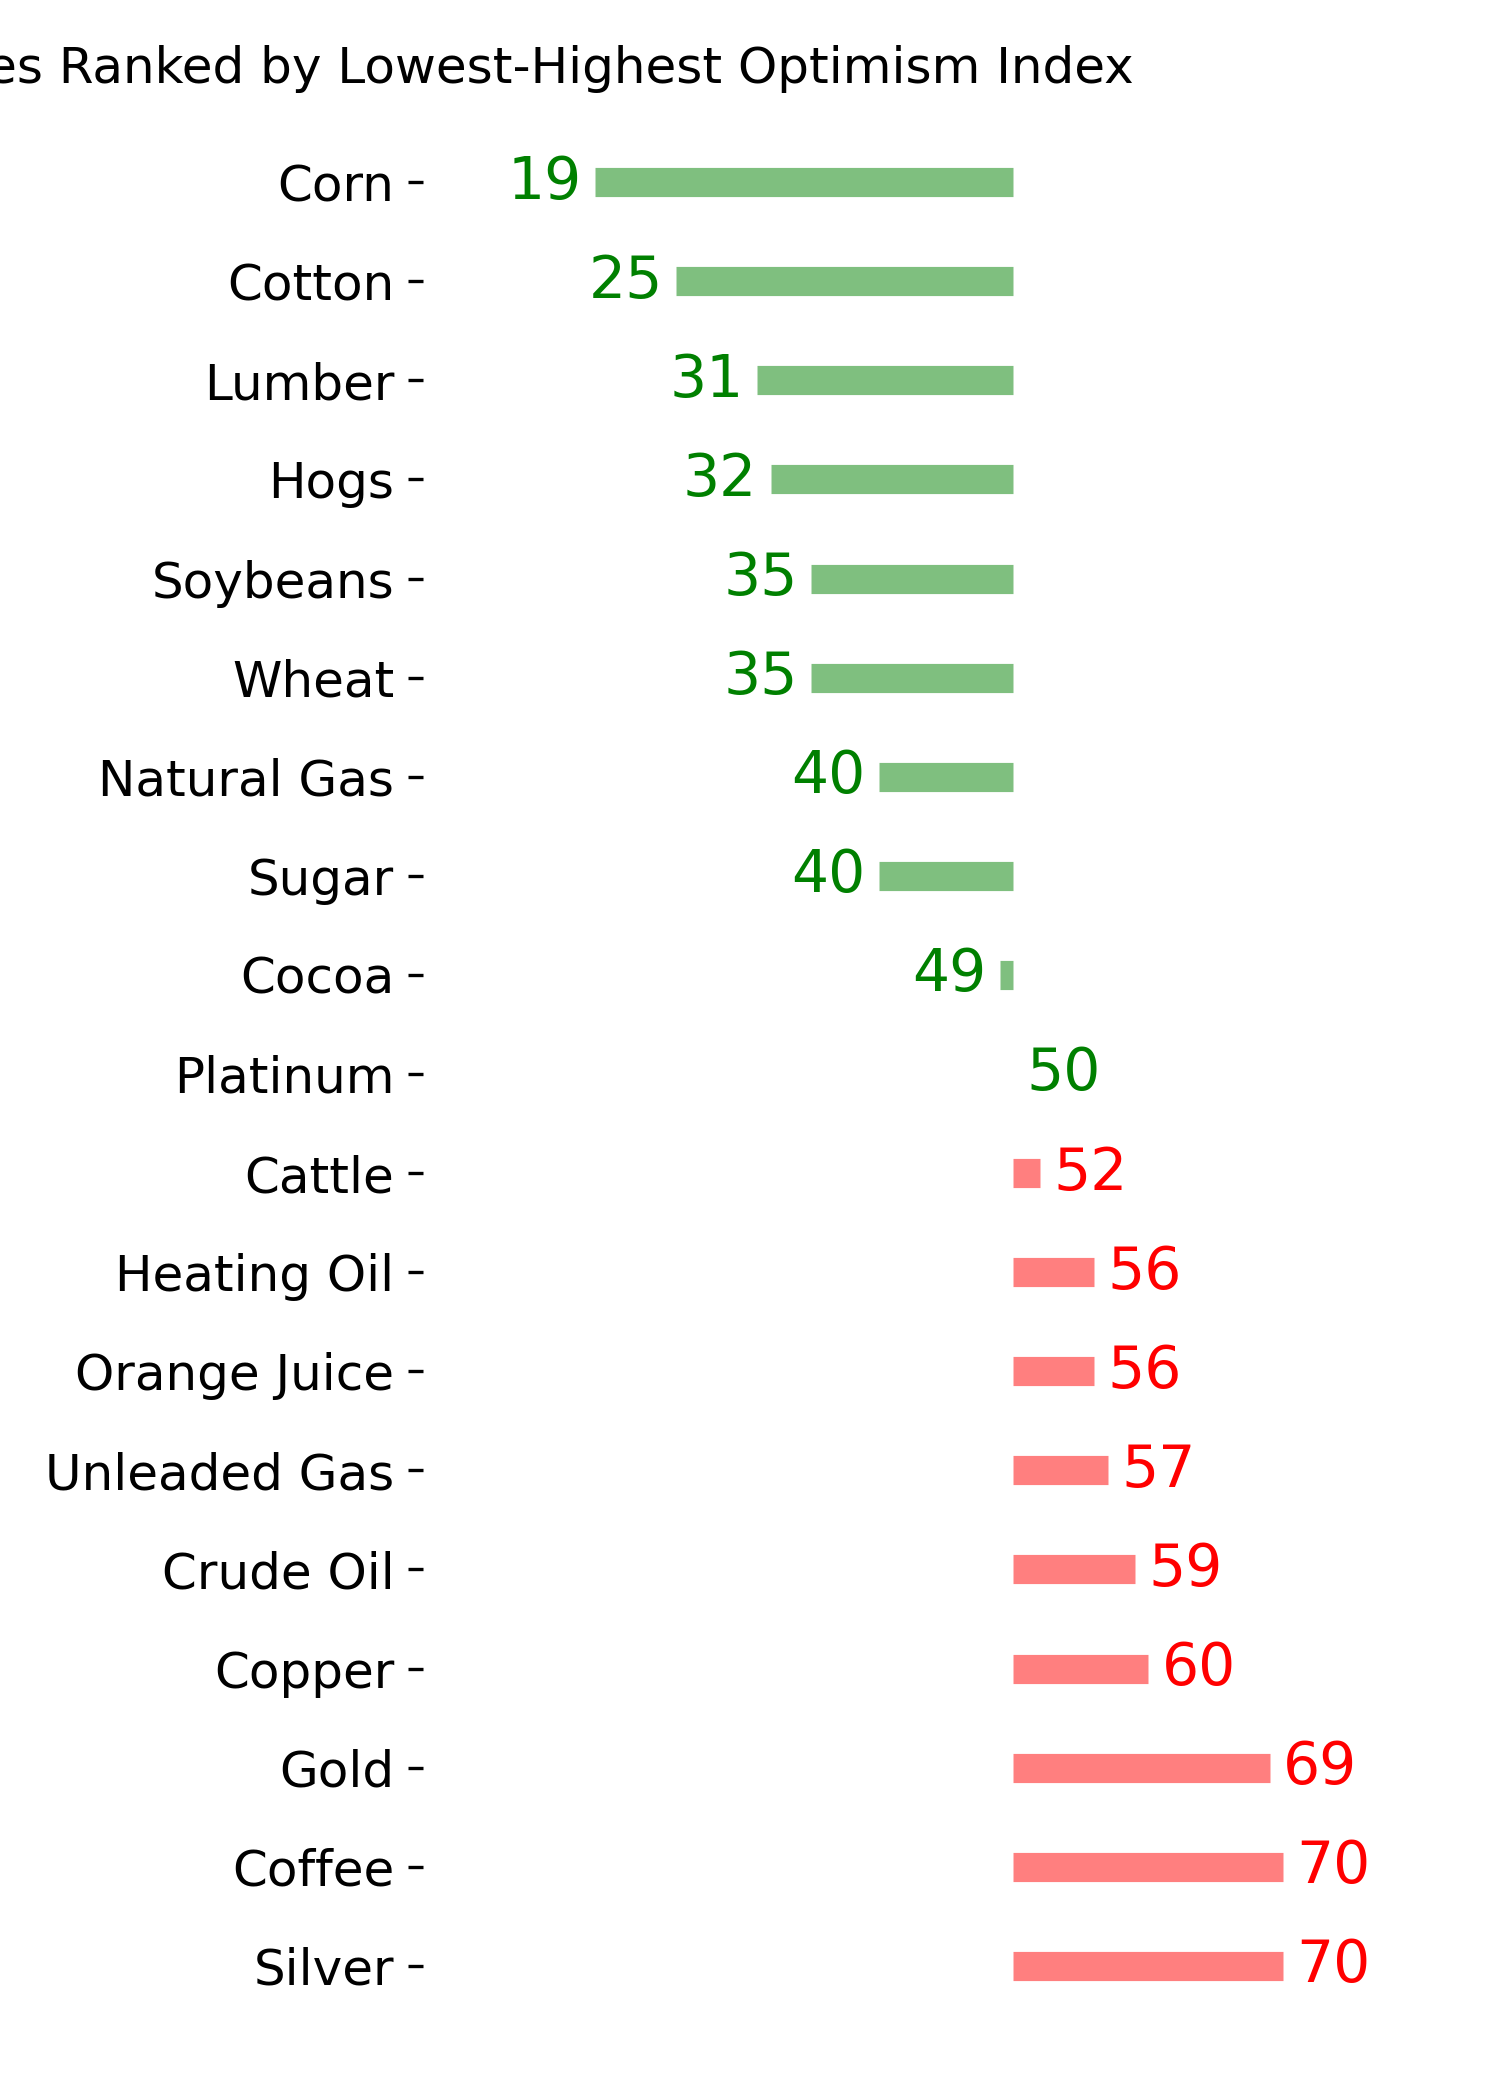
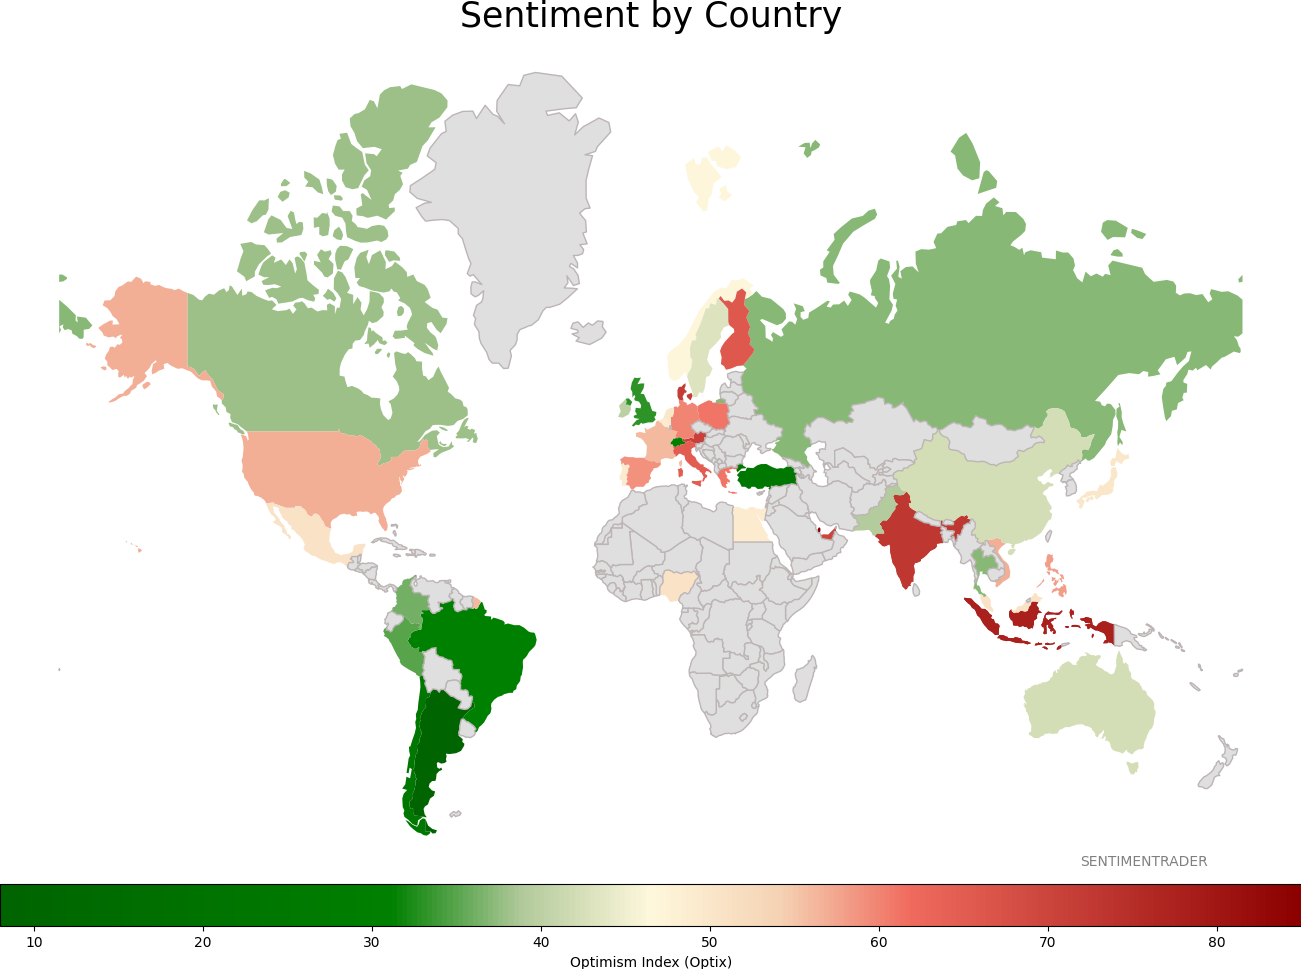
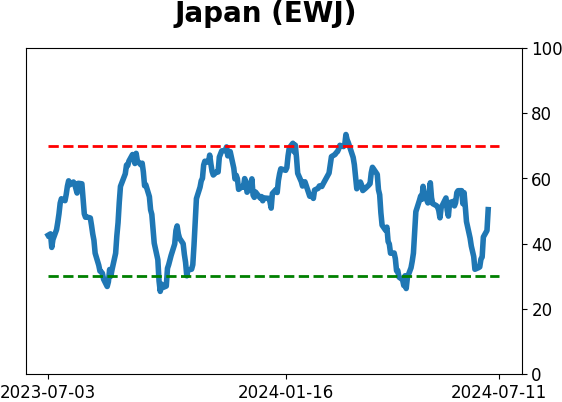
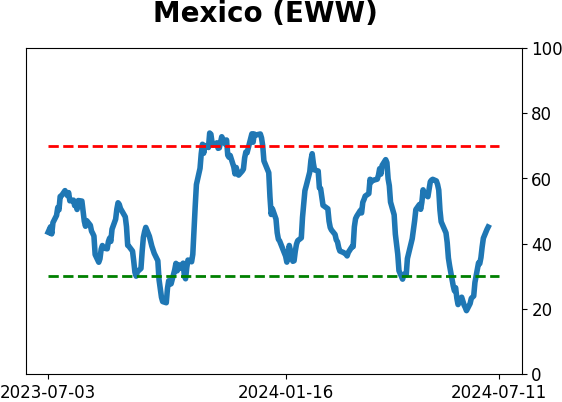
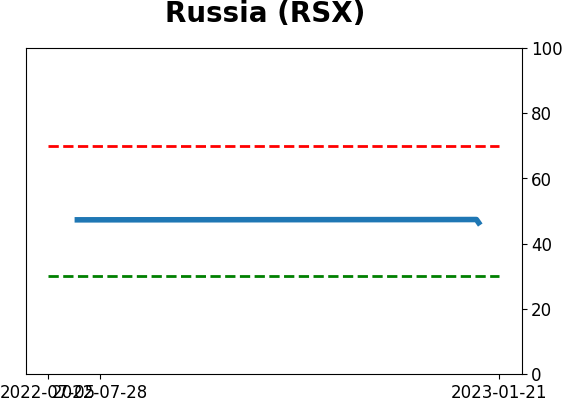
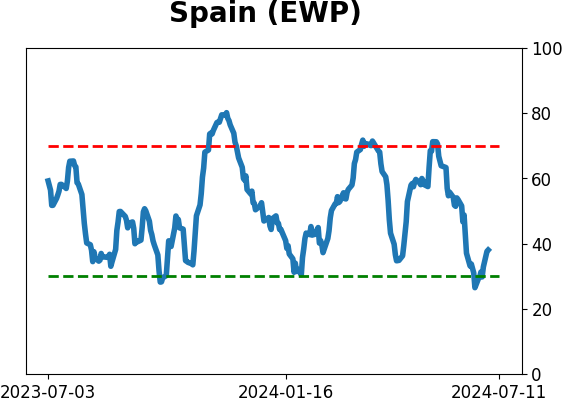
Sentiment Around The World
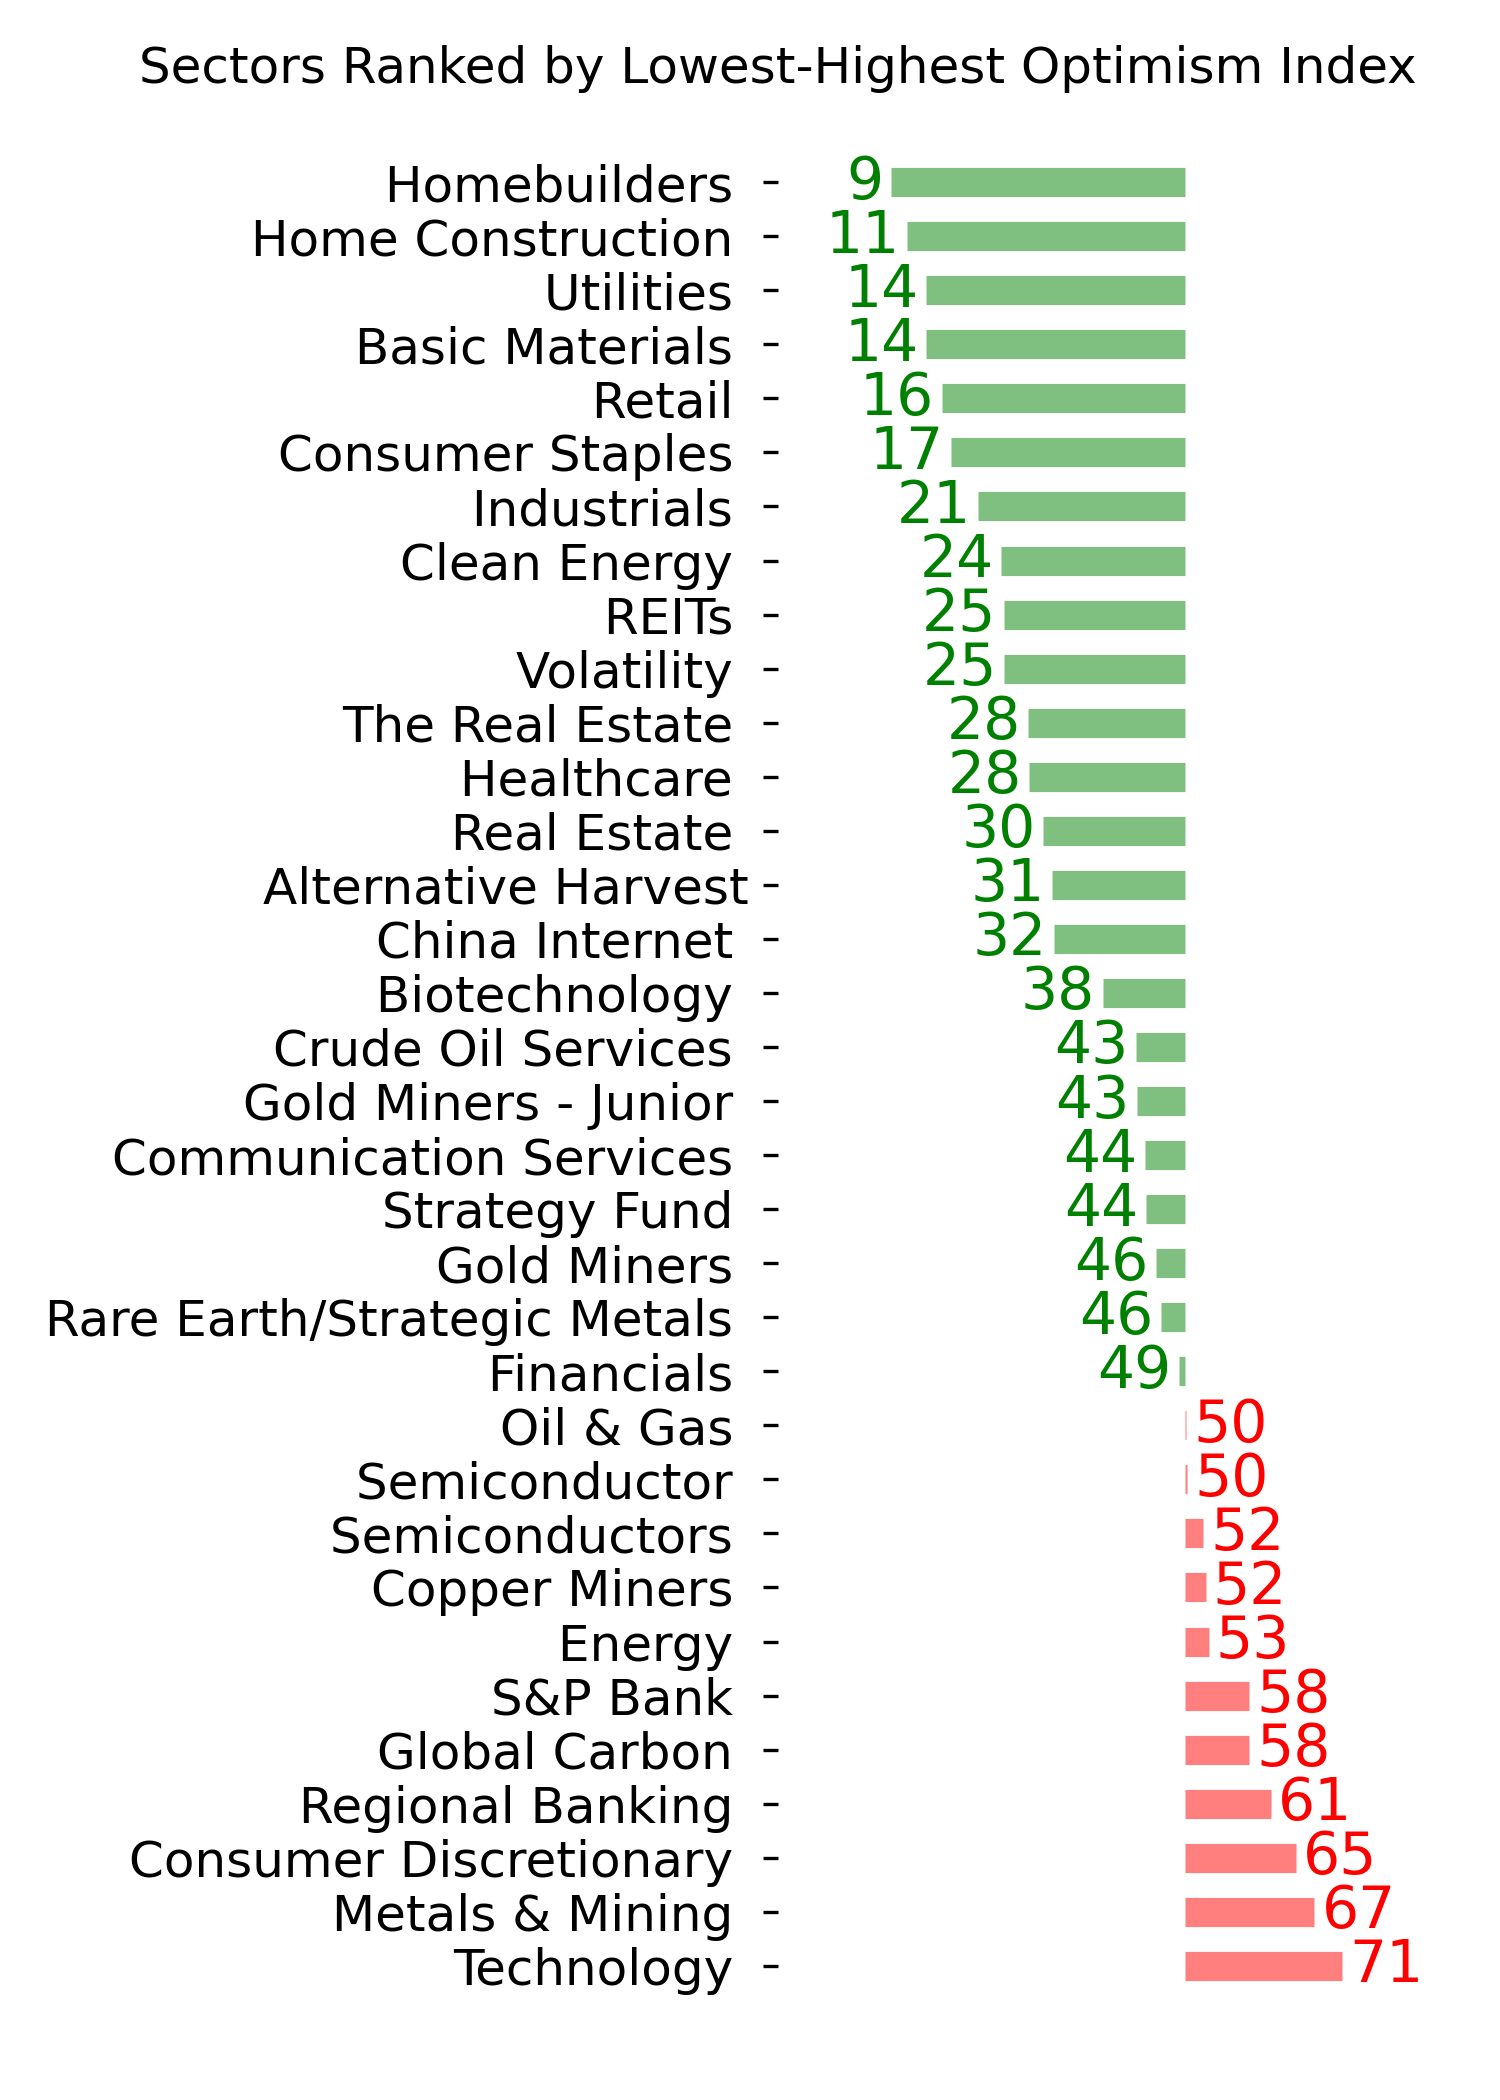
Optimism Index Thumbnails
|
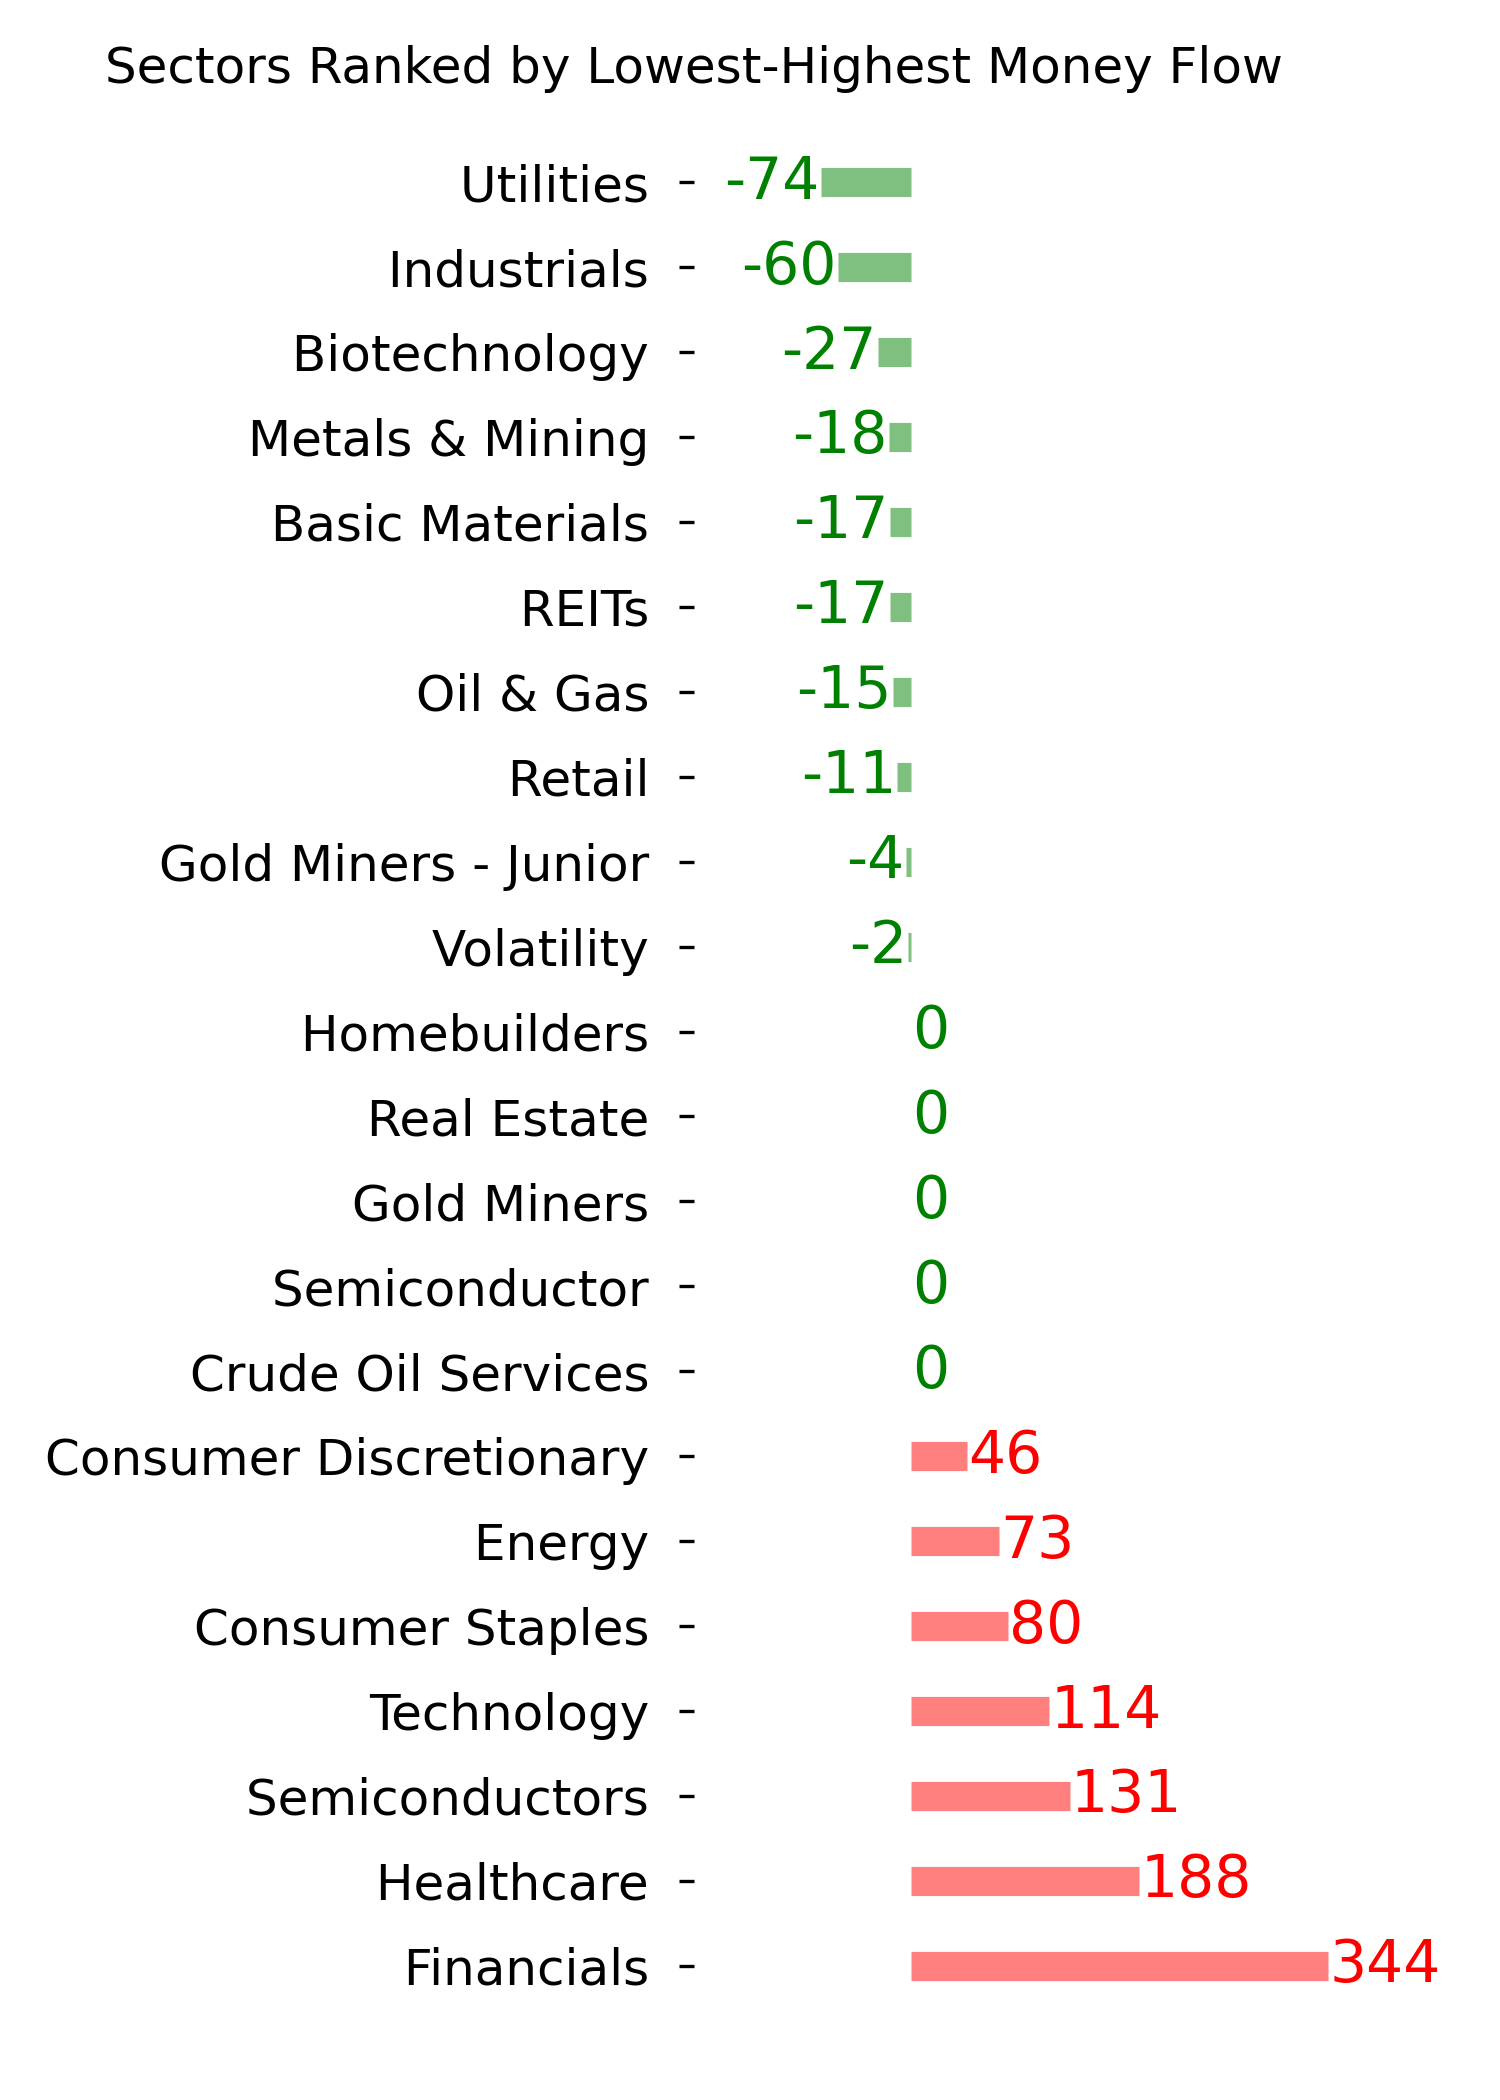
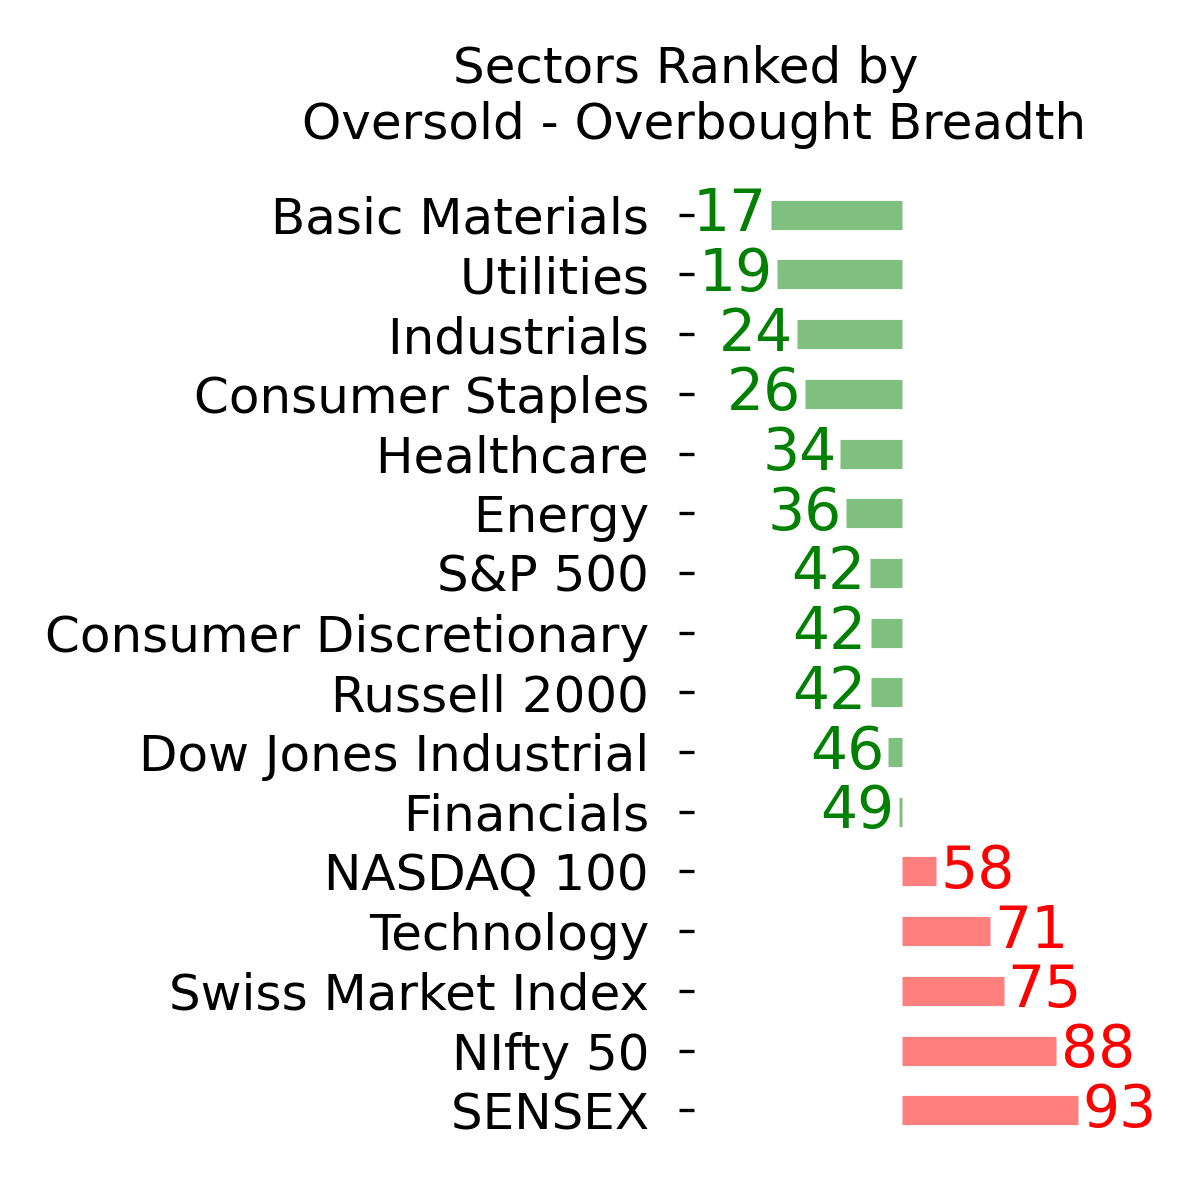
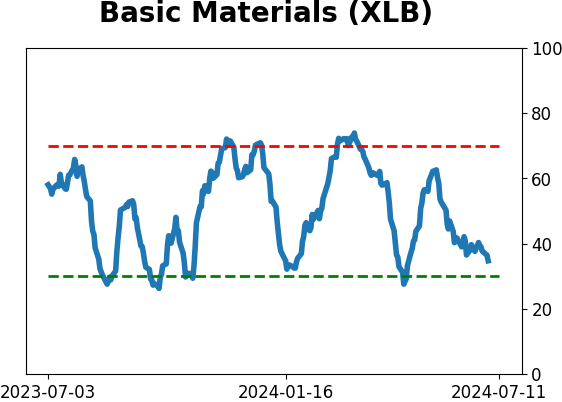
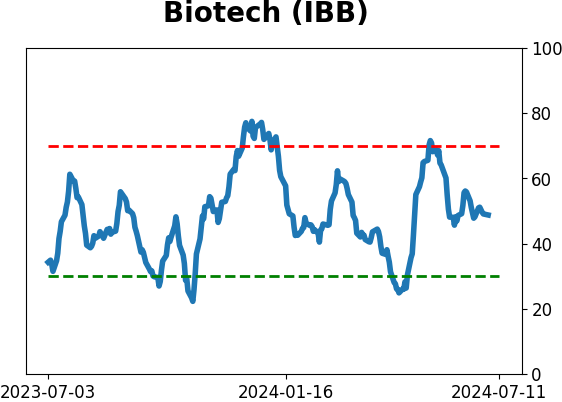
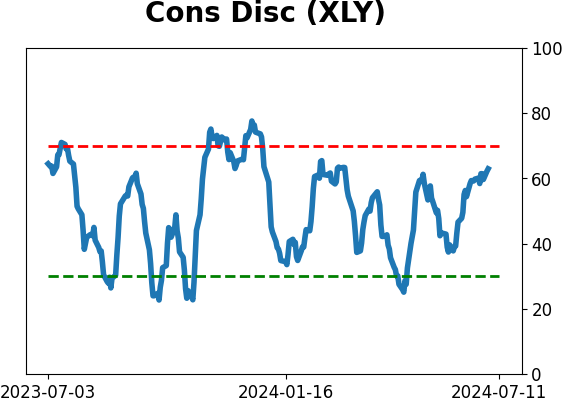
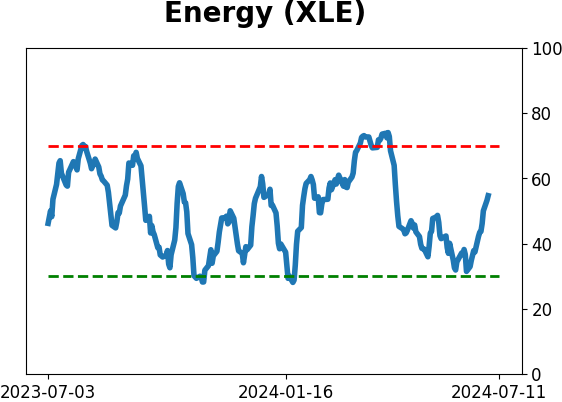
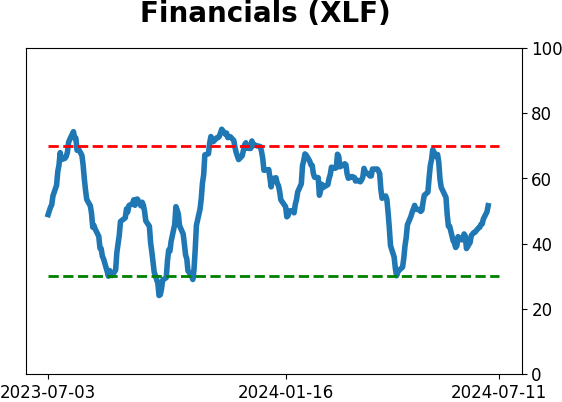
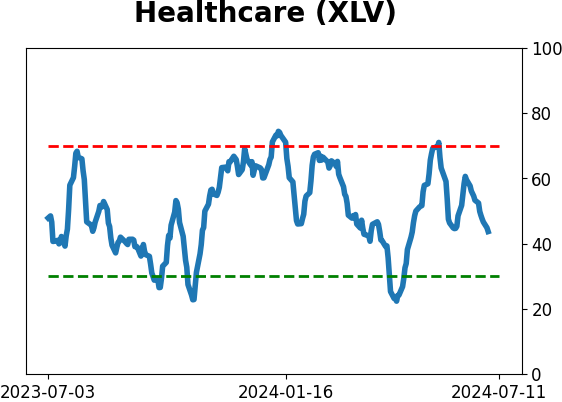
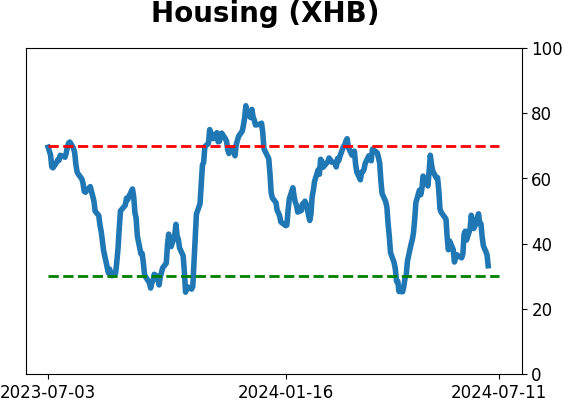
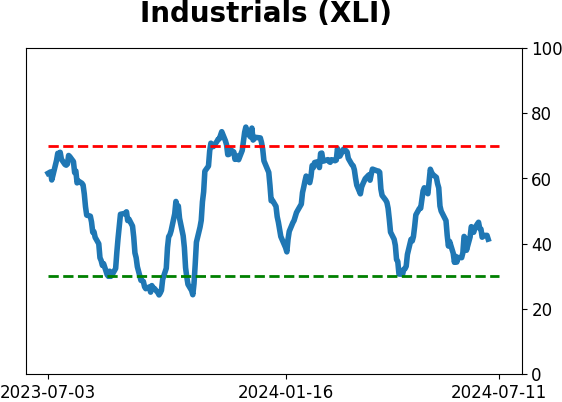
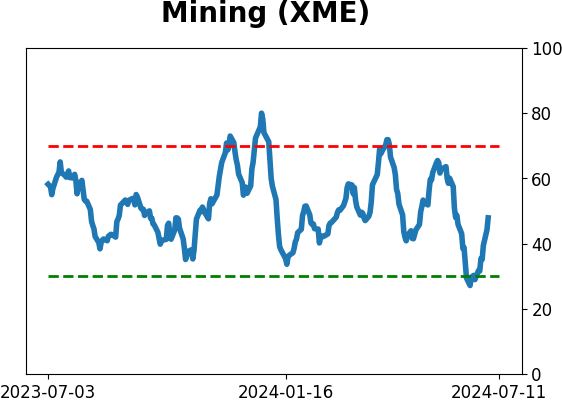
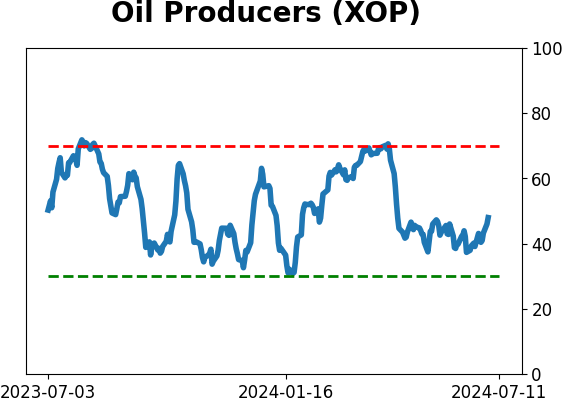
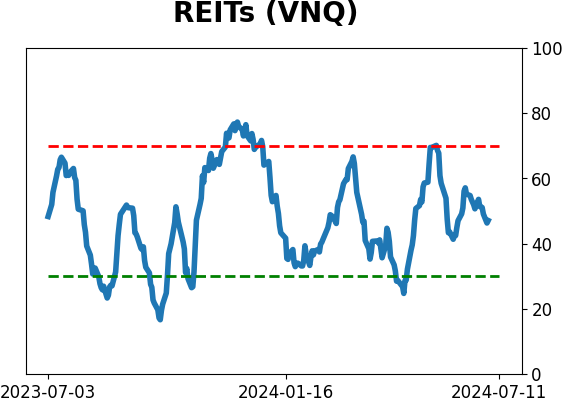
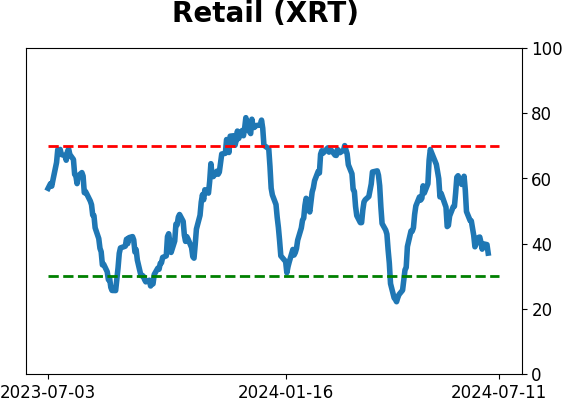
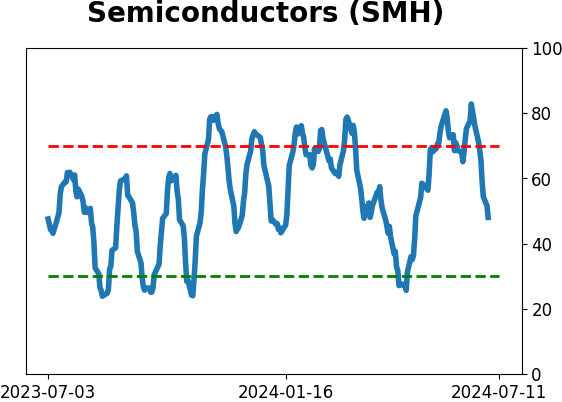
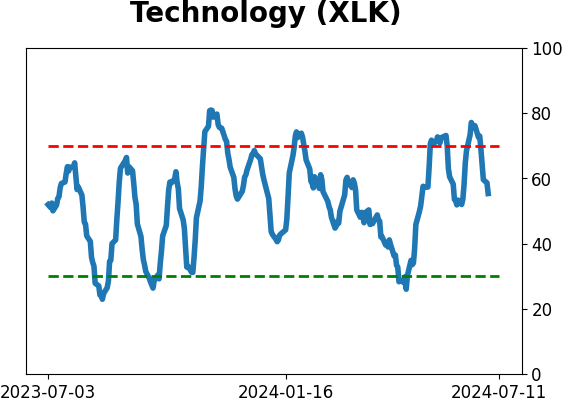
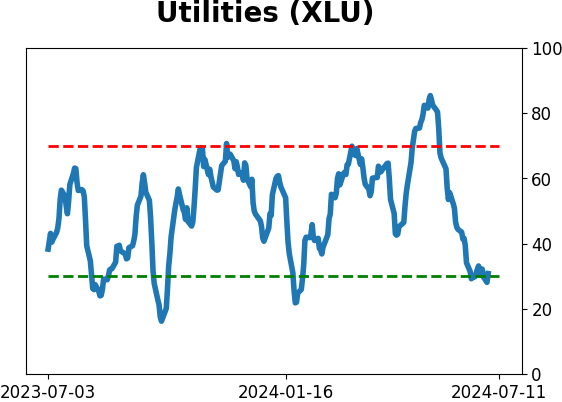
Sector ETF's - 10-Day Moving Average
|
|
|
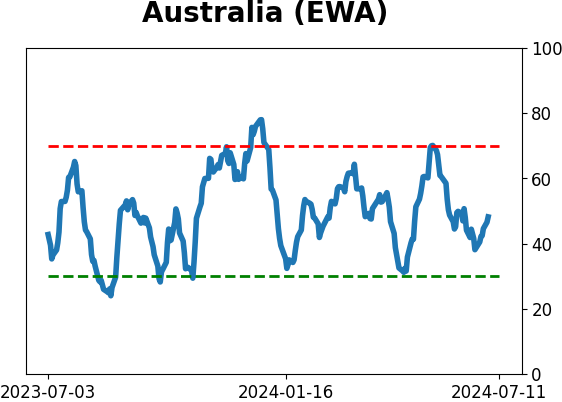
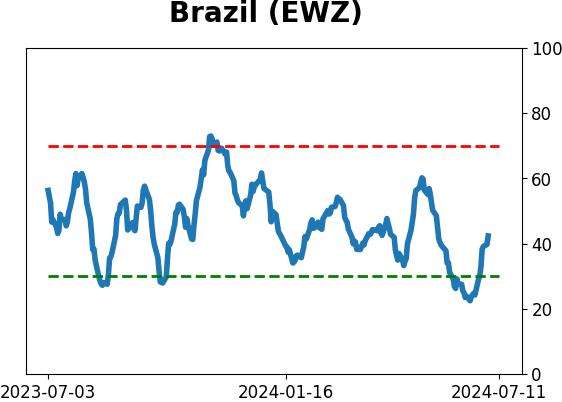
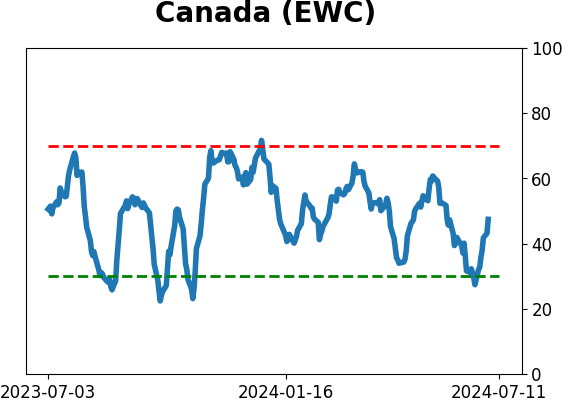
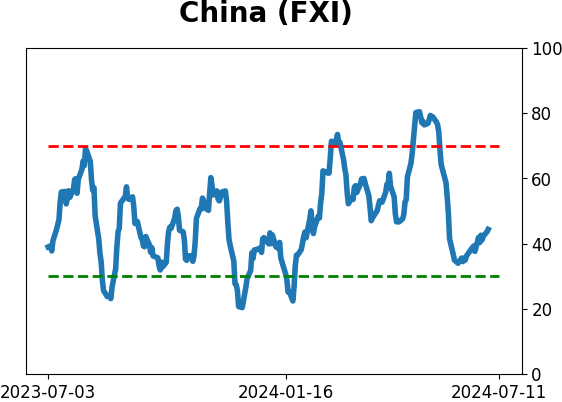
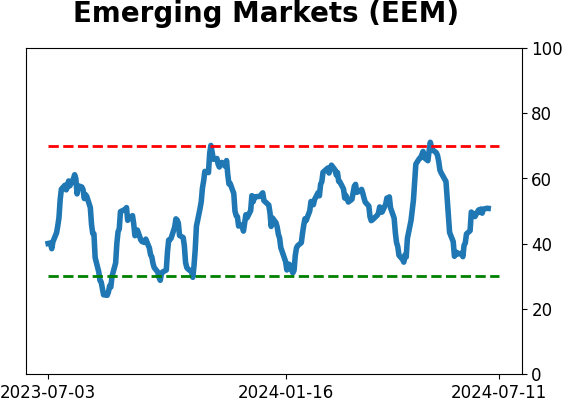
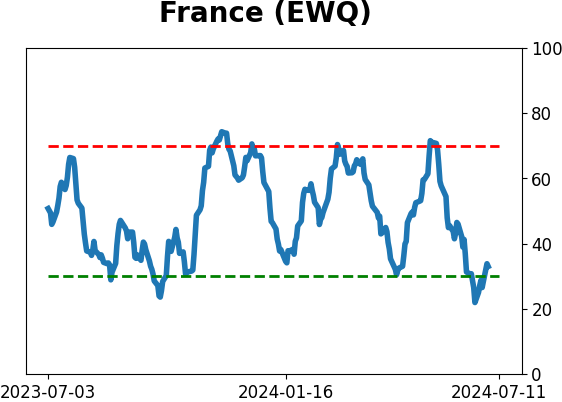
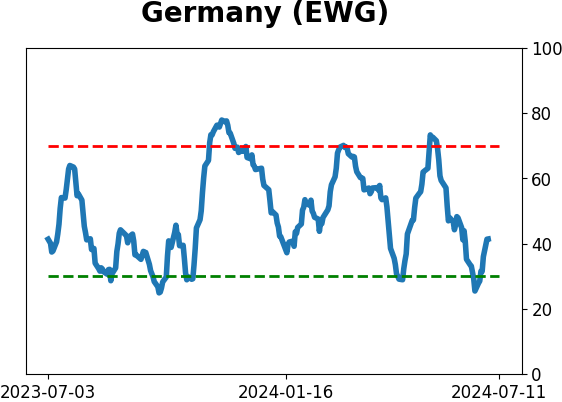
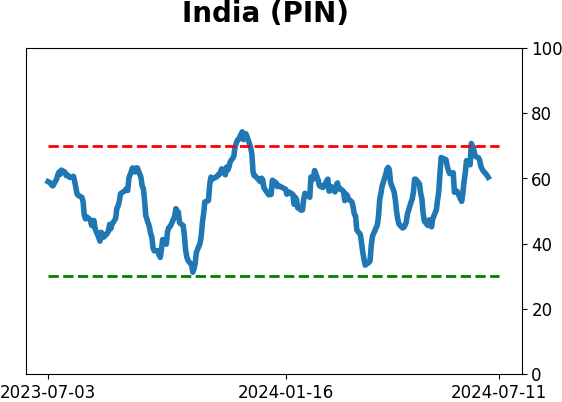
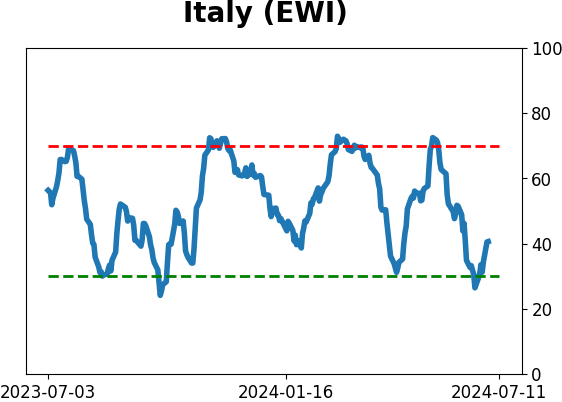
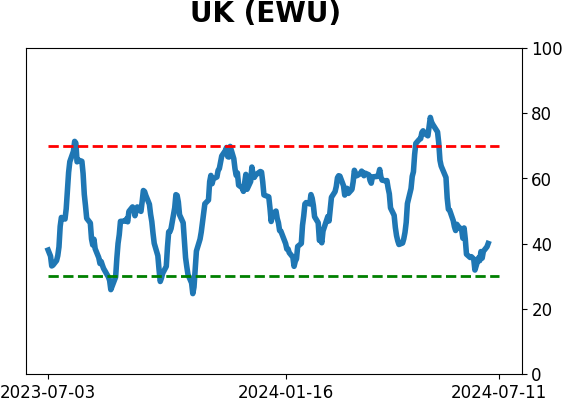
Country ETF's - 10-Day Moving Average
|
|
|
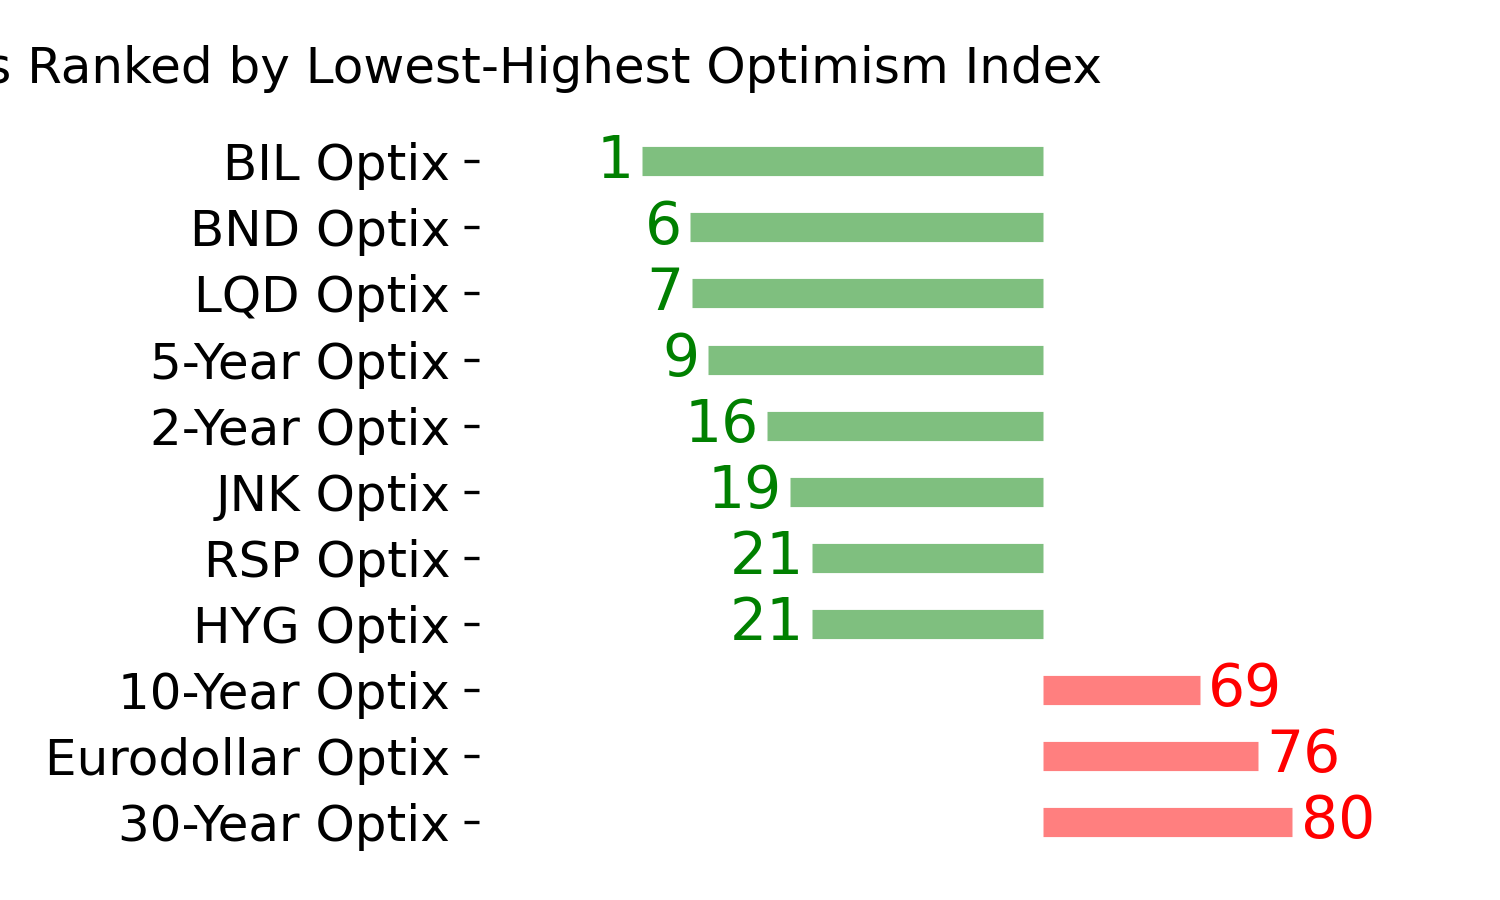
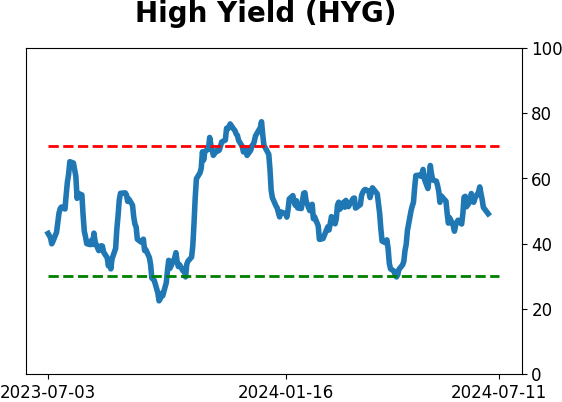
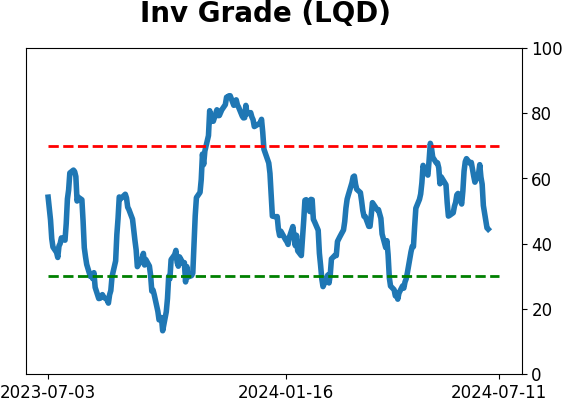
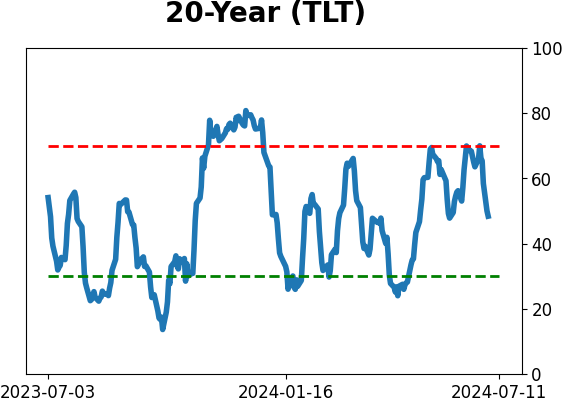
Bond ETF's - 10-Day Moving Average
|
|
|
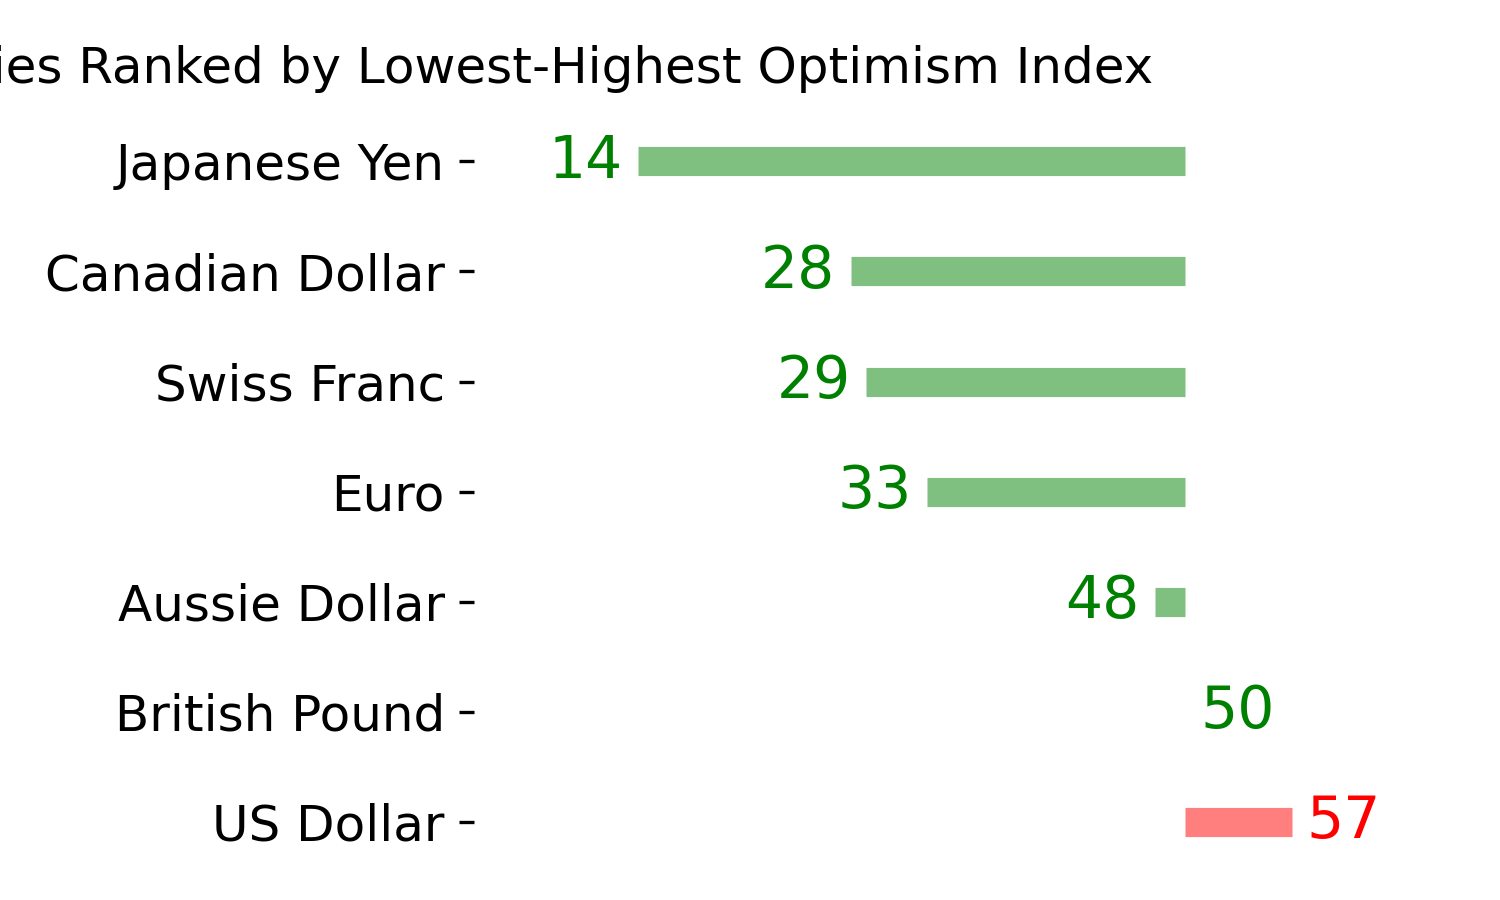
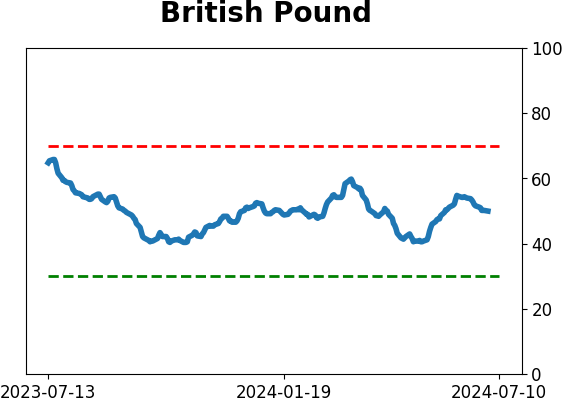
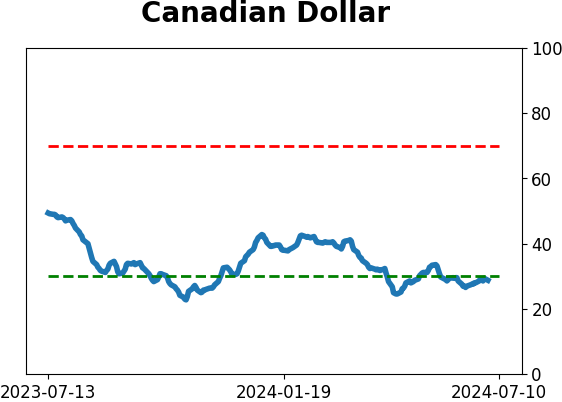
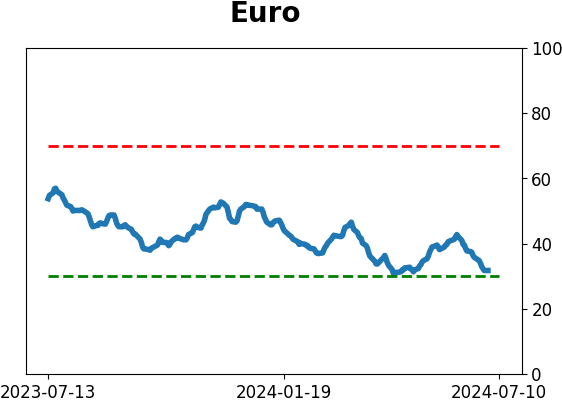
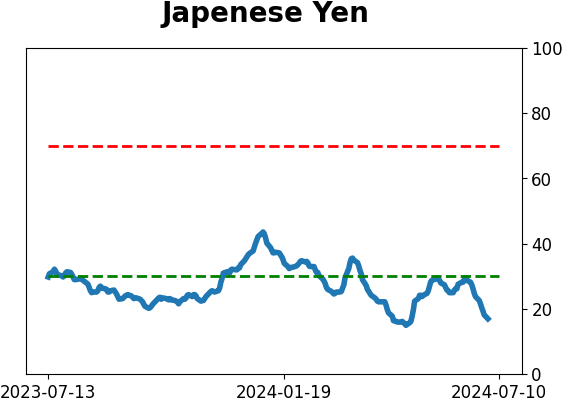
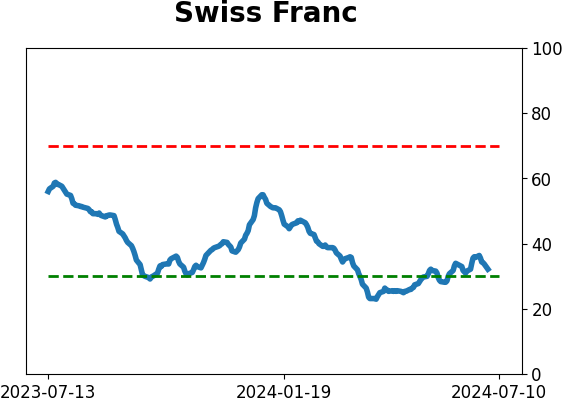
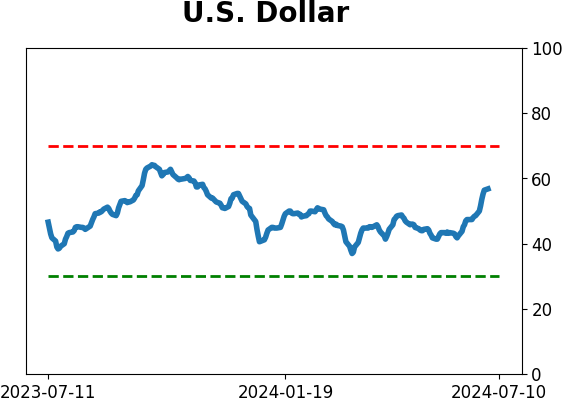
Currency ETF's - 5-Day Moving Average
|
|
|
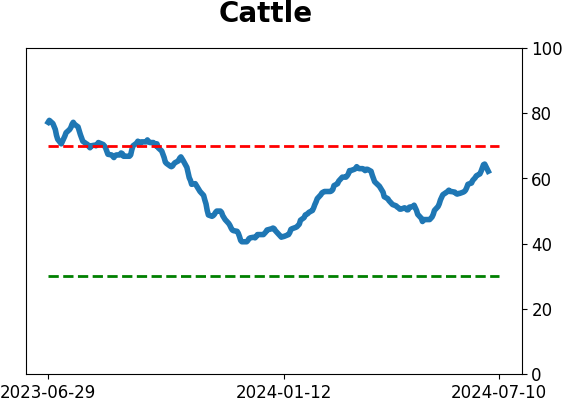
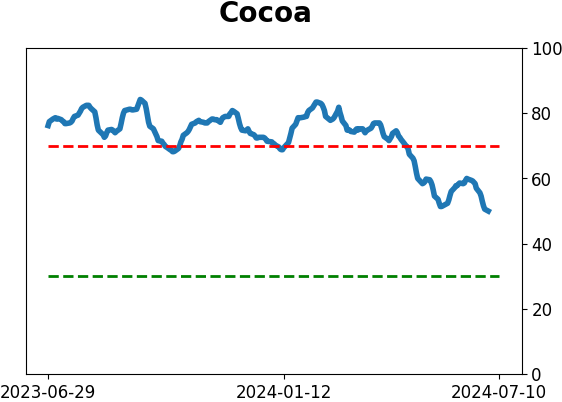
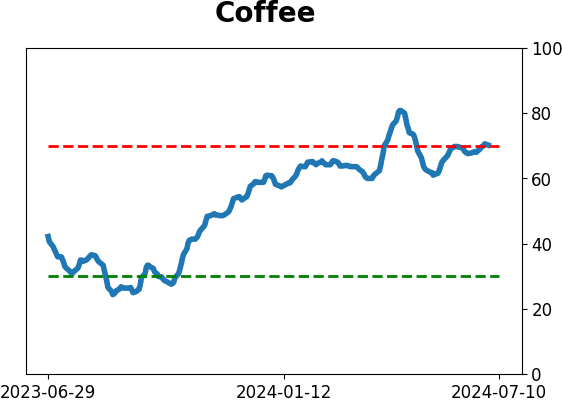
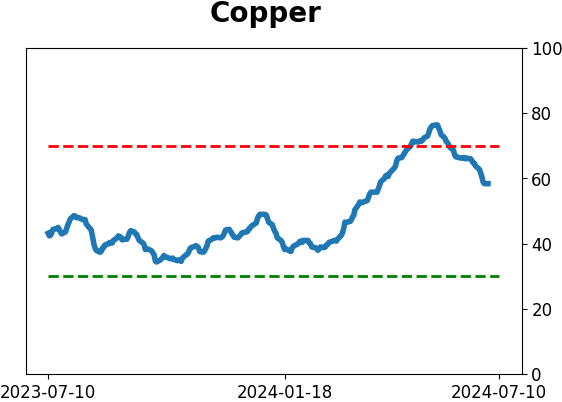
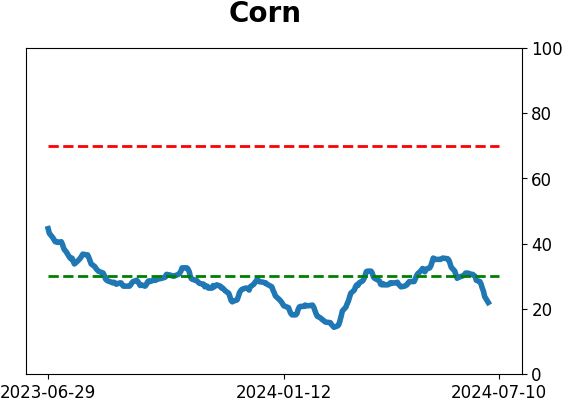
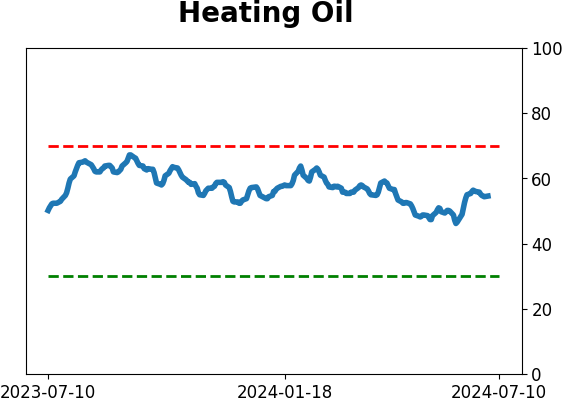
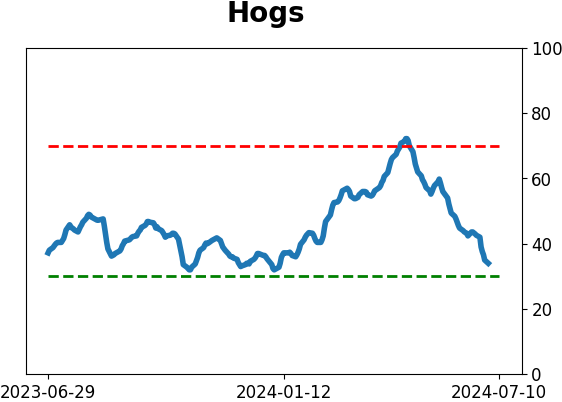
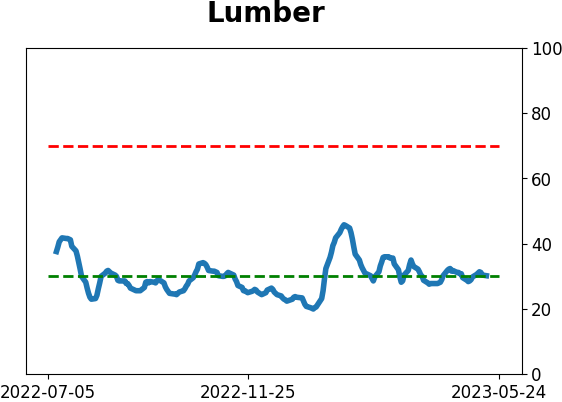
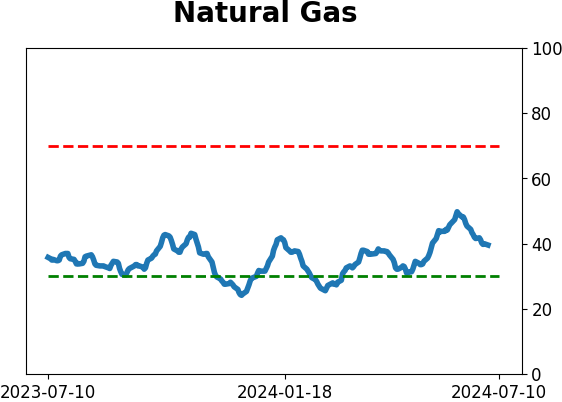
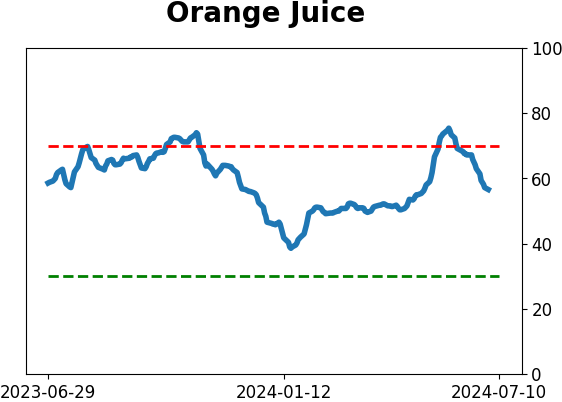
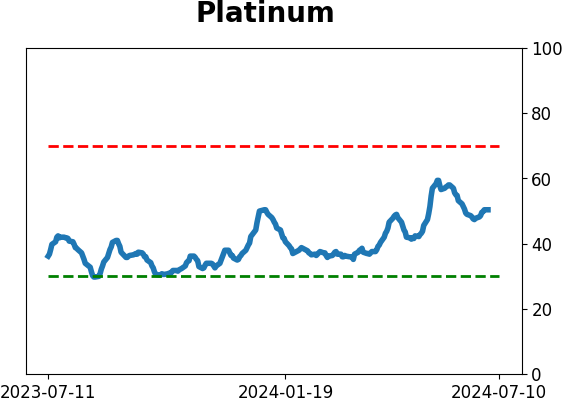
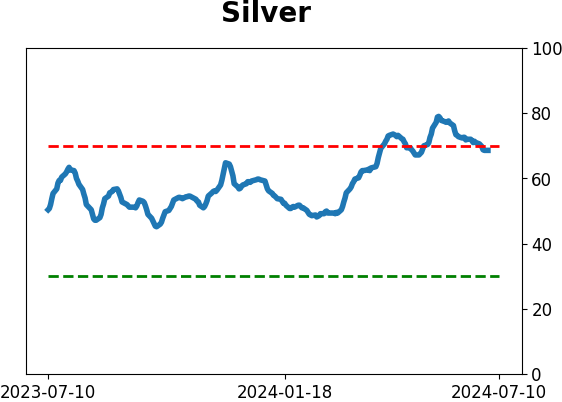
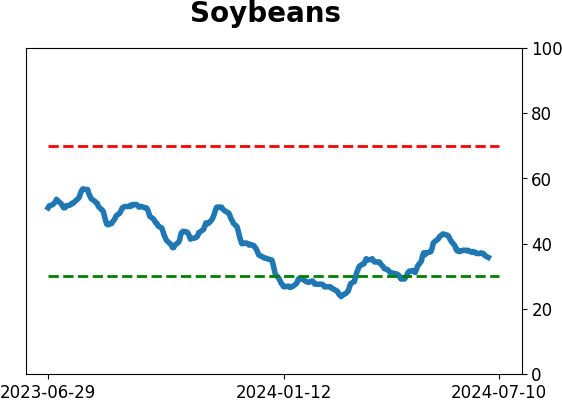
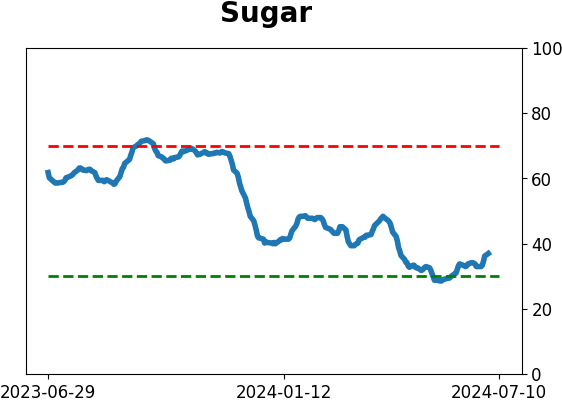
Commodity ETF's - 5-Day Moving Average
|
|