Headlines
|
|
It's time to put commodities back on the radar - Part III:
In Part III, we highlight commodity and stock market performance during the last 15 years of each previous 30-year cycle, including the most recent that ends on 2023-06-30.
|
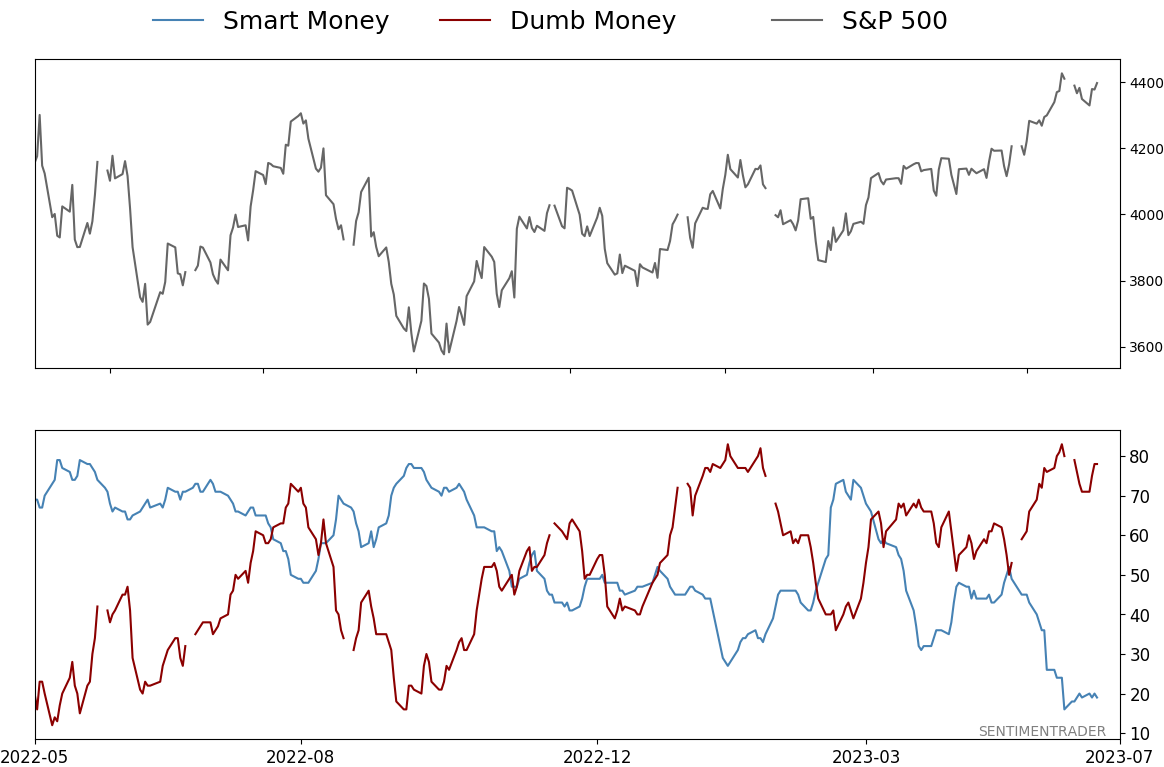
Smart / Dumb Money Confidence
|
Smart Money Confidence: 19%
Dumb Money Confidence: 78%
|
|
Risk Levels
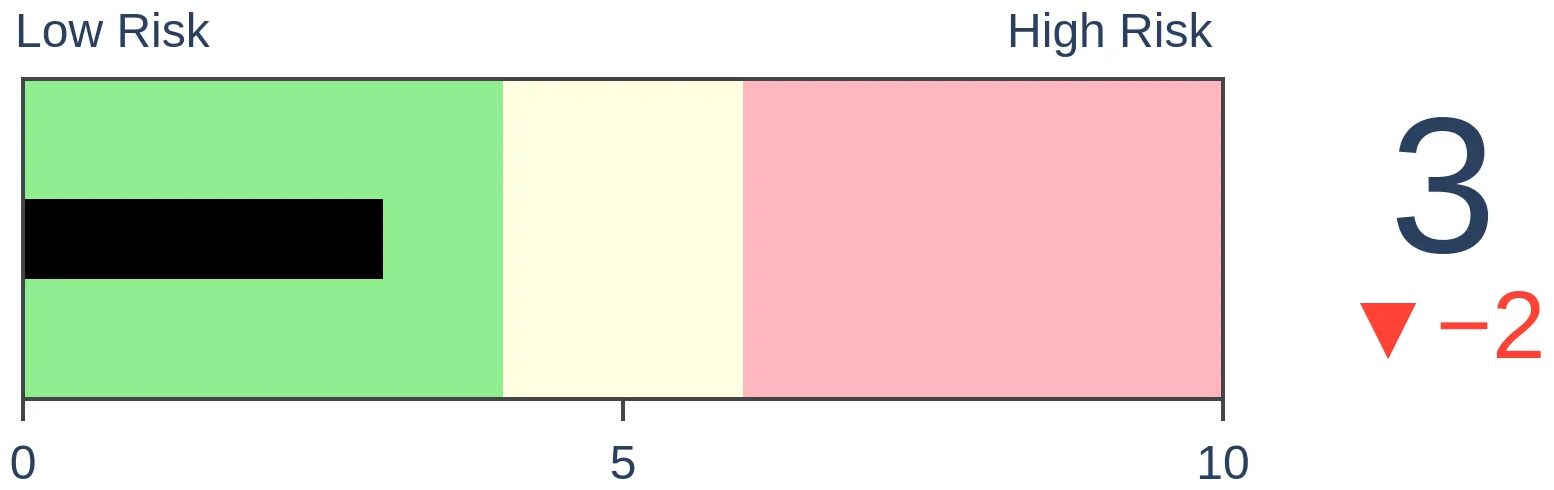
Stocks Short-Term
|
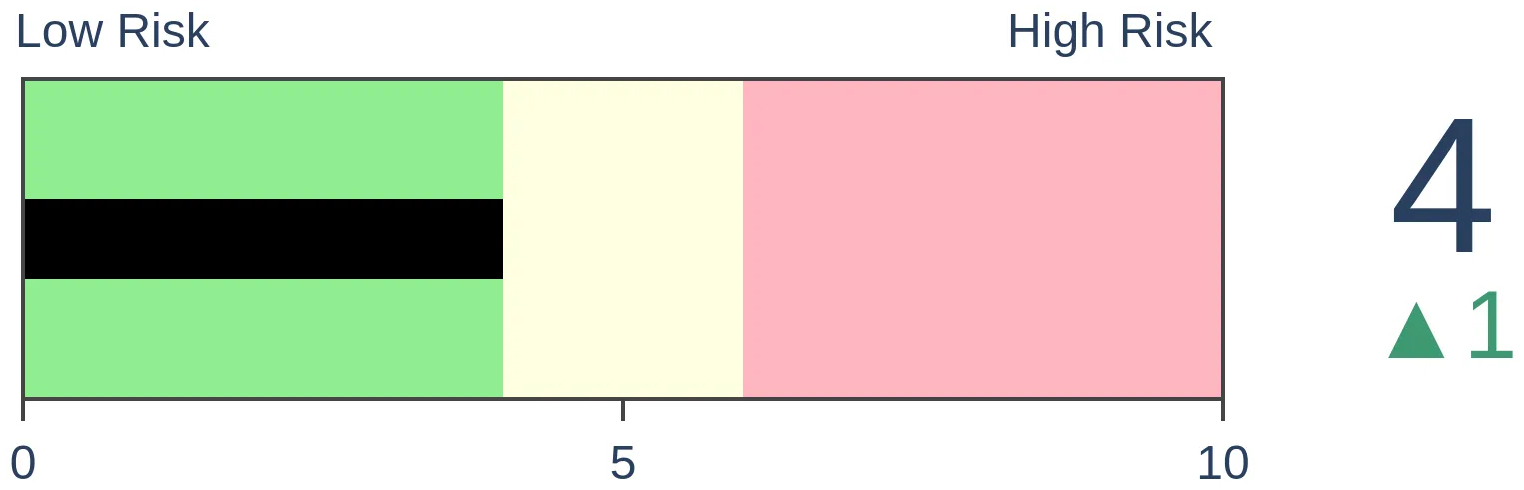
Stocks Medium-Term
|
|
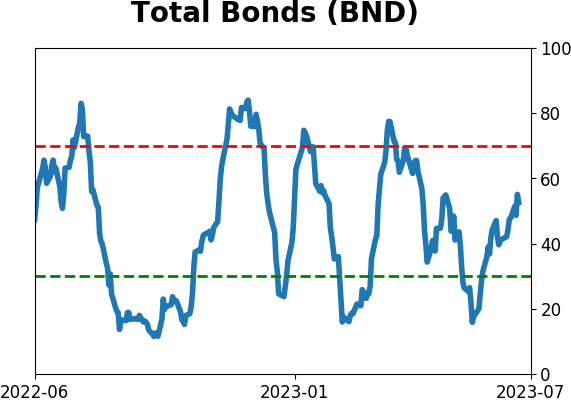
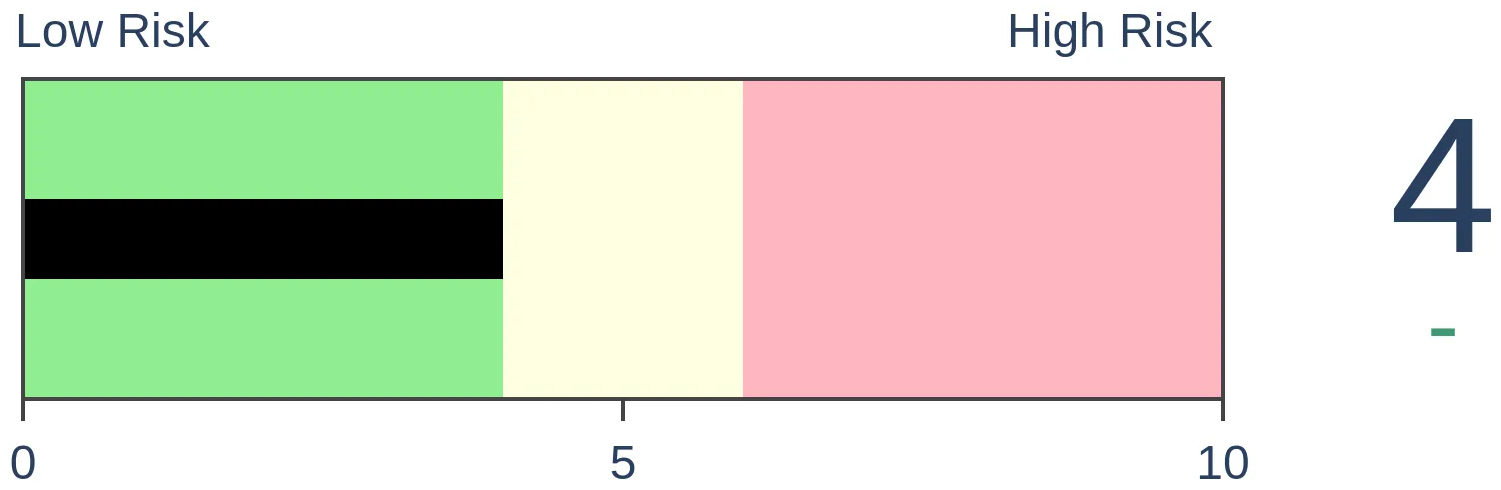
Bonds
|
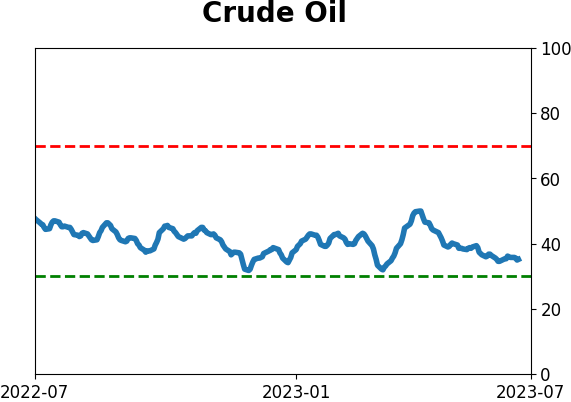
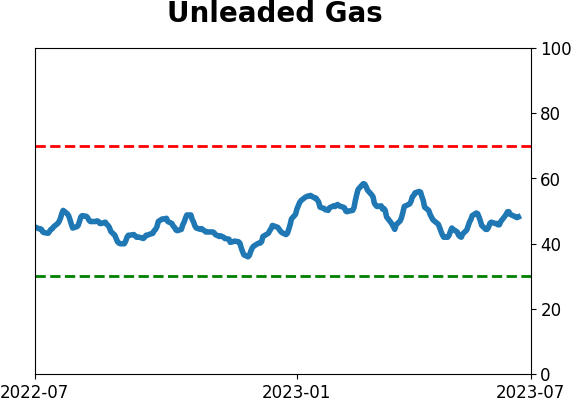
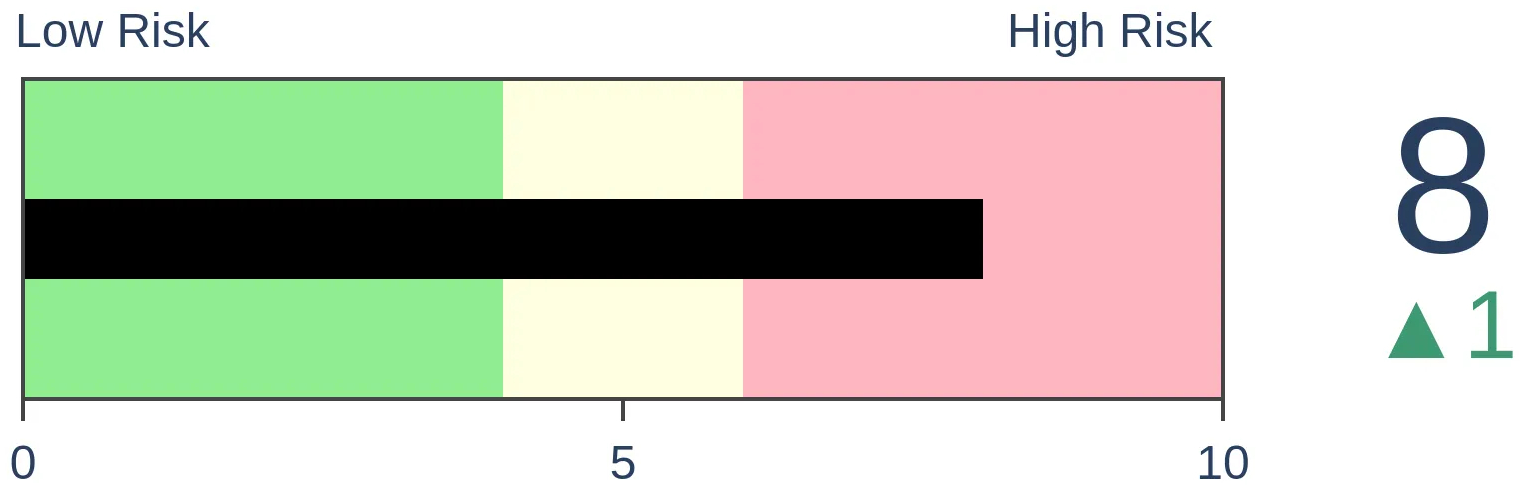
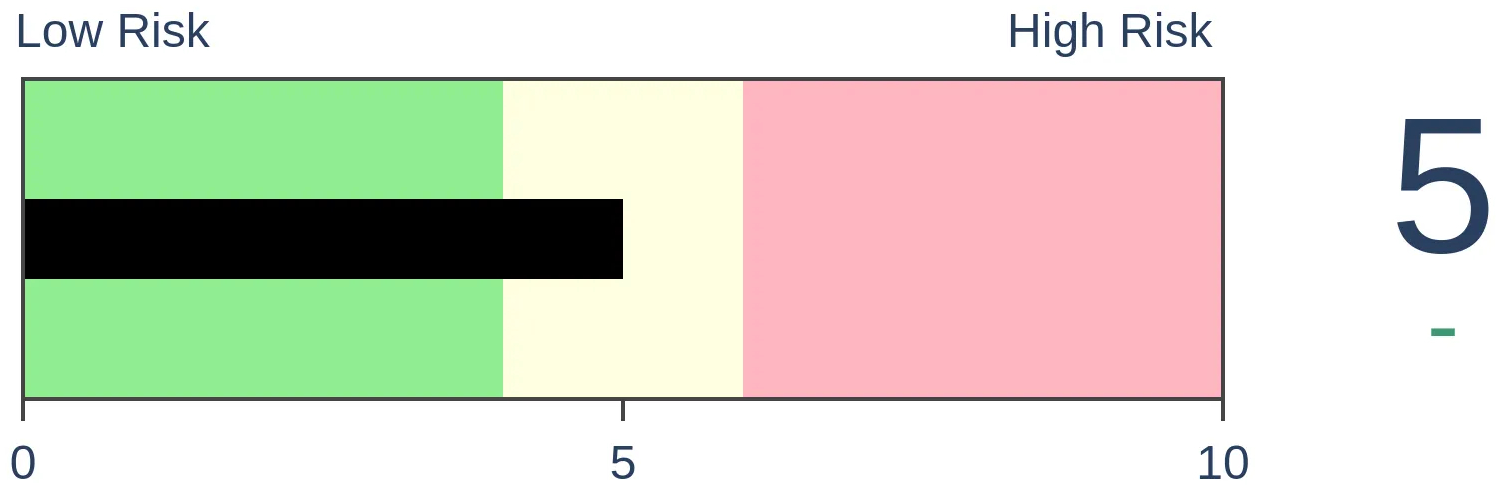
Crude Oil
|
|
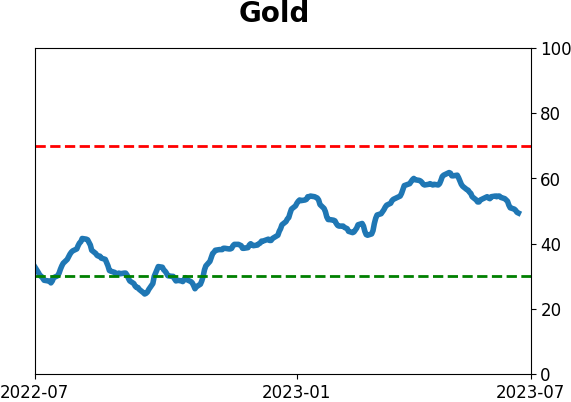
Gold
|
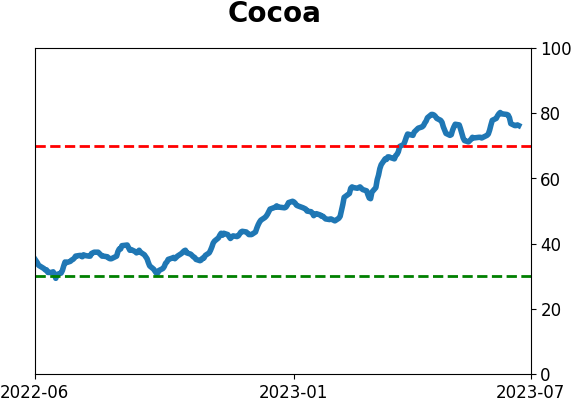
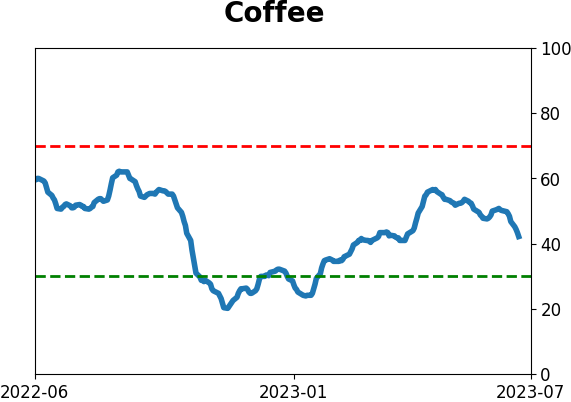
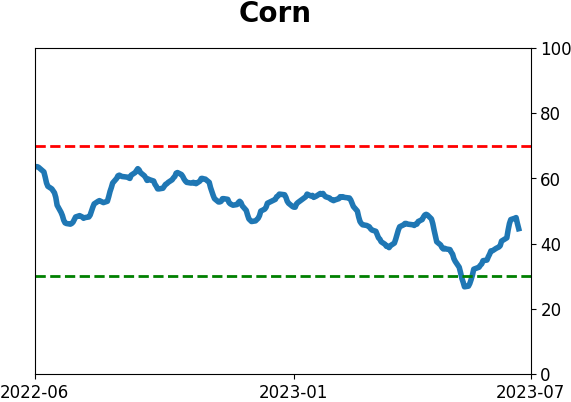
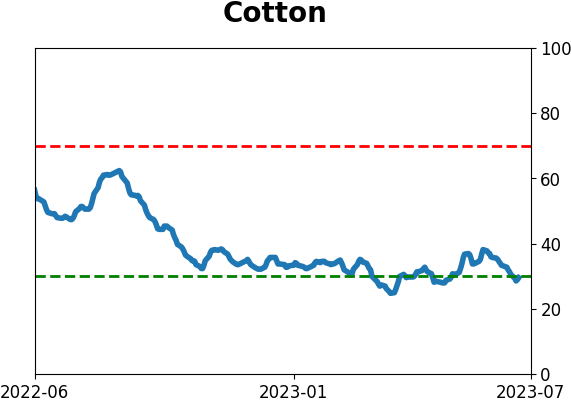
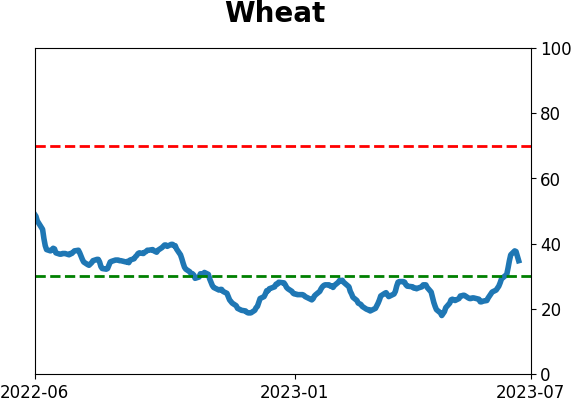
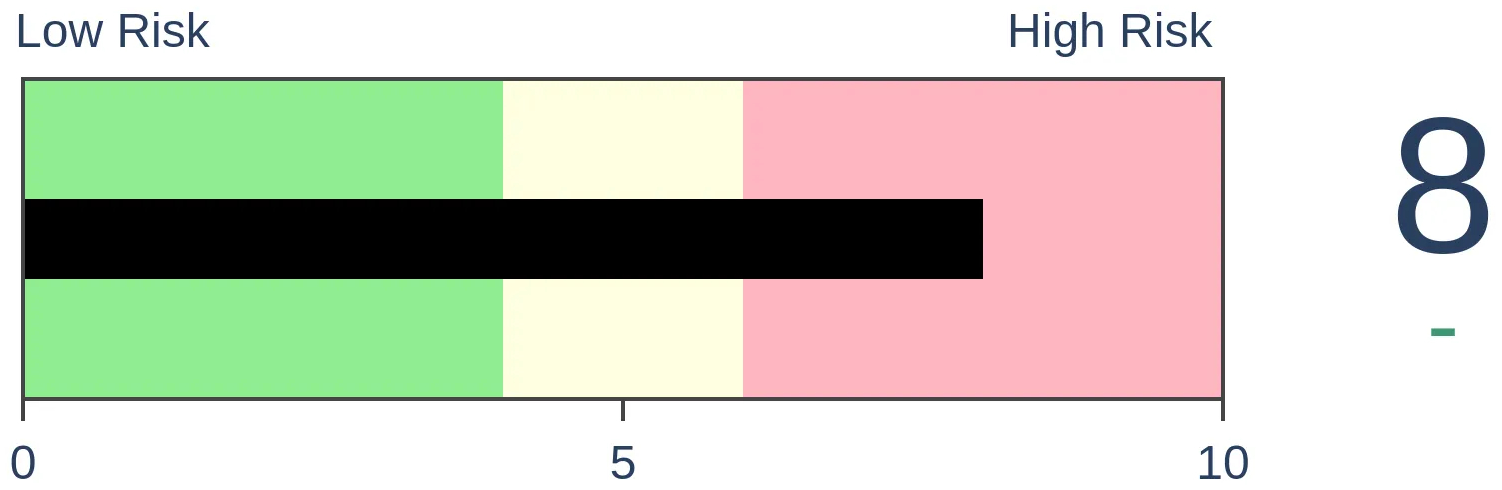
Agriculture
|
|
Research
By Jay Kaeppel
BOTTOM LINE
In Part III, we highlight commodity and stock market performance during the last 15 years of each previous 30-year cycle, including the most recent that ends on 2023-06-30.
FORECAST / TIMEFRAME
None
|
Key points
- In Part I, we highlighted a 30-yr cycle that typically sees commodities significantly outperform stocks during the first 15 years and vice versa during the last 15 years
- A new 30-yr cycle begins at the end of June 2023
- In Part II, we looked at commodity and stock performance during the first 15 years of previous cycles
- In Part III, we will look at commodity and stock performance during the last 15 years of previous cycles
Last 15 years of the 30-year cycle
As a quick refresher, to measure commodity returns, we use the following month-end prices for the following indexes:
- For commodities, we use the Bloomberg futures index from 1933 to1960 and the Bloomberg Spot Commodity Index from 1960 to the present
- For stocks, we use the monthly closing price for the S&P 500 Index
In Part I, we included the table below, which displays commodity and stock market performance during the last 15 years of each 30-year cycle since 1933. The most recent 15-year period began on 2008-06-30 and will end on 2023-06-30.
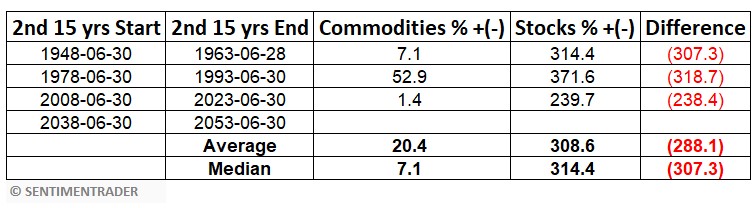
The critical thing to note in the table above is that during the last 15 years of previous 30-year cycles, commodities outperformed stocks by better than 15-to-1 on average (the difference is almost 45-to-1 if using median returns instead of average returns).
Commodity performance during the last 15 years of the 30-year cycle
The chart below displays the growth of $1 in commodities (using the Bloomberg indexes as a proxy) only during the last 15 years of each previous 30-year cycle.
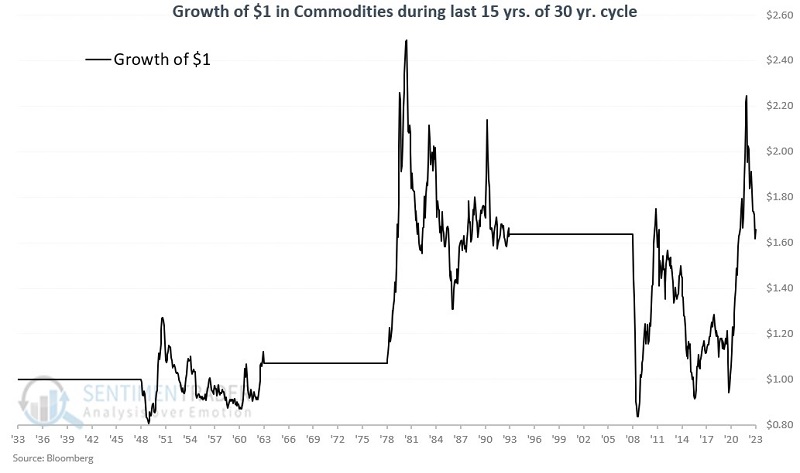
A closer look at the chart above reveals that commodity performance has been extraordinarily volatile, including some catastrophic declines. The cumulative gain from holding commodities during the combined 45 years tested was just +66%.
Stock performance during the last 15 years of the 30-year cycle
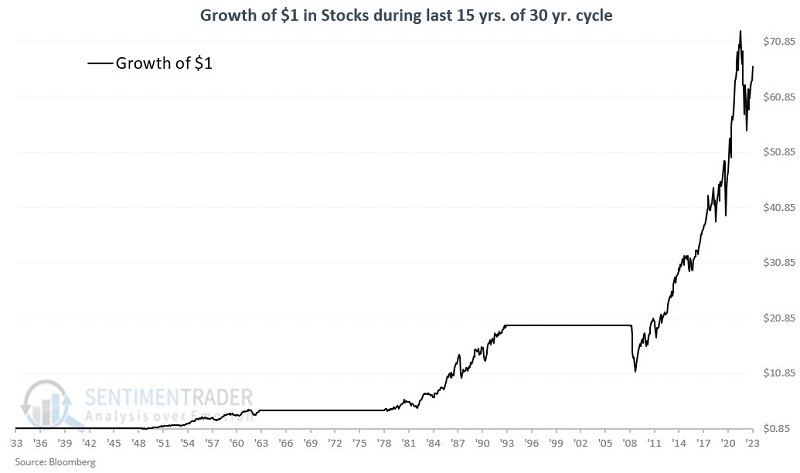
The chart below displays the growth of $1 in stocks (using the S&P 500 Index as a proxy) only during the last 15 years of each previous 30-year cycle.
To get a better perspective on stock returns during these periods, the chart below displays the same information as above on a logarithmic scale.
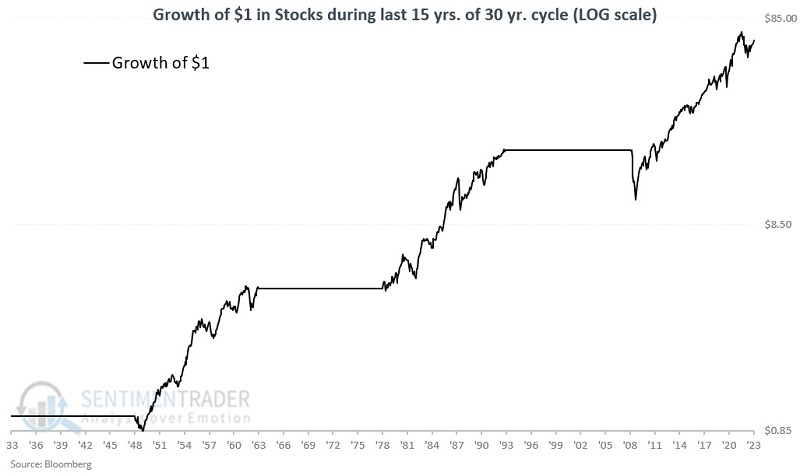
A closer look at the charts above reveal that:
- There is no guarantee that stocks will enjoy "smooth sailing" just because the calendar falls within a particular time period
- Nevertheless, the long-term "lower left to upper right" nature of returns is unmistakable
Comparing commodities to stocks during the last 15 years of the 30-year cycle
The chart below displays the growth of $1 in commodities (black line) versus $1 in stocks (blue line) if held only during the last 15 years of each previous 30-year cycle, including the one that ends on 2023-06-30.
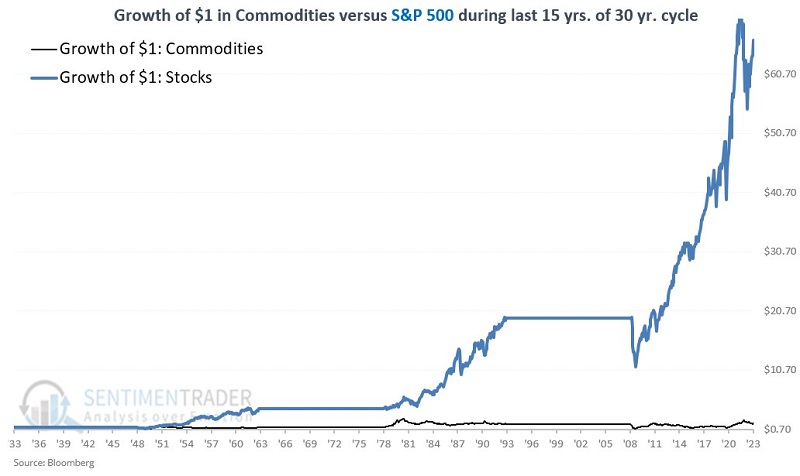
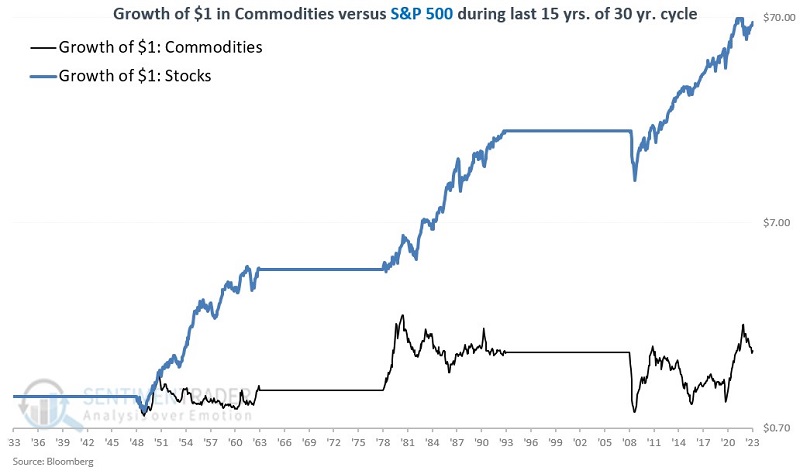
The chart below displays the same data as the chart above on a logarithmic scale.
What the research tells us…
As previous cycles portended, stocks significantly outperformed commodities over the most recent 15-year period ending on 2023-06-30. The next "last 15 years" period will not begin until the close on 2038-06-30.
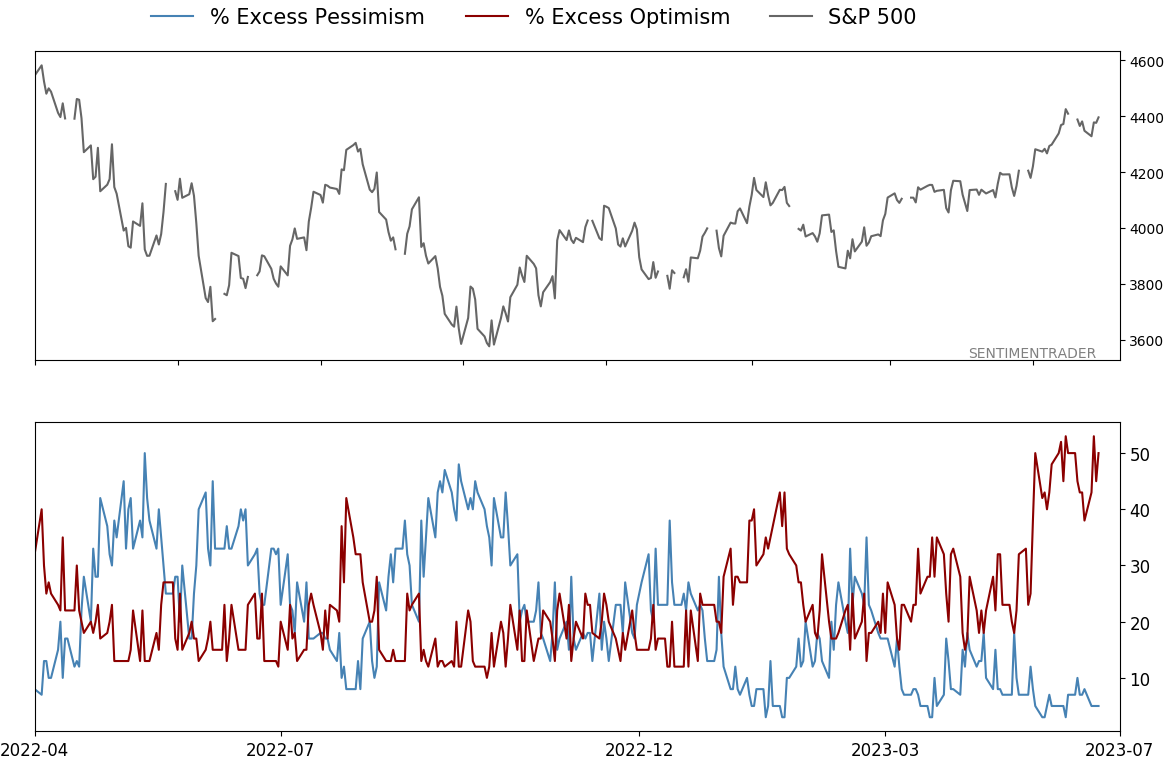
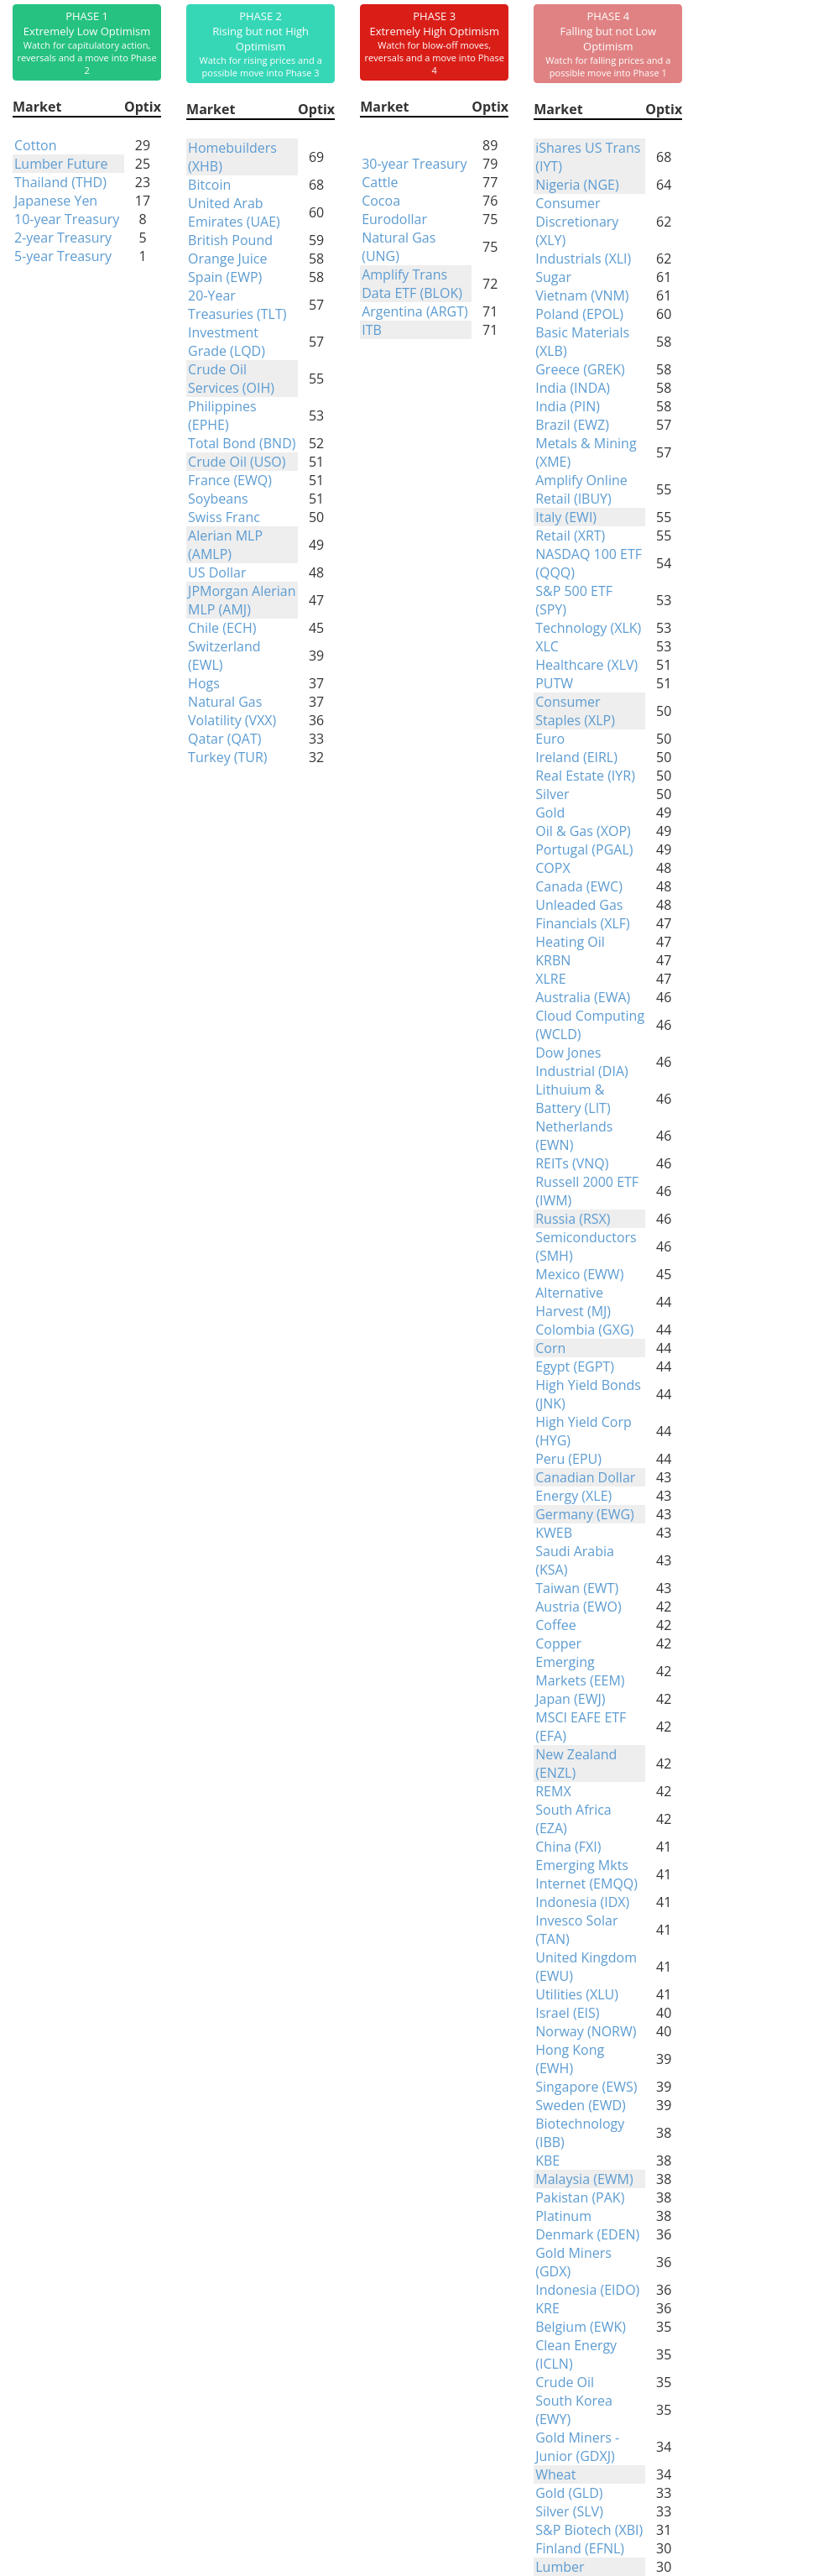
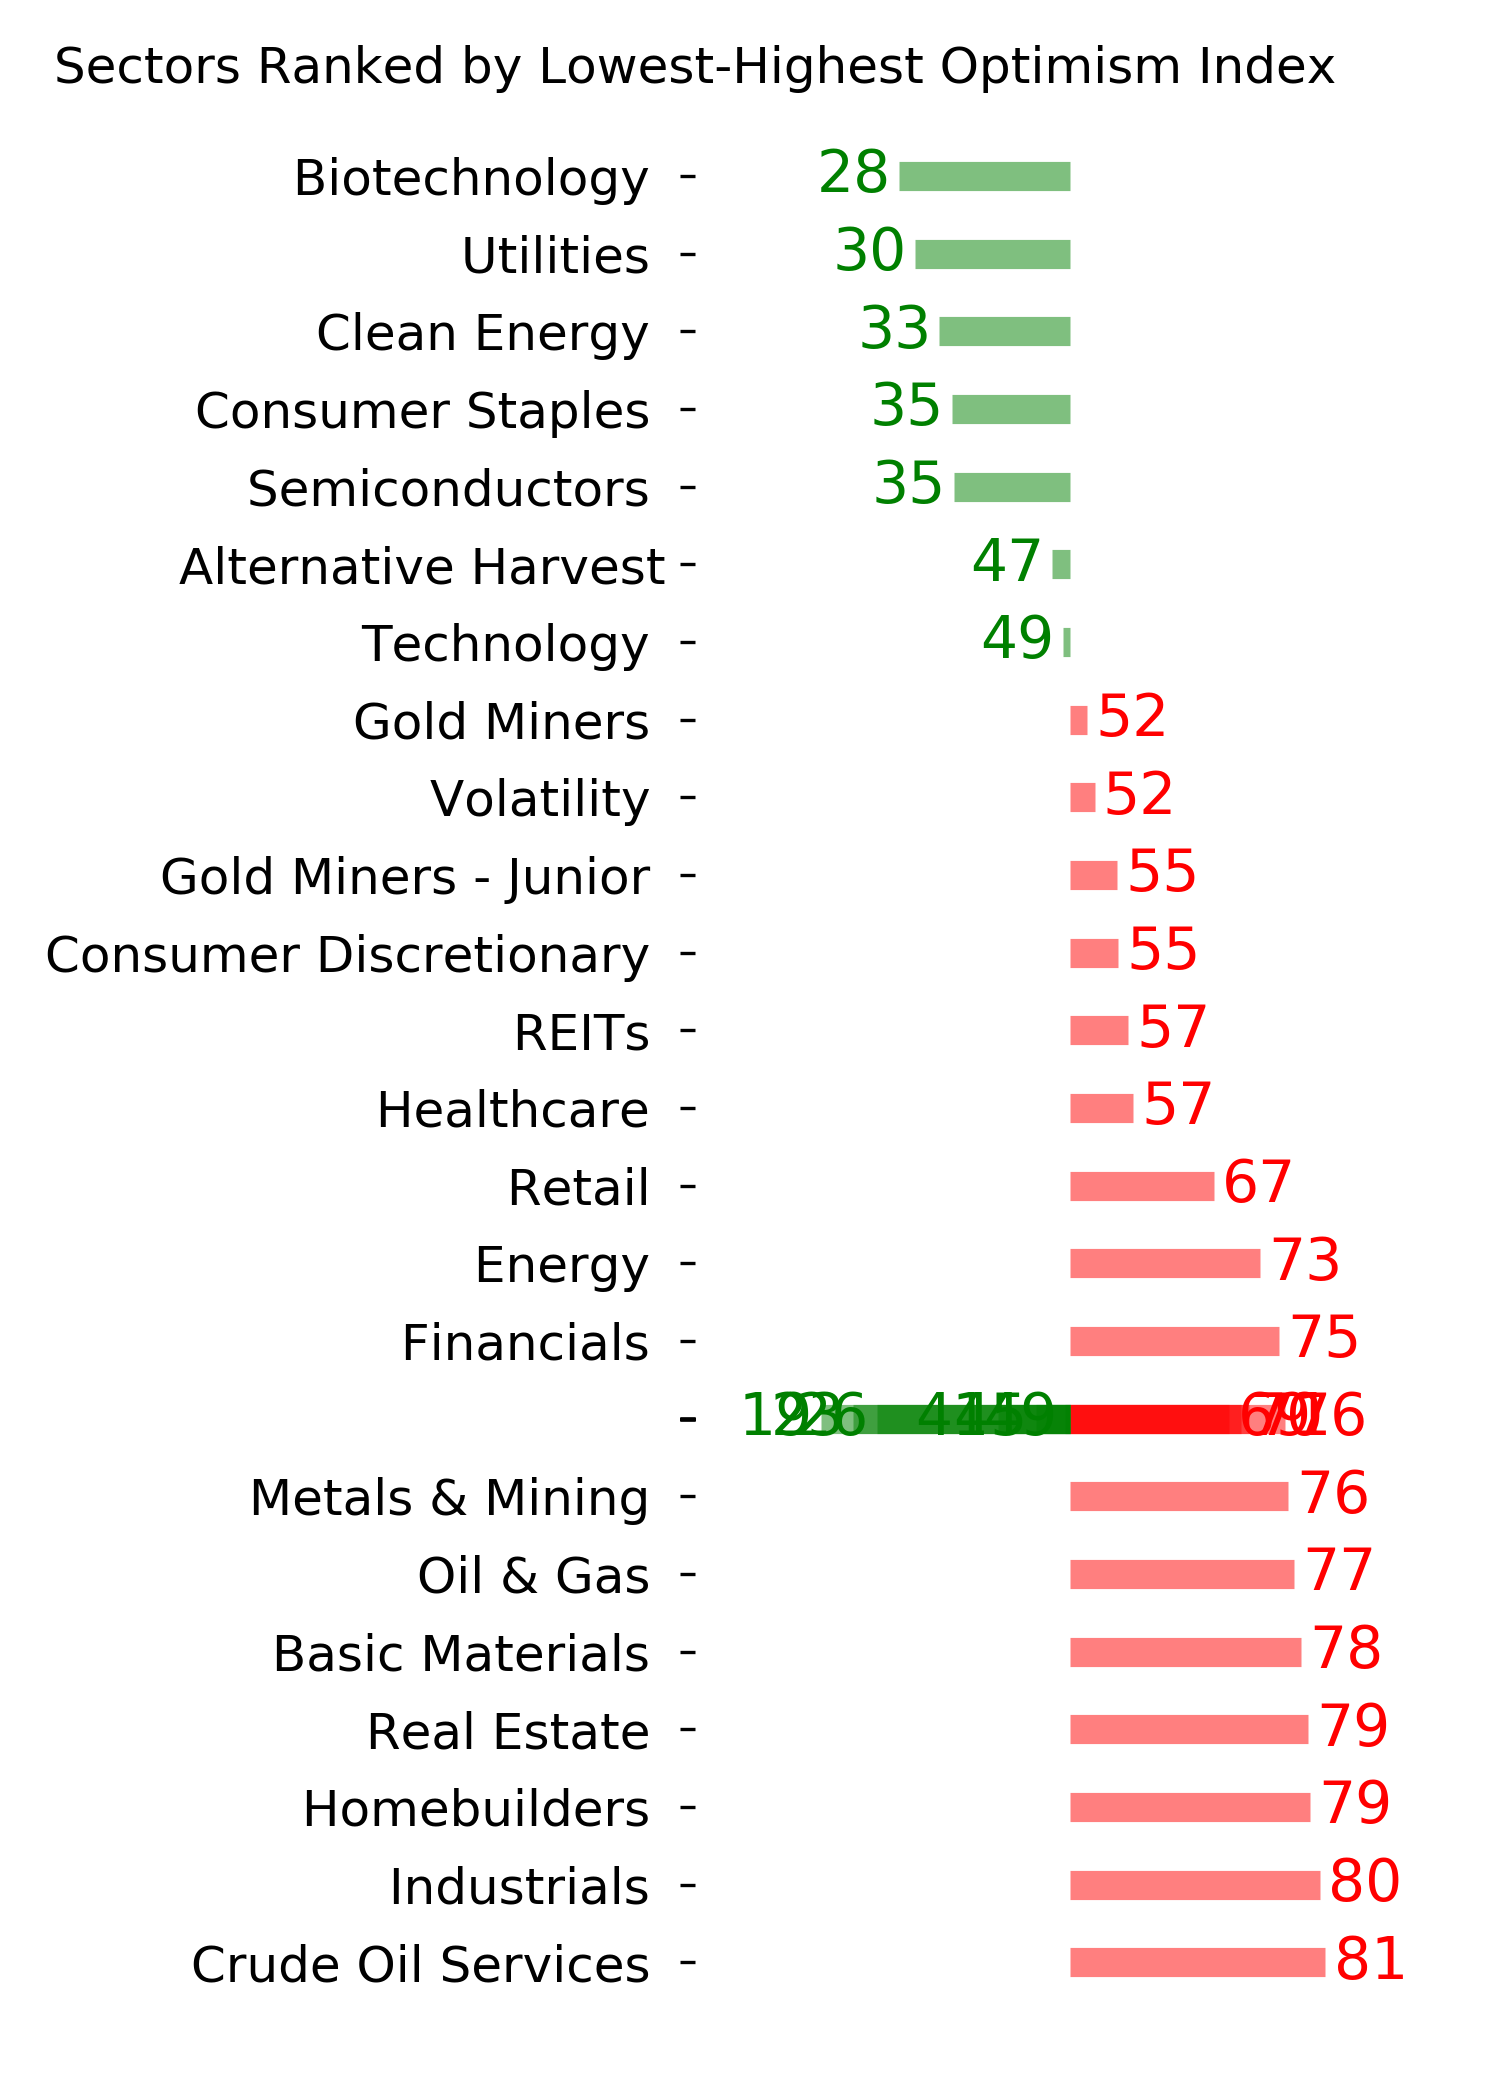
Indicators at Extremes
Phase Table
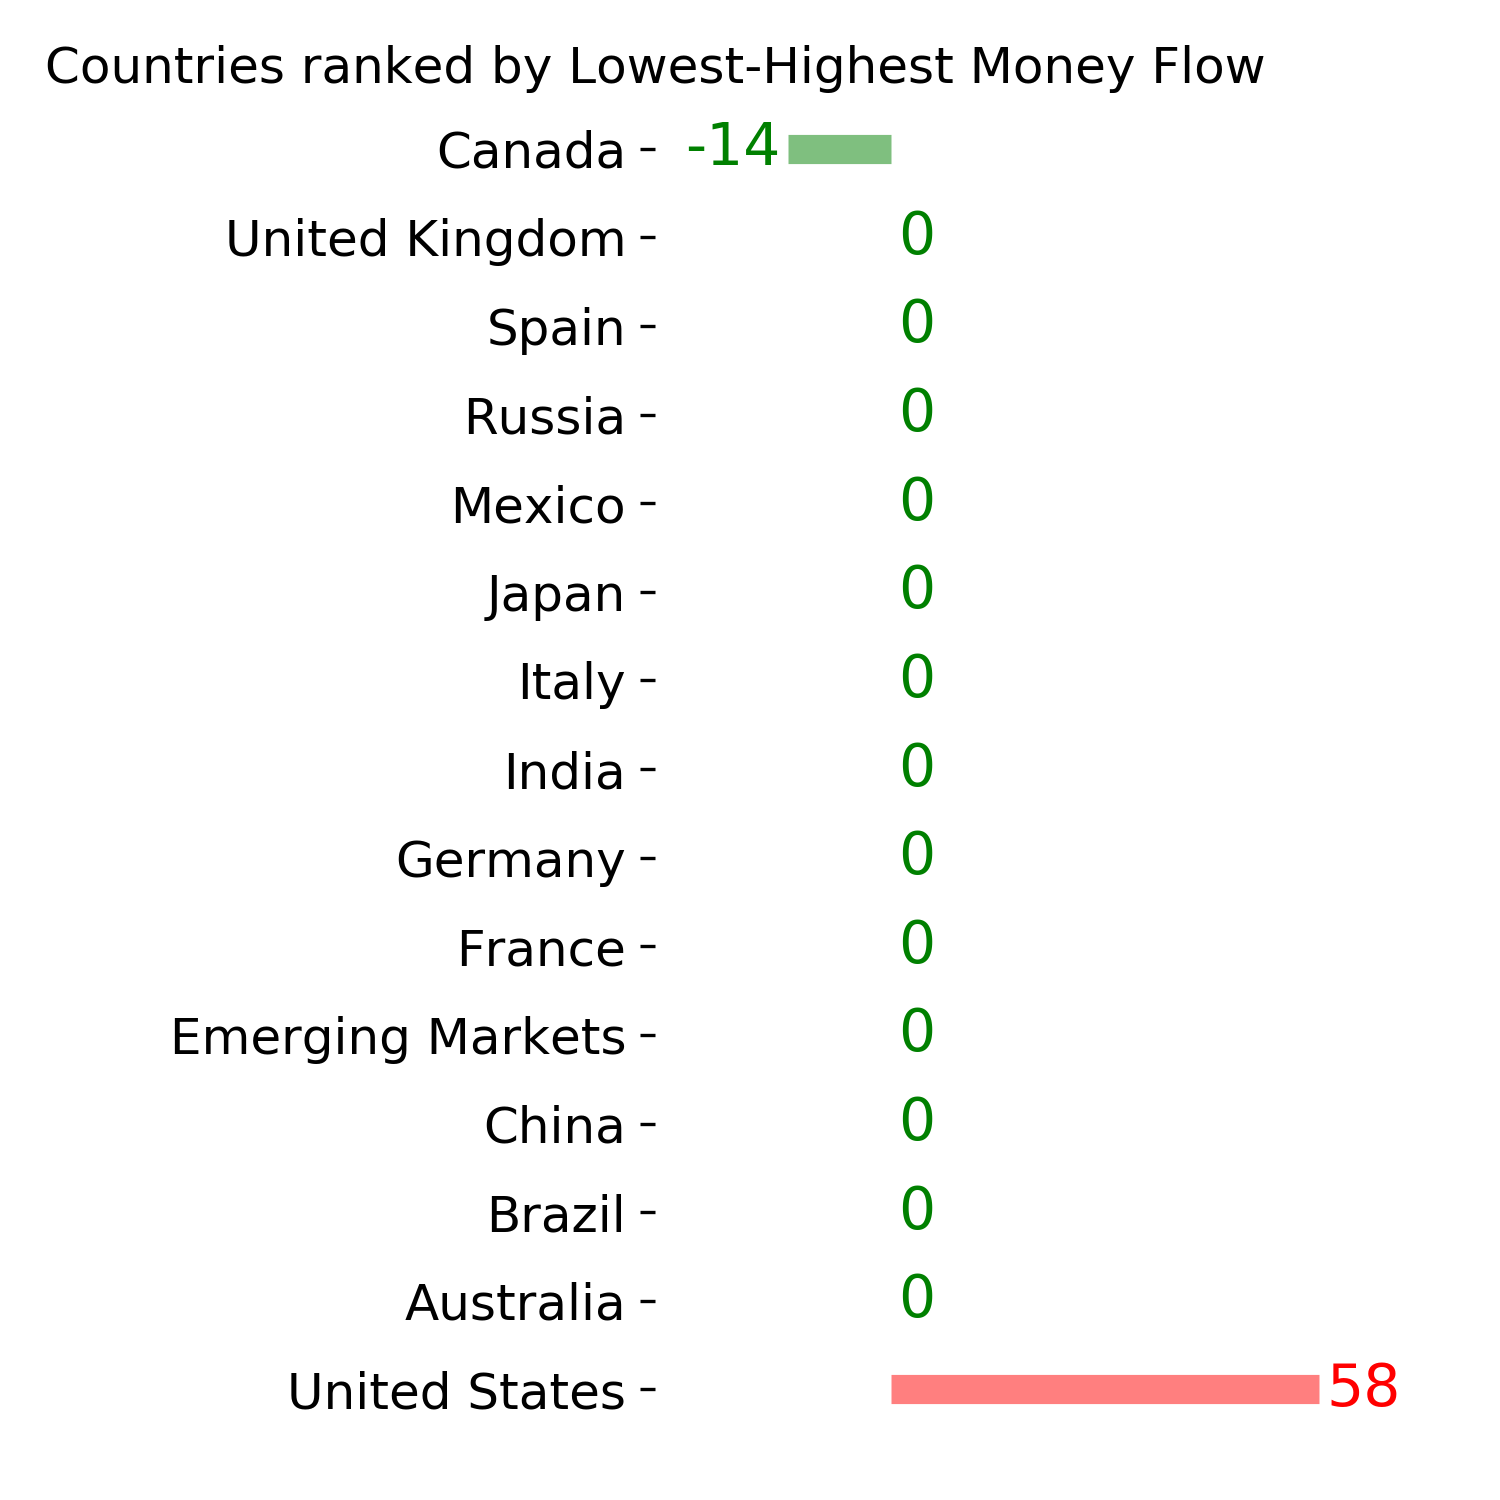
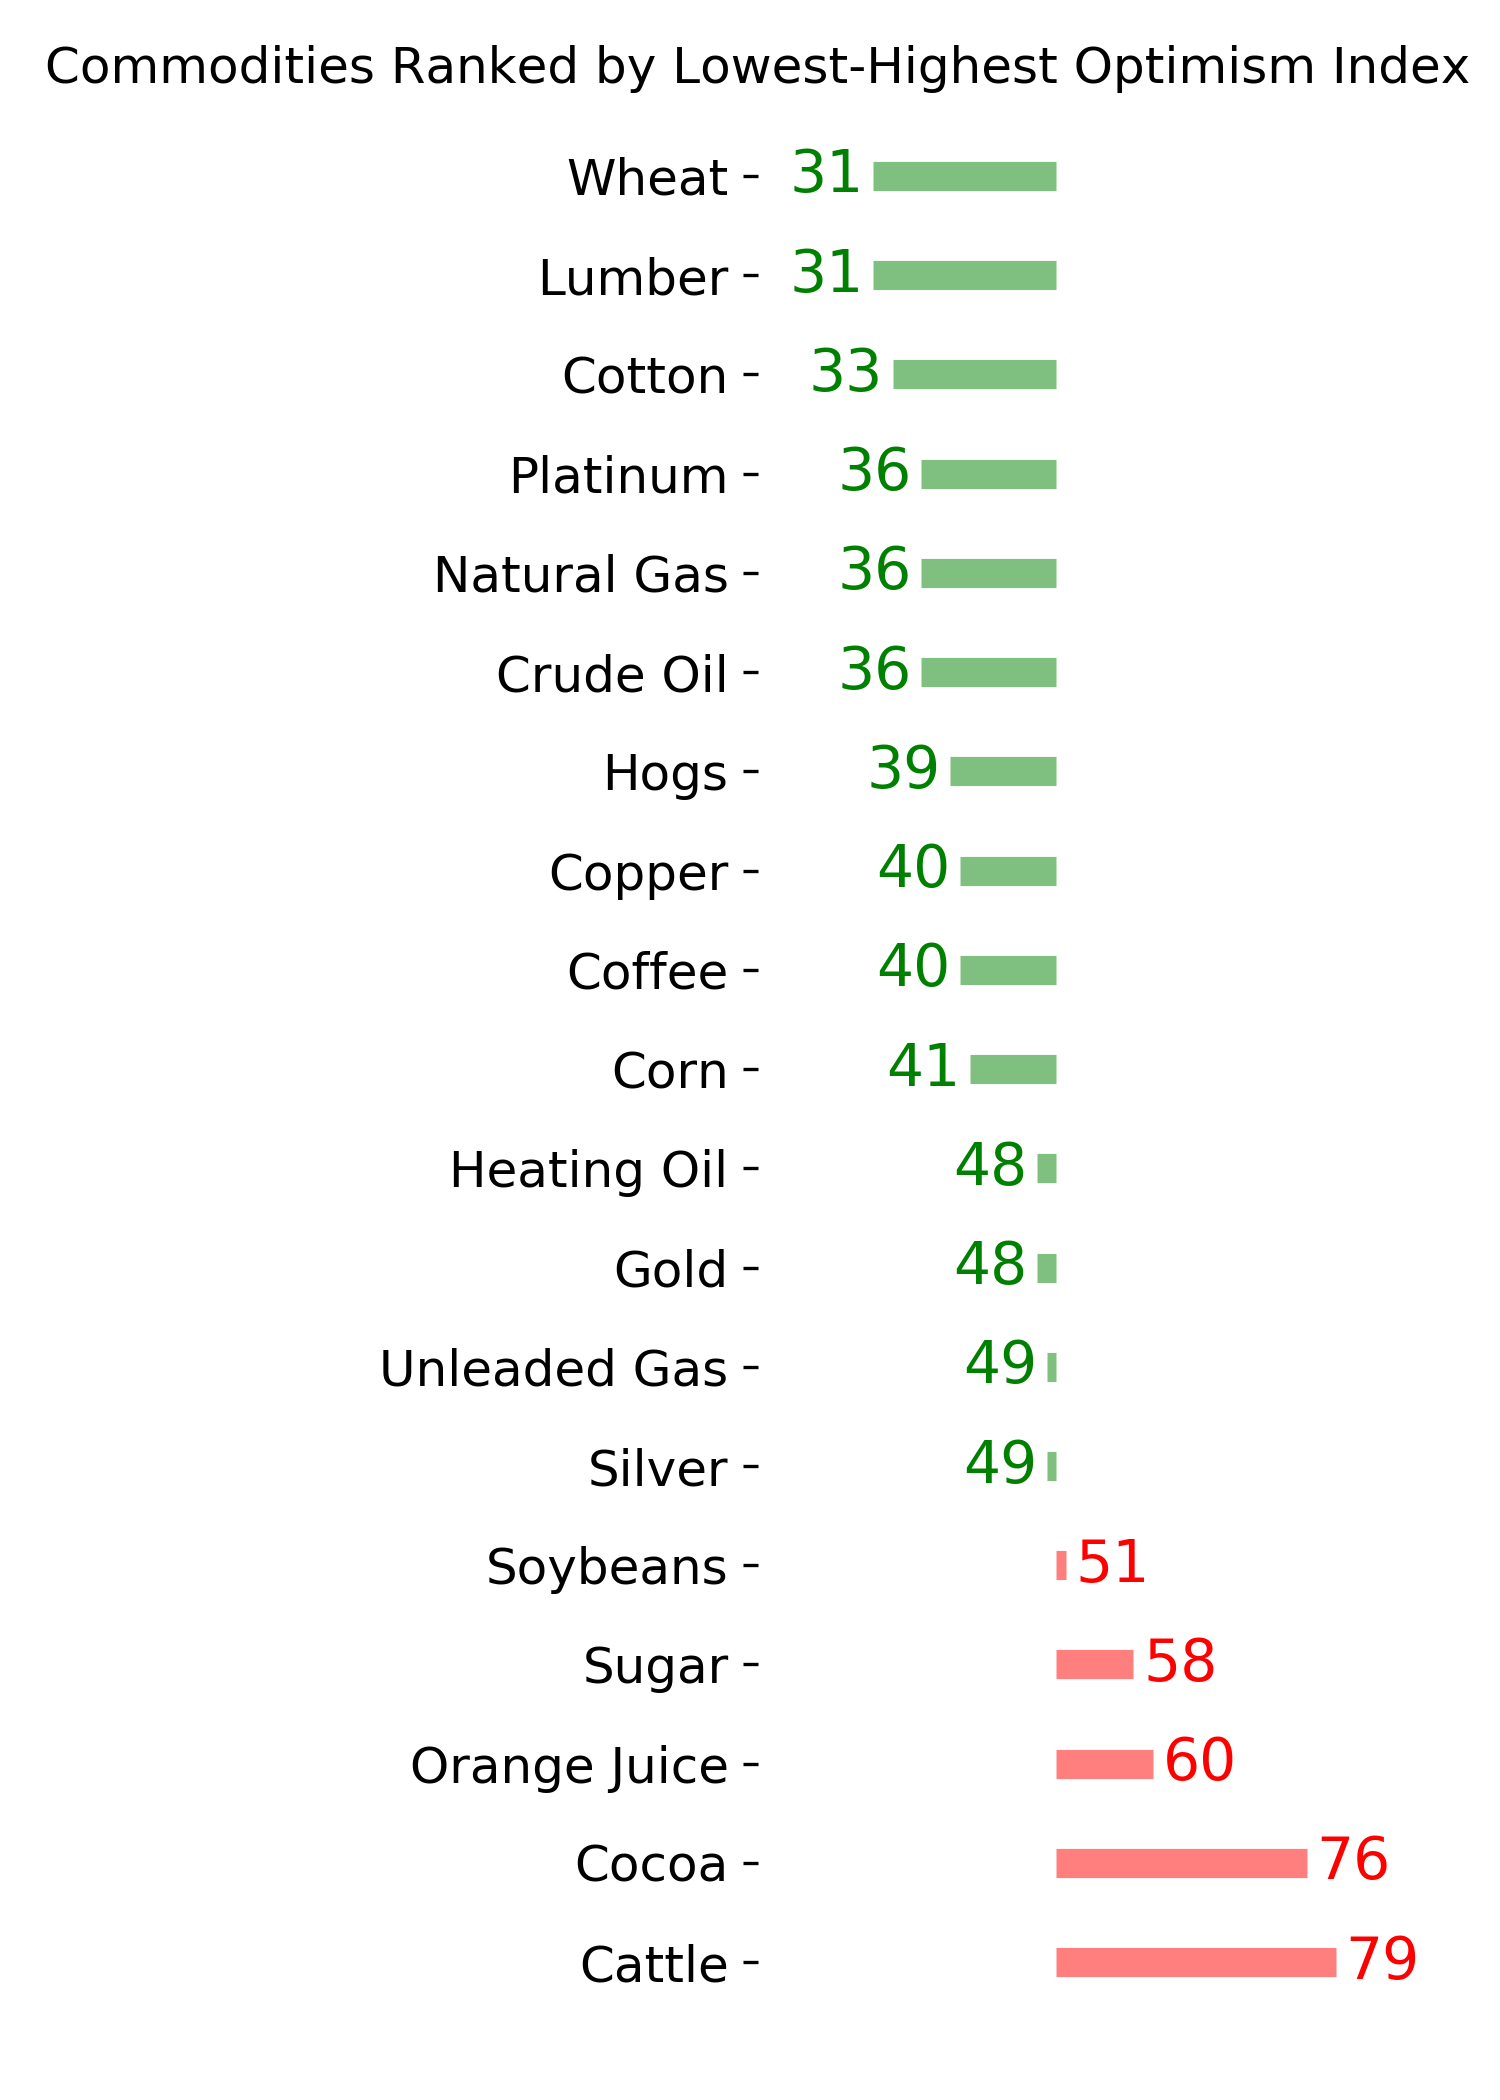
Ranks
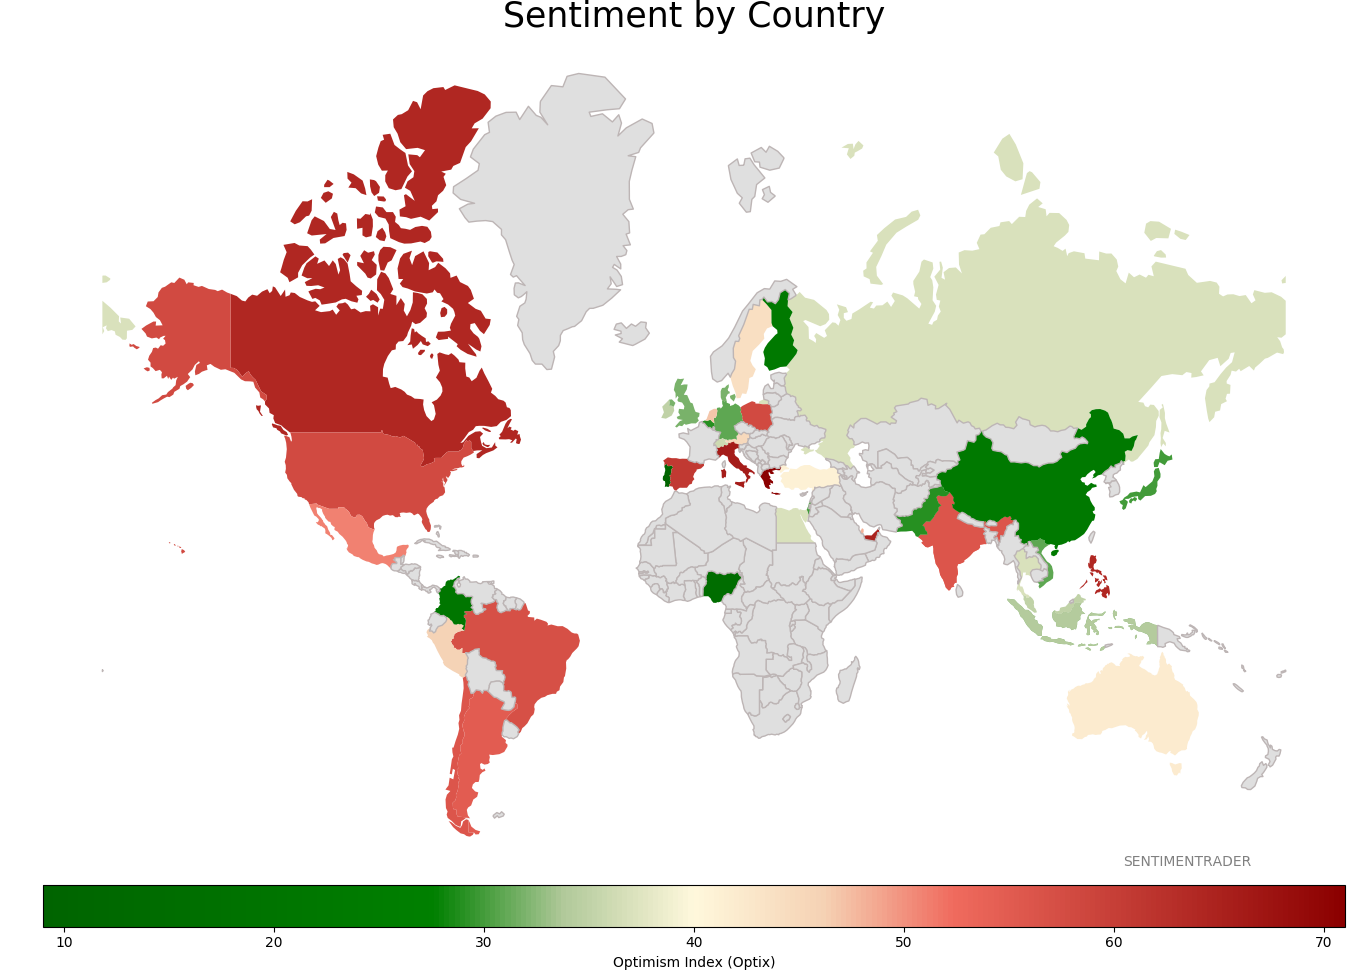
Sentiment Around The World
Optimism Index Thumbnails
|
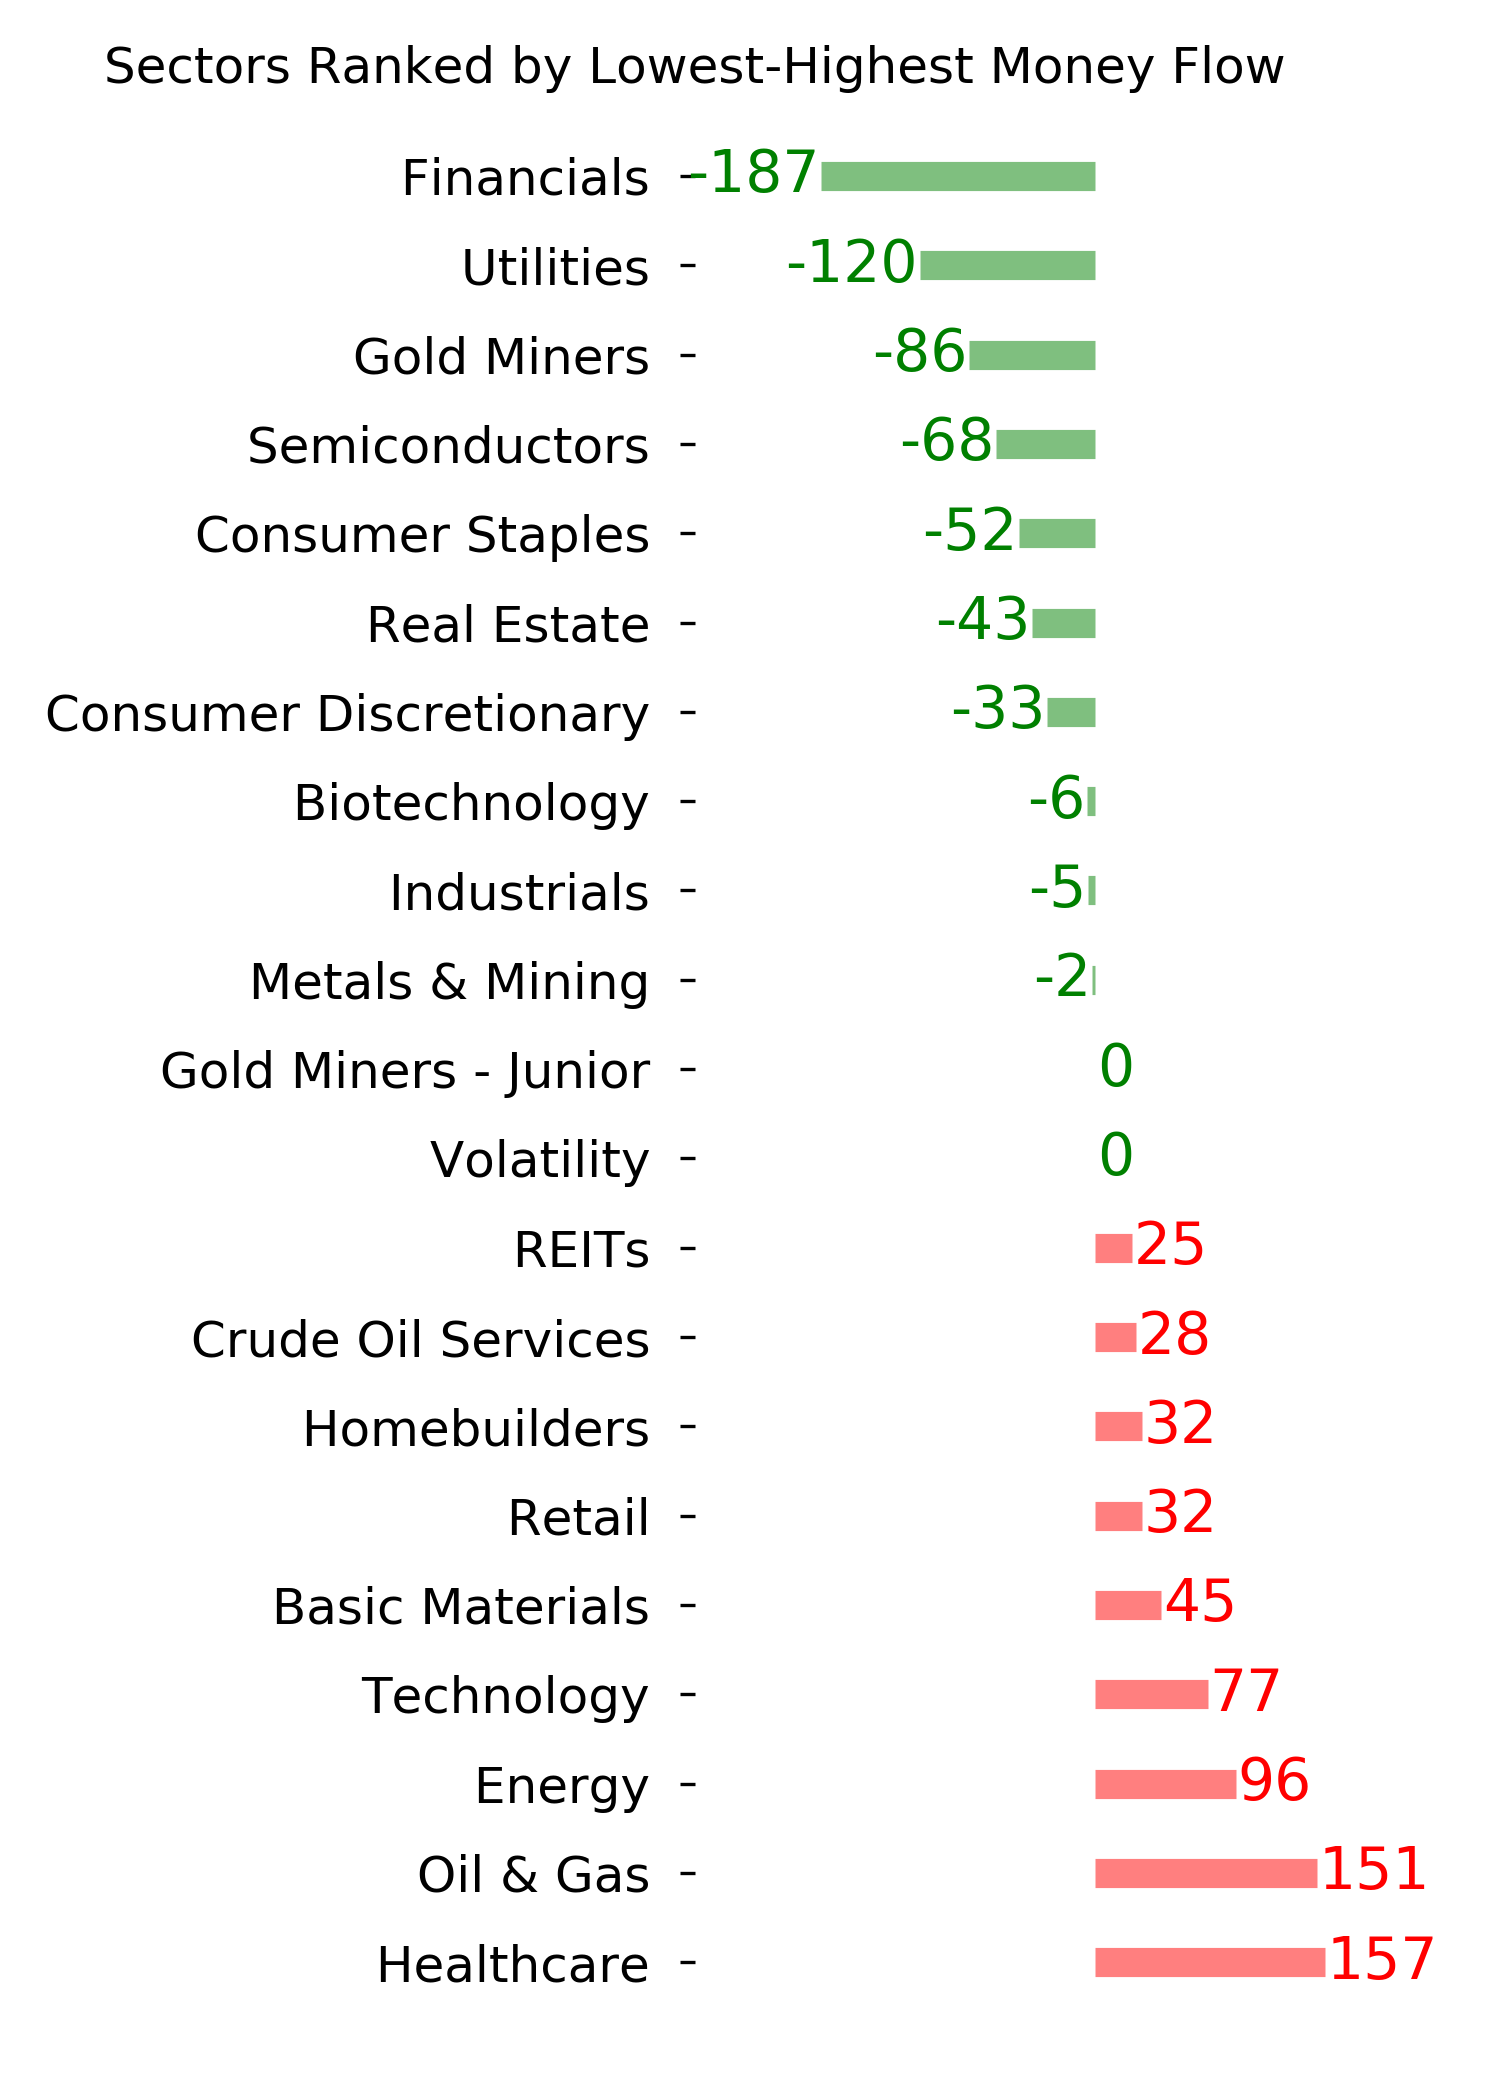
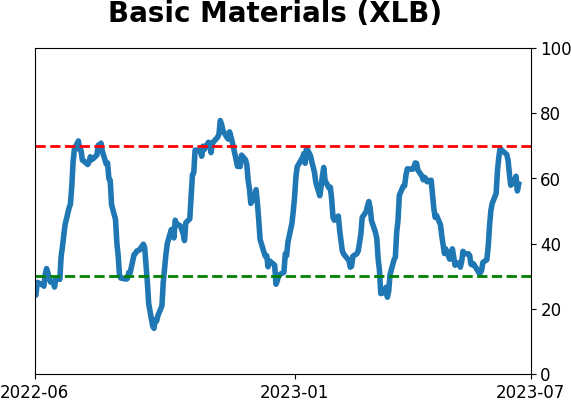
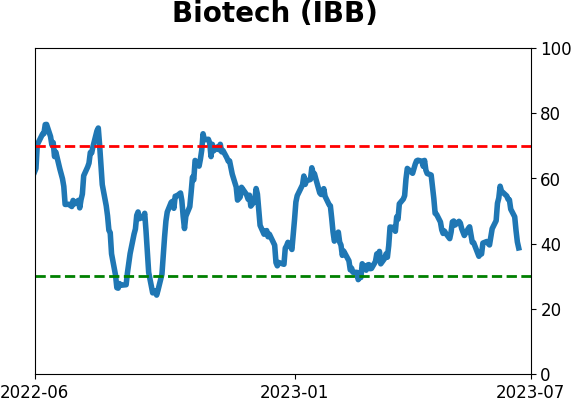
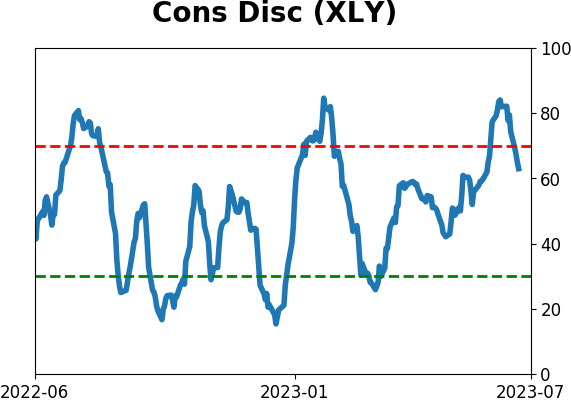
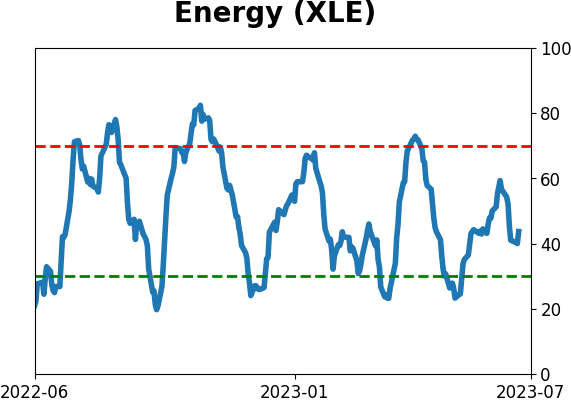
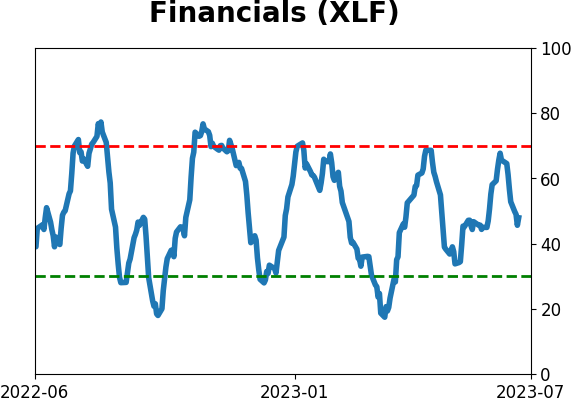
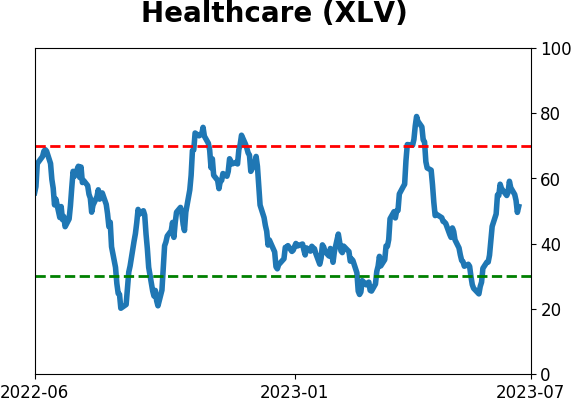
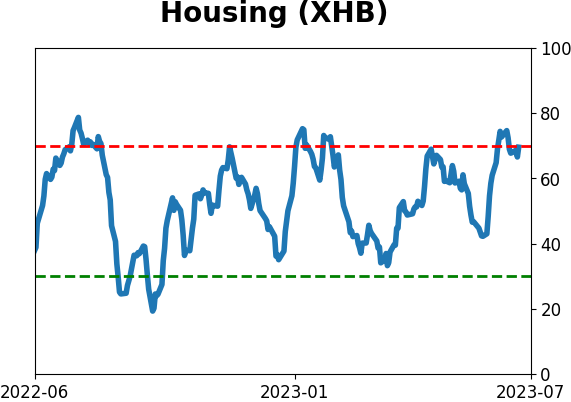
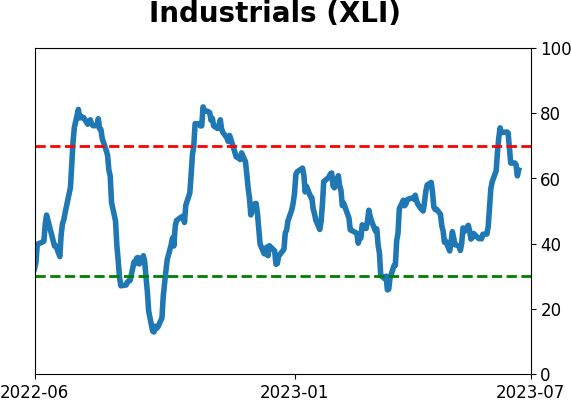
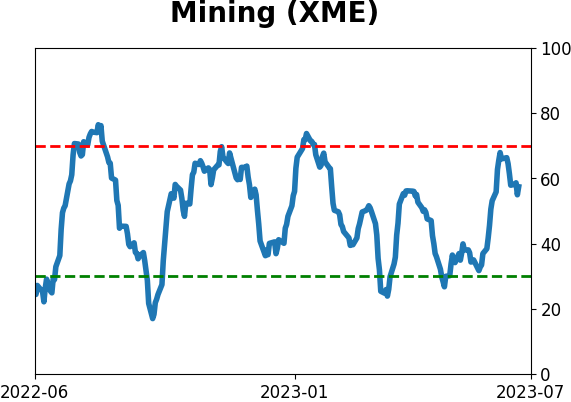
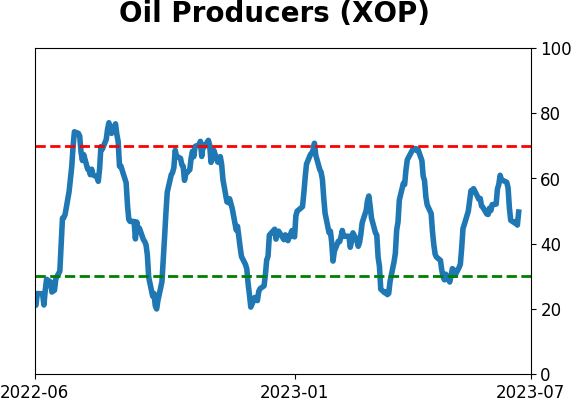
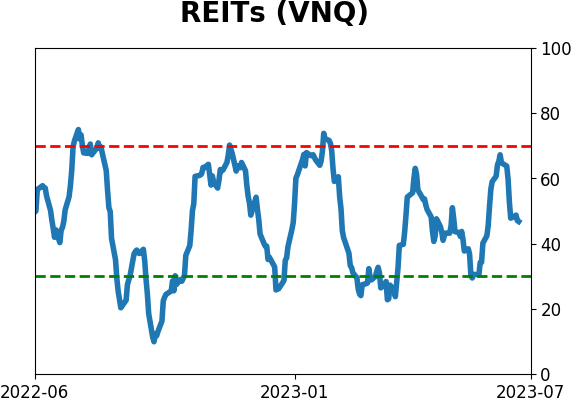
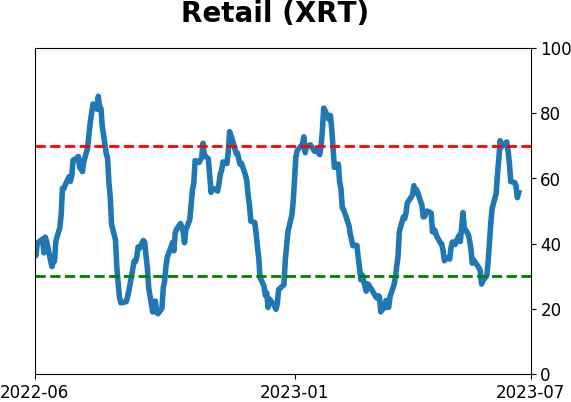
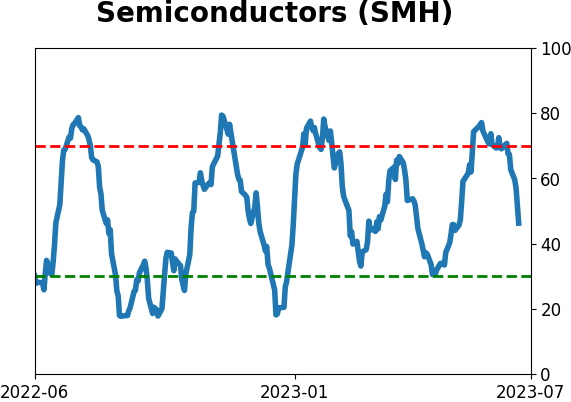
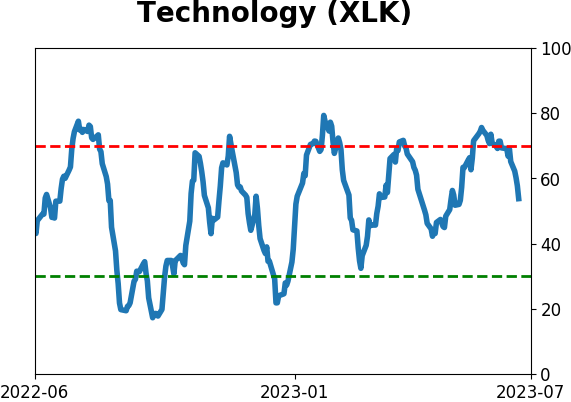
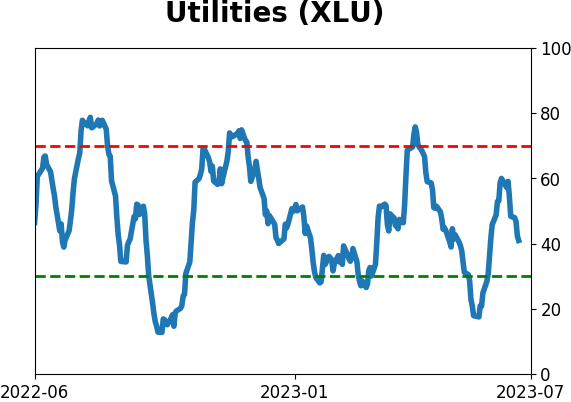
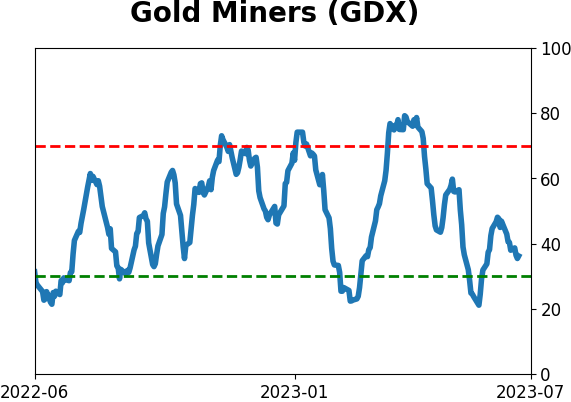
Sector ETF's - 10-Day Moving Average
|
|
|
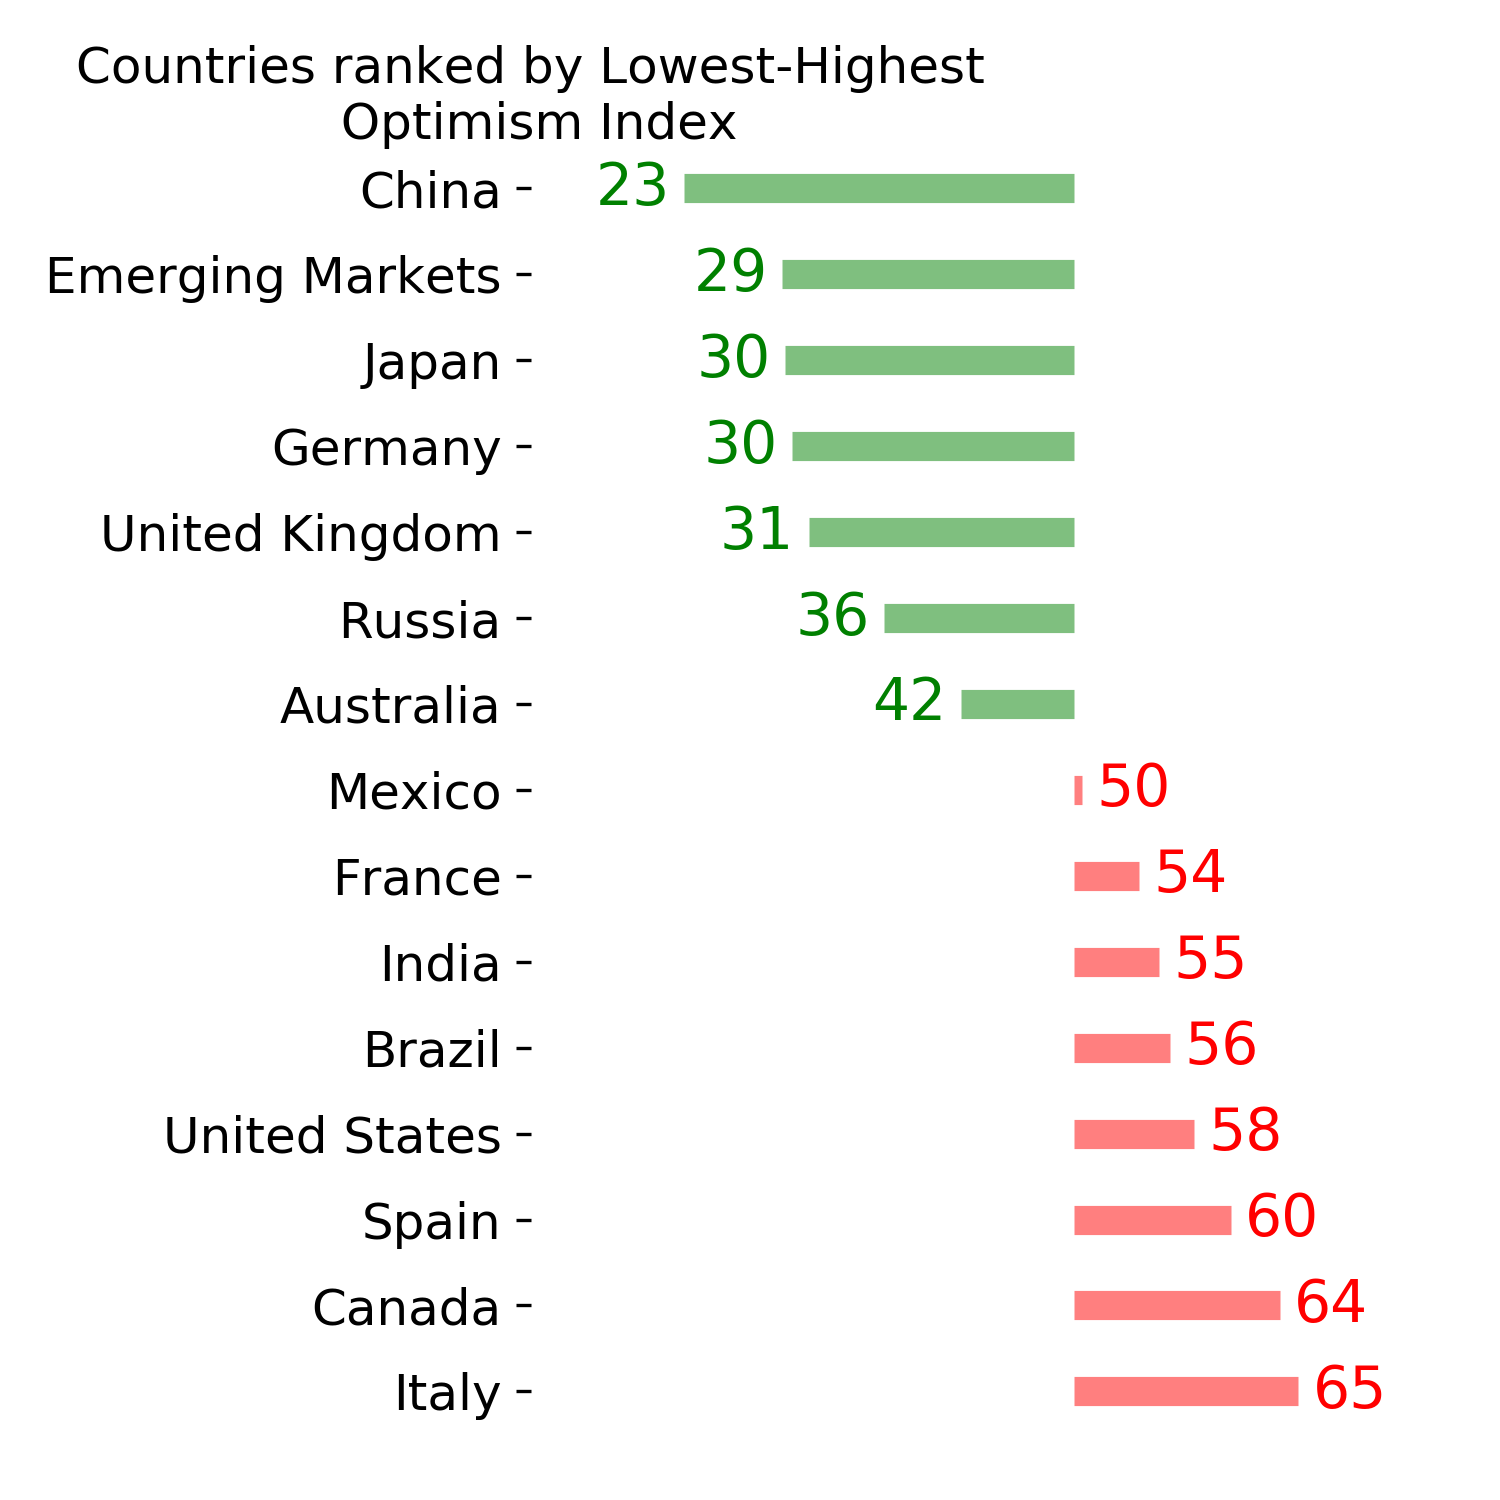
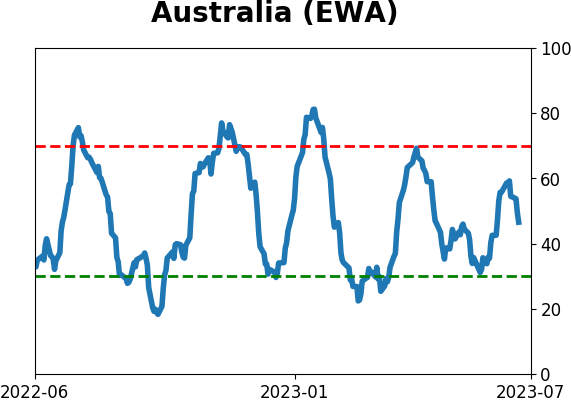
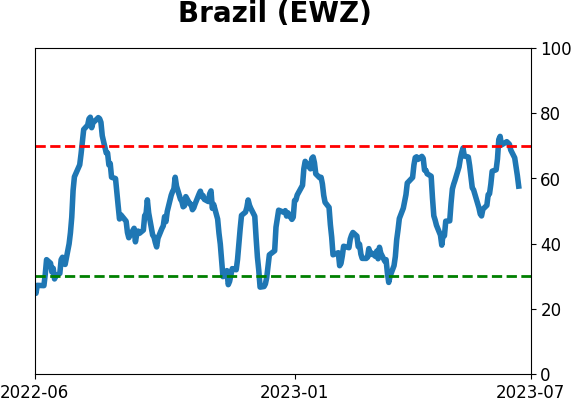
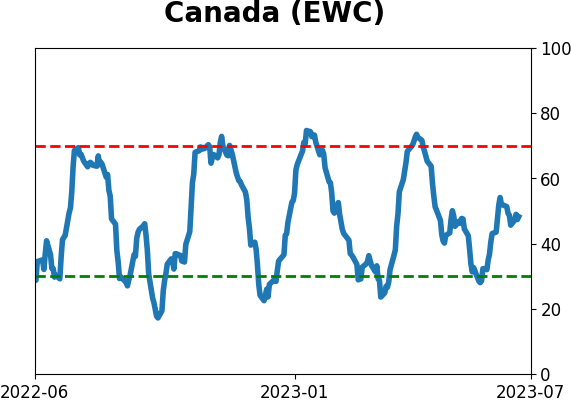
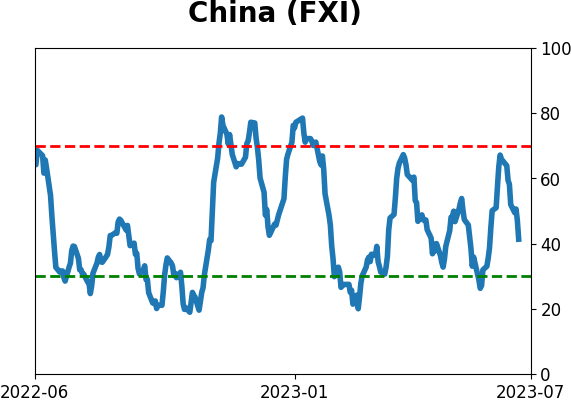
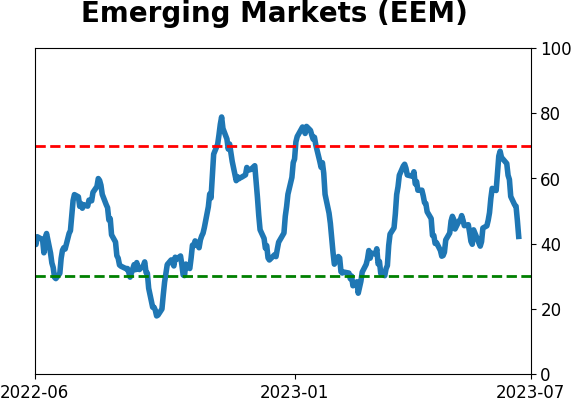
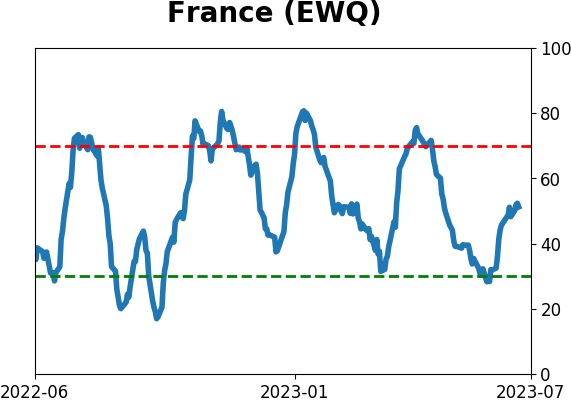
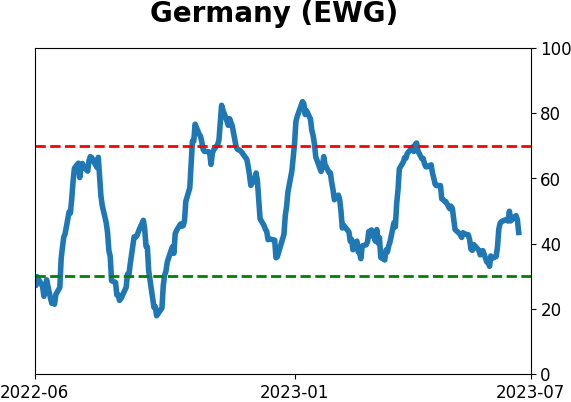
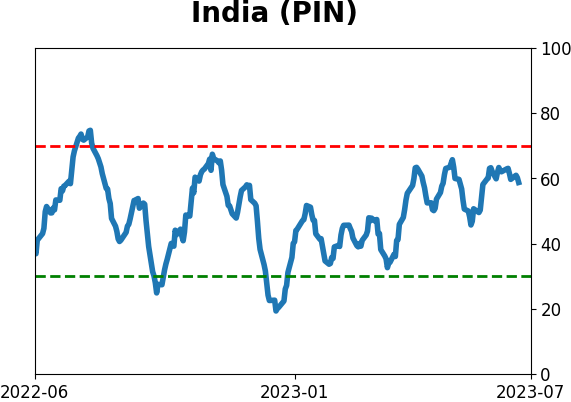
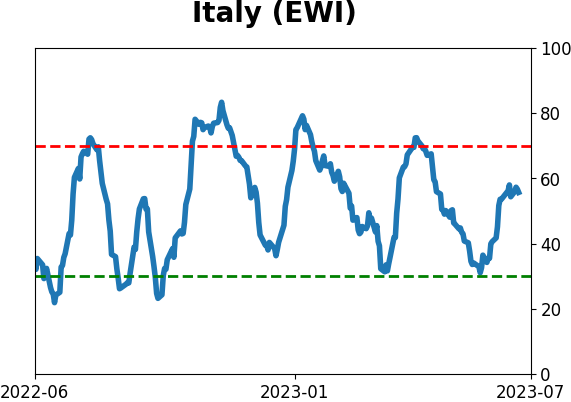
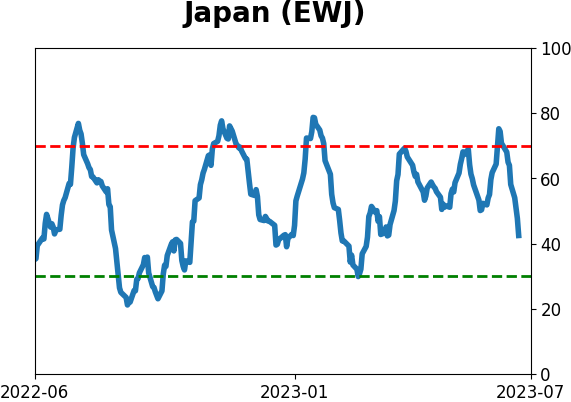
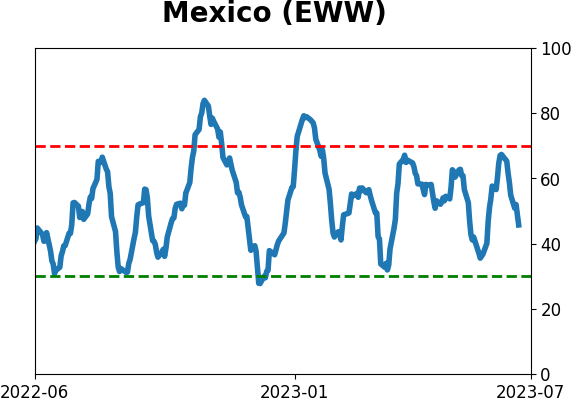
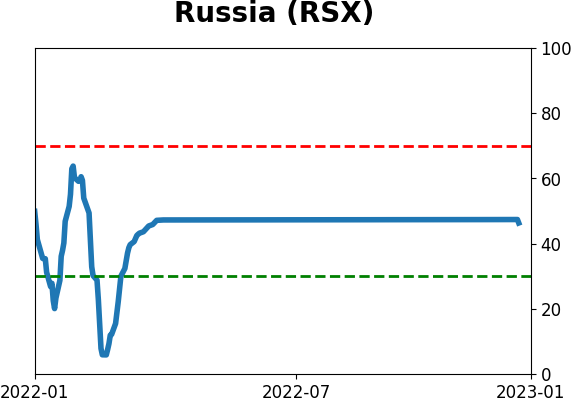
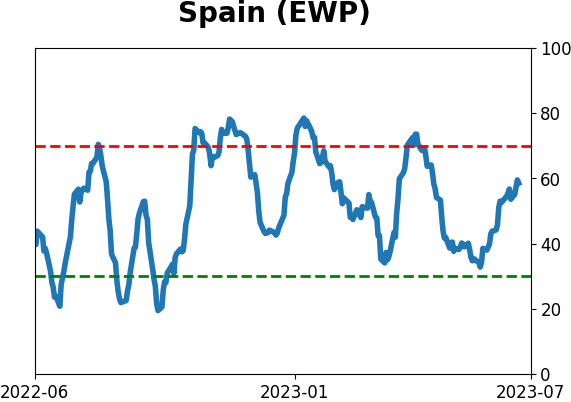
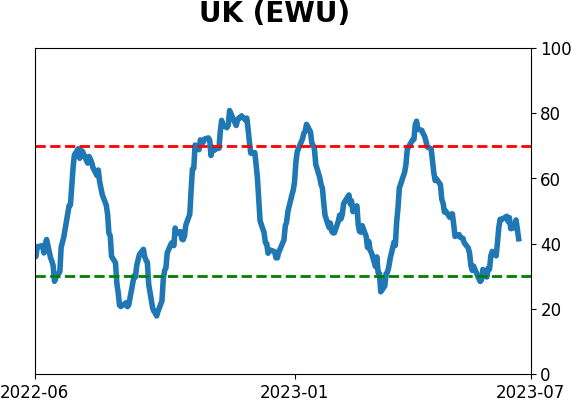
Country ETF's - 10-Day Moving Average
|
|
|
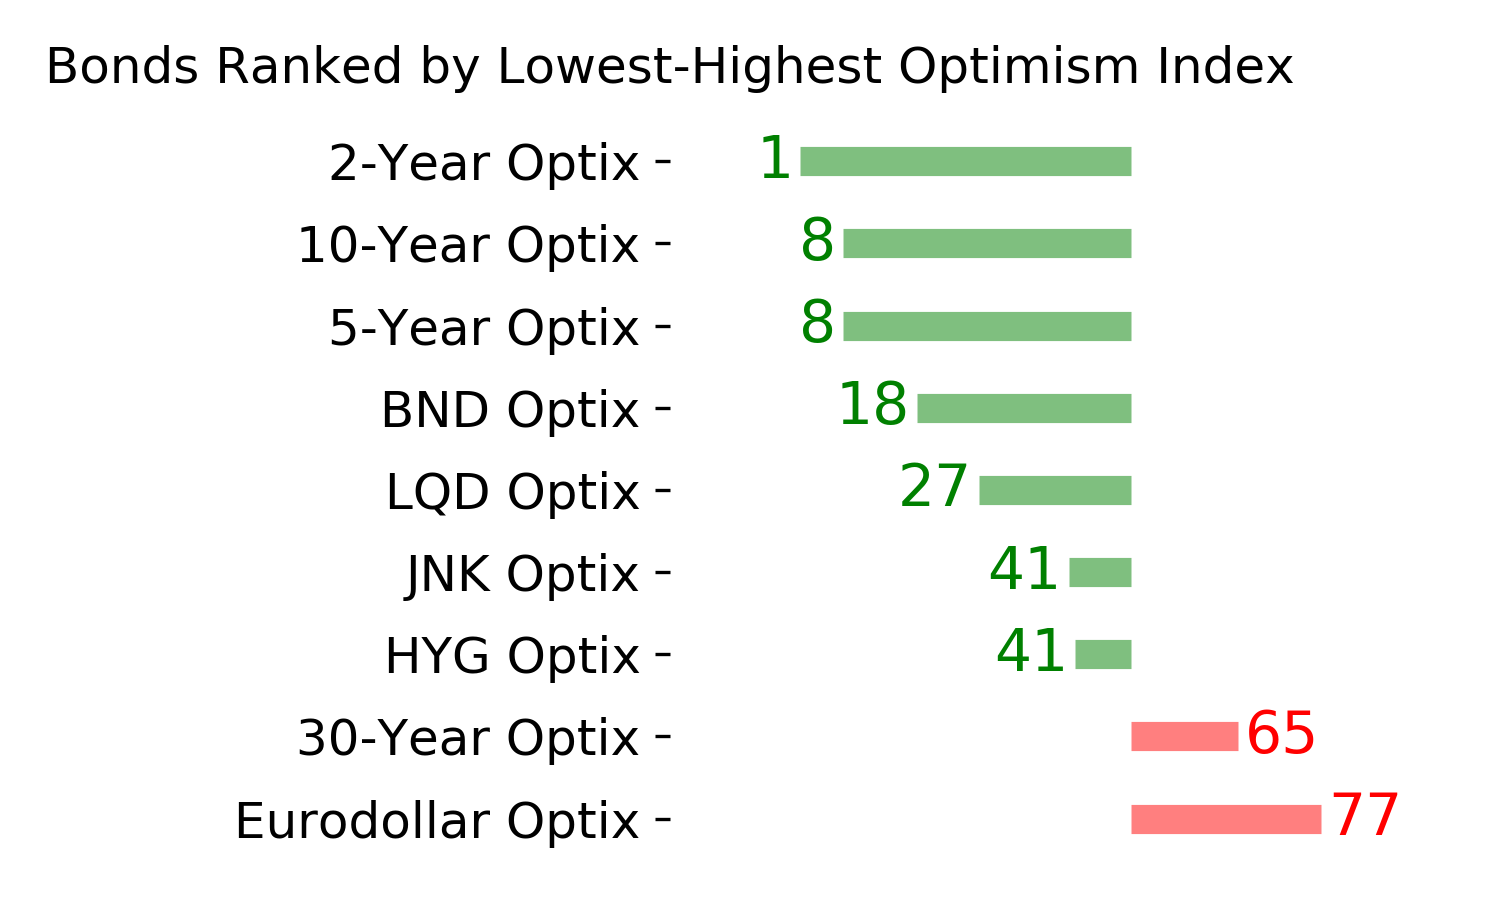
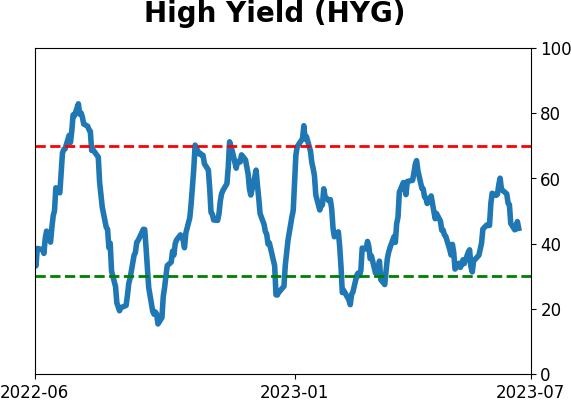
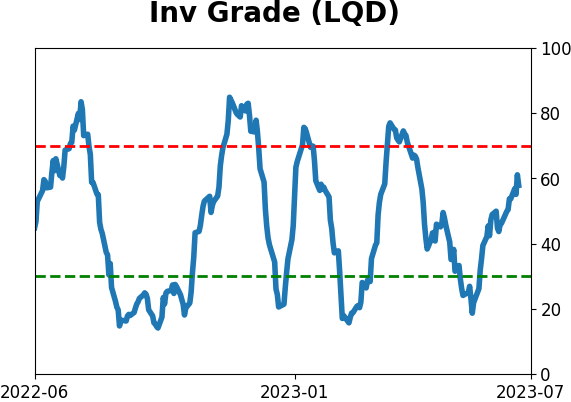
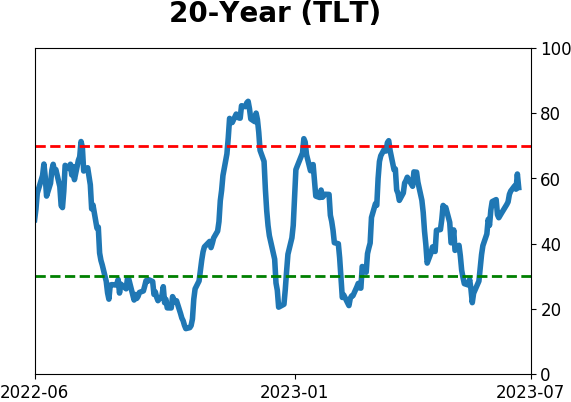
Bond ETF's - 10-Day Moving Average
|
|
|
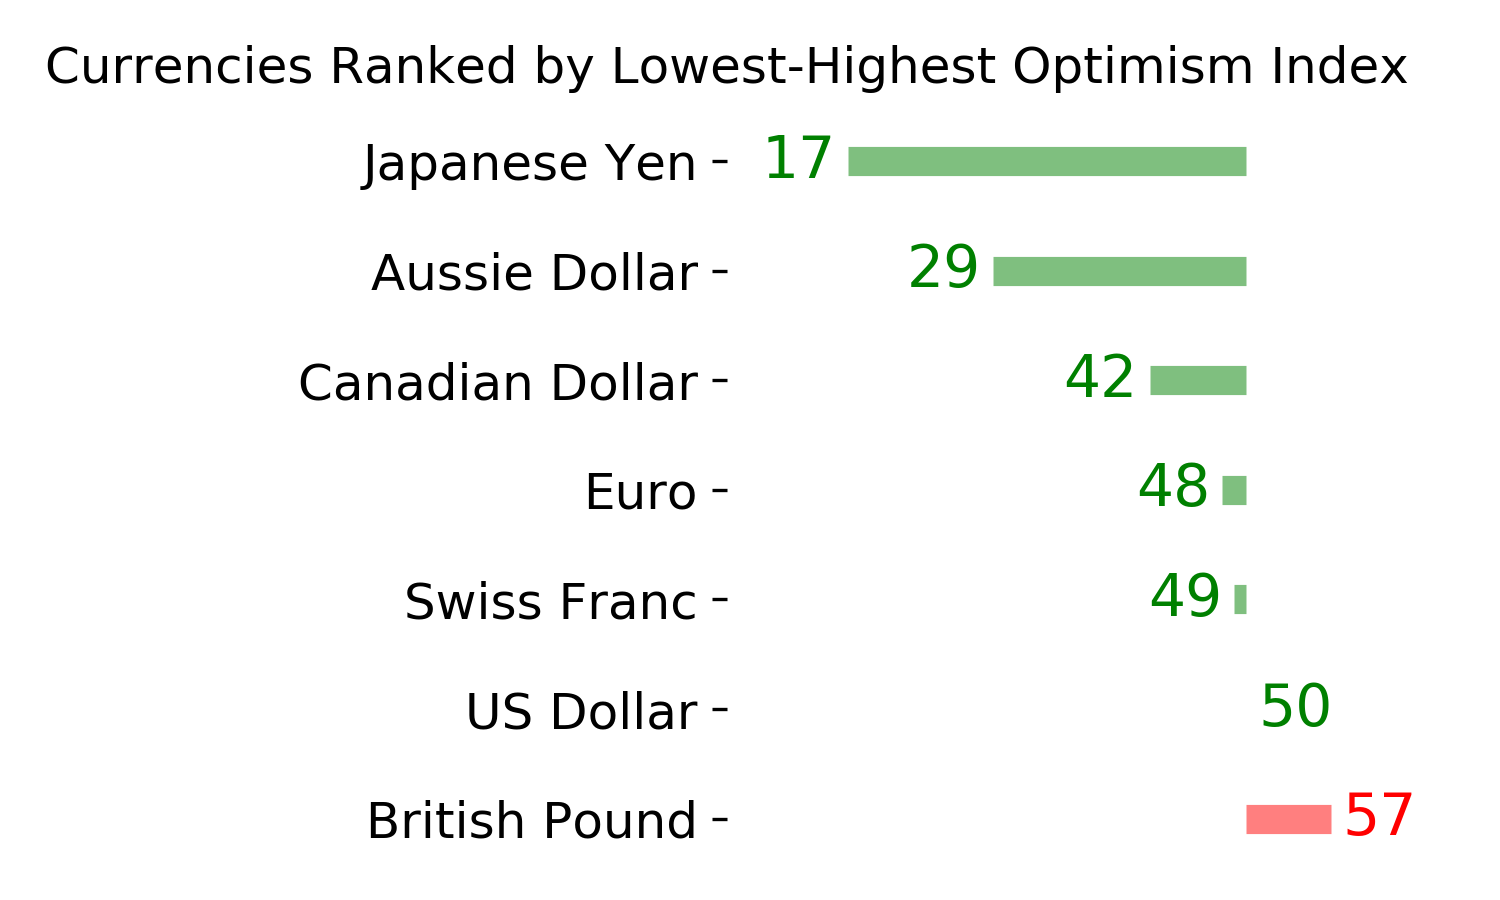
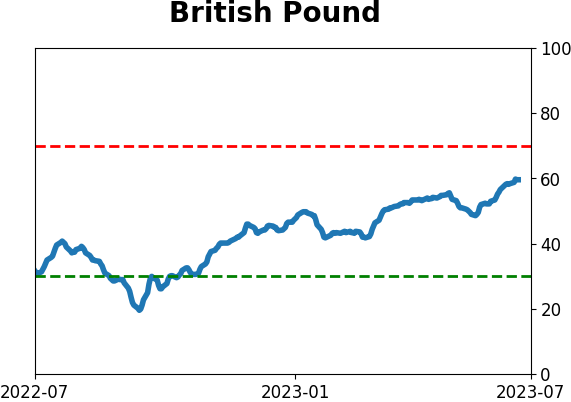
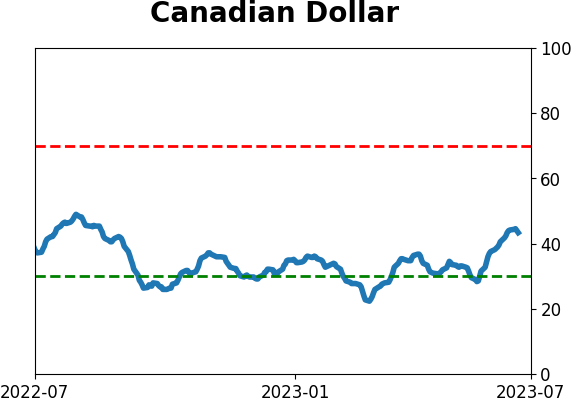
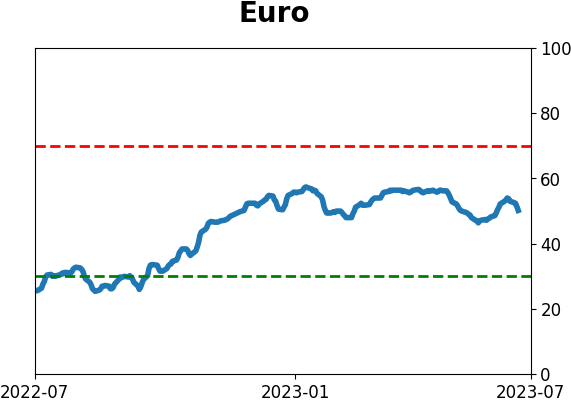
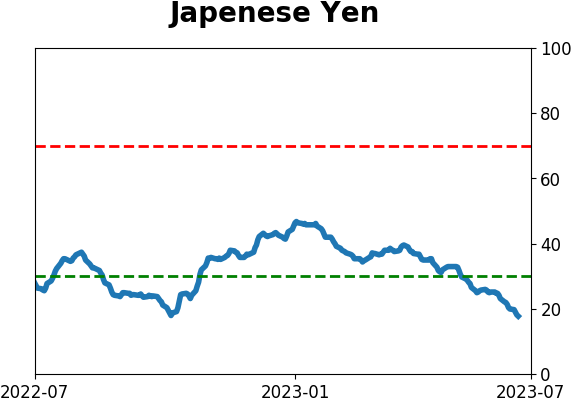
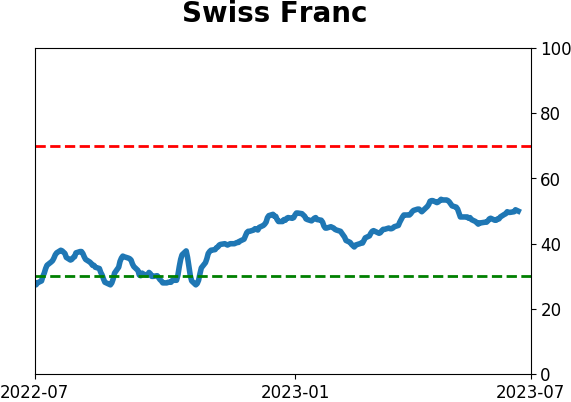
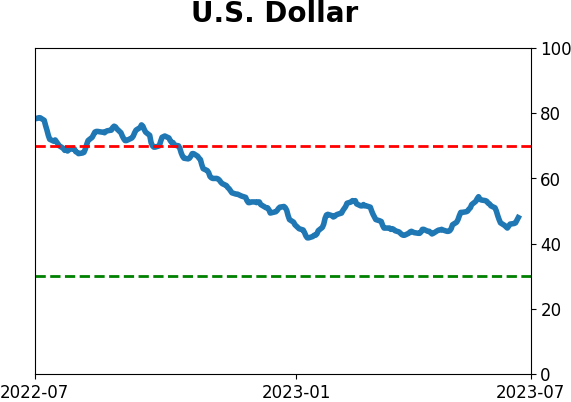
Currency ETF's - 5-Day Moving Average
|
|
|
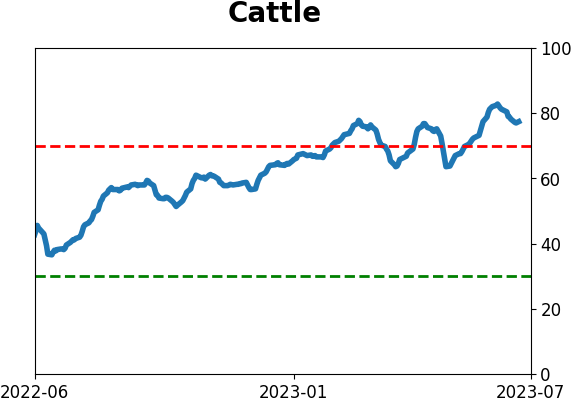
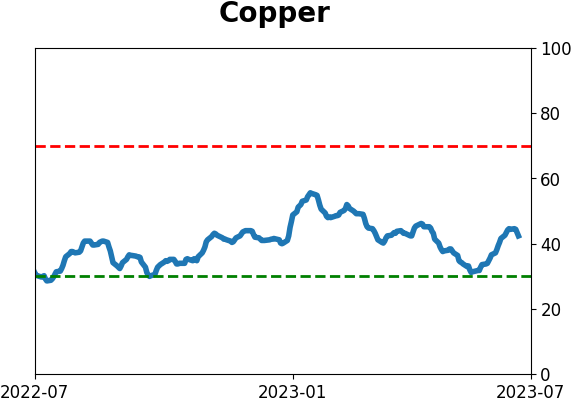
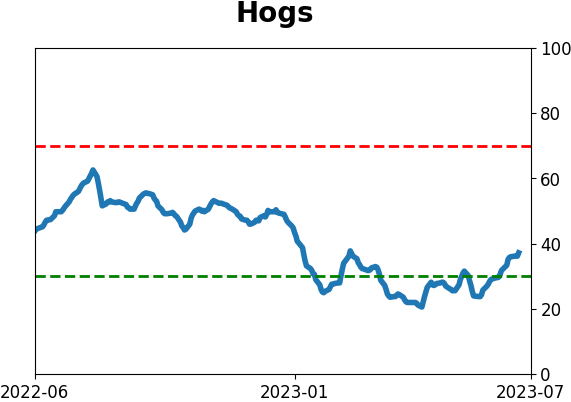
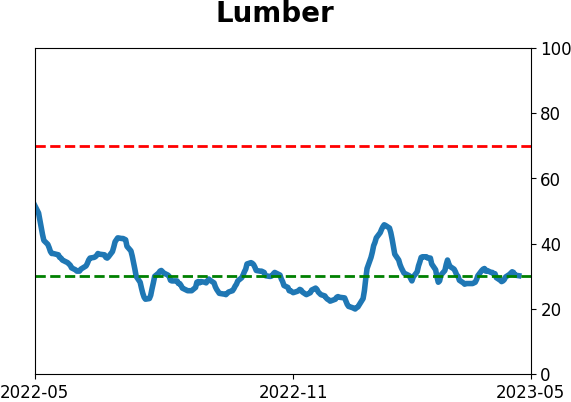
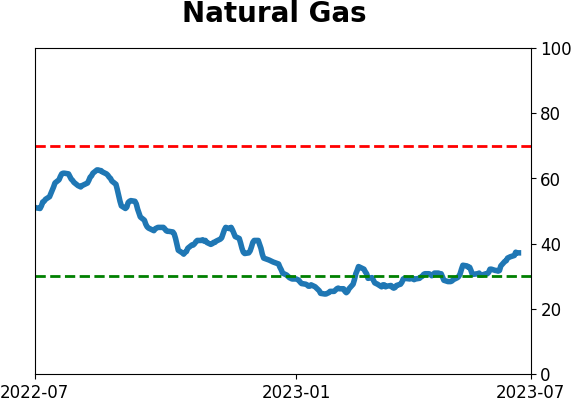
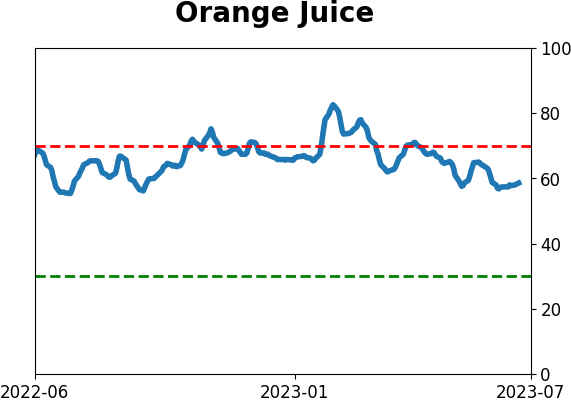
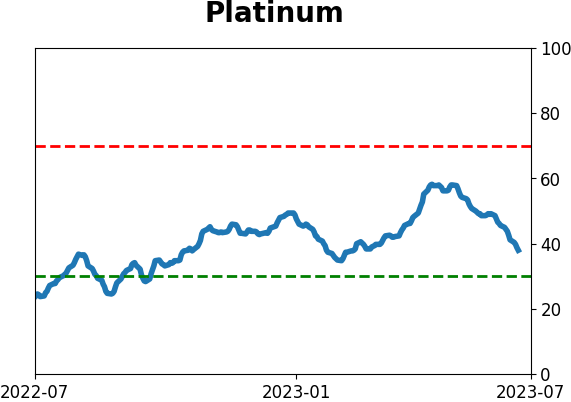
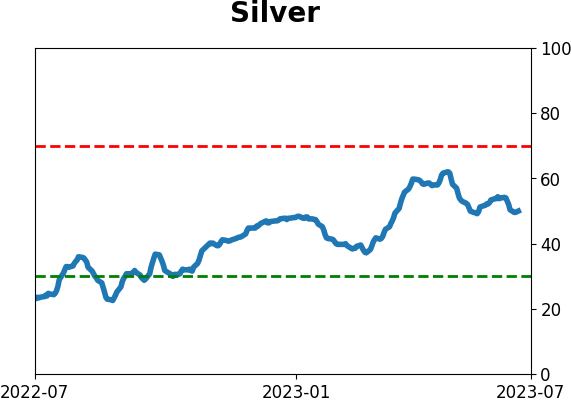
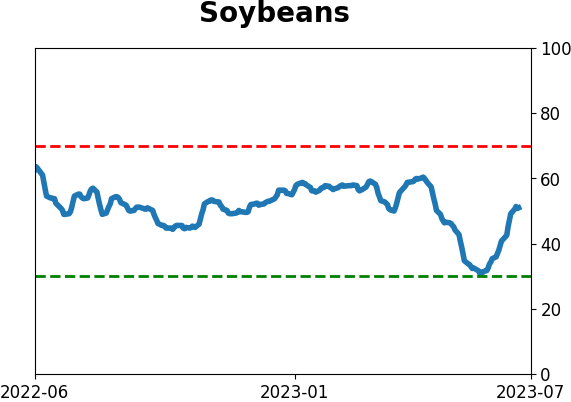
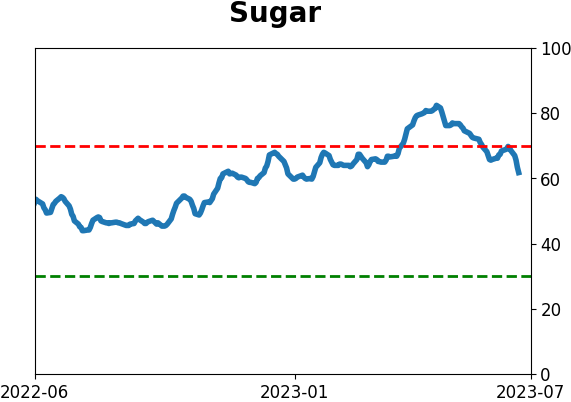
Commodity ETF's - 5-Day Moving Average
|
|