Headlines
|
|
Grains surged as traders were heavily off sides:
During the large decline for most asset prices in 2022, speculators built up large short positions in some grain contracts, especially wheat. They are only starting to reverse those now, as the Bloomberg Grains Index rallied more than 15% in only two weeks. Similar rallies tended to soon stall out, so bulls have to rely on offsided positioning for further gains.
|
Smart / Dumb Money Confidence
|
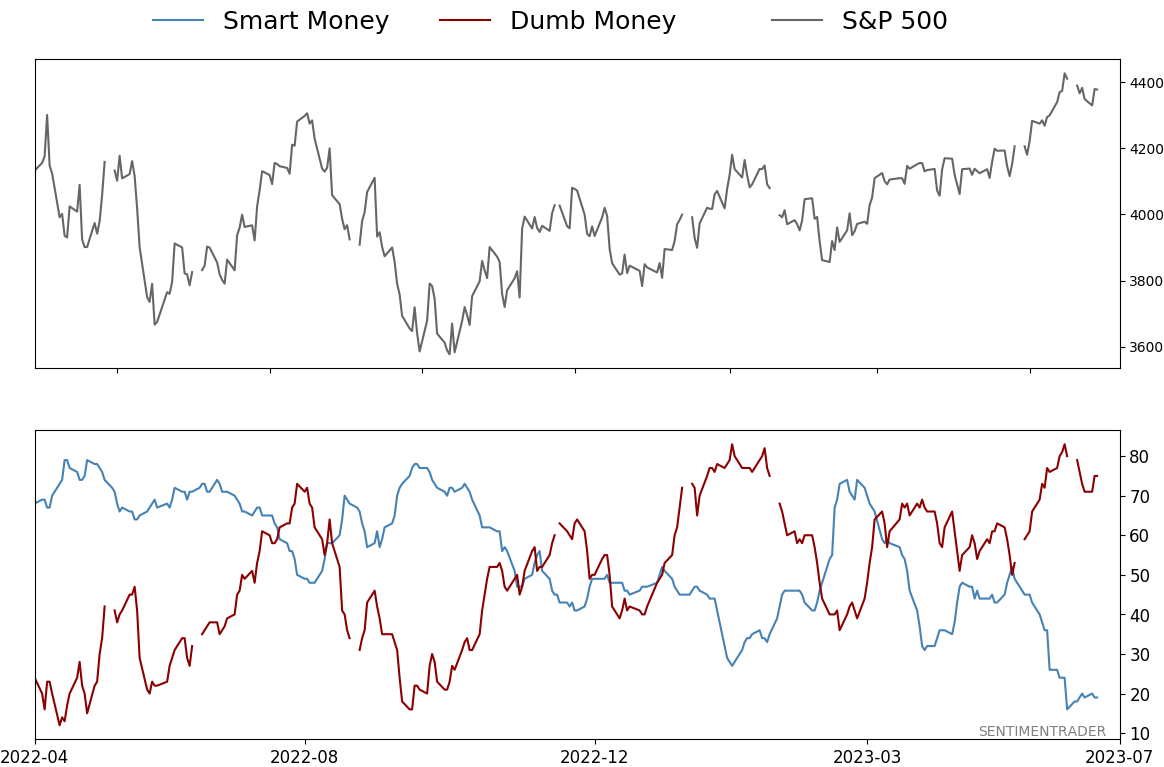
Smart Money Confidence: 19%
Dumb Money Confidence: 75%
|
|
Risk Levels
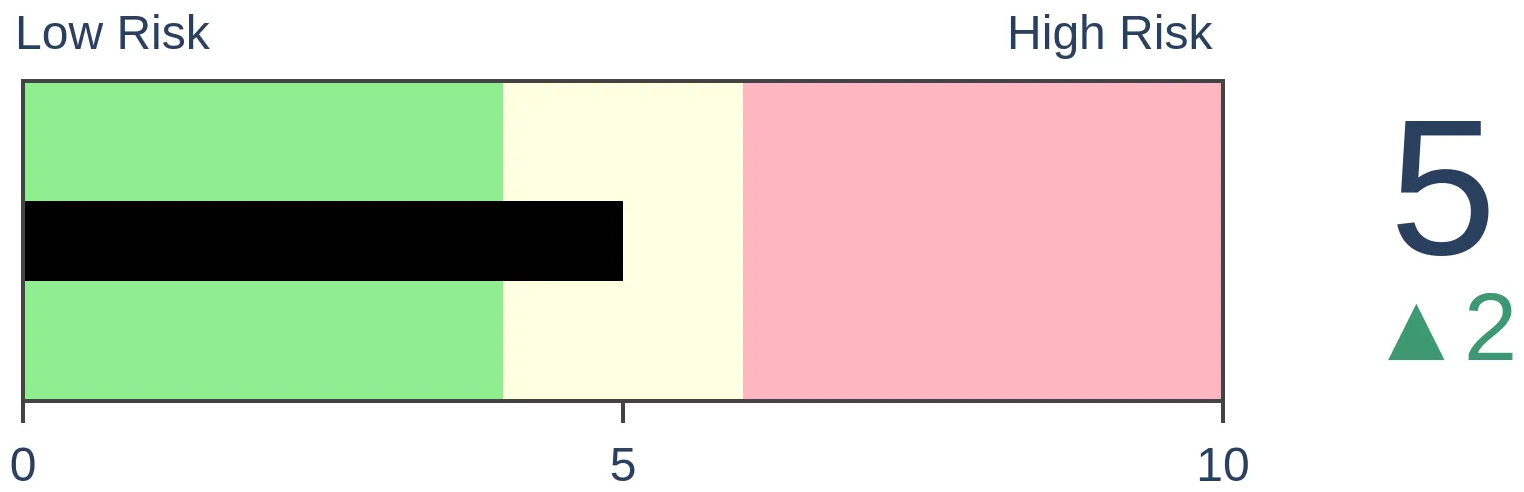
Stocks Short-Term
|
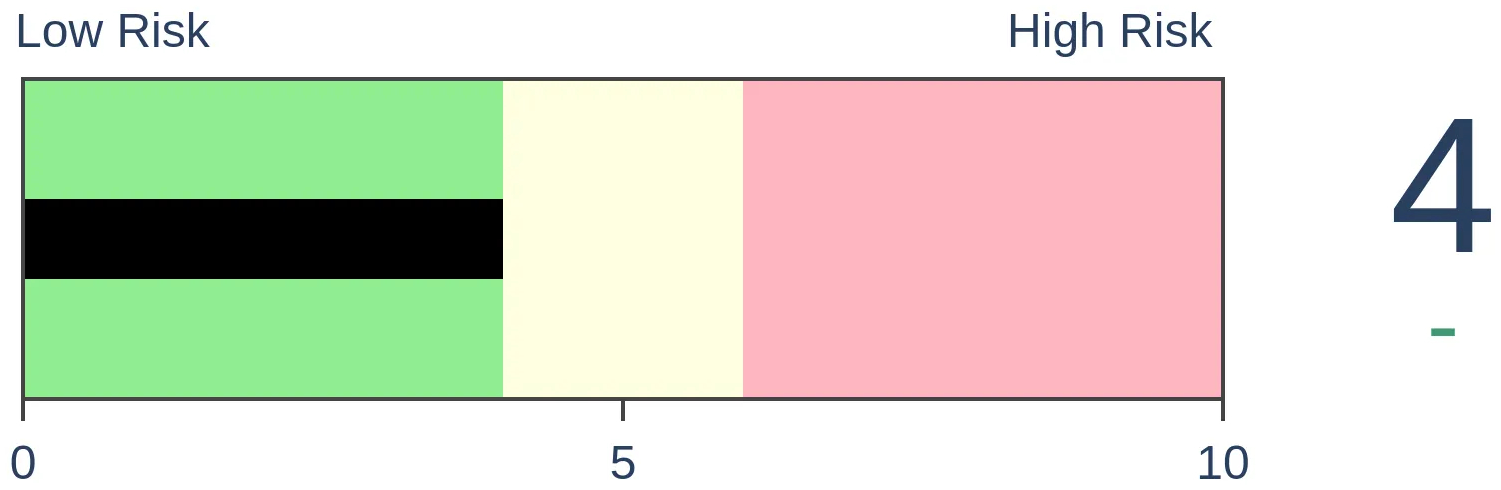
Stocks Medium-Term
|
|
Bonds
|
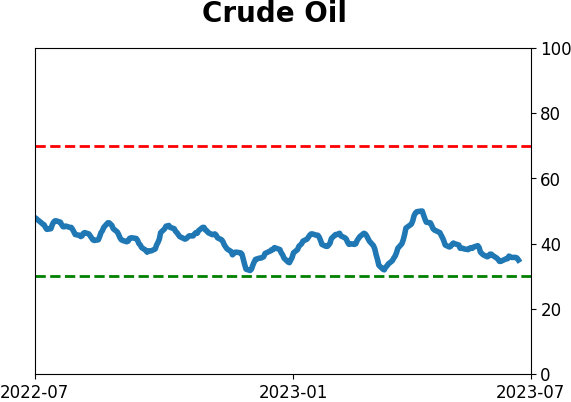
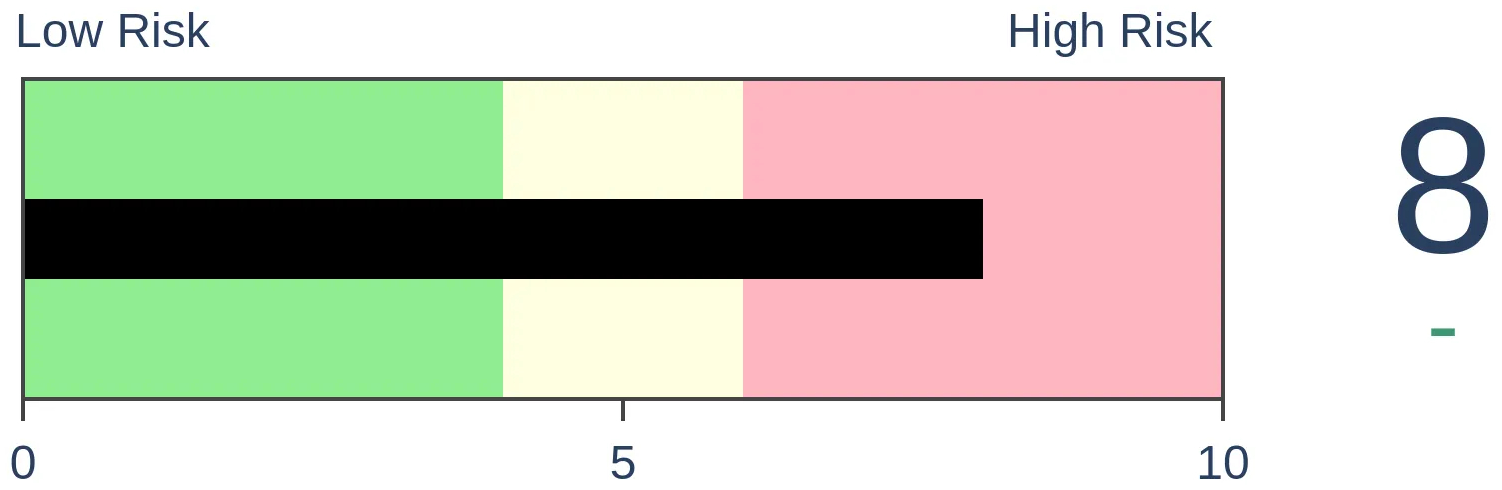
Crude Oil
|
|
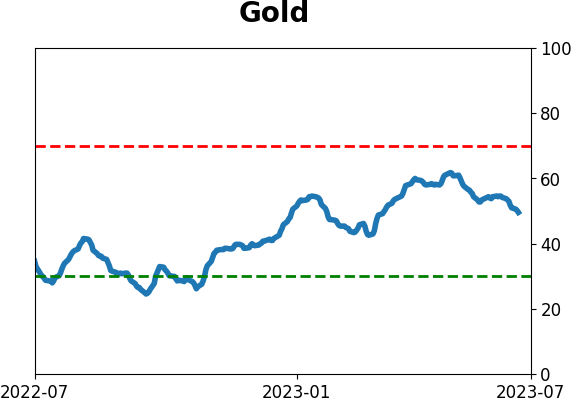
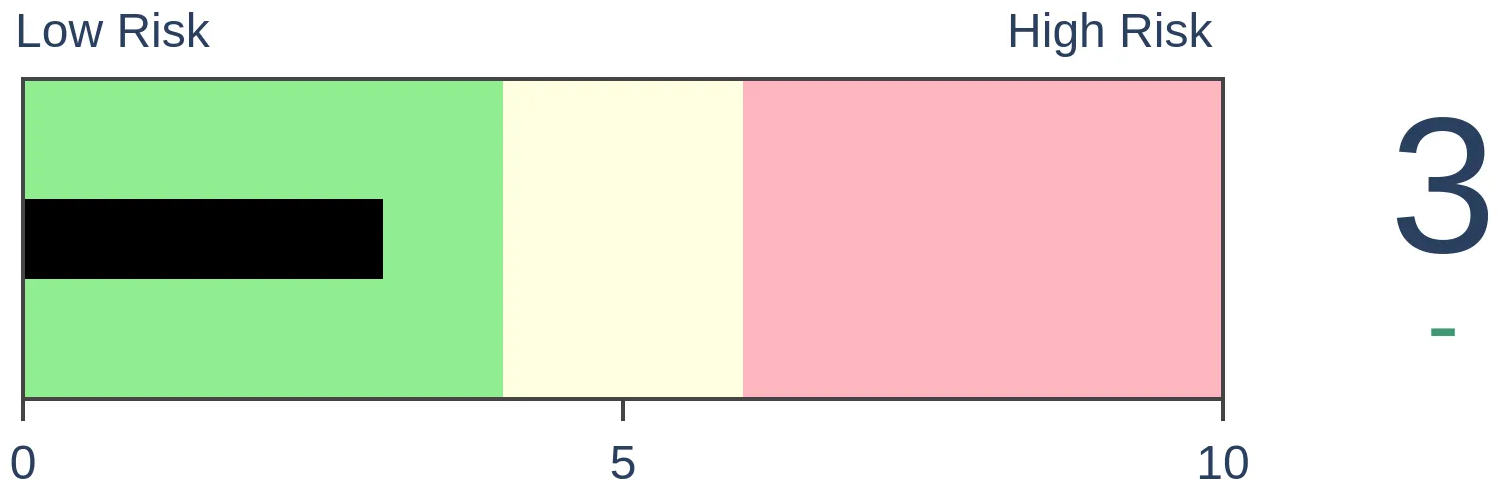
Gold
|
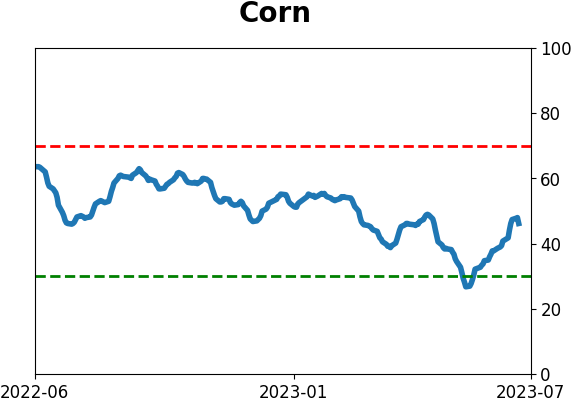
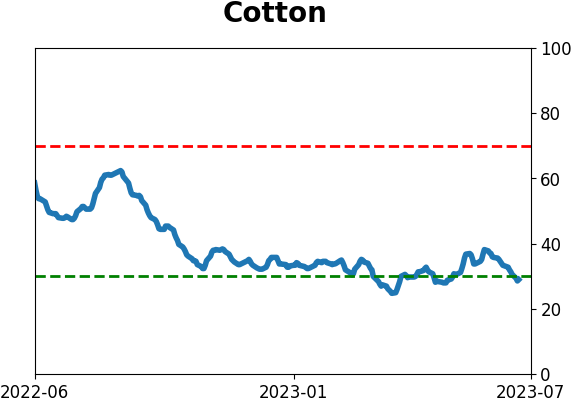
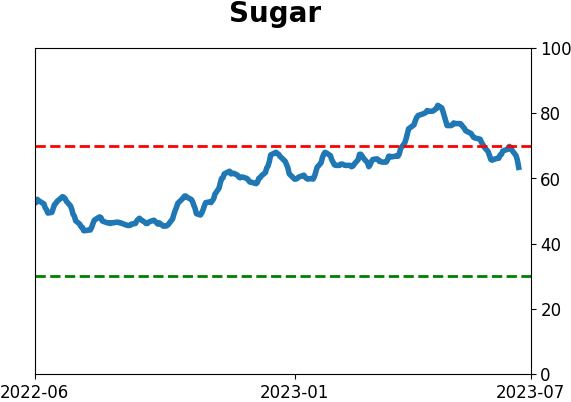
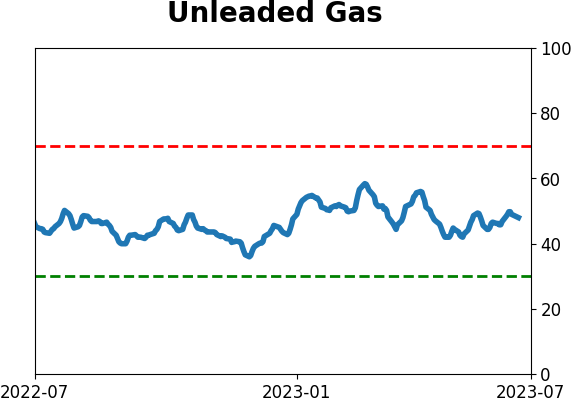
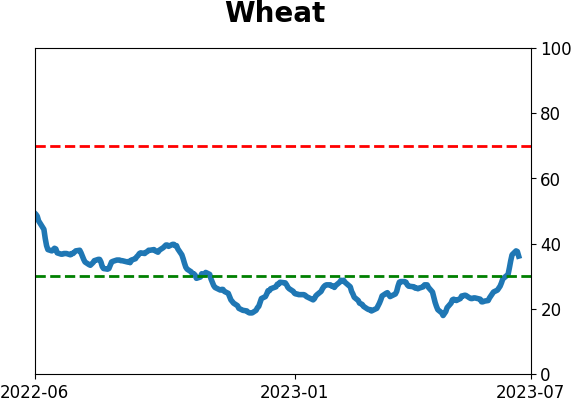
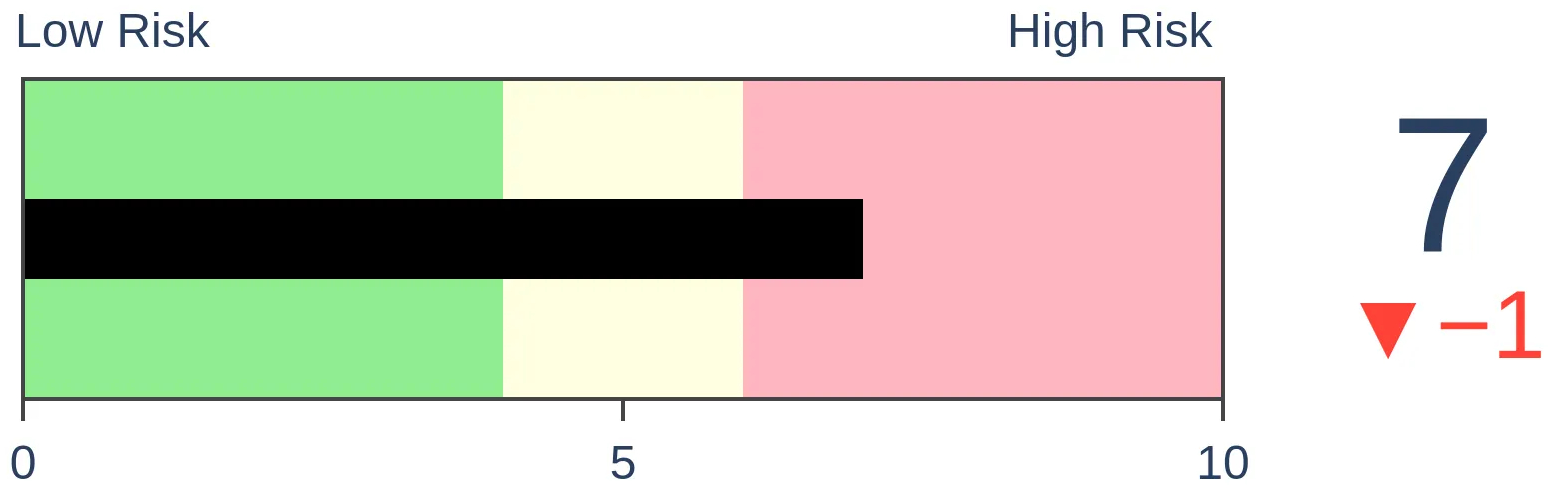
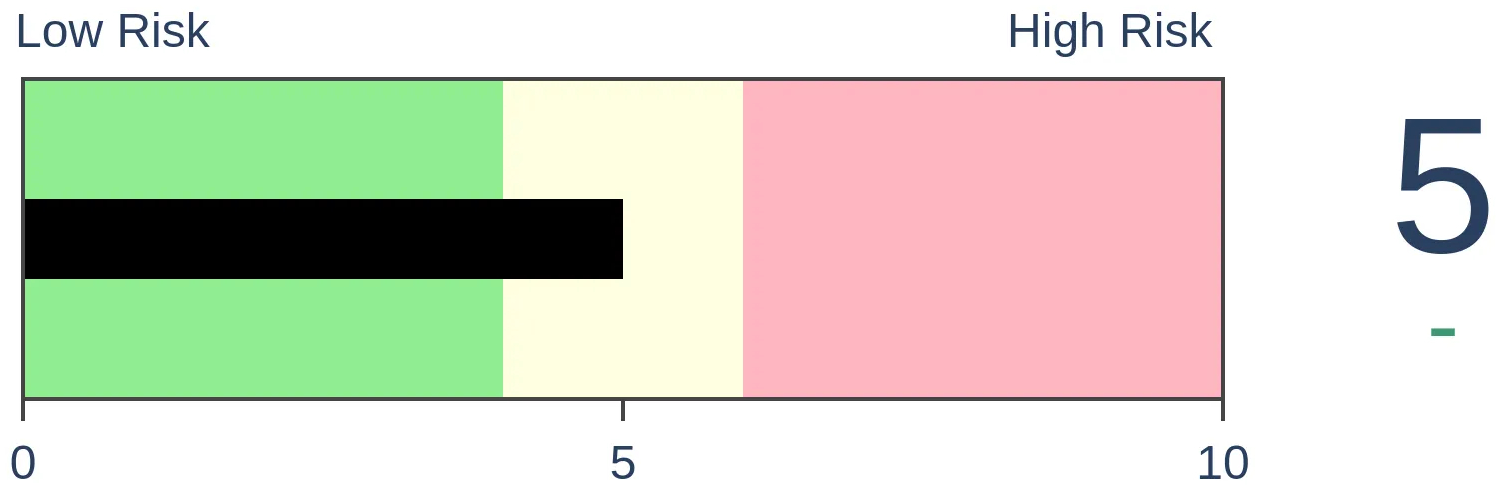
Agriculture
|
|
Research
By Jason Goepfert
BOTTOM LINE
During the large decline for most asset prices in 2022, speculators built up large short positions in some grain contracts, especially wheat. They are only starting to reverse those now, as the Bloomberg Grains Index rallied more than 15% in only two weeks. Similar rallies tended to soon stall out, so bulls have to rely on offsided positioning for further gains.
FORECAST / TIMEFRAME
None
|
Key points:
- Over a two-week stretch, grain prices rallied more than 15%
- That's one of the best rallies in 60 years, after which grains typically stumbled
- The biggest hope for grain bulls now is a reversal of significant short positions by speculators
A good couple of weeks for grains
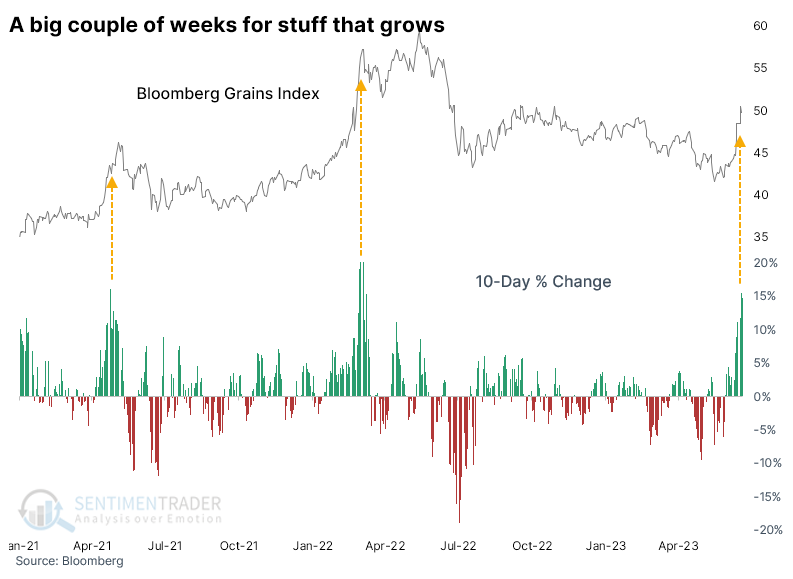
It was a tremendous couple of weeks for stuff that farmers grow. According to news reports, droughts across the Midwest recently triggered concerns about crops, and prices surged-supply and demand in action.
Even though prices for several contracts pulled back in recent sessions, the Bloomberg Grains Index jumped more than 15% over two weeks. The last two times we witnessed this kind of panic, traders' enthusiasm didn't last much longer. The parabolic rallies soon petered out and erased all the gains in the months ahead.
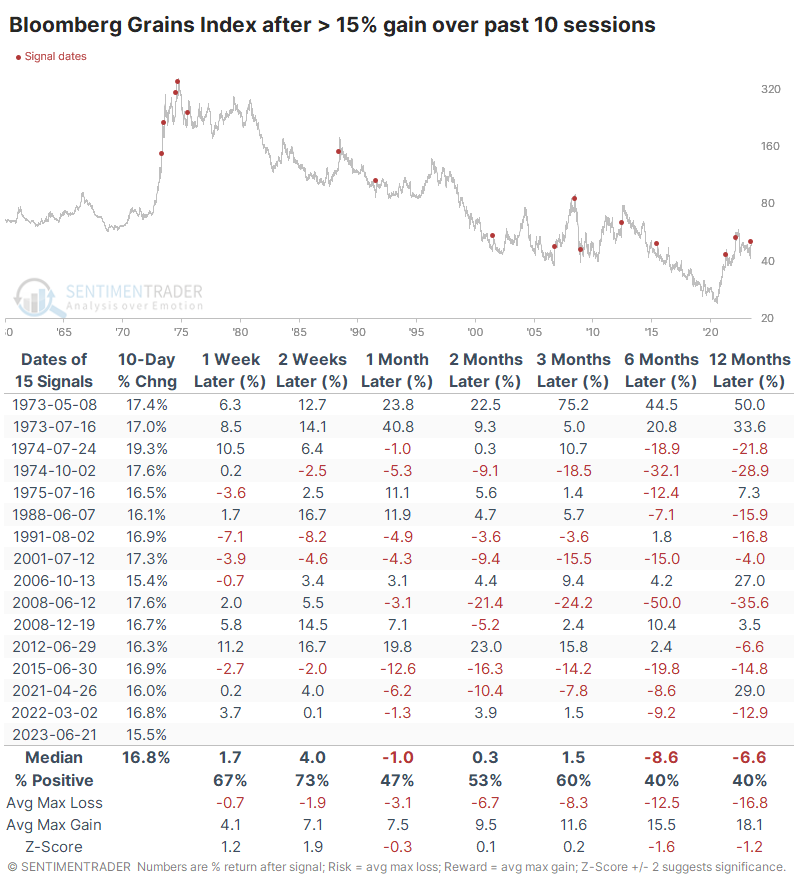
The recent performance after such parabolic moves were fairly representative of the more extended history. The table below shows how the Grains index performed after any 15% two-week gain. The probability of a further gain alternated above and below 50% until six months later, when only 40% of instances showed a positive return and with a poor risk/reward ratio.
Other than two signals in the leadup to the 1973 blow-off top, only one instance sported a double-digit gain six months later, while there were six double-digit losses.
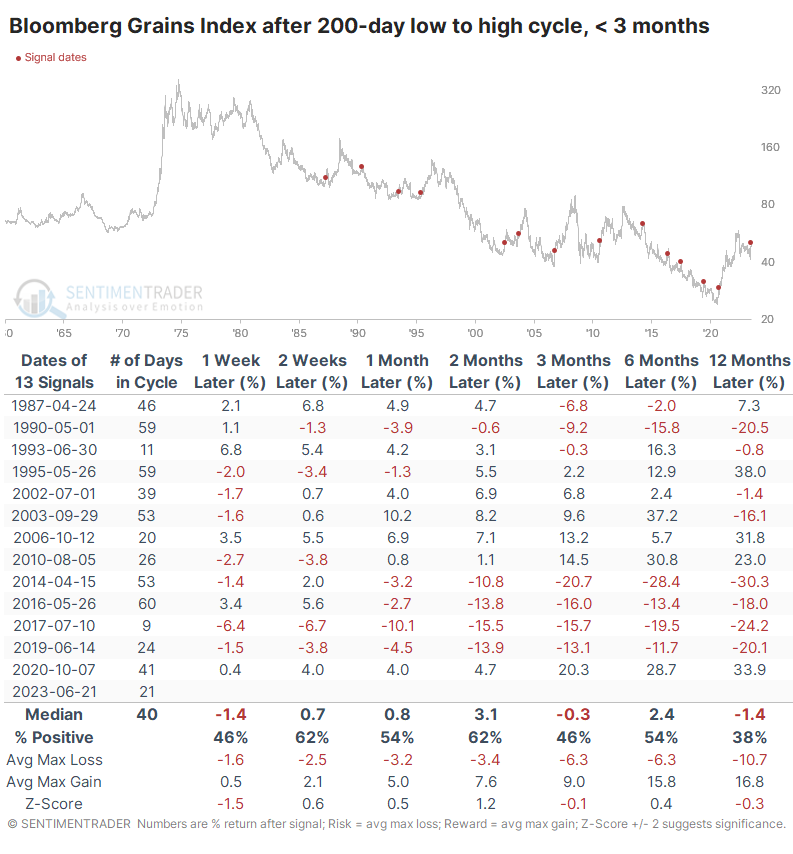
We like to look at behavior after extreme cycles, like pessimism to optimism or 52-week lows to highs. Often, these will capture behavior like FOMO (Fear Of Missing Out), particularly in the stock market.
That didn't seem much of a factor when it comes to grains. When the Grains index cycled from a 200-day low to a 200-day high in fewer than three months, its medium- to long-term returns were still mediocre to poor. It did capture some sustained gains several times but look at all those false dawns in the 2010s.
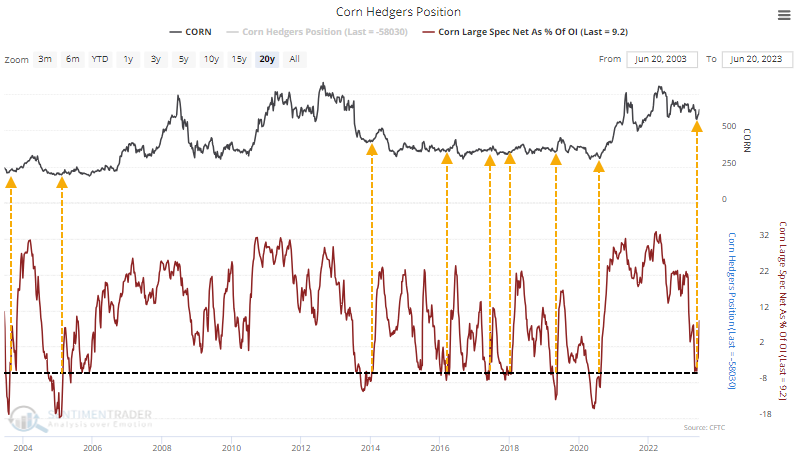
One thing going for grain bulls is positioning. During the steep decline last year, speculators built up massive short positions in several contracts, and they've only recently begun to reverse those.
Large speculators recently held more than 5% of open interest net short in corn futures. That doesn't sound like much, but historically it has occurred near troughs.
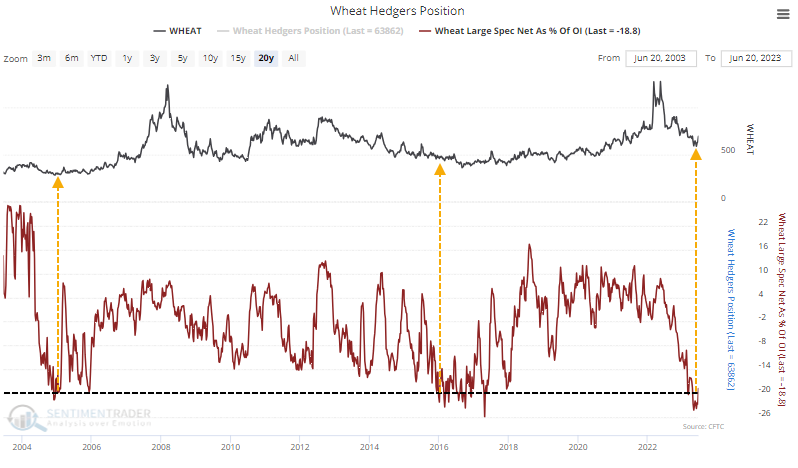
Speculators pressed their bets even further in wheat futures, holding more than 20% of open interest net short. There were only two distinct times in the past 20 years when they were so heavily short that market and both preceded multi-year runs.
What the research tells us...
Just like the stock, bond, crypto, and other markets, there isn't necessarily a one-size-fits-all outlook in agricultural commodities. Assets within broad classes generally tend to move within the same long-term trends but can diverge wildly. Grain prices spiked in recent weeks, and historically, that type of pace has not been sustained, even when triggering the first notable new high after a low. The biggest hope for bulls is still-offside positioning in some major contracts, particularly wheat.
Indicators at Extremes
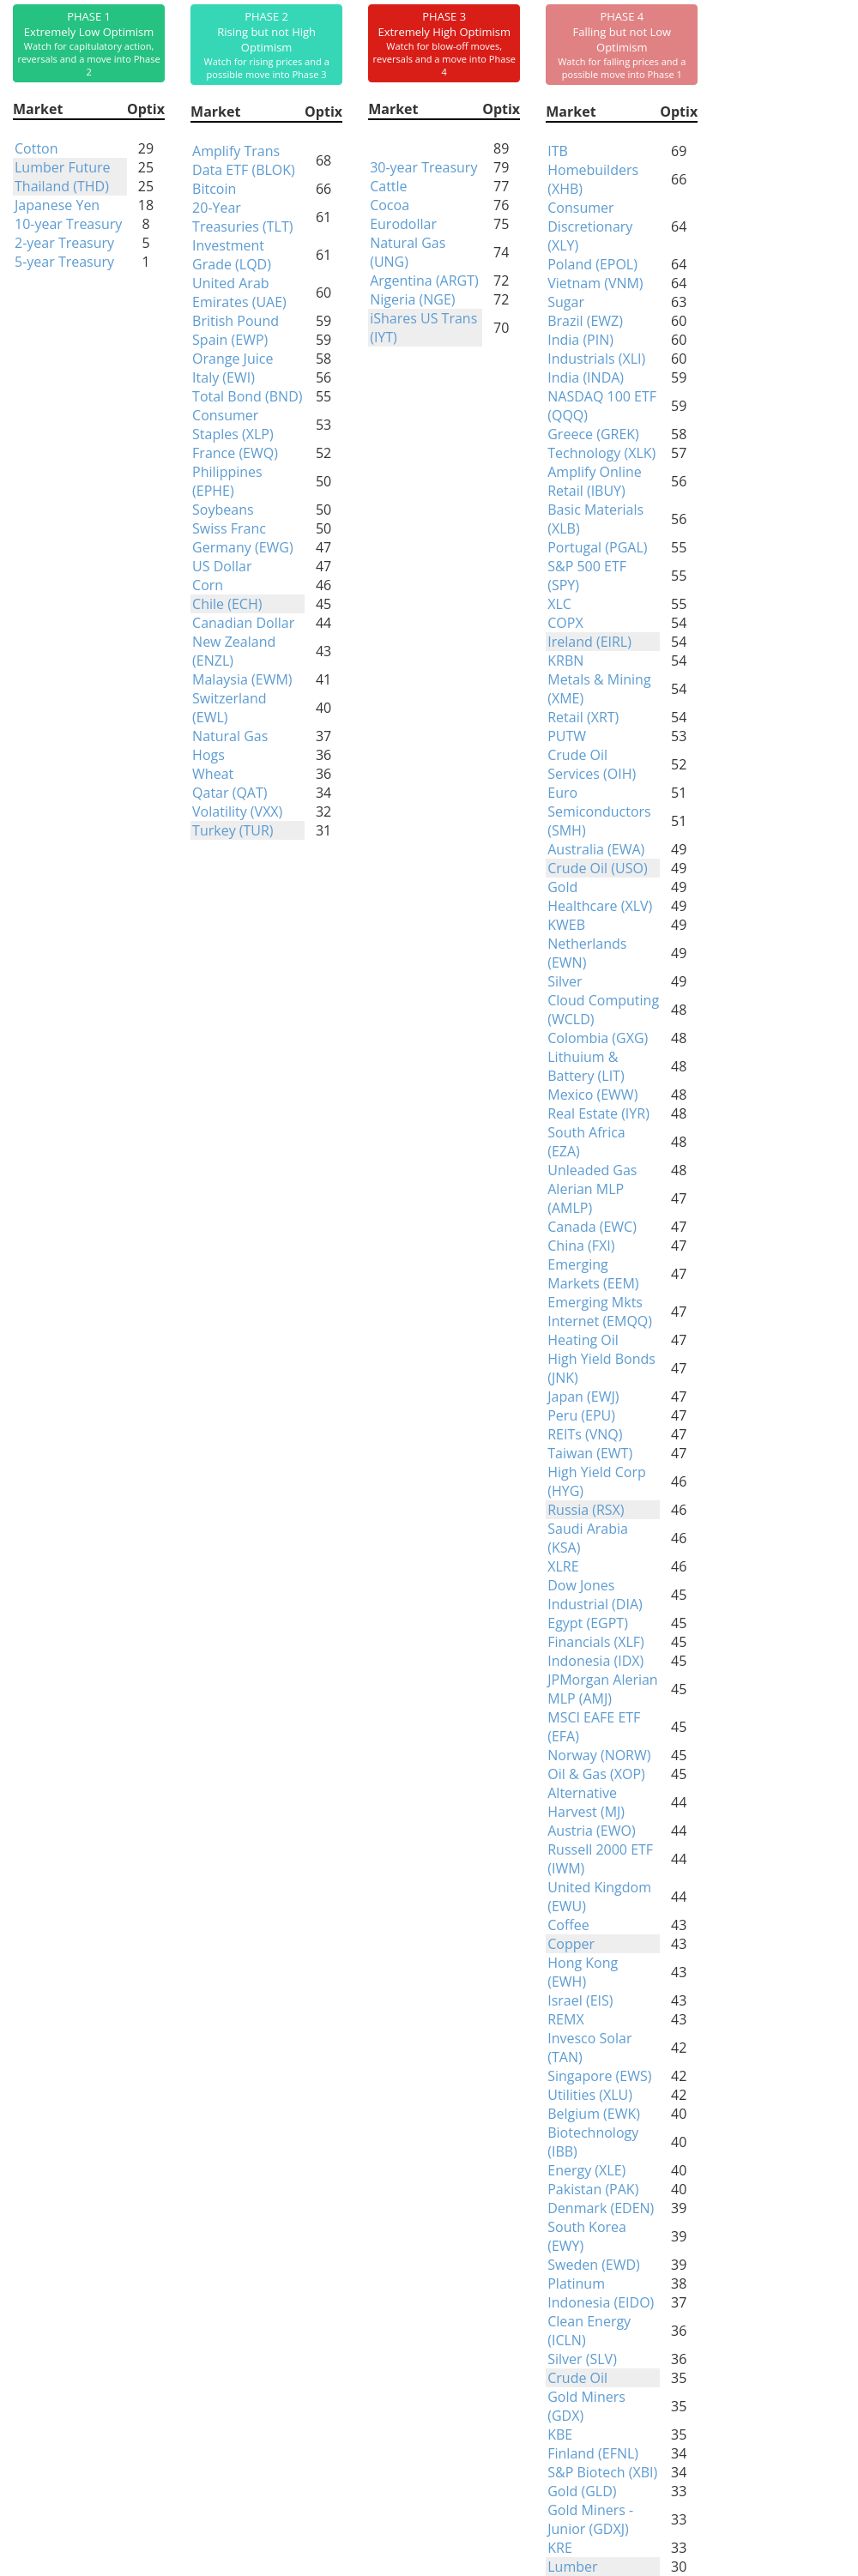
Phase Table
Ranks
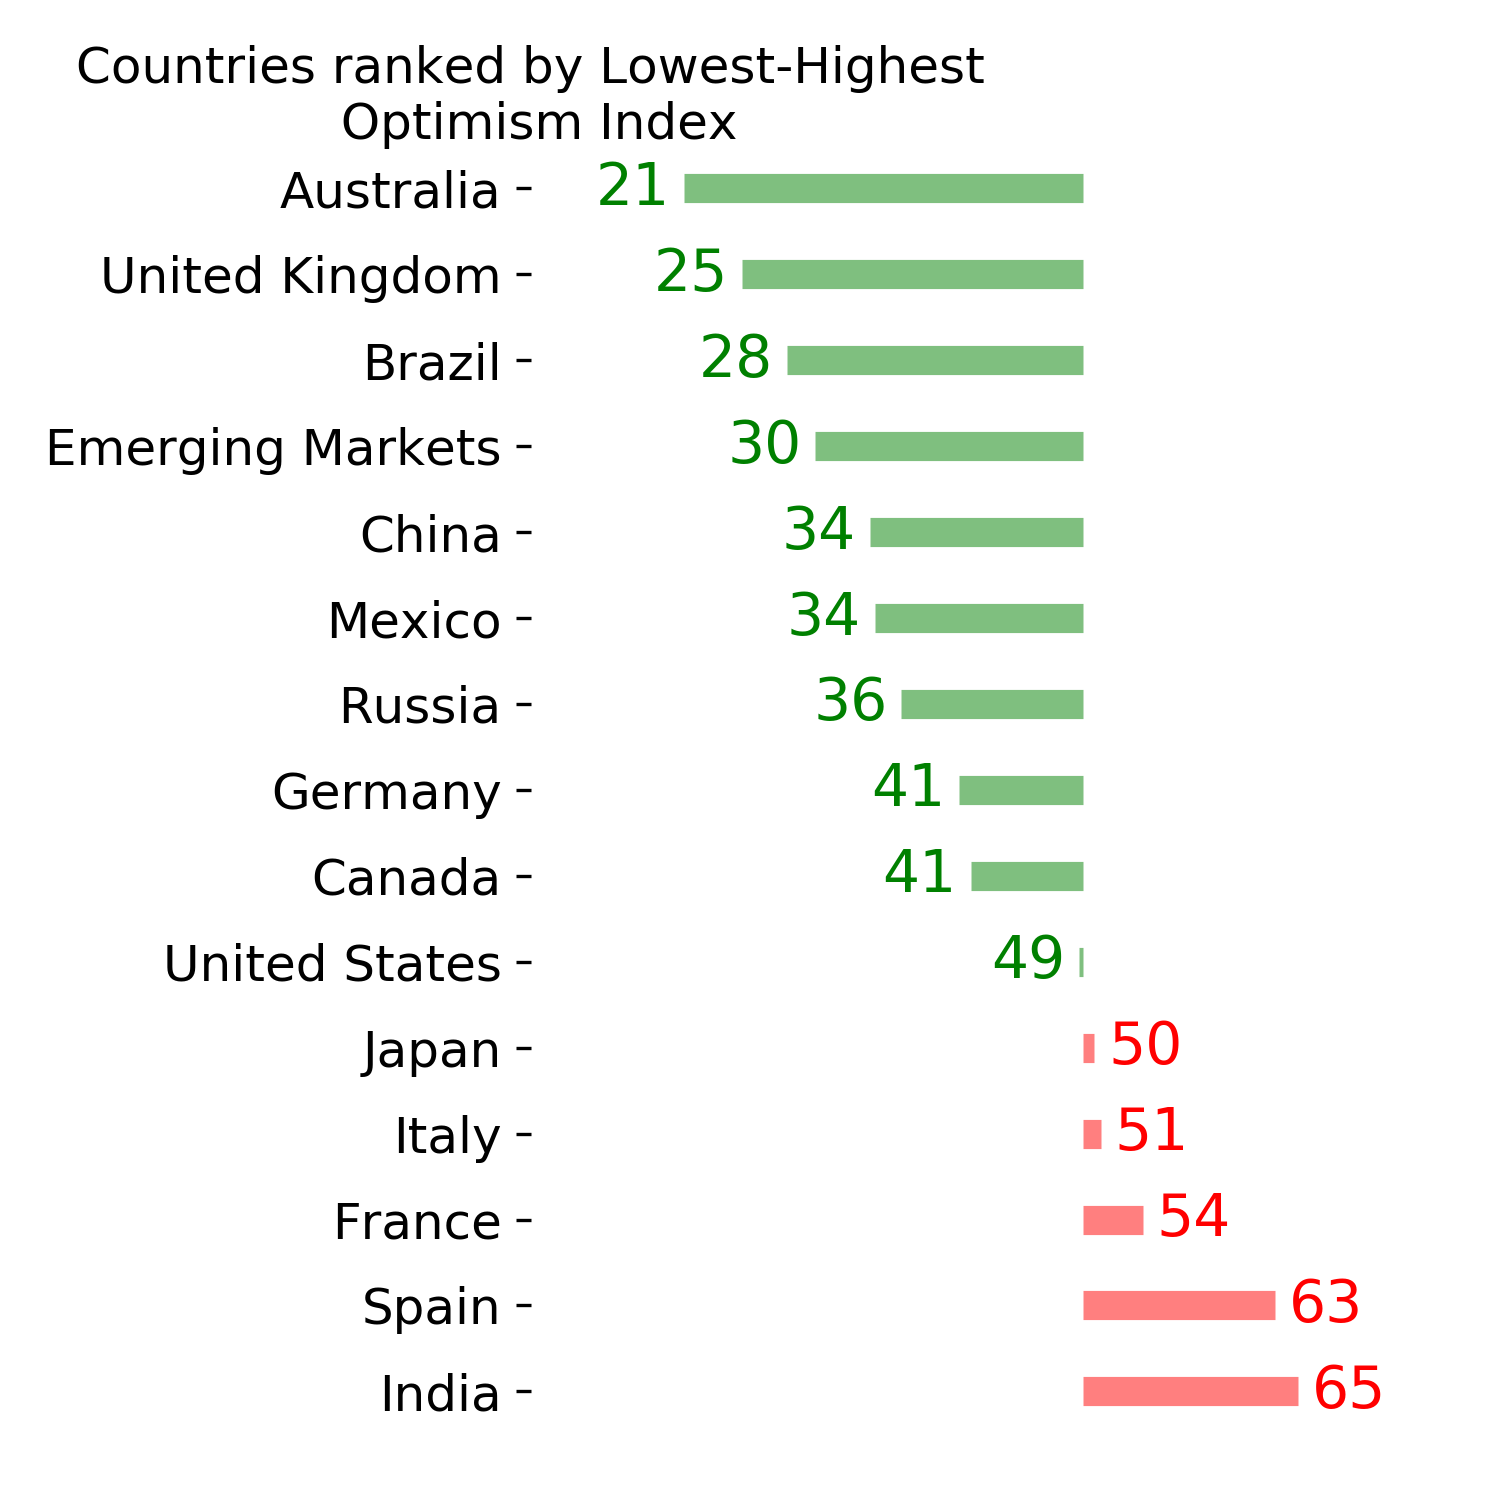
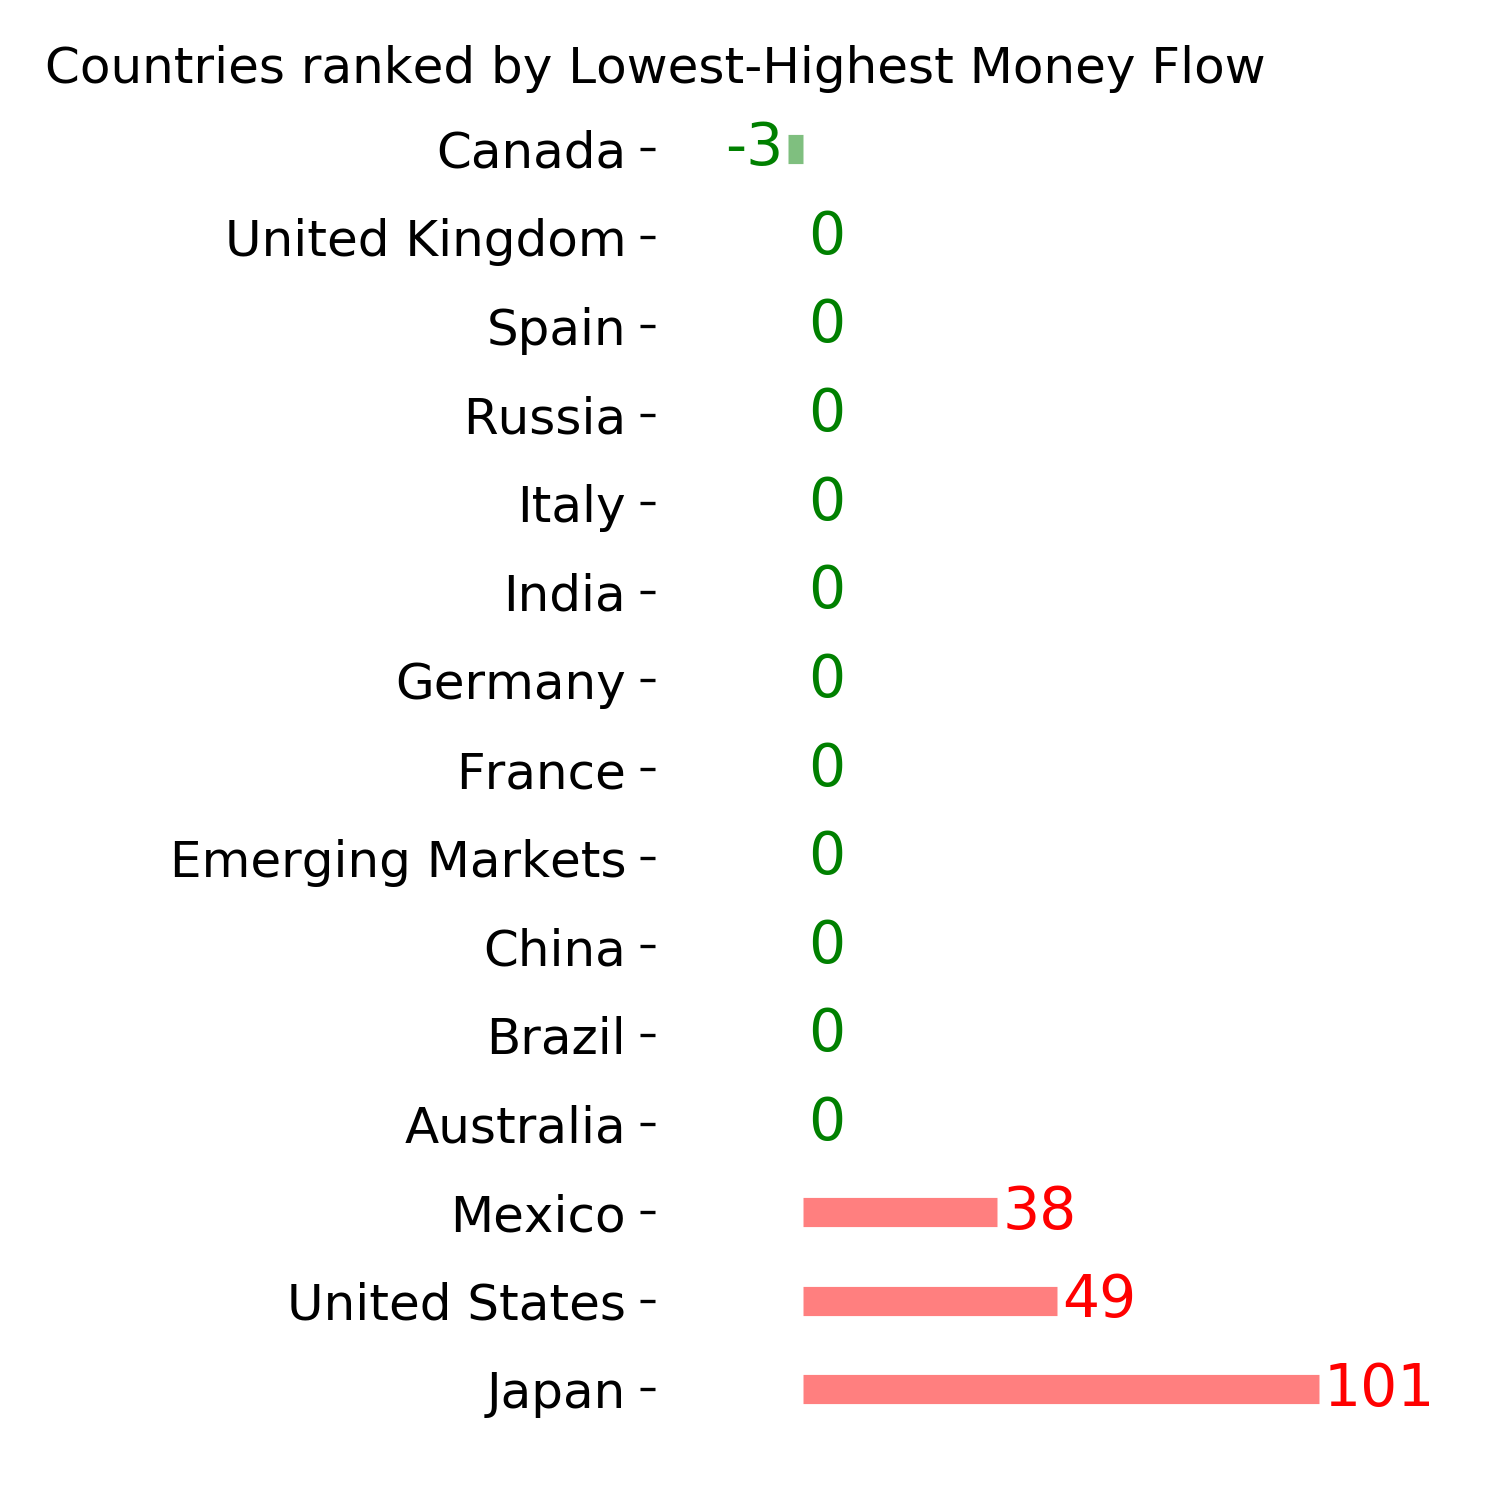
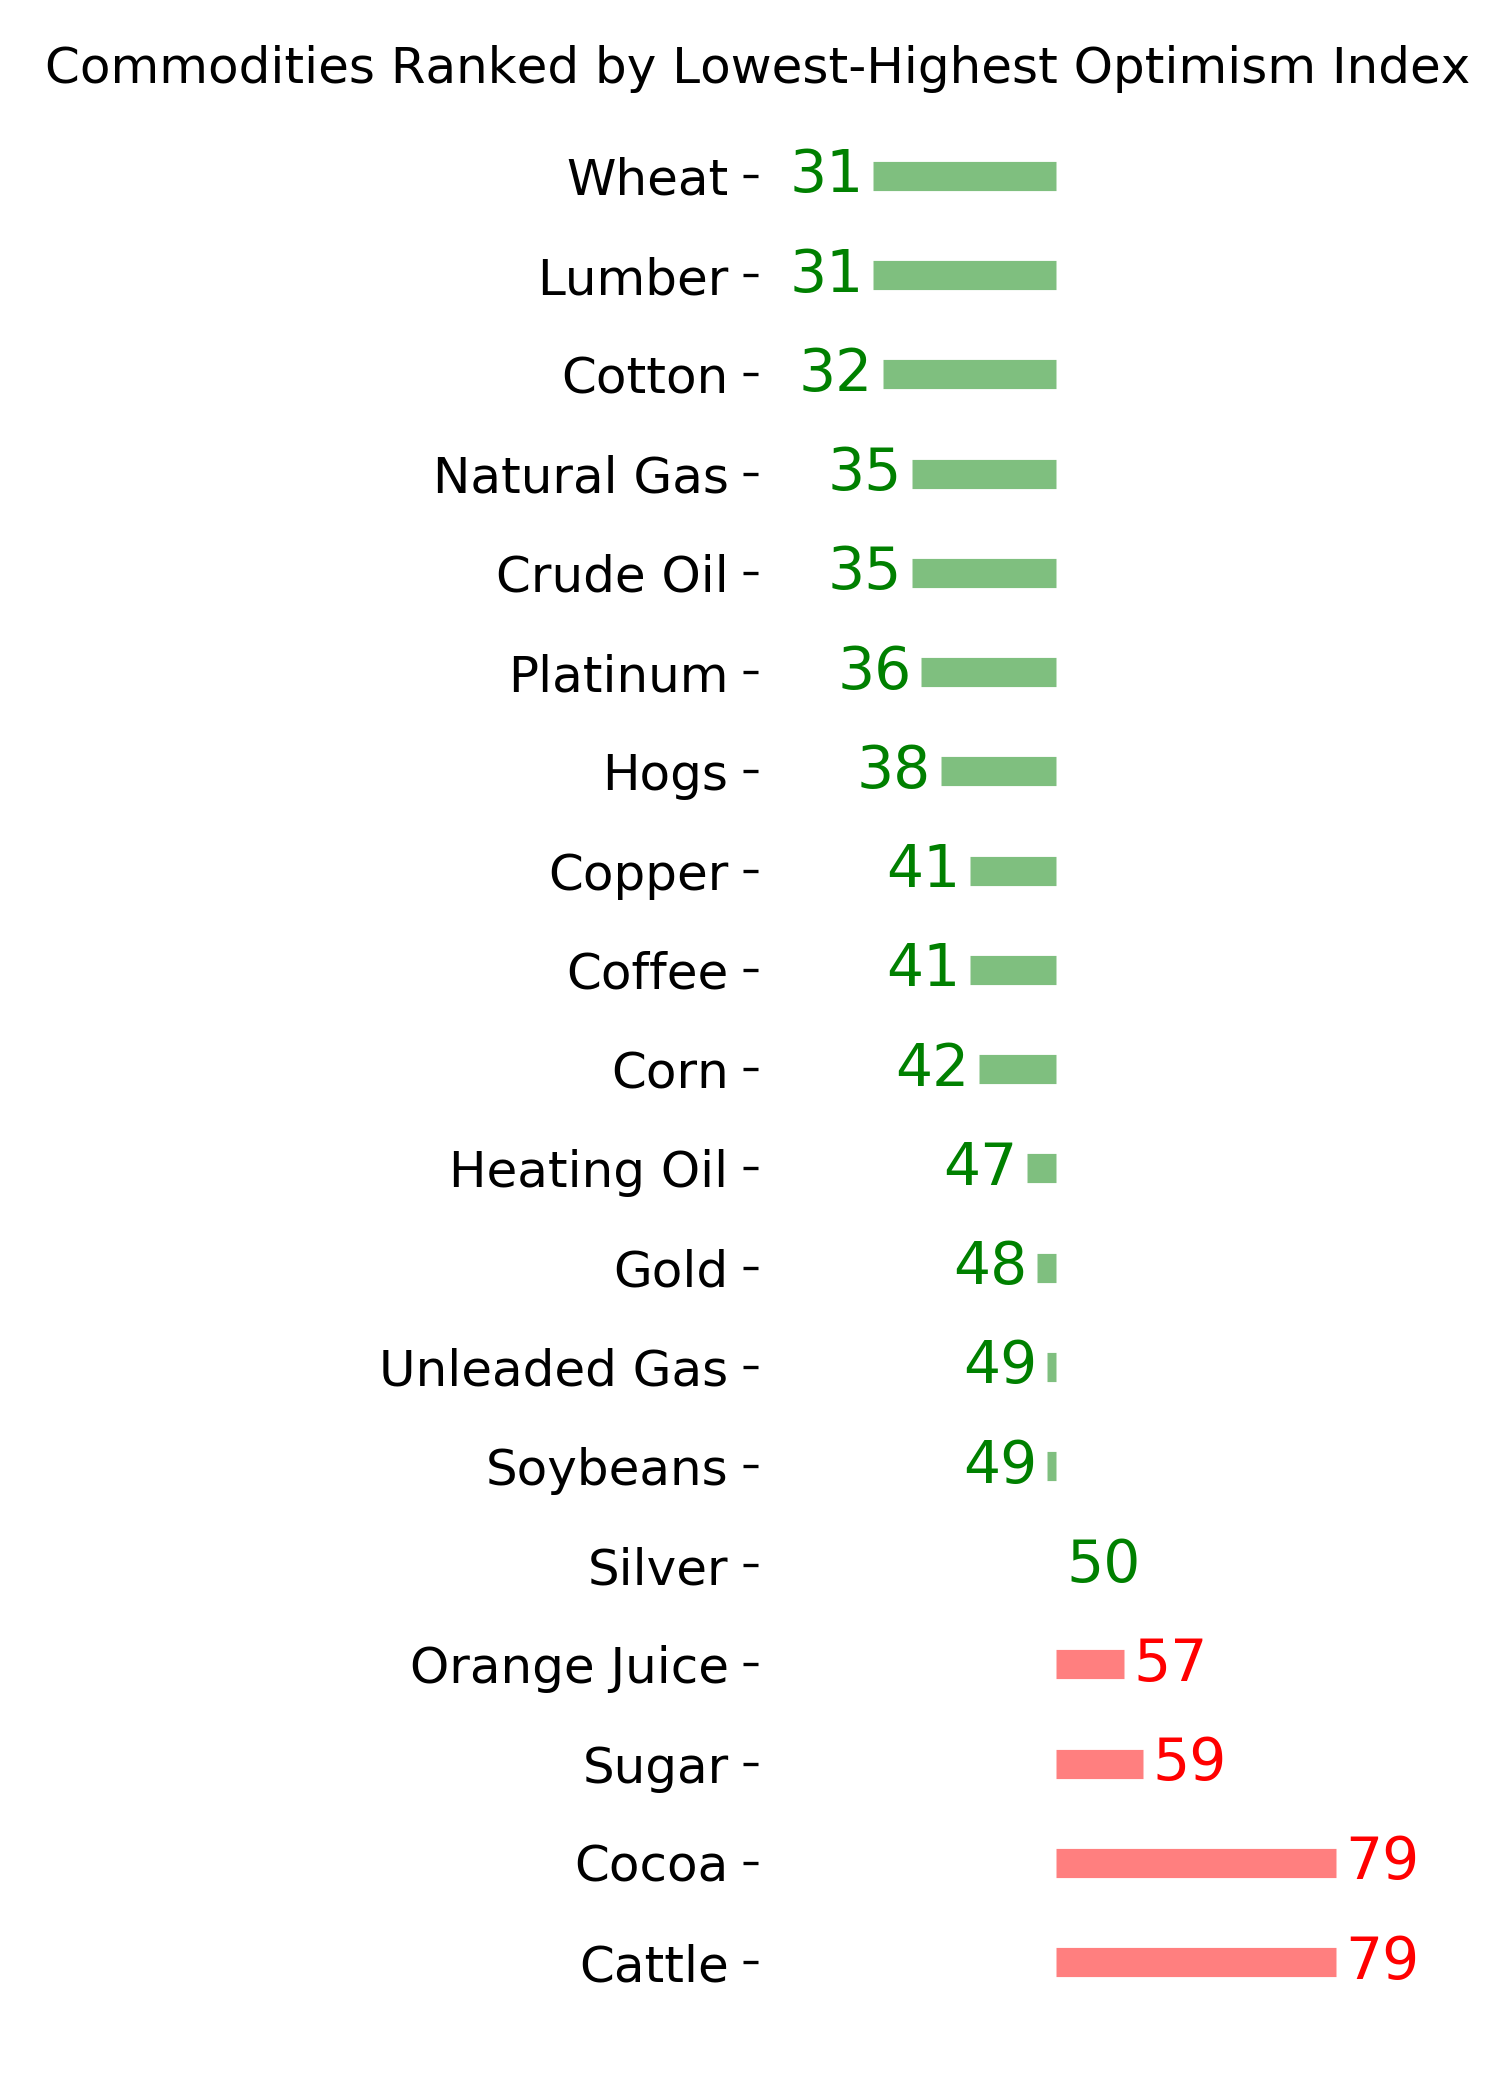
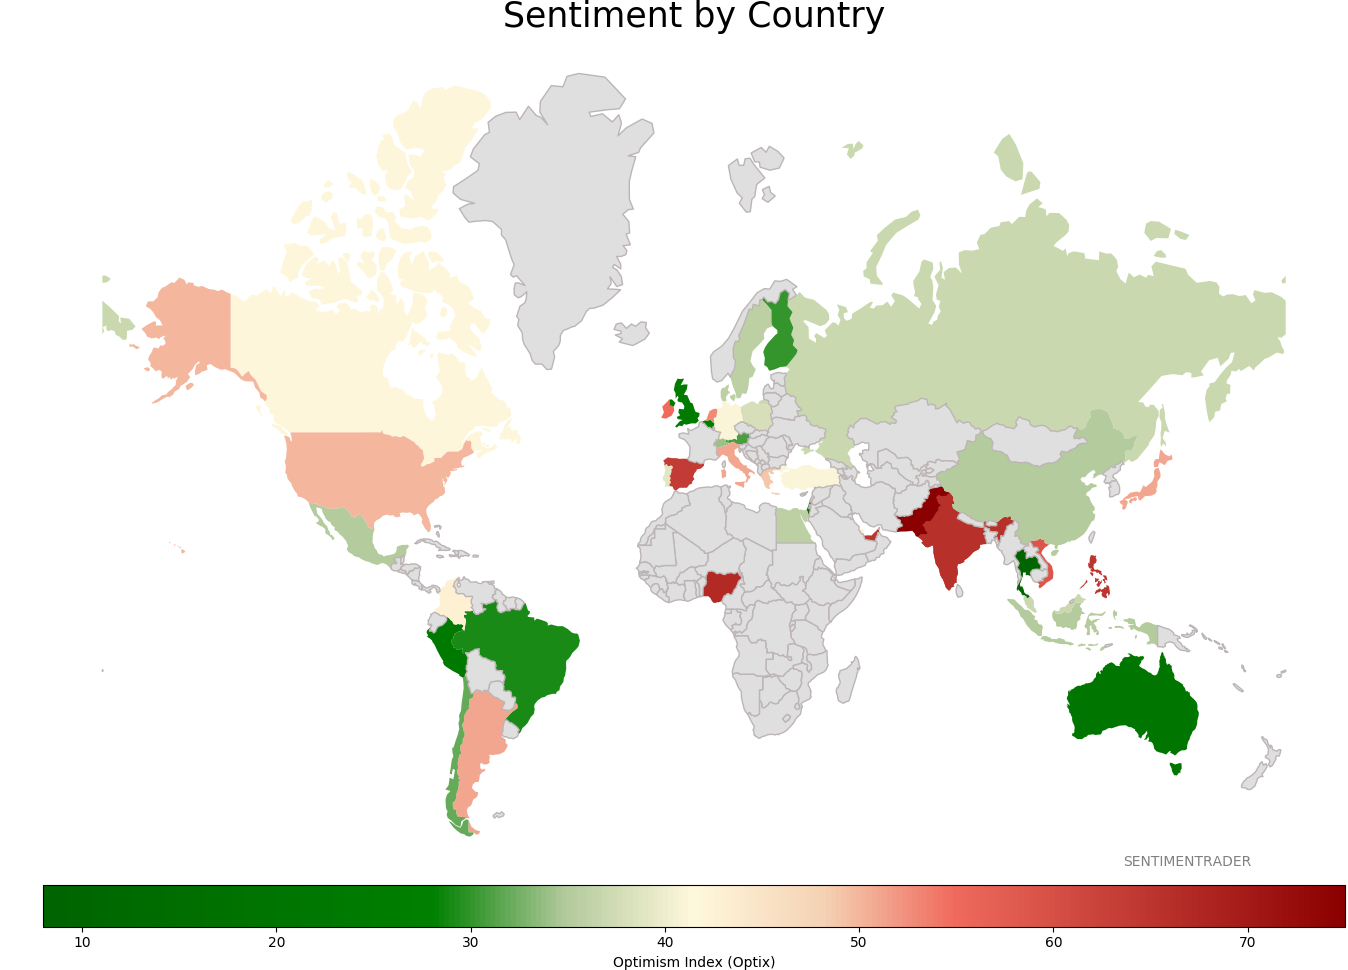
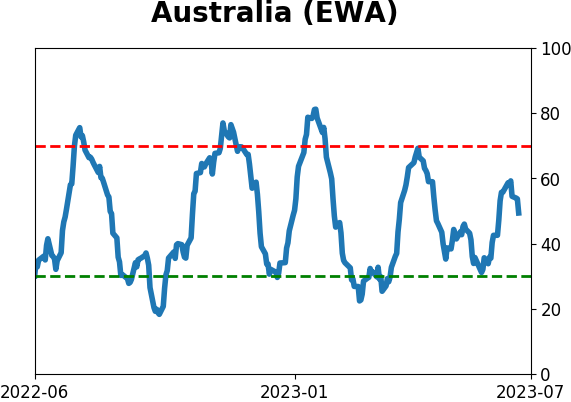
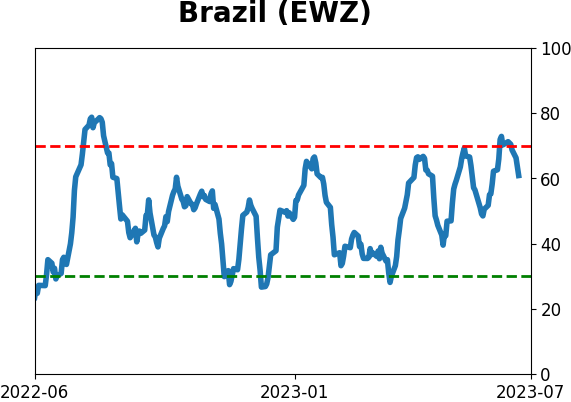
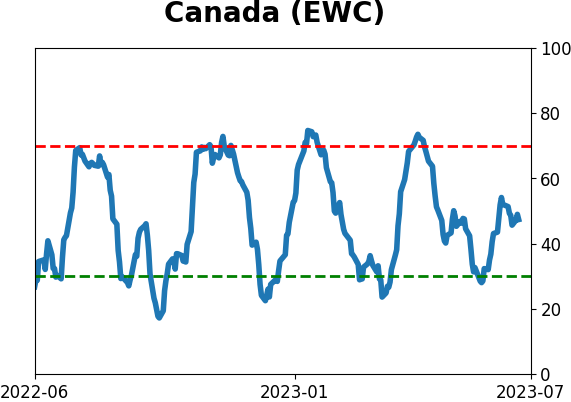
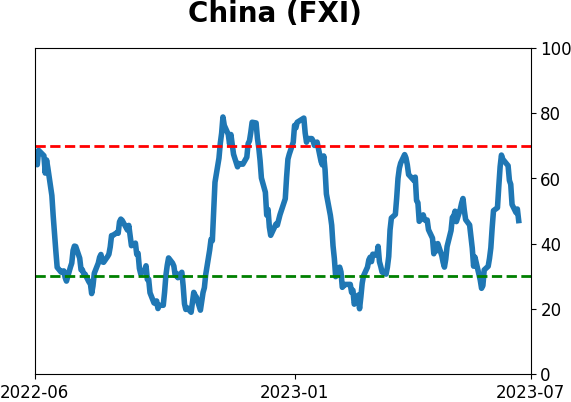
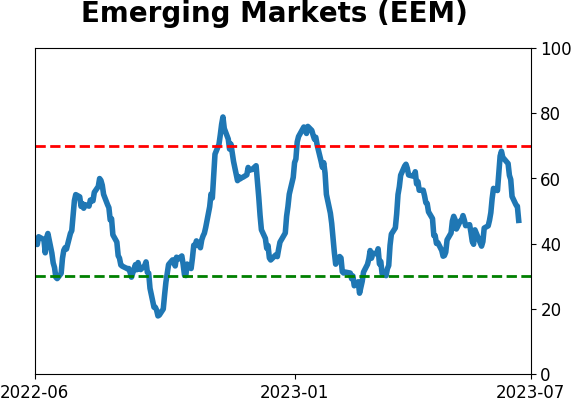
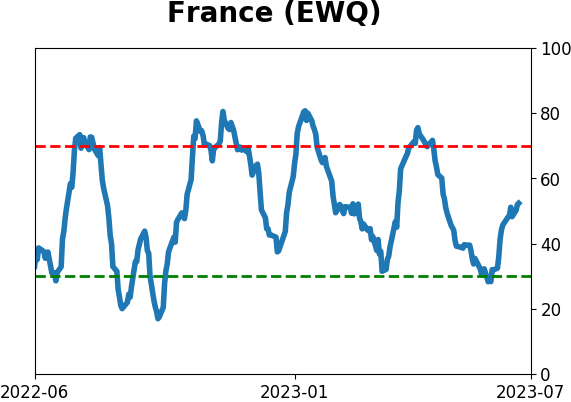
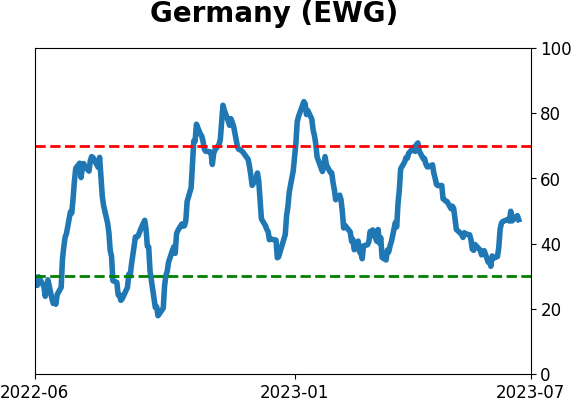
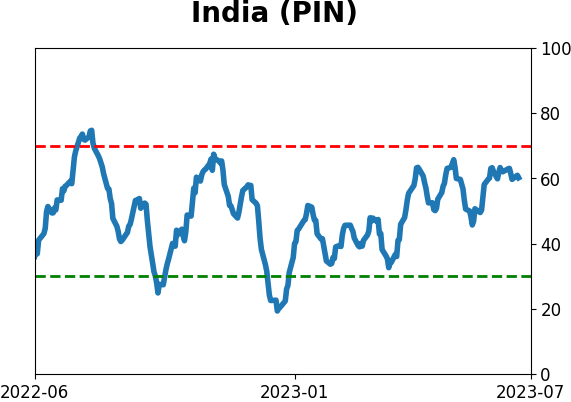
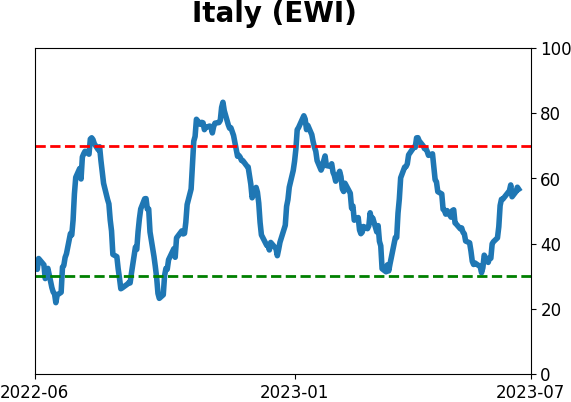
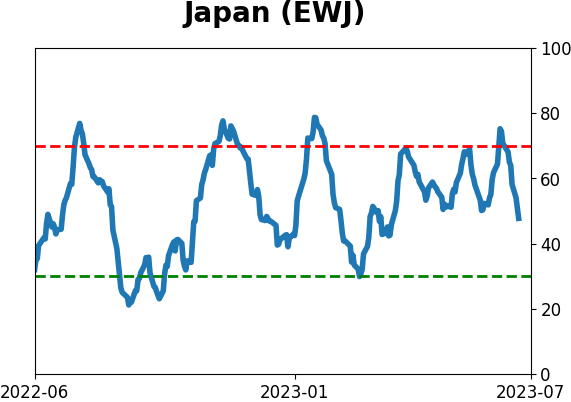
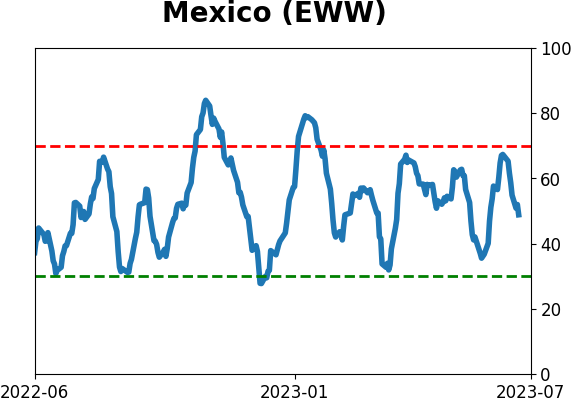
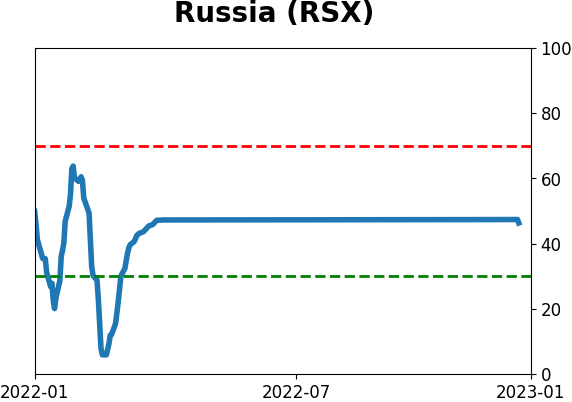
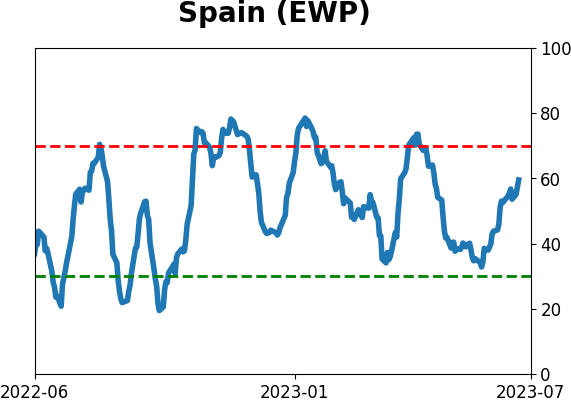
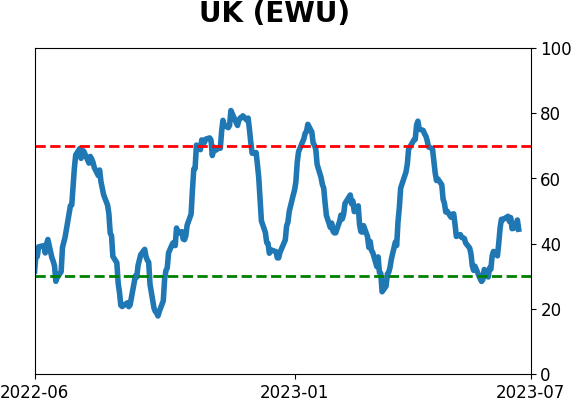
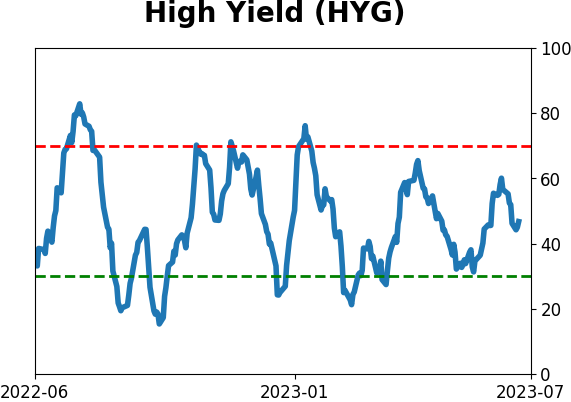
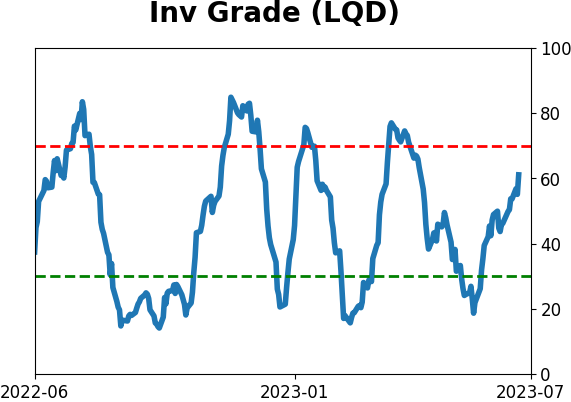
Sentiment Around The World
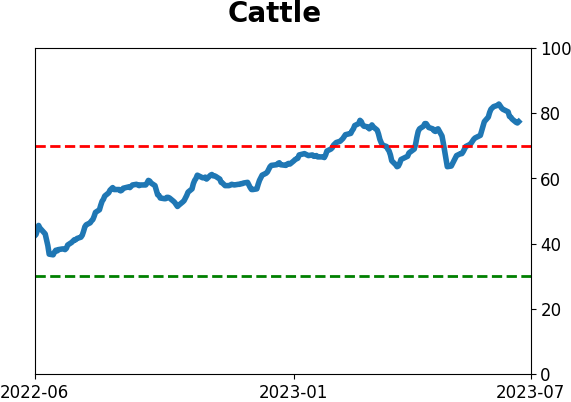
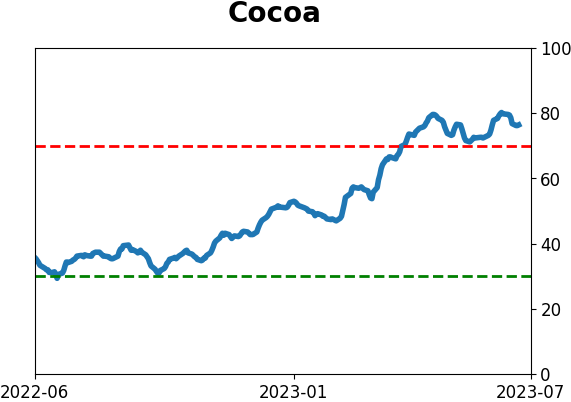
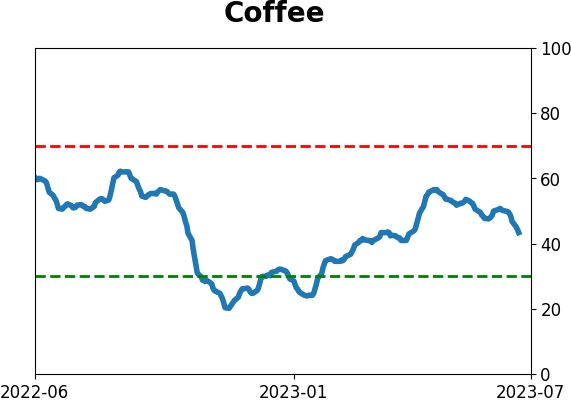
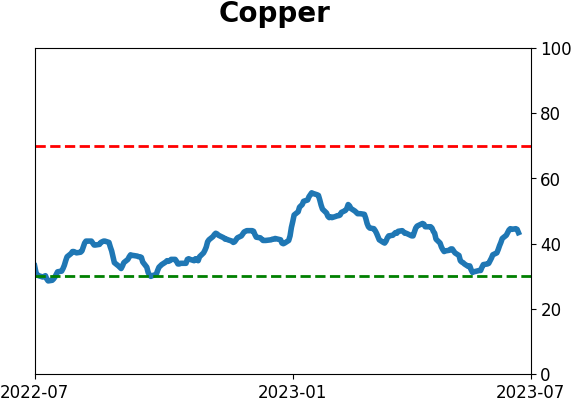
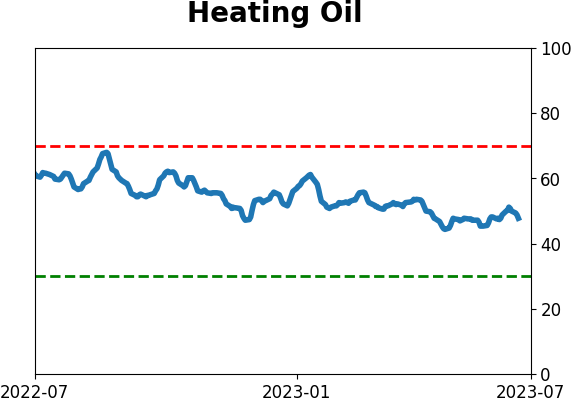
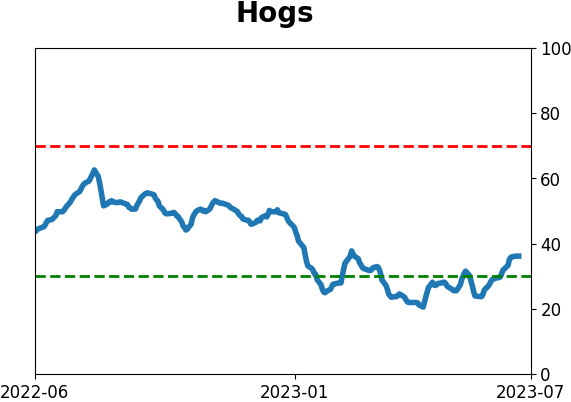
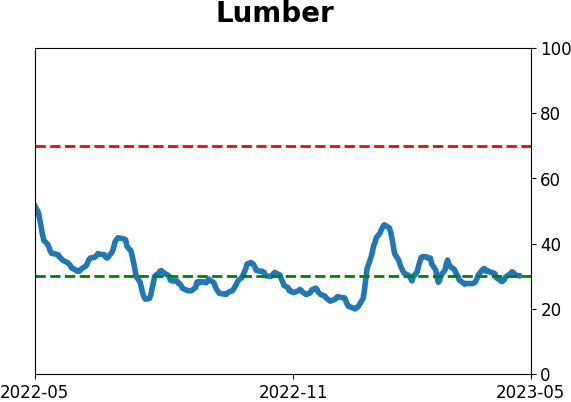
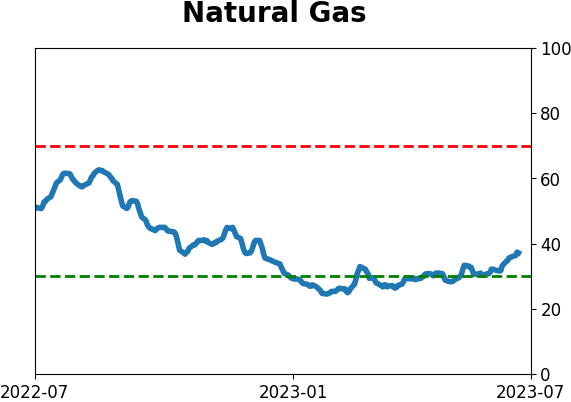
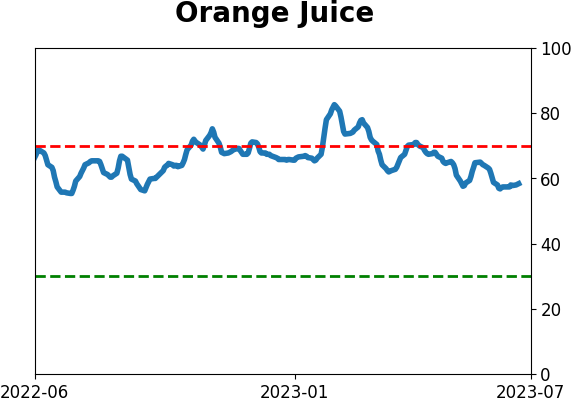
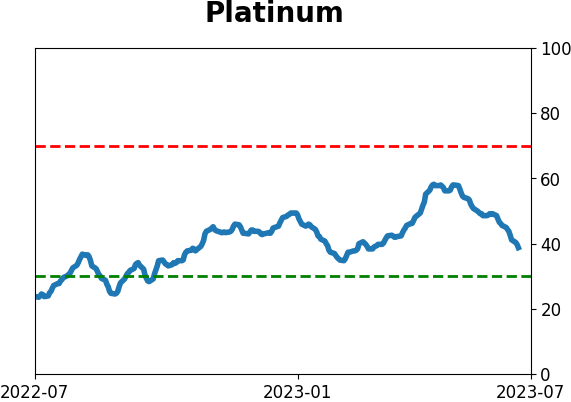
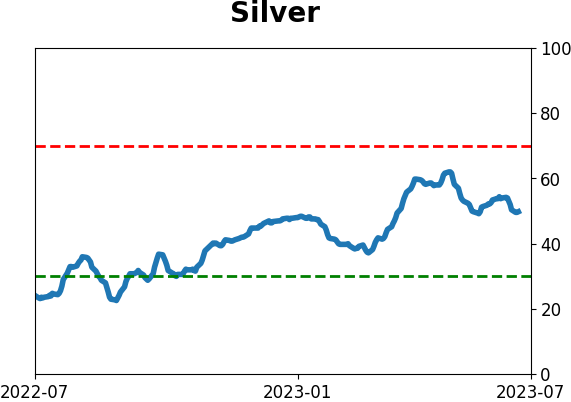
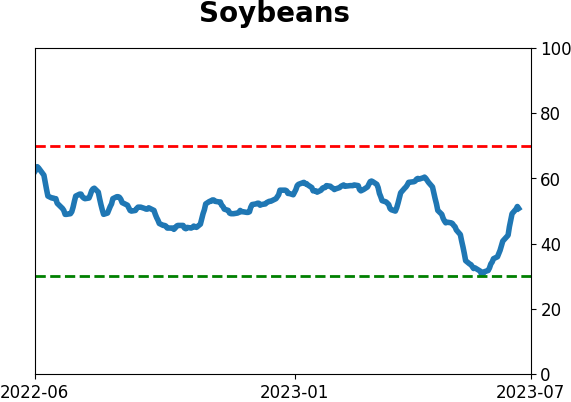
Optimism Index Thumbnails
|
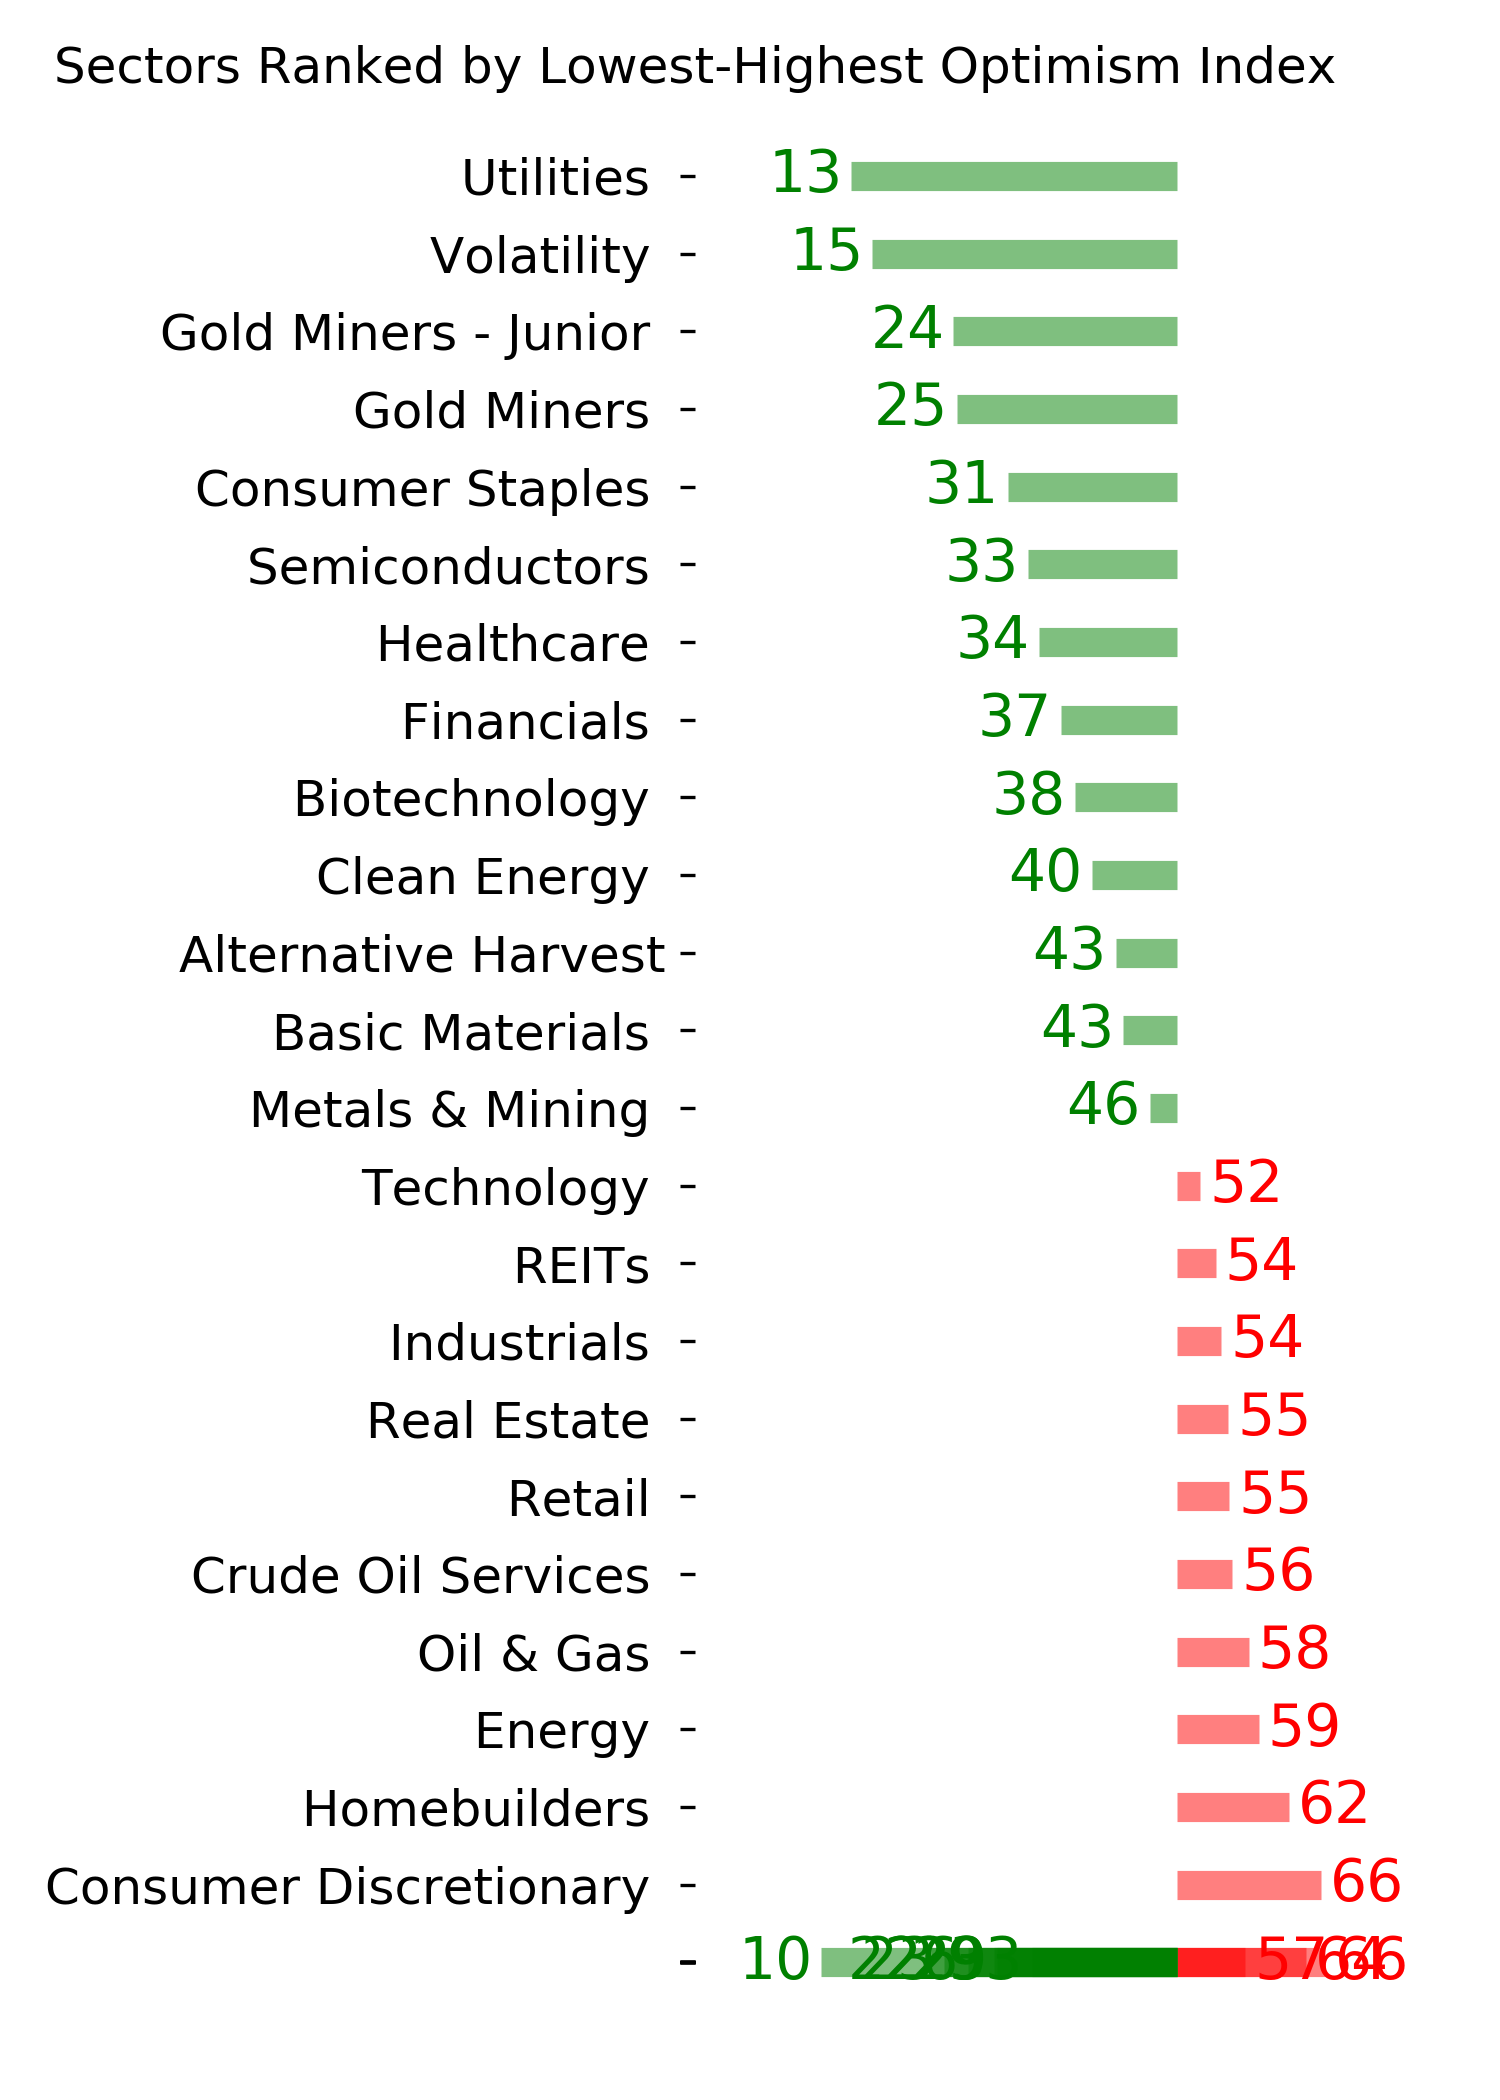
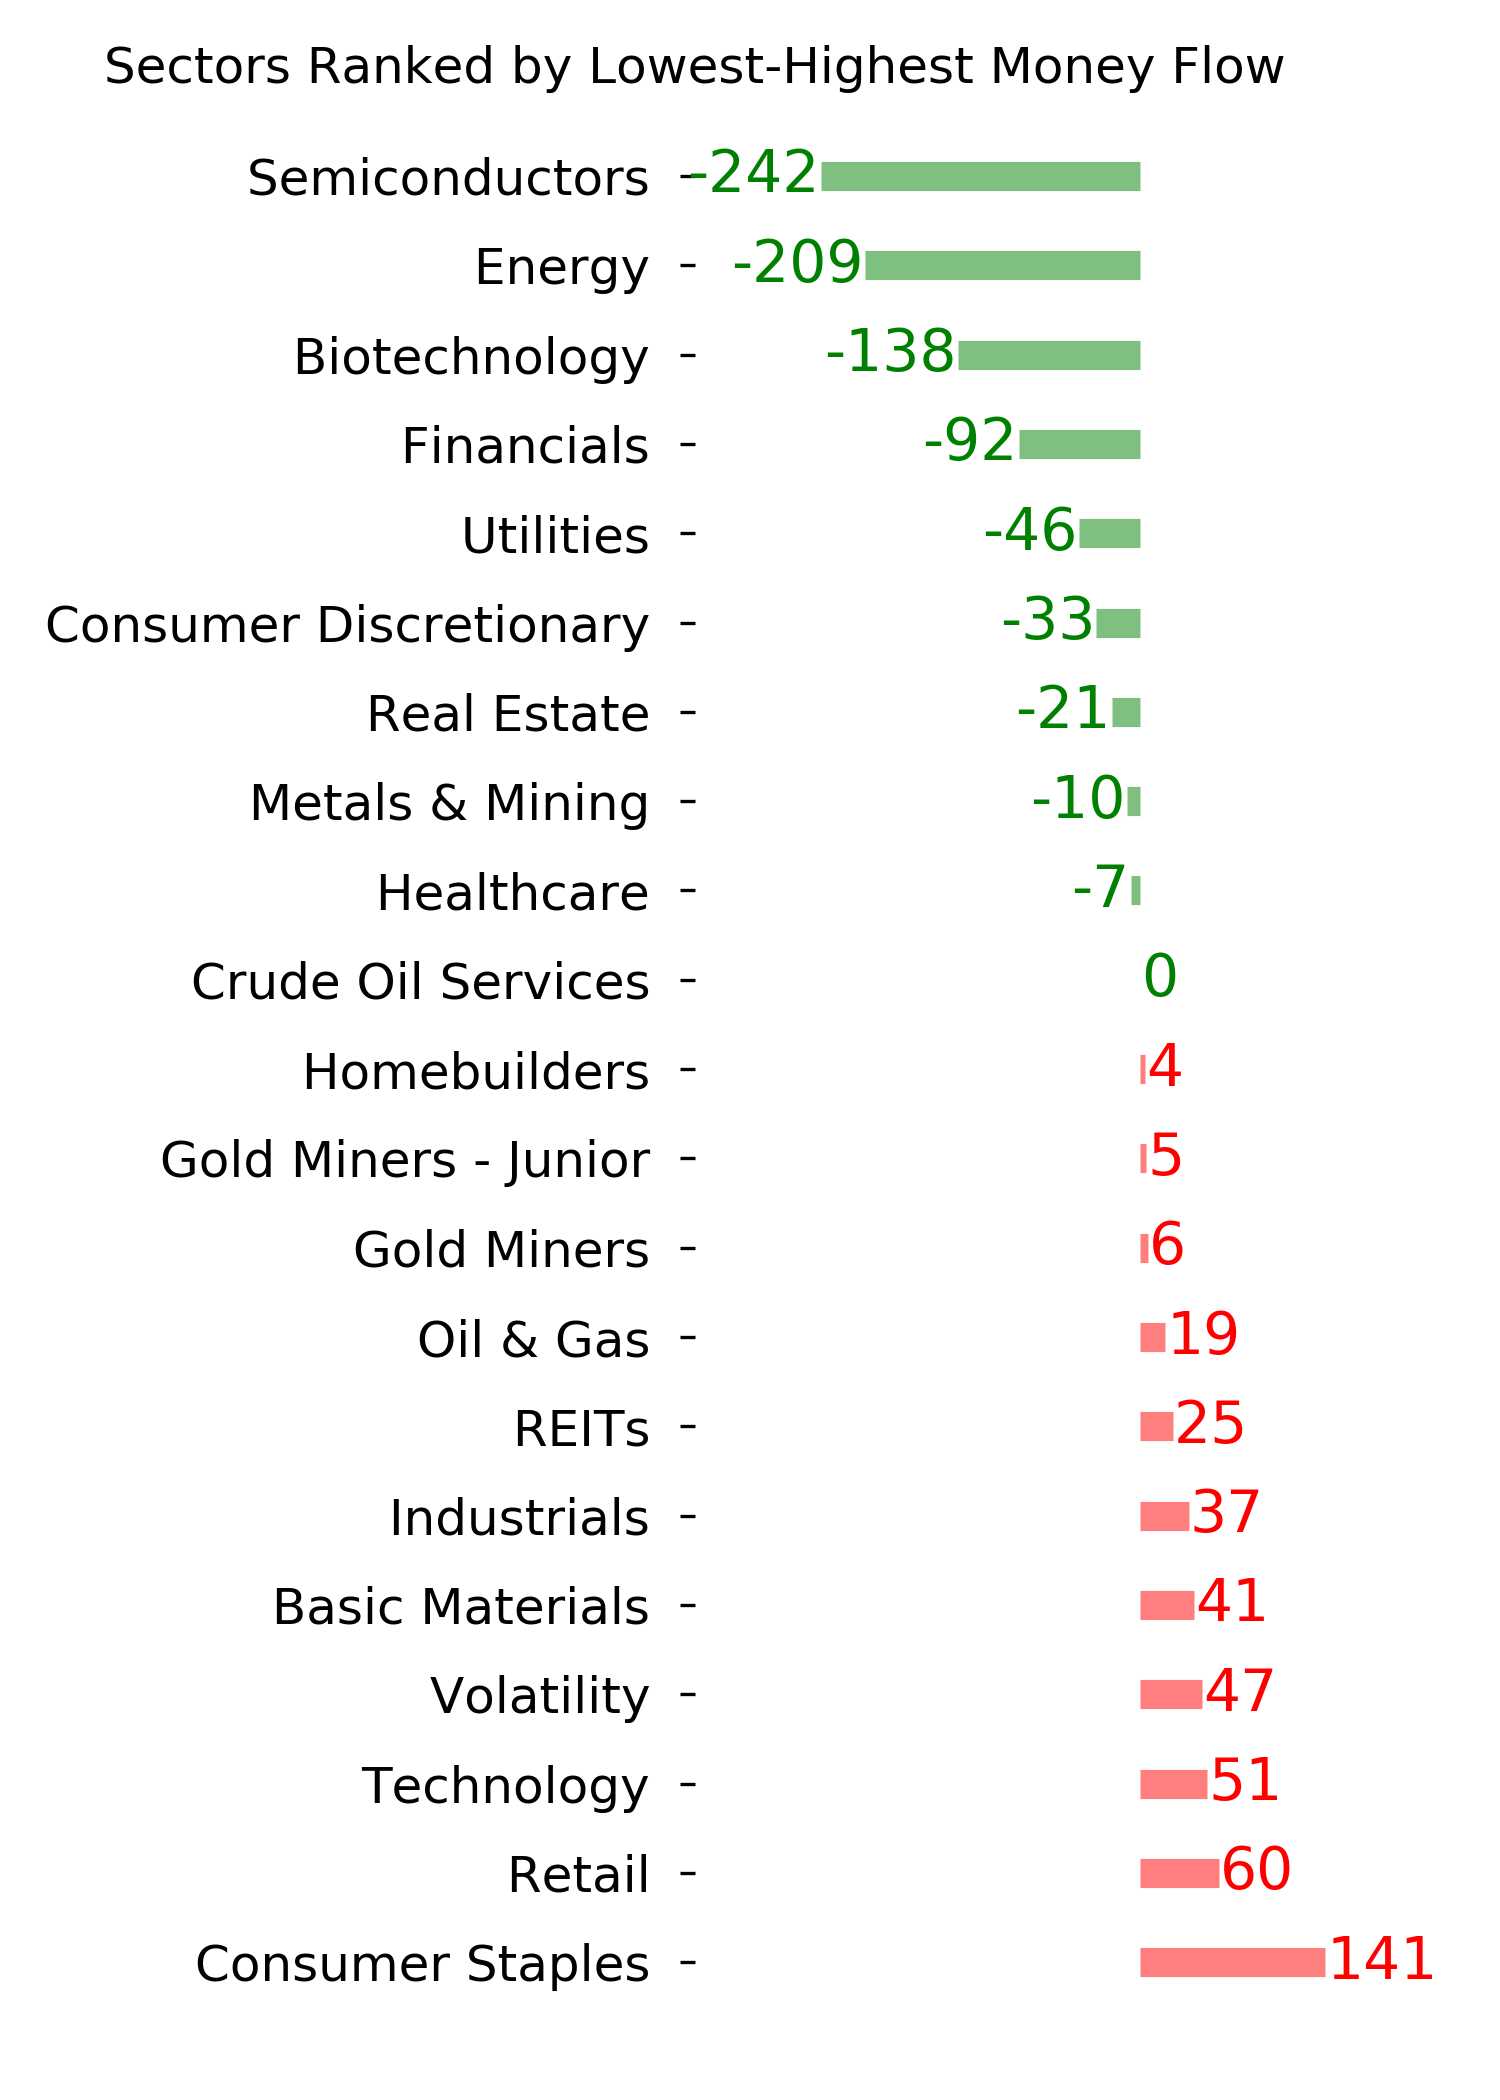
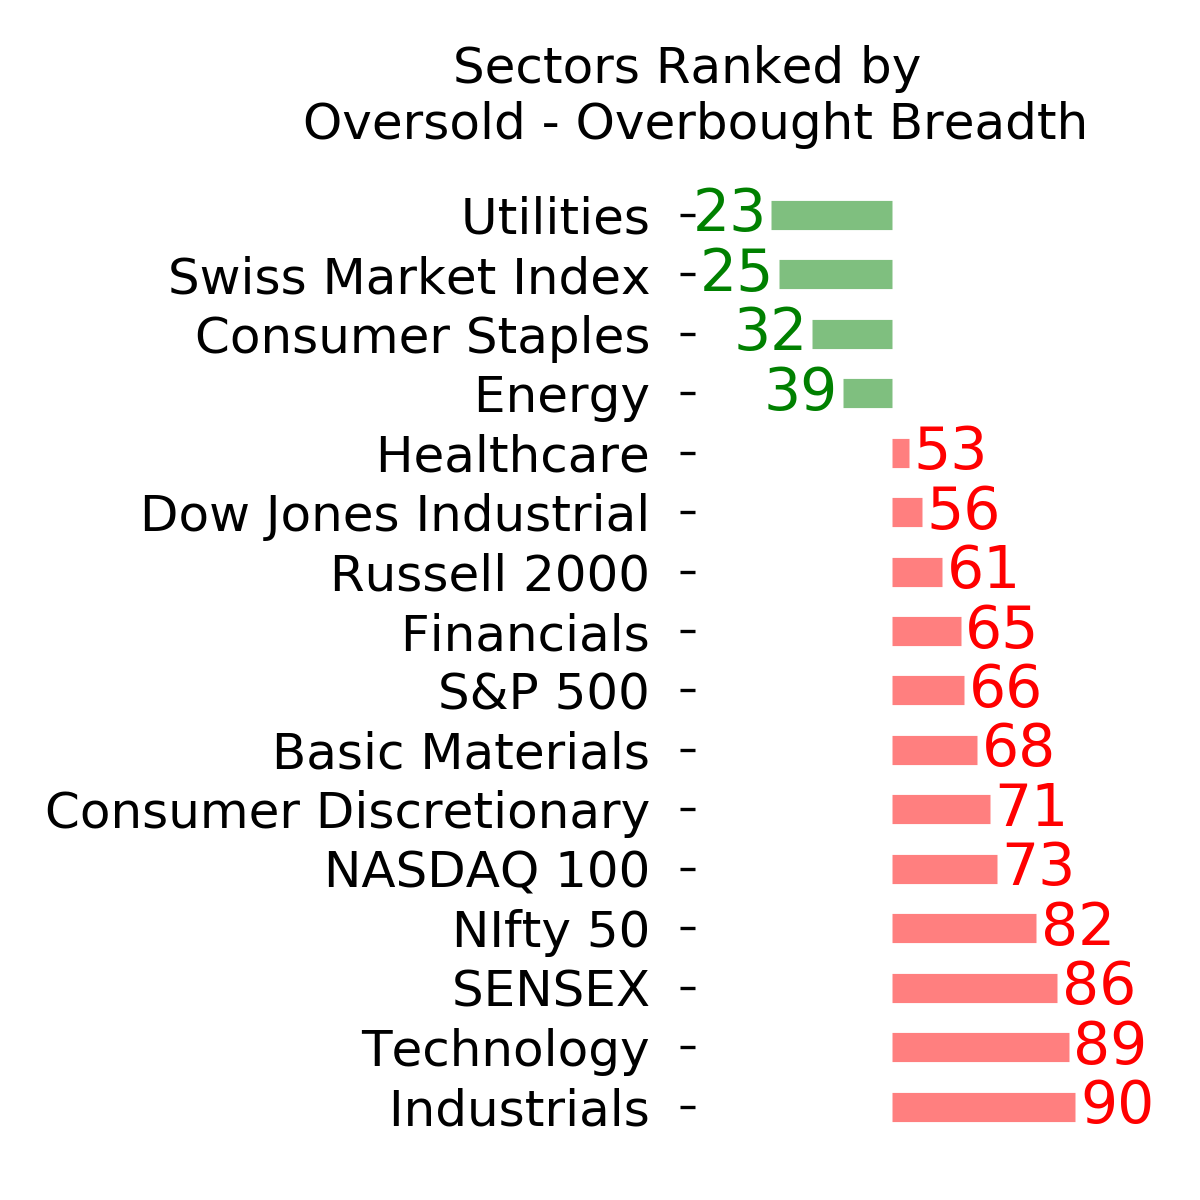
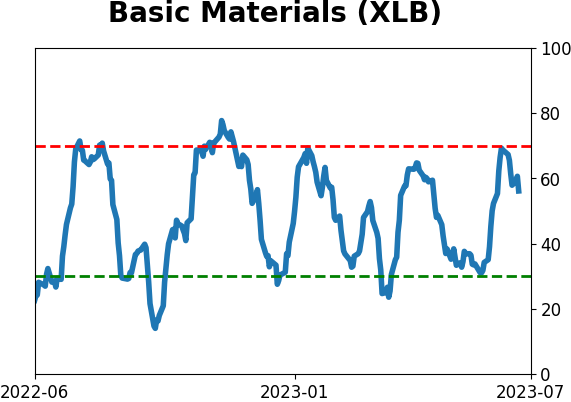
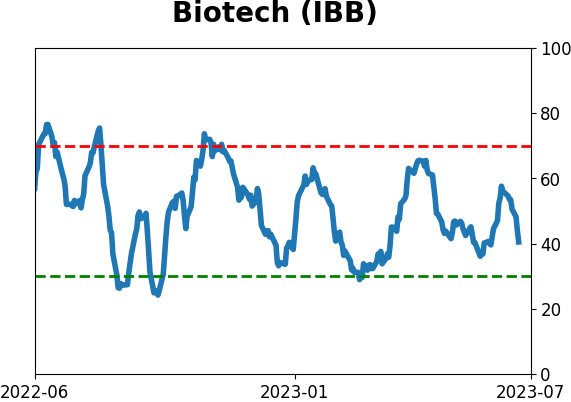
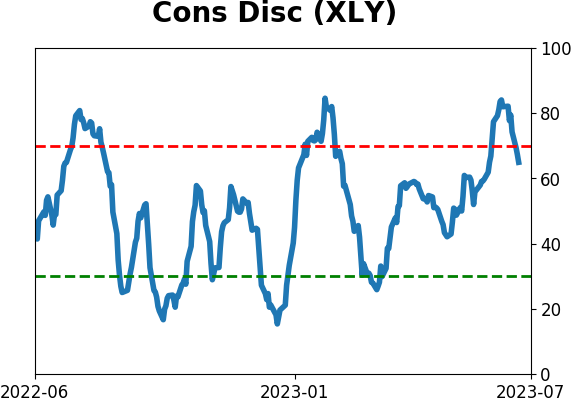
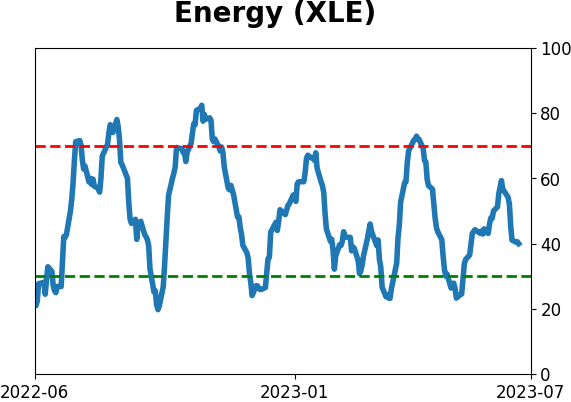
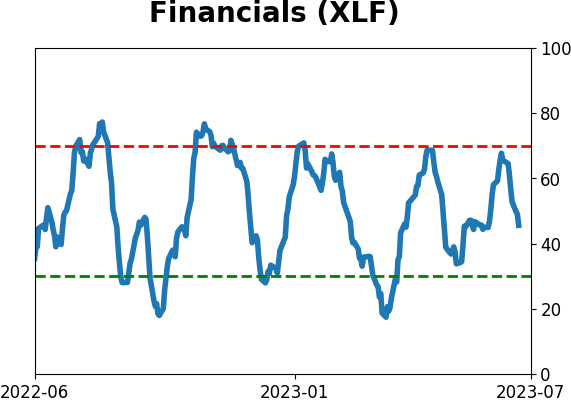
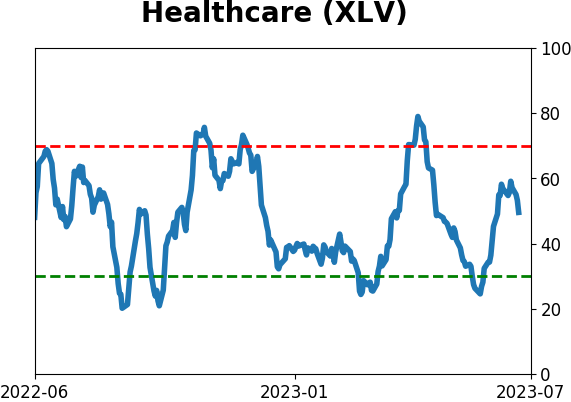
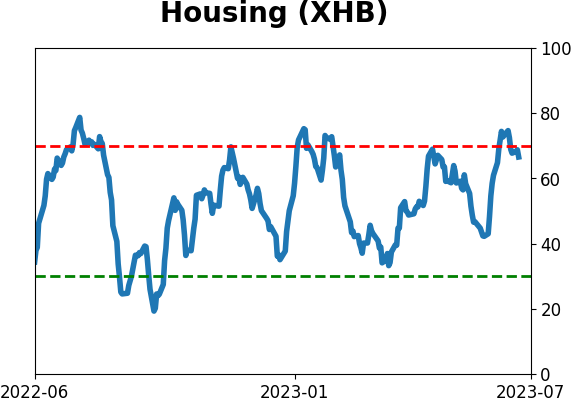
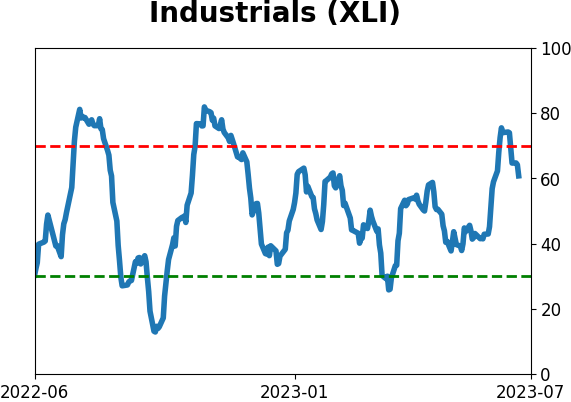
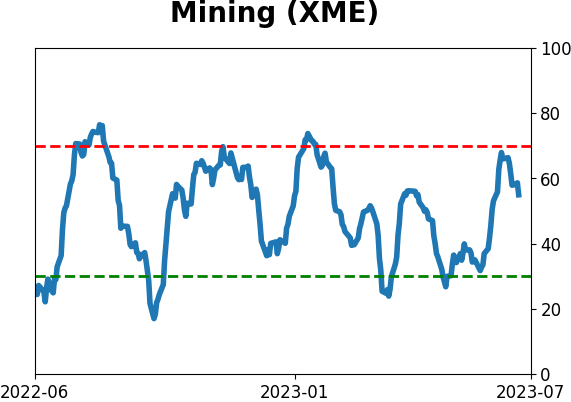
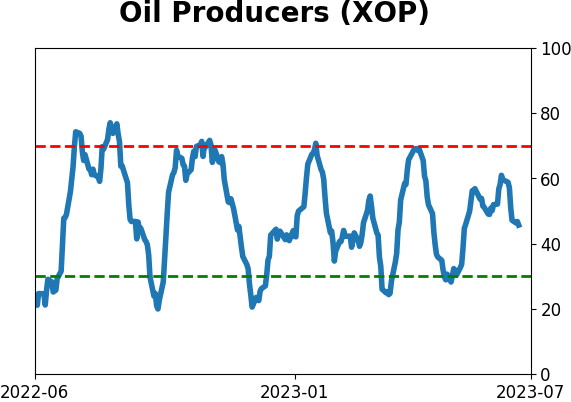
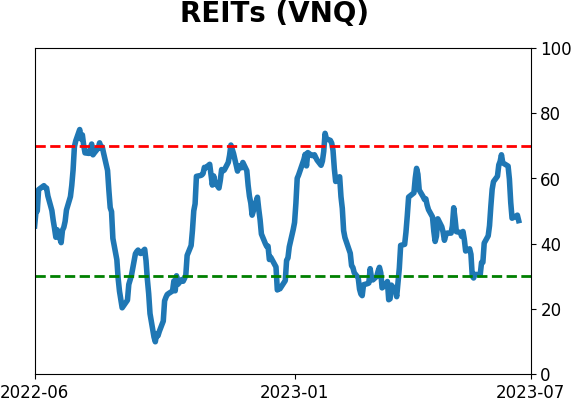
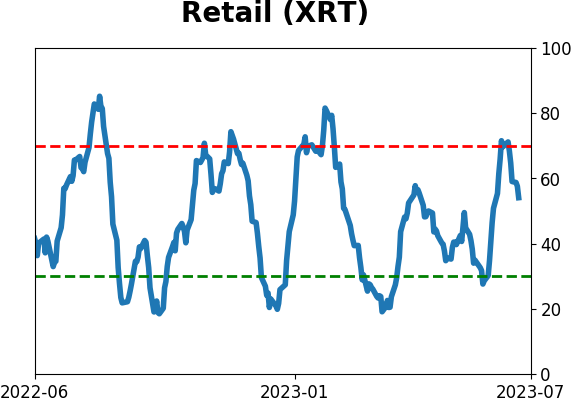
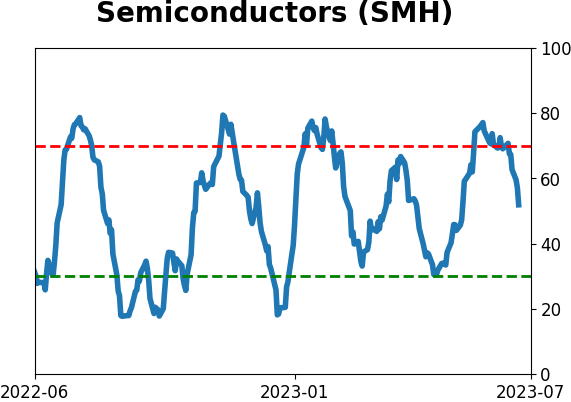
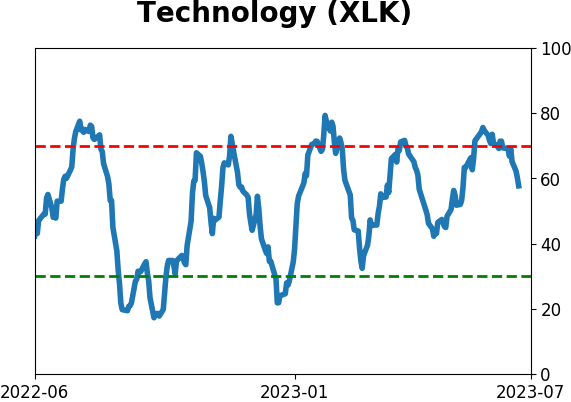
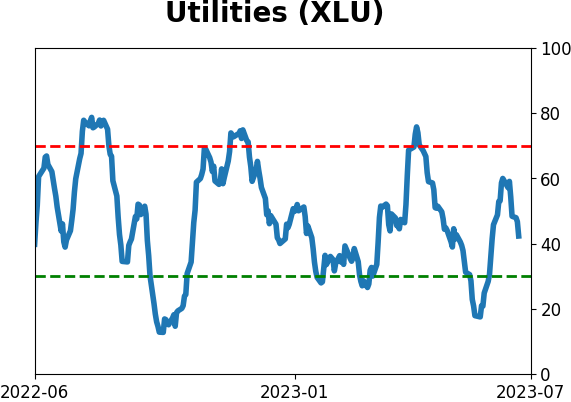
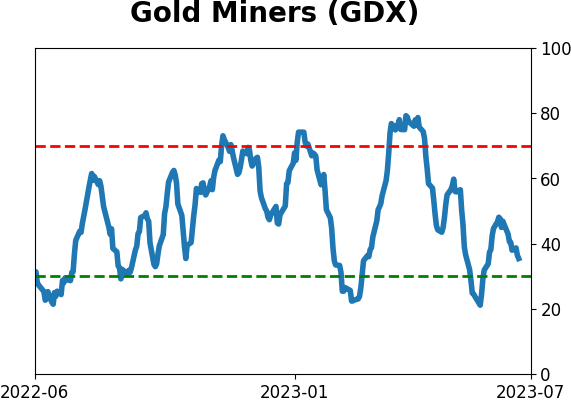
Sector ETF's - 10-Day Moving Average
|
|
|
Country ETF's - 10-Day Moving Average
|
|
|
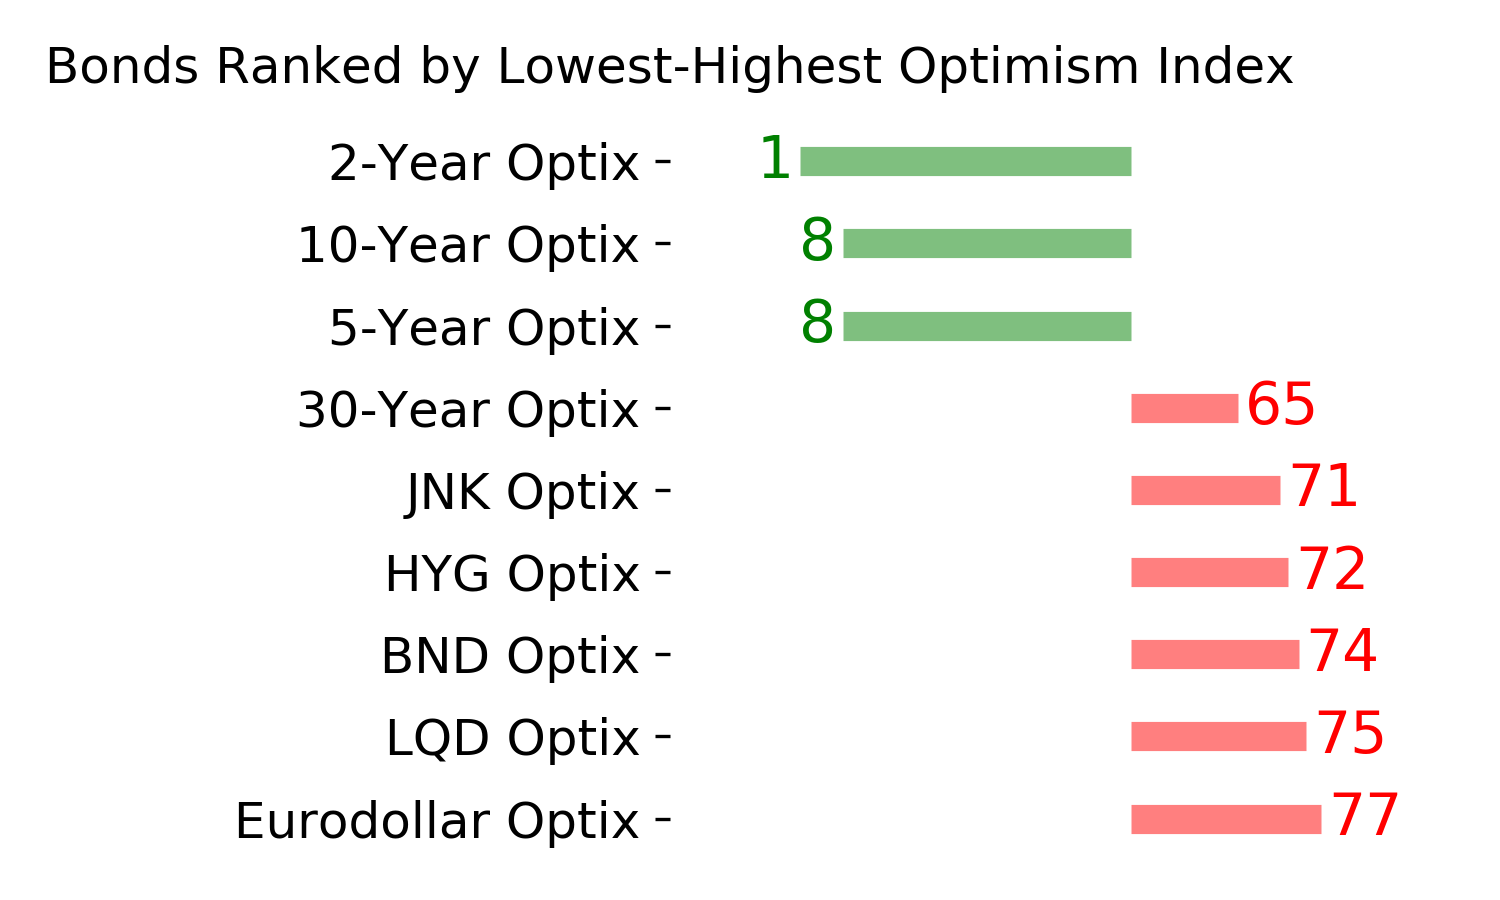
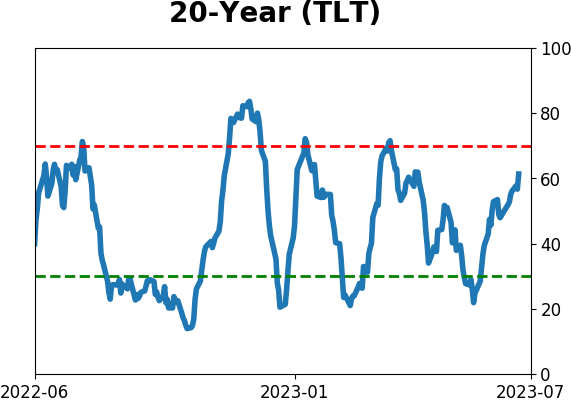
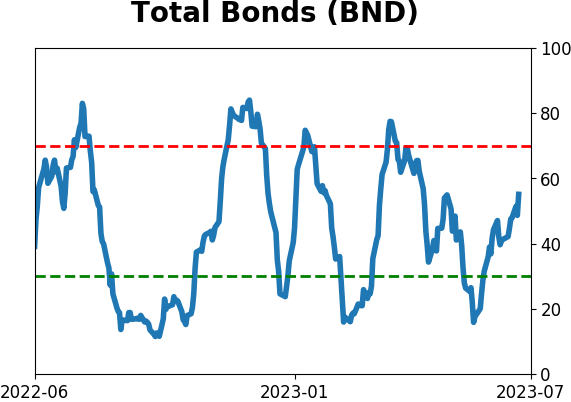
Bond ETF's - 10-Day Moving Average
|
|
|
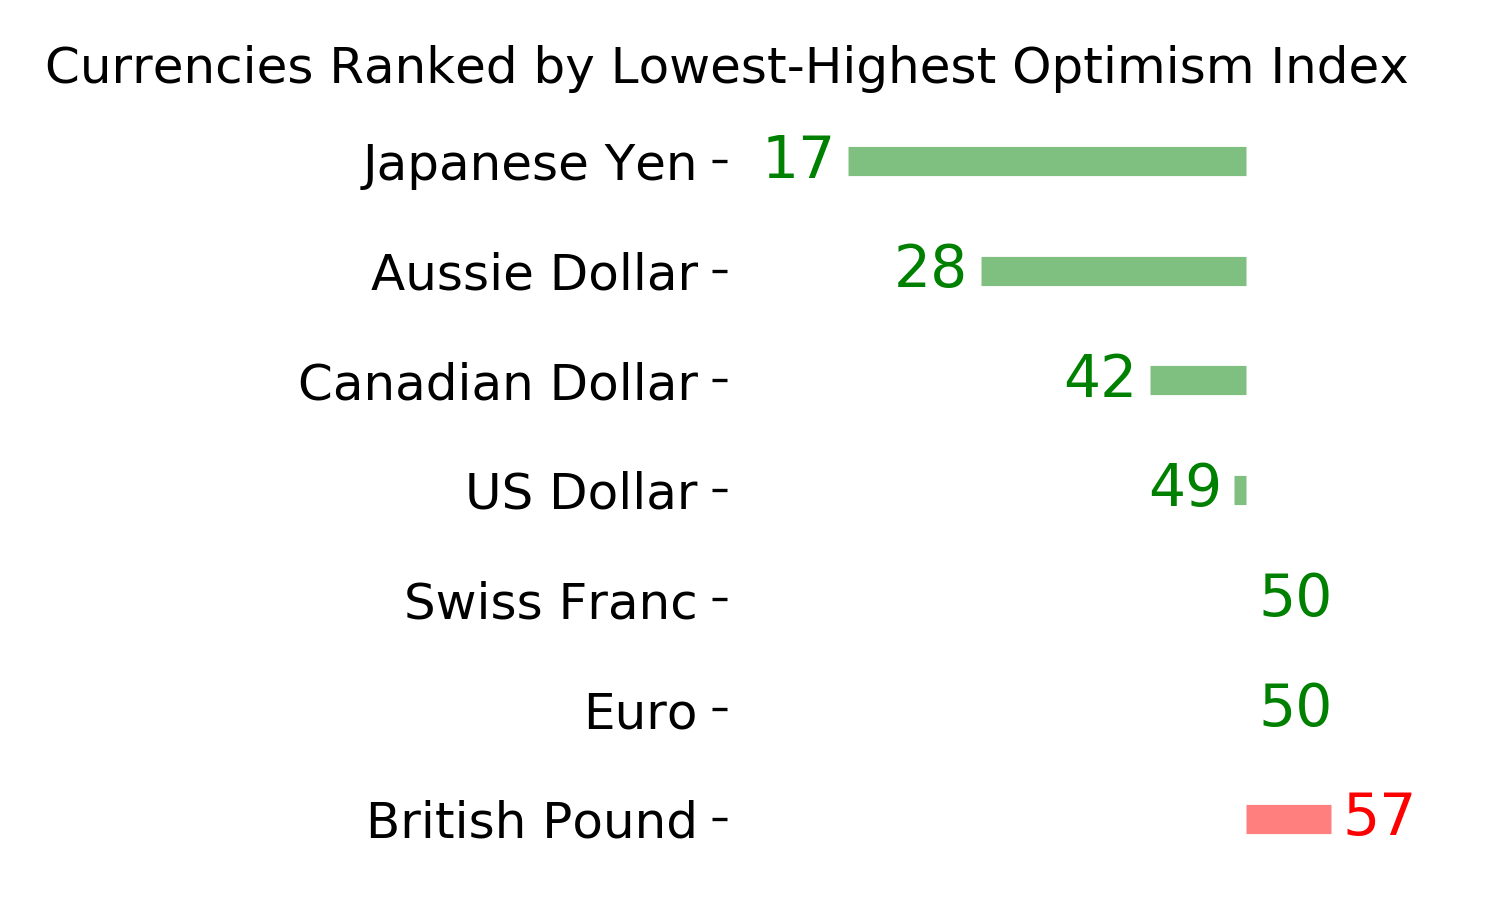
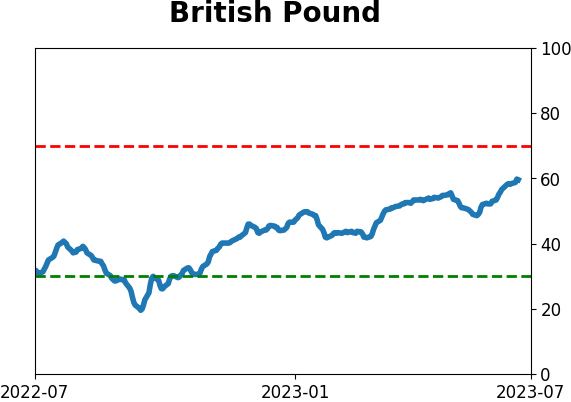
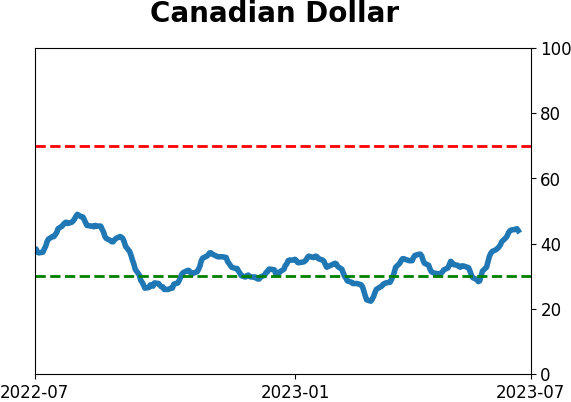
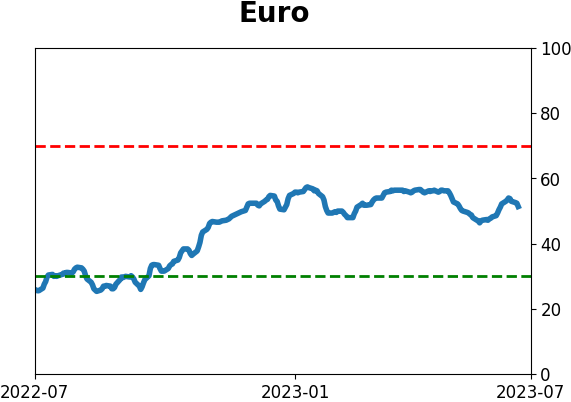
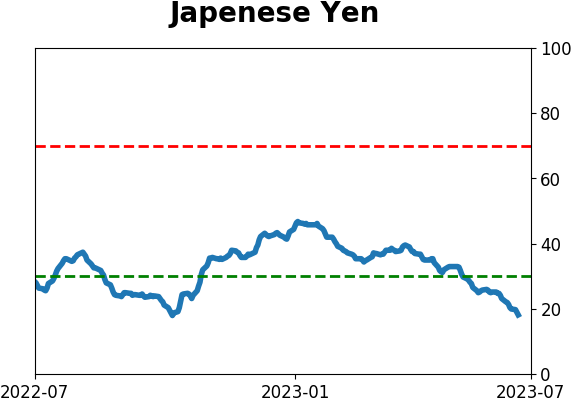
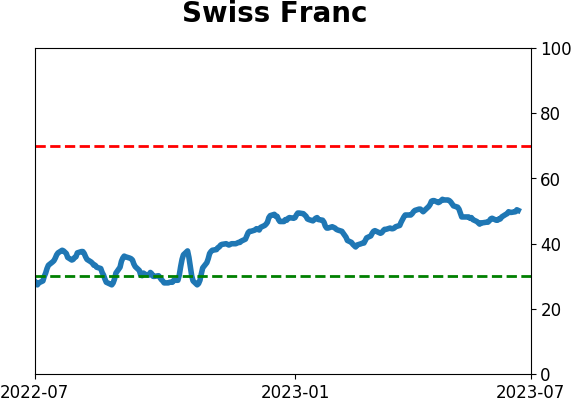
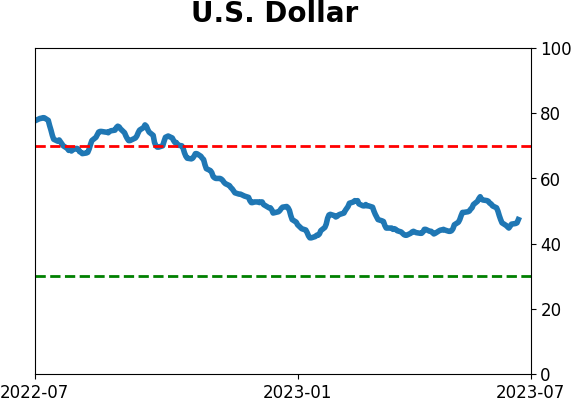
Currency ETF's - 5-Day Moving Average
|
|
|
Commodity ETF's - 5-Day Moving Average
|
|