Headlines
|
|
Correlations Between Factors Are Plunging:
The correlation between Growth and Value stocks has plunged to the lowest since 1928. The closest comparison was the year 2000, but there were many more less dramatic precedents. Other correlations are breaking down, too. These have been a better sign for one factor versus another rather than the broader stock market.
Bottom Line:
See the Outlook & Allocations page for more details on these summaries STOCKS: Hold
The speculative frenzy in February is wrung out. Internal dynamics have mostly held up, with some exceptions. Many of our studies still show a mixed to poor short-term view, with medium- and long-term ones turning more positive. BONDS: Hold
Various parts of the market got hit in March, with the lowest Bond Optimism Index we usually see during healthy environments. After a shaky couple of weeks, the broad bond market has modestly recovered. Not a big edge here either way. GOLD: Hold
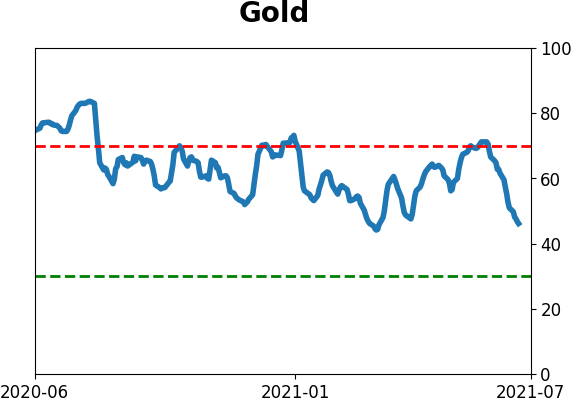
Gold and miners have done very well, recovering above long-term trend lines. The issue is that both have tended to perform poorly after similar situations - will have to wait and see how it plays out.
|
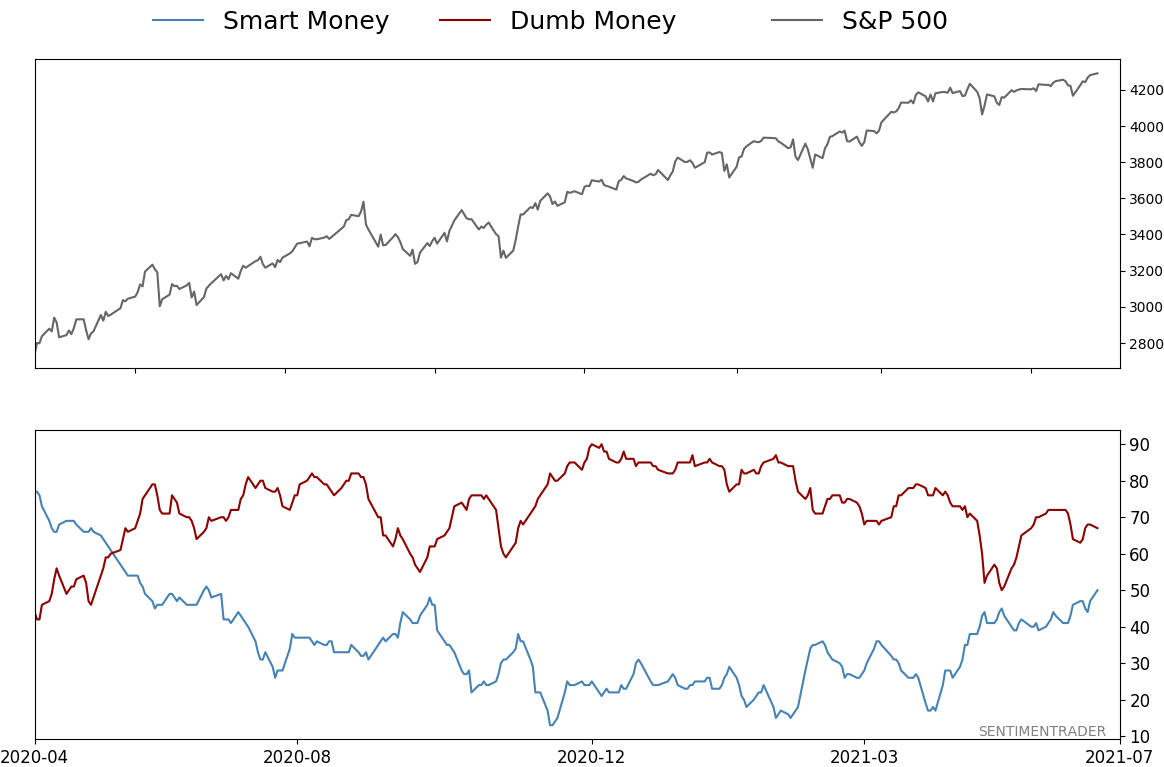
Smart / Dumb Money Confidence
|
Smart Money Confidence: 50%
Dumb Money Confidence: 67%
|
|
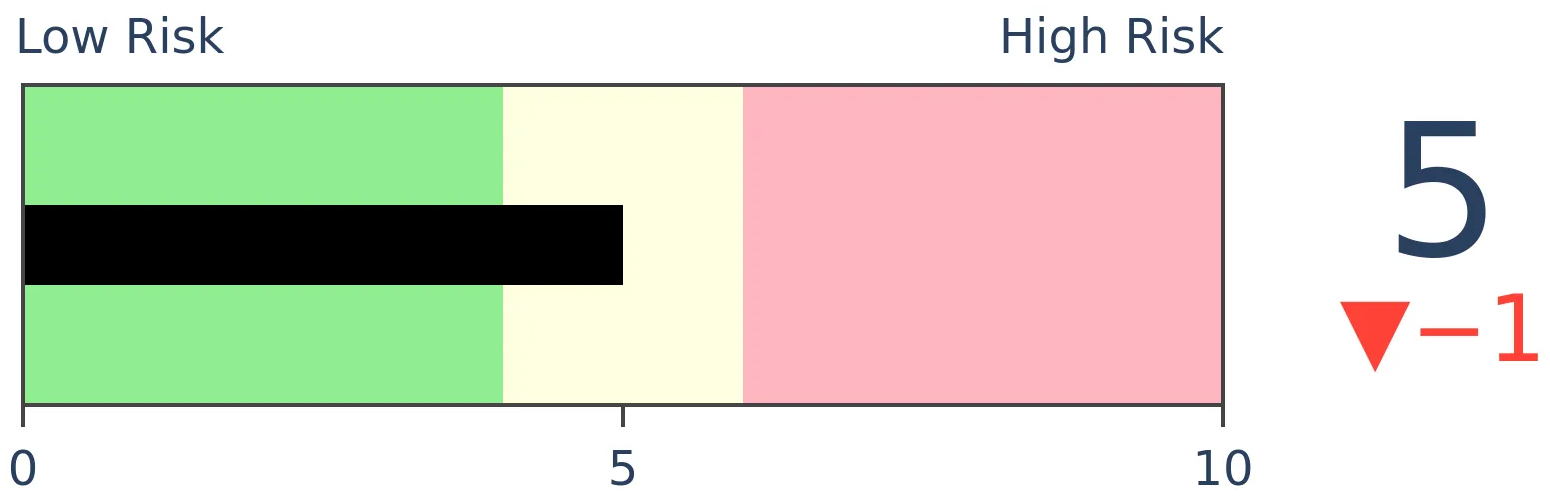
Risk Levels
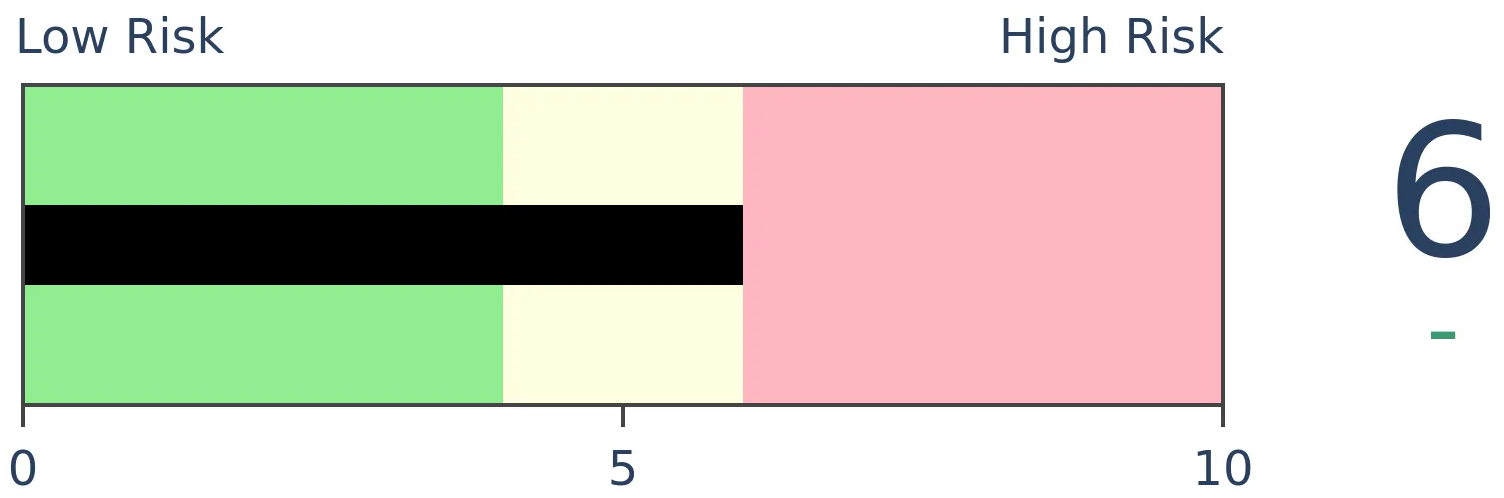
Stocks Short-Term
|
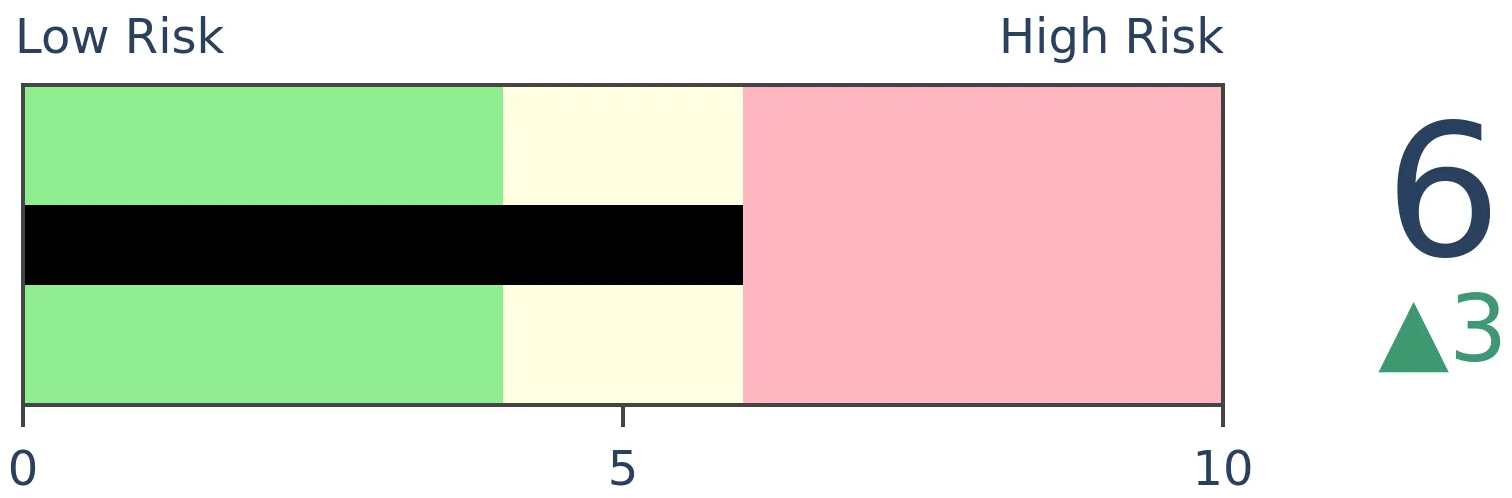
Stocks Medium-Term
|
|
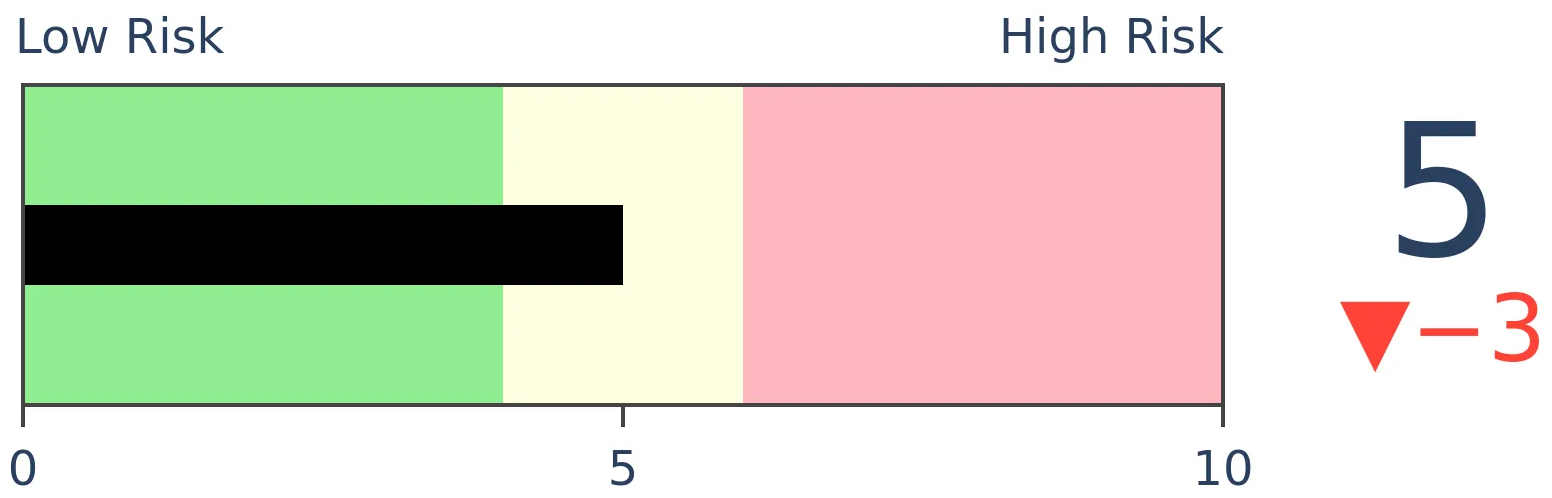
Bonds
|
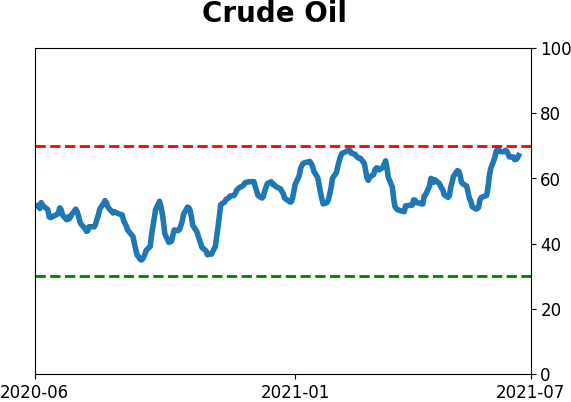
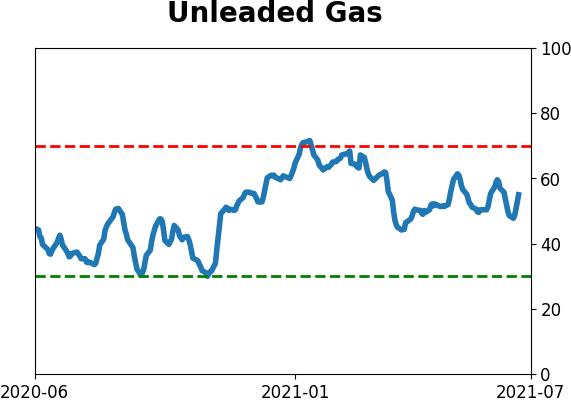
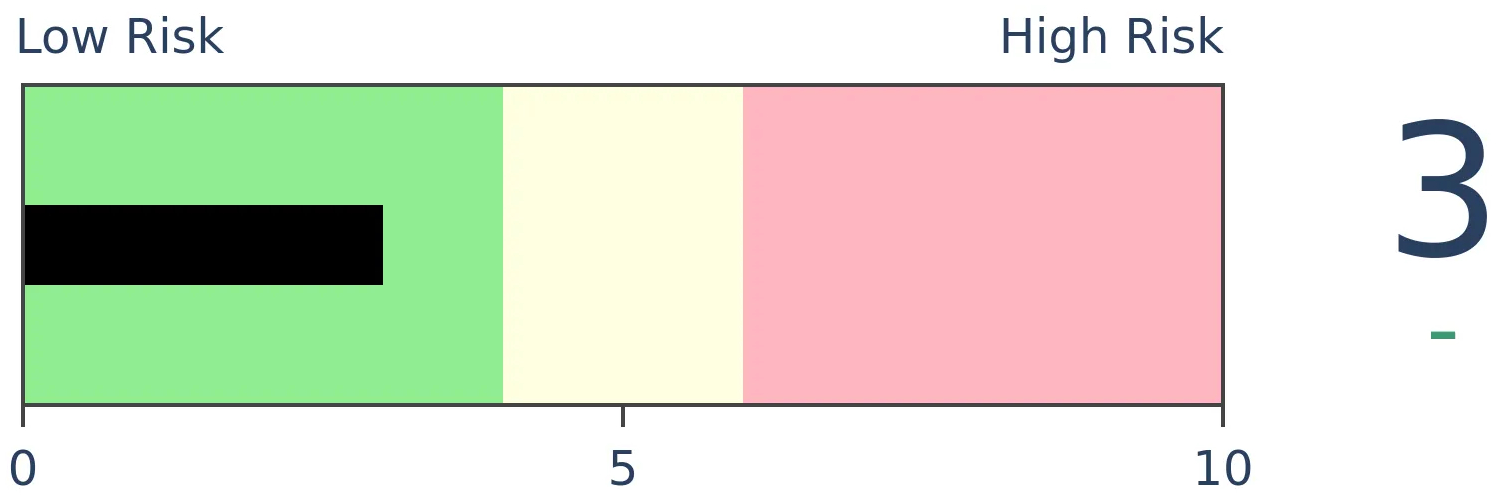
Crude Oil
|
|
Gold
|
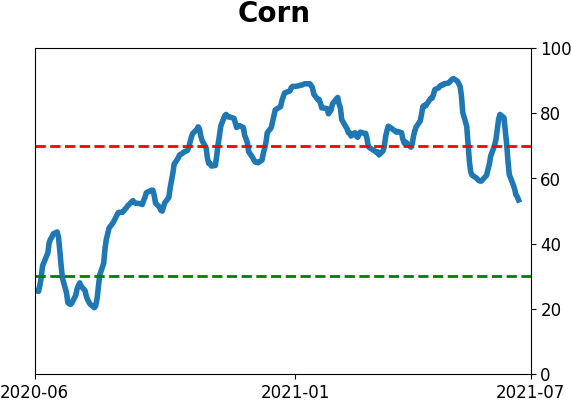
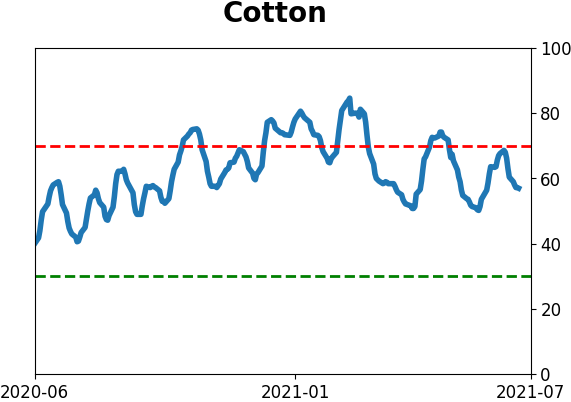
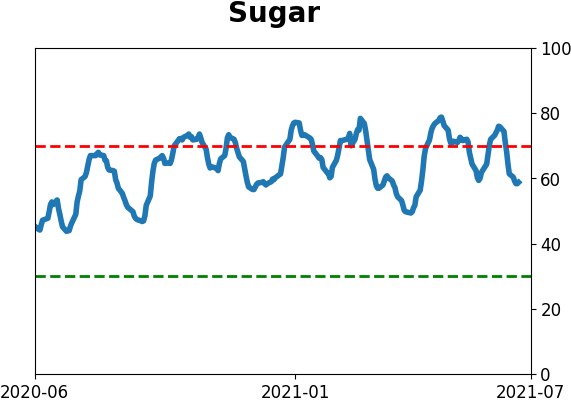
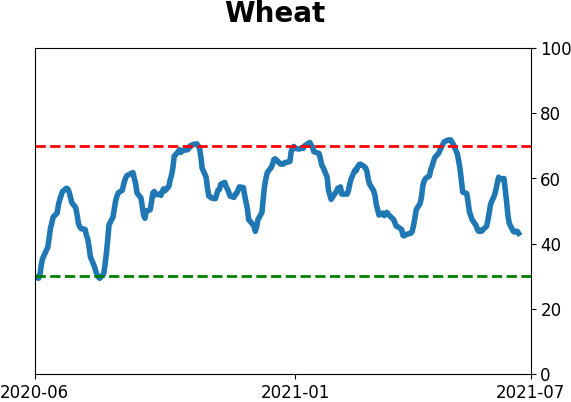
Agriculture
|
|
Research
BOTTOM LINE
The correlation between Growth and Value stocks has plunged to the lowest since 1928. The closest comparison was the year 2000, but there were many more less dramatic precedents. Other correlations are breaking down, too. These have been a better sign for one factor versus another rather than the broader stock market.
FORECAST / TIMEFRAME
None
|
This is just like the year 2000, and stocks are about to take a tumble.
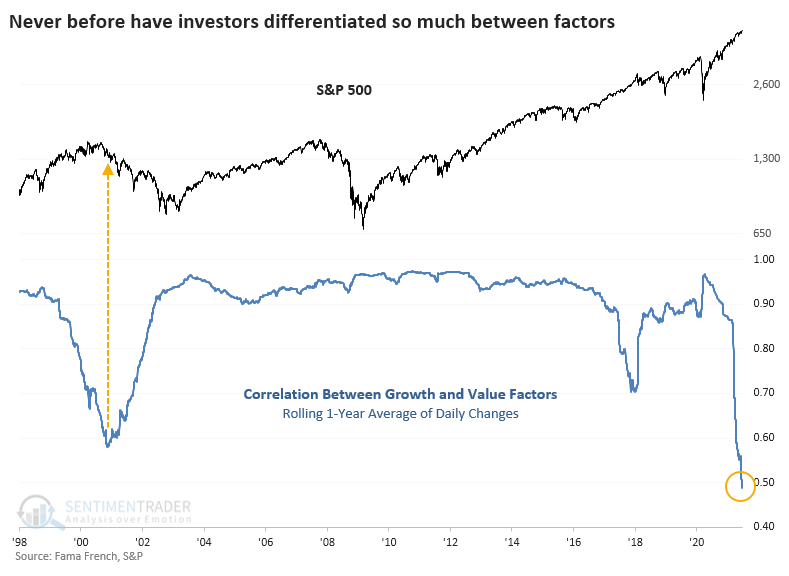
That's the implication from a chart that's being shared around trading desks, relating to the breakdown in correlation between Growth and Value stocks. If we look at a rolling 1-year correlation between daily percentage changes between those two factors, it's now at the lowest point since the pricking of the internet bubble.
In recent weeks, the correlation has plunged, exceeding the prior drop in early 2018. And if we're looking for scare tactics, we can conclude that stocks are about to crash. Full stop.
Theoretically, a bearish argument might make sense. If investors are so complacent about stocks that they don't exit, they just shift their assets from one sector or factor to another, then there really isn't much concern being priced in.
GETTING SOME PERSPECTIVE
Let's go back to 1928 and see if we can find any other periods that might have shown similar behavior.
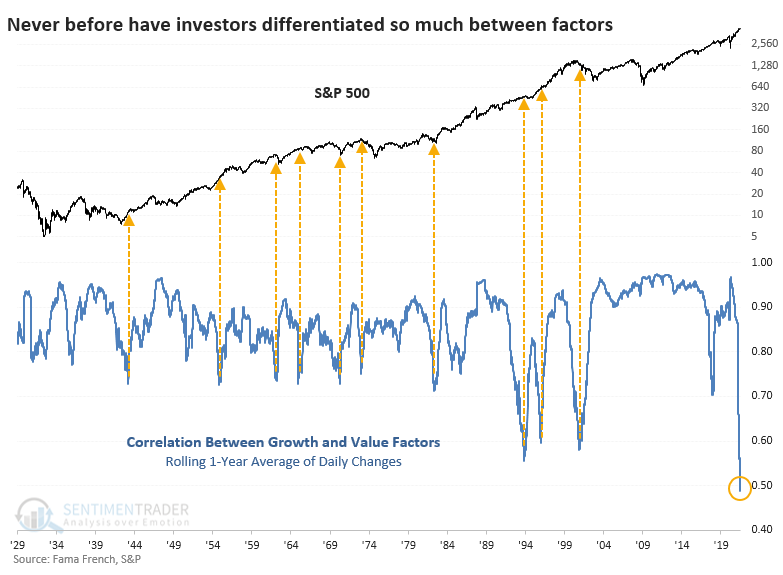
There weren't any, not really. The past year has seen the lowest correlation between Growth and Value in history. The 2000 scenario is scary, but it's also an outlier. The lowest 1-year correlation, besides the current one, occurred in 1993, before a mild recession and then one of the greatest bull runs in the history of all markets.
Lesser extremes in the correlation preceded a couple of bear markets, most notably in 1974. But they preceded even more rallies, including the birth of modern bull markets in 1982.
NOT A SELL SIGNAL, EXCEPT FOR GROWTH STOCKS
The table below shows longer-term future returns in the S&P 500 following any time when the correlation between Growth and Value factors dropped below 0.75 for the first time in at least a year.
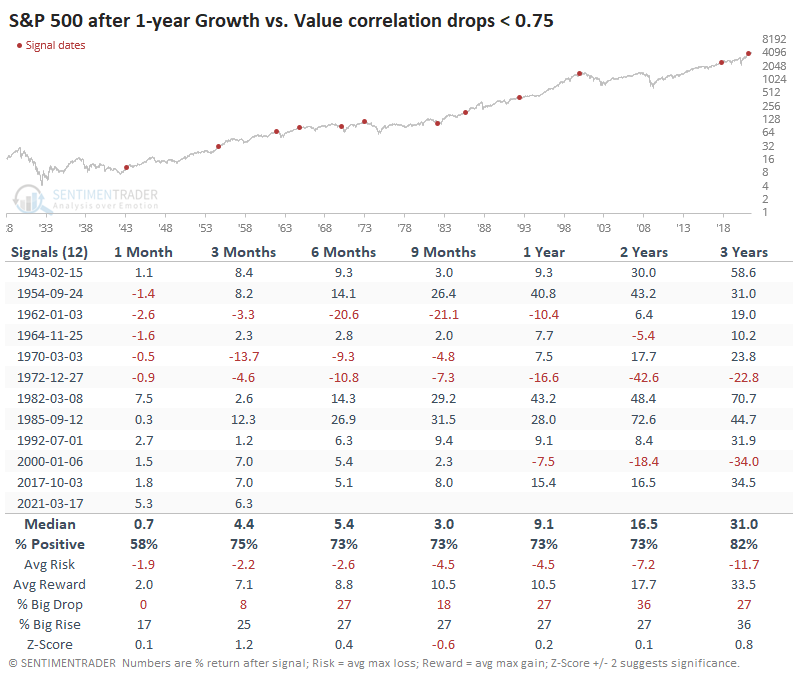
Clearly, it wasn't a consistent signal to become overly defensive about stocks in general. However, it was a good signal to become cautious about growth stocks over a longer time horizon.
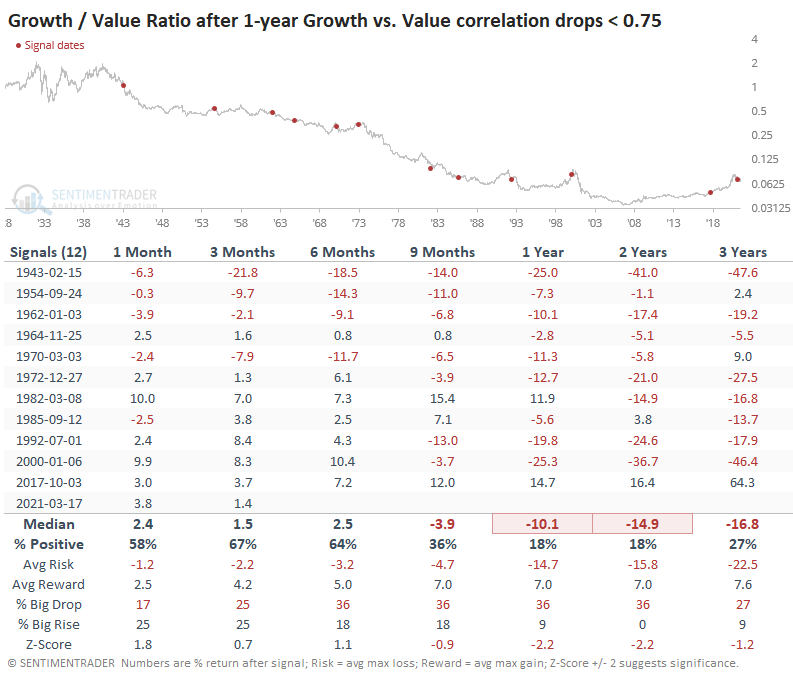
During the next 1-2 years, Growth stocks underperformed Value stocks after 10 out of 12 signals, and the last signal in 2017 was really the only sustained exception to this.
There were surprisingly large returns in Discretionary and Technology stocks, which is surprising given the above table. But overall, Value stocks showed higher returns.
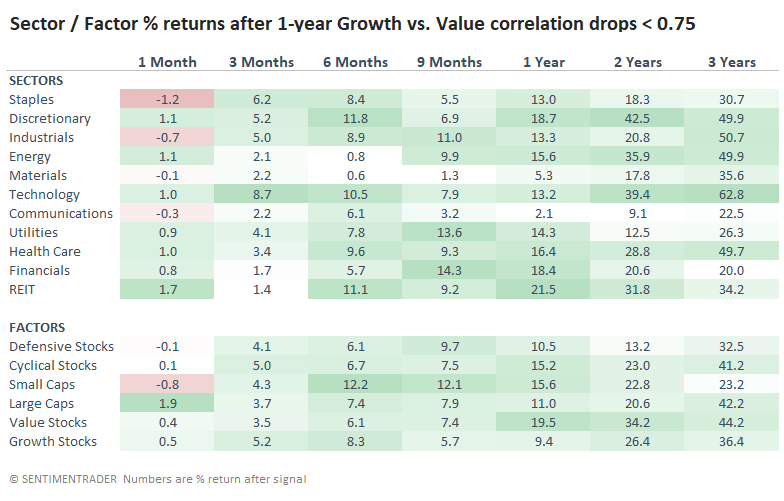
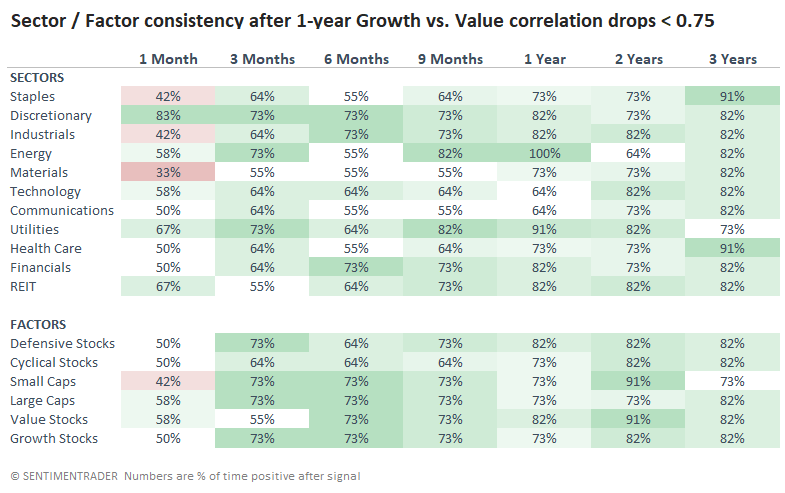
But the most consistently positive sectors included Energy and Utilities.
OTHER CORRELATIONS ARE BREAKING DOWN, TOO
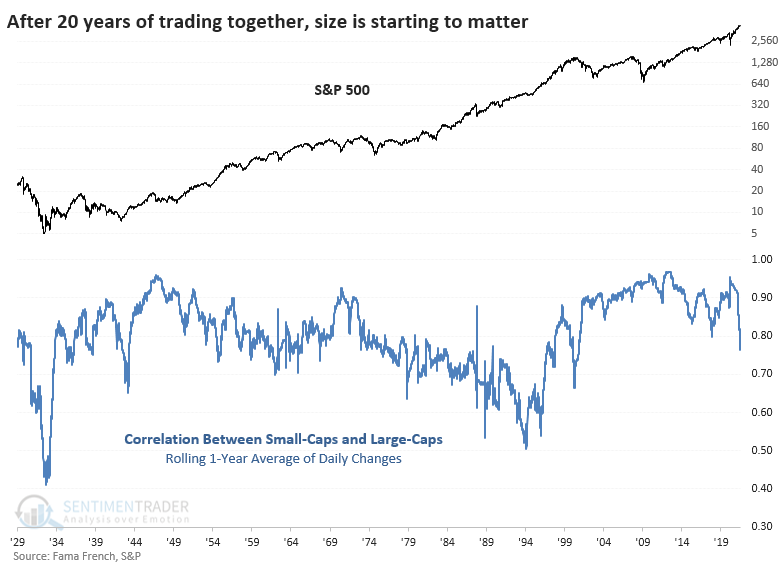
When we look at correlations between other factors, we can see that things are starting to break down suddenly, meaning that sectors, factors, and stocks are trading on their own merits rather than as a whole.
The correlation between Small-Cap and Large-Cap stocks is the lowest in 20 years. As a predictor, though, it's hard to see anything.
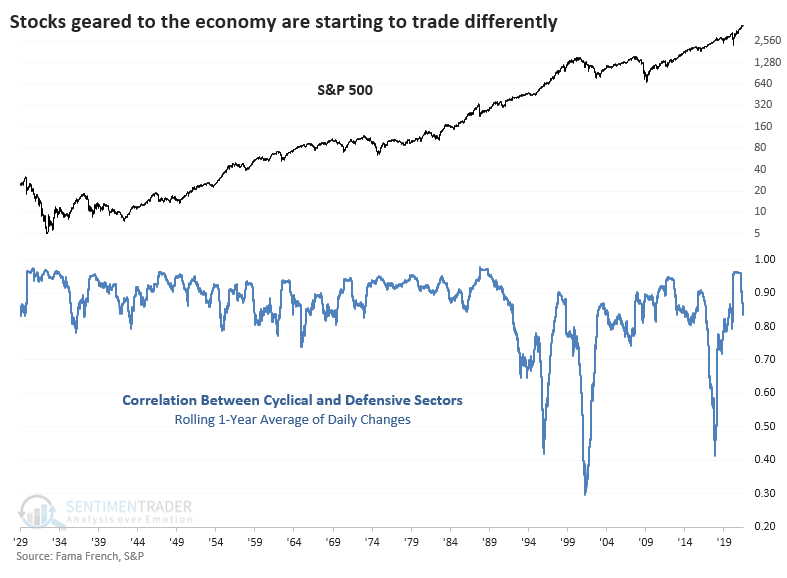
The same goes for Cyclical versus Defensive factors. The lowest correlation ever recorded was during 2000 - 2001, then in late 2017, but currently, that correlation is just starting to turn down in earnest after being the highest in over 30 years.
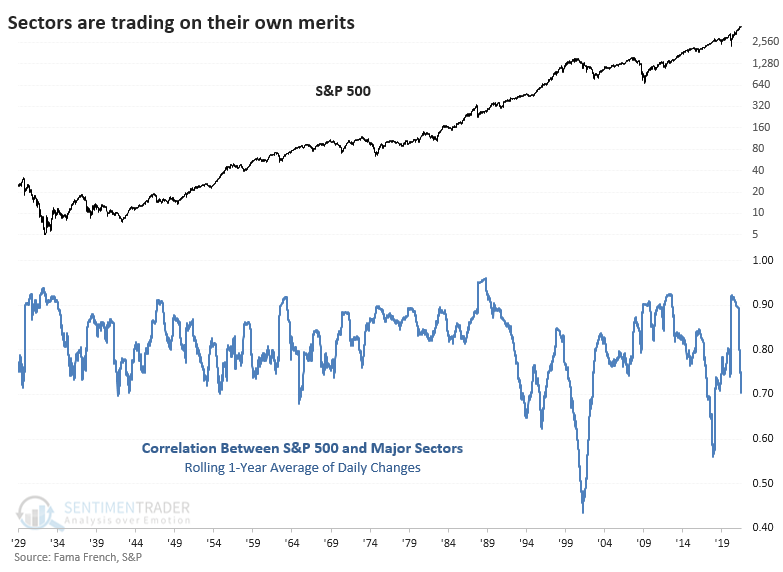
The average correlation between the S&P 500 index and each of its major sectors is 0.70, again coming on the heels of what had been an extremely high correlation in the aftermath of the pandemic. This brings up a couple of disturbing precedents like 2000 and 2018 but also historic bull markets like the mid-1990s. Not much to read into here.
When we look at the breakdowns in some of the correlations between factors, some recent disturbing comparisons pop up. Everyone likes to point to the top of the 1999 - 2000 bubble, and certainly, there are some valid comparisons to that time period when it comes to sentiment and even some fundamental metrics.
However, it's not by any means an exact roadmap, and we'd caution against relying on it too heavily, especially since we haven't yet seen consistent internal deterioration. Trading late last week showed some signs of that, but we need more evidence. When it comes to these correlation breakdowns, the most we could confidently suggest is that it's probably a bad sign for Growth versus Value stocks, and a tilt toward the latter has some good historical backing.
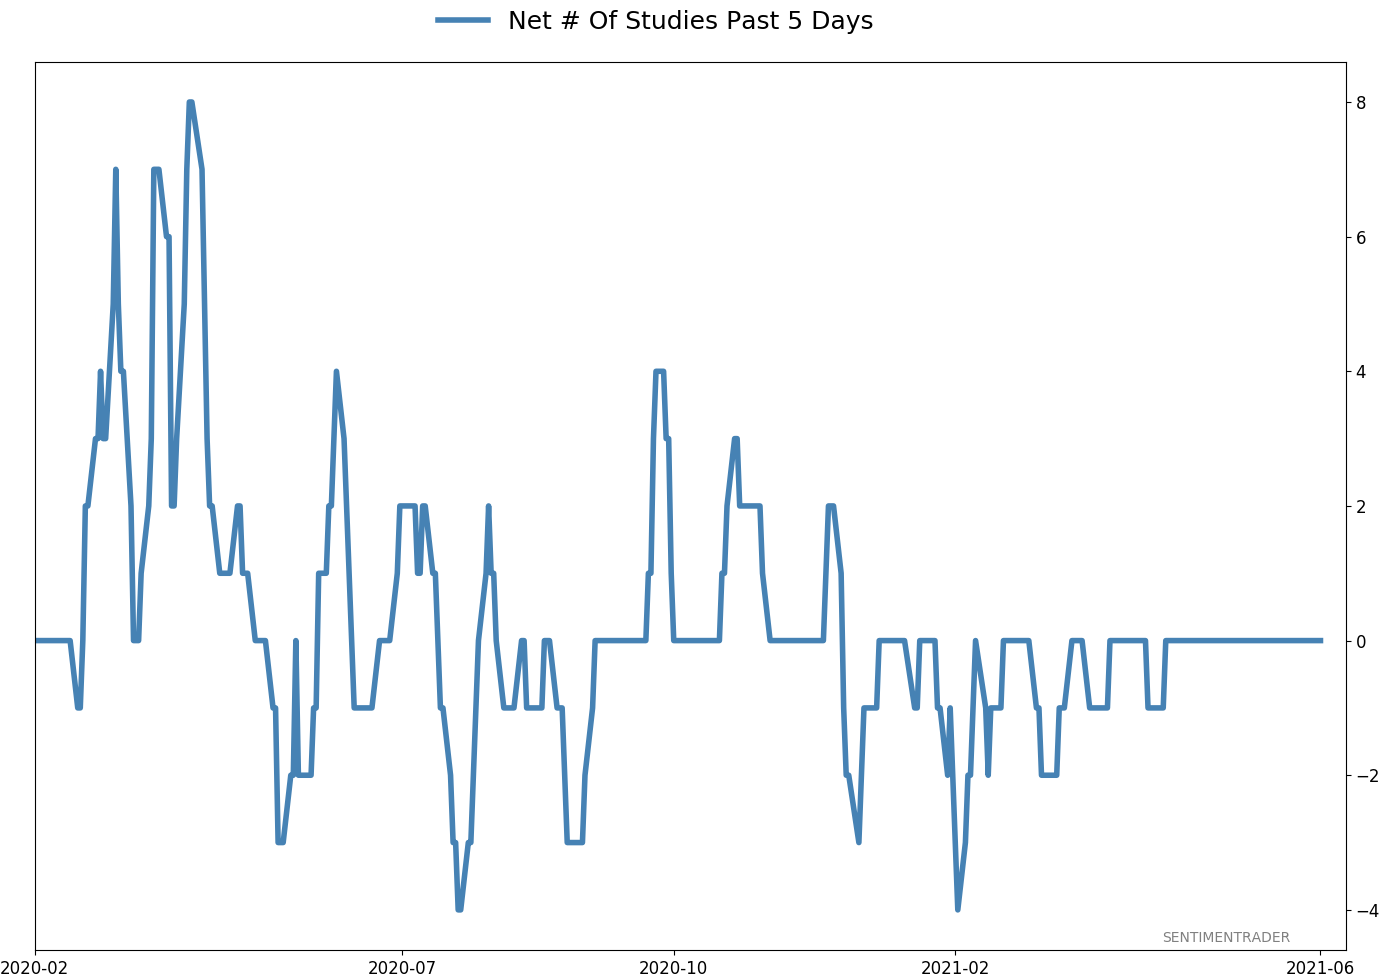
Active Studies
| Time Frame | Bullish | Bearish | | Short-Term | 0 | 1 | | Medium-Term | 2 | 2 | | Long-Term | 8 | 5 |
|
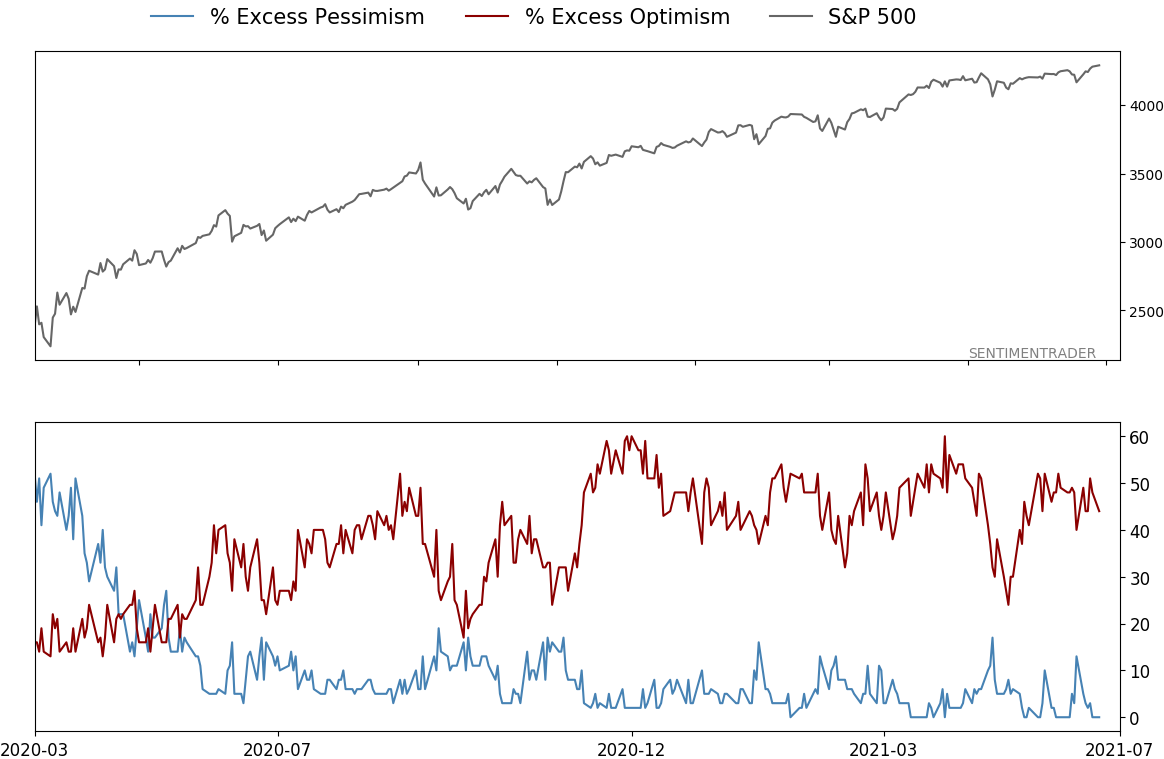
Indicators at Extremes
|
% Showing Pessimism: 0%
Bullish for Stocks
|
|
Portfolio
| Position | Description | Weight % | Added / Reduced | Date | | Stocks | RSP | 4.1 | Added 4.1% | 2021-05-19 | | Bonds | 23.9% BND, 6.9% SCHP | 30.7 | Reduced 7.1% | 2021-05-19 | | Commodities | GCC | 2.6 | Reduced 2.1%
| 2020-09-04 | | Precious Metals | GDX | 5.6 | Reduced 4.2% | 2021-05-19 | | Special Situations | 4.3% XLE, 2.2% PSCE | 7.6 | Reduced 5.6% | 2021-04-22 | | Cash | | 49.4 | | |
|
Updates (Changes made today are underlined)
Much of our momentum and trend work has remained positive for several months, with some scattered exceptions. Almost all sentiment-related work has shown a poor risk/reward ratio for stocks, especially as speculation drove to record highs in exuberance in February. Much of that has worn off, and most of our models are back toward neutral levels. There isn't much to be excited about here. The same goes for bonds and even gold. Gold has been performing well lately and is back above long-term trend lines. The issue is that it has a poor record of holding onto gains when attempting a long-term trend change like this, so we'll take a wait-and-see approach. RETURN YTD: 9.2% 2020: 8.1%, 2019: 12.6%, 2018: 0.6%, 2017: 3.8%, 2016: 17.1%, 2015: 9.2%, 2014: 14.5%, 2013: 2.2%, 2012: 10.8%, 2011: 16.5%, 2010: 15.3%, 2009: 23.9%, 2008: 16.2%, 2007: 7.8%
|
|
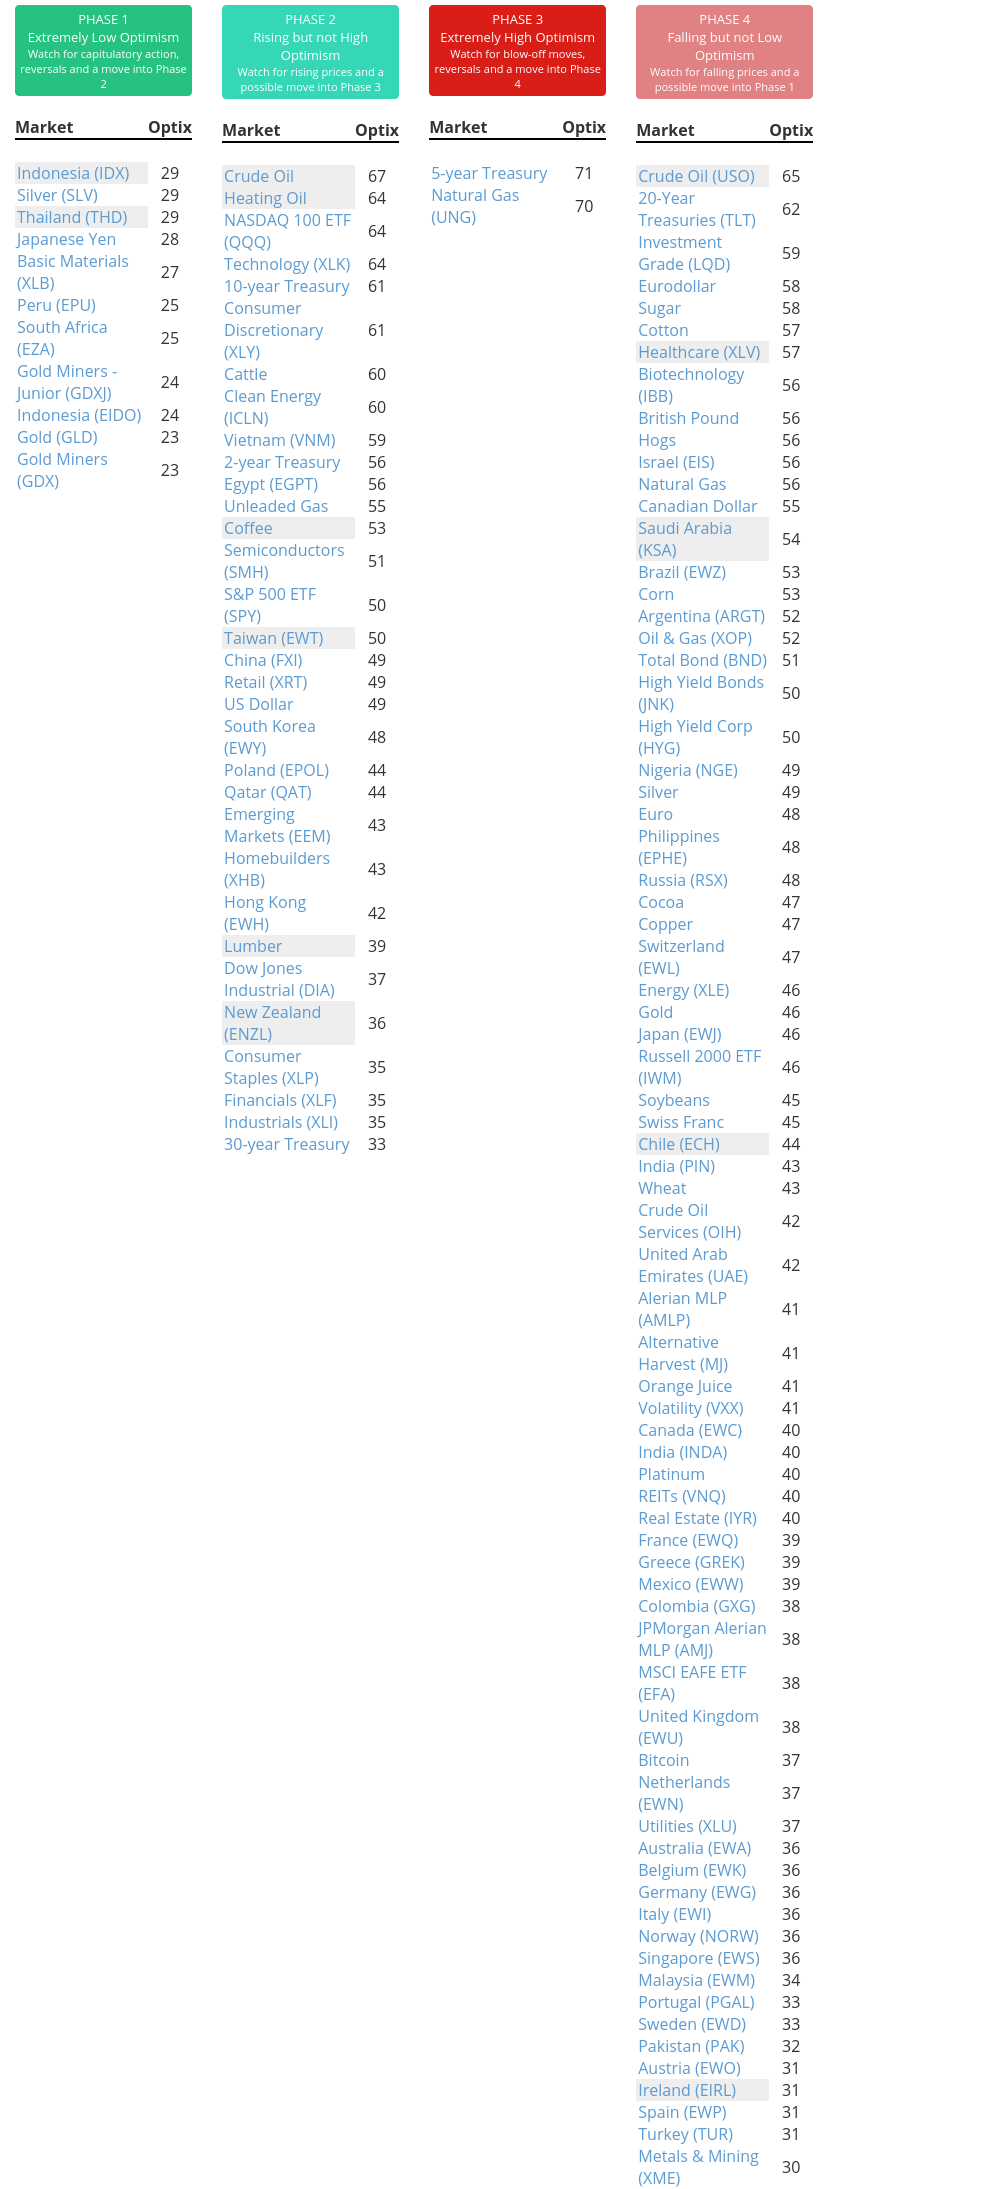
Phase Table
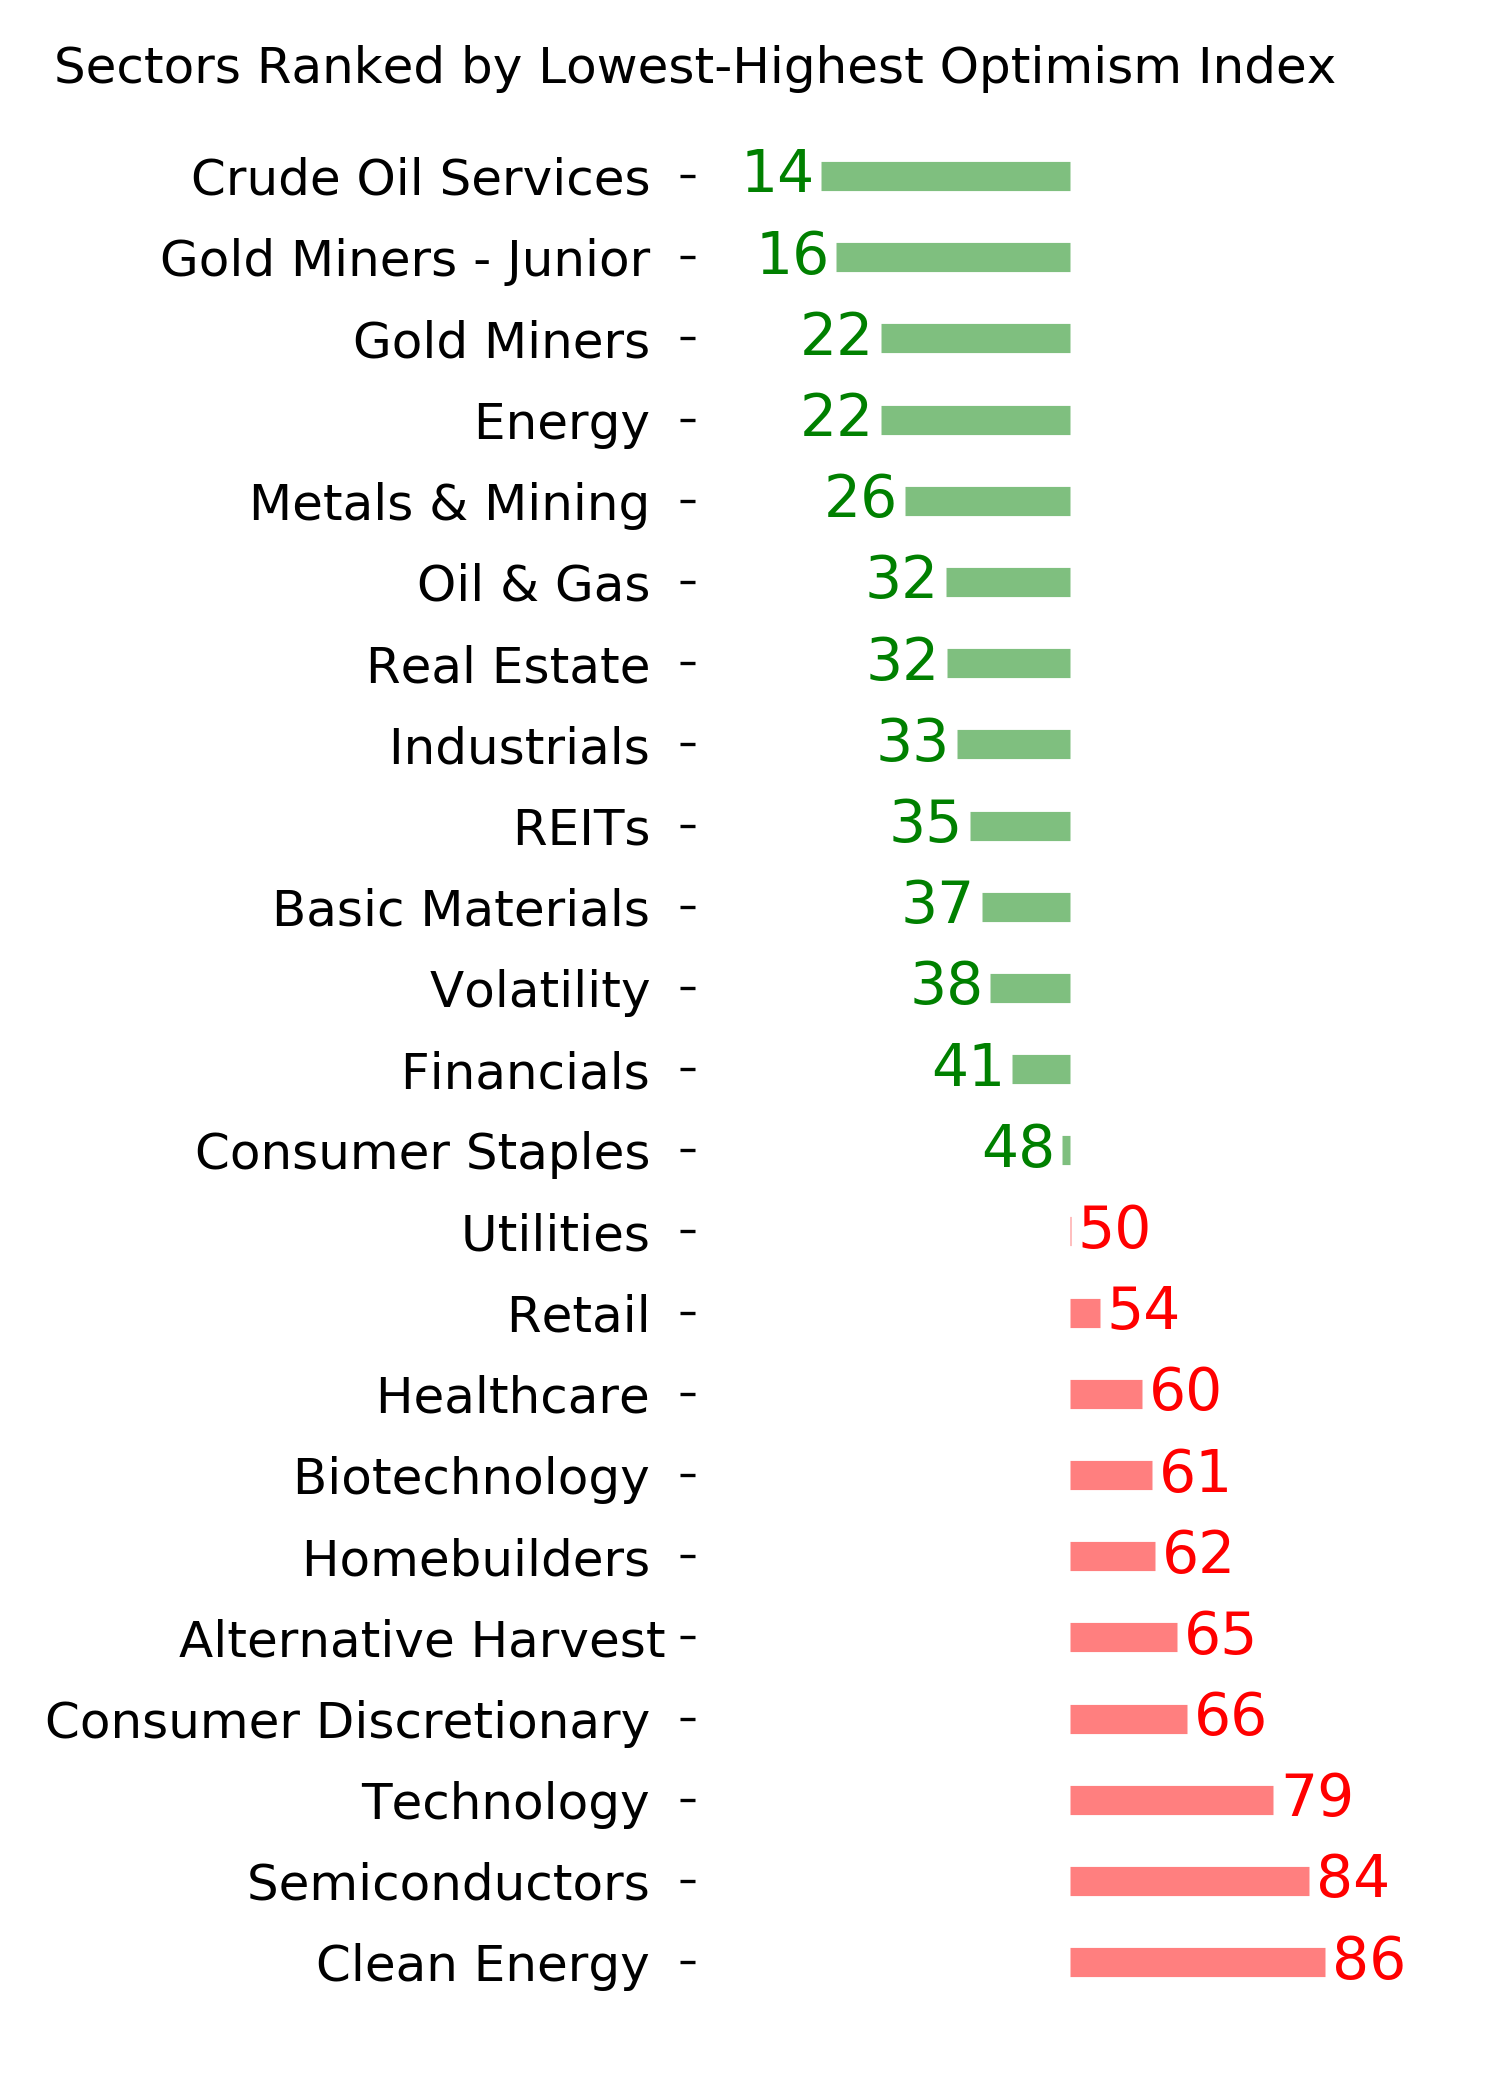
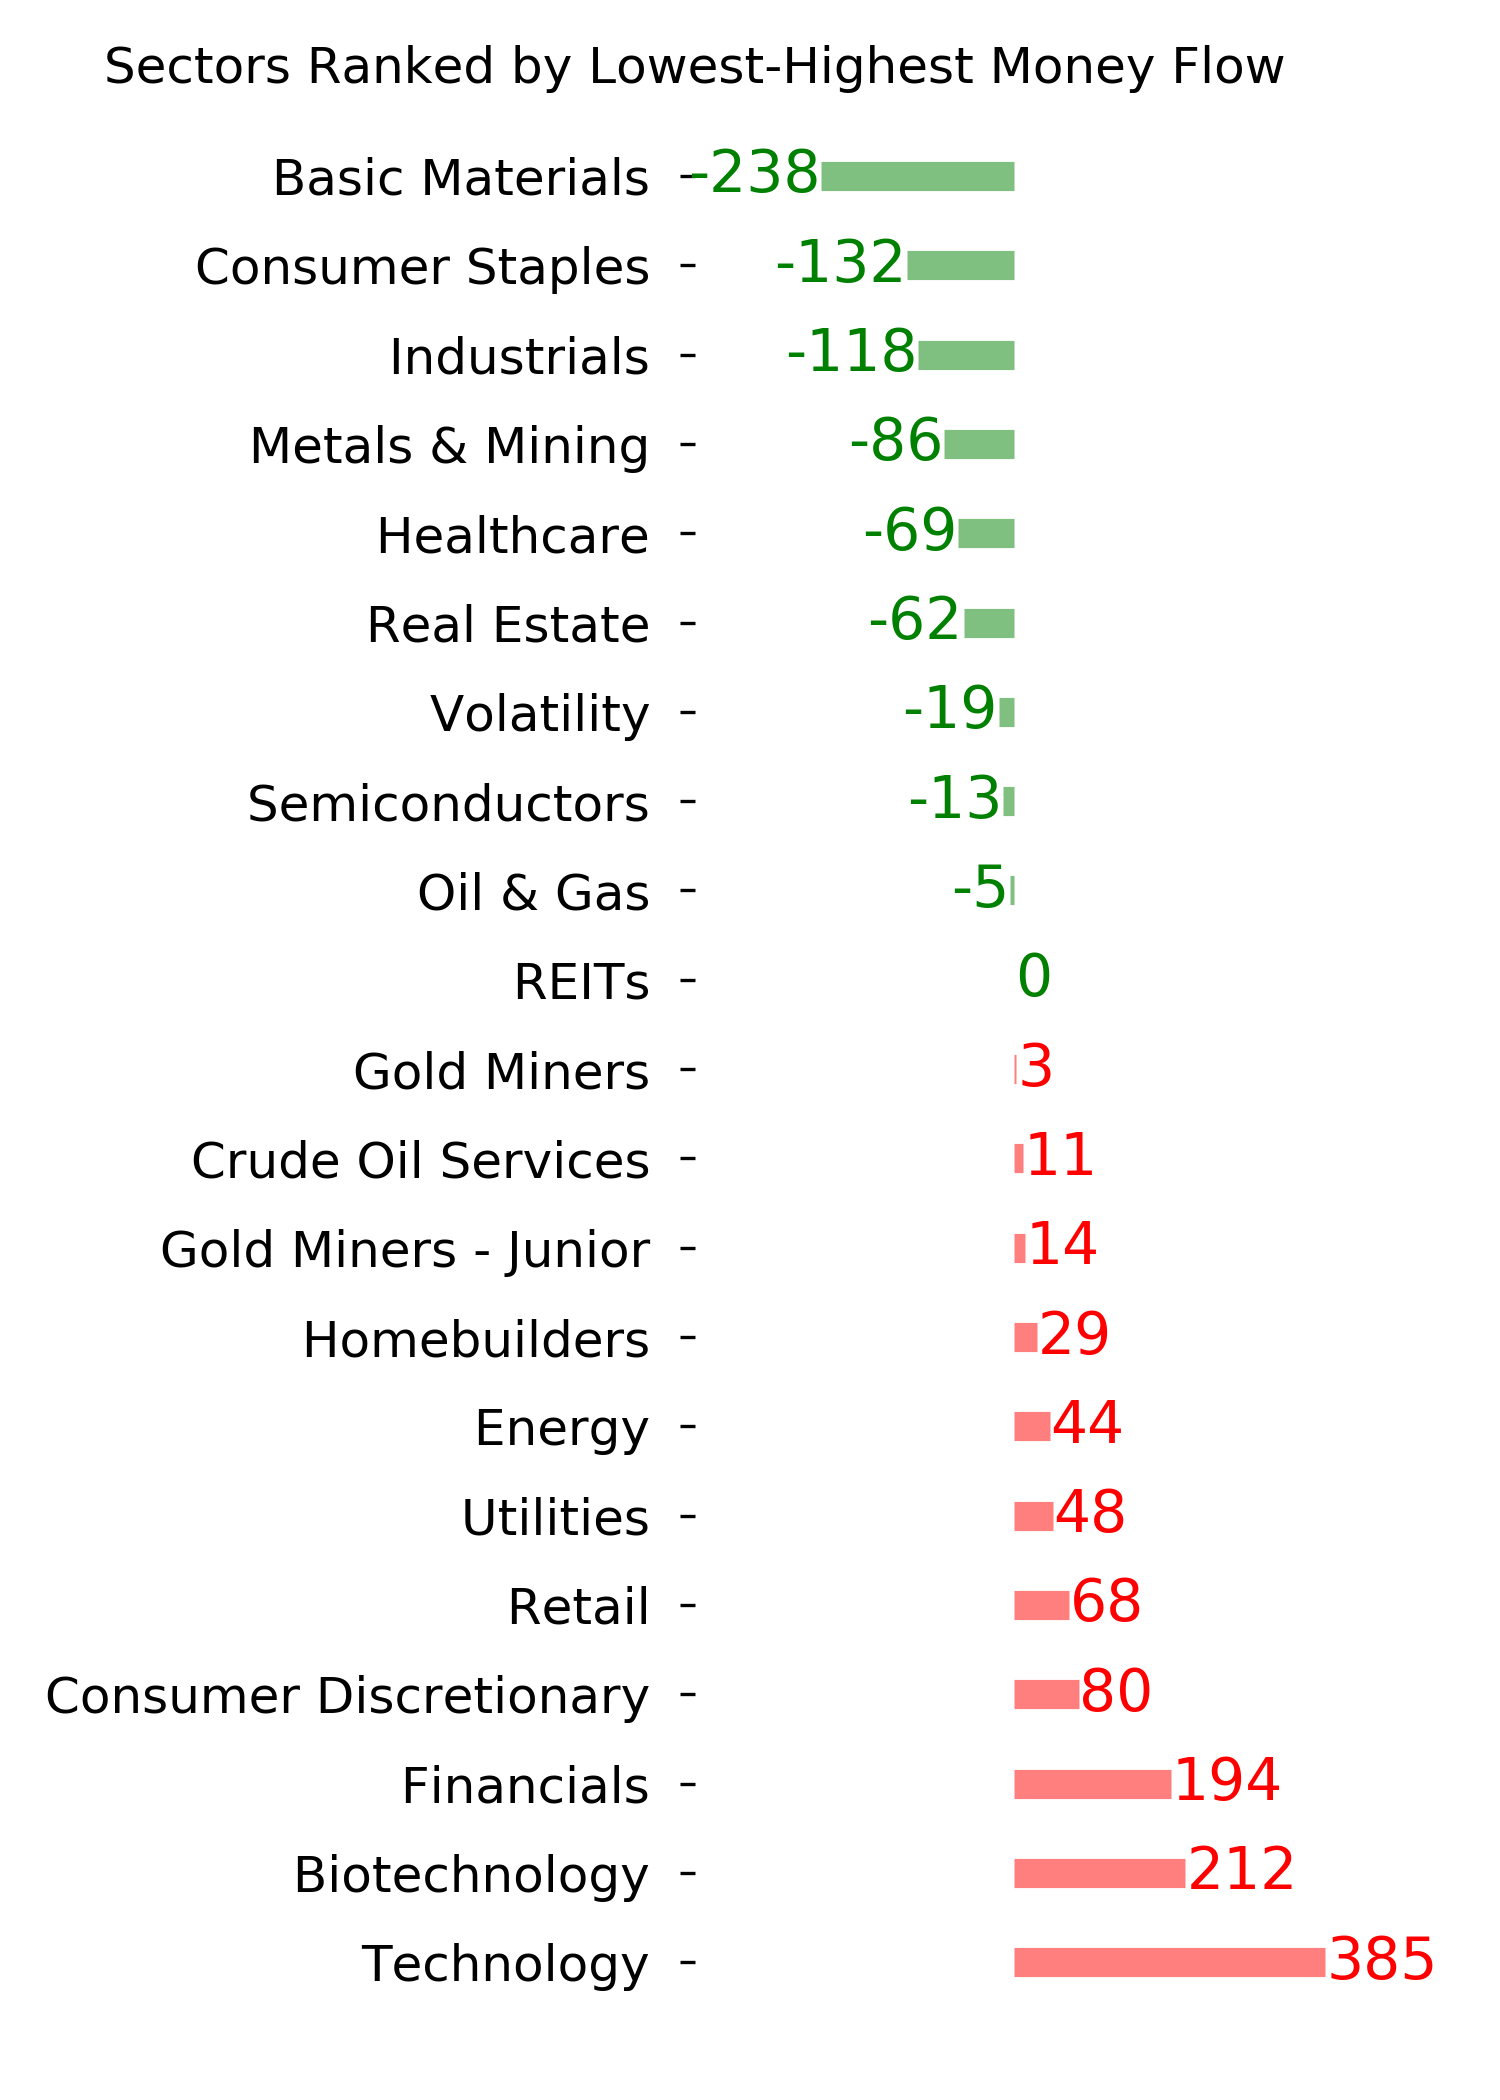
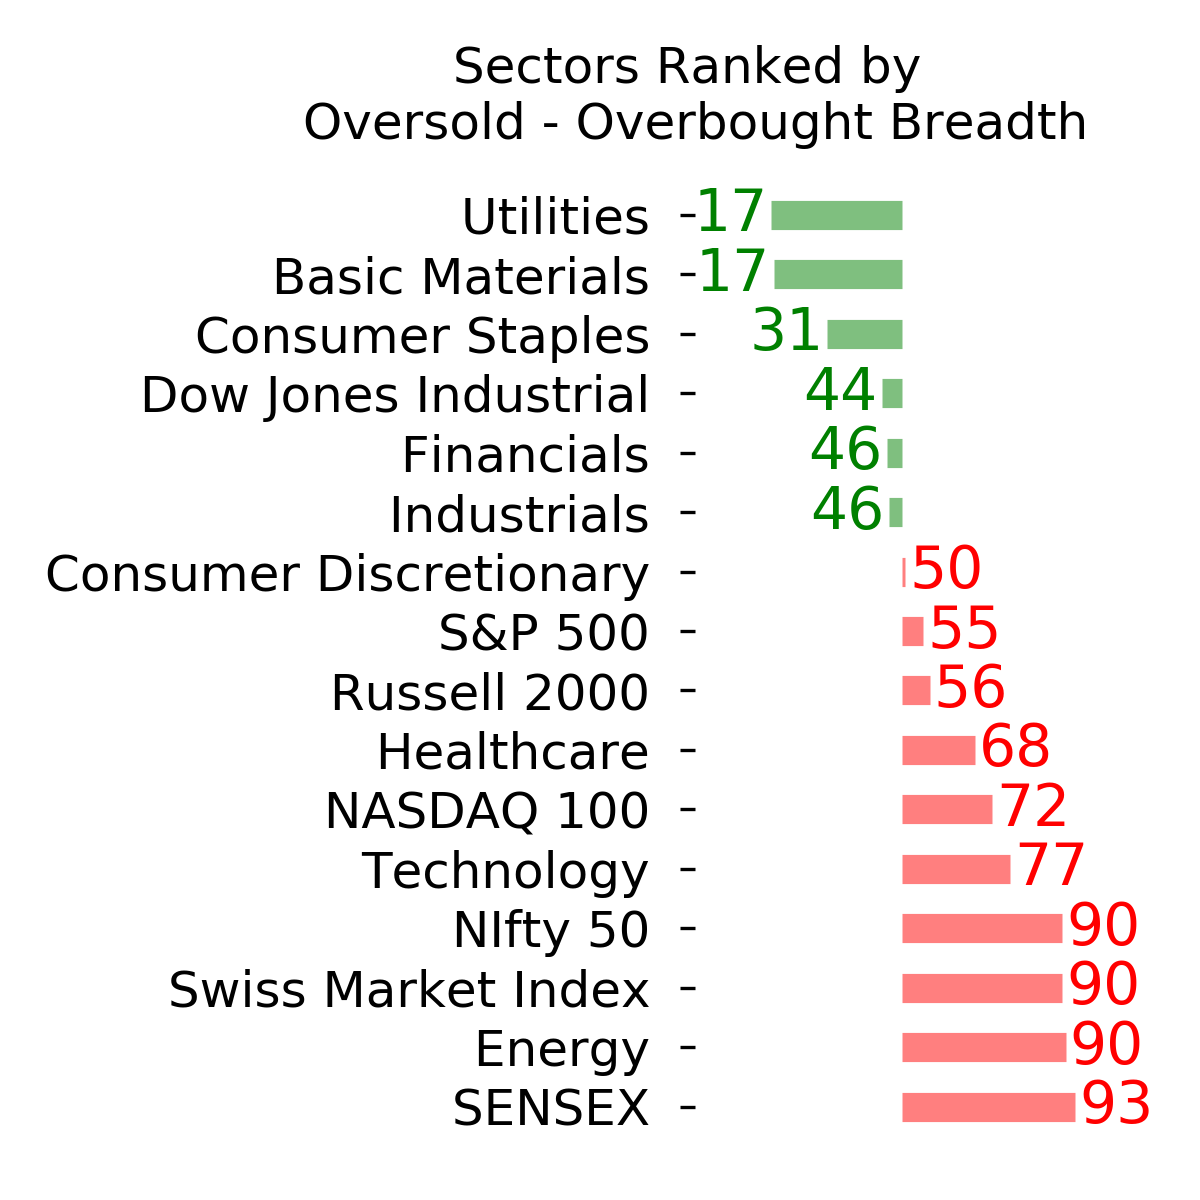
Ranks
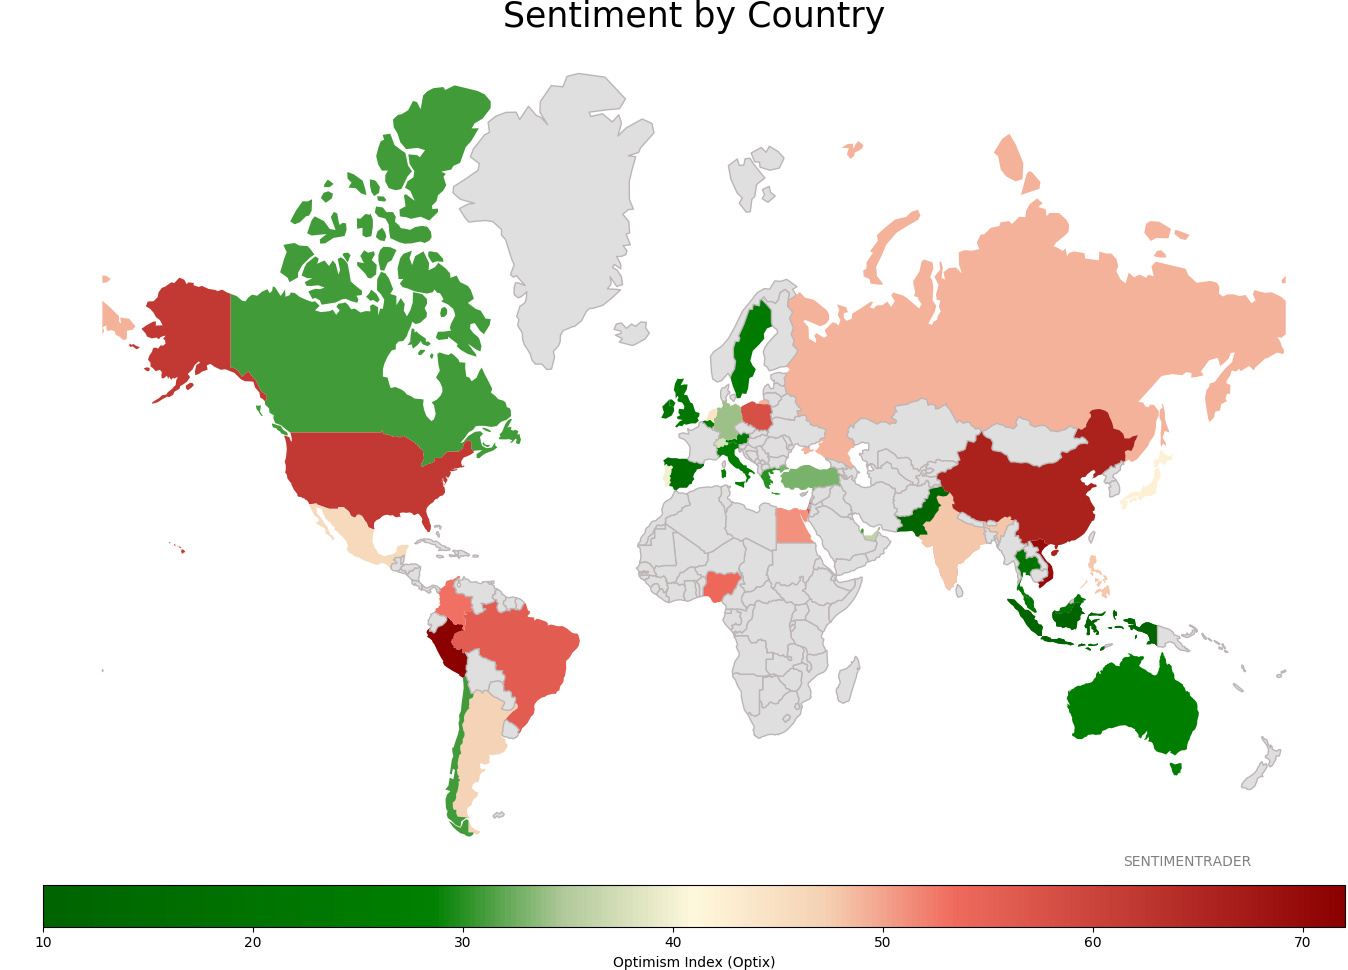
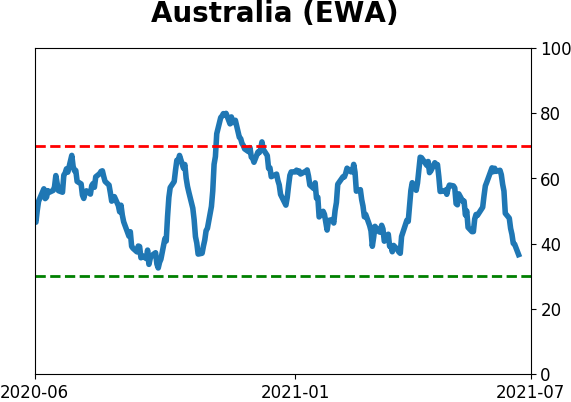
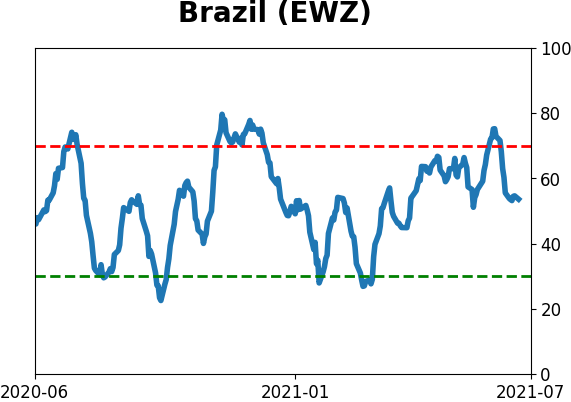
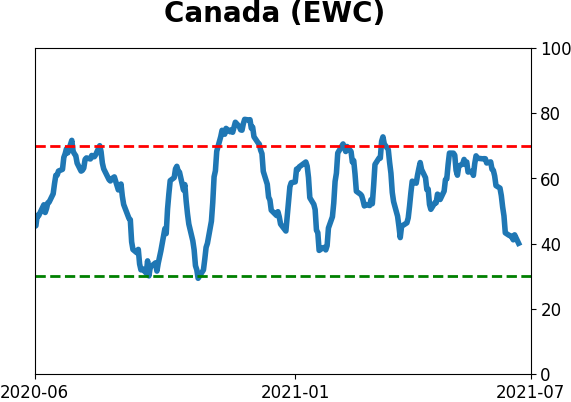
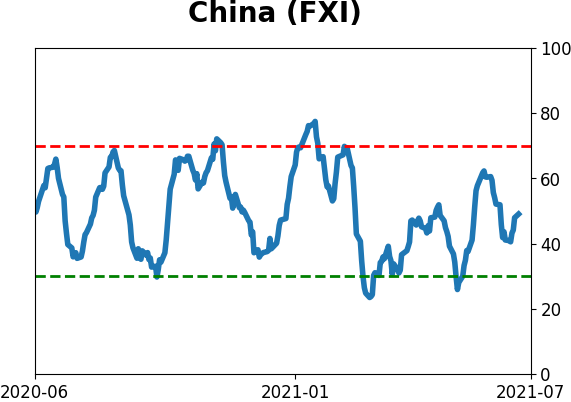
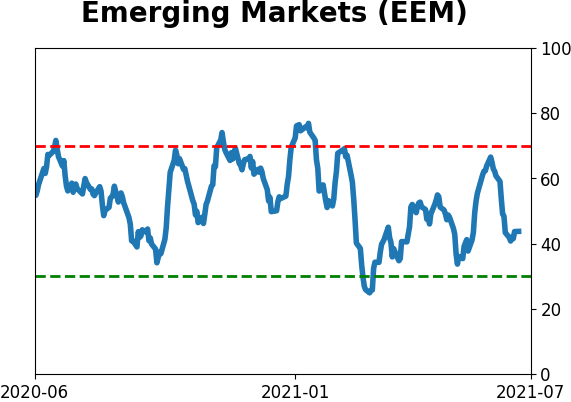
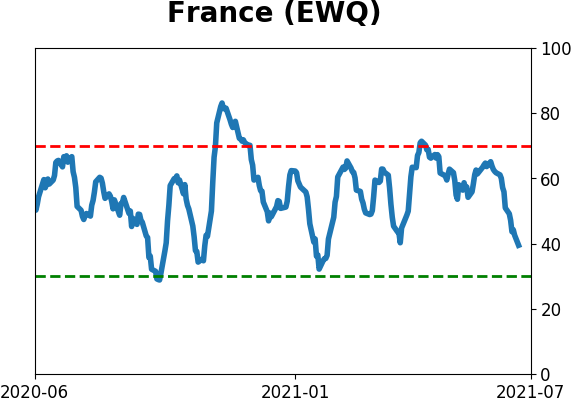
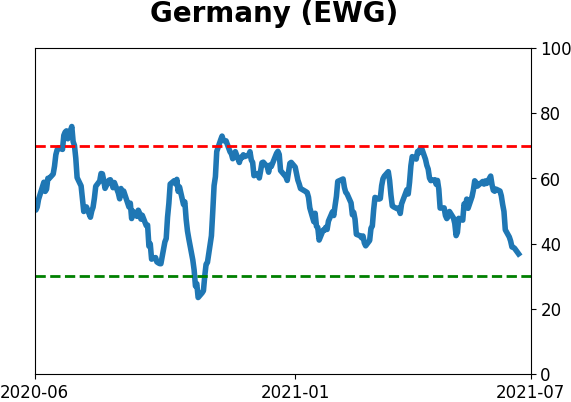
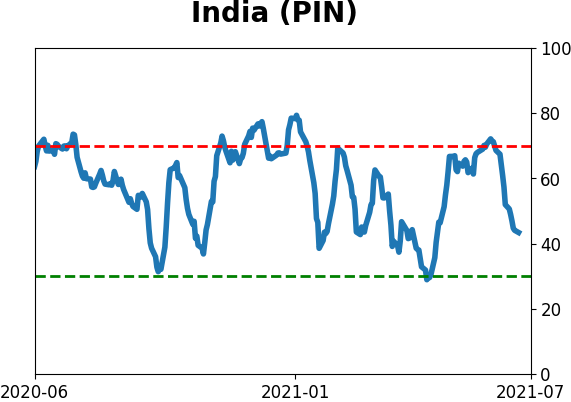
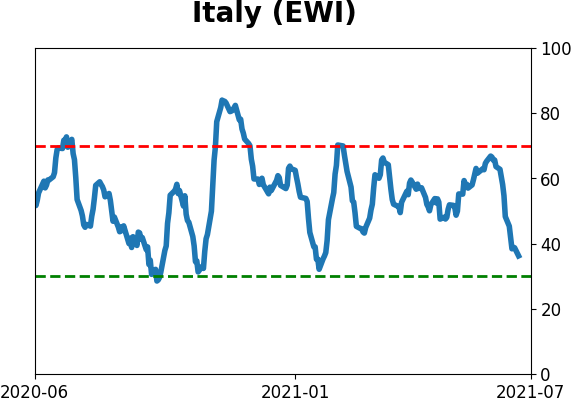
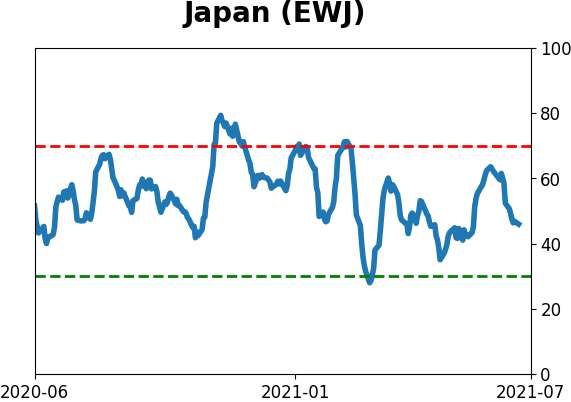
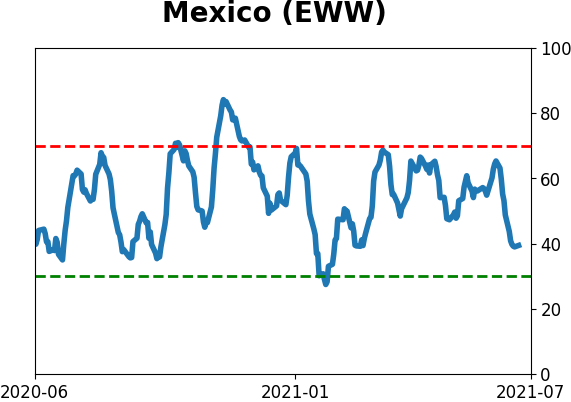
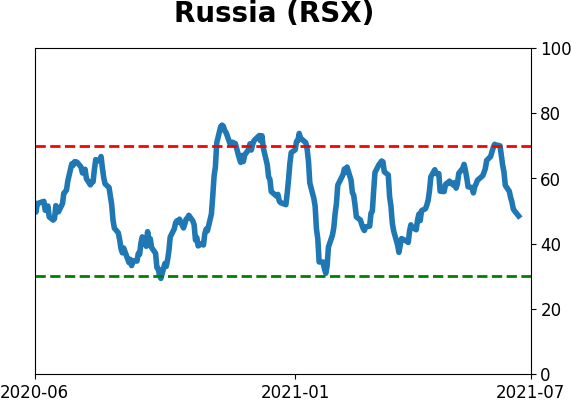
Sentiment Around The World
Optimism Index Thumbnails
|
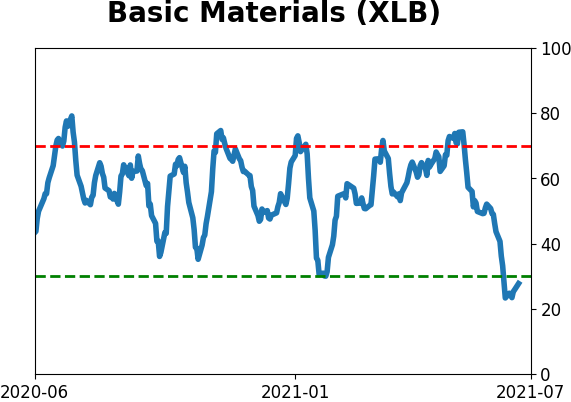
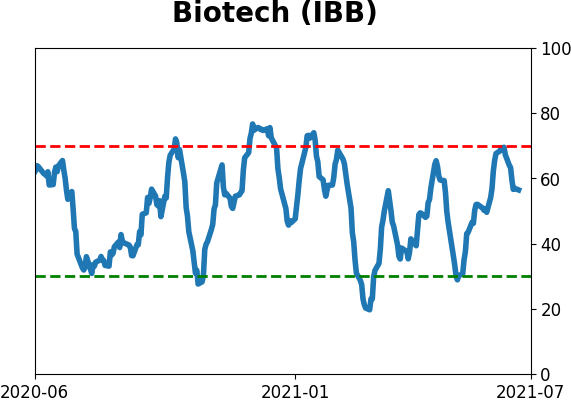
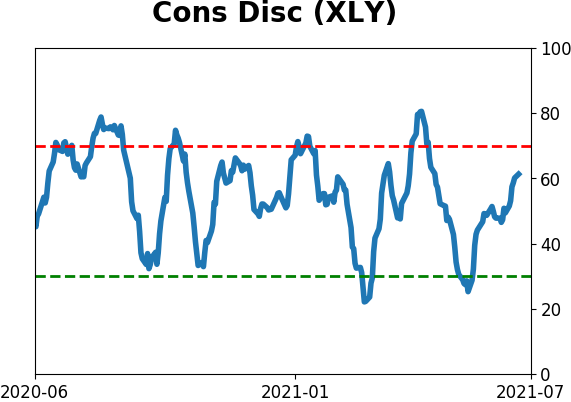
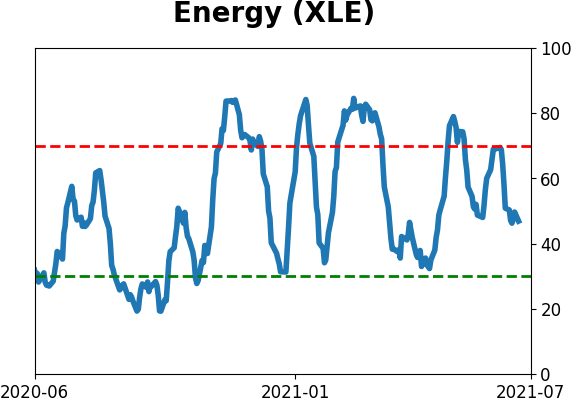
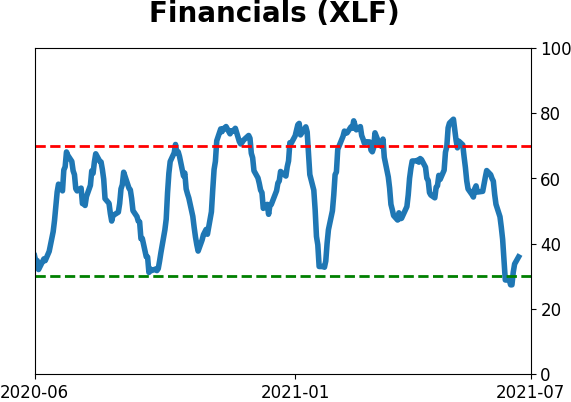
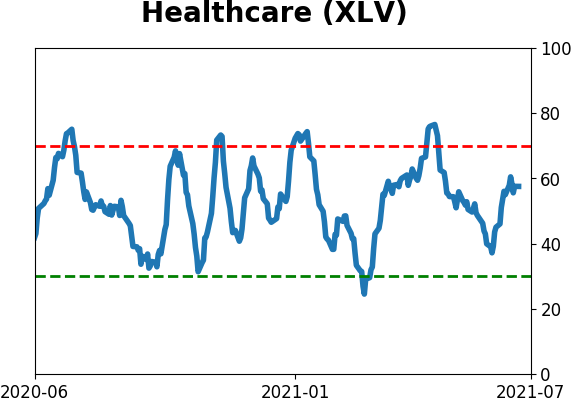
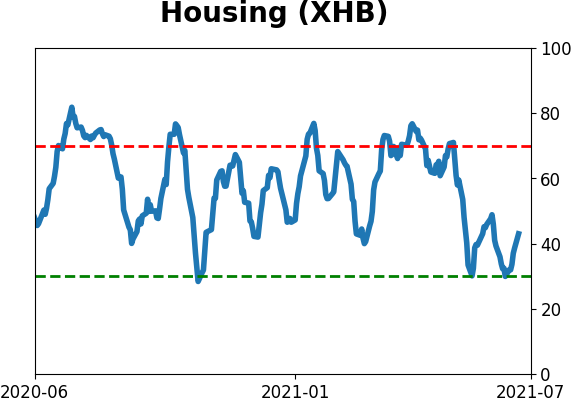
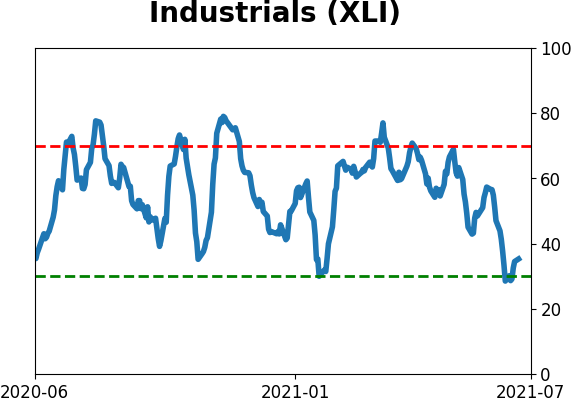
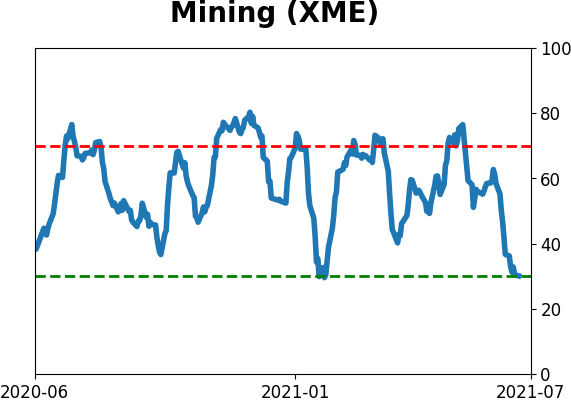
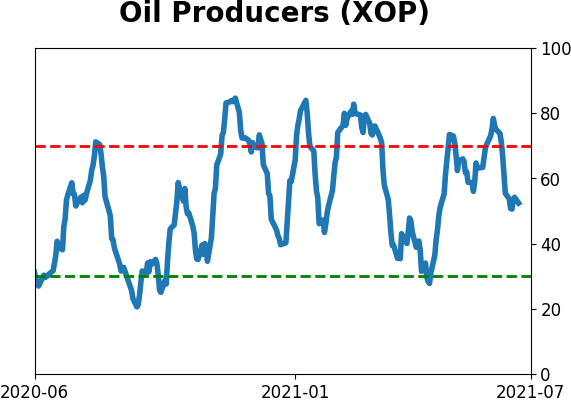
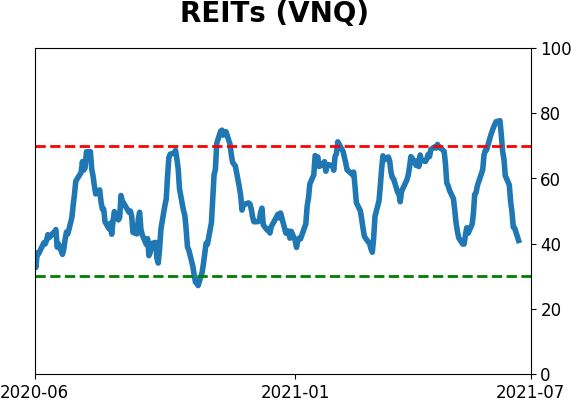
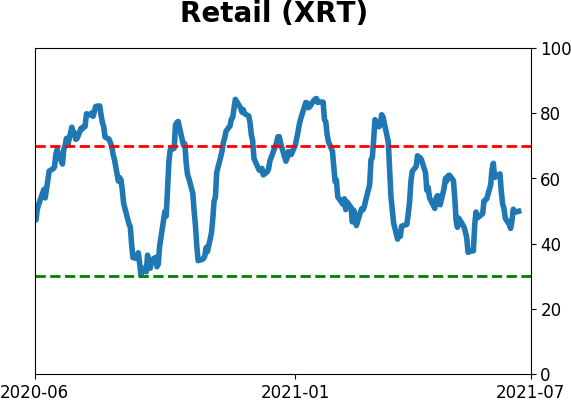
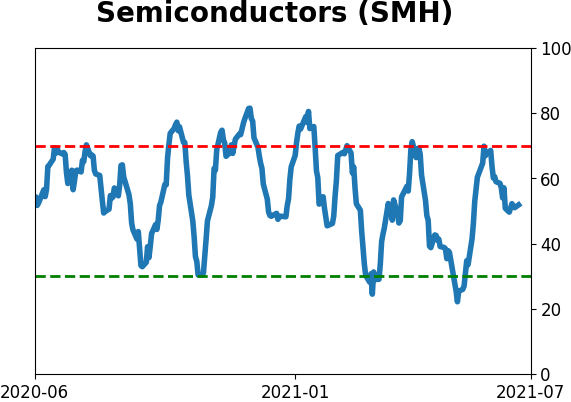
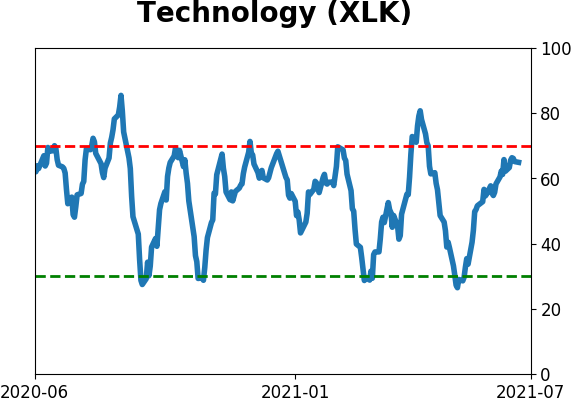
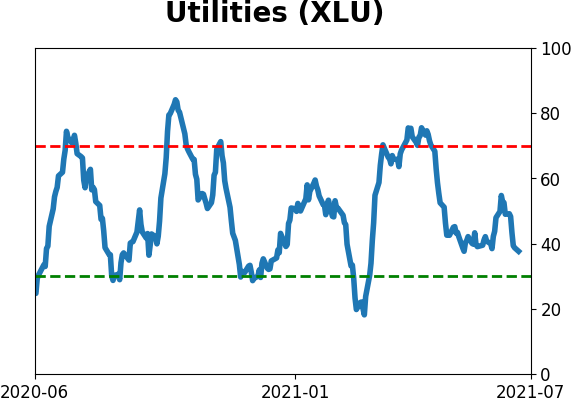
Sector ETF's - 10-Day Moving Average
|
|
|
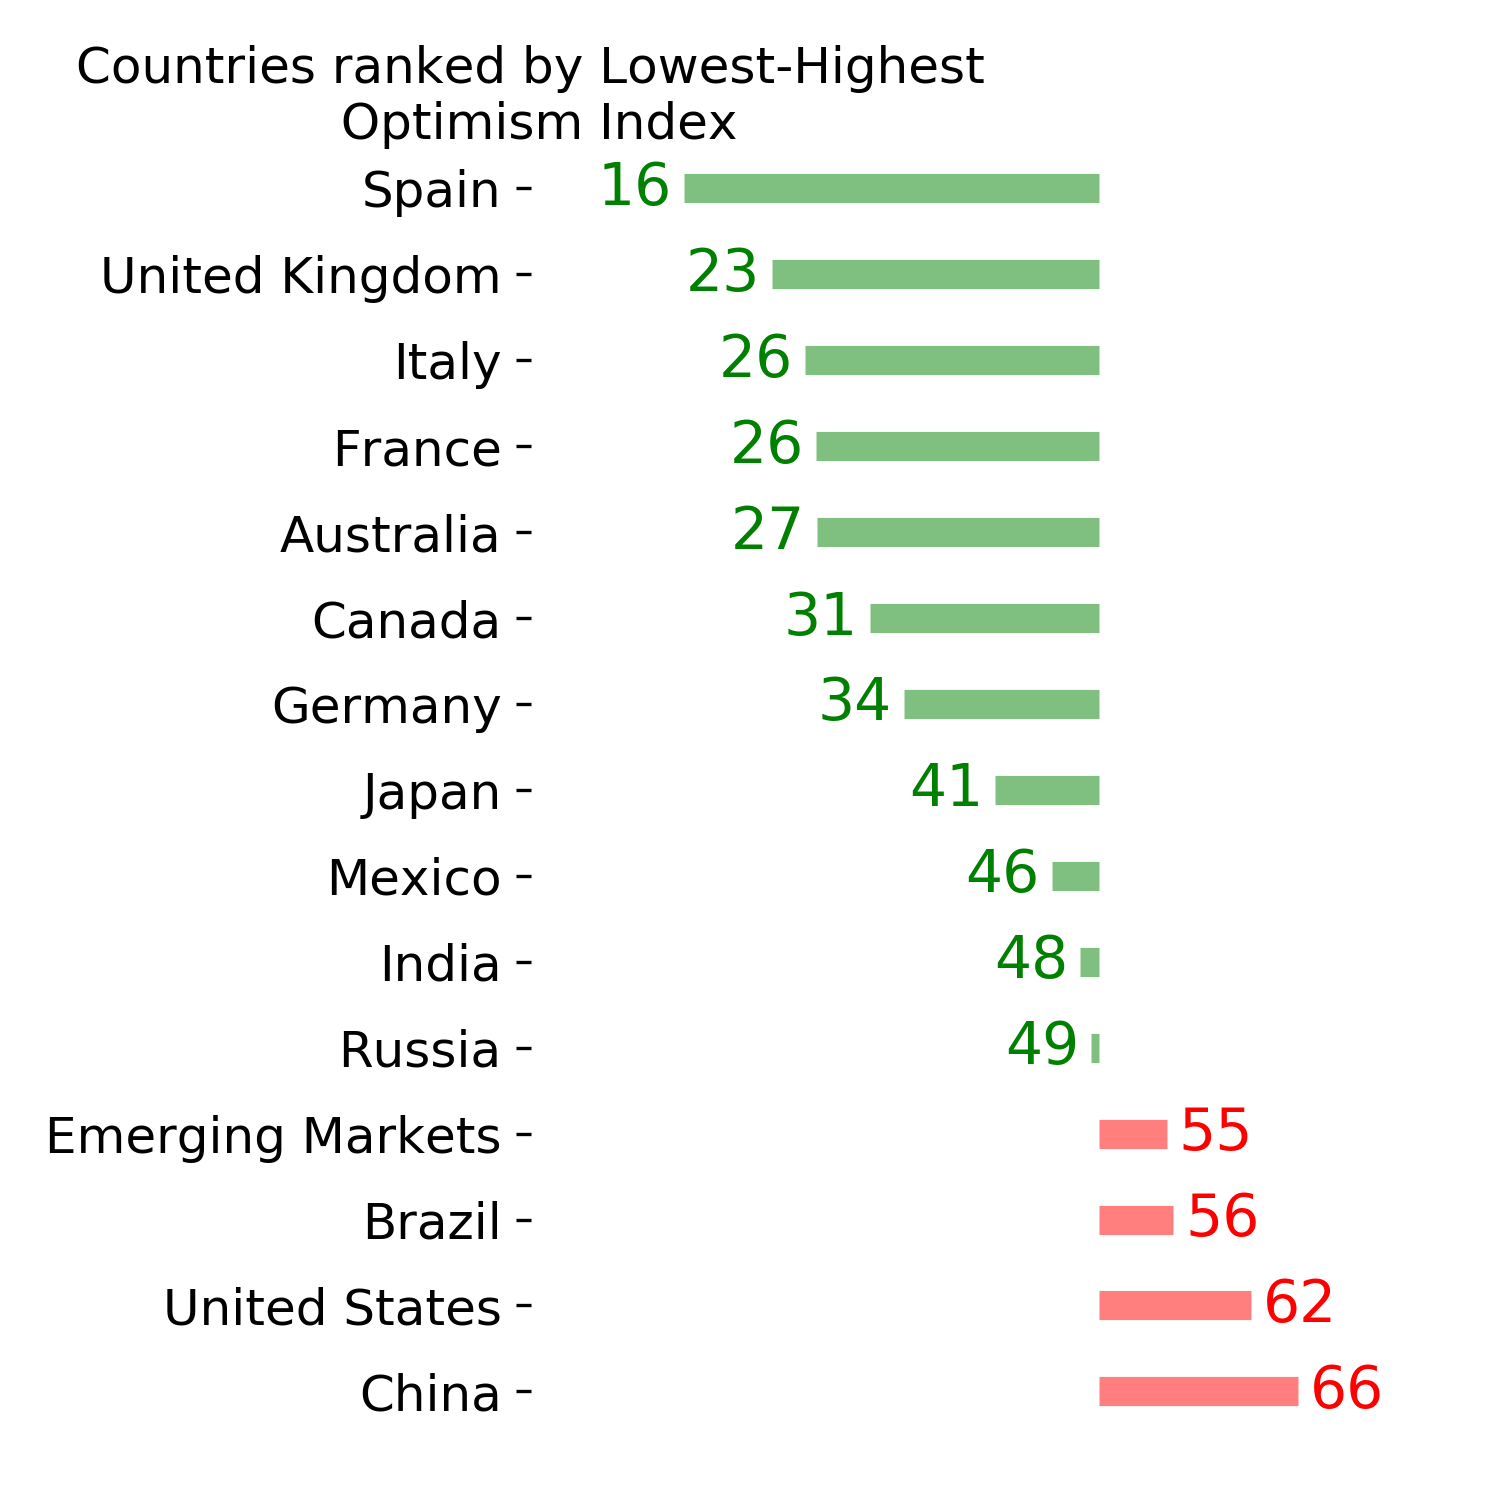
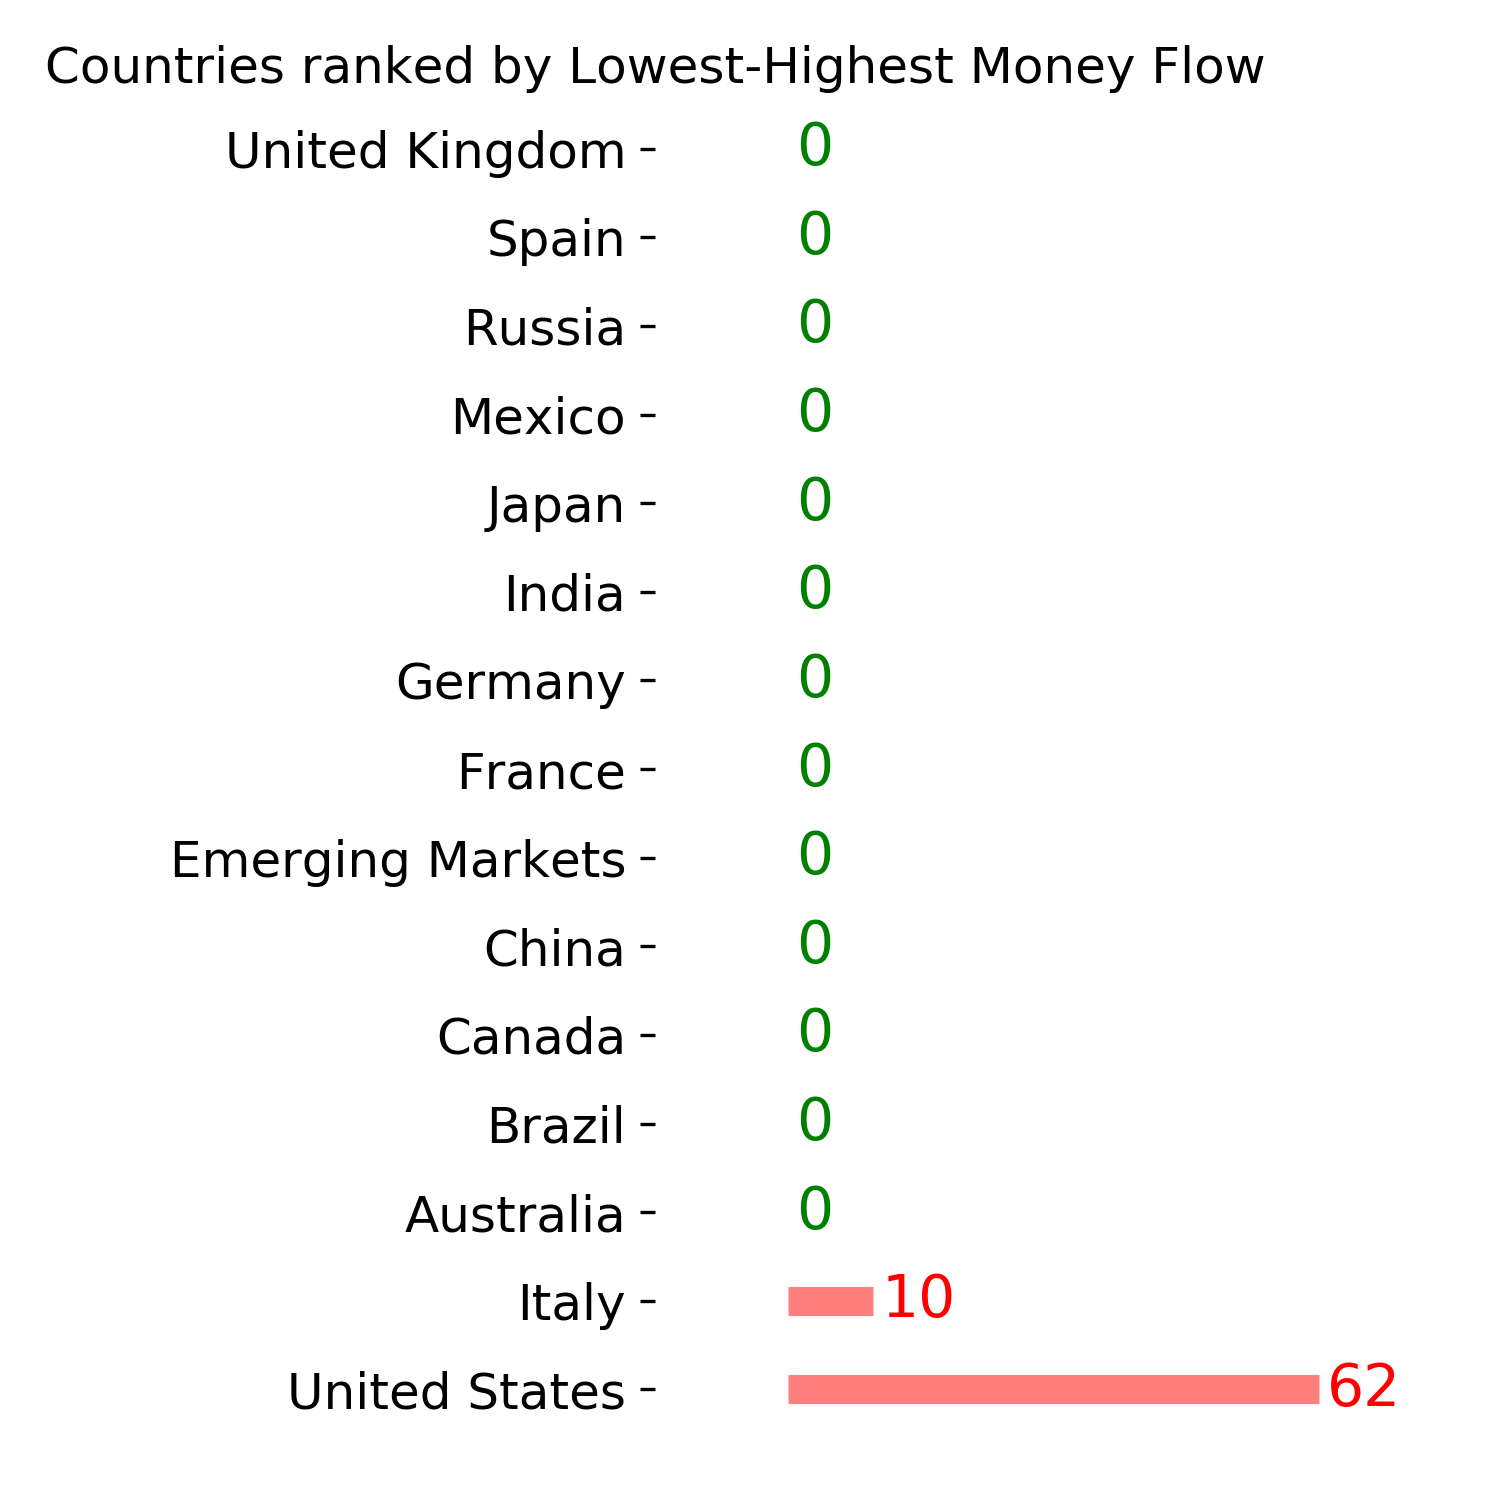
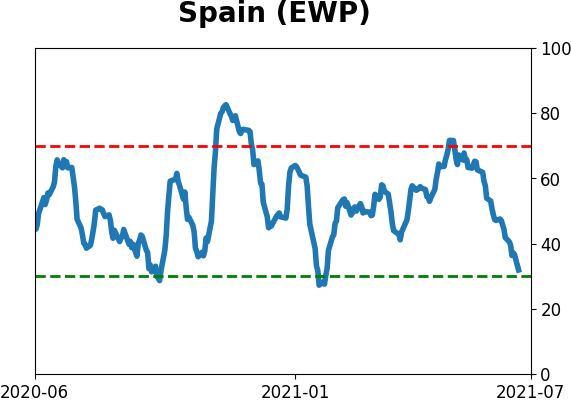
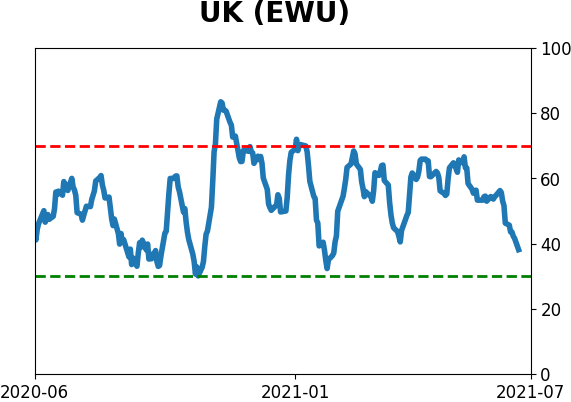
Country ETF's - 10-Day Moving Average
|
|
|
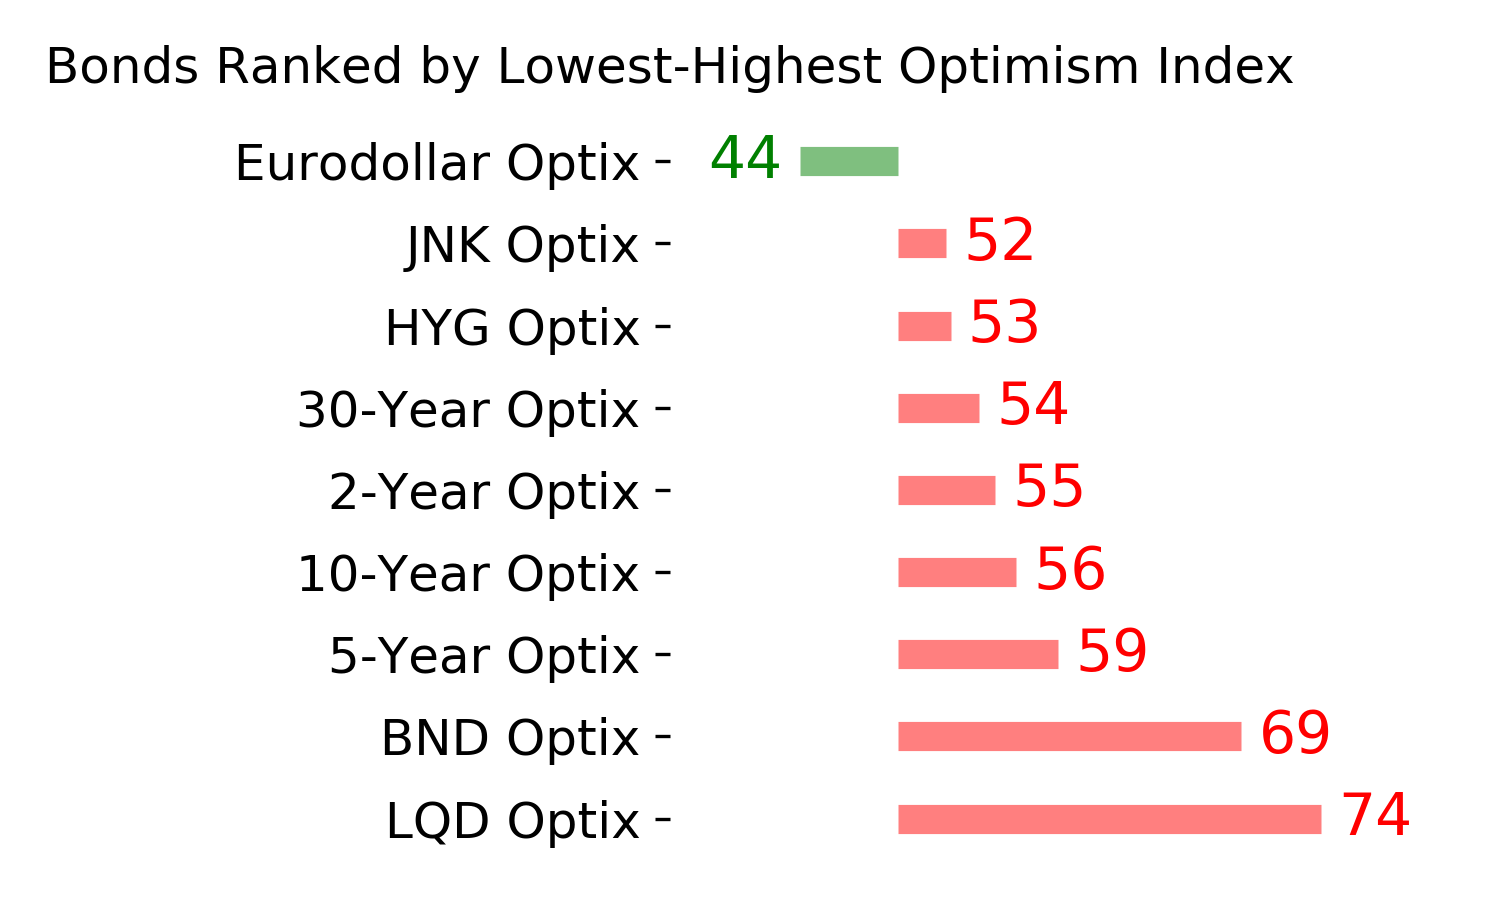
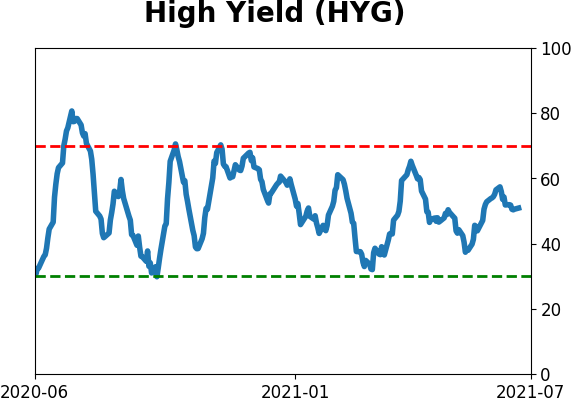
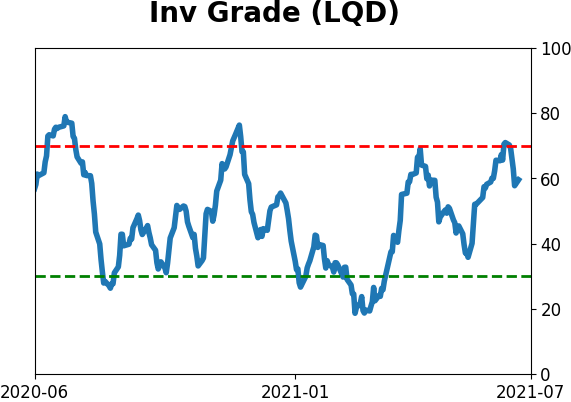
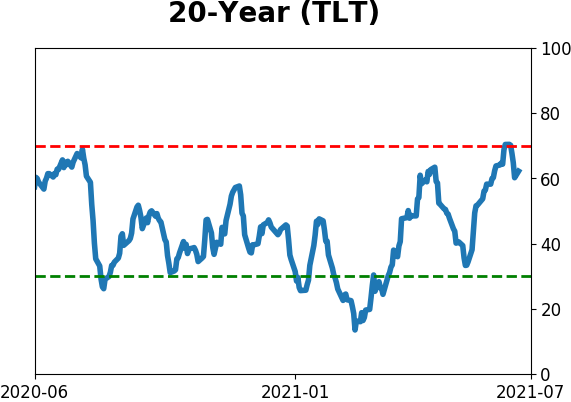
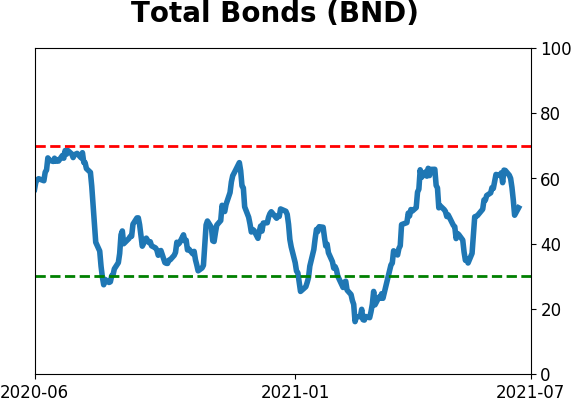
Bond ETF's - 10-Day Moving Average
|
|
|
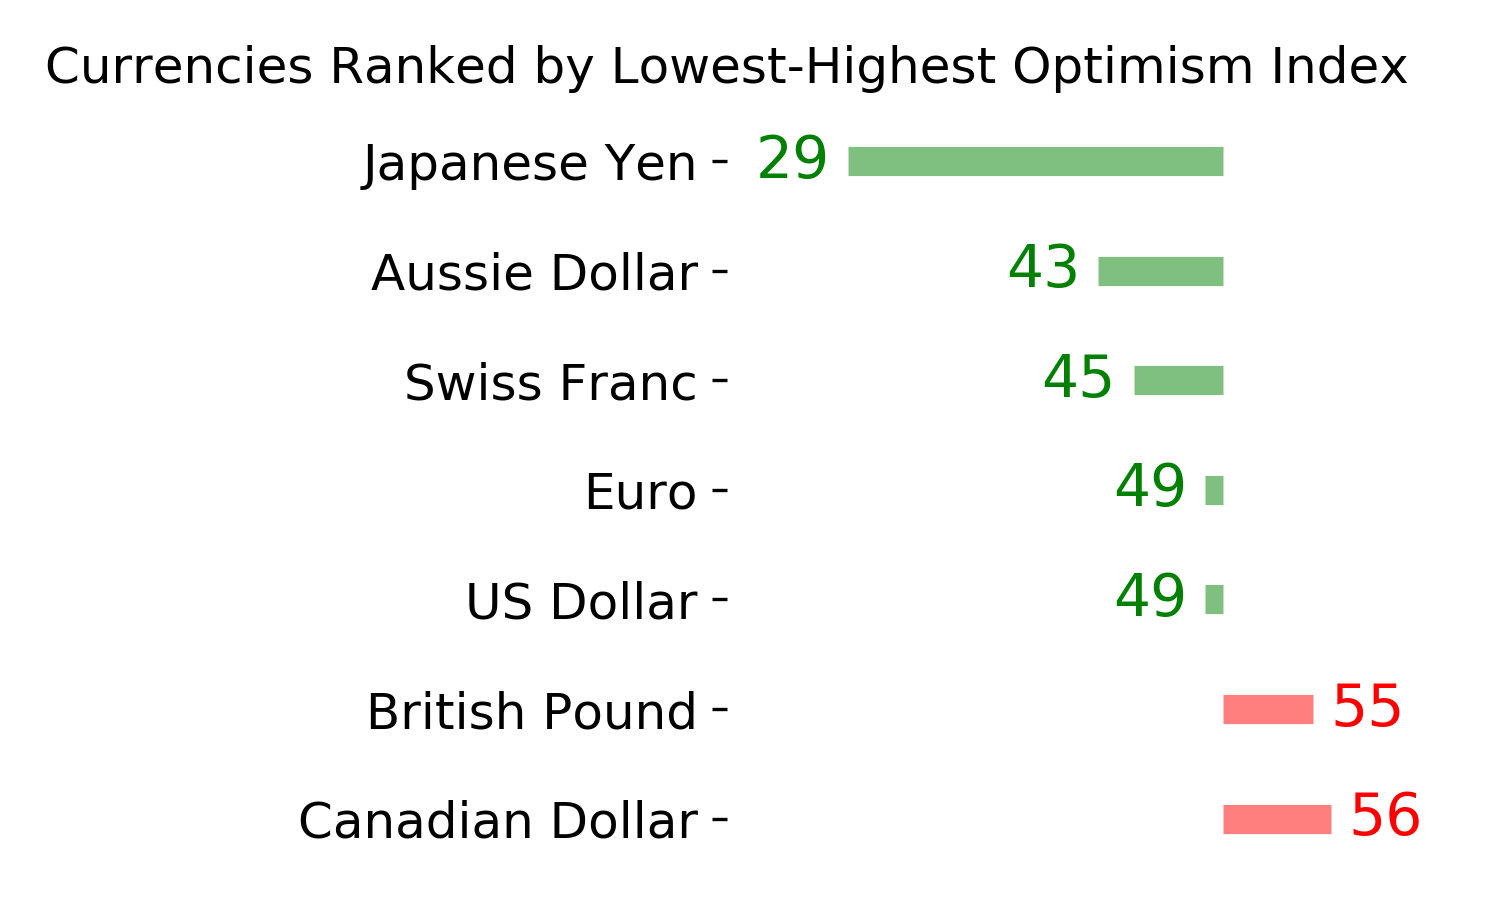
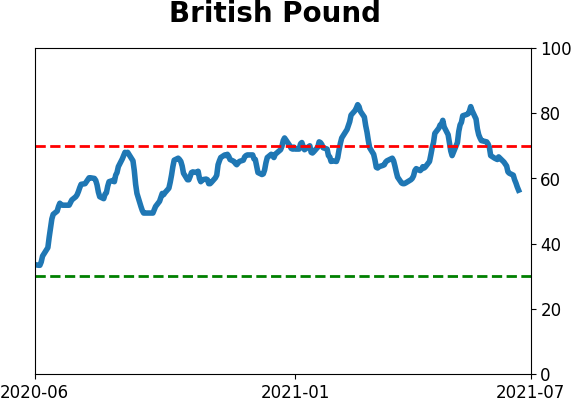
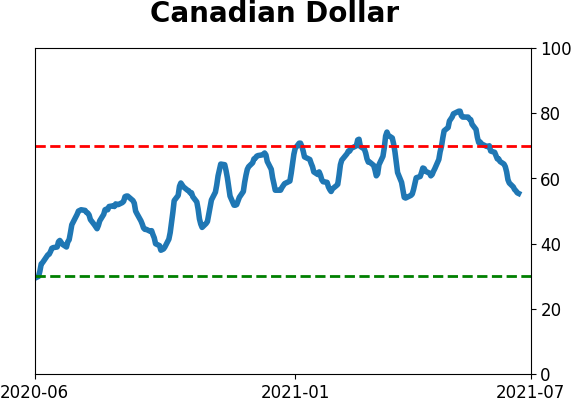
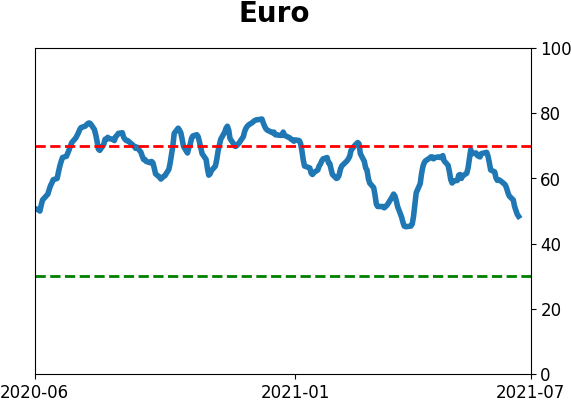
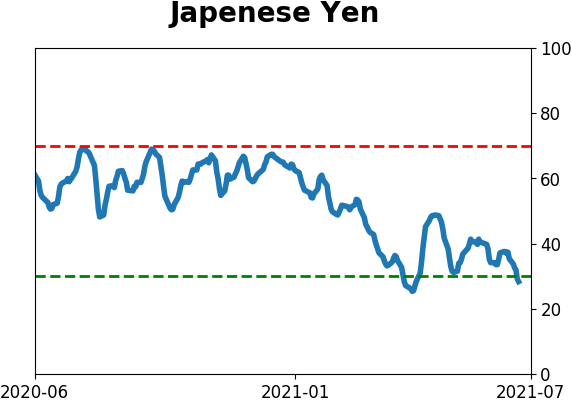
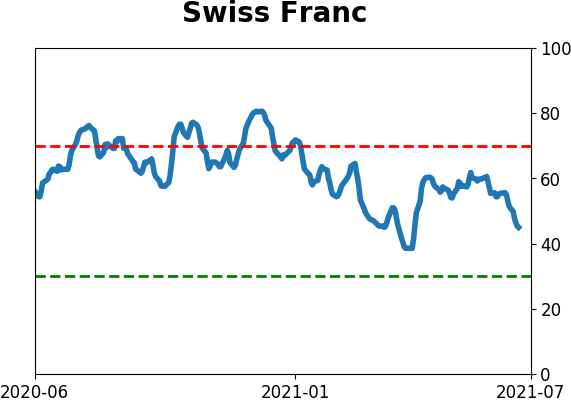
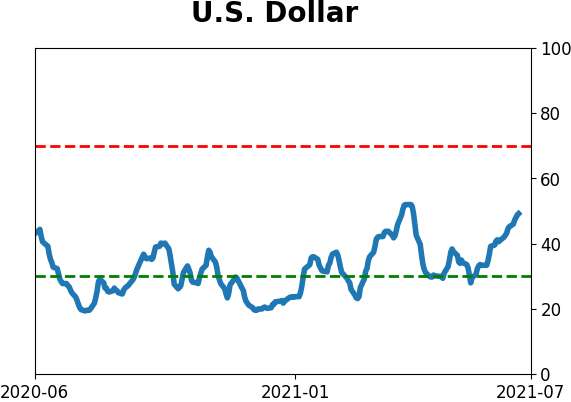
Currency ETF's - 5-Day Moving Average
|
|
|
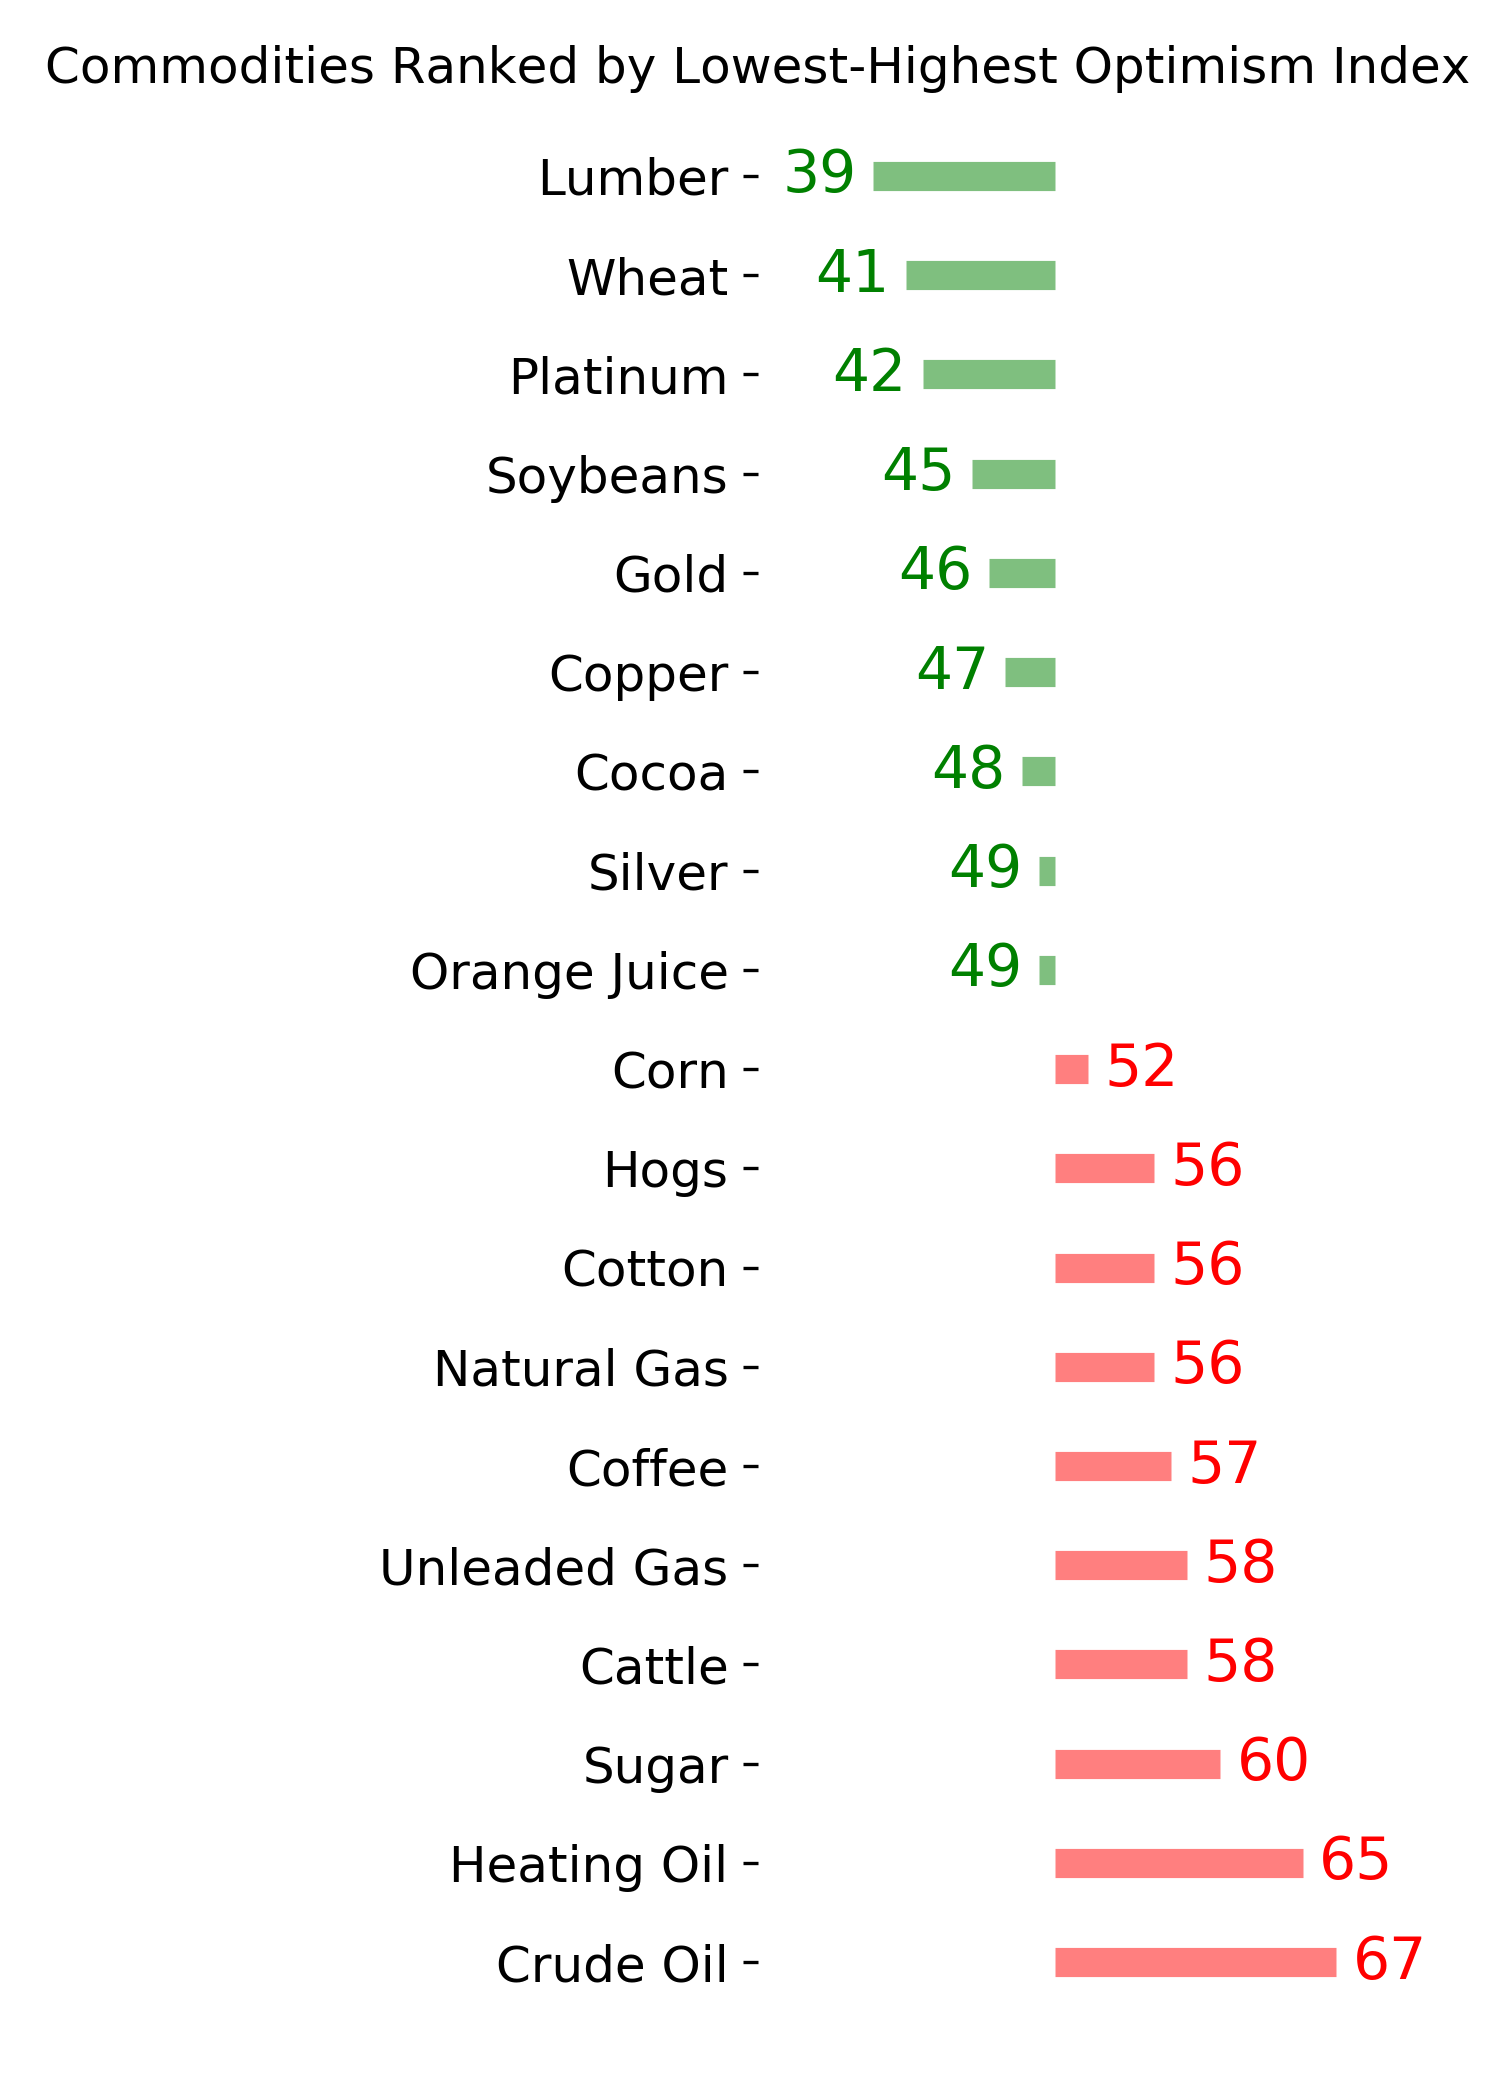
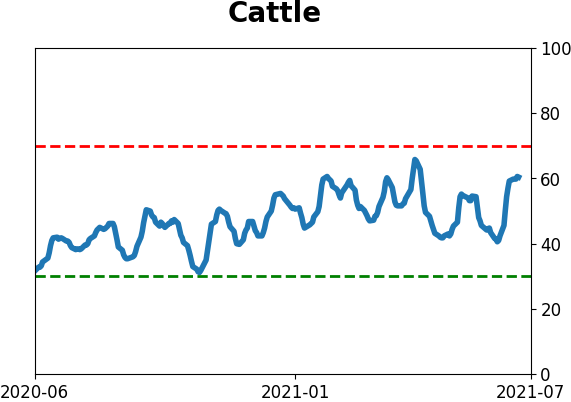
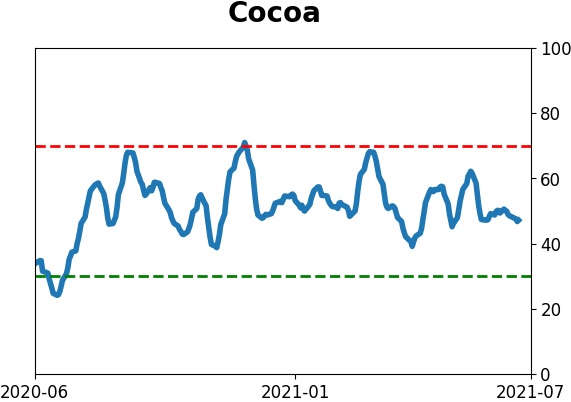
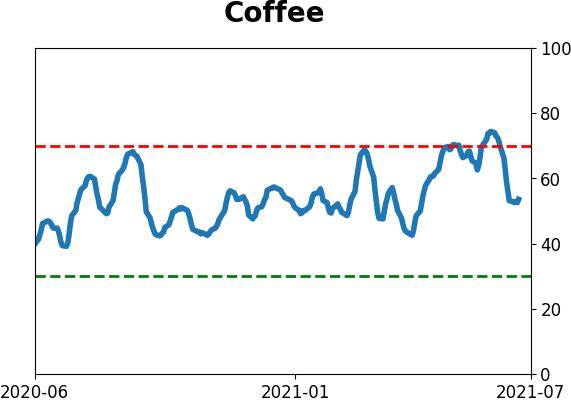
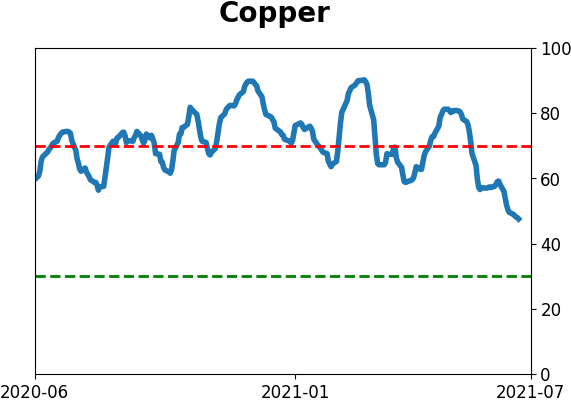
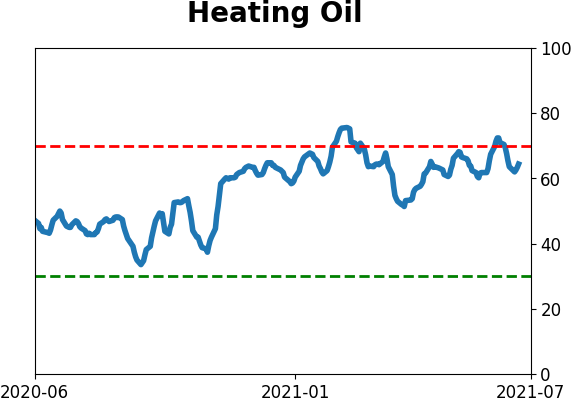
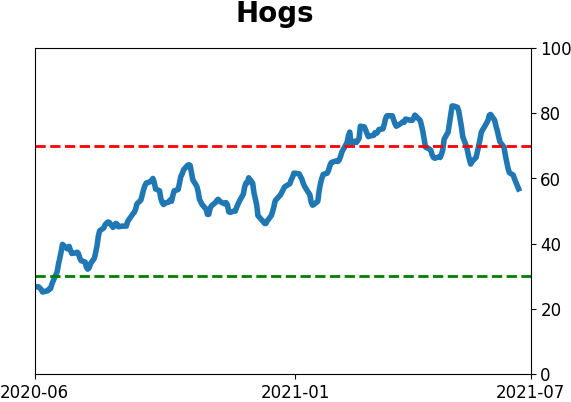
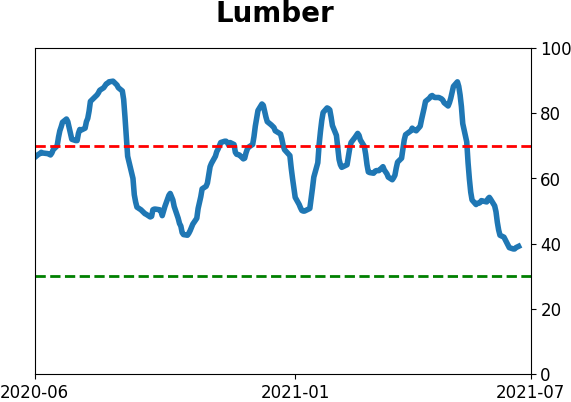
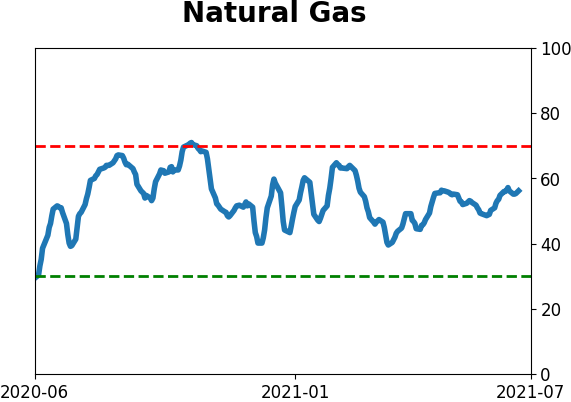
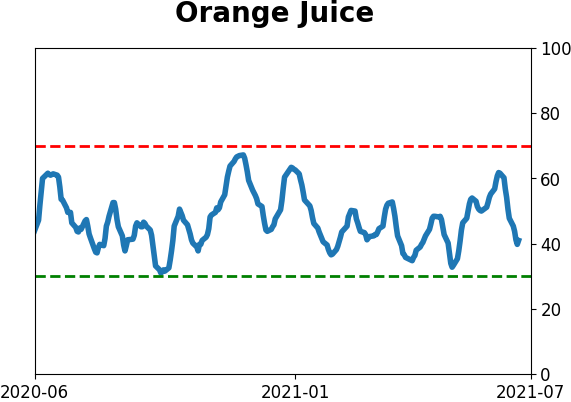
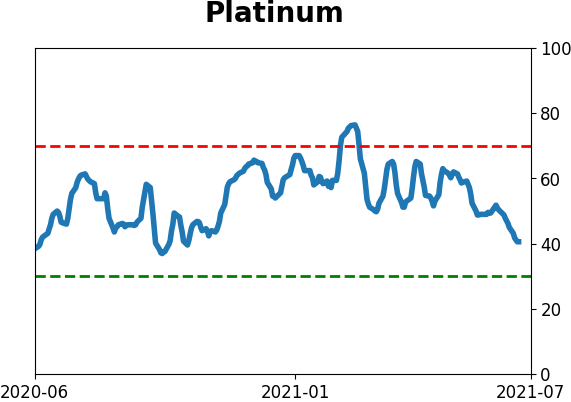
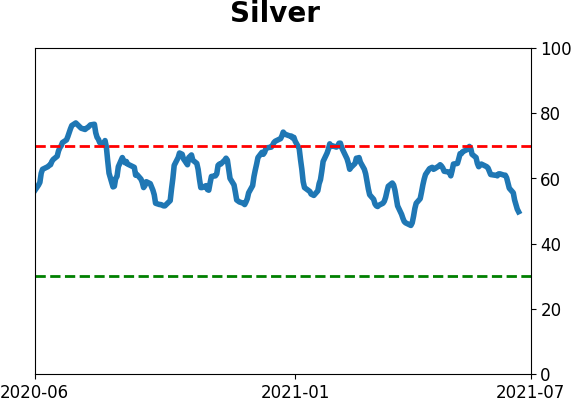
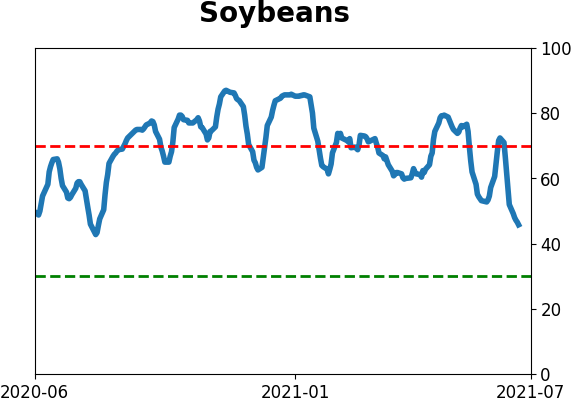
Commodity ETF's - 5-Day Moving Average
|
|