Headlines
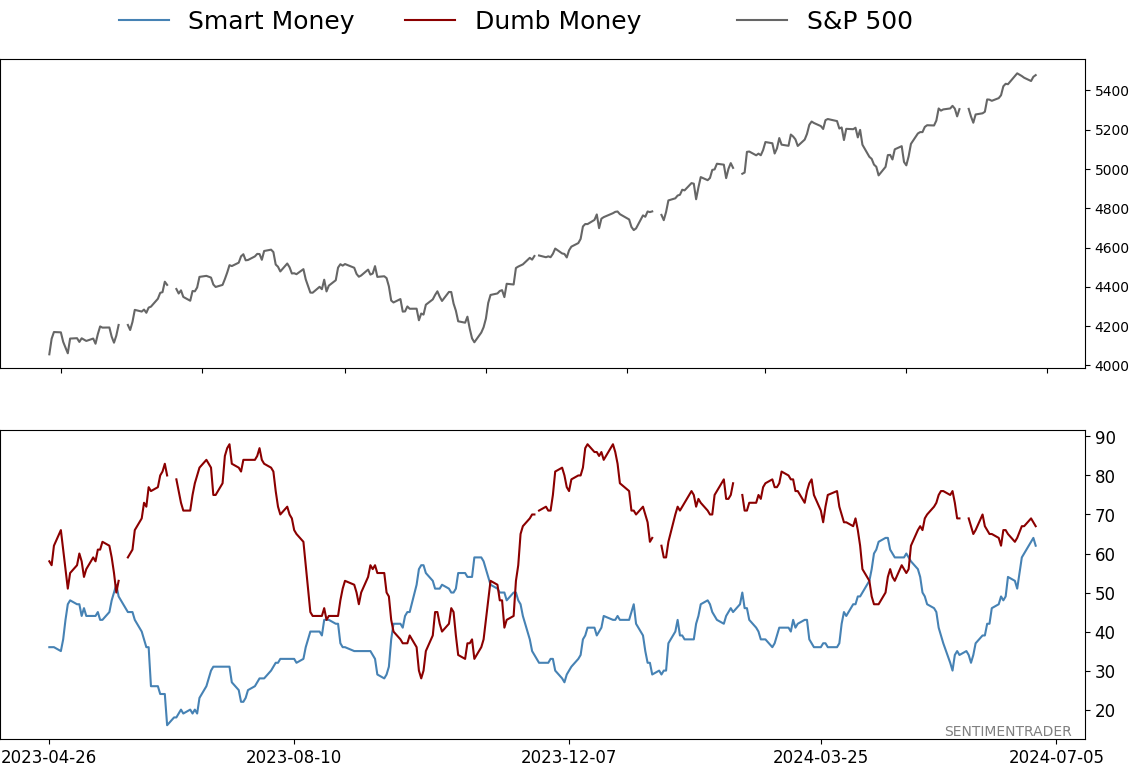
Smart / Dumb Money Confidence
|
Smart Money Confidence: 62%
Dumb Money Confidence: 67%
|
|
Risk Levels
Stocks Short-Term

|
Stocks Medium-Term
|
|
Bonds

|
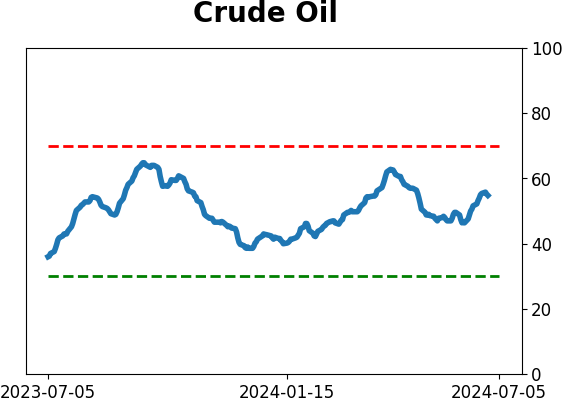
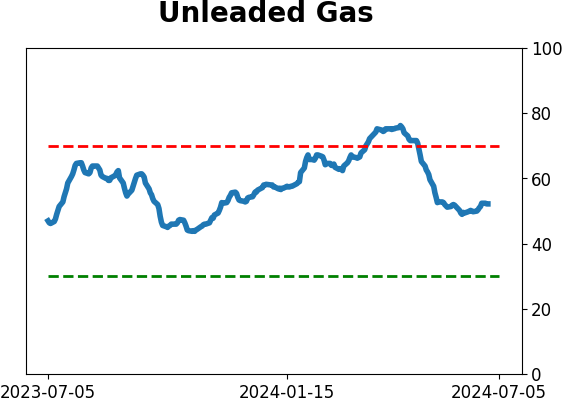
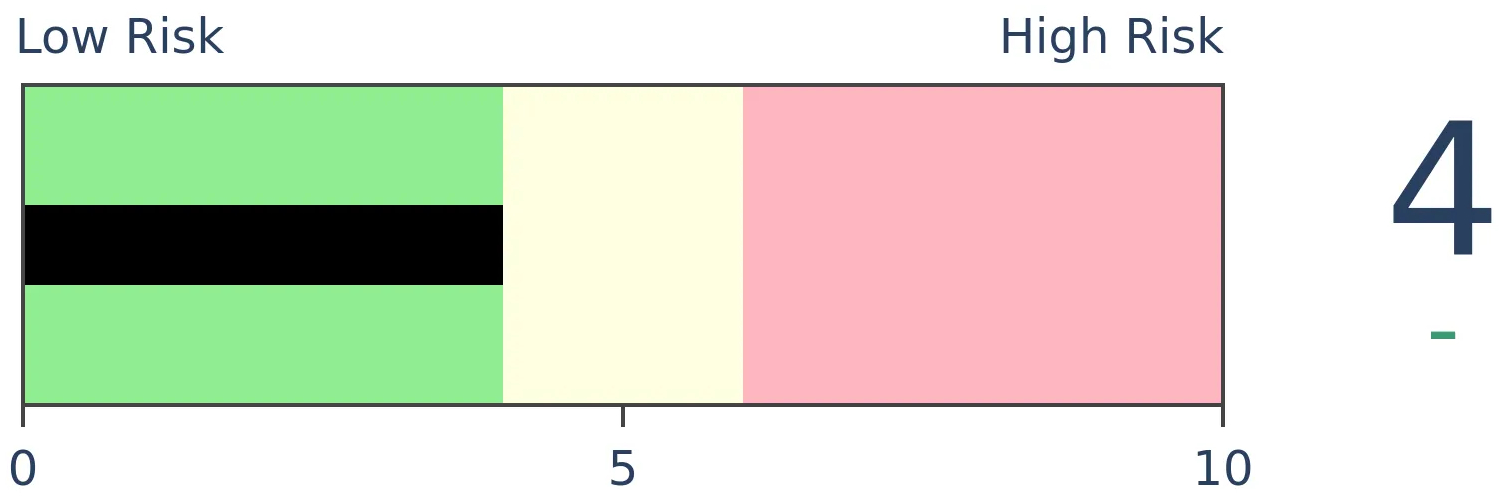
Crude Oil
|
|
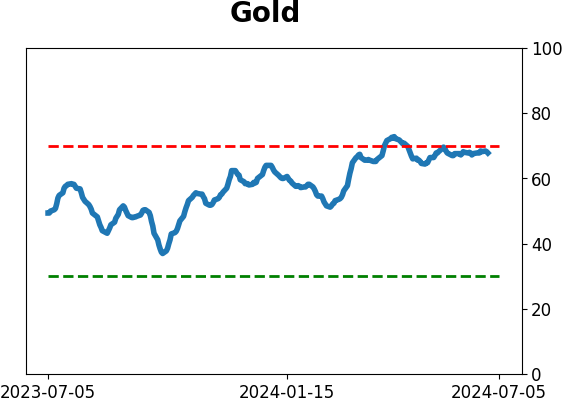
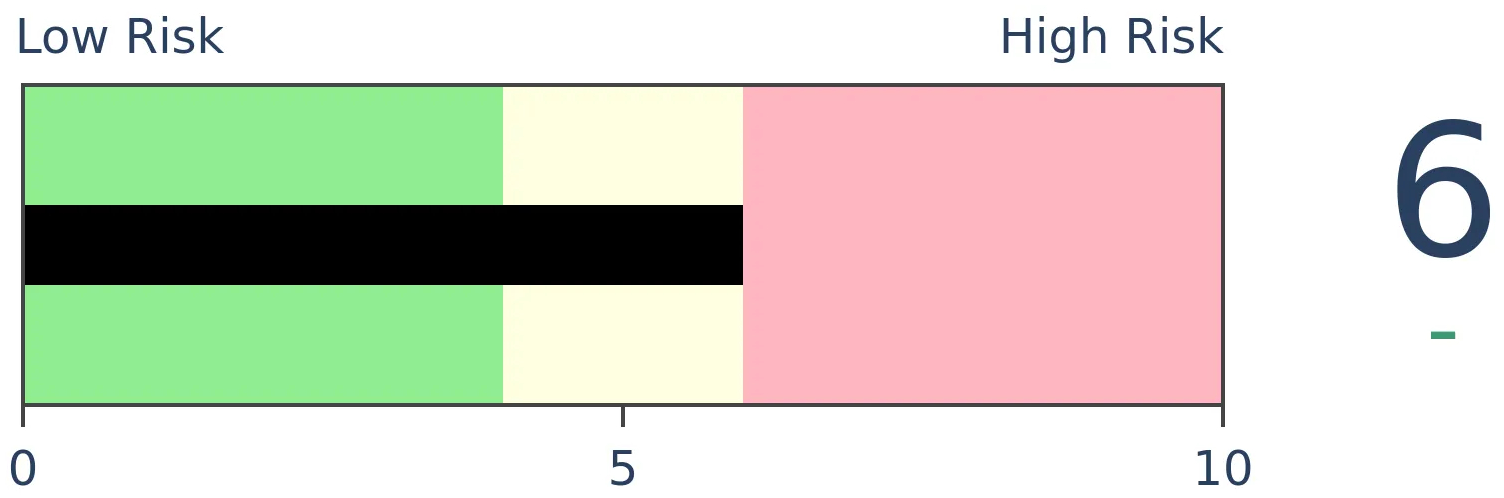
Gold
|
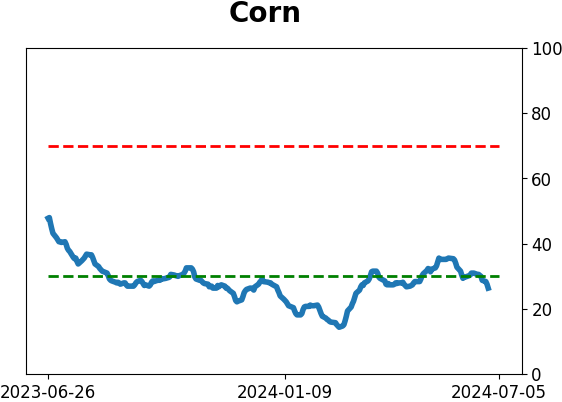
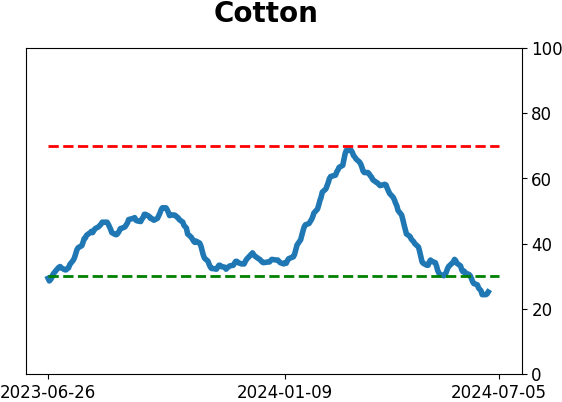
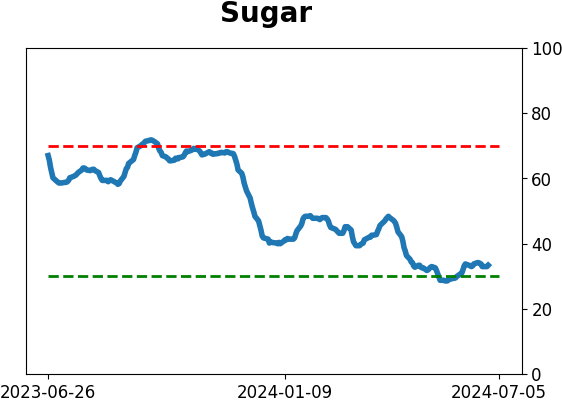
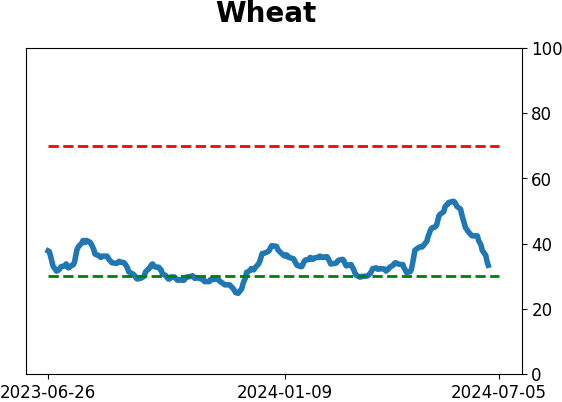
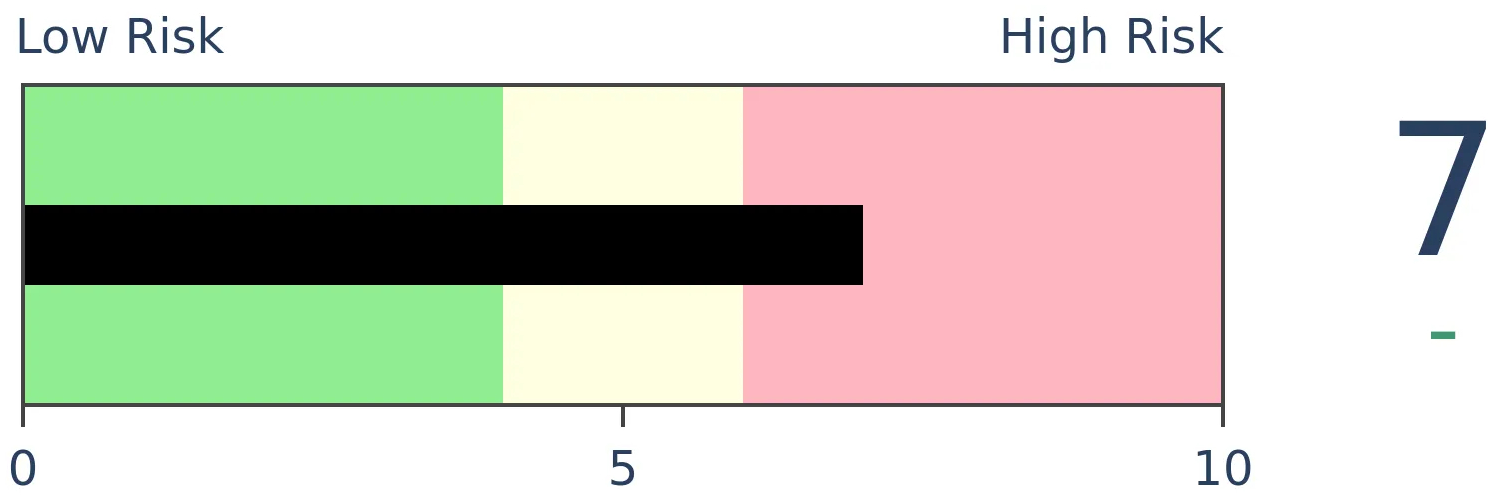
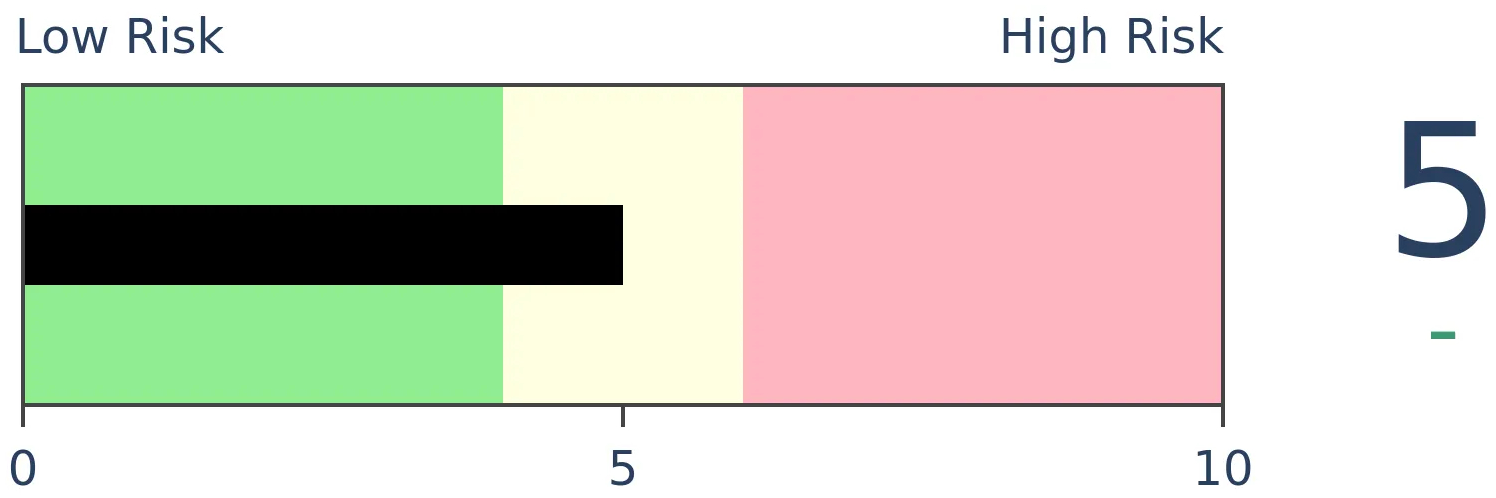
Agriculture
|
|
Research
By Dean Christians
BOTTOM LINE
Key points:
FORECAST / TIMEFRAME
None
|
Key points:
- The percentage of commodities in a bear market cycled from less than 25% to greater than 50%
- Similar shifts preceded unfavorable returns and win rates for a commodity index over the subsequent year
- Several other factors cast doubt on the sustainability of the current uptrend
The uptrend in a broad commodity index appears in jeopardy
In a research note in April, I highlighted a bullish price momentum signal for commodities, suggesting that a broad index had transitioned from a bearish to a bullish environment following a prolonged downtrend. While my composite trend model remains positive, although deteriorating, other indicators are flashing warning signs, calling into question the sustainability of the uptrend.
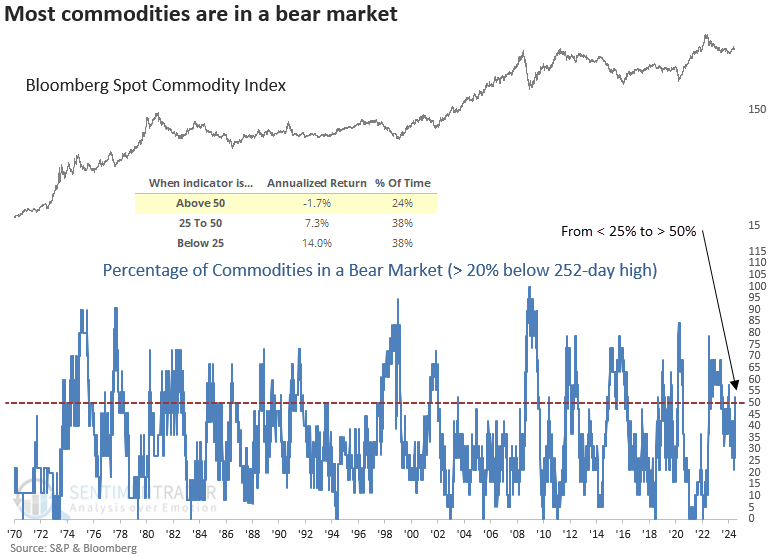
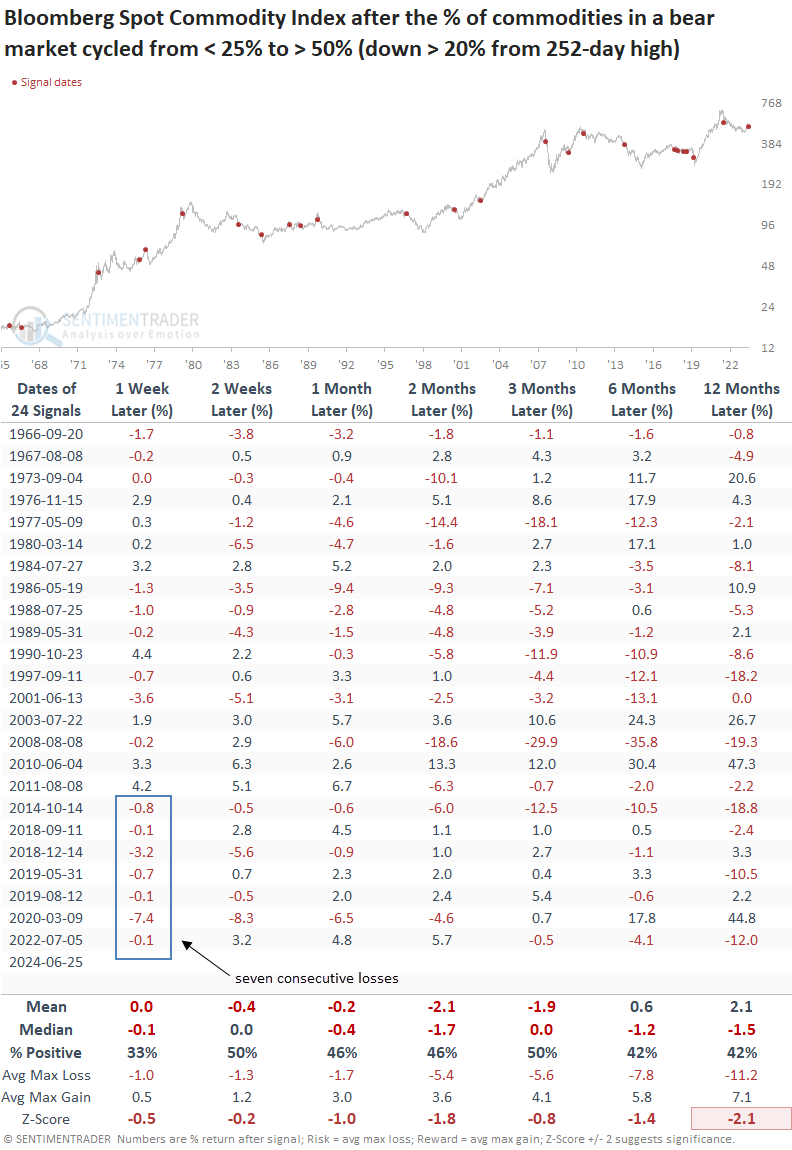
One such indicator, the percentage of commodities in a bear market, shifted from under 25% to over 50%, indicating that most commodities have declined more than 20% from their 252-day high, which is highly unusual in a bullish trend environment.
As the chart below shows, when more than 50% of commodities are in a bear market, the Bloomberg Spot Commodity Index produces an annualized return of -1.7%, a stark contrast from periods when the indicator resided below 25%.
Similar shifts preceded a negative outlook for a broad basket of commodities
Following precedents when the percentage of commodities in a bear market shifted from under 25% to over 50%, the Bloomberg Spot Commodity Index struggled over the subsequent year, with the median maximum loss exceeding the maximum gain in every time frame.
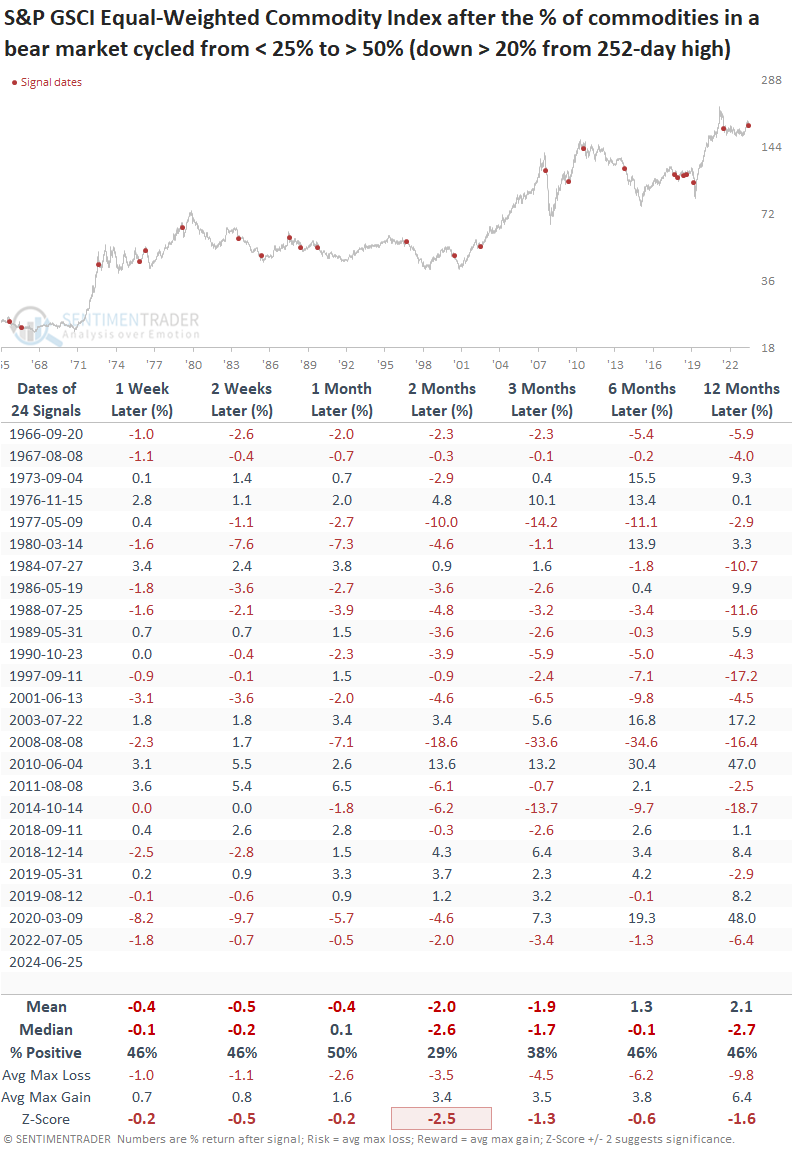
Commodities like crude oil can influence the Bloomberg Spot Commodity Index, which is weighted based on liquidity and global economic significance. Therefore, to provide an unbiased perspective, I applied the signals to the equal-weighted S&P GSCI Commodity Index.
Returns and win rates for the equal-weighted S&P GSCI Commodity Index demonstrate a similar negative outlook over the following year, especially two months in, with negative returns 71% of the time.
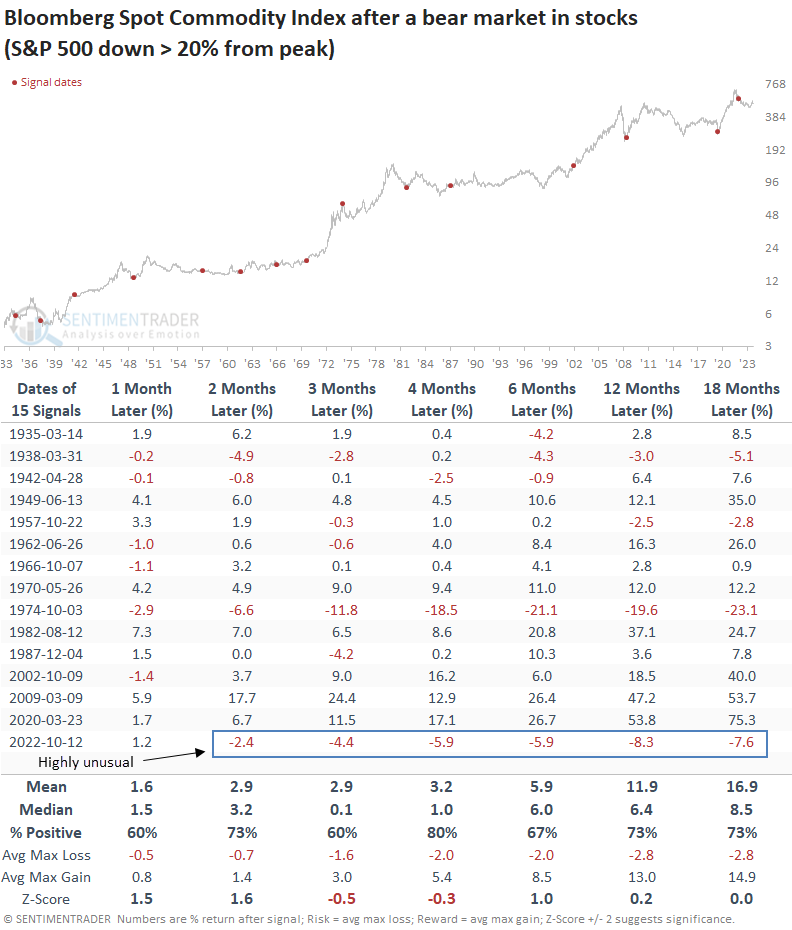
Other concerns undermining the bullish trend in commodities
Usually, following a bear market, commodities rise in unison with stocks. However, this time, returns have been negative in every time frame from two to eighteen months later. Of course, it's essential to recognize that a recession did not accompany the 2022 bear market in stocks.
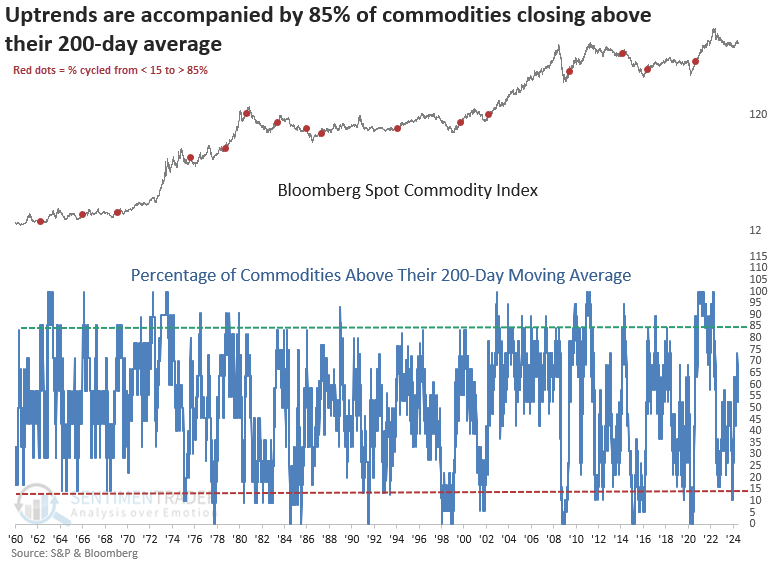
At least 85% of commodities have traditionally exceeded their 200-day averages during every cyclical or secular upswing in the Bloomberg Spot Commodity Index. The absence of this scenario currently raises questions about the uptrend's validity.
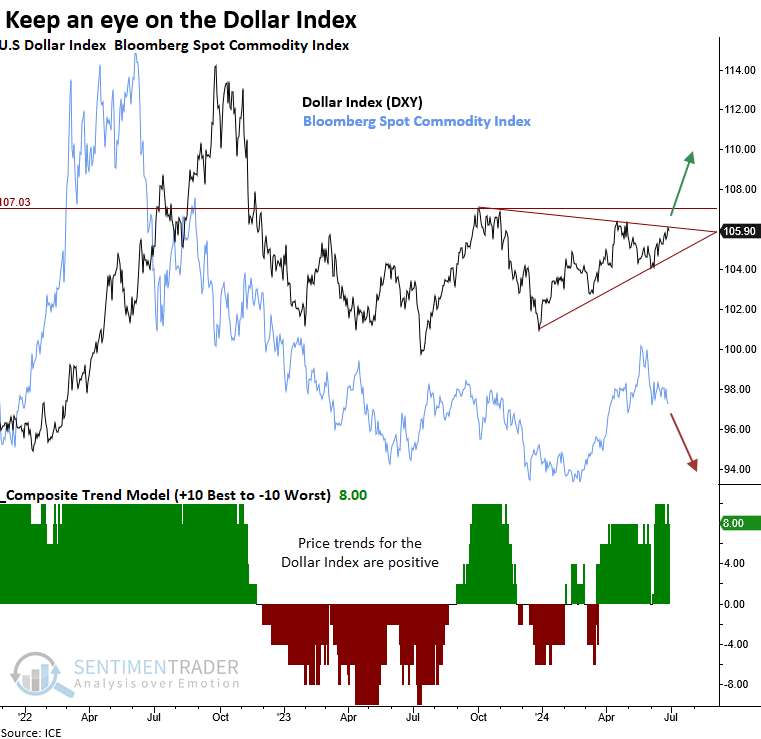
Commodities dance to the tune of the dollar
I'm monitoring the Dollar Index (DXY) closely. If the DXY breaks above 107, commodities, which are priced off the USD, will likely take a hit.
What the research tells us...
Beginning in February 2024, a broad commodity index shifted from a bearish to a bullish trend. However, prices have deteriorated over the last month, with most commodities returning to a bear market, raising doubts about the rally's sustainability. Although the retracement could be a typical pullback within an ongoing uptrend, factors such as post-bear market performance and long-term participation trends in individual commodities indicate the rally may have been a countertrend move. With the Dollar Index (DXY) consolidating in a symmetrical triangle pattern, an upside resolution would intensify the pressure on commodities.
Indicators at Extremes
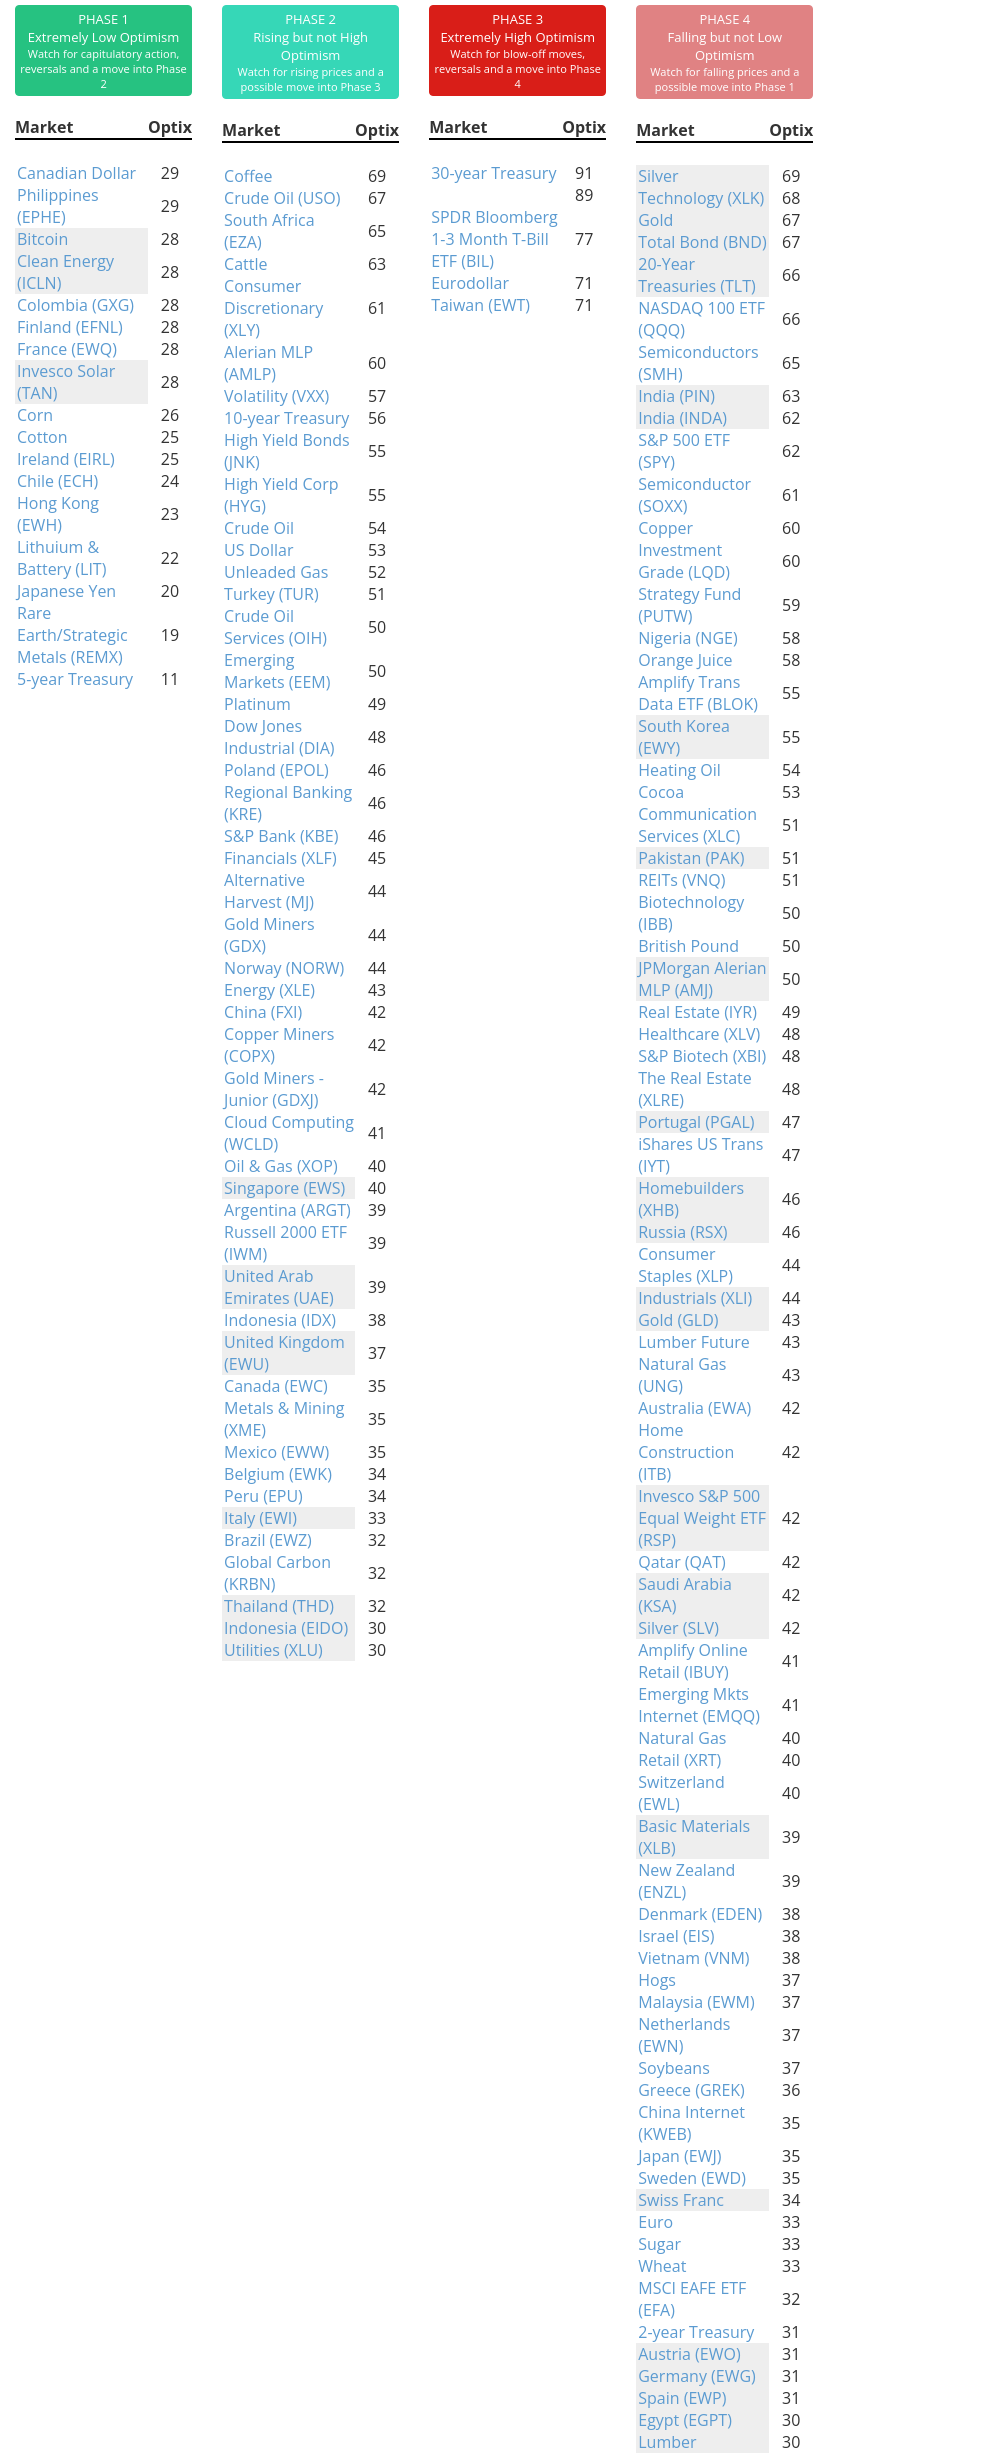
Phase Table
Ranks
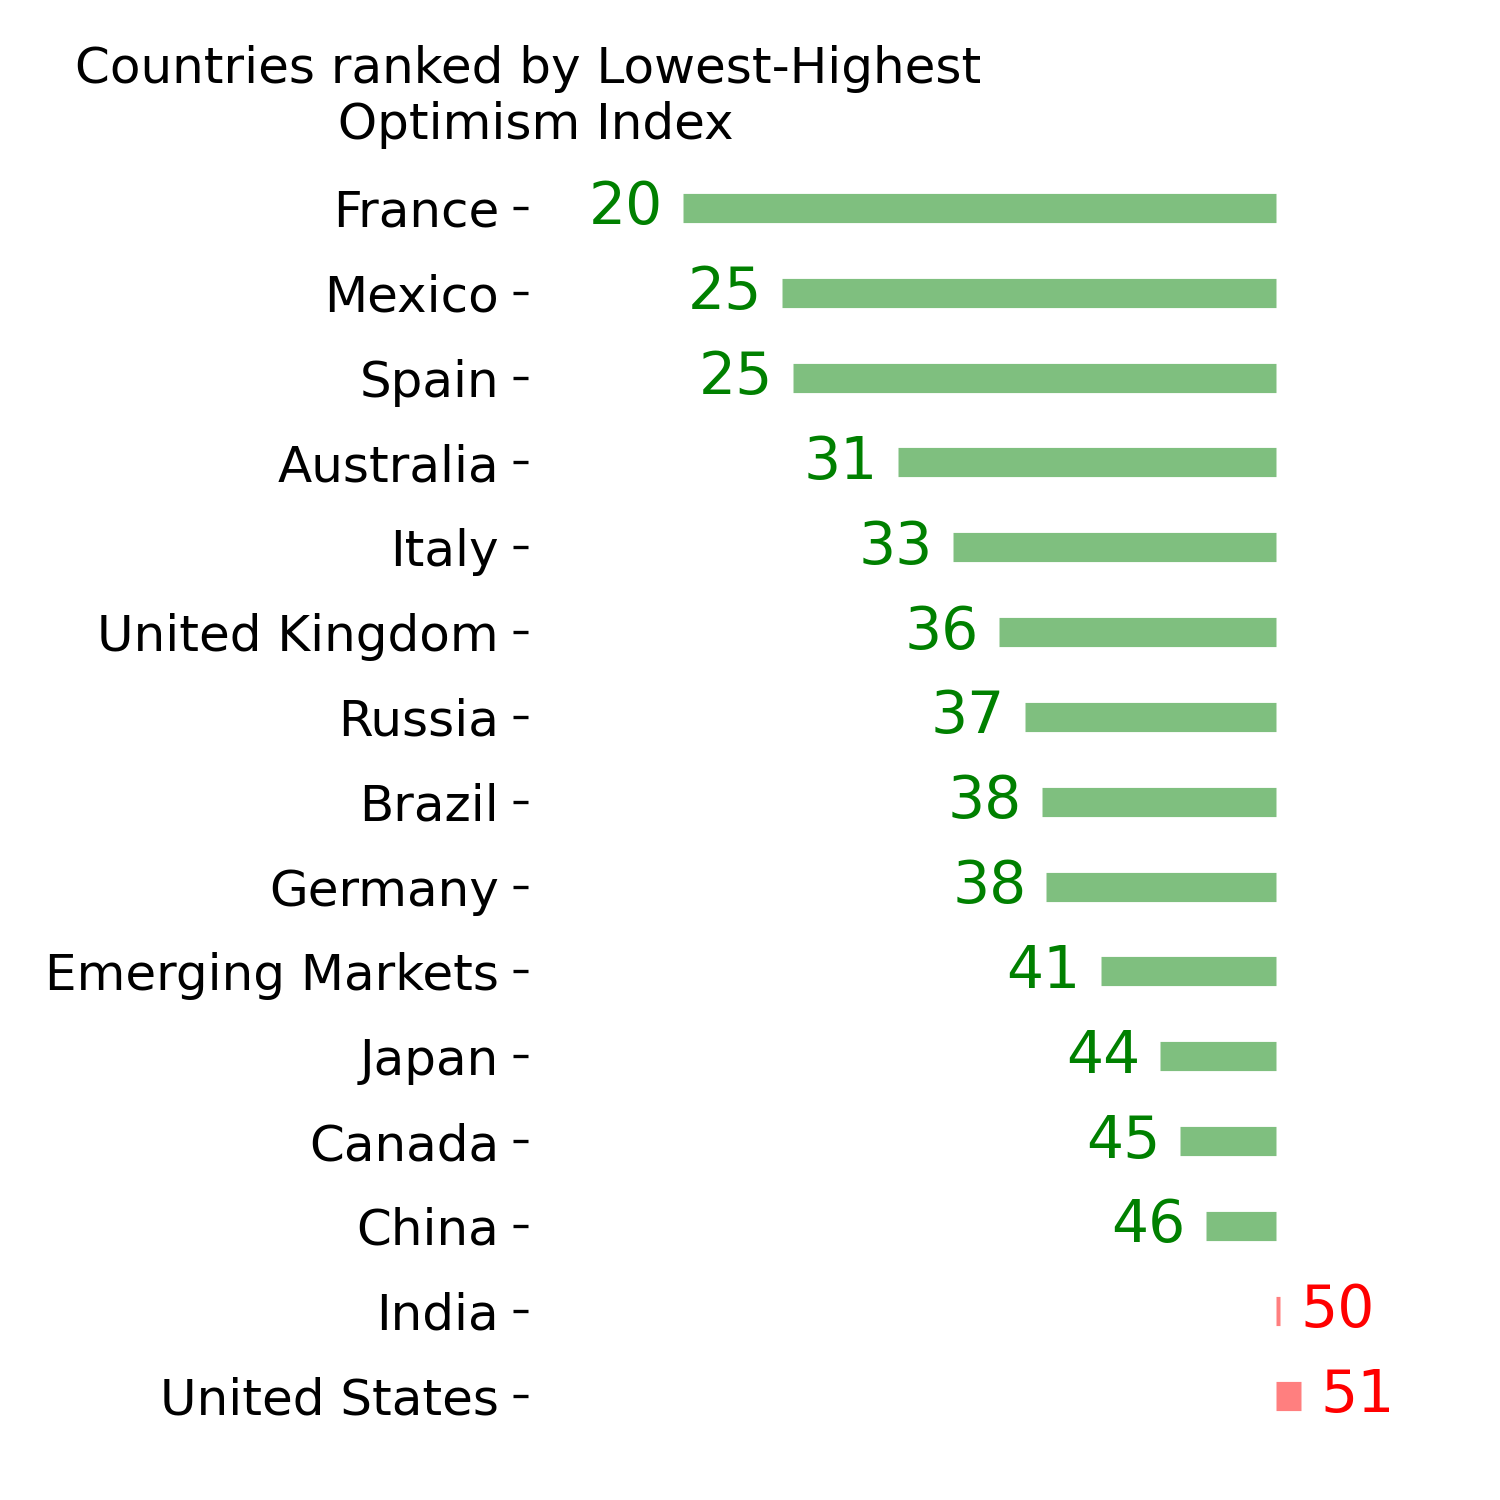
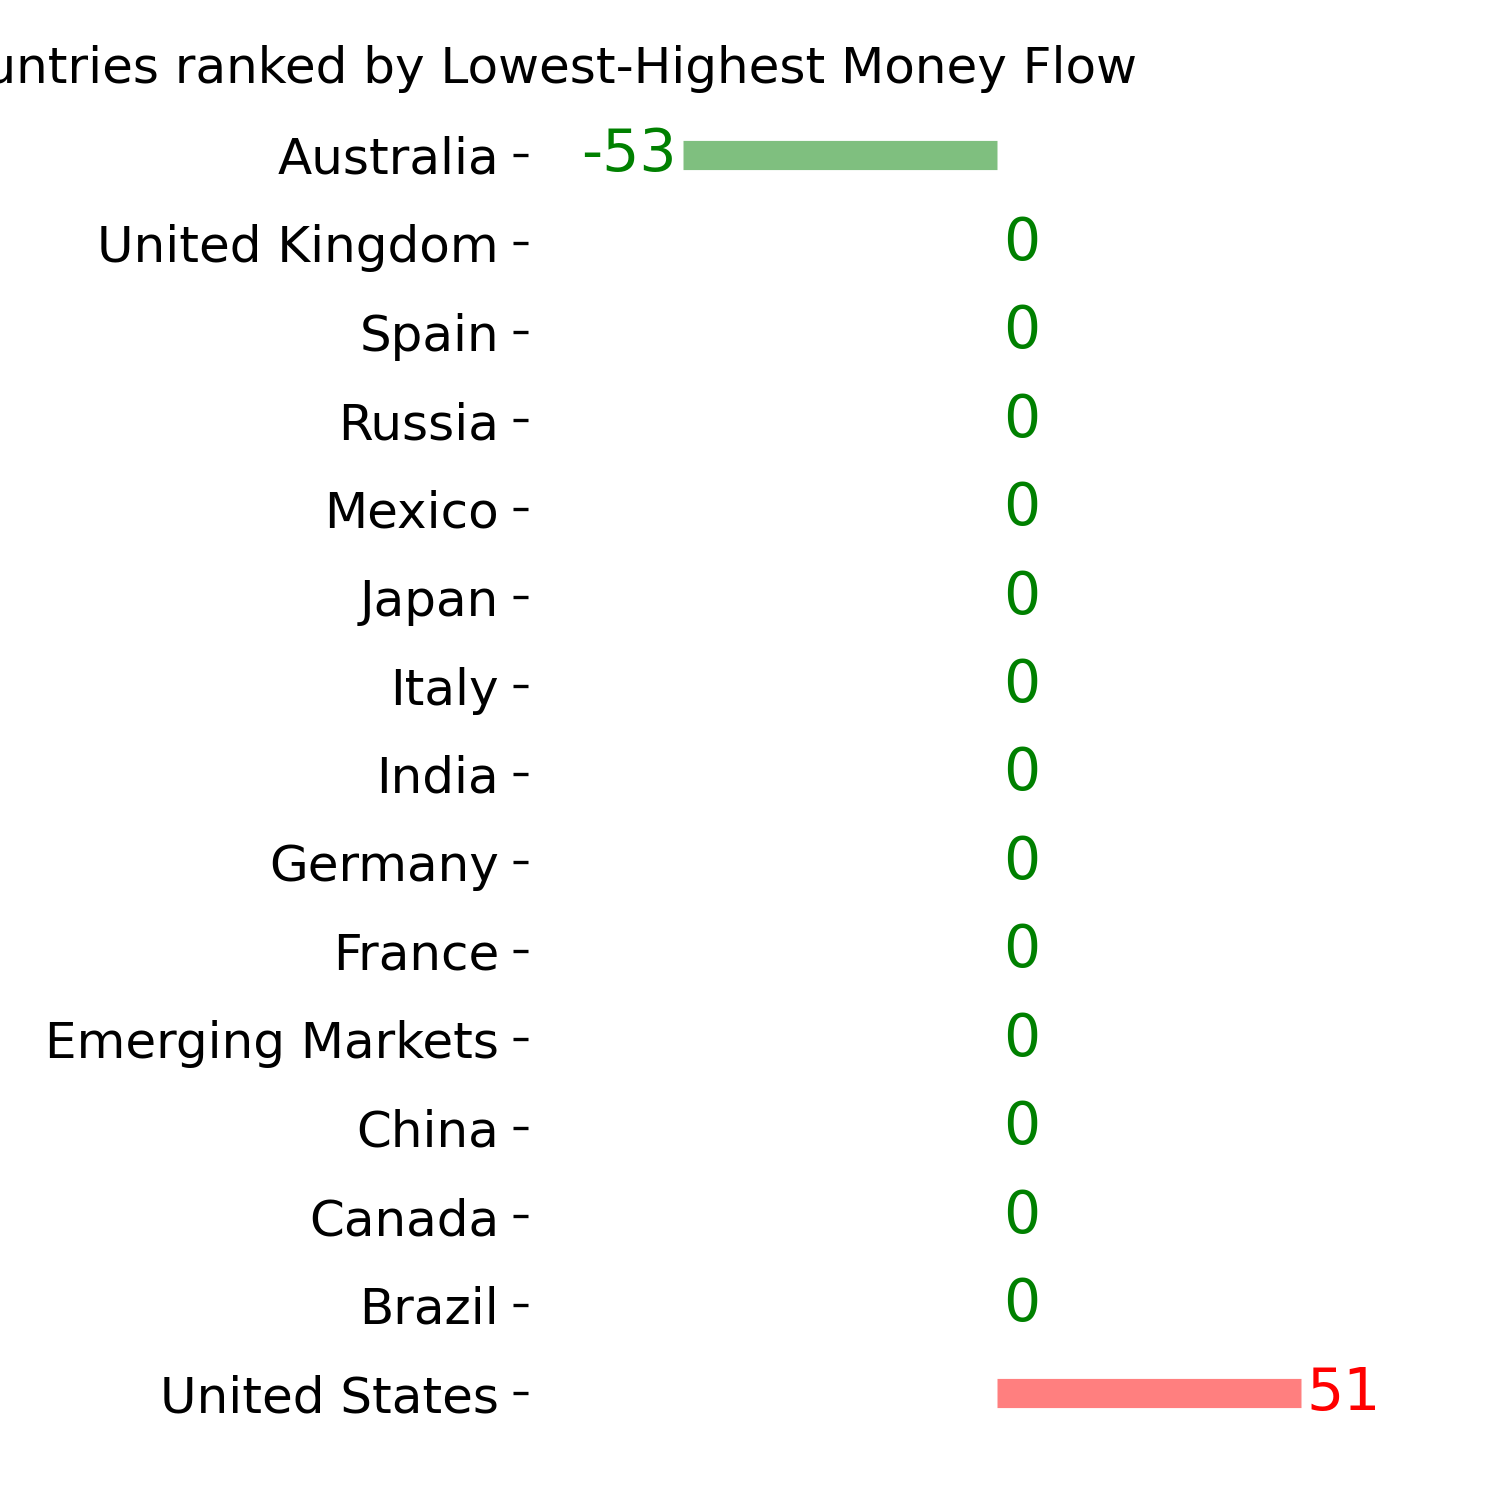
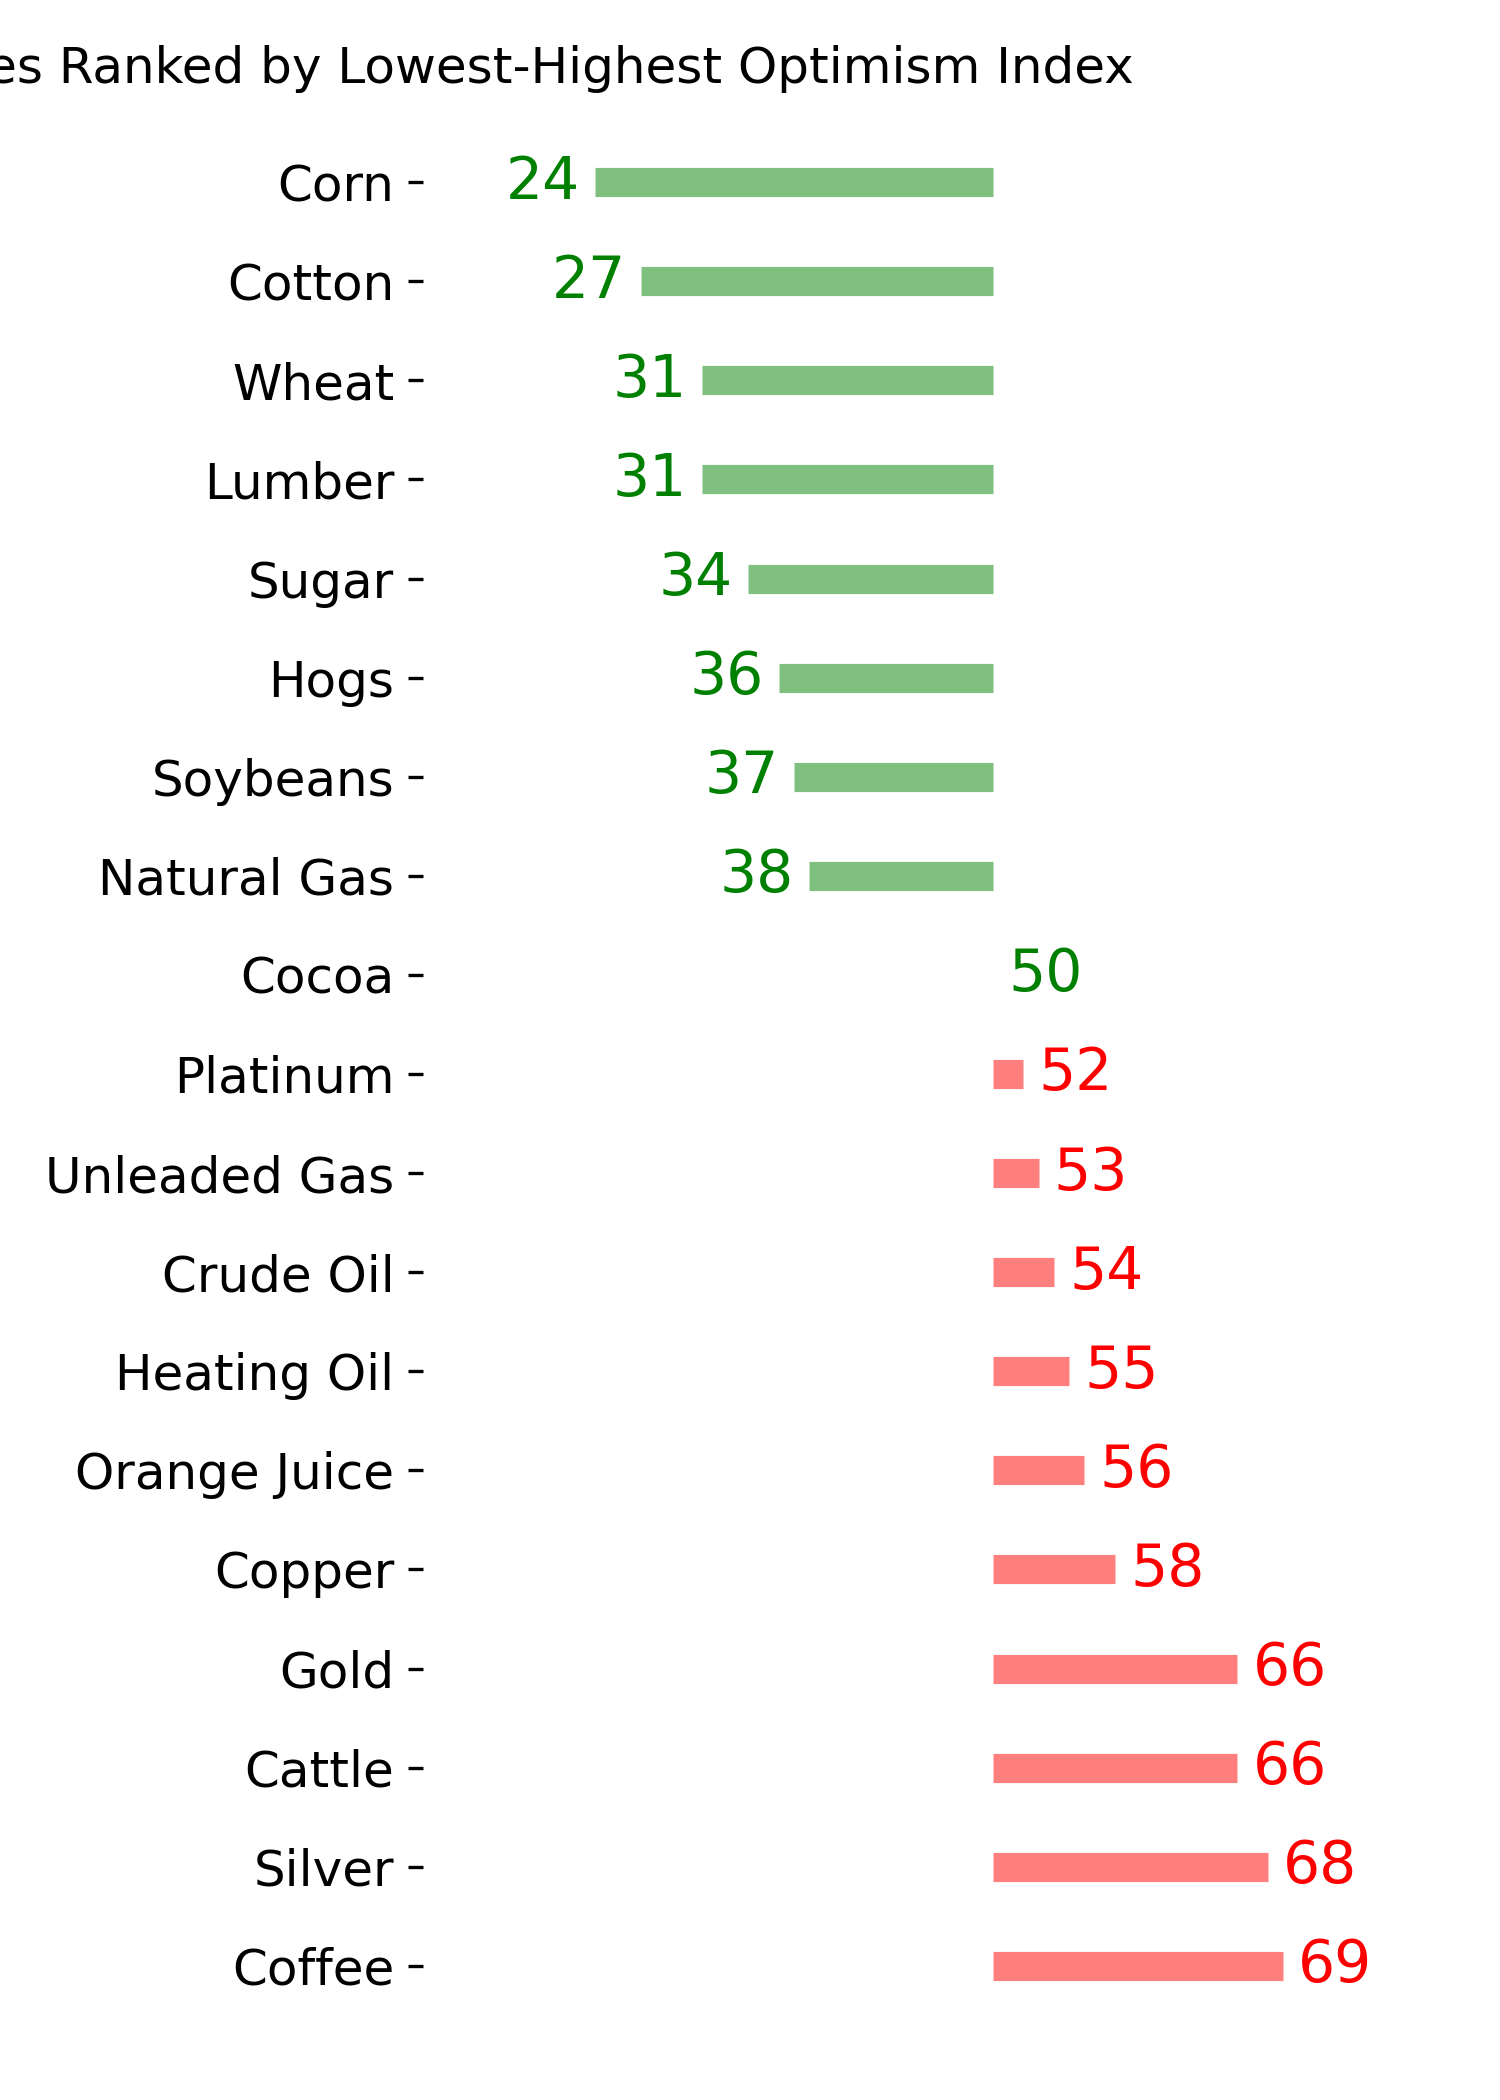
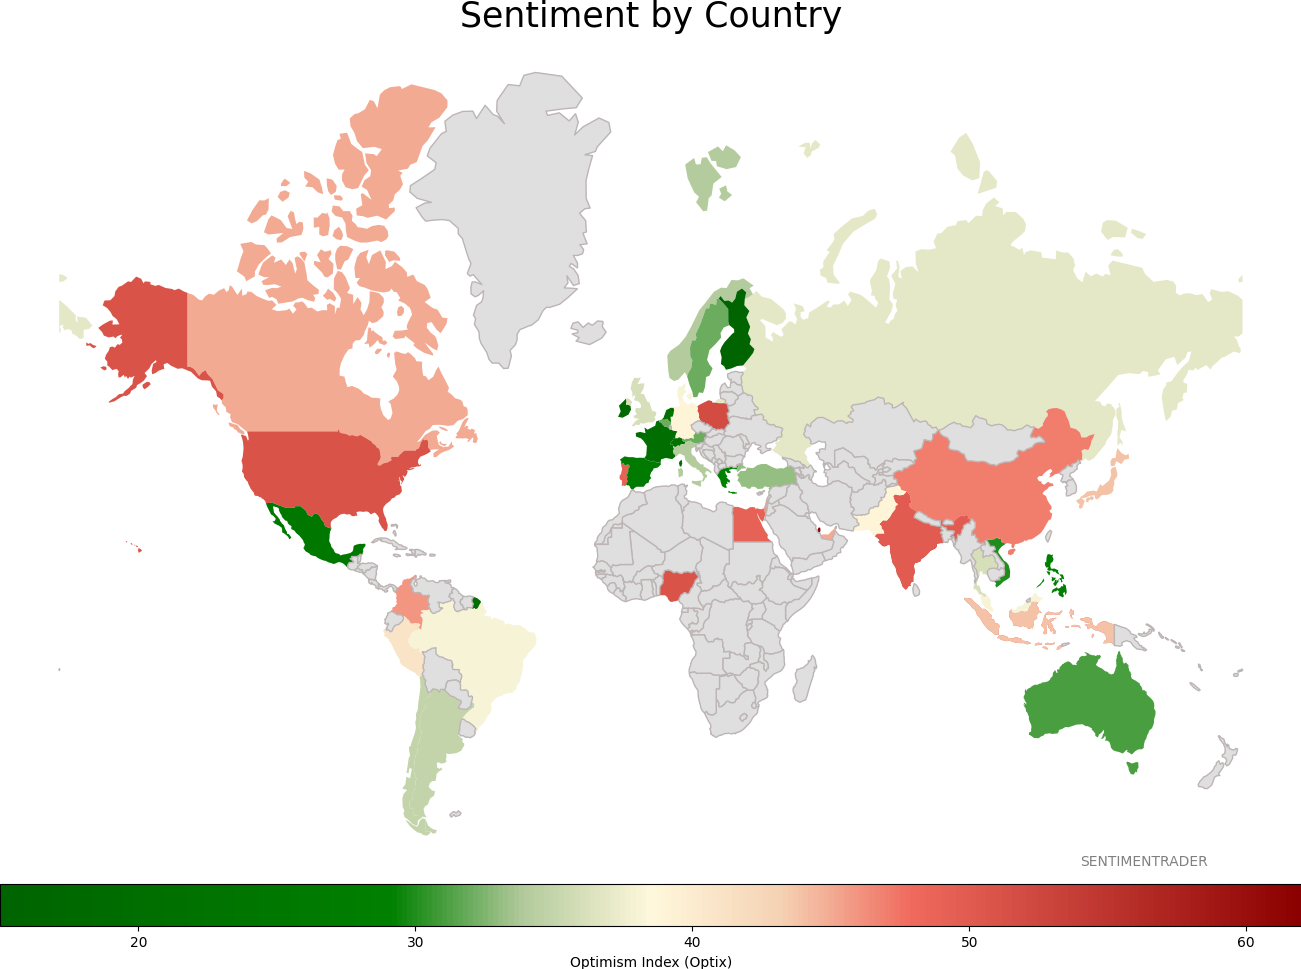
Sentiment Around The World
Optimism Index Thumbnails
|
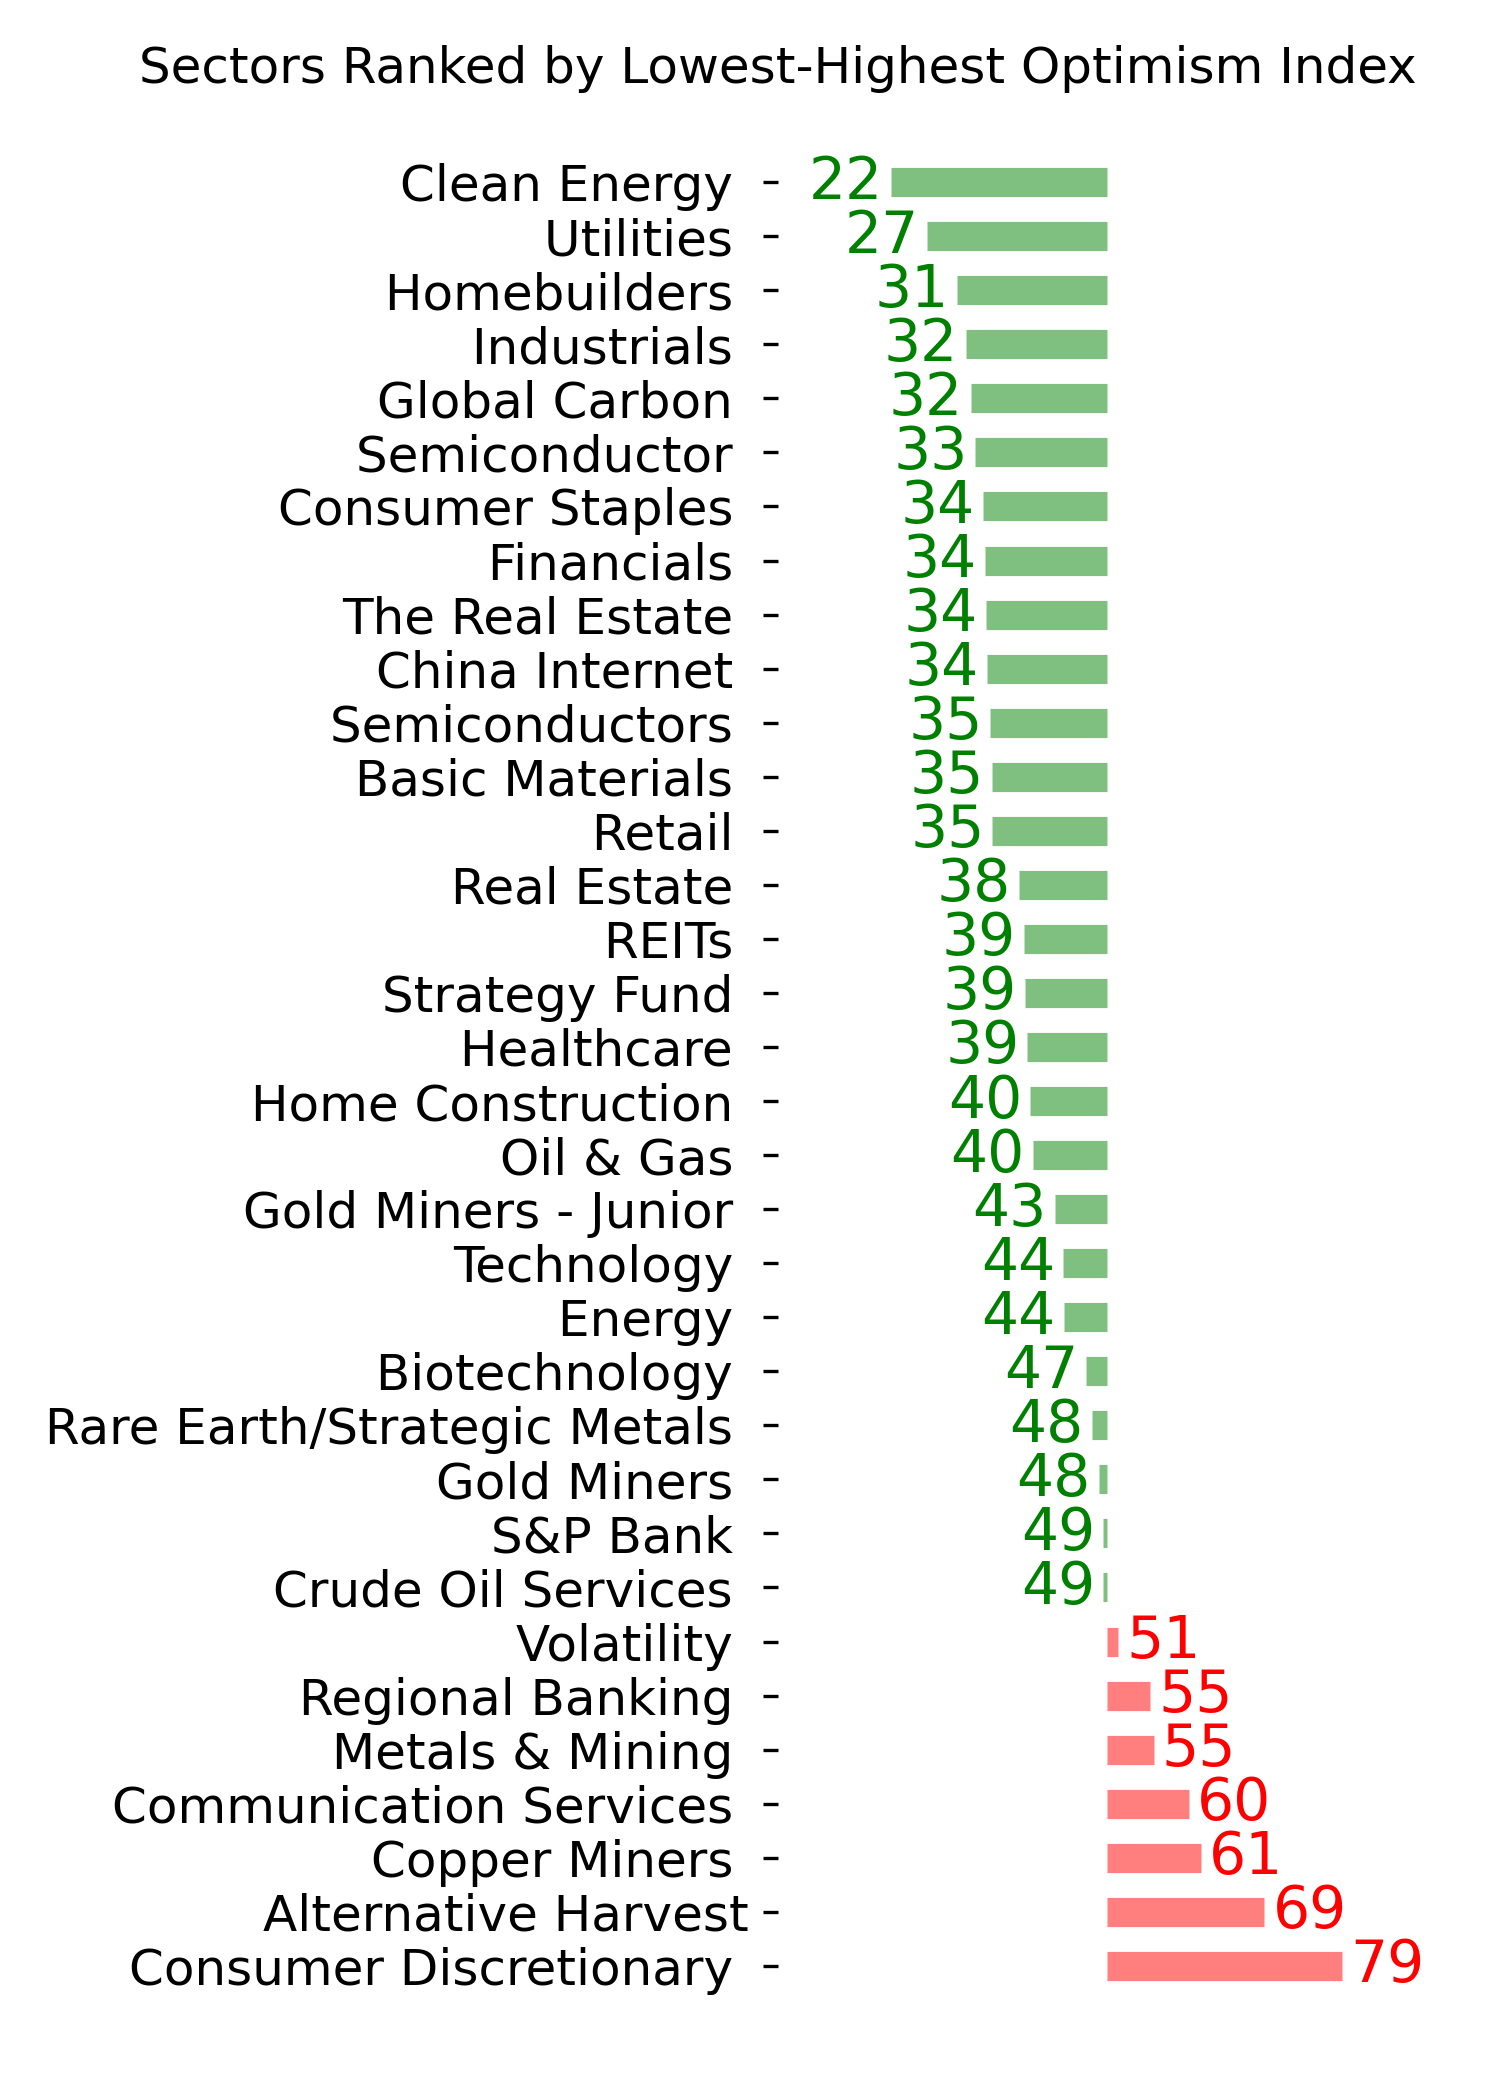
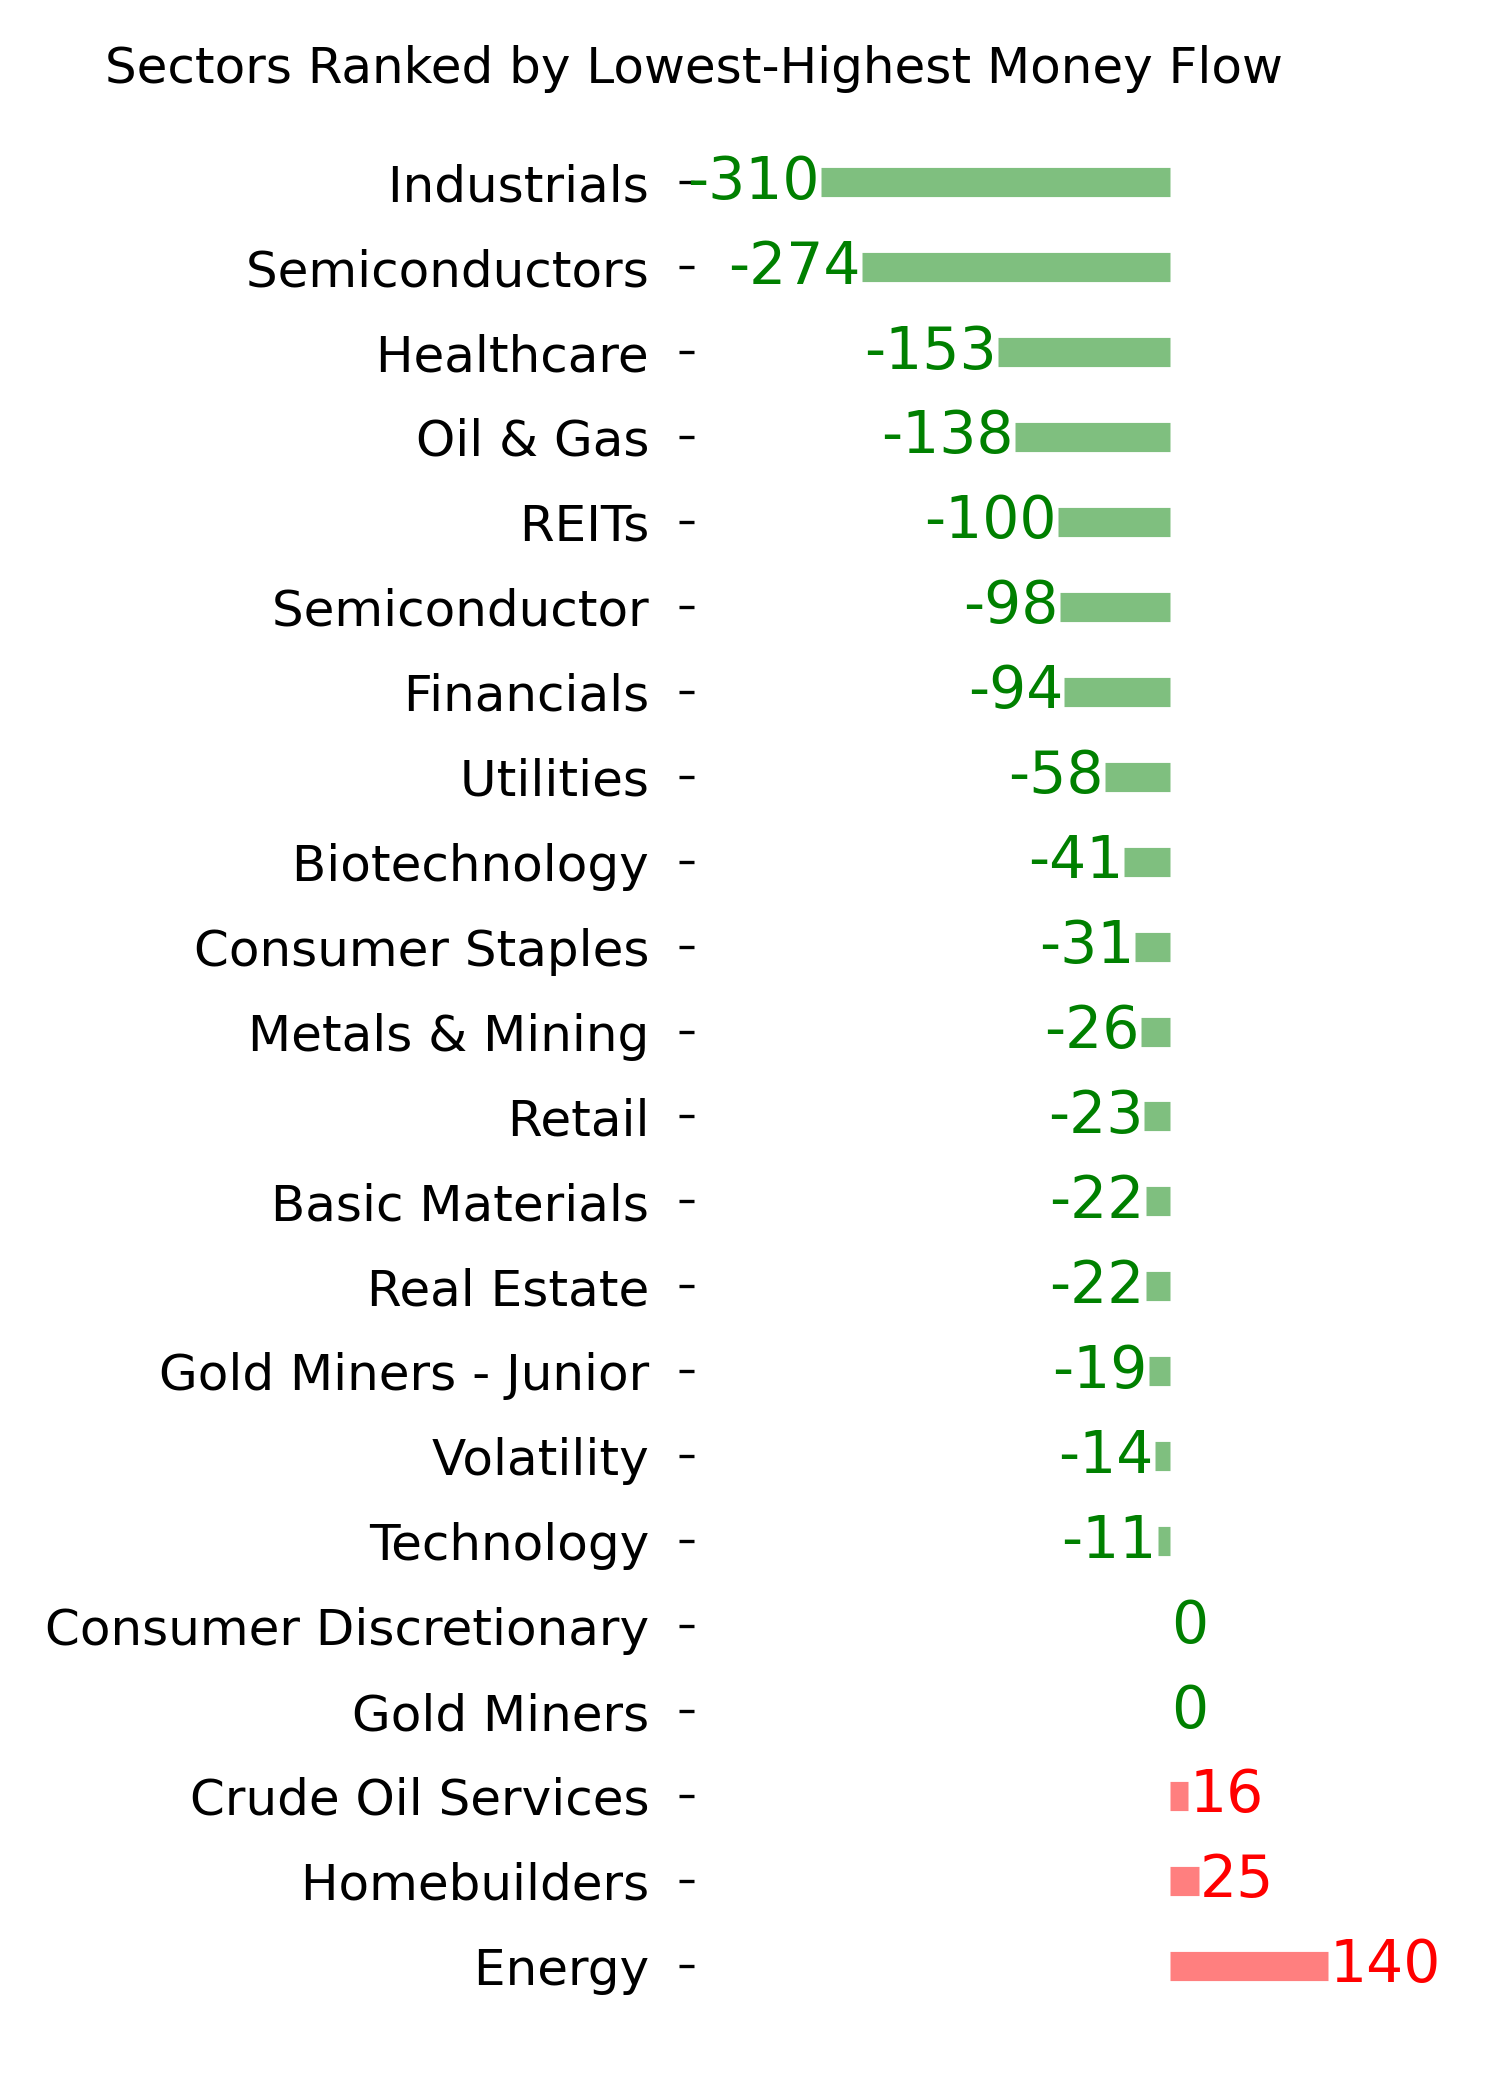
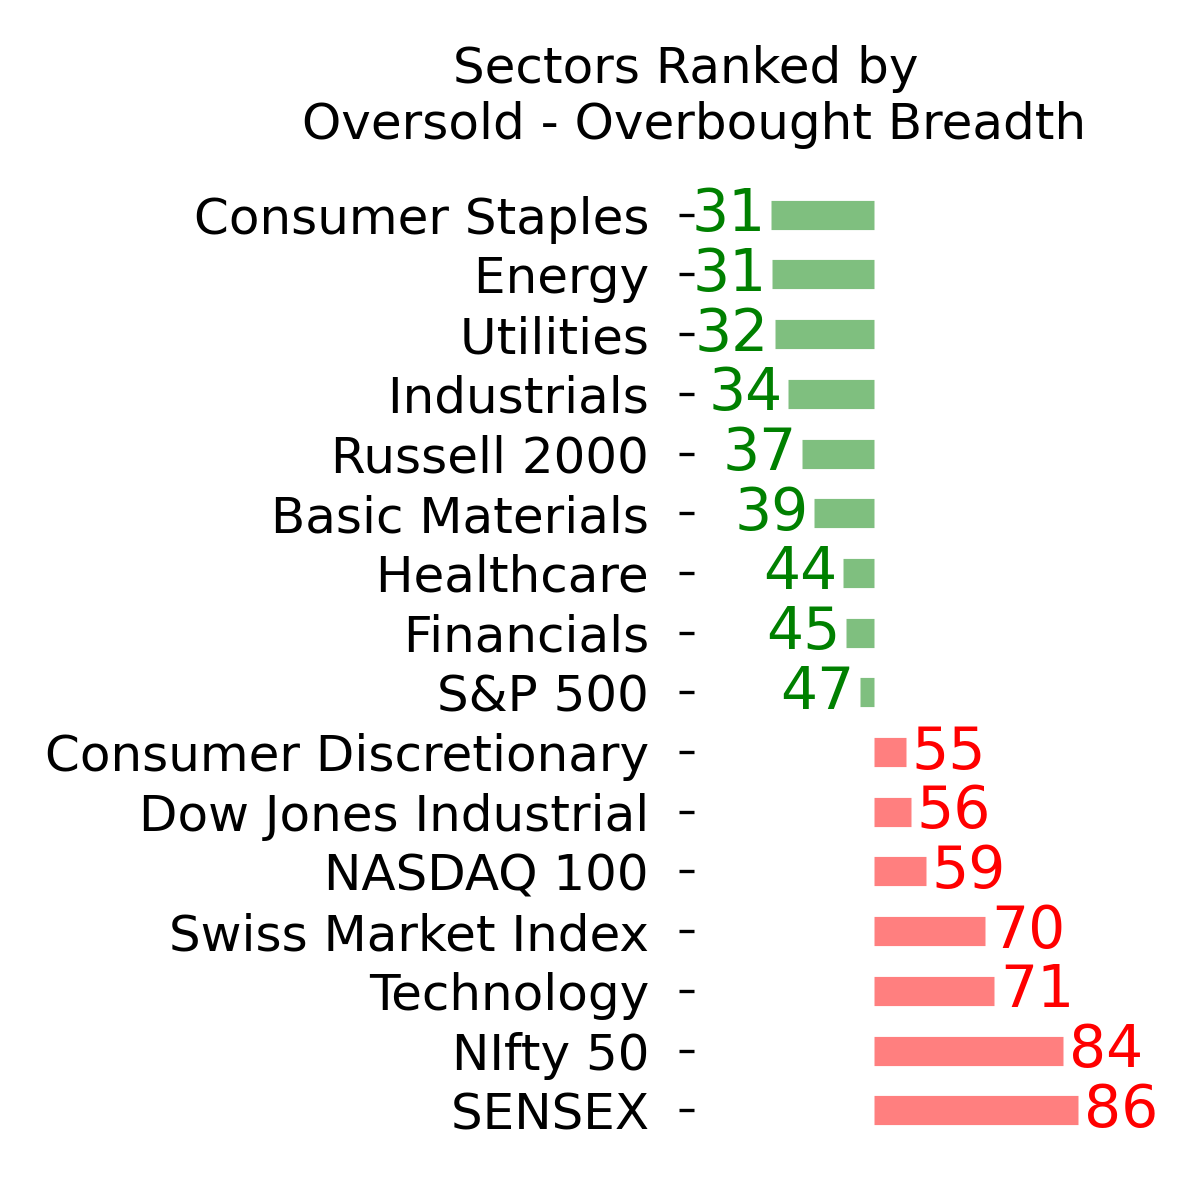
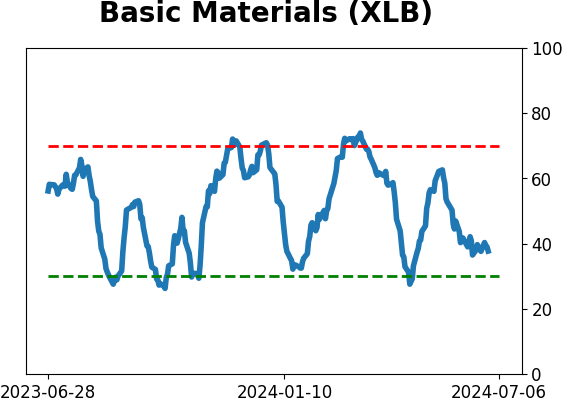
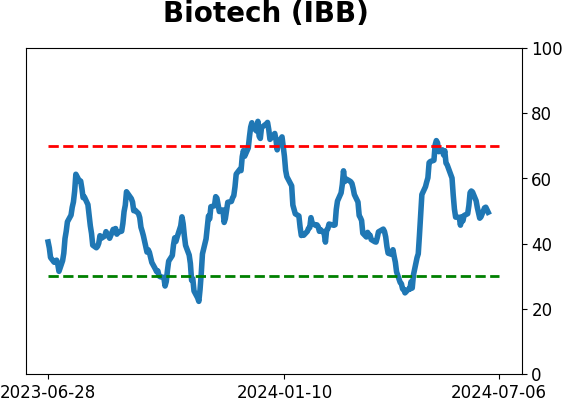
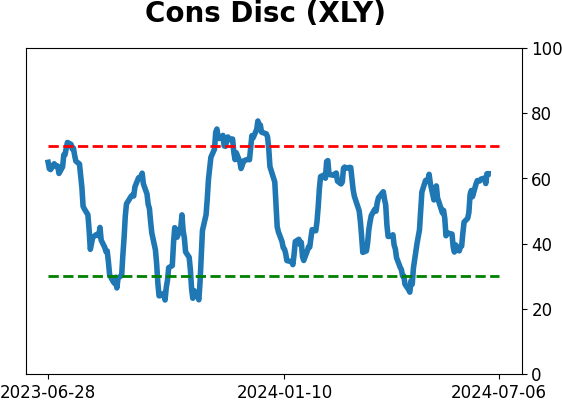
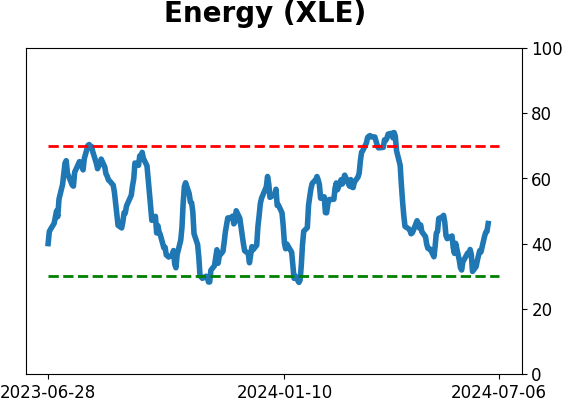
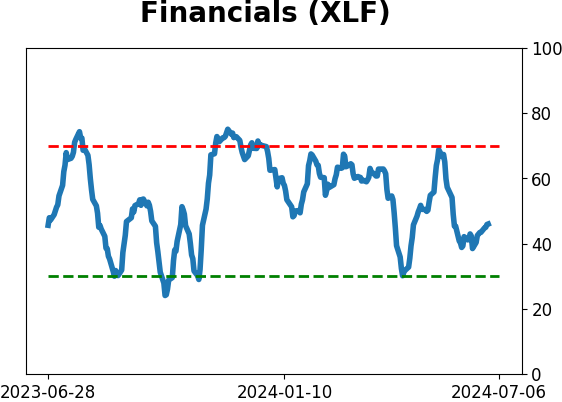
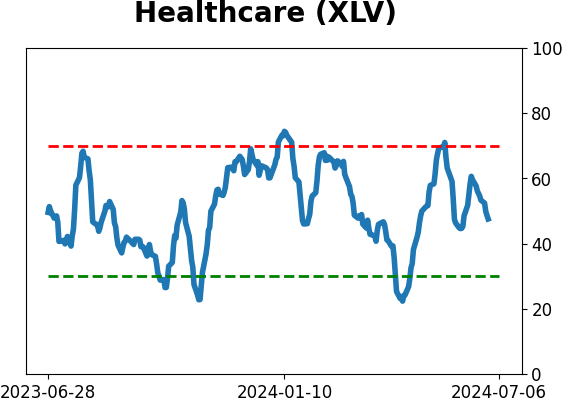
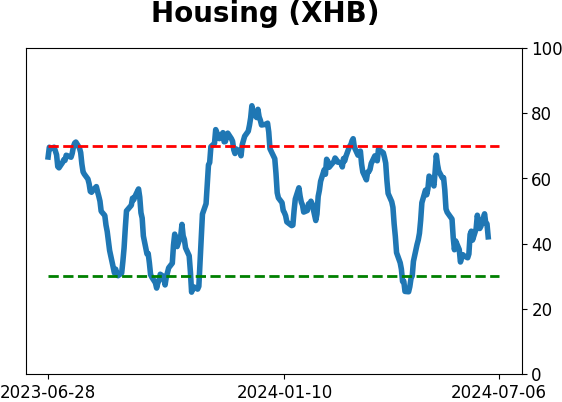
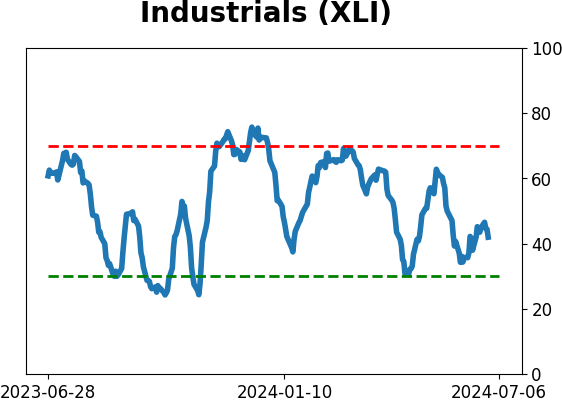
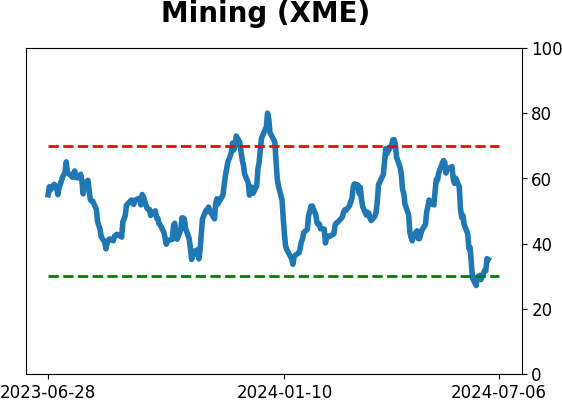
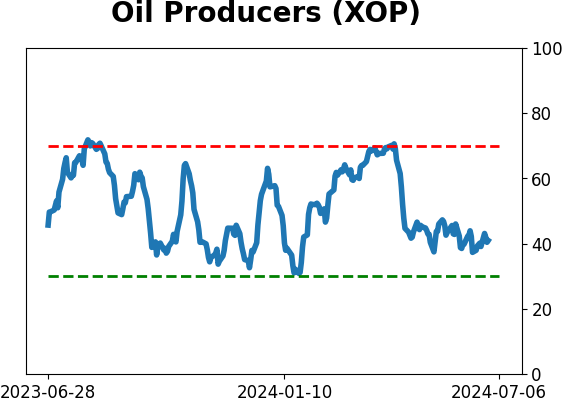
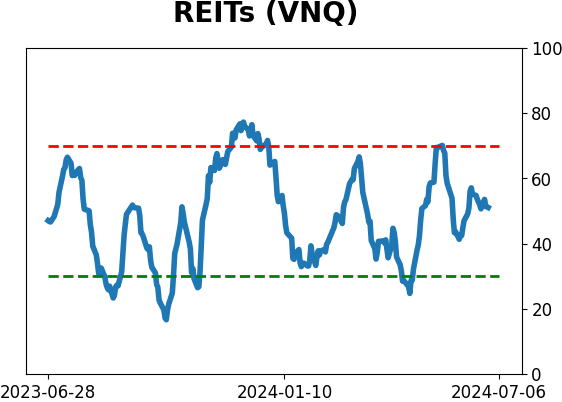
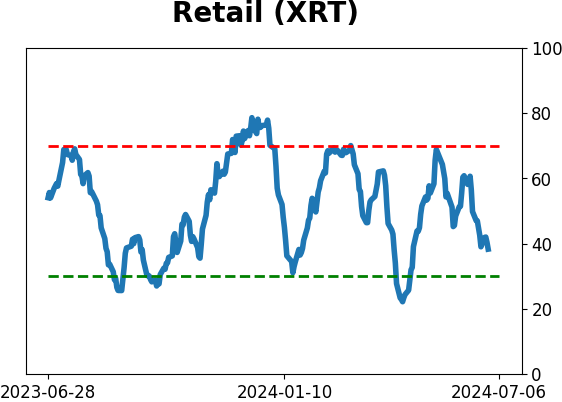
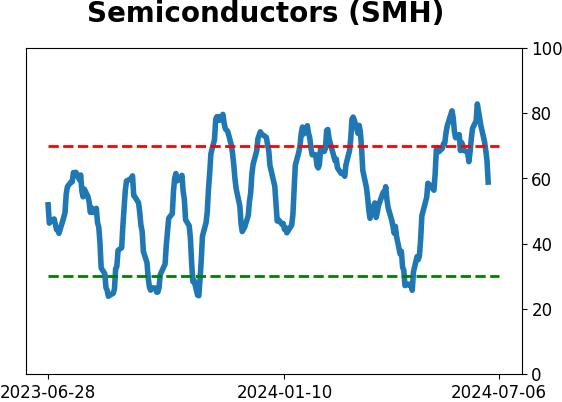
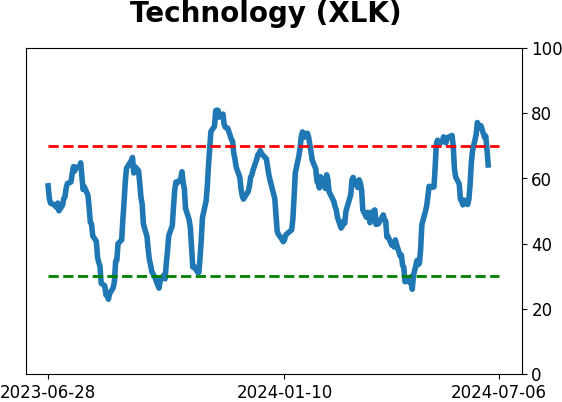
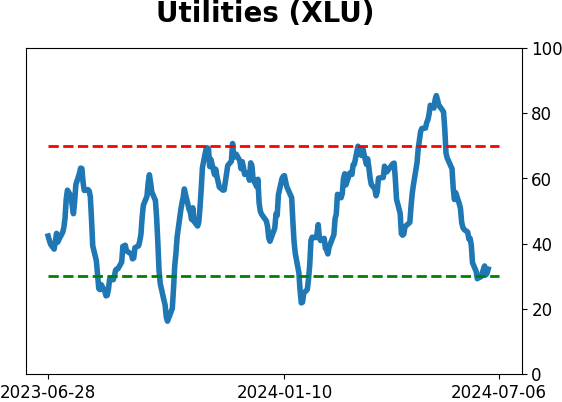
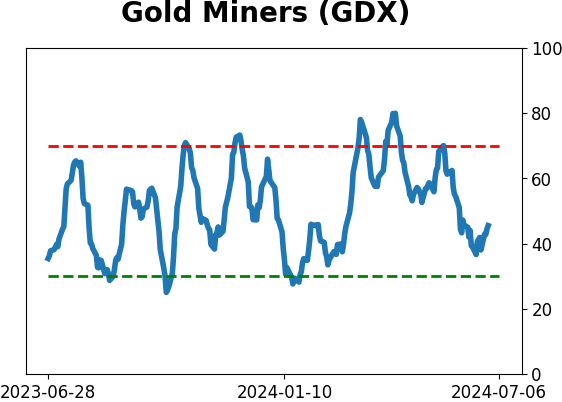
Sector ETF's - 10-Day Moving Average
|
|
|
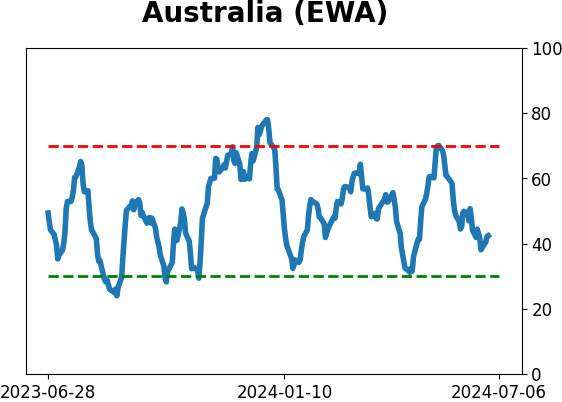
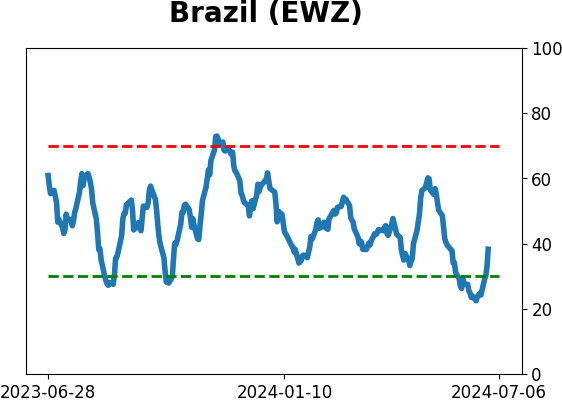
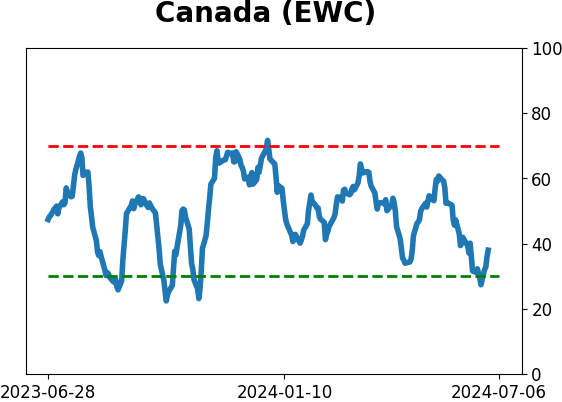
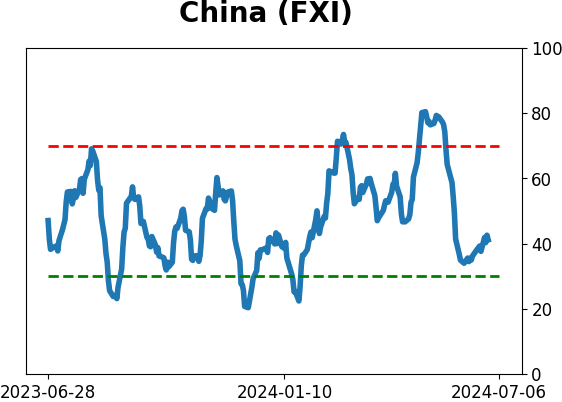
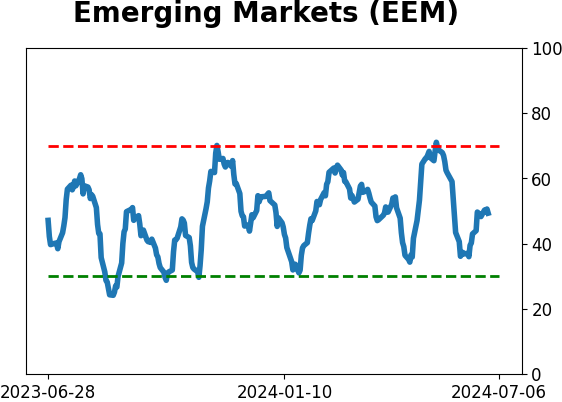
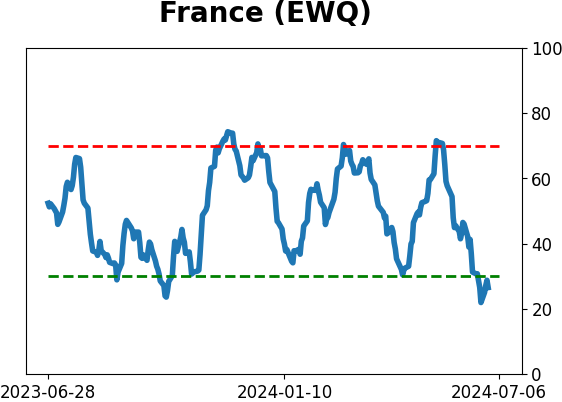
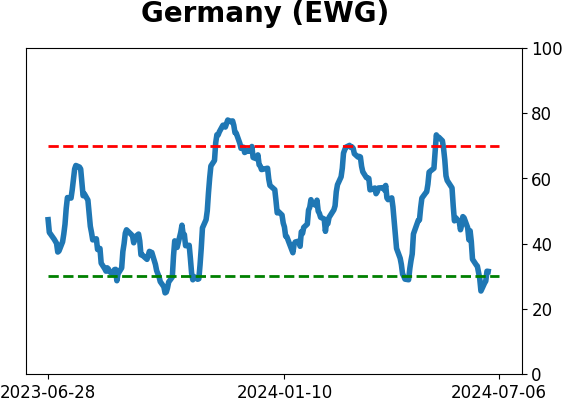
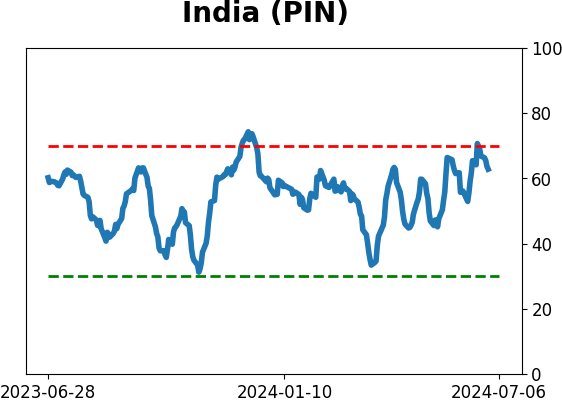
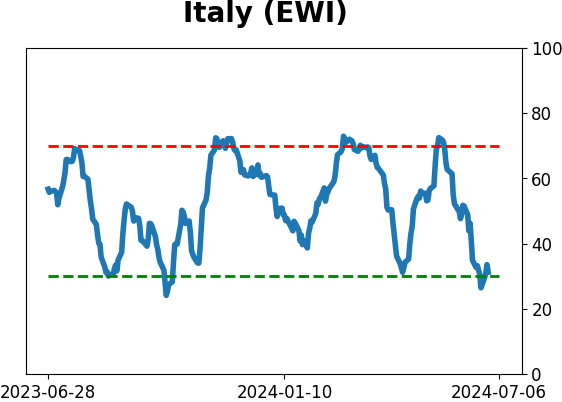
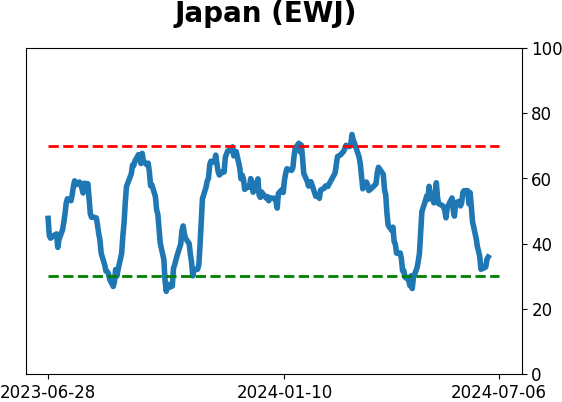
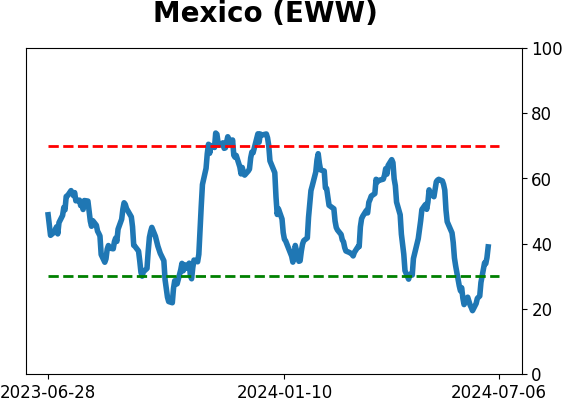
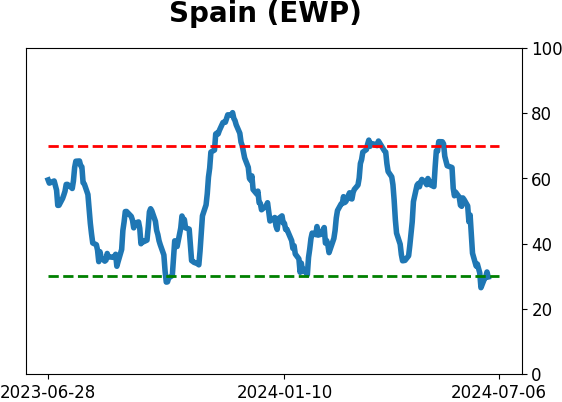
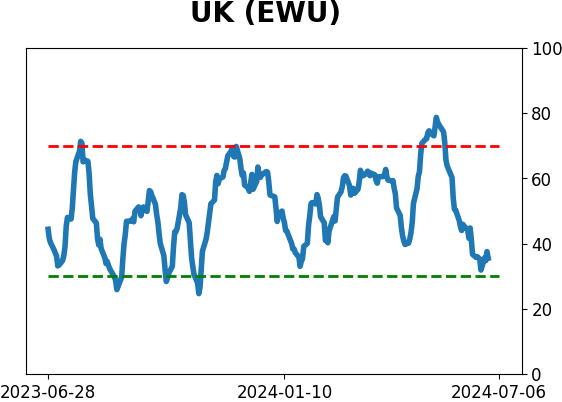
Country ETF's - 10-Day Moving Average
|
|
|
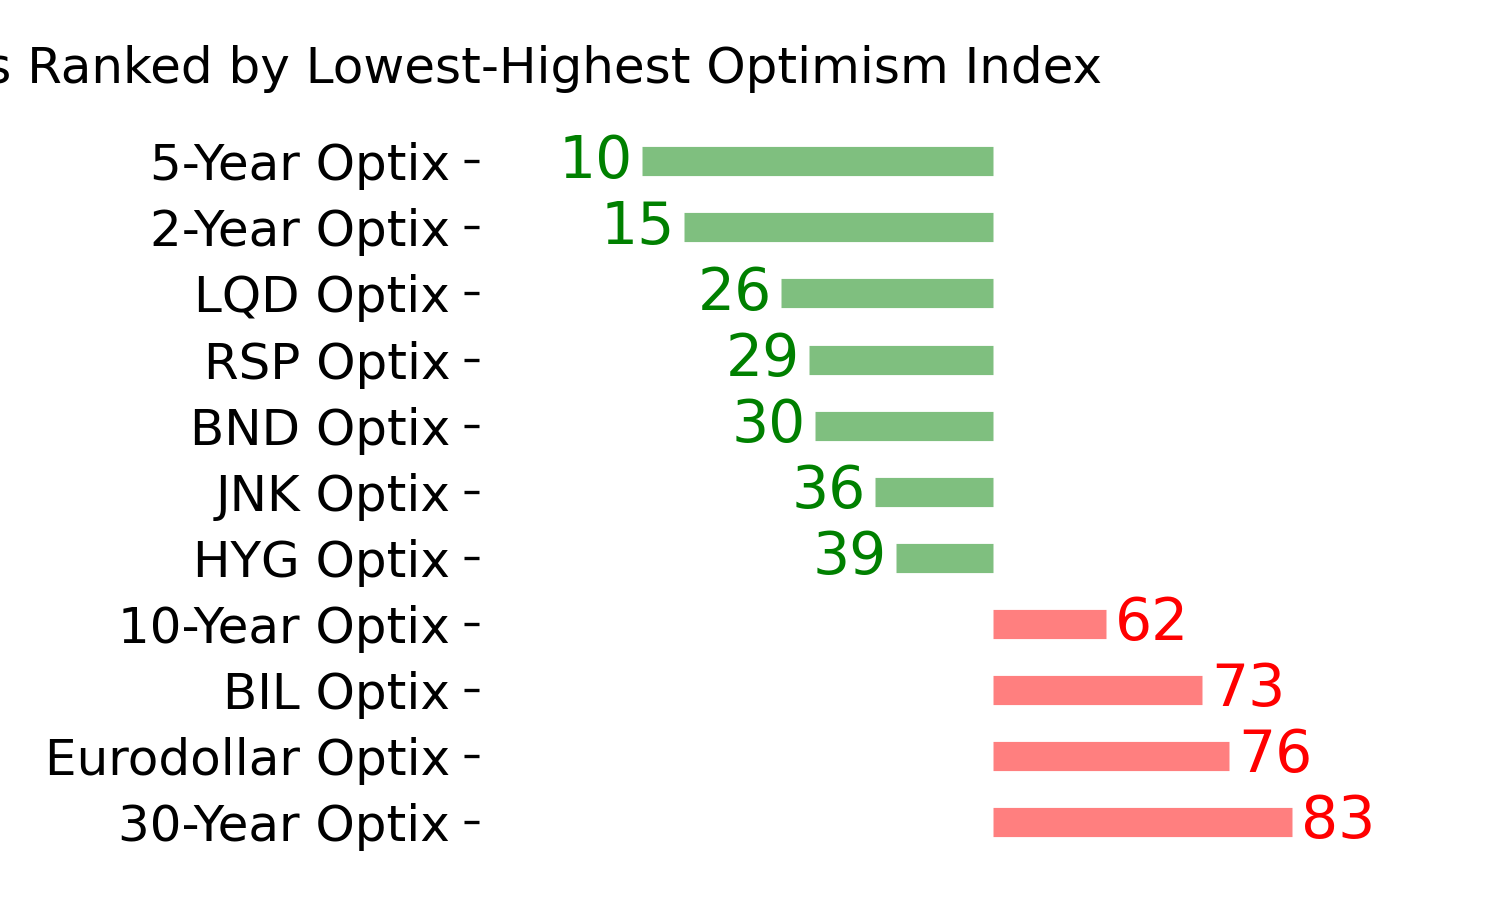
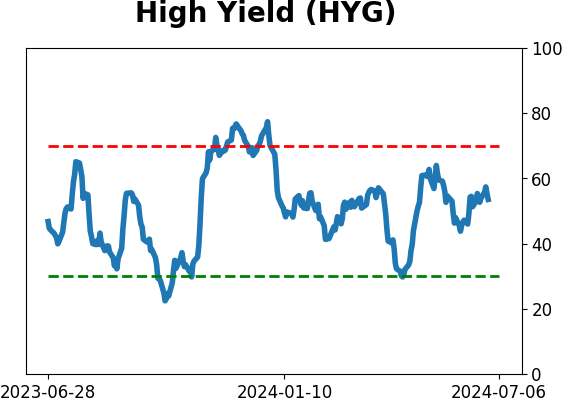
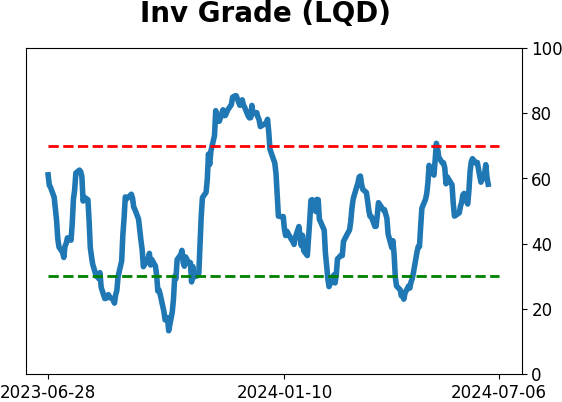
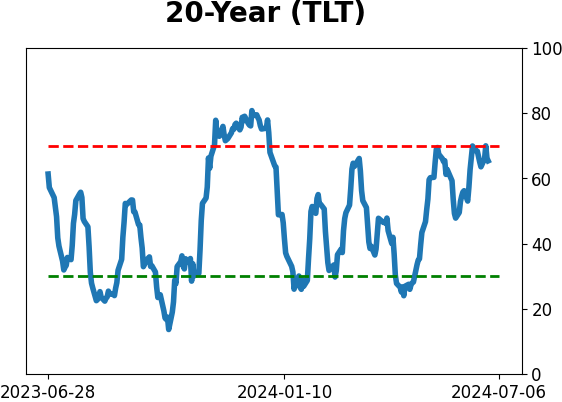
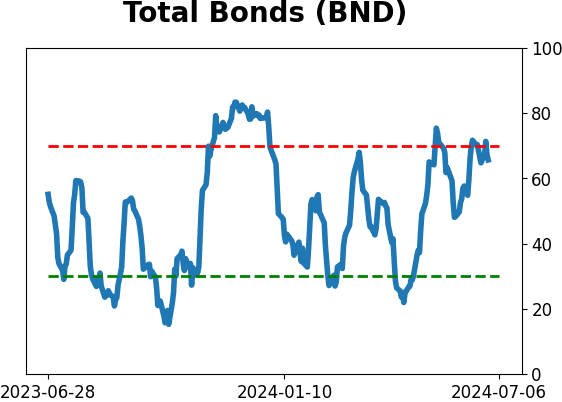
Bond ETF's - 10-Day Moving Average
|
|
|
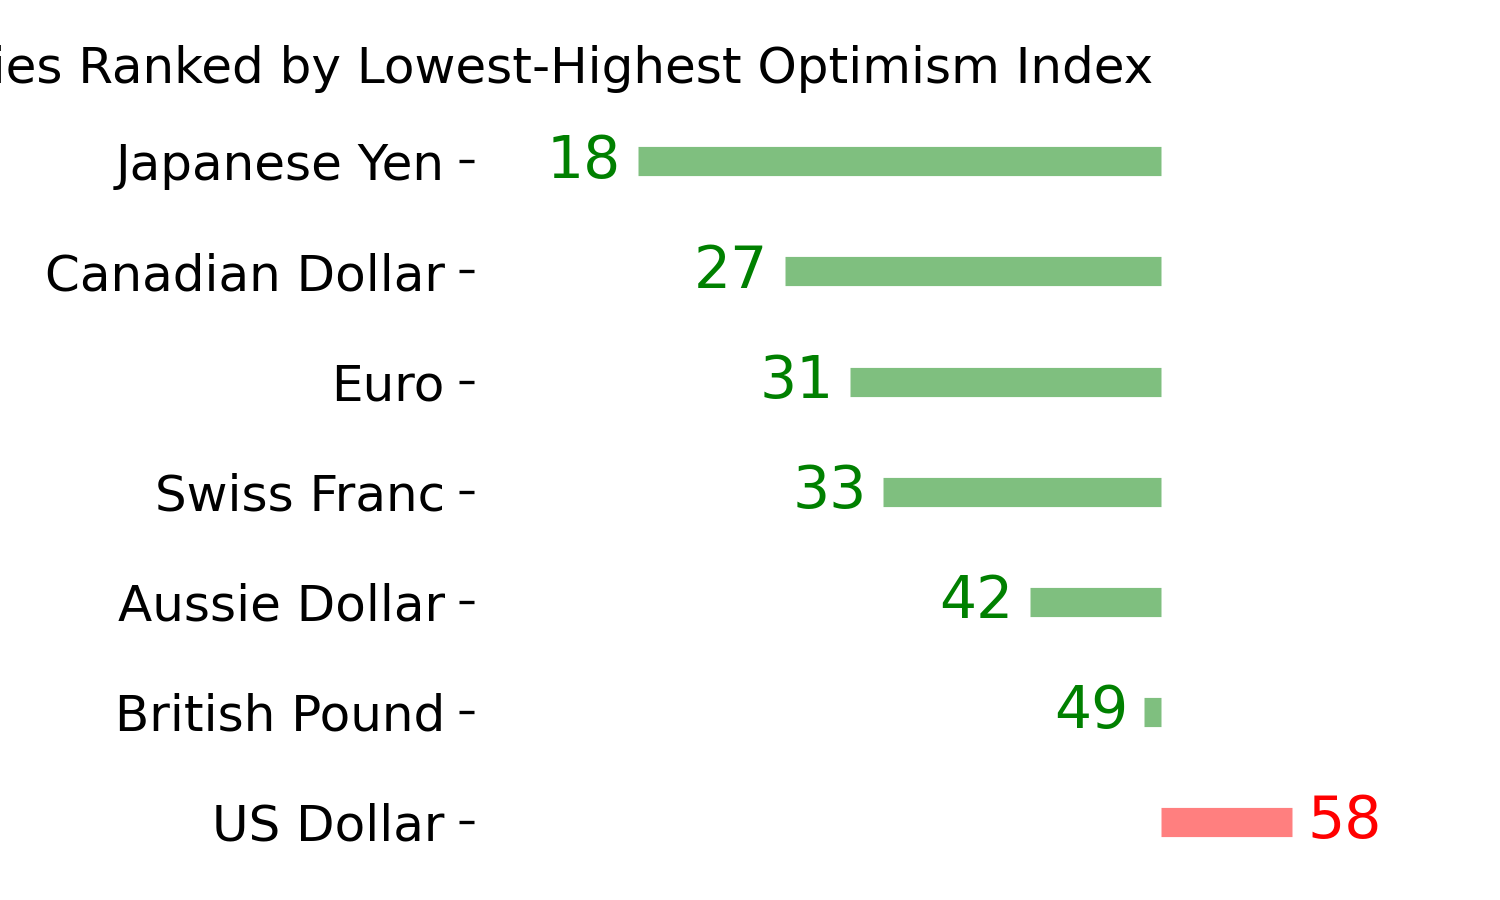
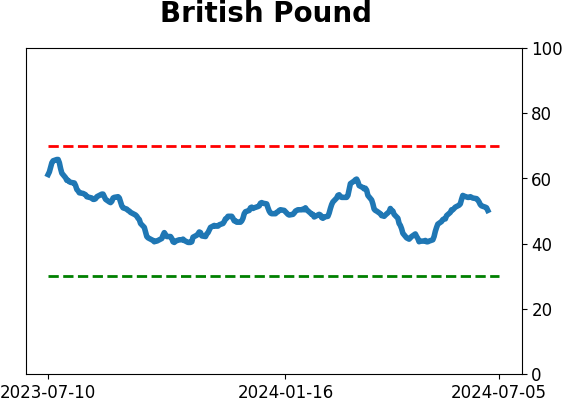
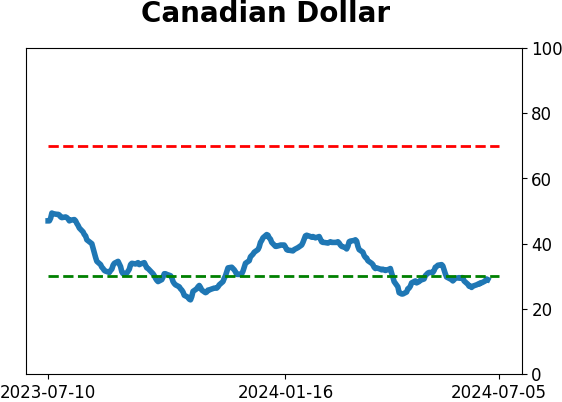
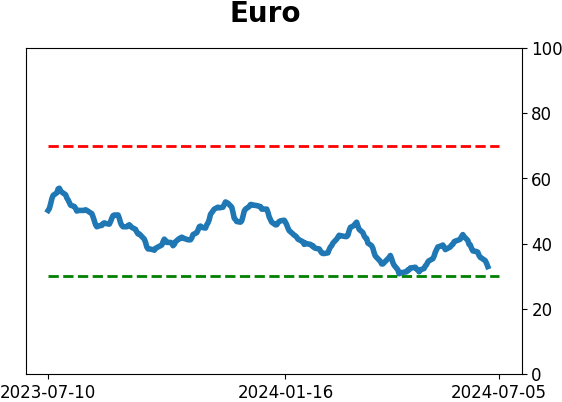
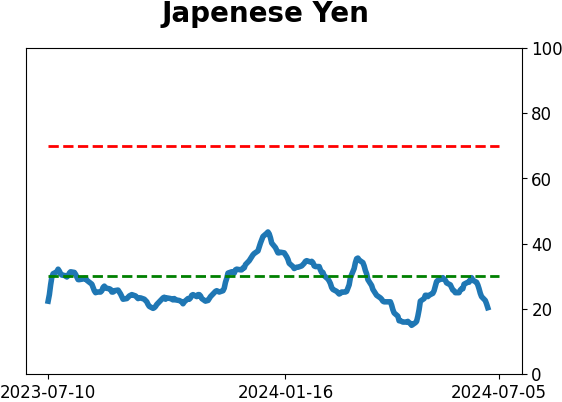
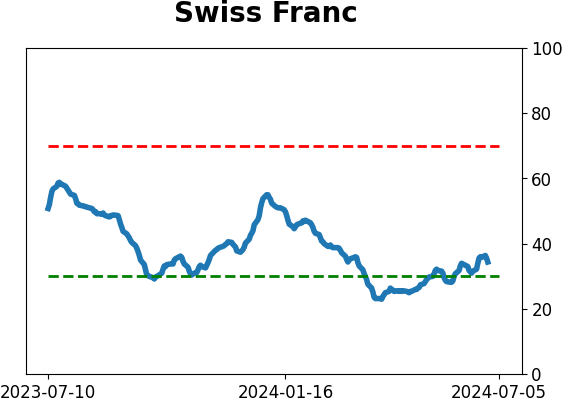
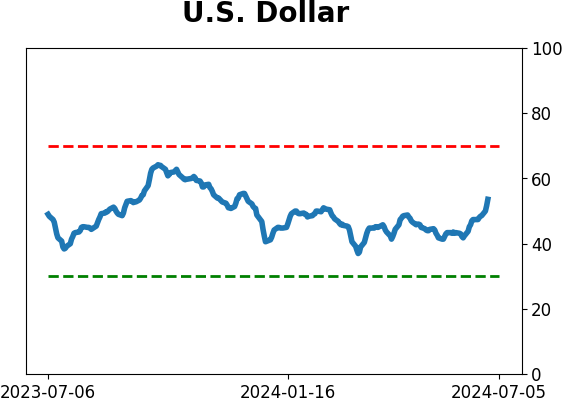
Currency ETF's - 5-Day Moving Average
|
|
|
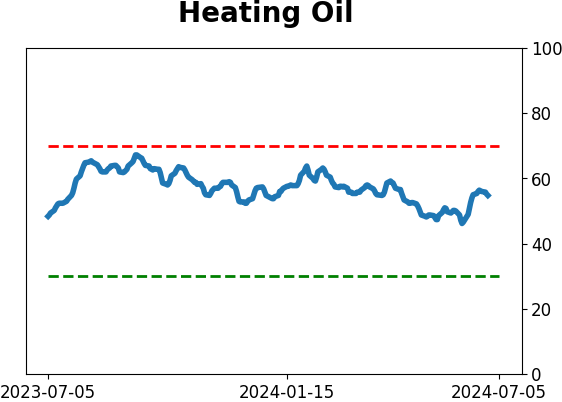
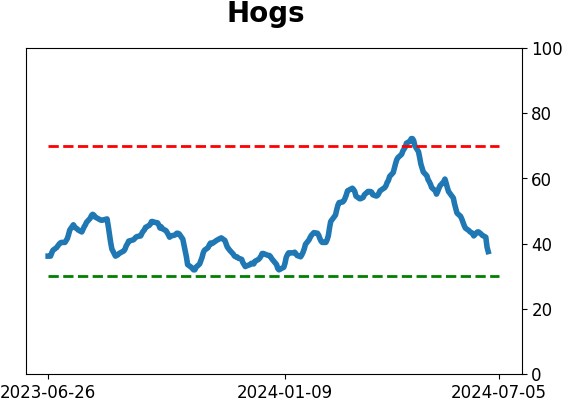
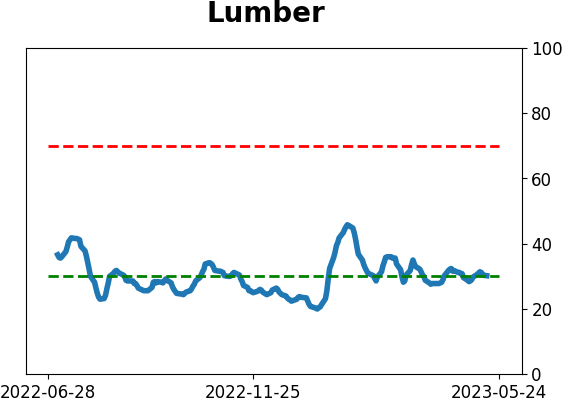
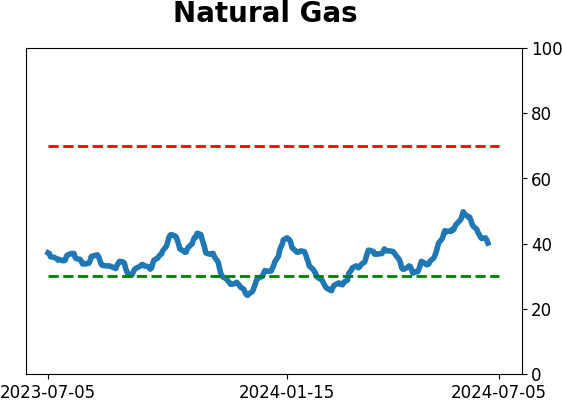
Commodity ETF's - 5-Day Moving Average
|
|