Headlines
|
|
The growth stock resurgence and its impact on the market:
Growth stocks bottomed relative to Value stocks several weeks ago, and held up even when the S&P 500 dived to fresh lows in mid-June. When Growth is leading, it has preceded modestly positive returns for stocks, but didn't necessarily mean that Growth would continue to outperform.
|
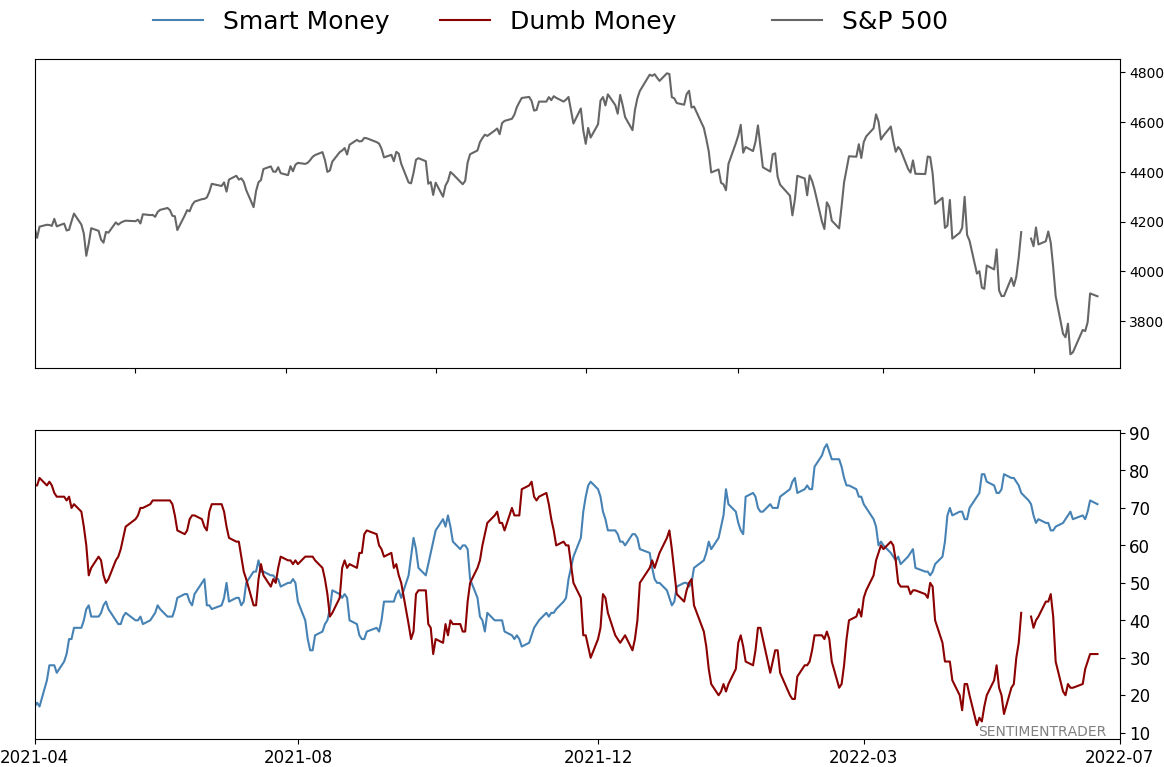
Smart / Dumb Money Confidence
|
Smart Money Confidence: 71%
Dumb Money Confidence: 31%
|
|
Risk Levels
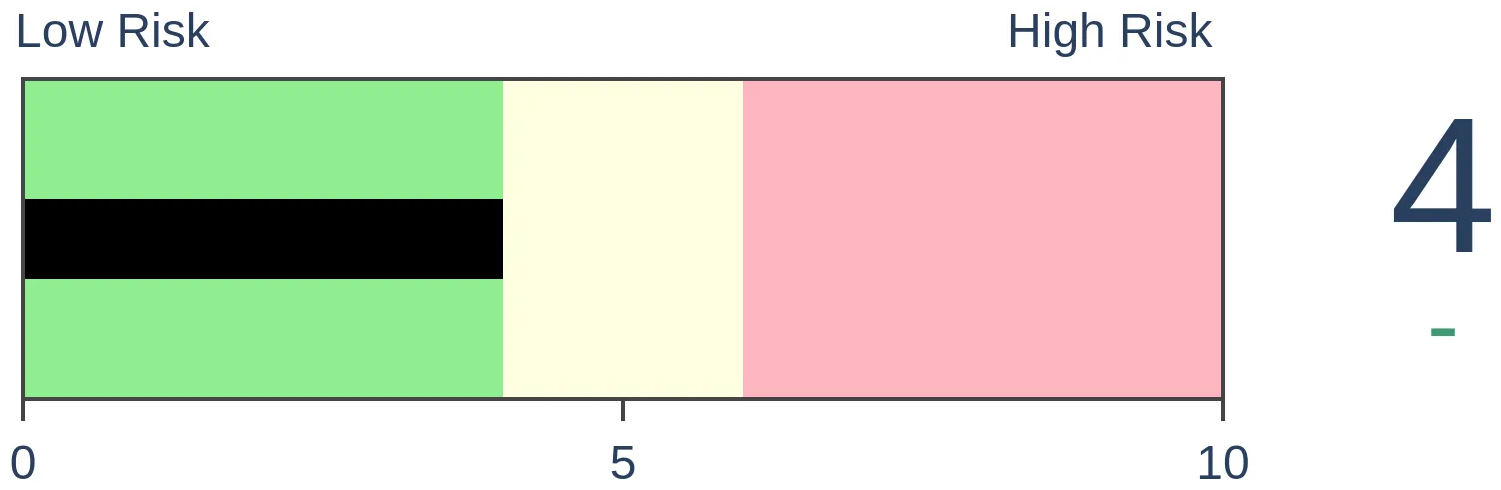
Stocks Short-Term
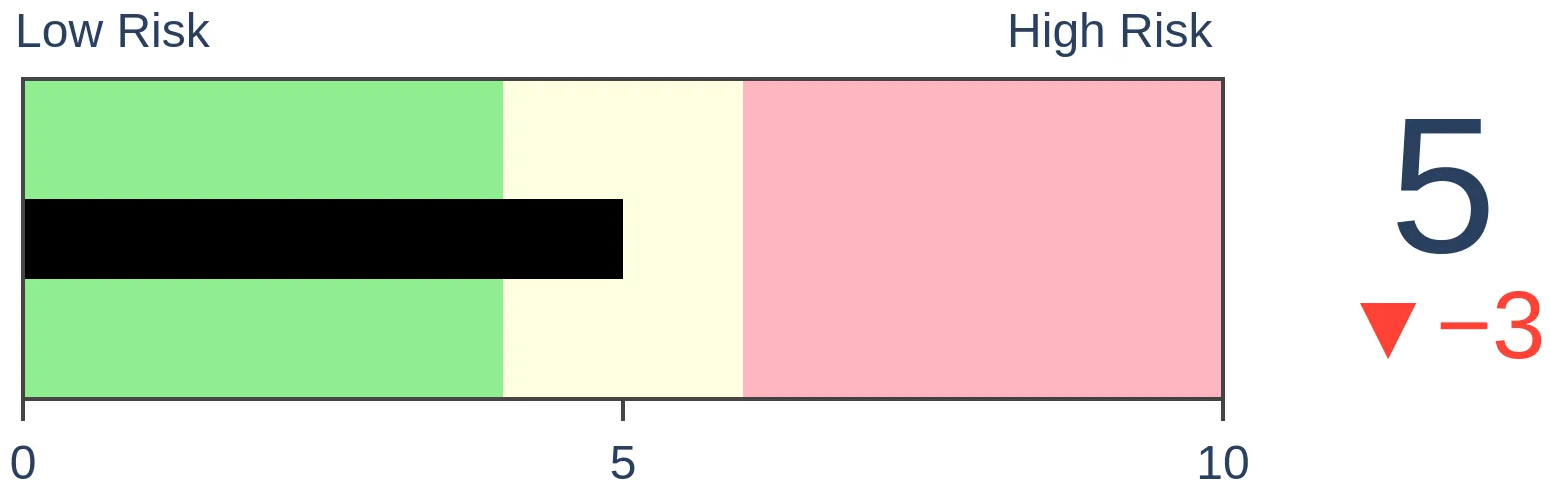
|
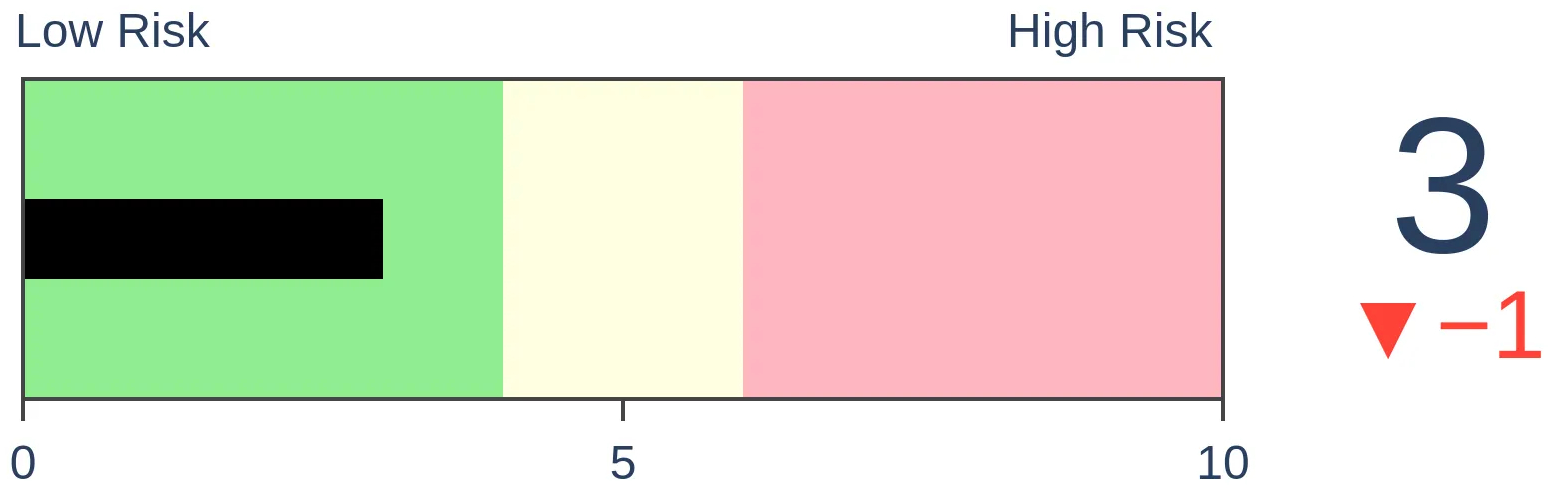
Stocks Medium-Term
|
|
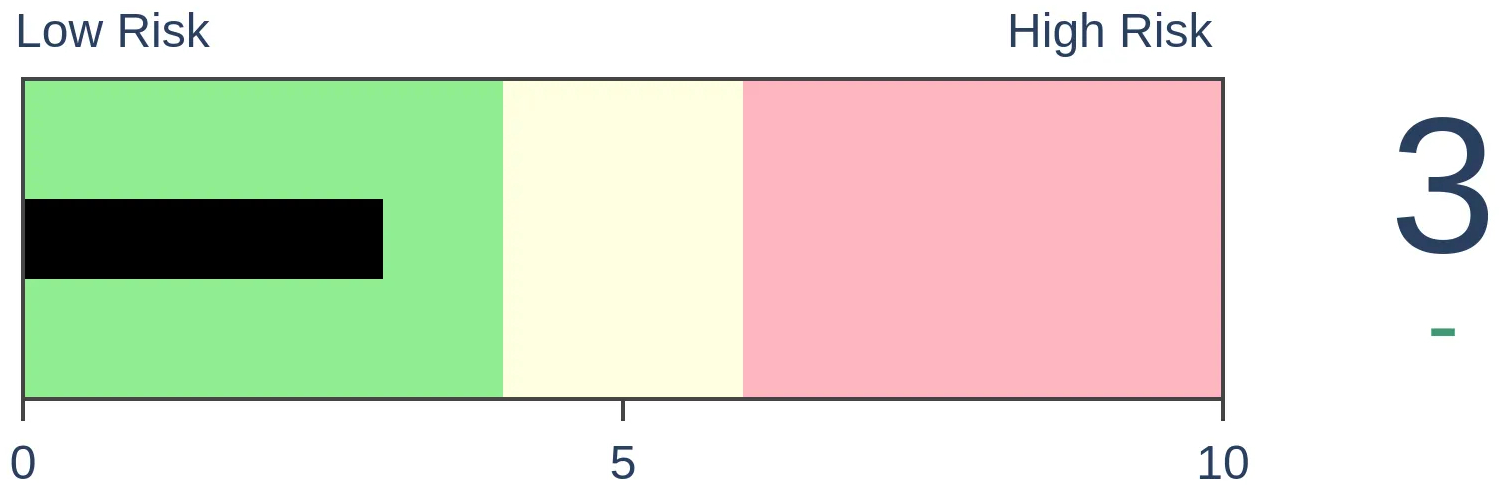
Bonds
|
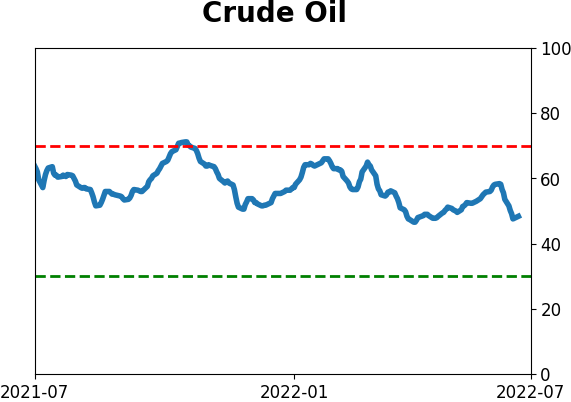
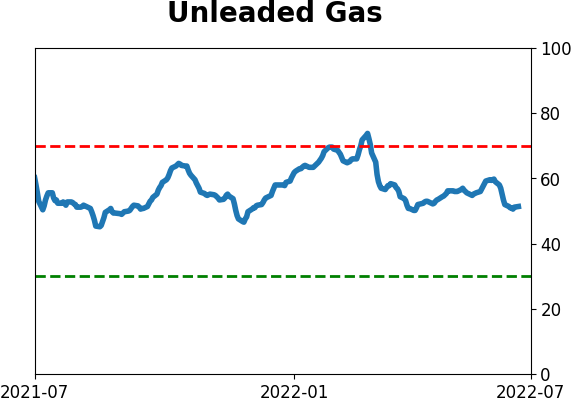
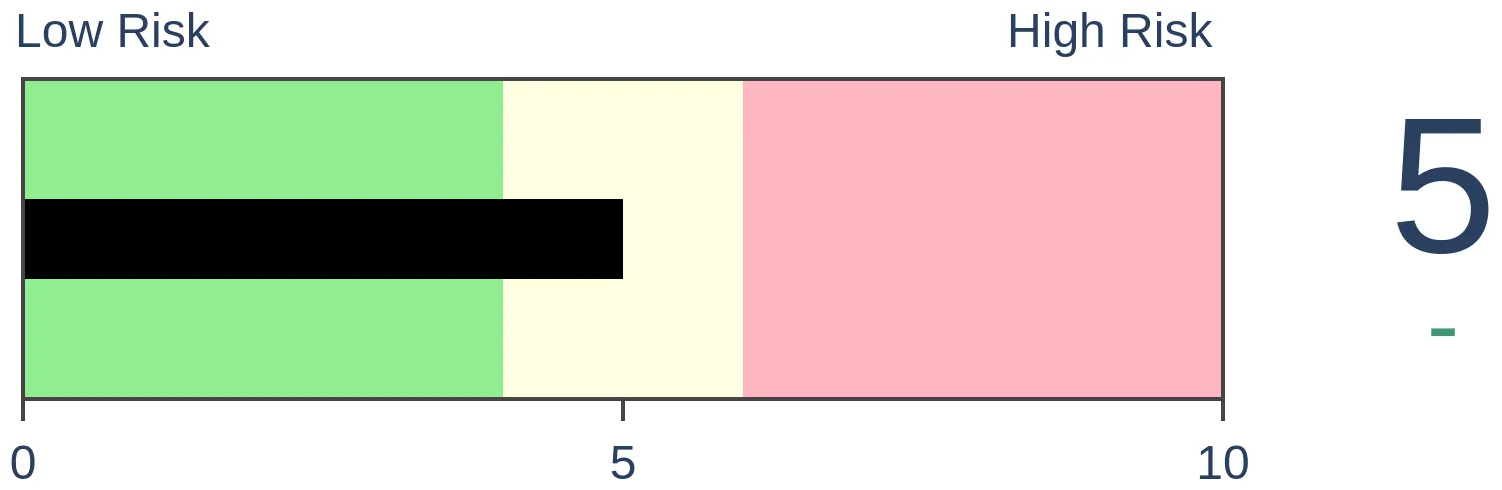
Crude Oil
|
|
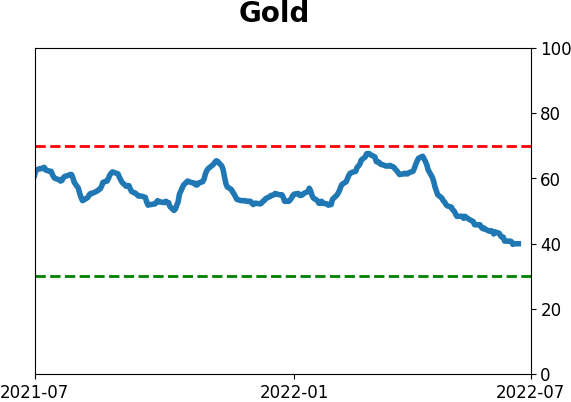
Gold
|
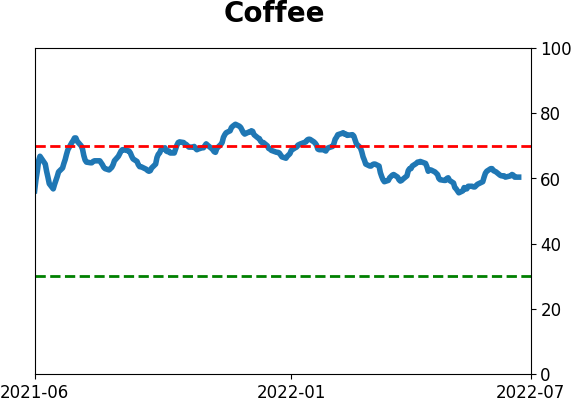
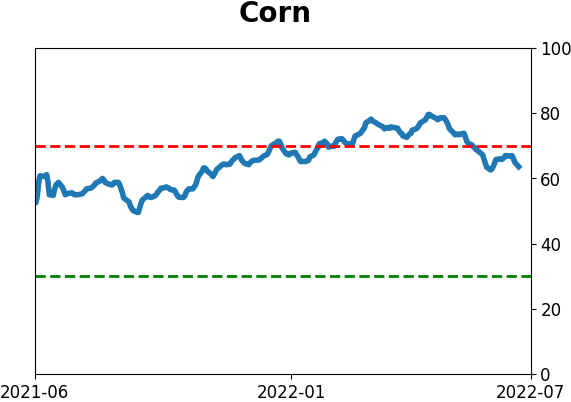
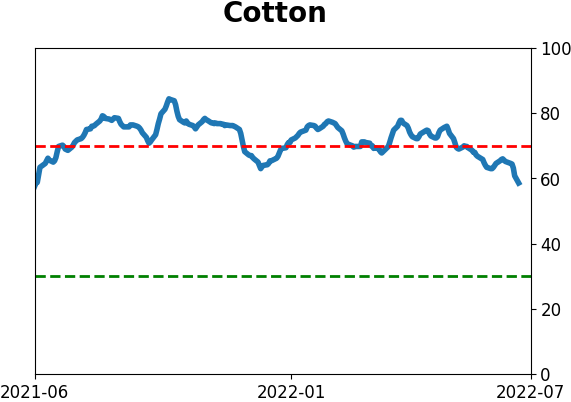
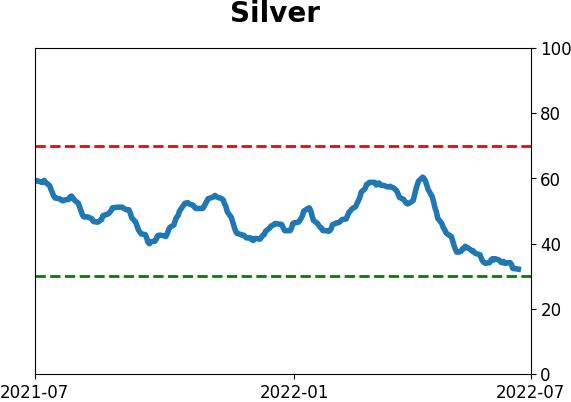
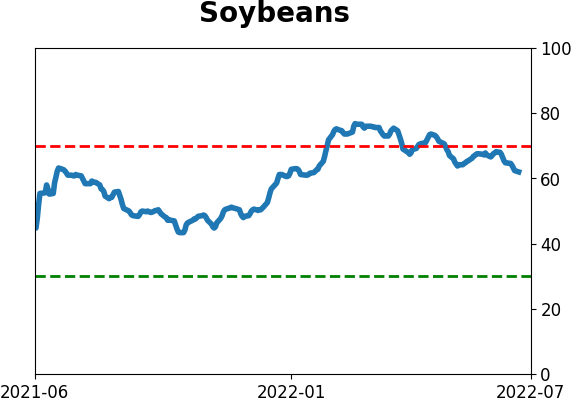
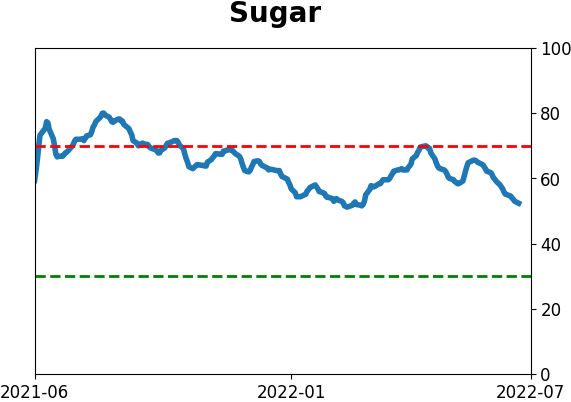
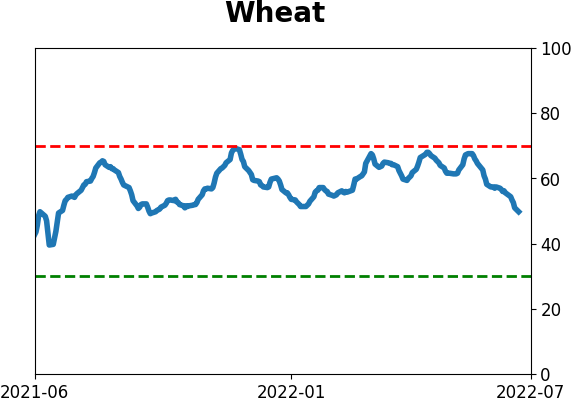
Agriculture

|
|
Research
By Jason Goepfert
BOTTOM LINE
Growth stocks bottomed relative to Value stocks several weeks ago, and held up even when the S&P 500 dived to fresh lows in mid-June. When Growth is leading, it has preceded modestly positive returns for stocks, but didn't necessarily mean that Growth would continue to outperform.
FORECAST / TIMEFRAME
None
|
Key points:
- Growth stocks bottomed relative to Value weeks before the S&P 500 did
- The ratio of Growth to Value just hit a 30-day high while the S&P is still well below its own high
- These divergences led to mildly positive returns for stocks but not necessarily for Growth
A positive divergence in Growth
Growth is back. Well, kind of - it's still early days.
After falling to a 52-week low on May 24, the ratio of Growth to Value stocks shot higher and stabilized. When the S&P 500 plunged to a new low in mid-June, Growth stocks held up relative to Value. That's the first real positive divergence during this bear market.
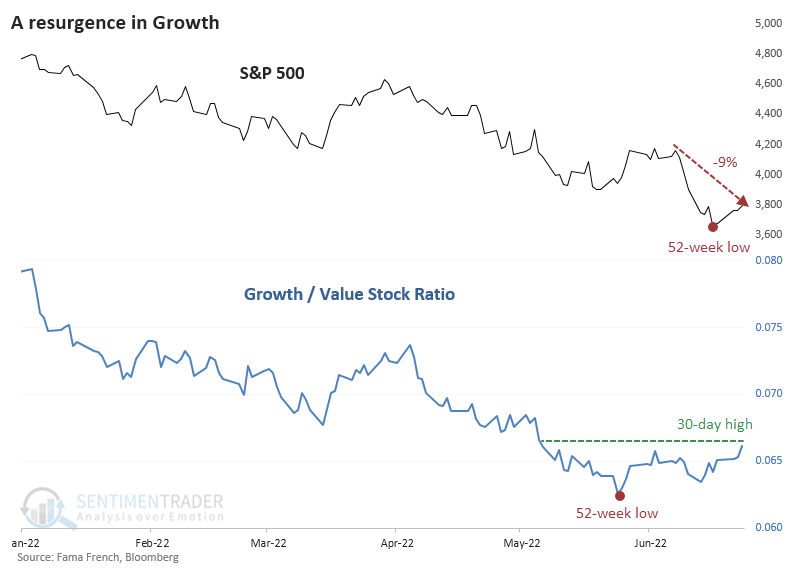
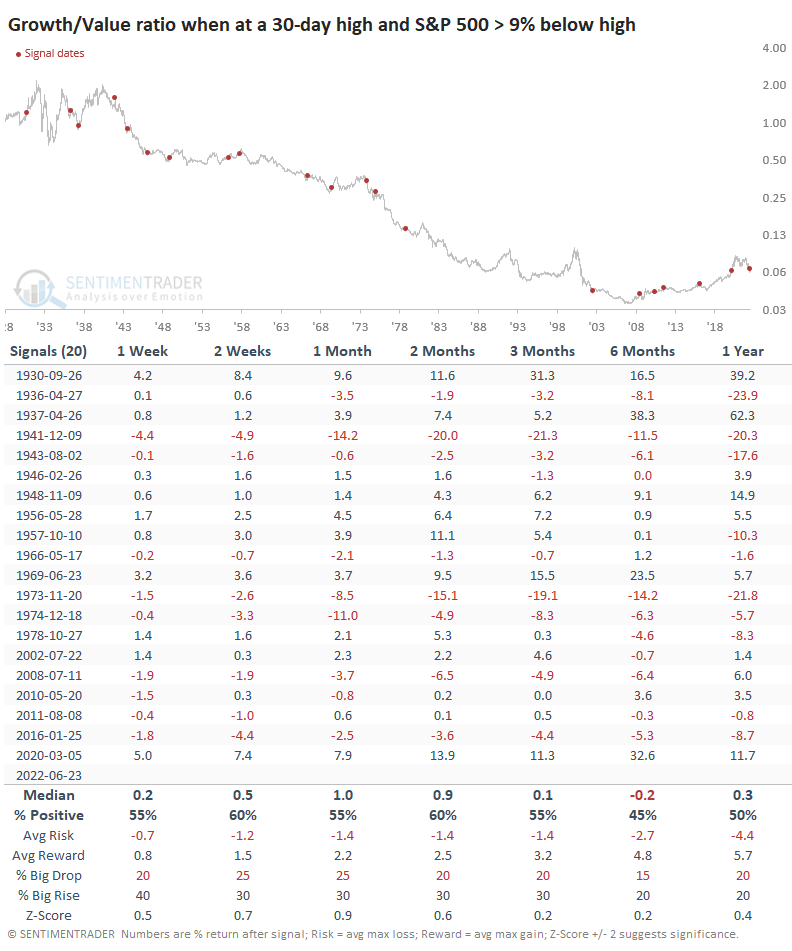
By late last week, the Growth/Value Ratio had climbed to a 30-day high, while the S&P was still more than 9% below its own high. Because of the rush to tech stocks during the pandemic, a similar divergence triggered in early March 2020, which was a horrible buy signal for the broader market.
But during "normal" market conditions, whatever those are, when the Growth/Value Ratio leads the S&P, it has mostly been a good sign. Not perfect, by any means, with a few double-digit losses.
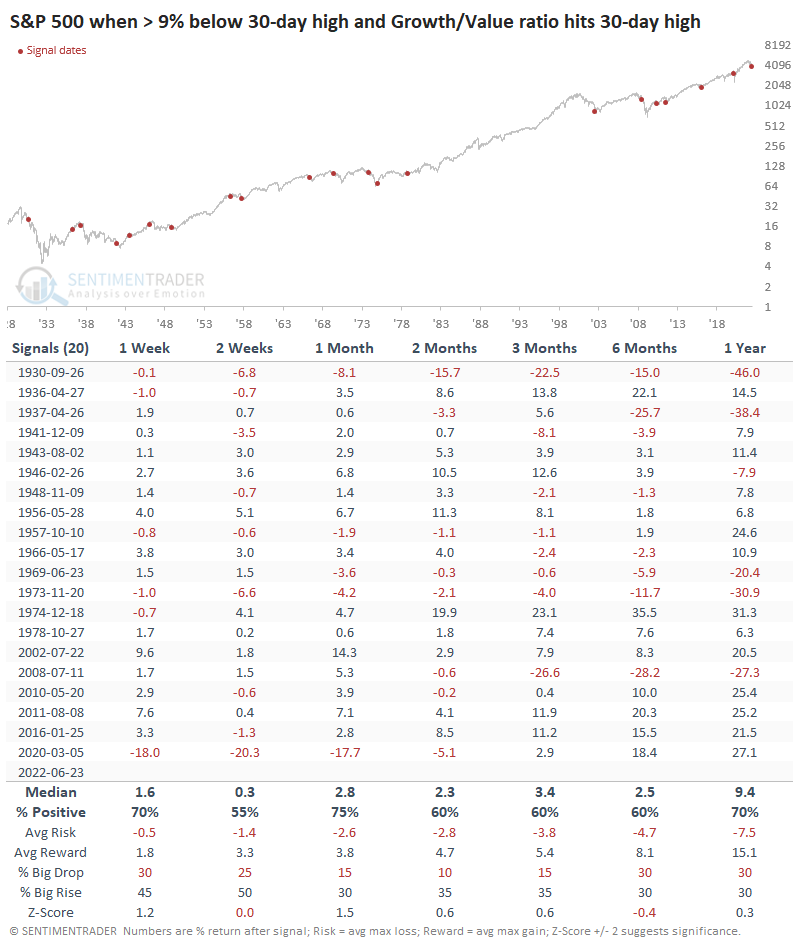
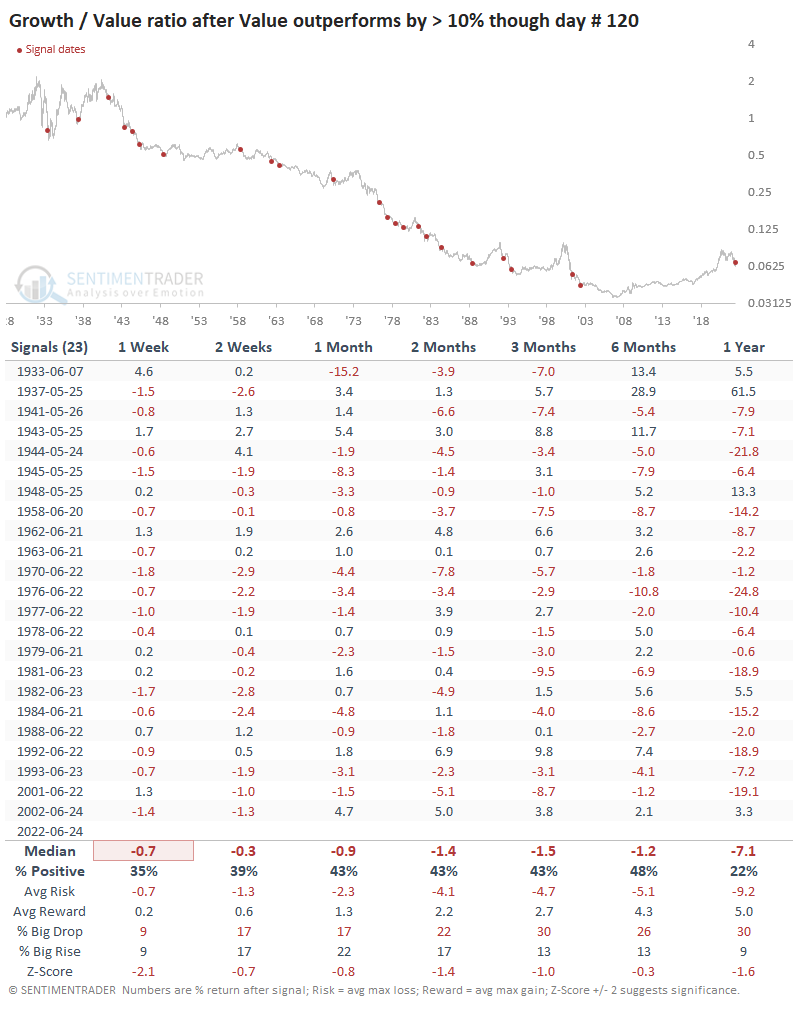
After these divergences, Growth stocks had some difficulty holding onto their lead. Over the past 50 years, Growth stocks underperformed Value during the next six months after 7 out of 9 signals.
Another way to look at the divergence is by time. When the S&P set its new low on June 16, the Growth/Value Ratio was already more than three weeks away from its own low and was holding more than 2% above it.
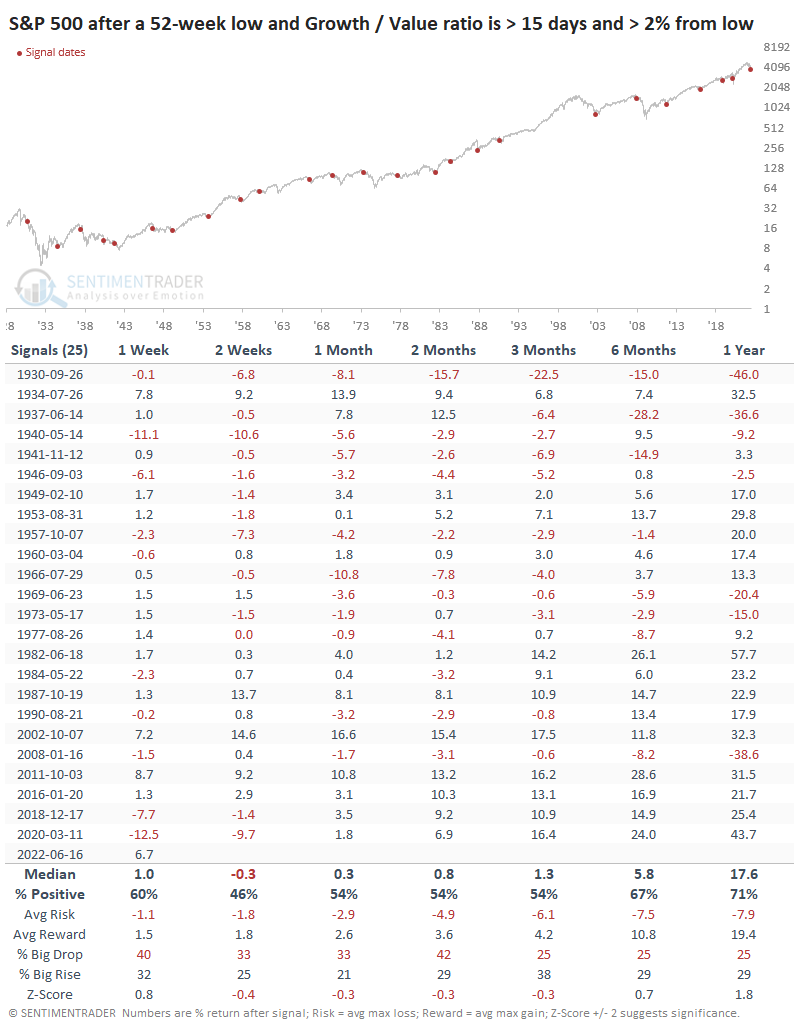
Again, this was an okay sign for stocks, but nothing special; the S&P's forward returns were about in line with random.
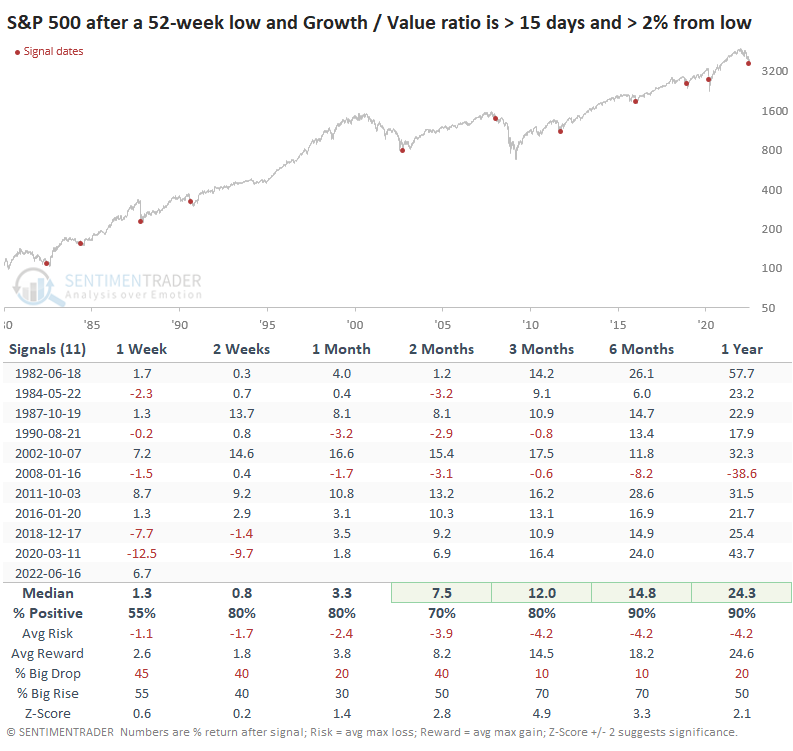
Most of the negative returns were before 1982, so if we focus on more recent history, then returns jumped, with only one failed signal. Of course, that requires us to believe that recent decades are more of a relevant comparison to our current market than pre-1980 conditions.
Best year in past 20
The rebound in Growth versus Value comes on the heel of what had been a massive trend toward the latter. Value outperformed Growth by well over 10% through the 120th trading day of the year, its widest outperformance since 2002.
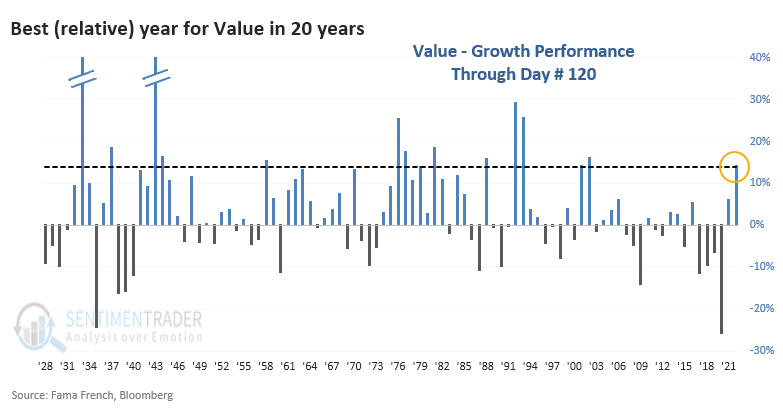
This didn't necessarily signal much for the months ahead; through year-end and next June, returns in the S&P 500 were pretty weak.
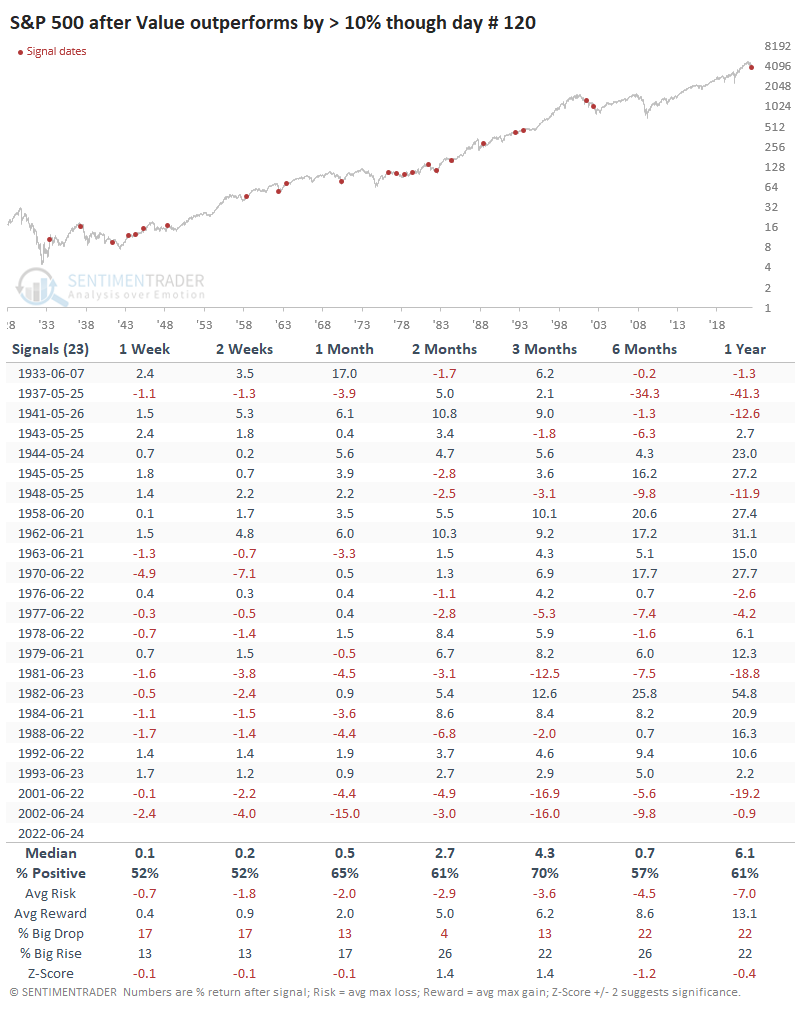
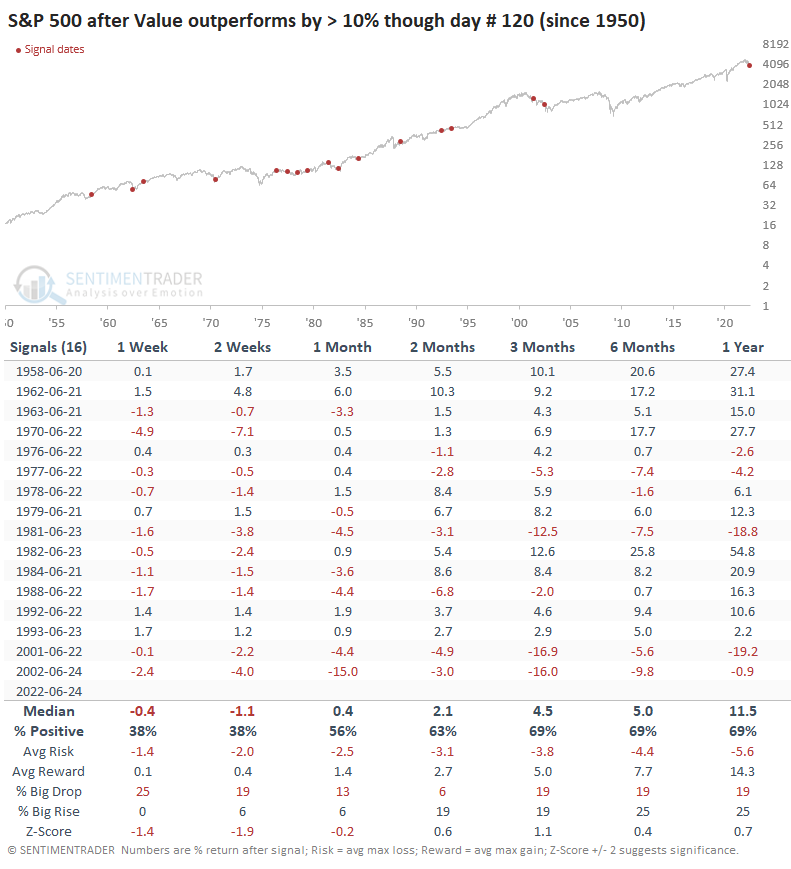
That weakness is mainly due to pre-1950 when there was Saturday trading and day #120 only went through May. Post-1950 returns improved.
Even so, it wasn't a good sign for Growth.
What the research tells us...
Generally, when investors favor Growth stocks, it suggests optimism for the future. And stocks need investors to be optimistic about putting in buy orders and driving prices higher. There is a lot of room for them to recover - as Dean noted, recently, 100% of our Risk-On/Risk-Off indicators were in "risk-off" territory. But their recent outperformance relative to Value doesn't show compelling evidence that it will continue, or that it's necessarily a good sign for the broader market. In recent decades, it has been, so that's a modest positive.
Indicators at Extremes
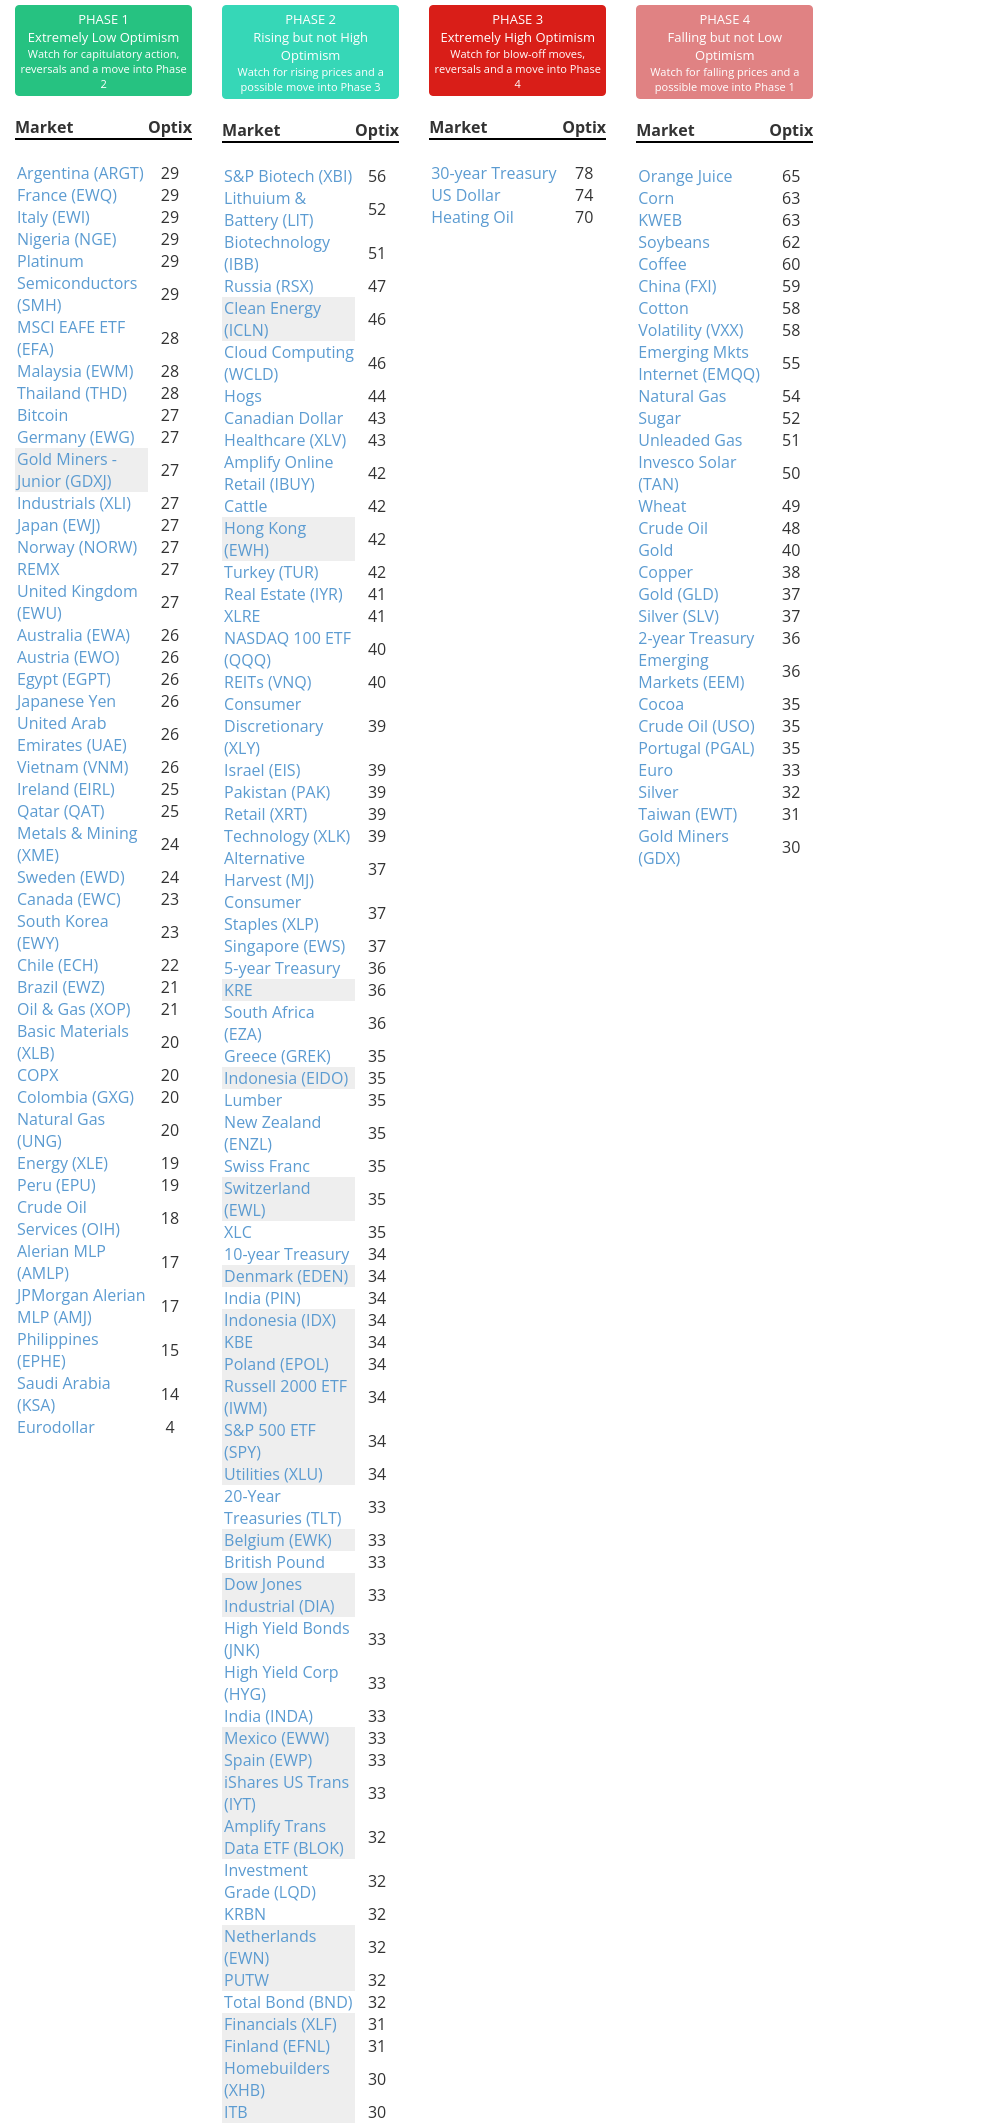
Phase Table
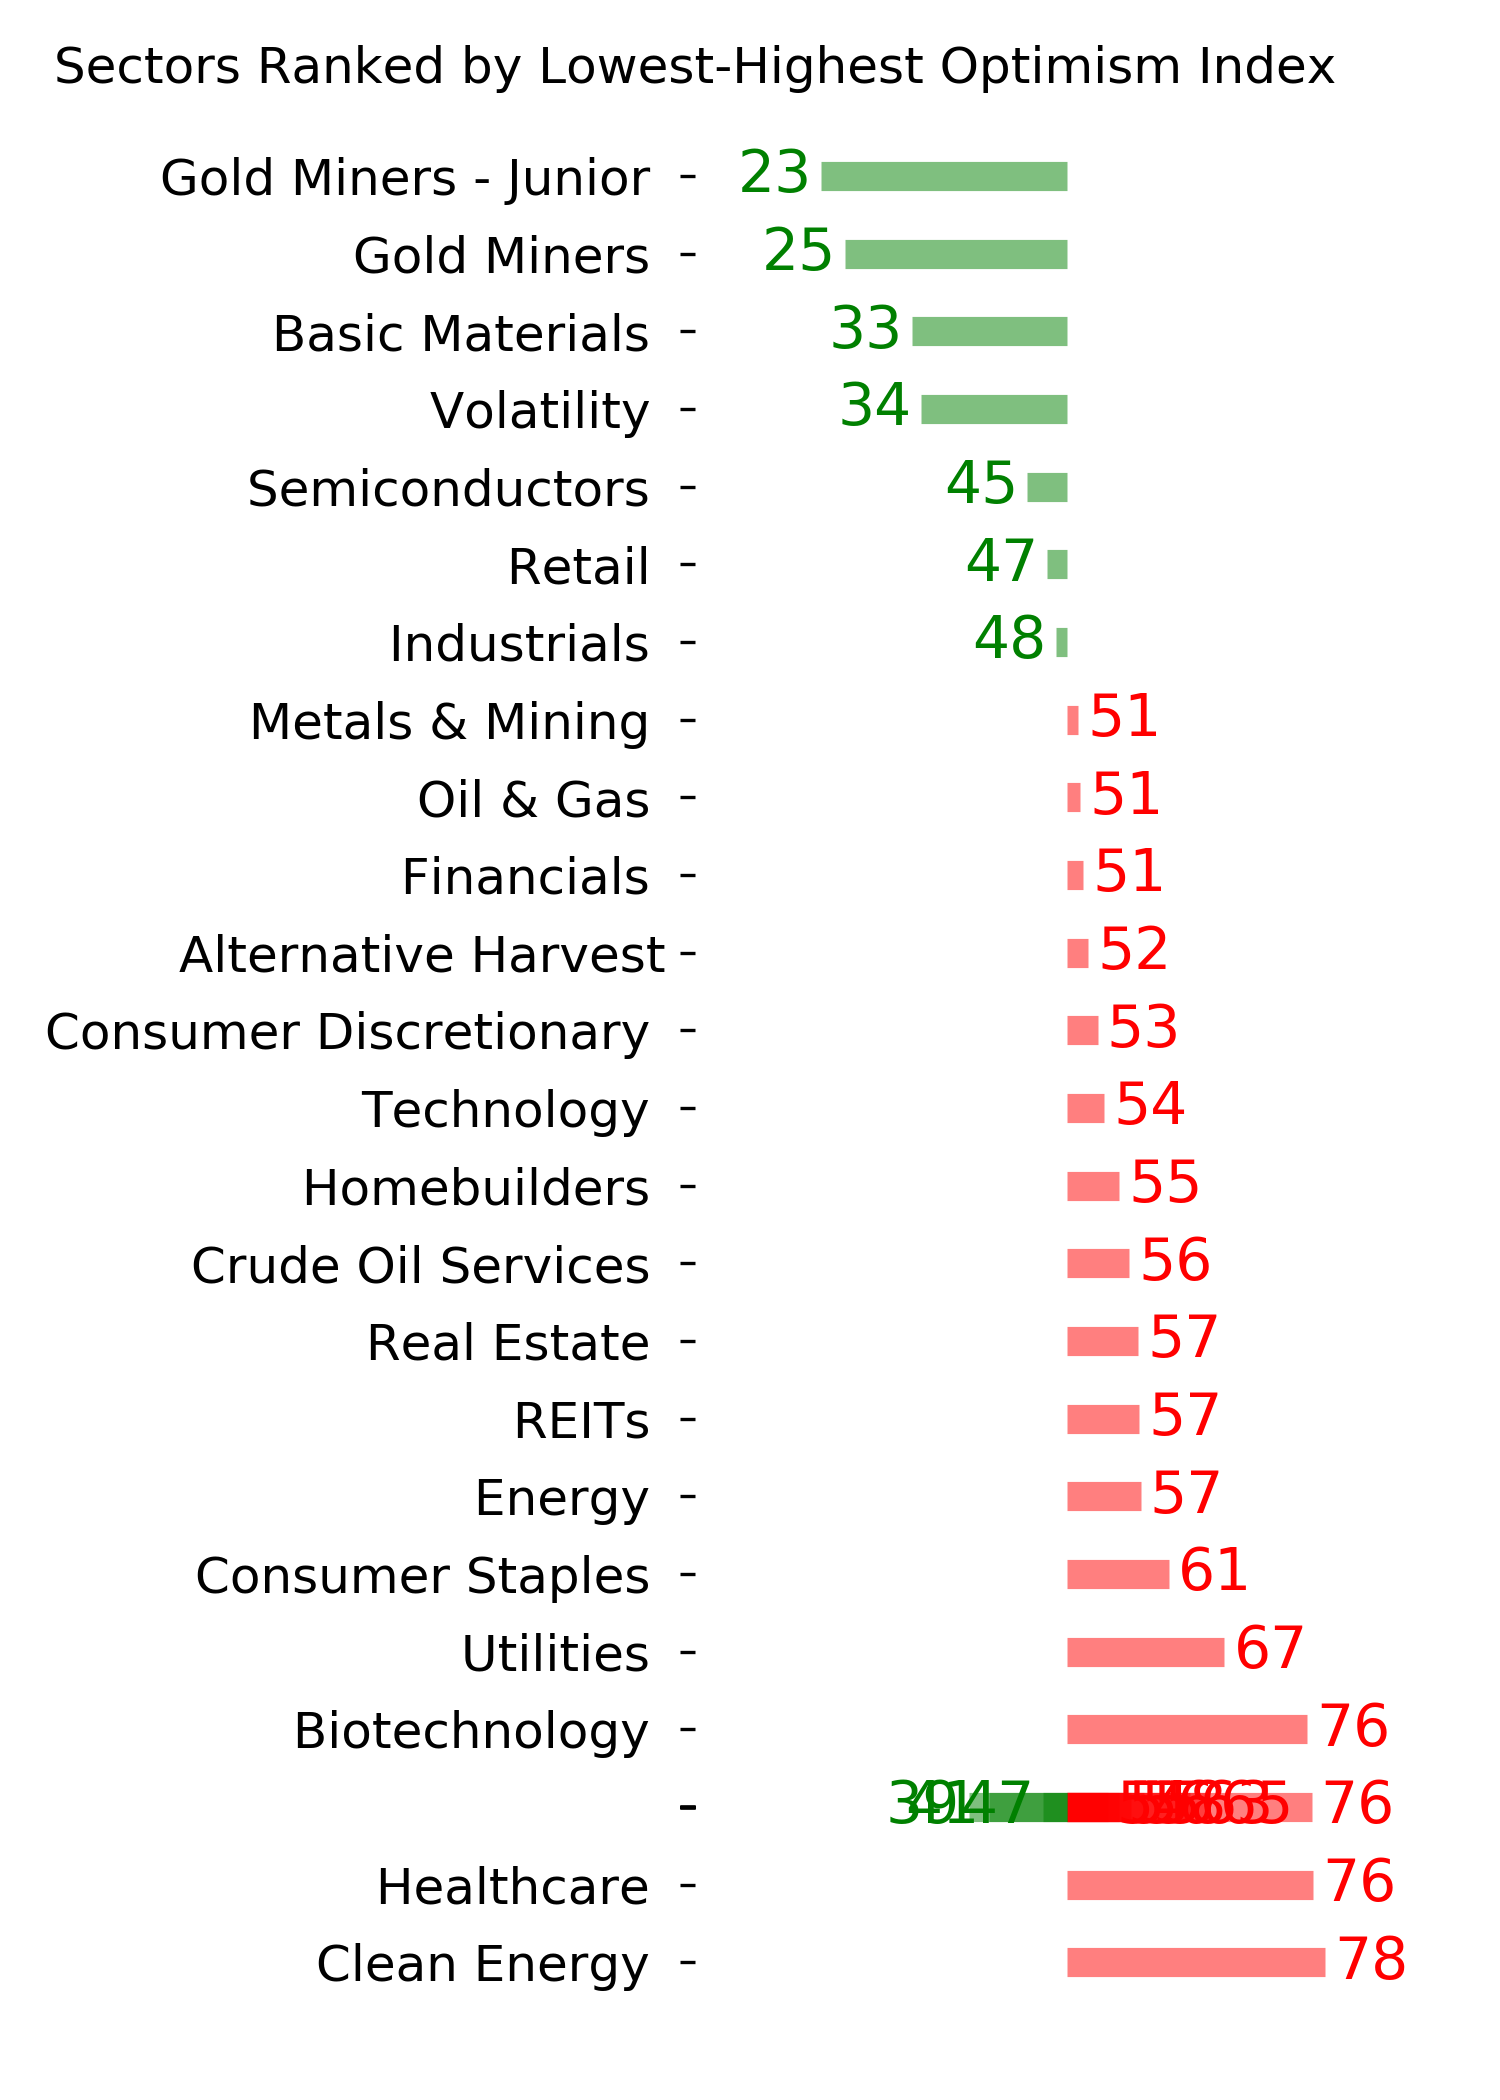
Ranks
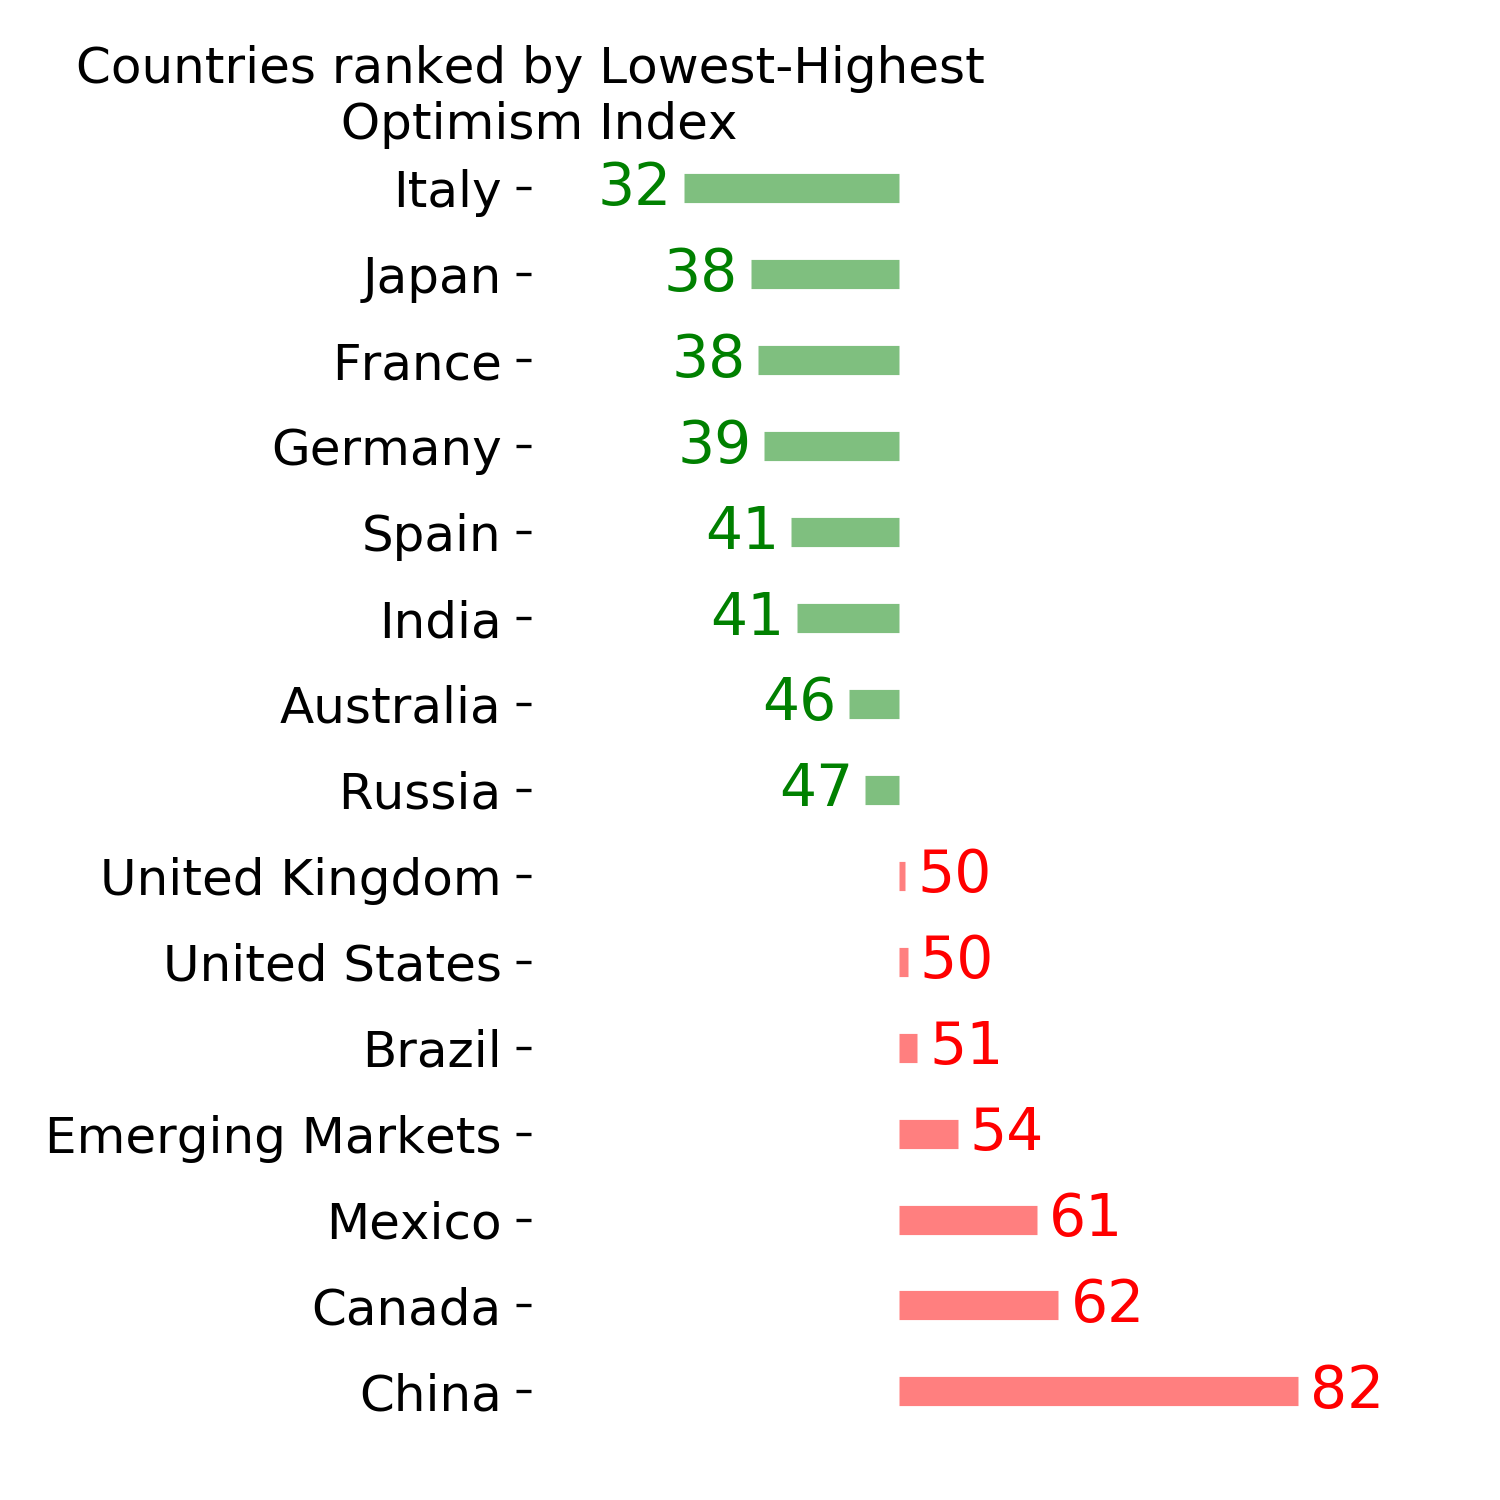
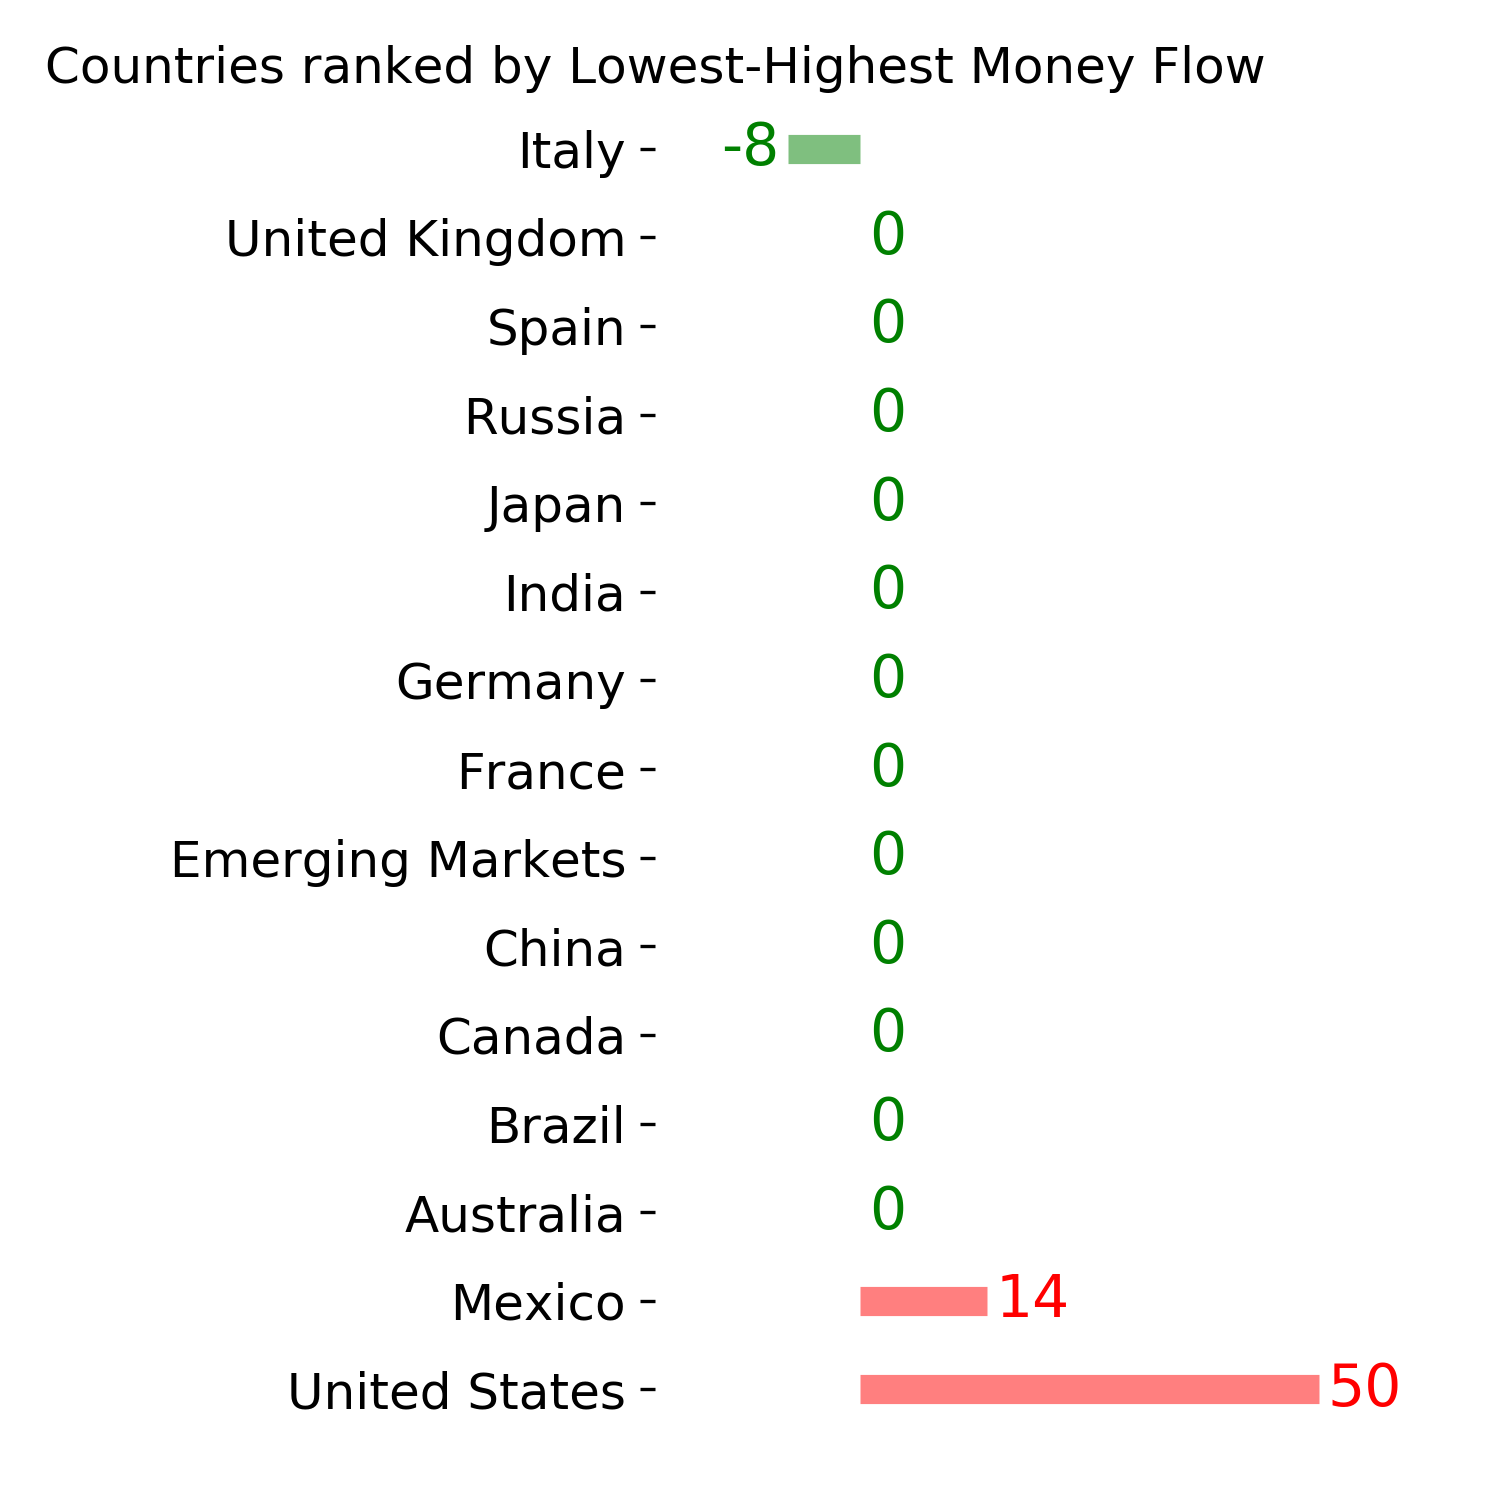
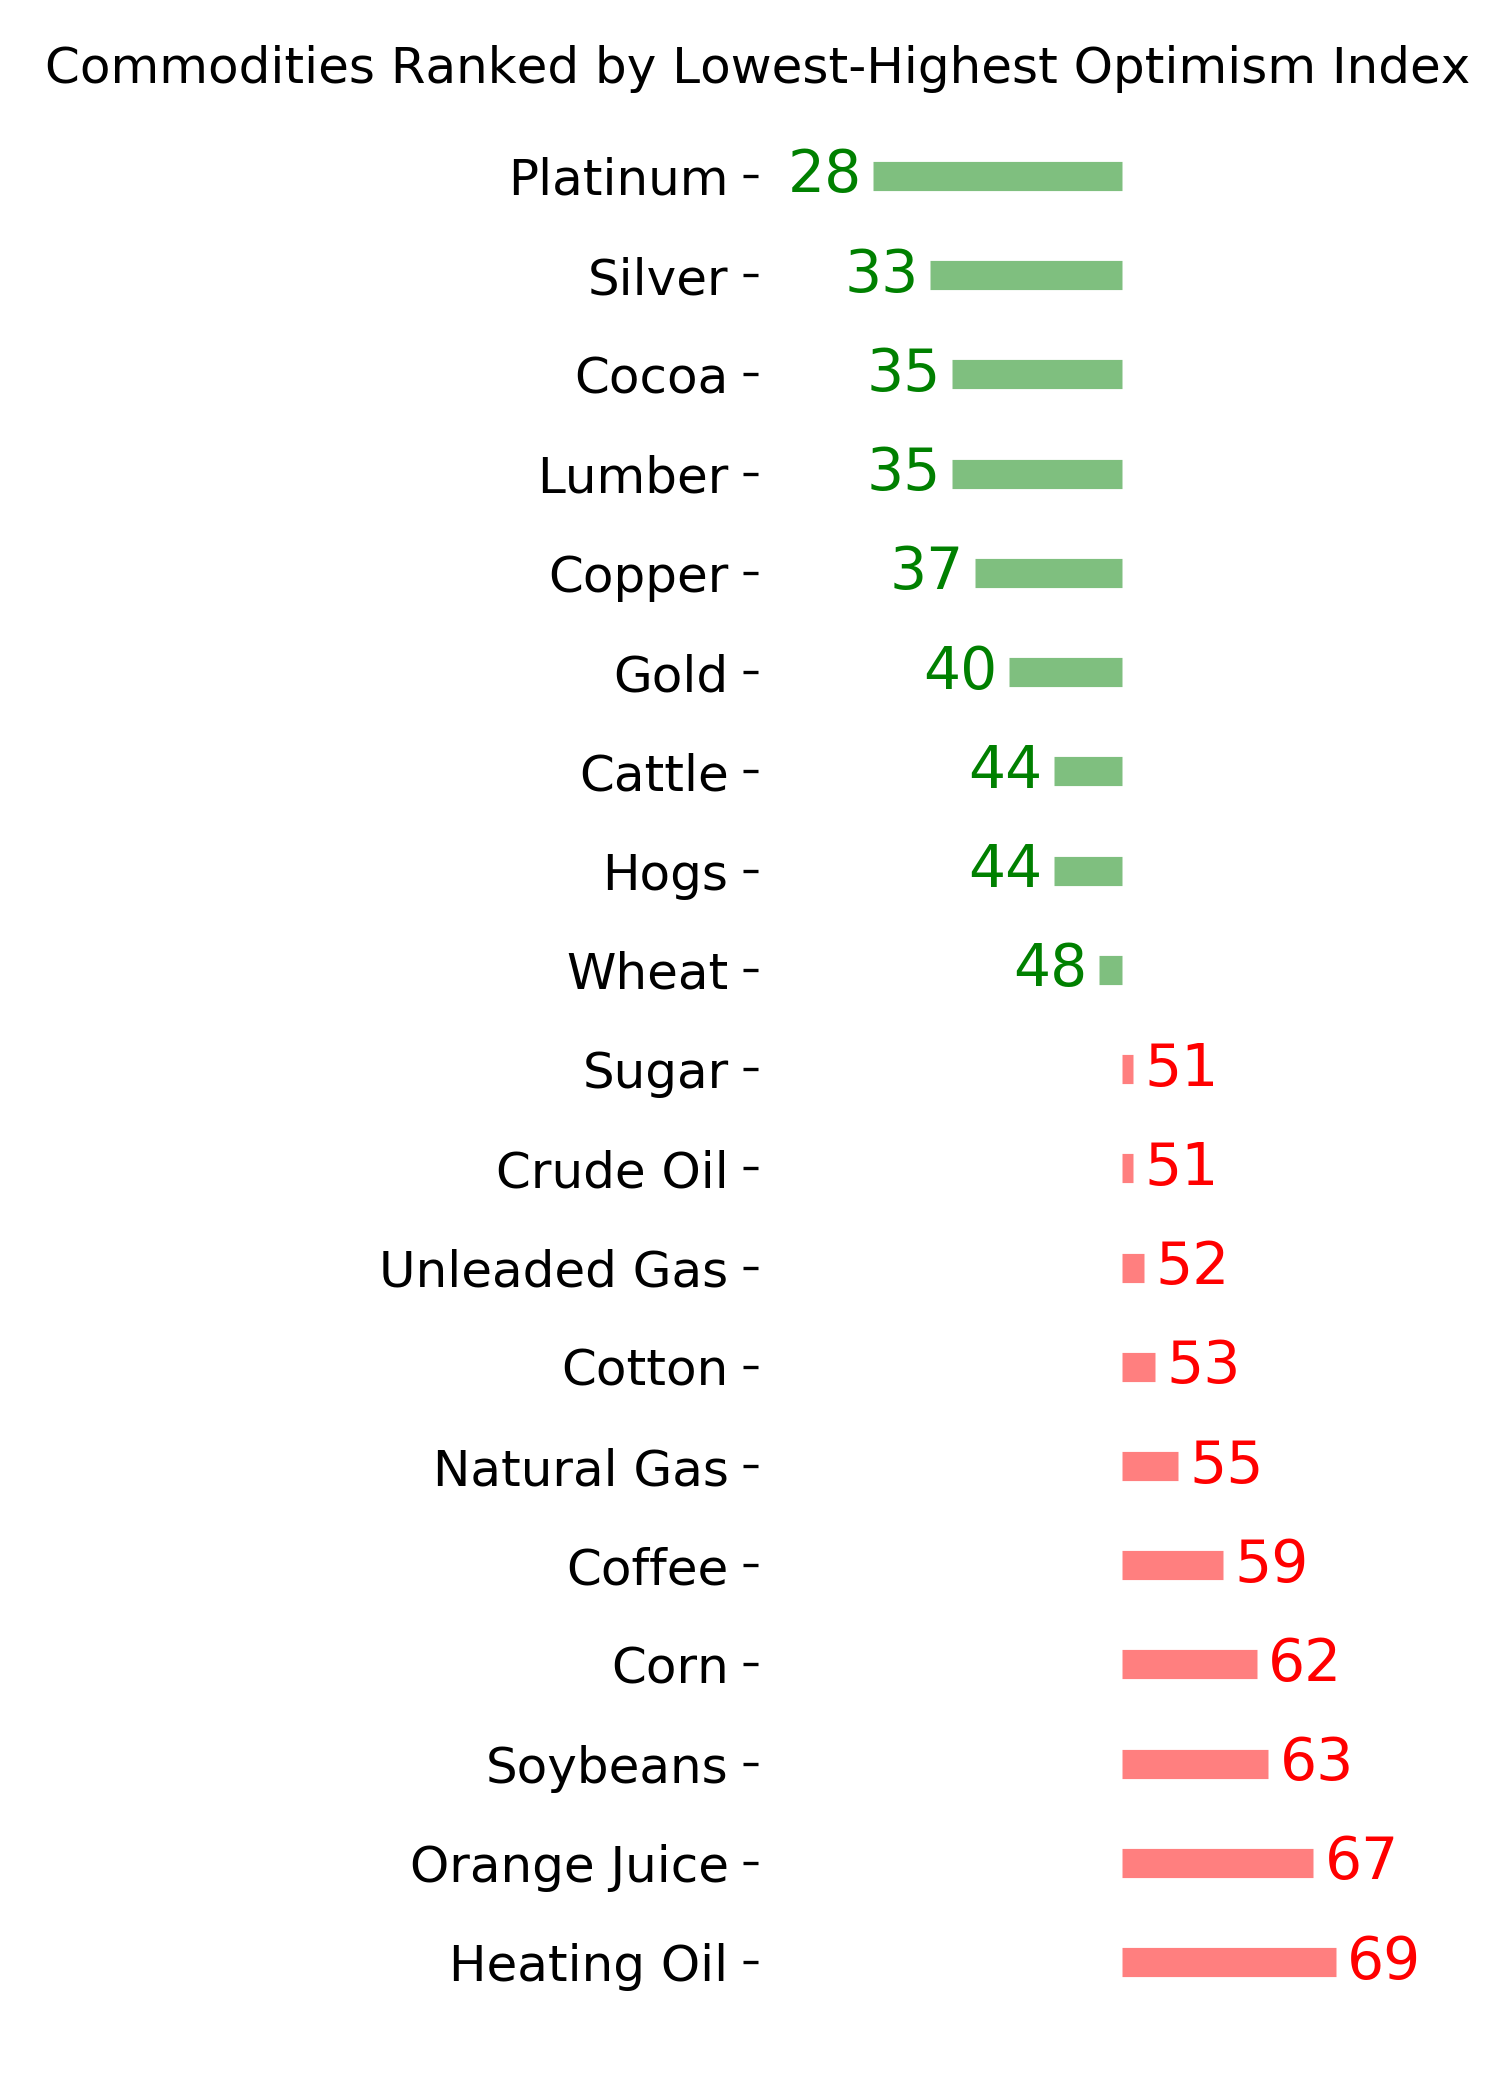
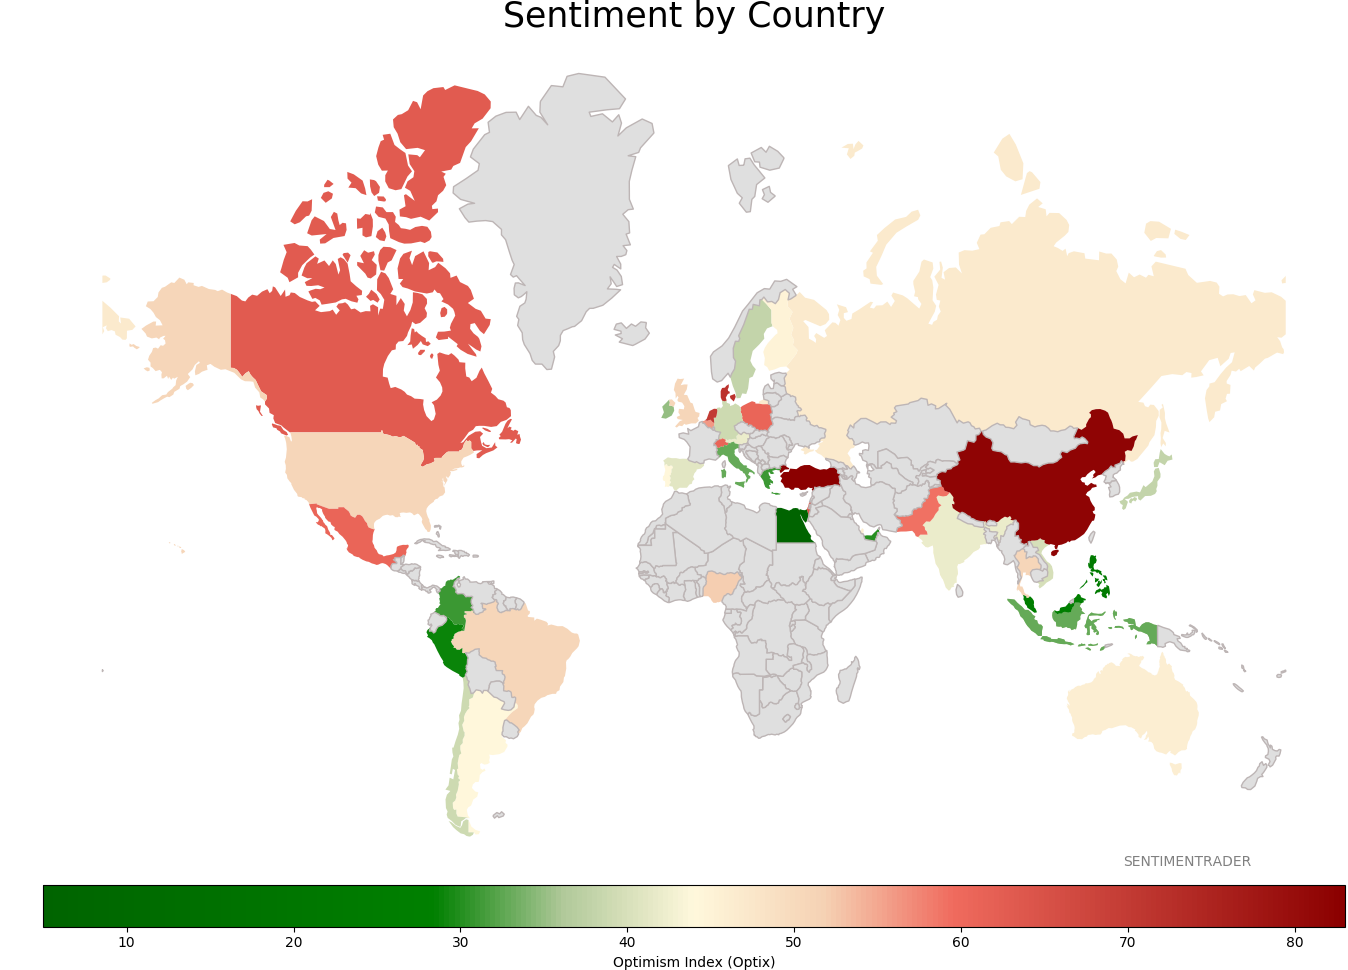
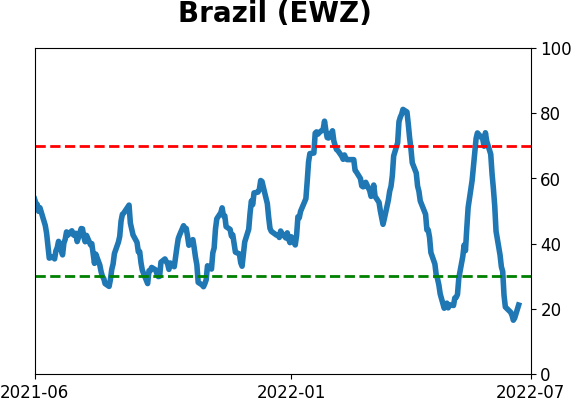
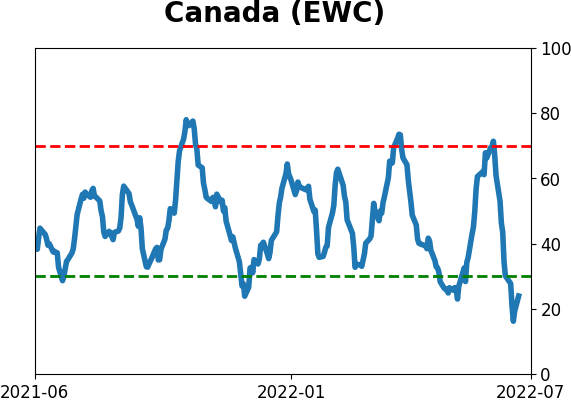
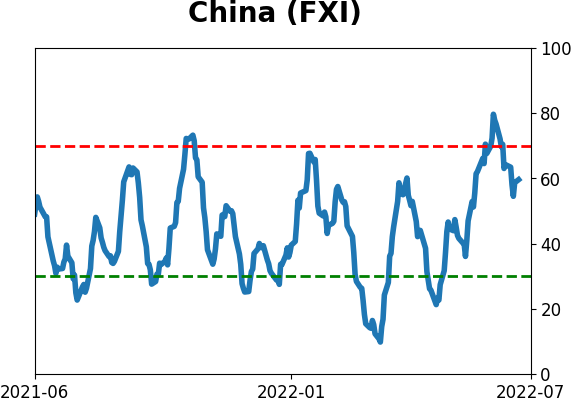
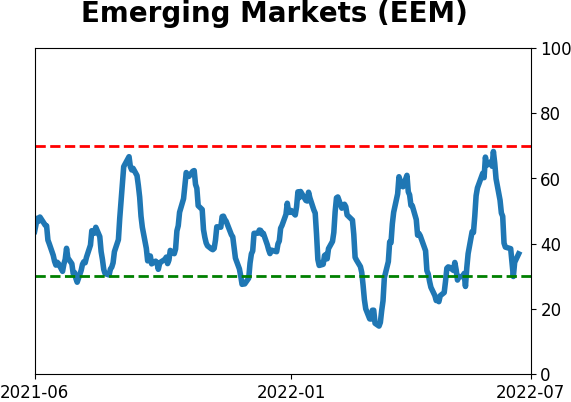
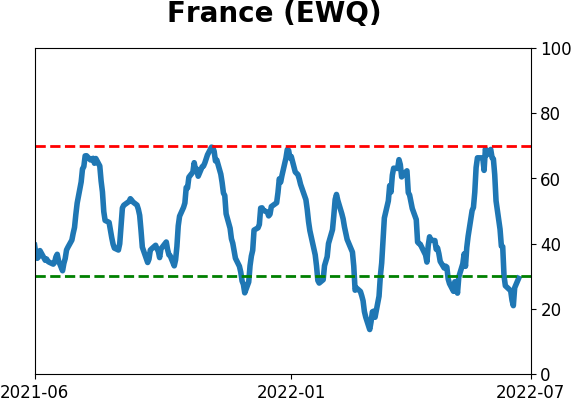
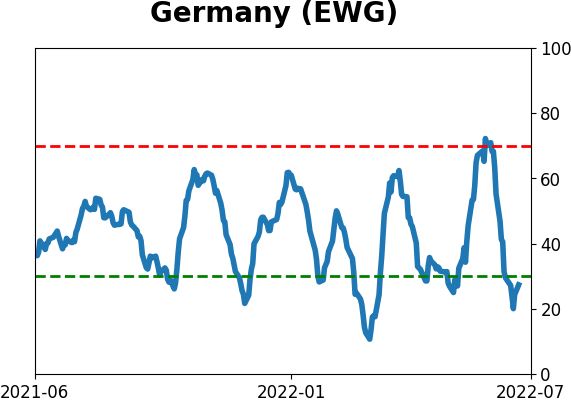
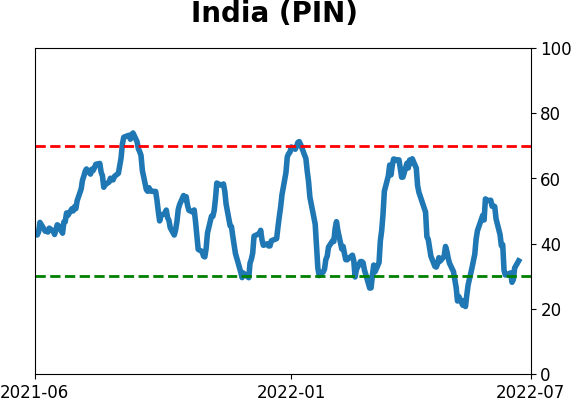
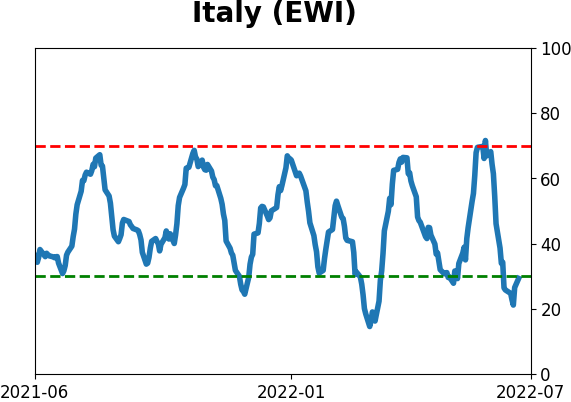
Sentiment Around The World
Optimism Index Thumbnails
|
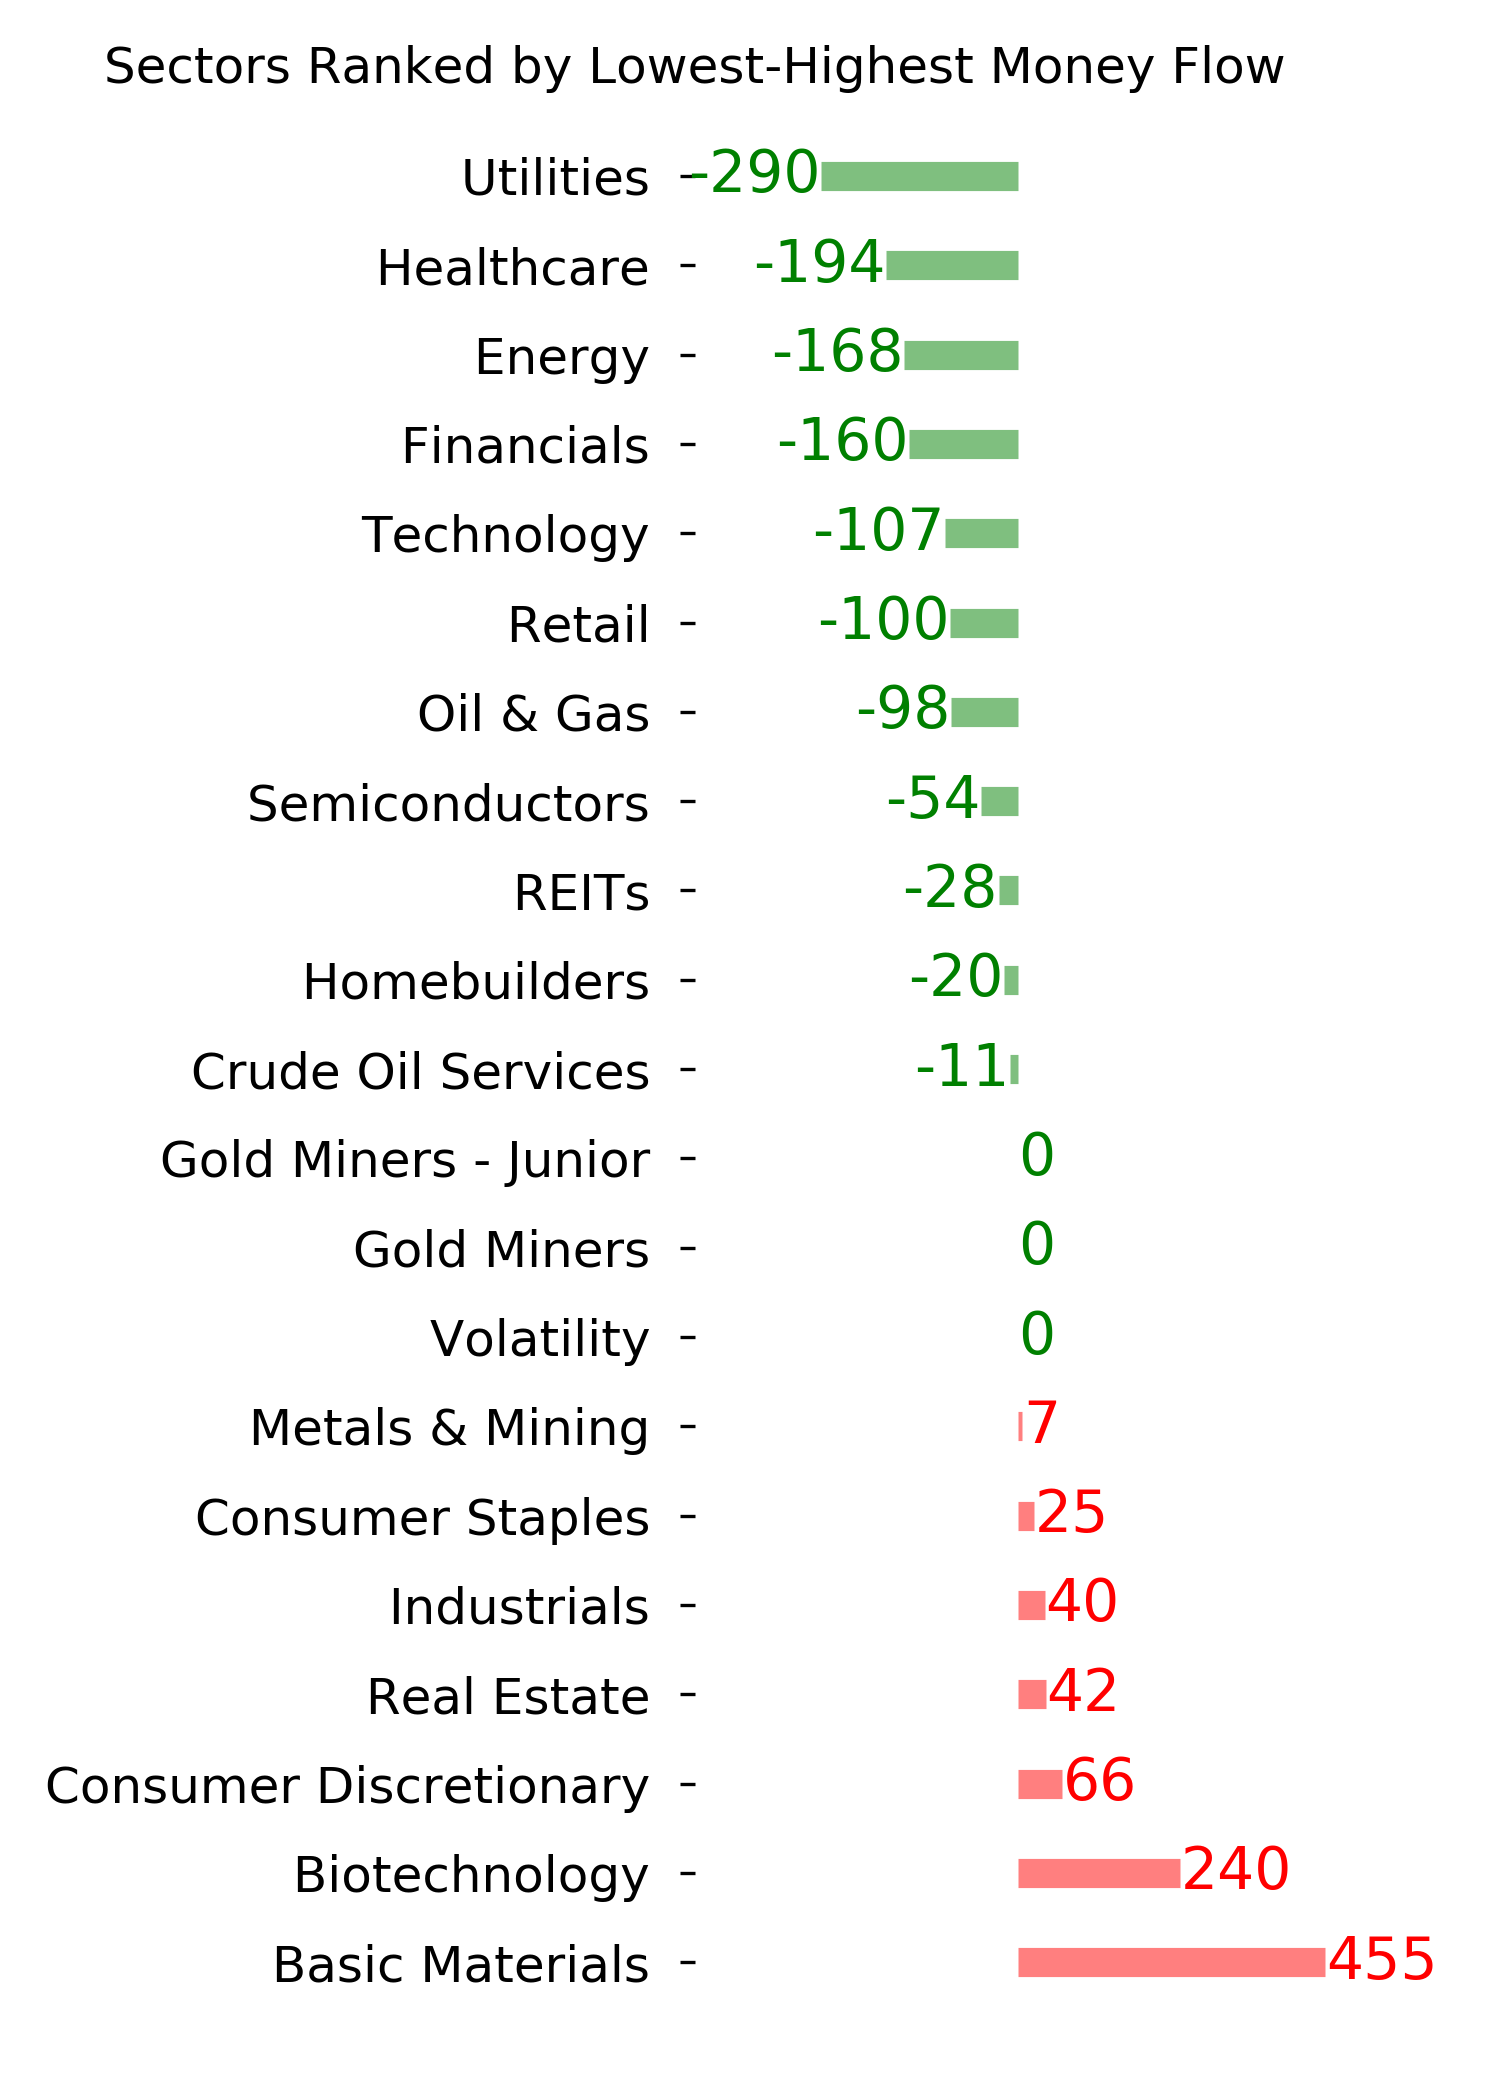
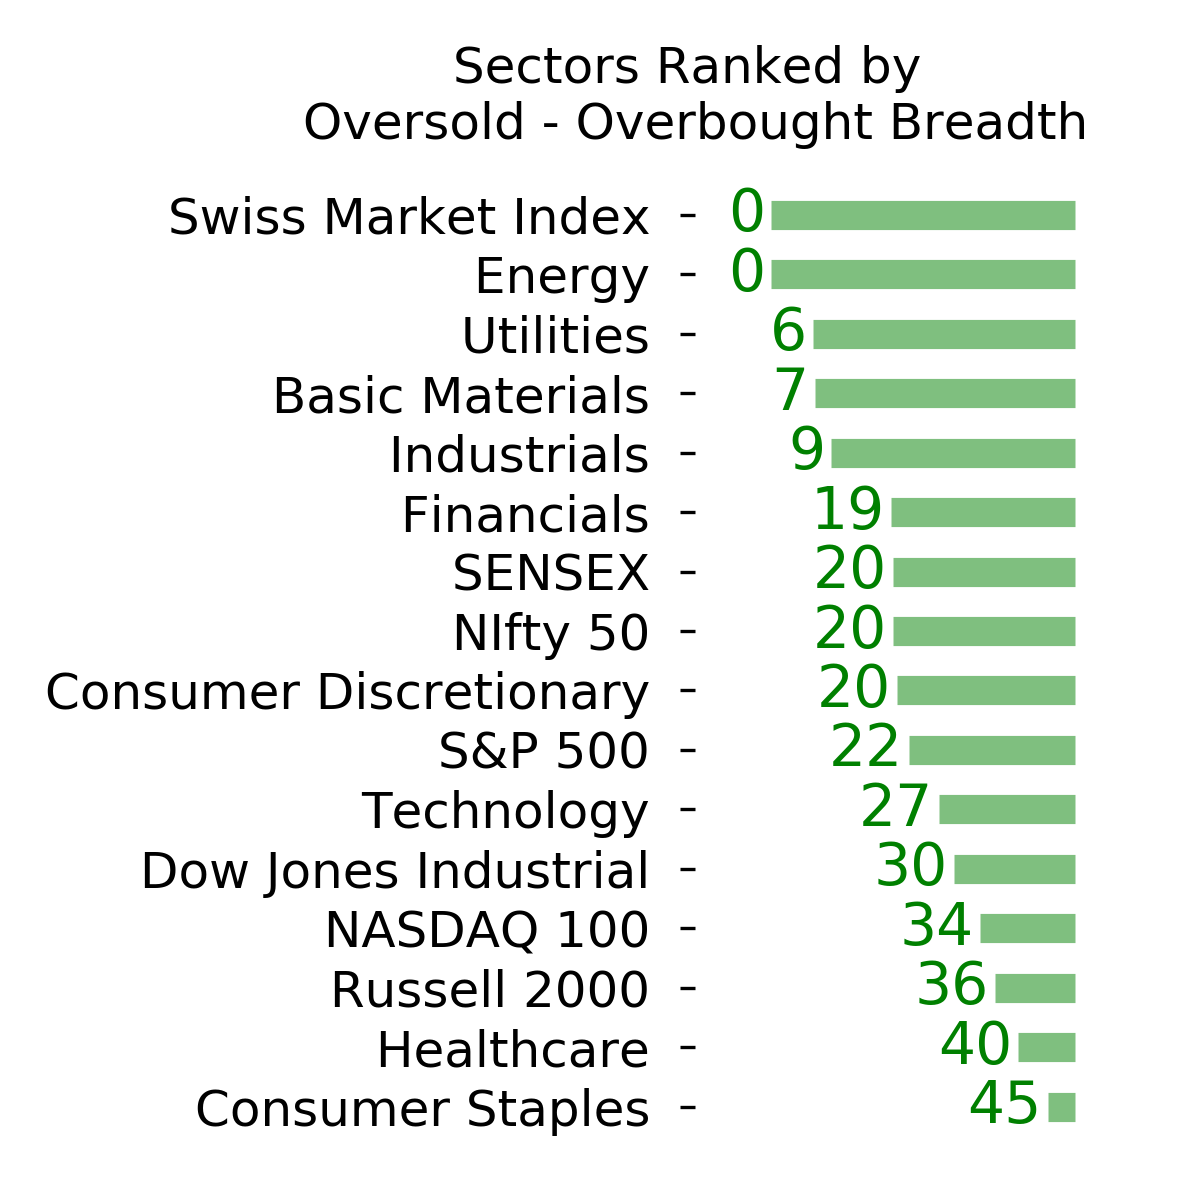
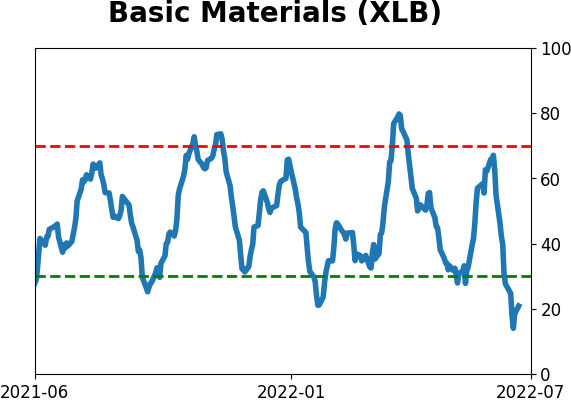
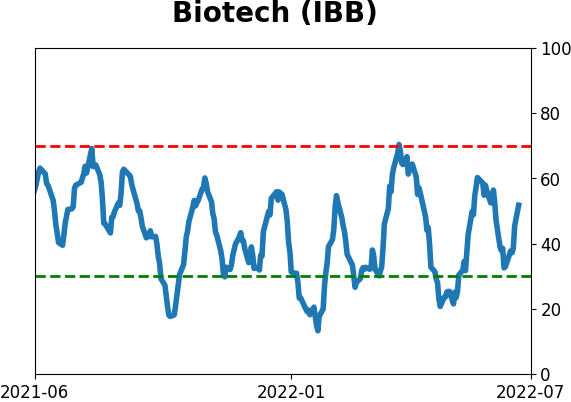
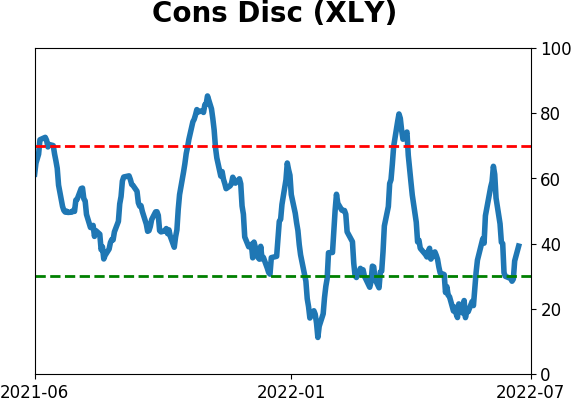
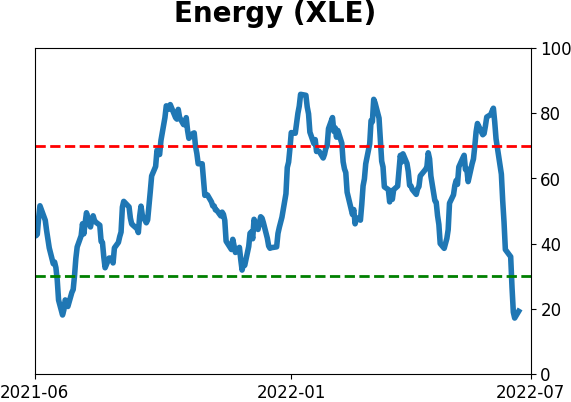
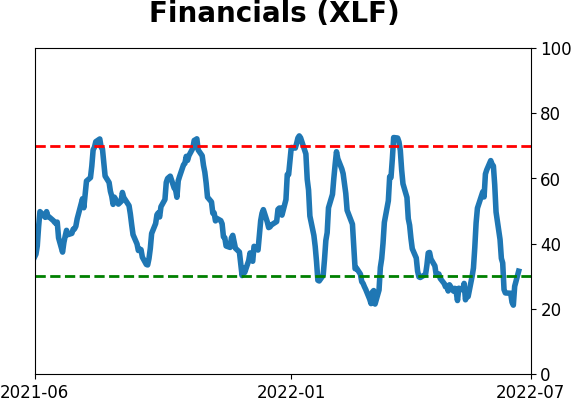
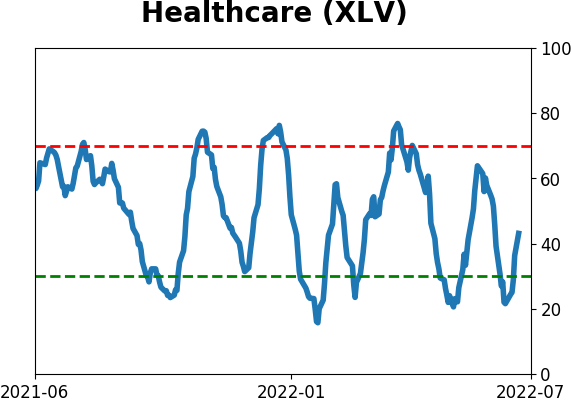
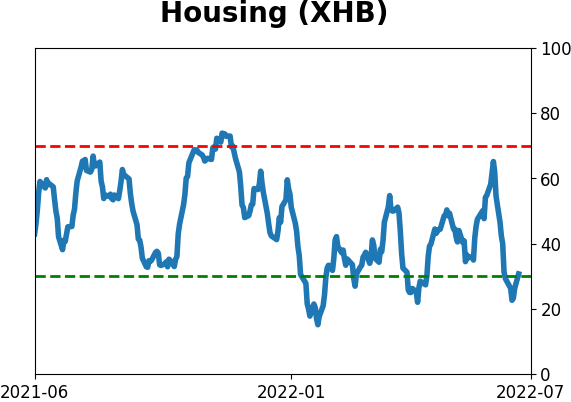
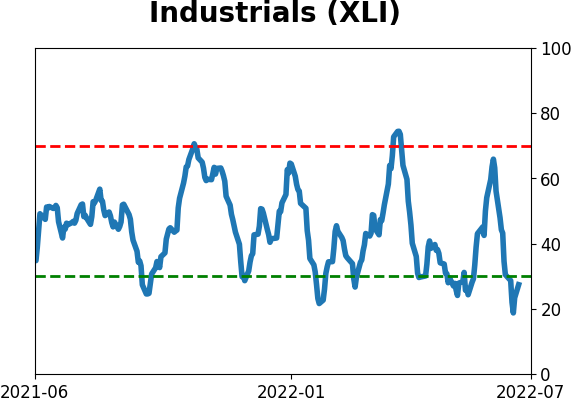
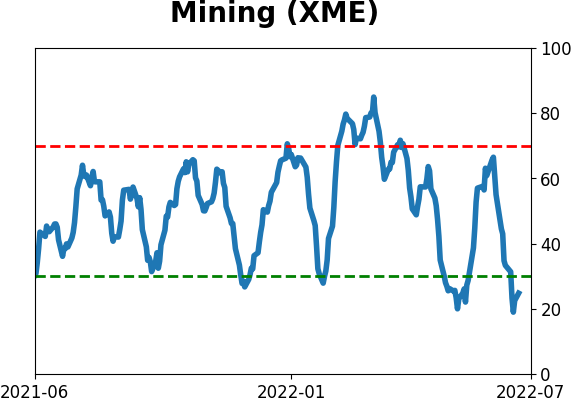
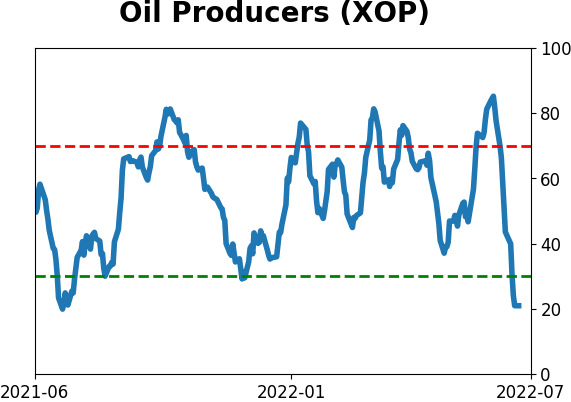
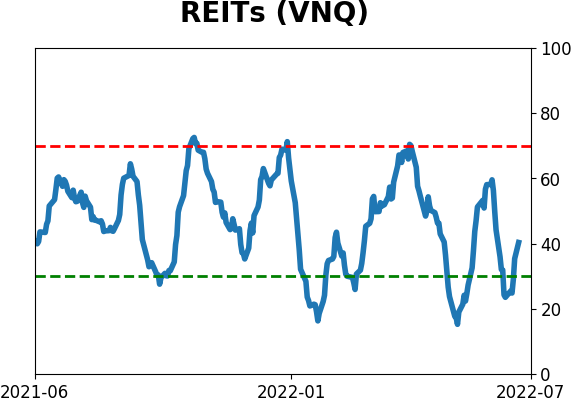
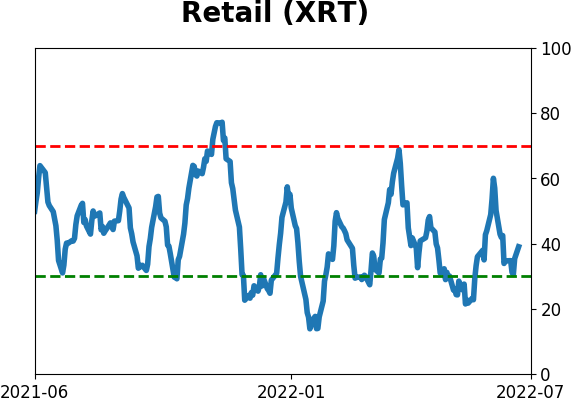
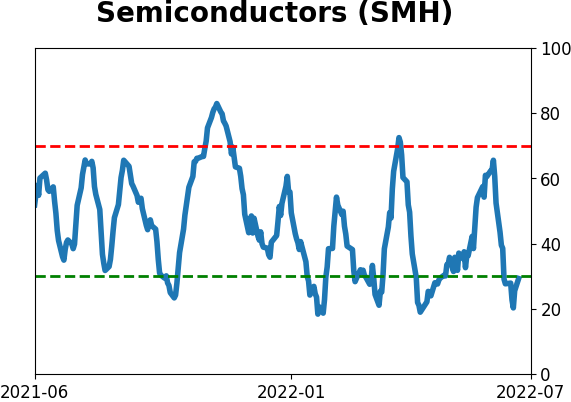
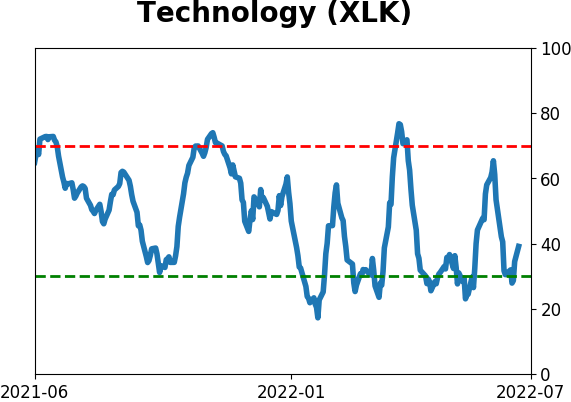
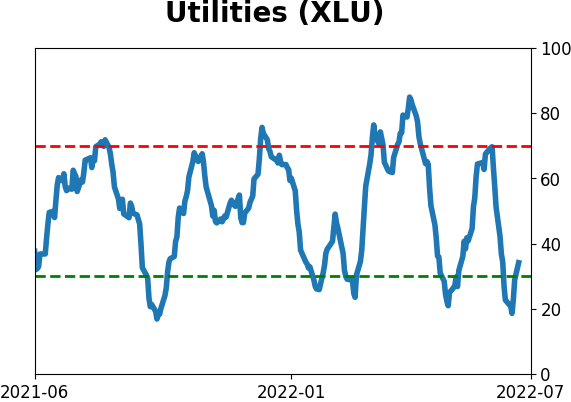
Sector ETF's - 10-Day Moving Average
|
|
|
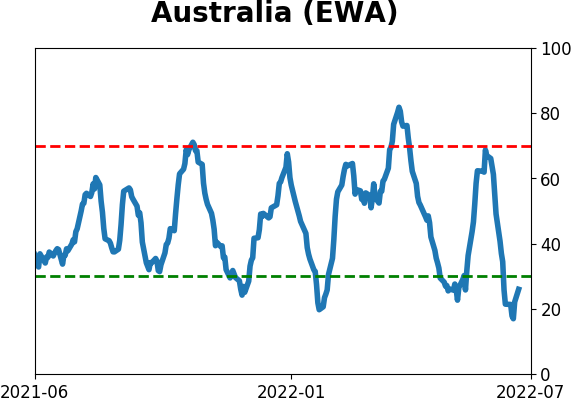
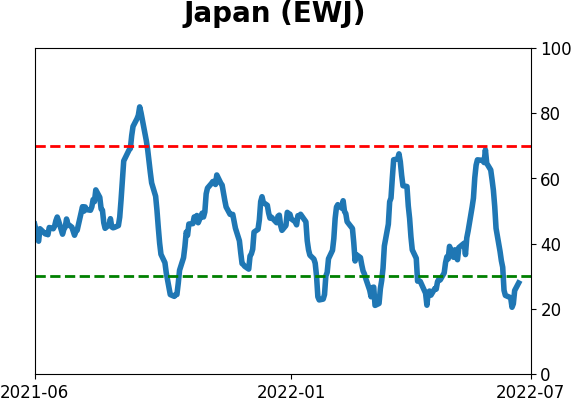
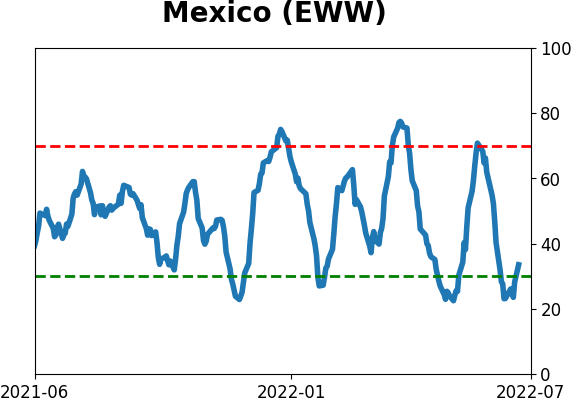
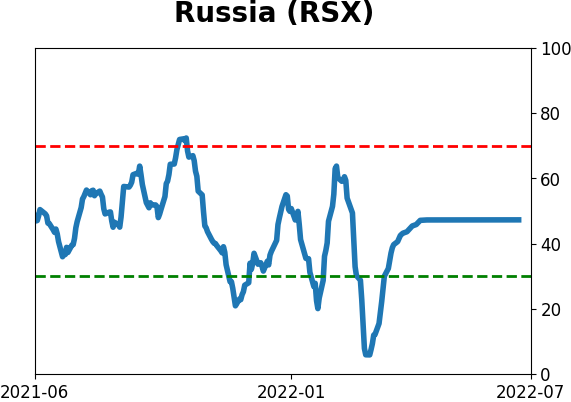
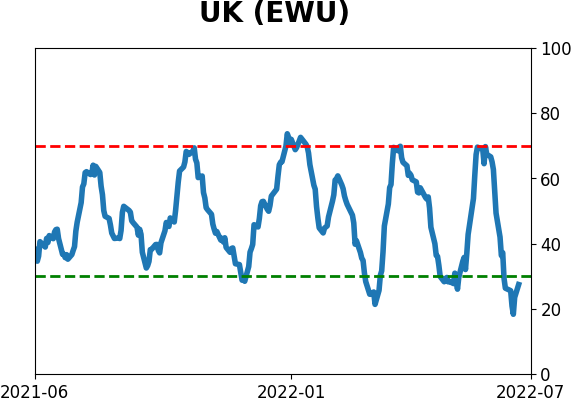
Country ETF's - 10-Day Moving Average
|
|
|
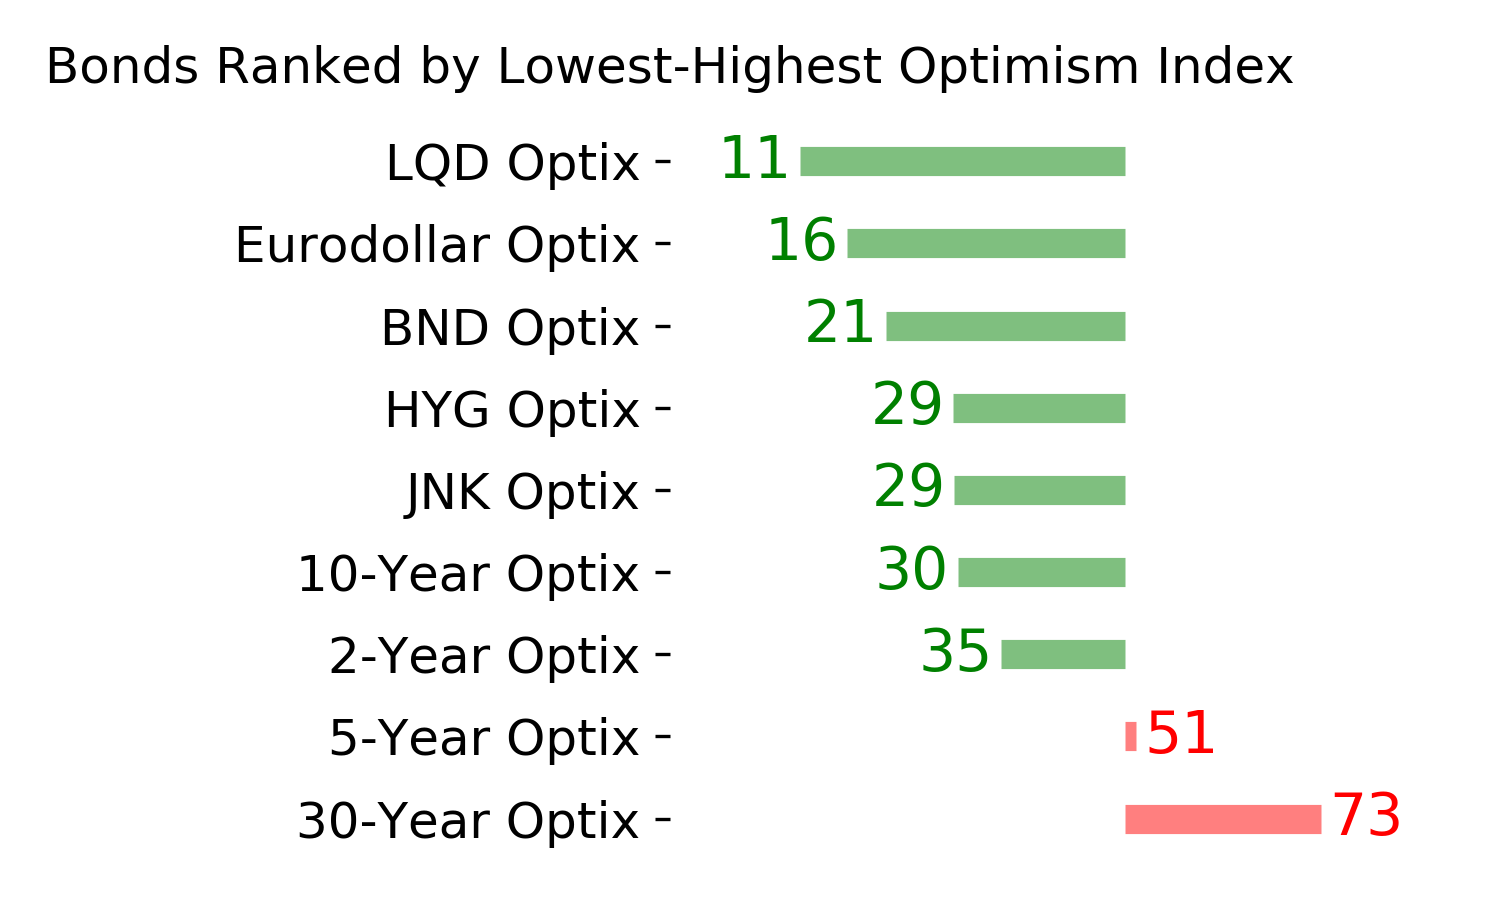
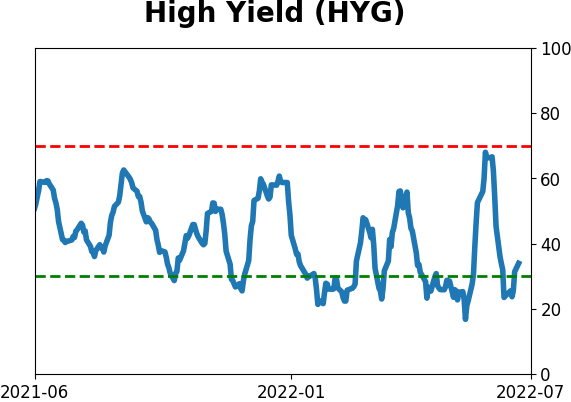
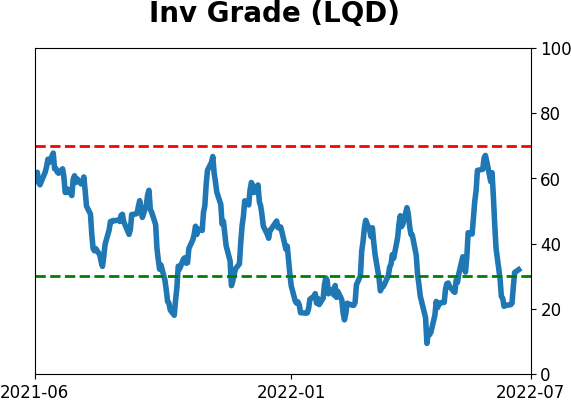
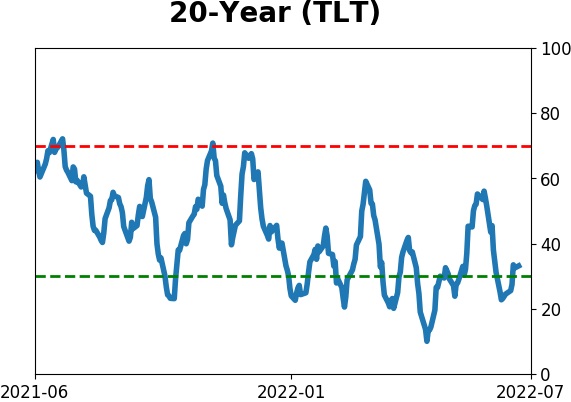
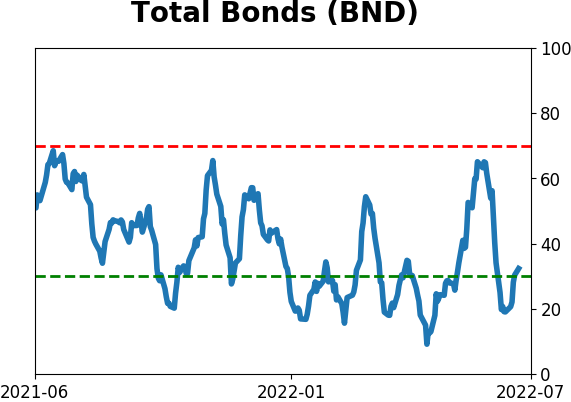
Bond ETF's - 10-Day Moving Average
|
|
|
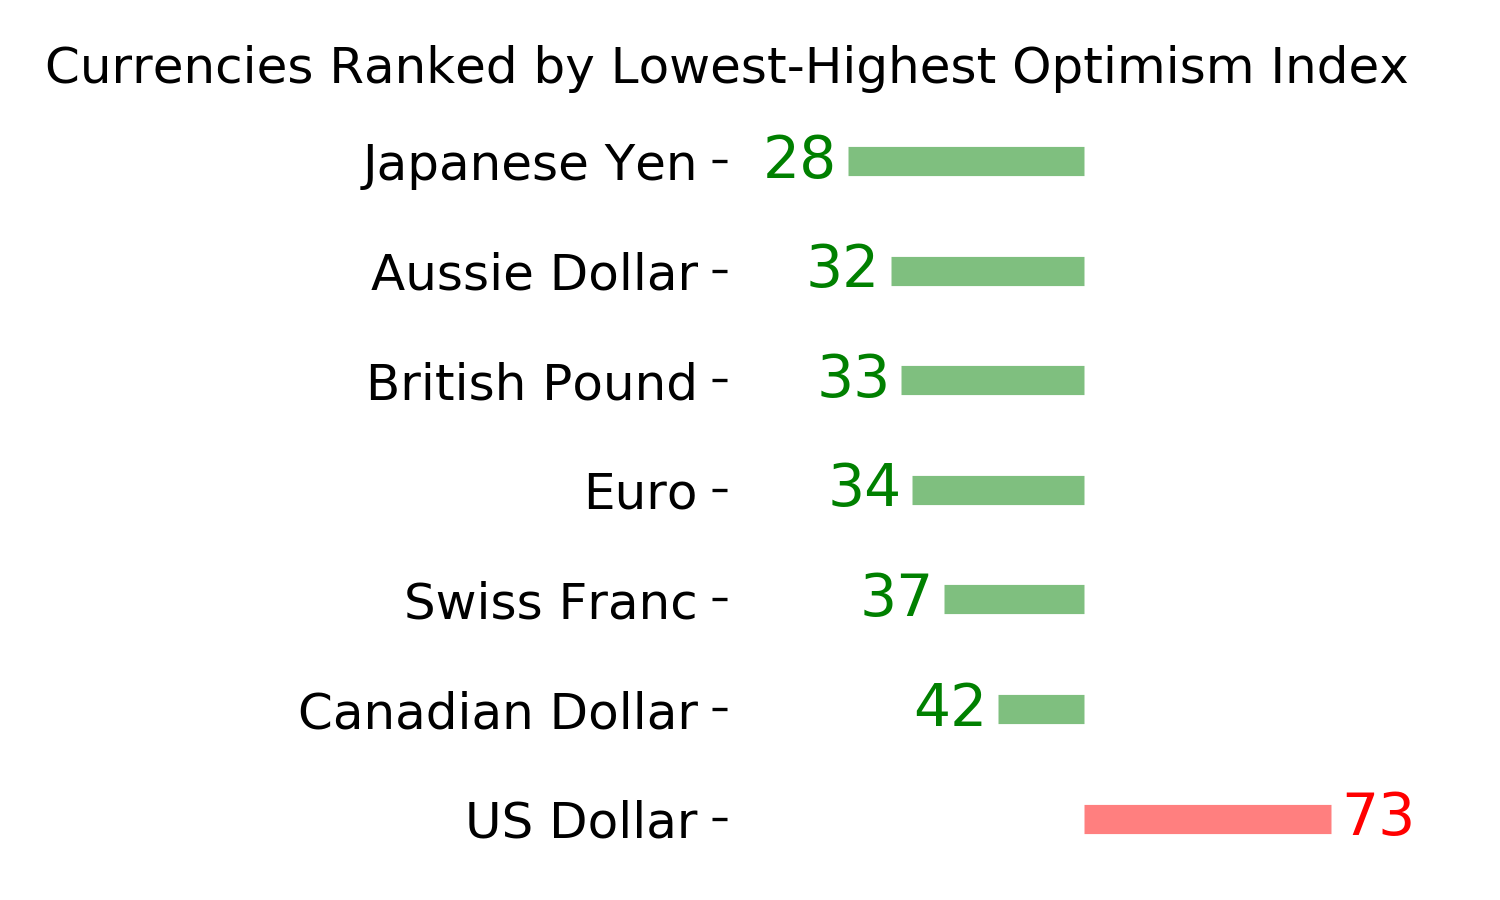
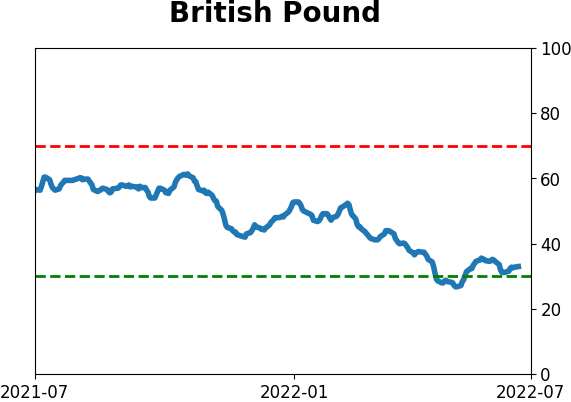
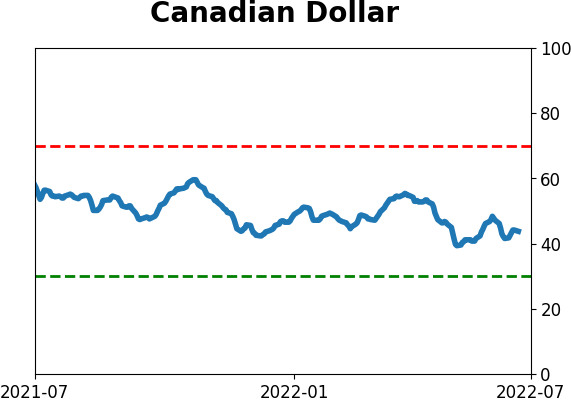
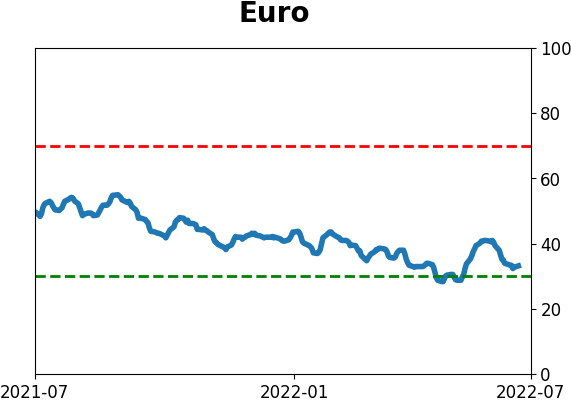
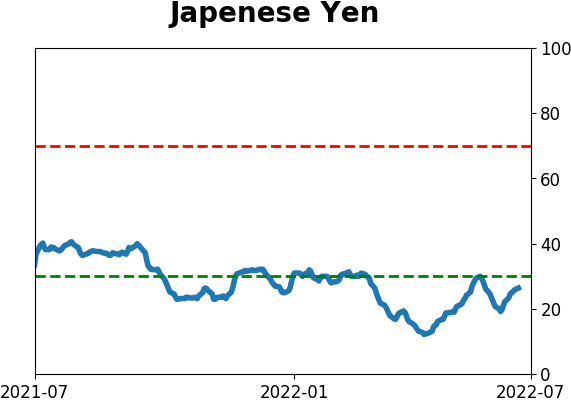
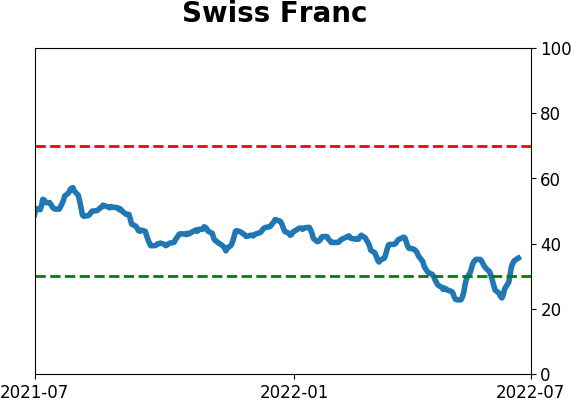
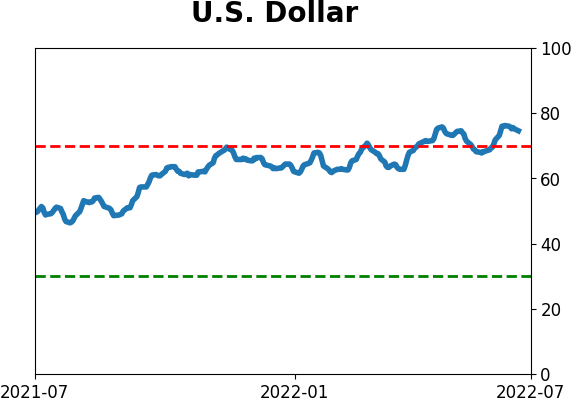
Currency ETF's - 5-Day Moving Average
|
|
|
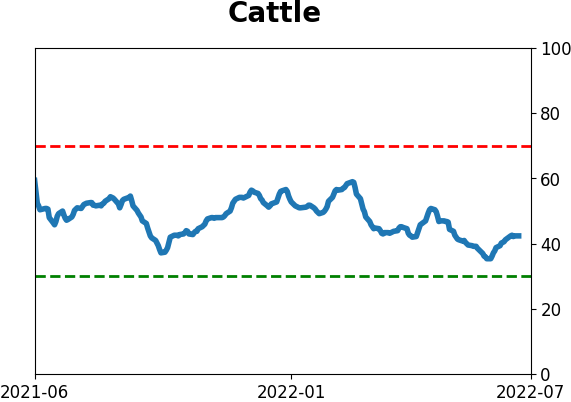
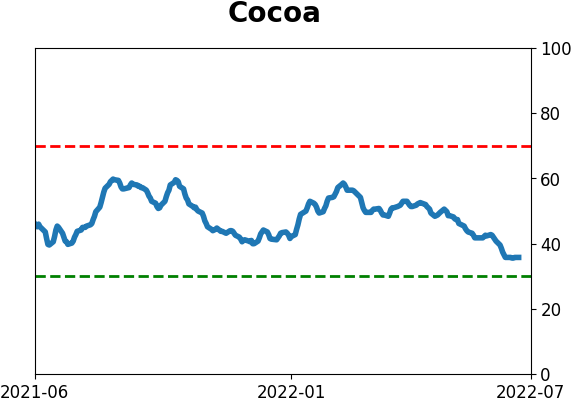
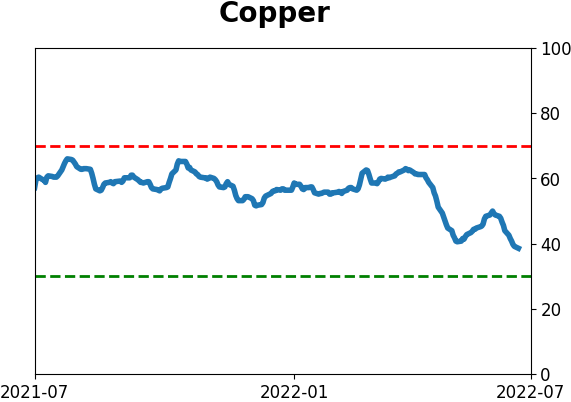
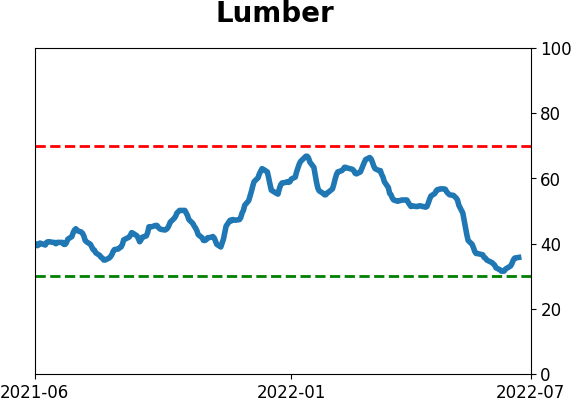
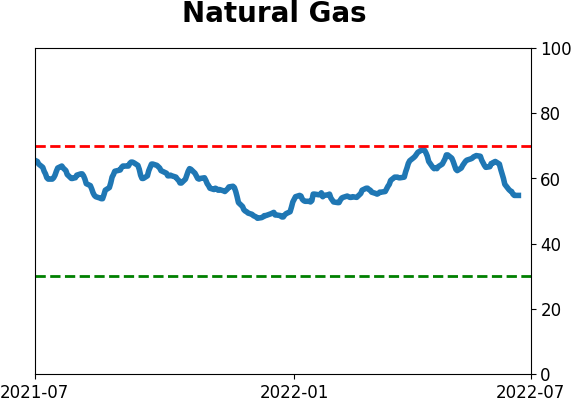
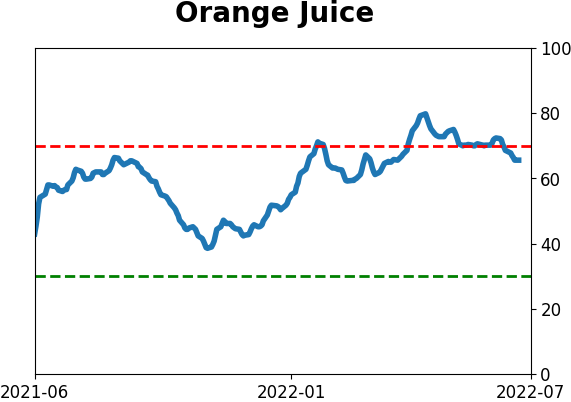
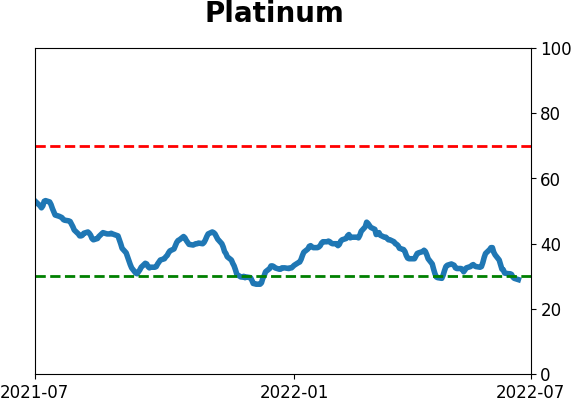
Commodity ETF's - 5-Day Moving Average
|
|