Headlines
|
|
Optimism ebbs as indexes rally:
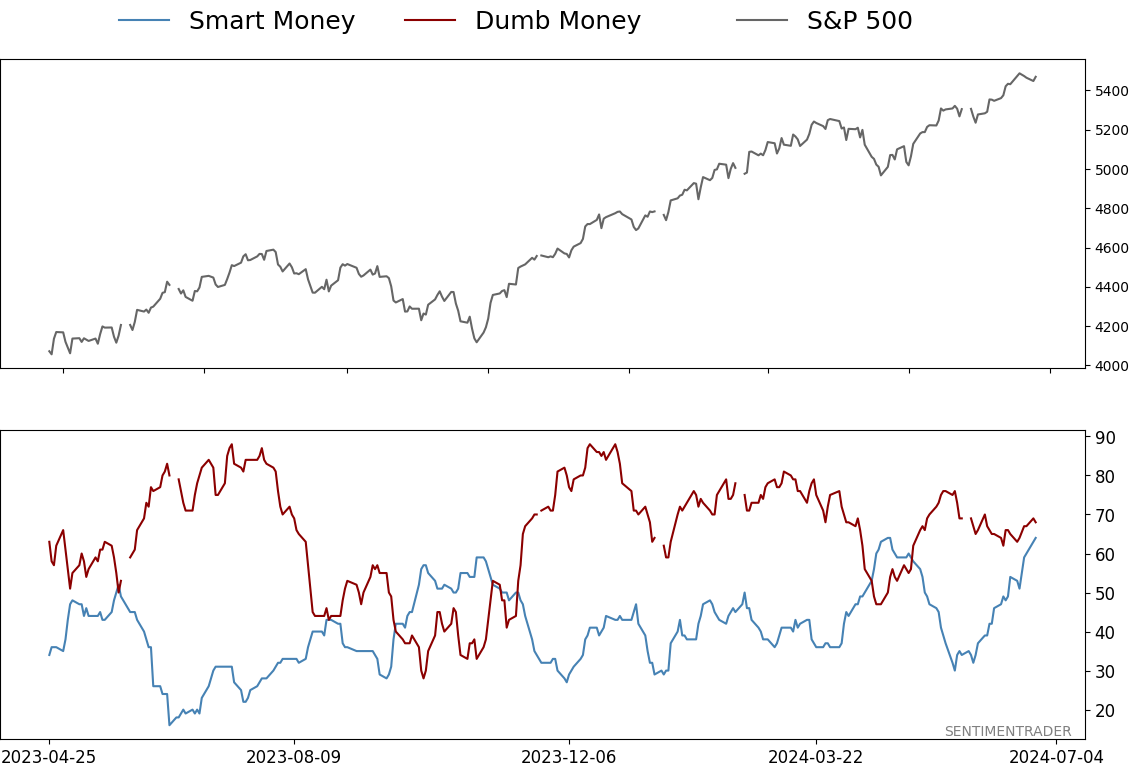
Contrarians always seem to be heartened by a lack of optimism among other investors, but it's not that simple. Bull markets thrive on ever-rising optimism, and that's not something we're seeing now. Dumb Money Confidence is showing less and less optimism as stocks rally, and the Fear & Greed model is actually closer to fear than greed.
|
Smart / Dumb Money Confidence
|
Smart Money Confidence: 64%
Dumb Money Confidence: 68%
|
|
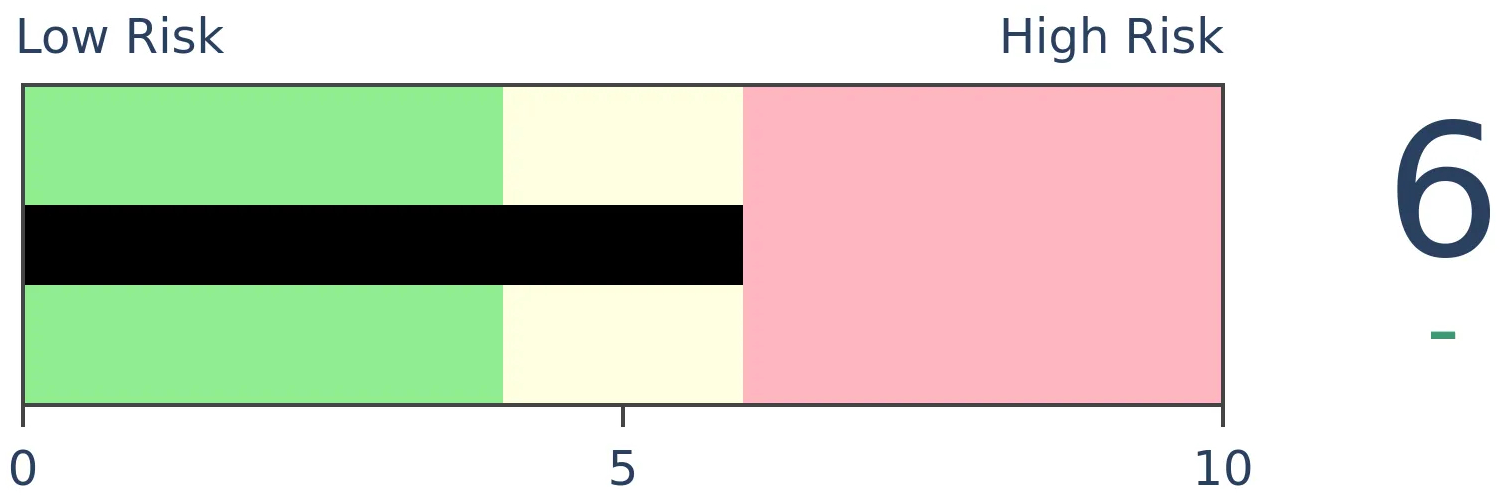
Risk Levels
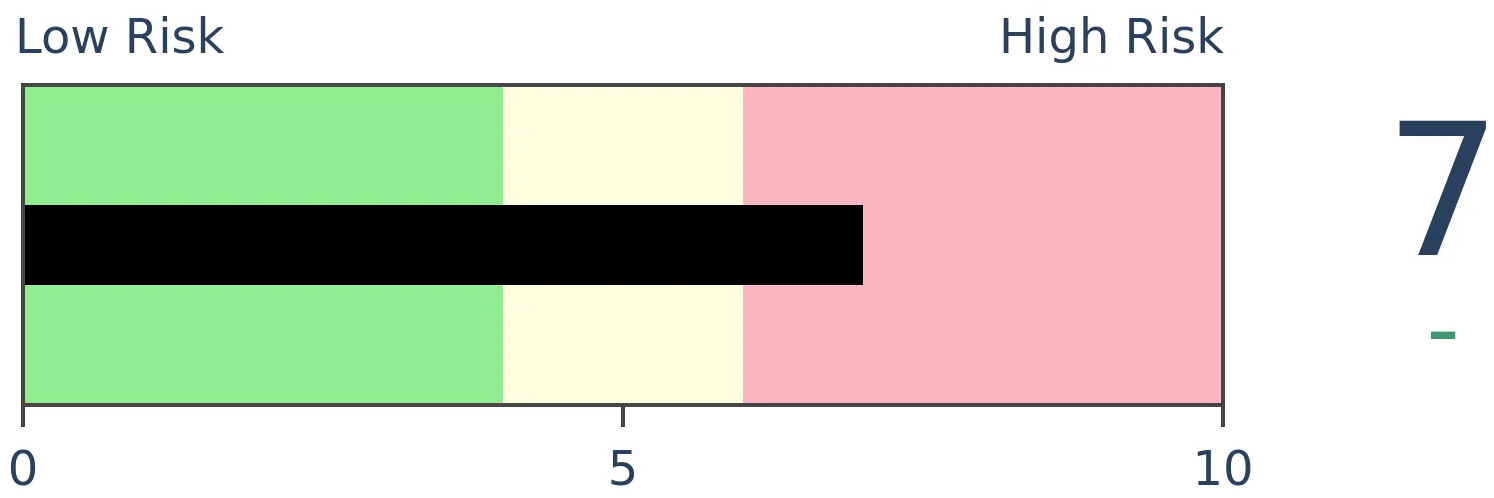
Stocks Short-Term
|
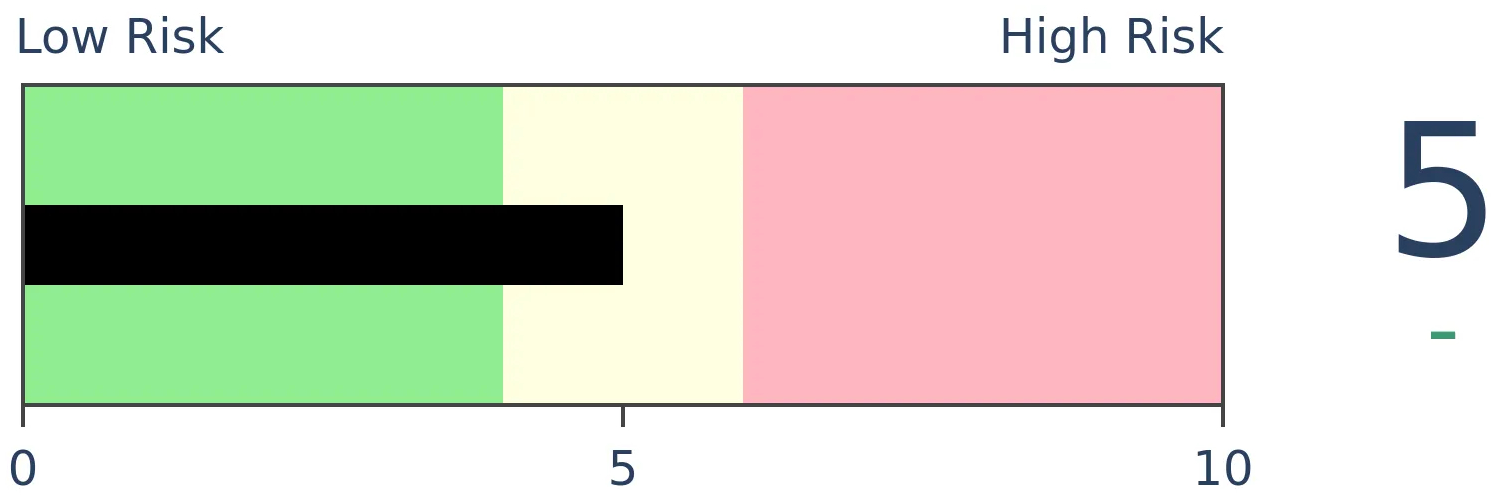
Stocks Medium-Term
|
|
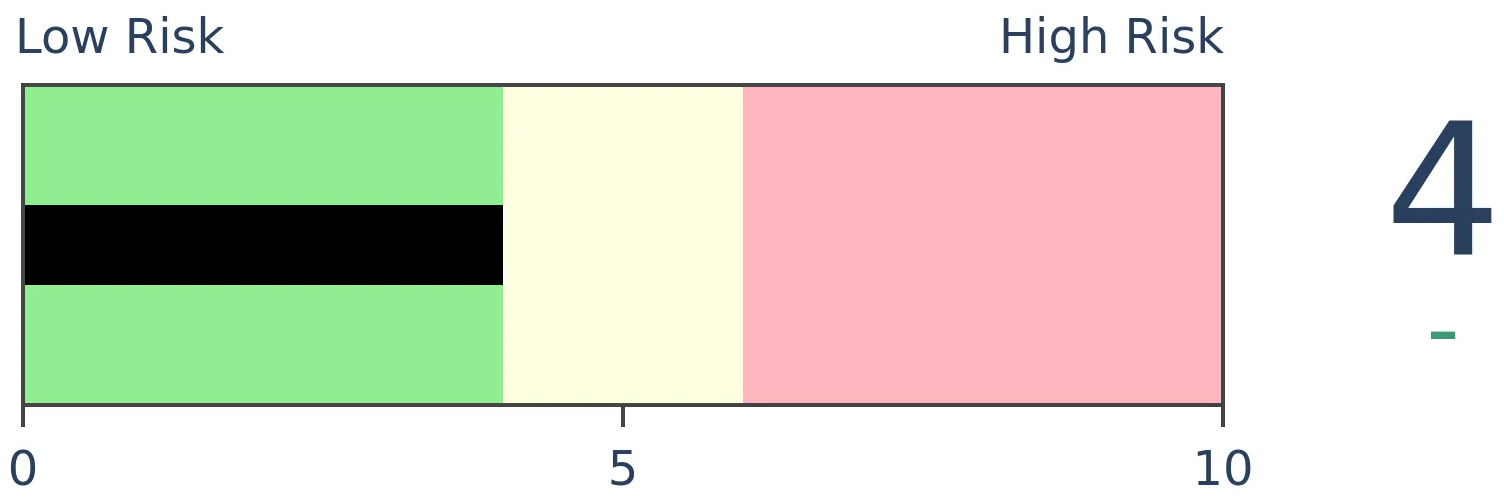
Bonds

|
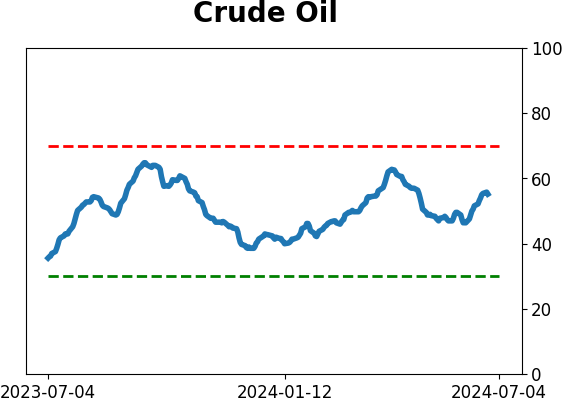
Crude Oil
|
|
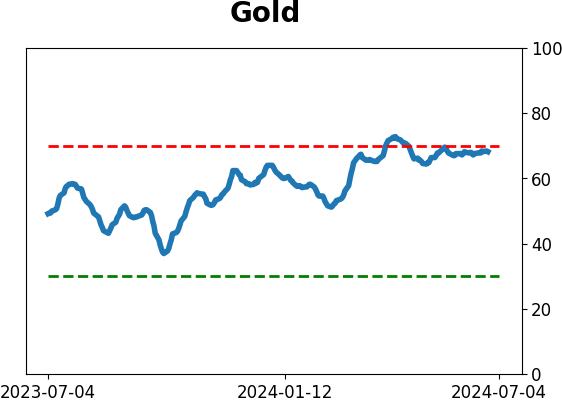
Gold

|
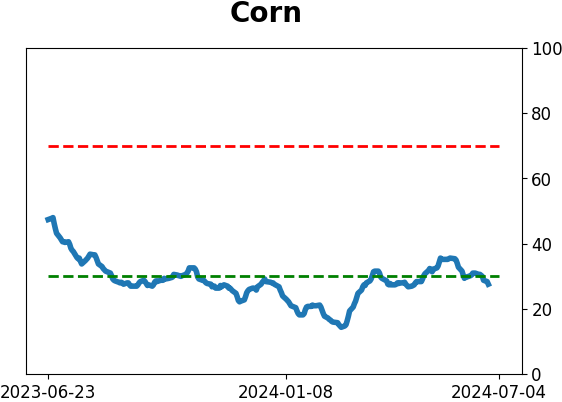
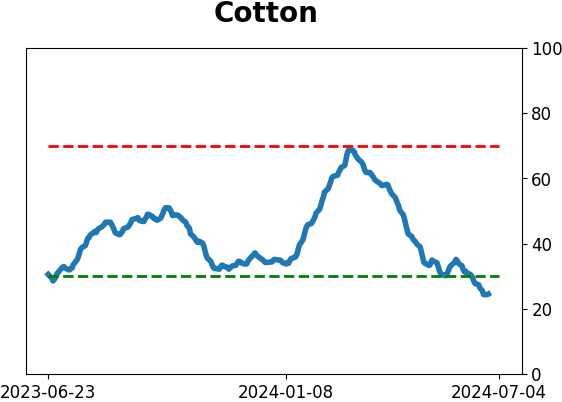
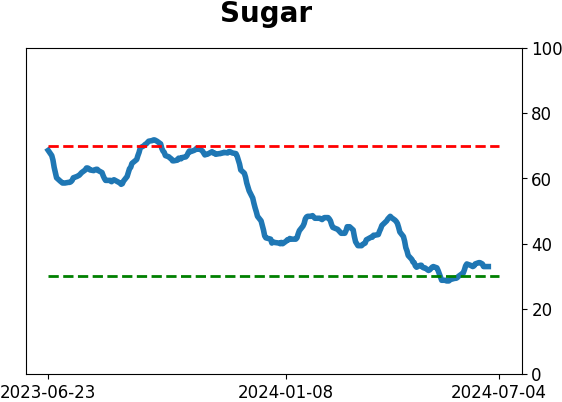
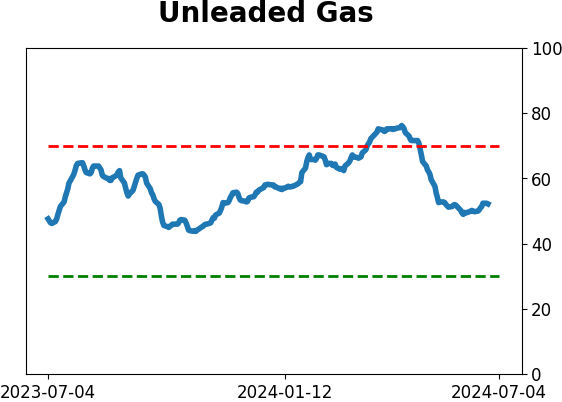
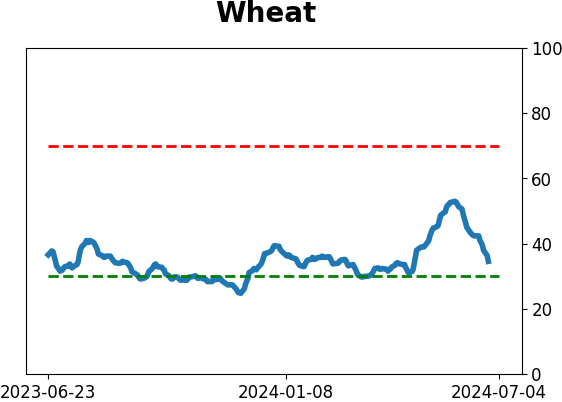
Agriculture
|
|
Research
By Jason Goepfert
BOTTOM LINE
Contrarians always seem to be heartened by a lack of optimism among other investors, but it's not that simple. Bull markets thrive on ever-rising optimism, and that's not something we're seeing now. Dumb Money Confidence is showing less and less optimism as stocks rally, and the Fear & Greed model is actually closer to fear than greed.
FORECAST / TIMEFRAME
None
|
Key points:
- As stocks rally, Dumb Money Confidence has reached lower highs, showing a divergence with price action
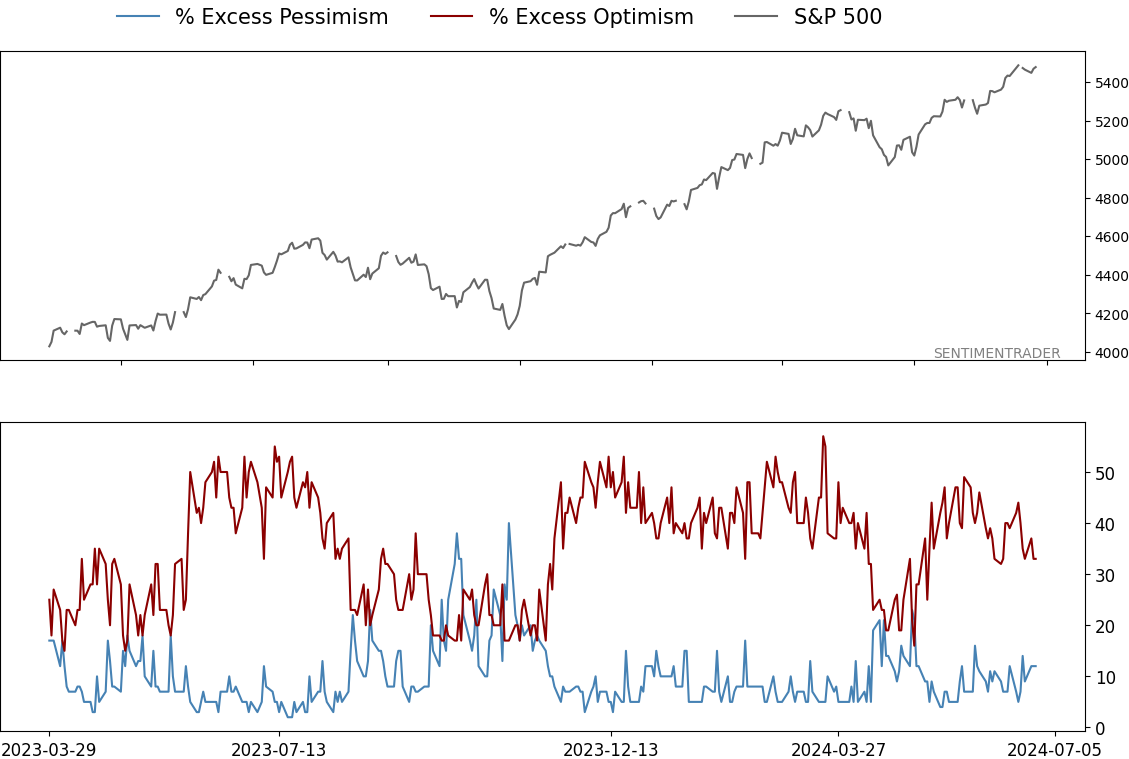
- The lack of interest is even more evident in the Fear & Greed model
- Bull markets thrive on ever-rising optimism, so negative divergences tend to precede weaker prices
Investors are becoming less interested
Over the past couple of weeks, we've looked multiple times at divergences developing under the surface of the Nasdaq 100 and across other parts of the market. These divergences are both a cause and an effect of a historically calm and uncorrelated market on the index level.
It's not just breadth that is diverging. That can be concerning enough because it shows that the indexes everyone pays attention to are masking underlying turmoil. But bull markets can continue as long as investors remain bullish, especially if they are getting increasingly bullish. At some point, that optimism climaxes, but up until then, rising optimism is a feature, not a bug, of sustained bull markets.
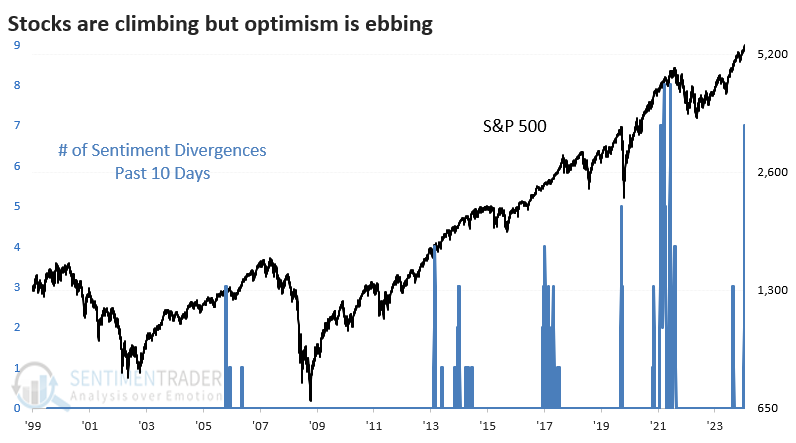
That's why it's a bit disturbing that we're not seeing more bullishness now. As the major indexes have climbed, Dumb Money Confidence has become less enthusiastic. That's what we saw preceding the peak in 2021, though that divergence went on for many more months before it mattered.
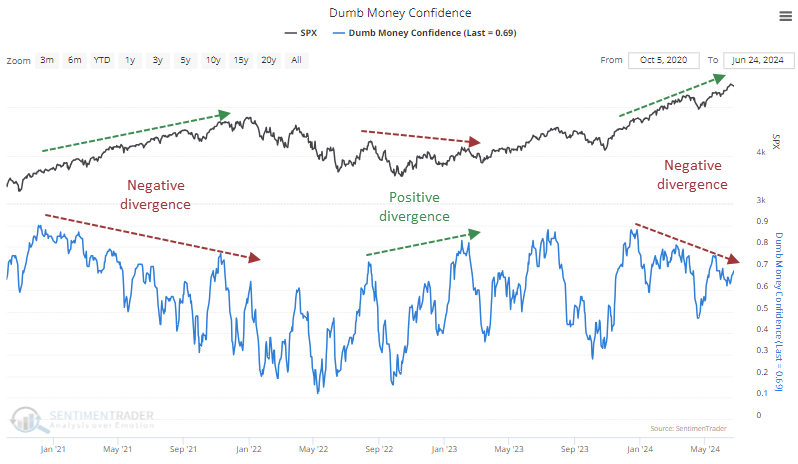
It might be worth paying attention now because the divergences have added up. Since any divergence can persist for a long time, quantifying them and identifying clusters is often beneficial. That helps a little bit to judge when they might matter. And now we have the 2nd-largest cluster since Dumb Money originated in 1998, next to the late summer and fall of 2021.
Fear & Greed is nearing fear
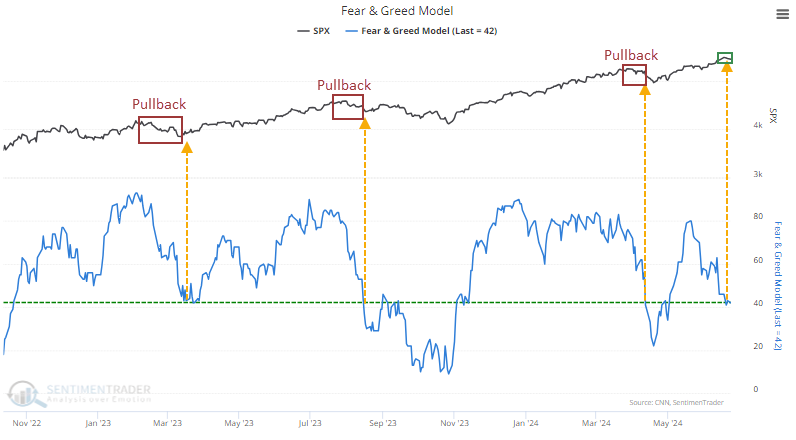
We can see a similar divergence with the Fear & Greed model. This is based on the one published by CNN, and this one is more explainable because that model is much more heavily influenced by breadth than Dumb Money Confidence. Despite the S&P 500 hovering near record highs, the model is dropping toward Fear level, which has usually only happened after a more significant price pullback.
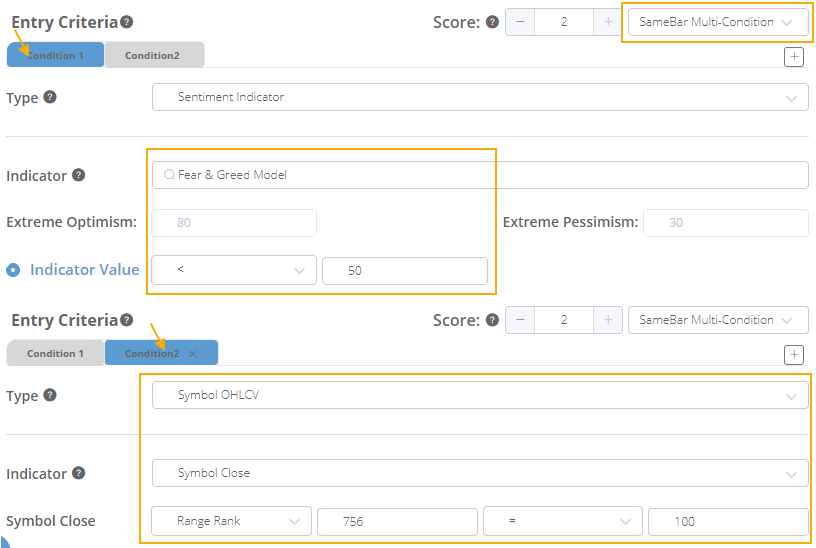
You can test for similar scenarios by clicking the Backtest with the Backtest Engine 2.0 indicator. We'll do a multi-condition test to look for any date when the Fear & Greed model was below 50, and the S&P 500 was at 100% of its 3-year range (756 trading days).
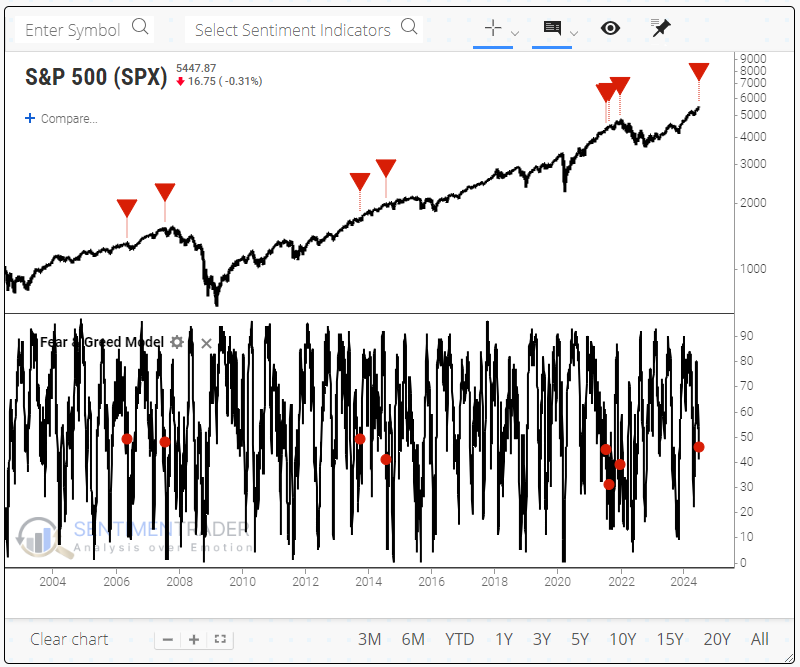
The resulting chart and stats show that, as a system, this was not a very successful shorting strategy. However, just glancing at the charts shows that these divergences tended to show up around some trouble spots.
The table below shows every date when the S&P 500 closed at a 52-week high. At the same time, Dumb Money Confidence was below 70% and the Fear and Greed model was below 50. These are new highs with ebbing optimism, and the S&P's returns weren't too comfortable for bulls.
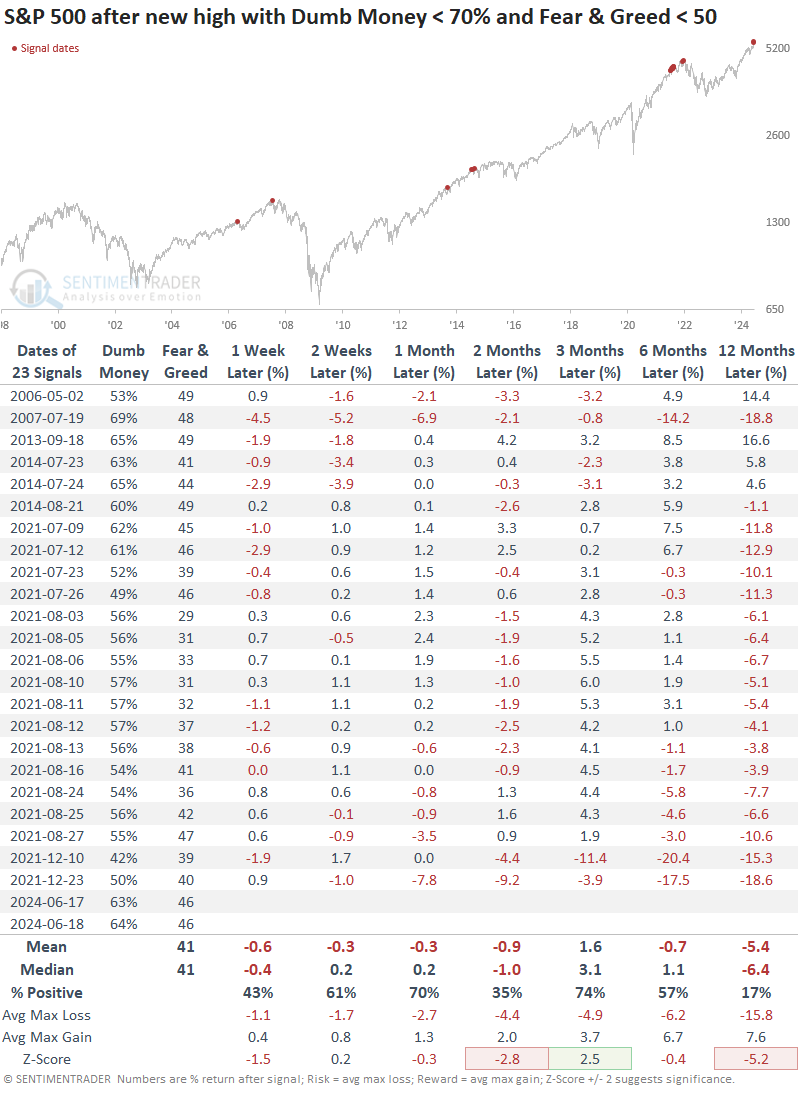
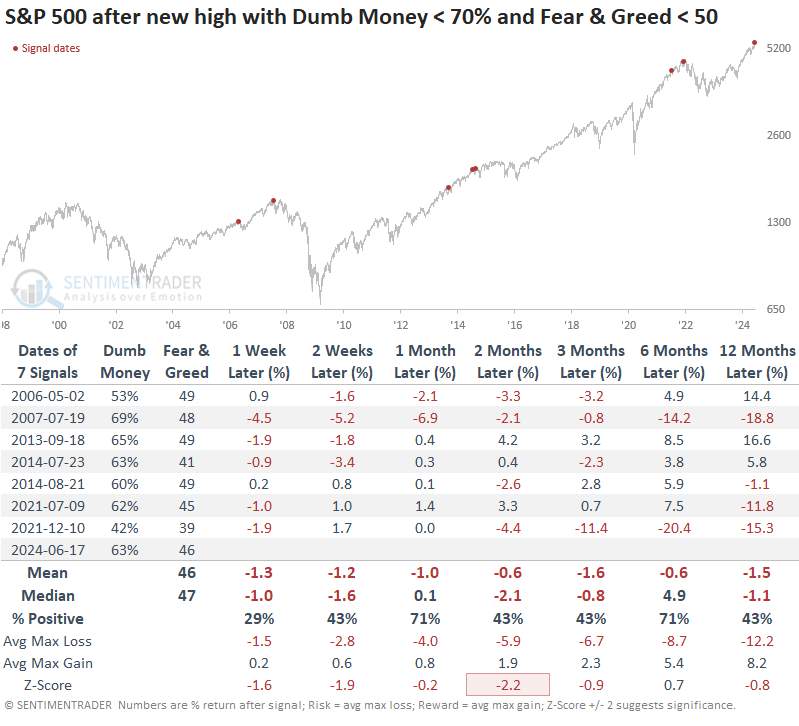
One reason for the poor results is the large number of dates clustered in 2021. So, let's filter the table only to include the first instance in at least a month, which we can see below. Again, however, there was a lot of red in the table, with a poor ratio of risk to reward for bulls.
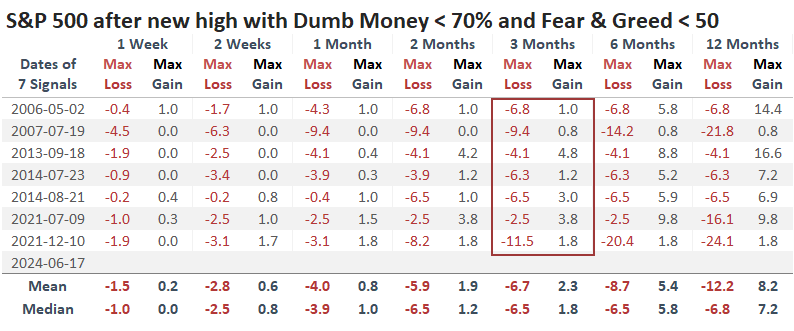
A table of maximum gains and losses across time frames shows that the skew was heavily skewed toward risk over the next three months. There were only two signals when the reward was greater than the risk, and those were just barely.
What the research tells us...
One of the frustrating aspects of closely watching non-confirming indicators is that oddities can pile up for weeks, months, or even years. When an investor gets disgusted enough that nothing matters anymore (while everyone else is making big money), things tend to start to matter again. It's a head game that causes many to abandon this type of analysis.
We're starting to see some of that attitude now. The divergences started a while ago, yet the major indexes and a handful of stocks have been hitting new highs or close to them. So, we're seeing the usual catcalls about just following the charts. Okay, whatever floats your boat. We're more focused on risk; in that sense, risk has risen. It's at the highest point for multi-week to multi-month traders/investors in at least two years. Anything can happen, of course, but the most likely scenario is that short-term gains will likely be given back during a subsequent pullback.
Indicators at Extremes
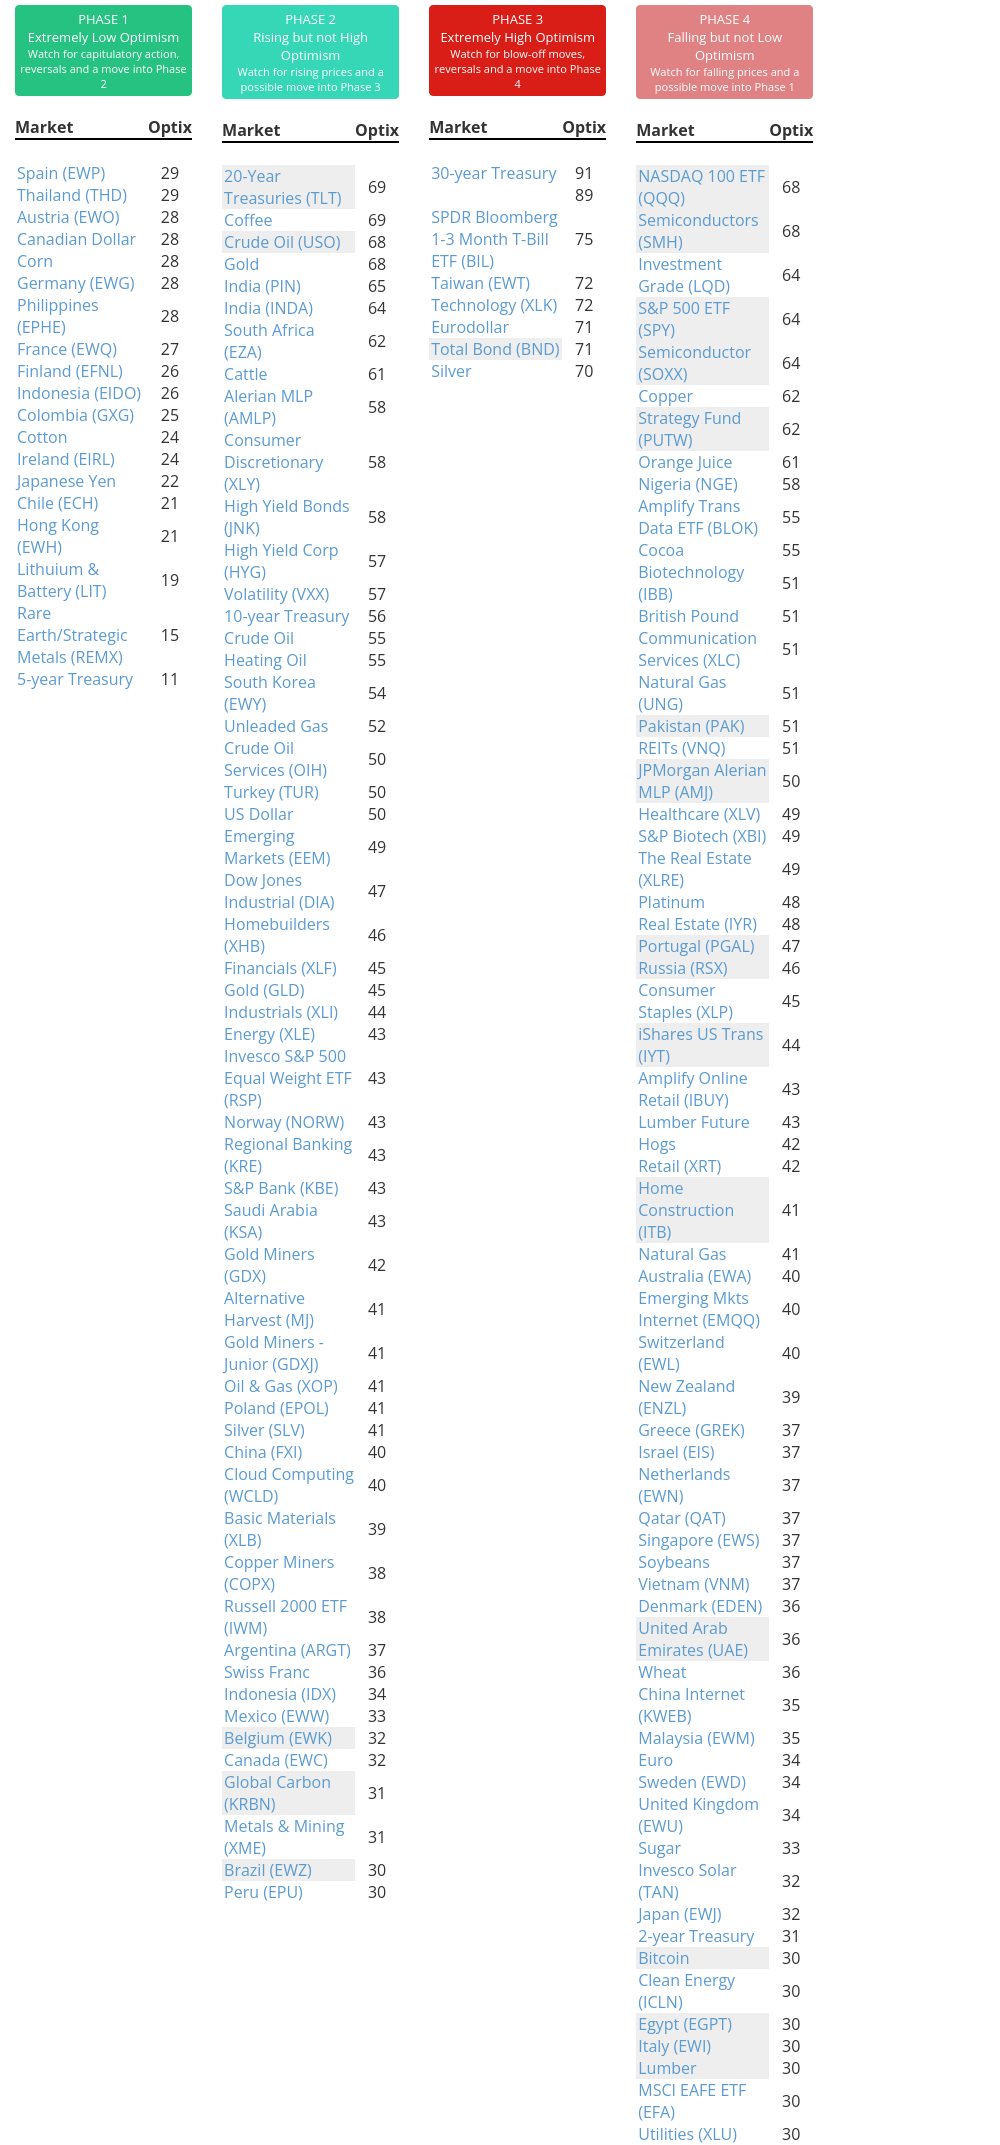
Phase Table
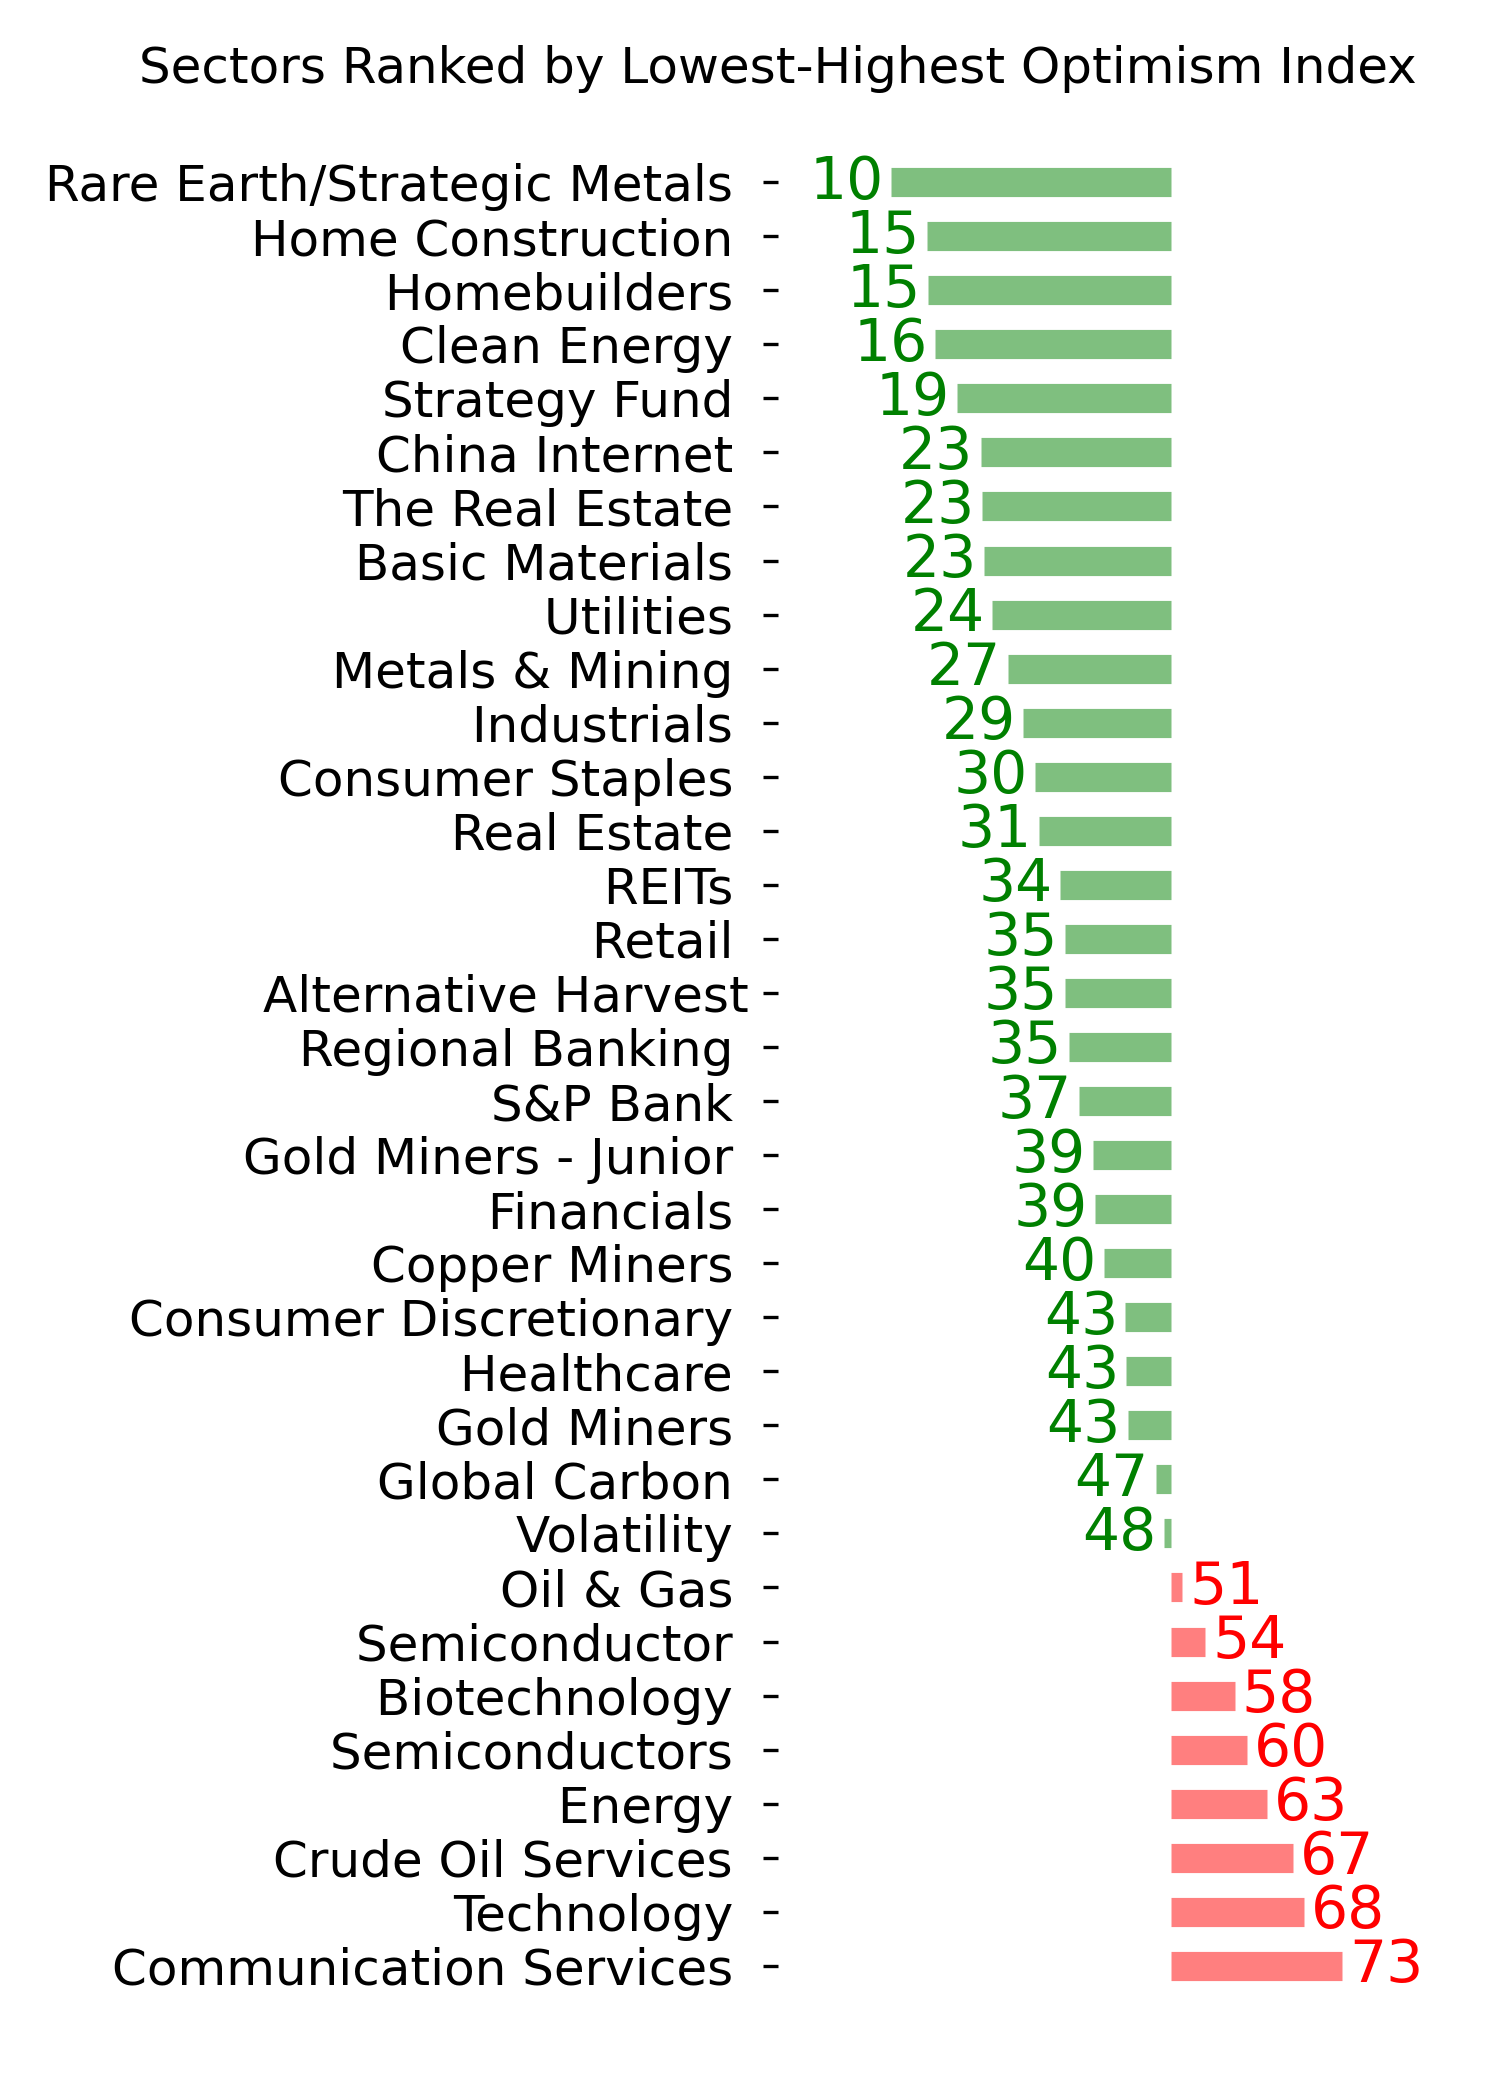
Ranks
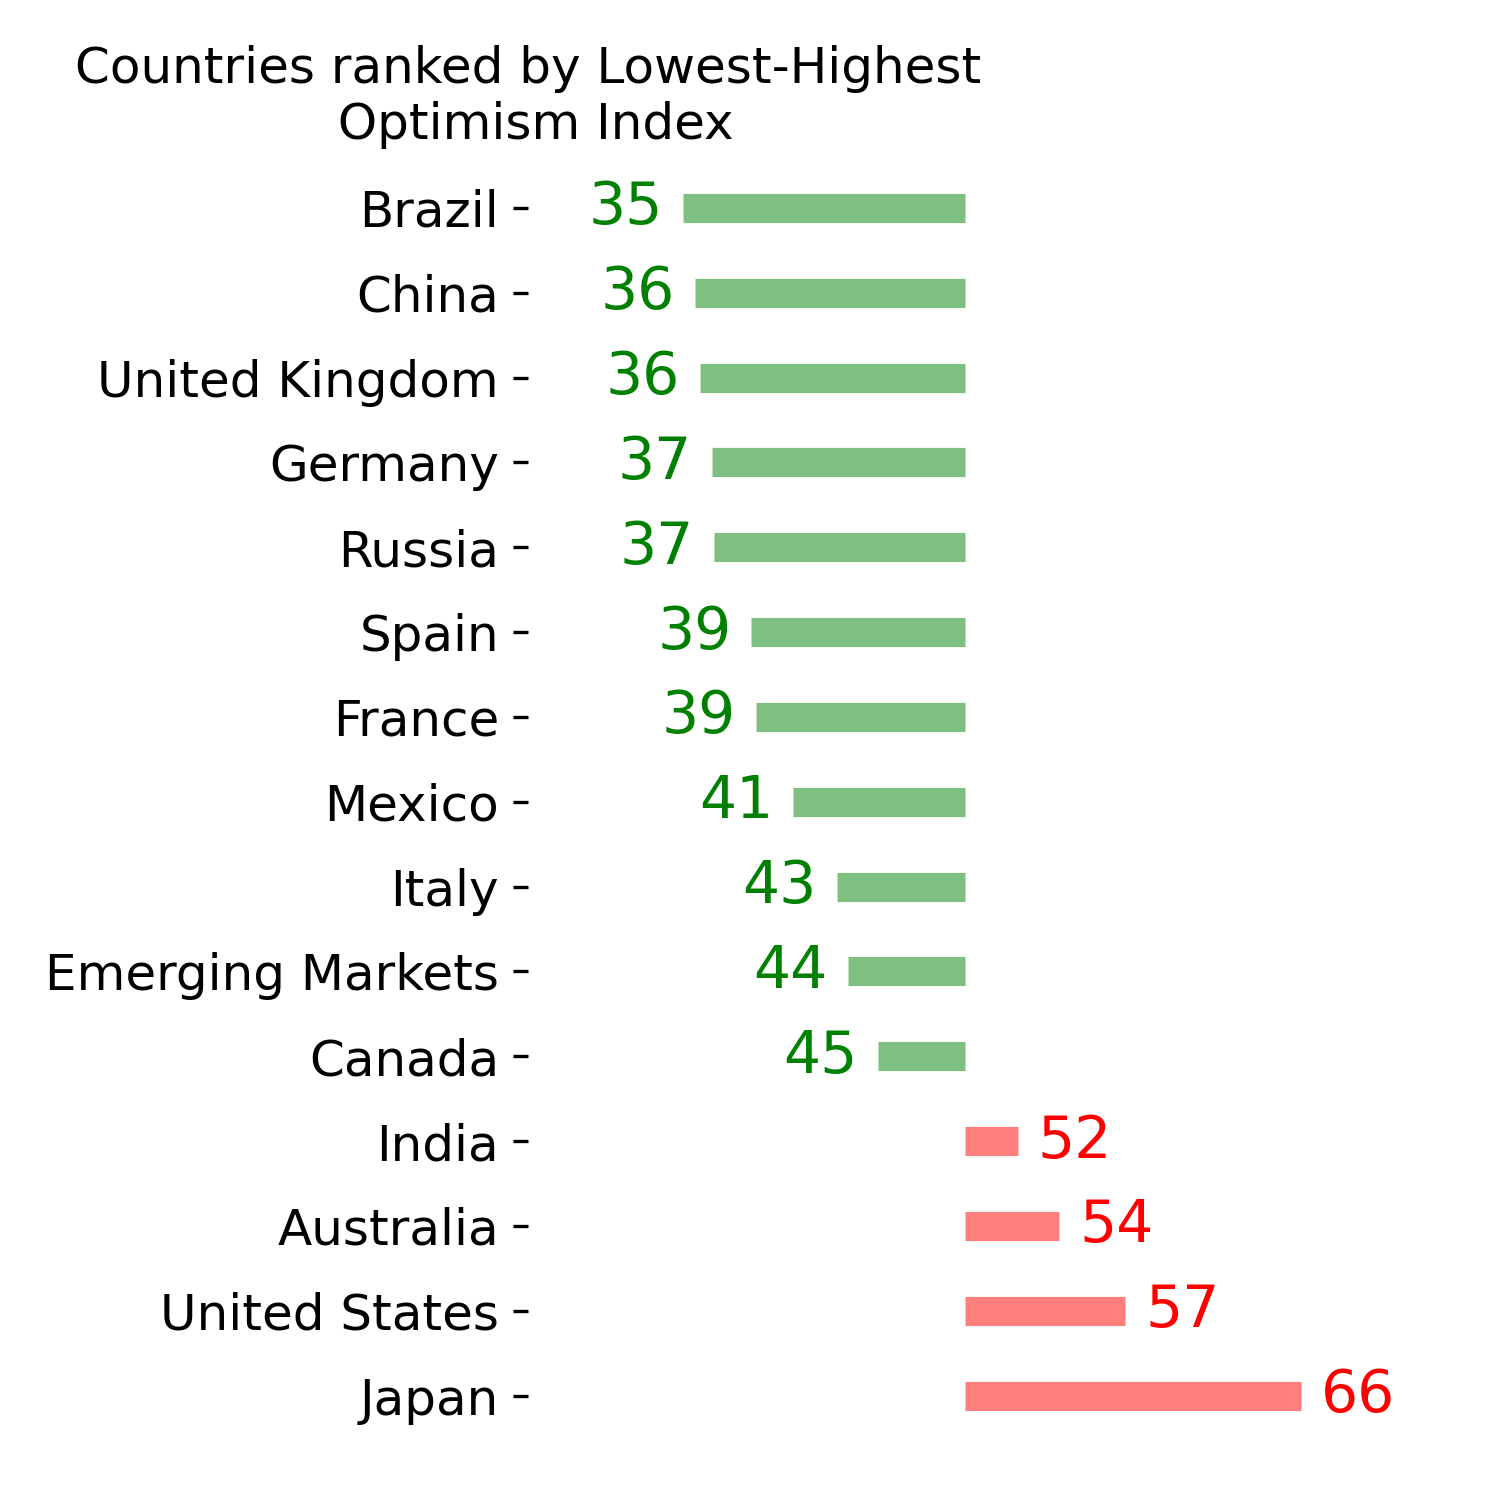
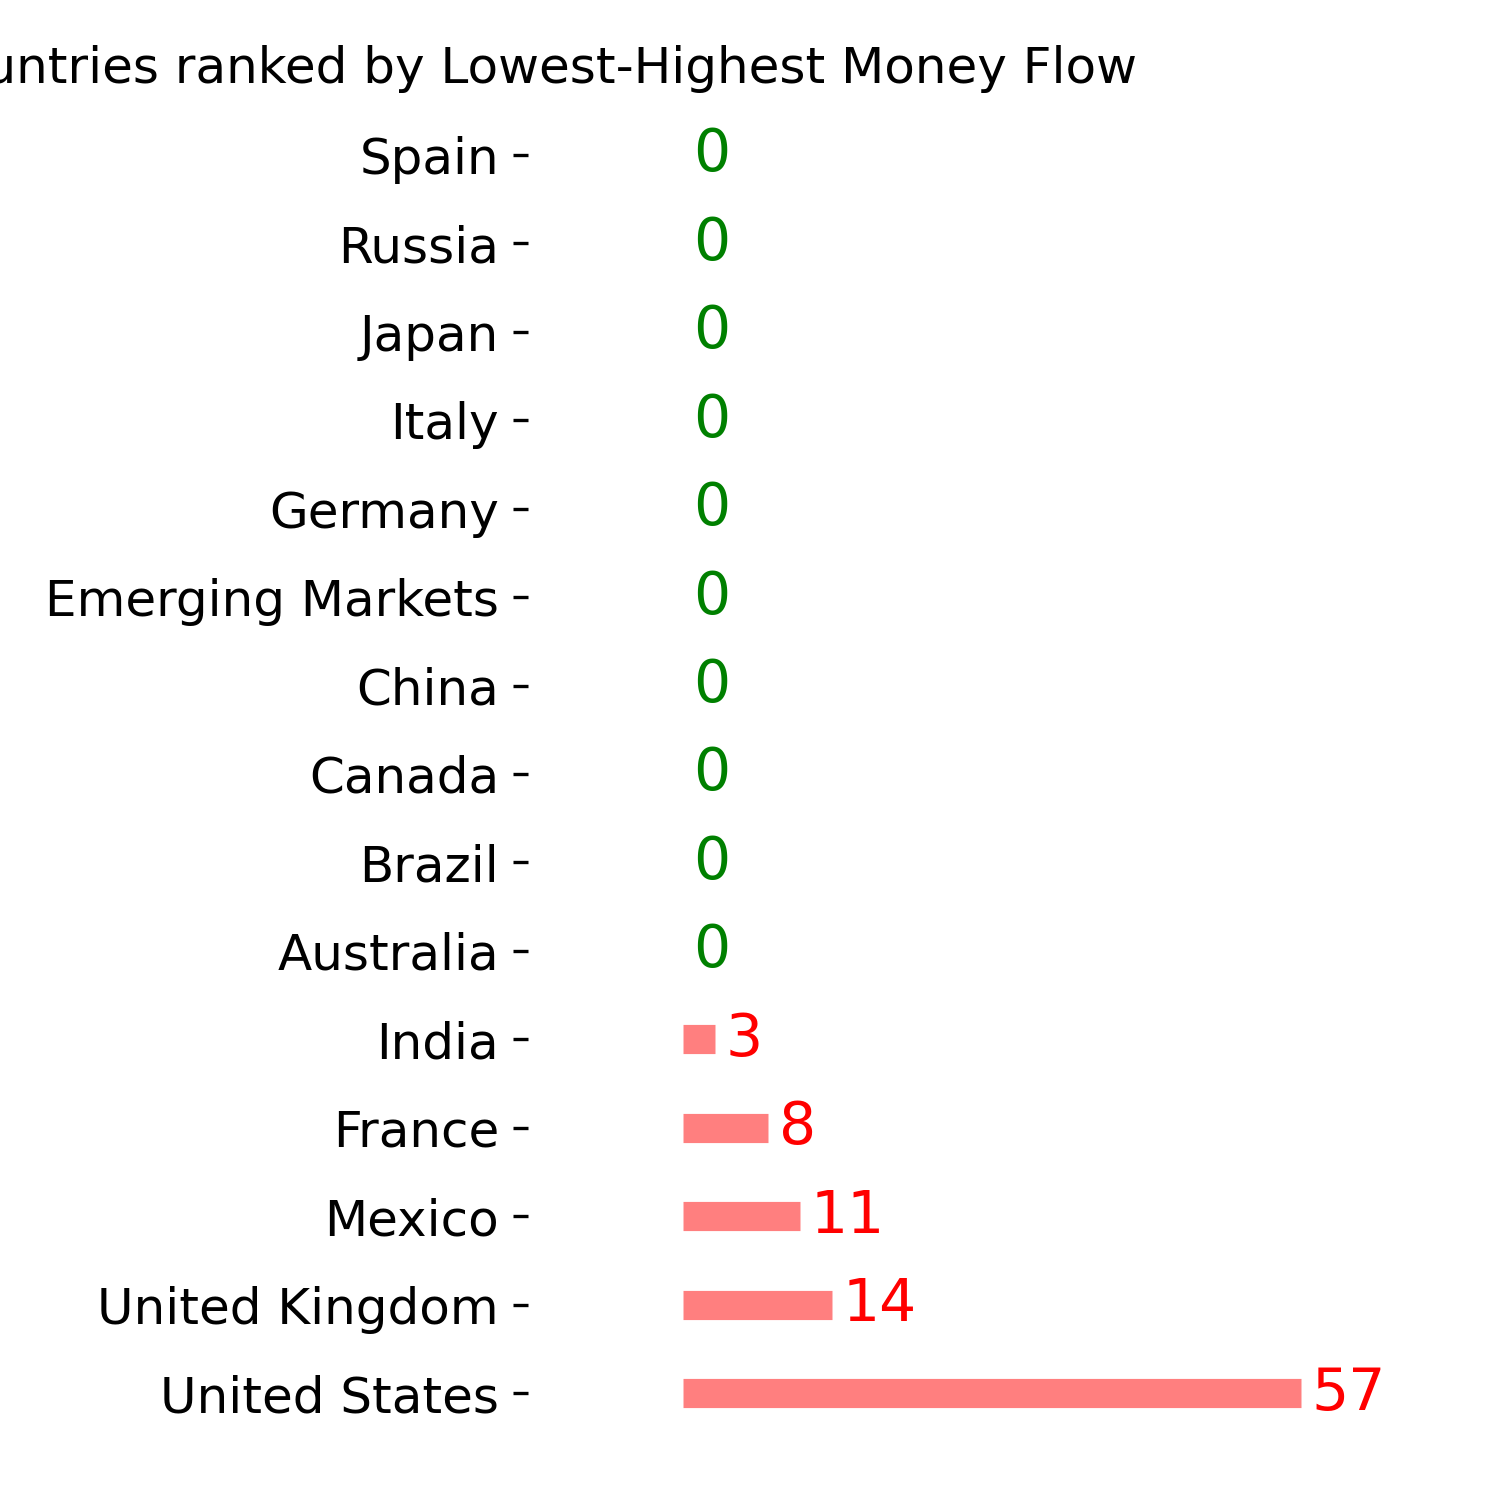
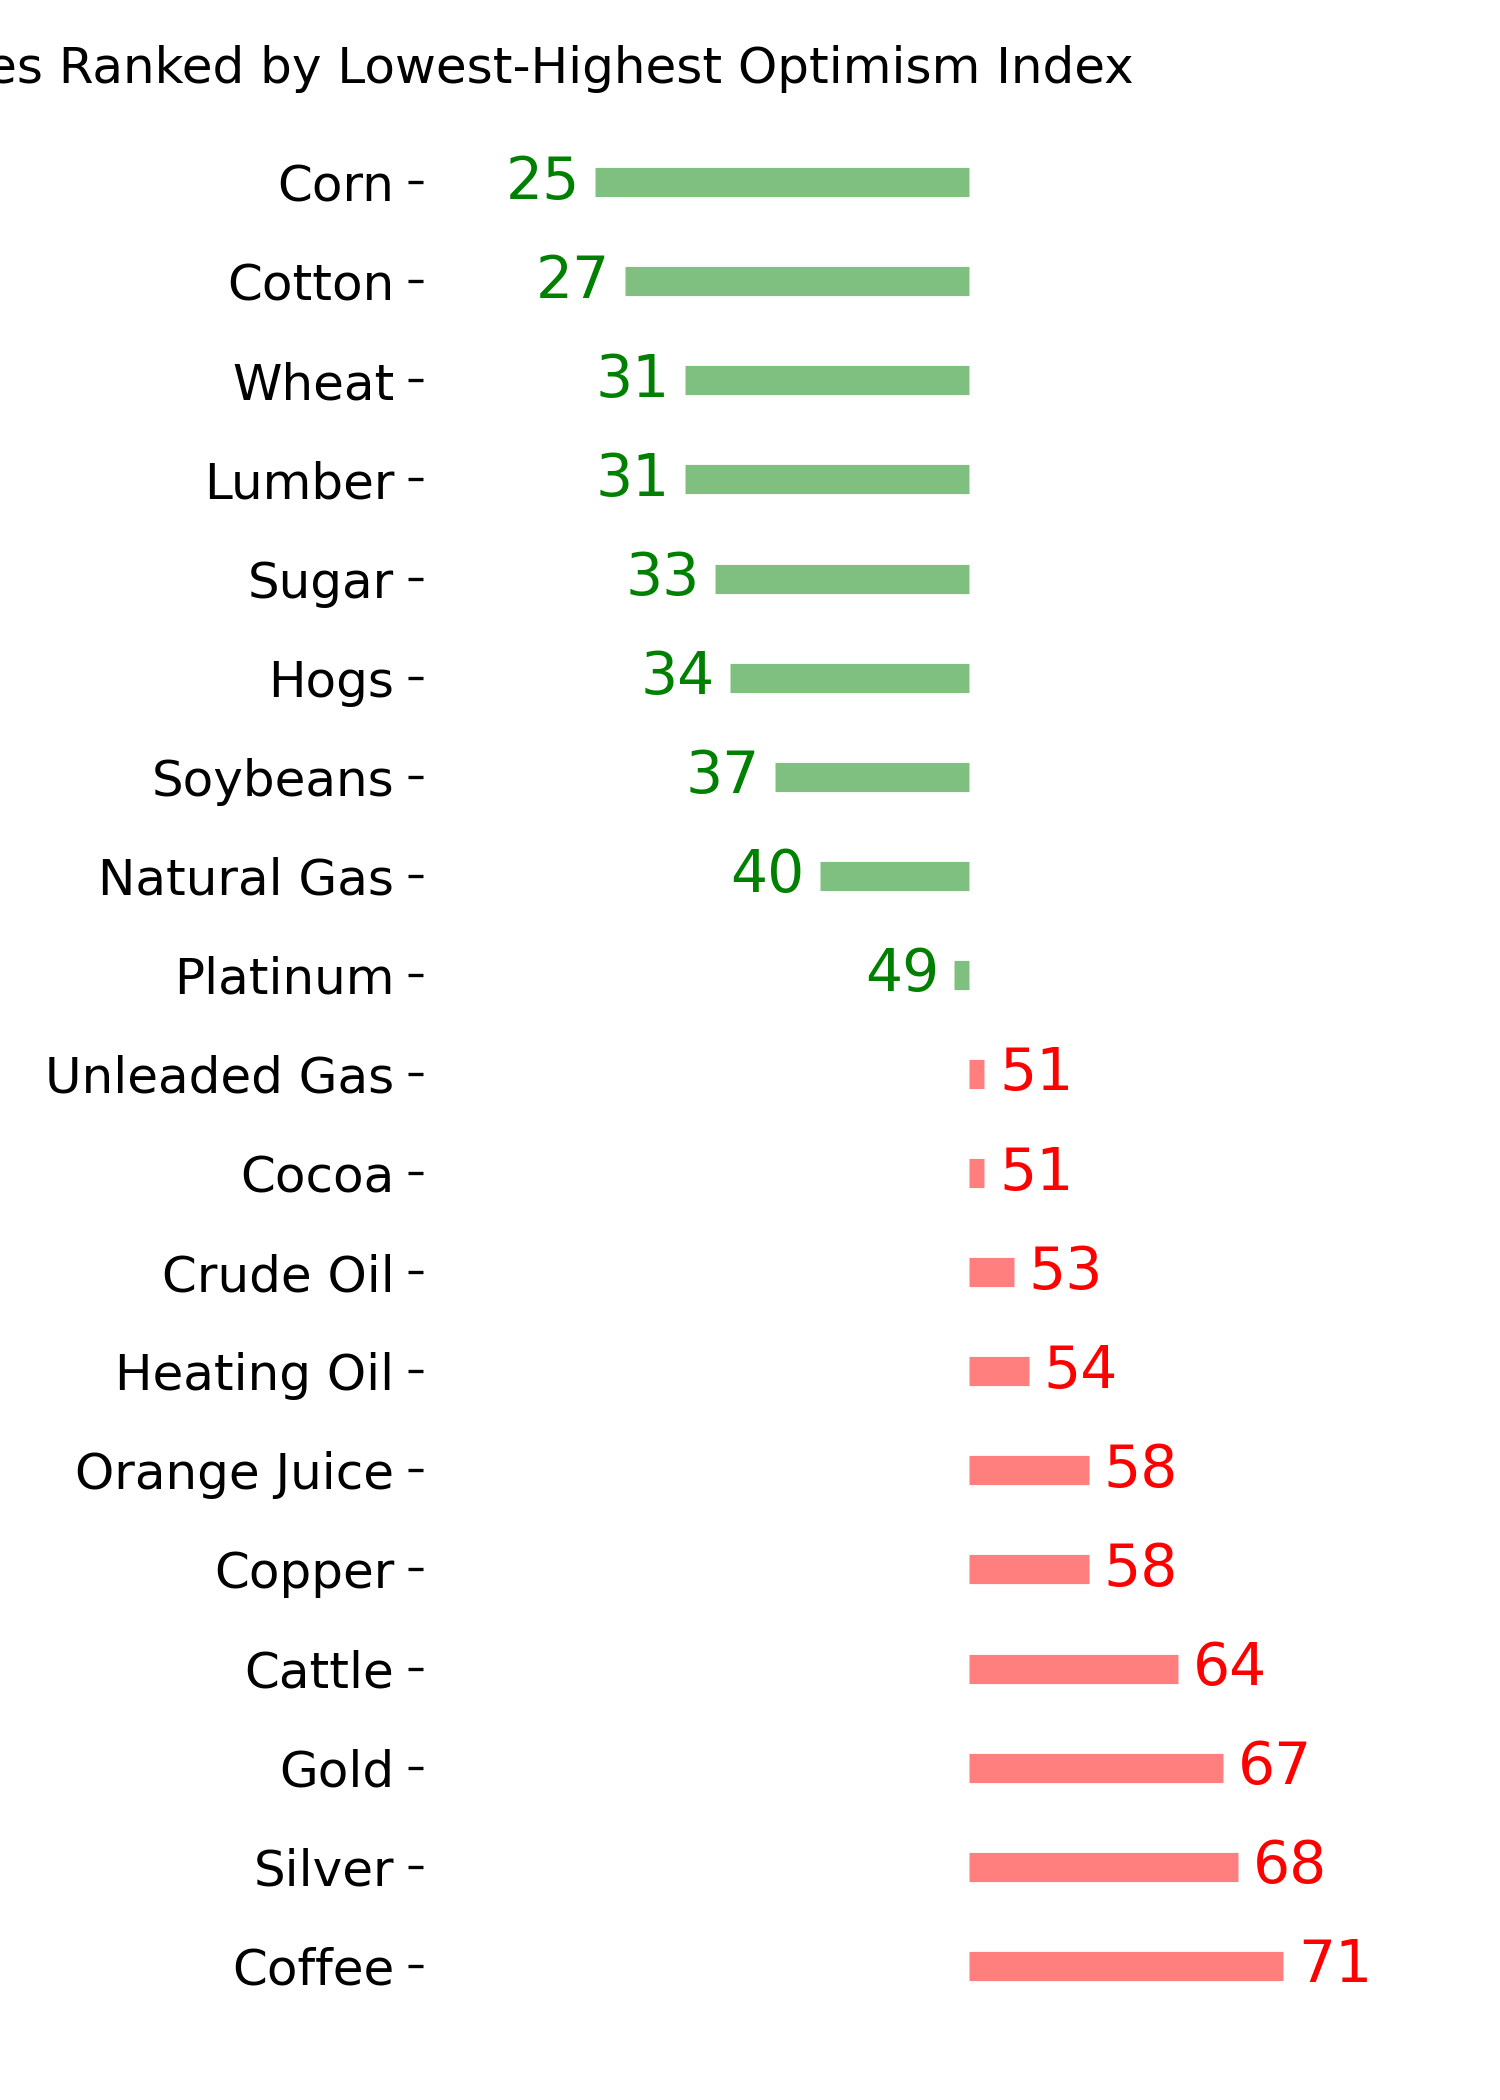
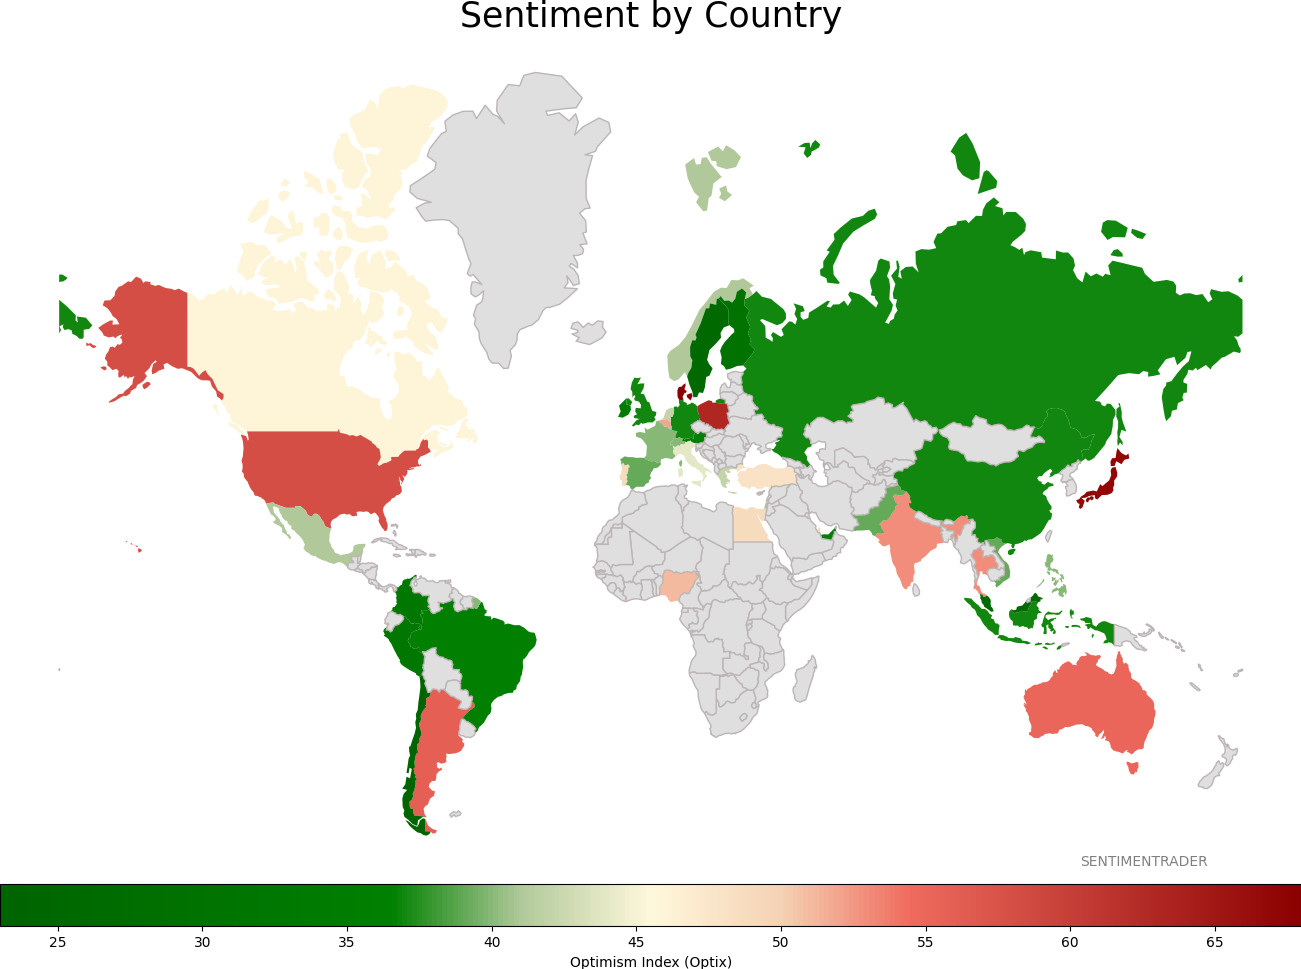
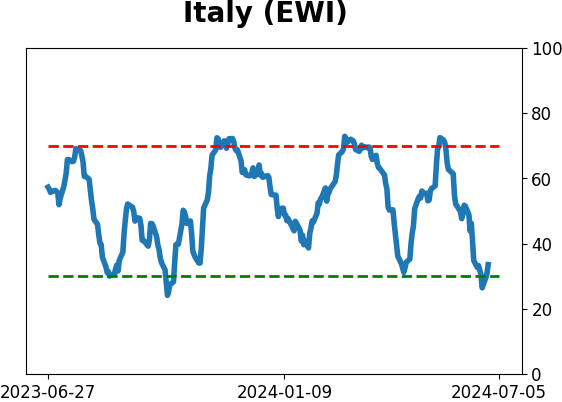
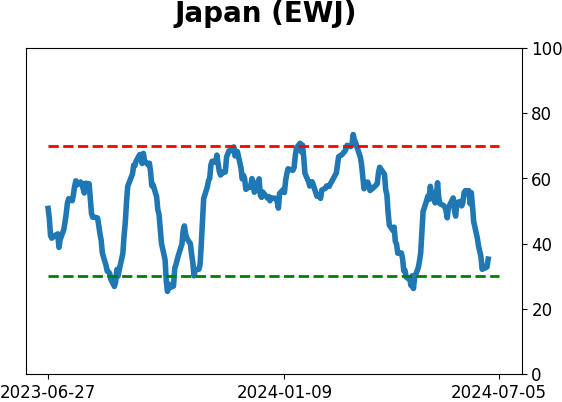
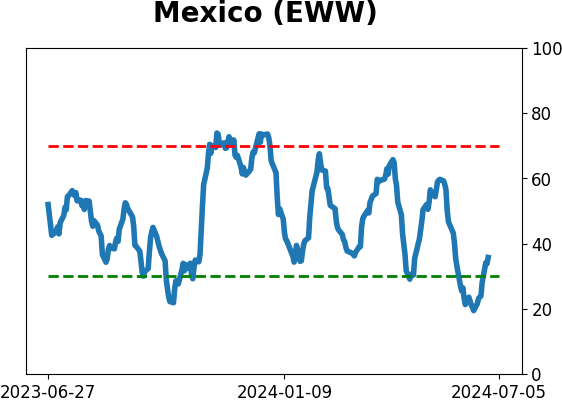
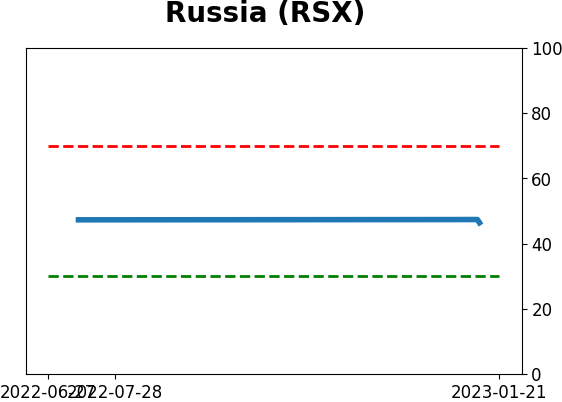
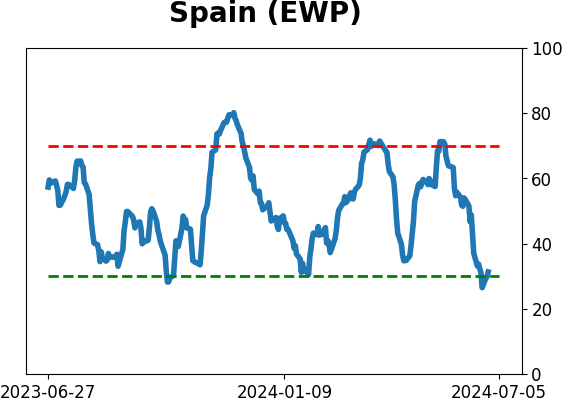
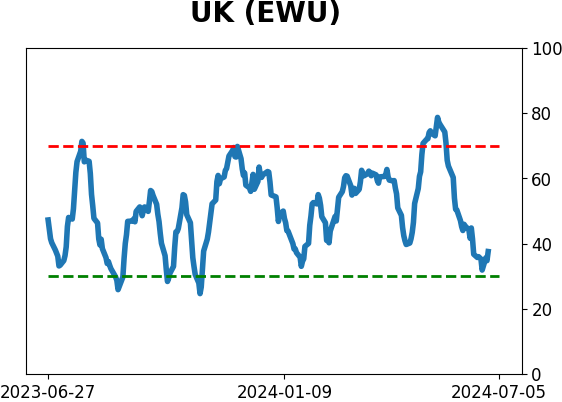
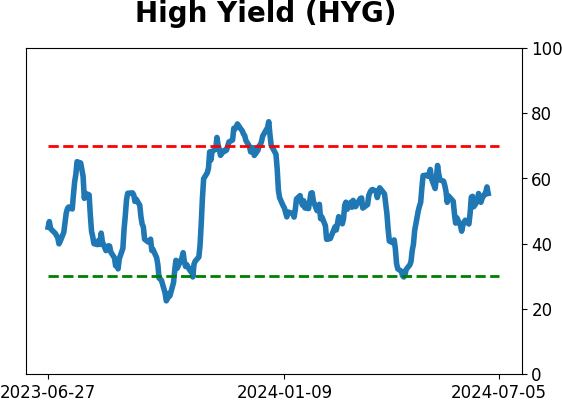
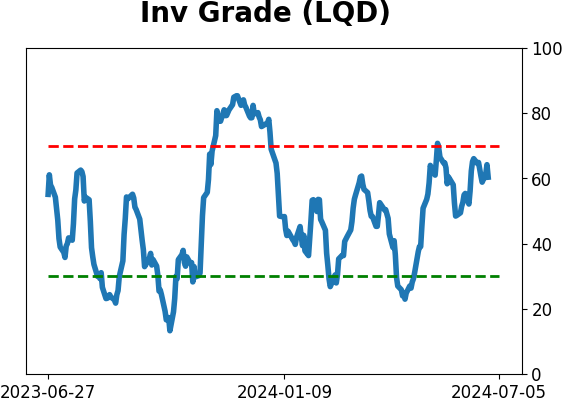
Sentiment Around The World
Optimism Index Thumbnails
|
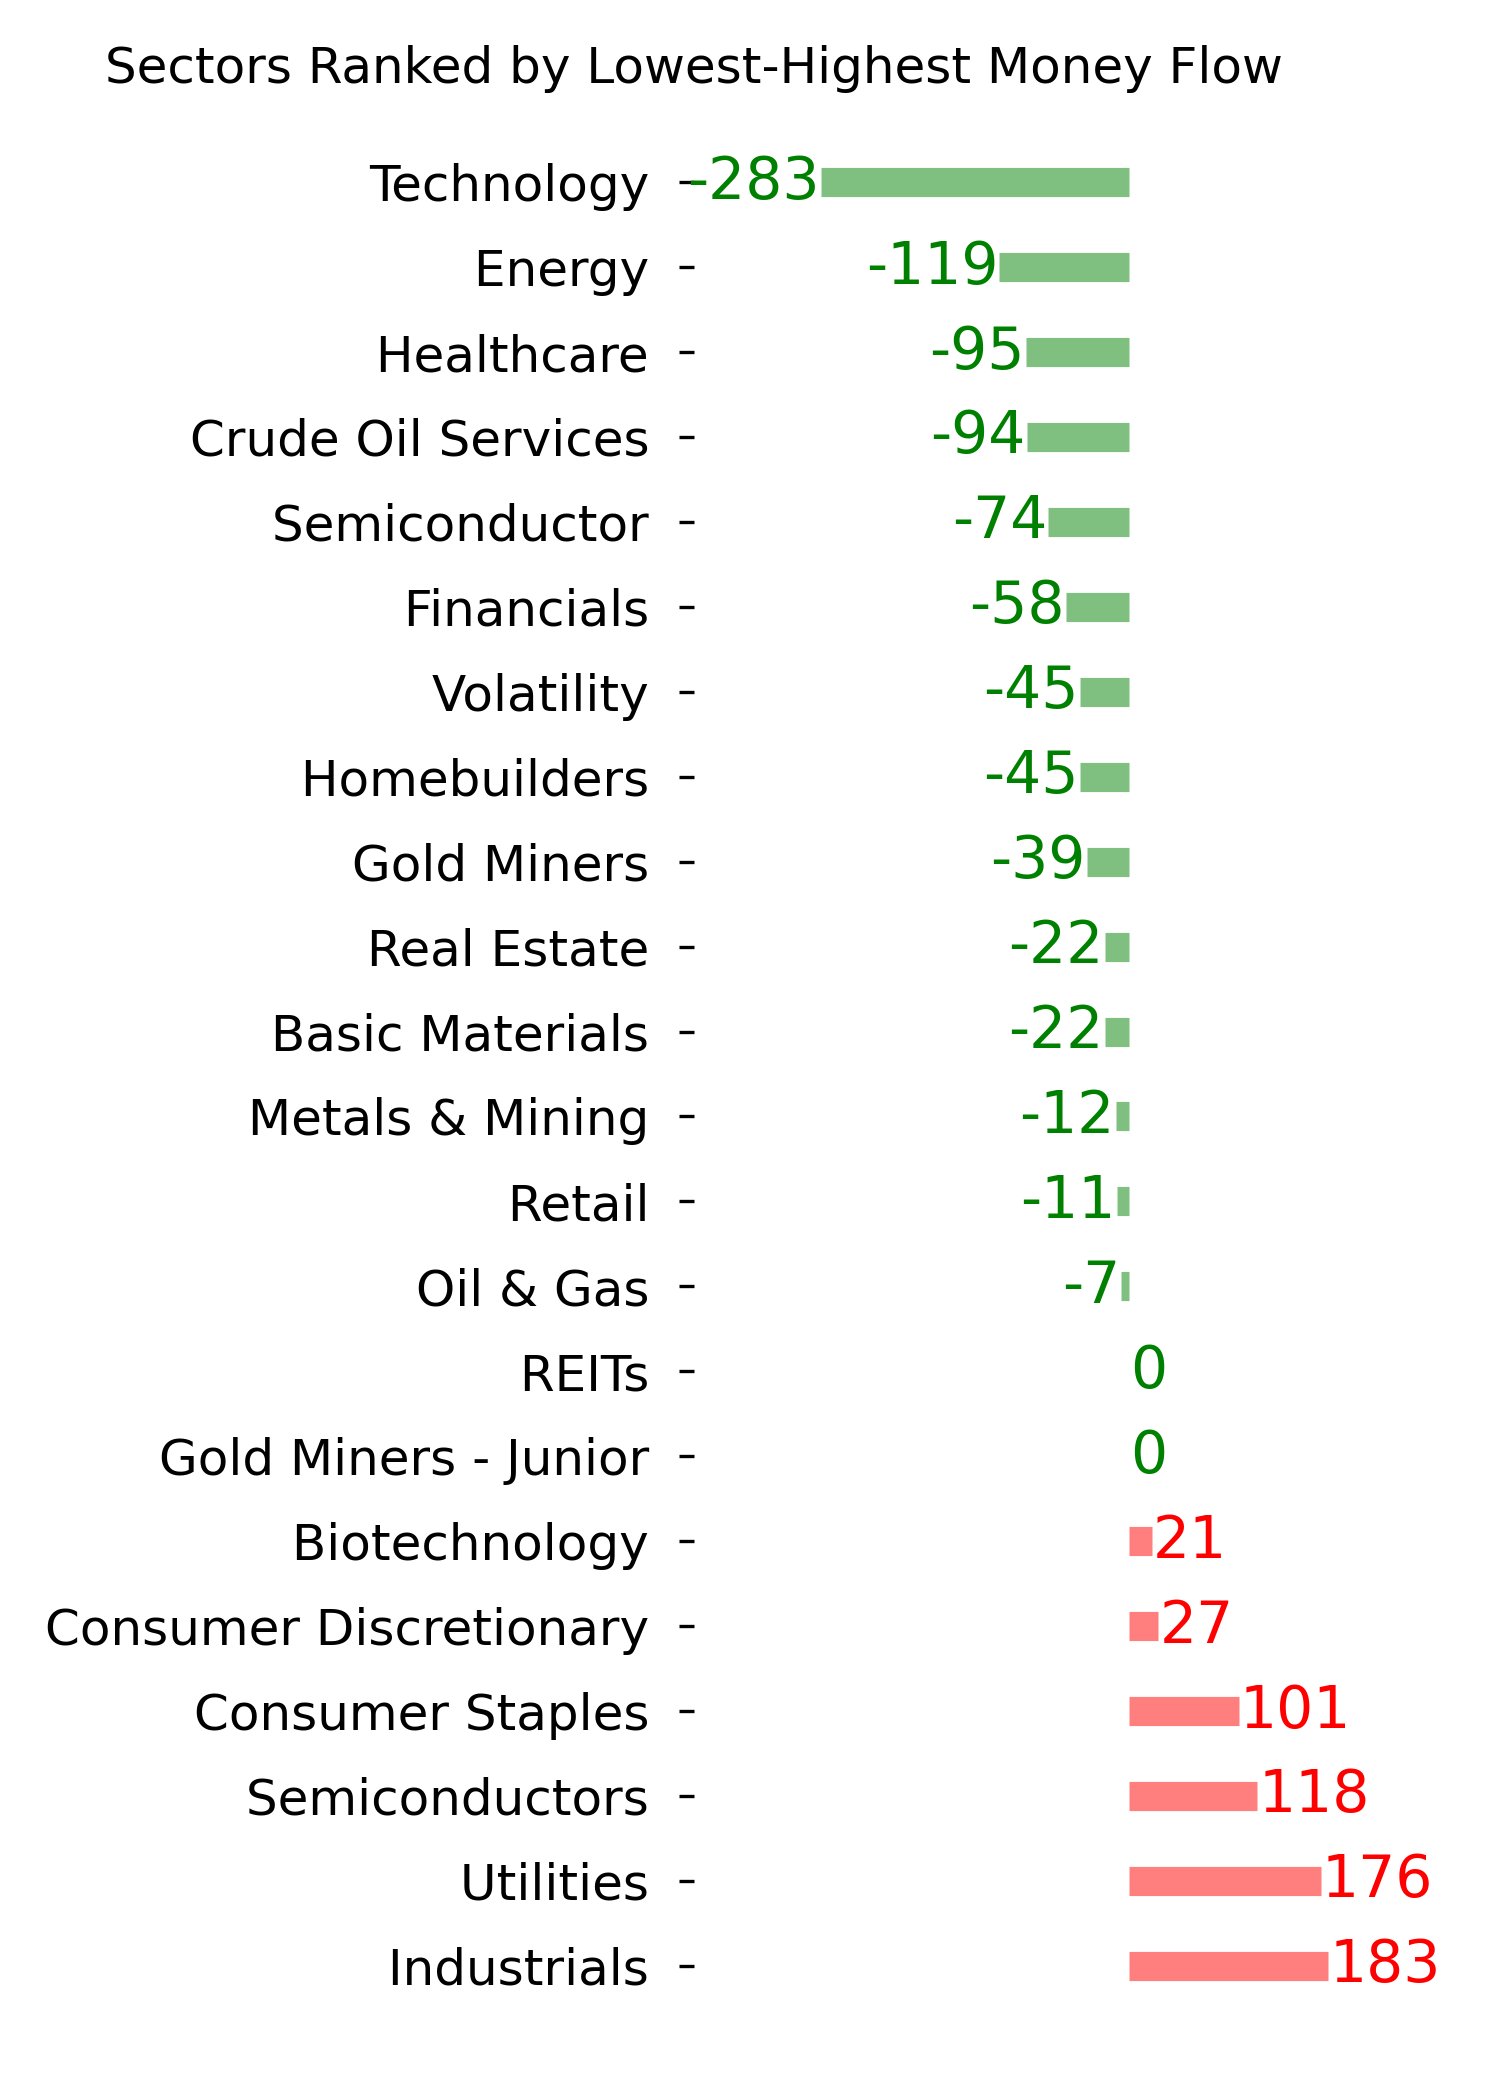
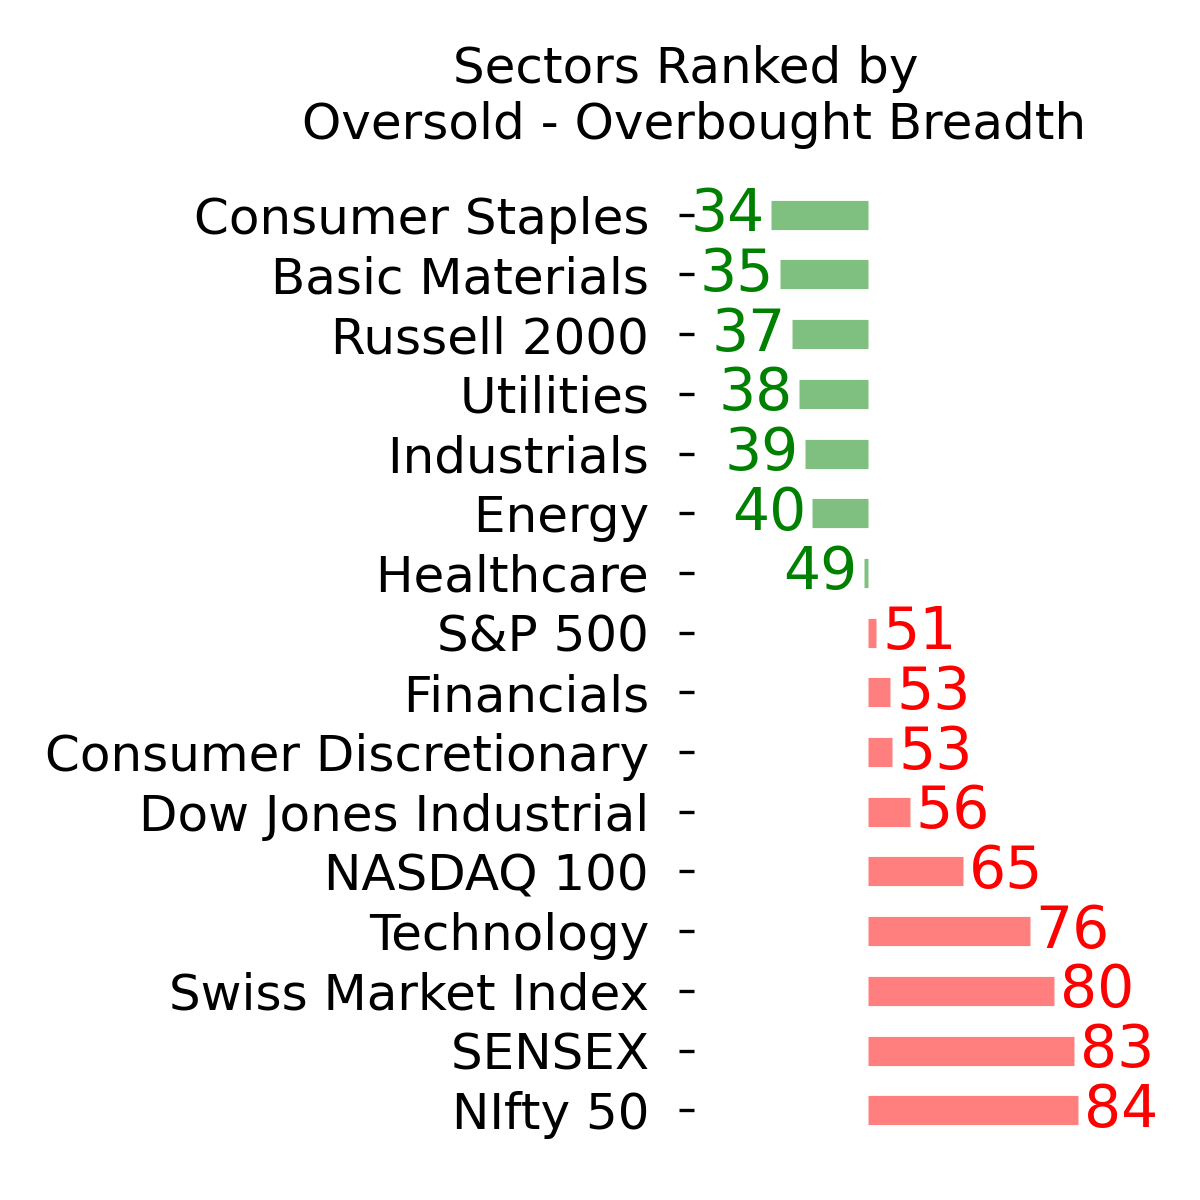
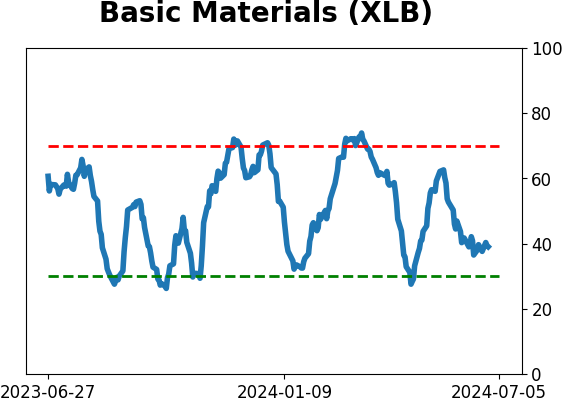
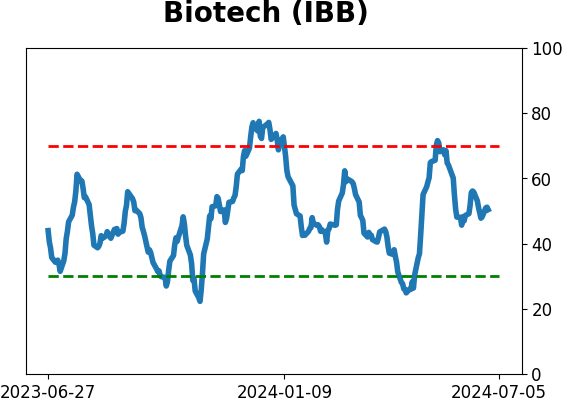
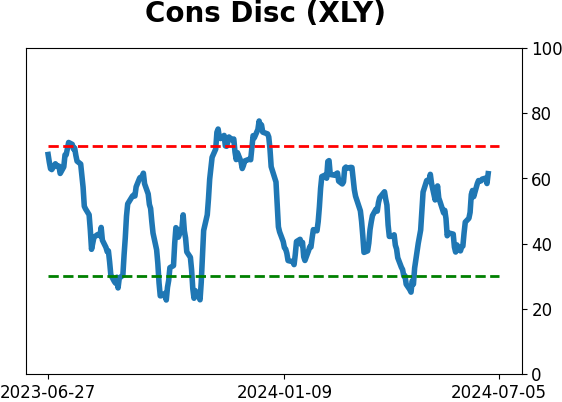
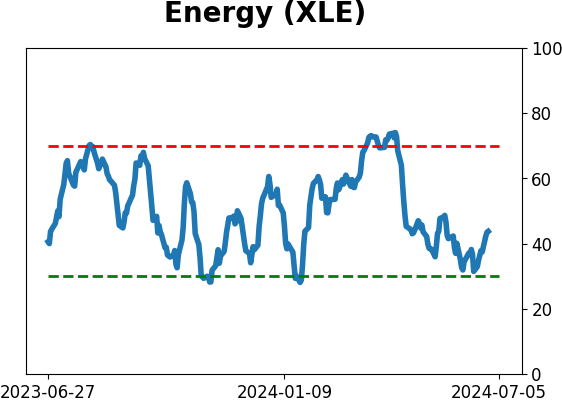
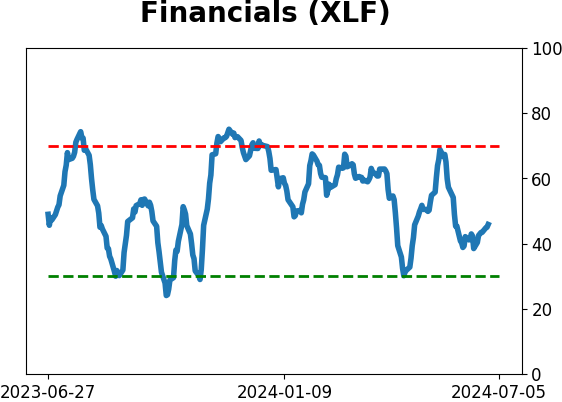
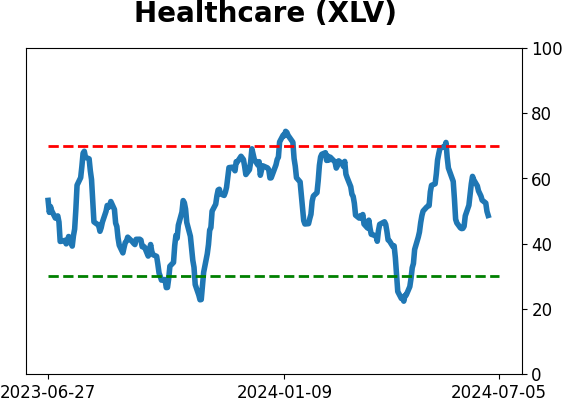
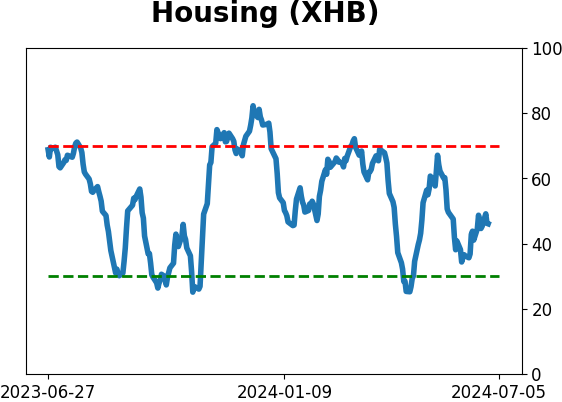
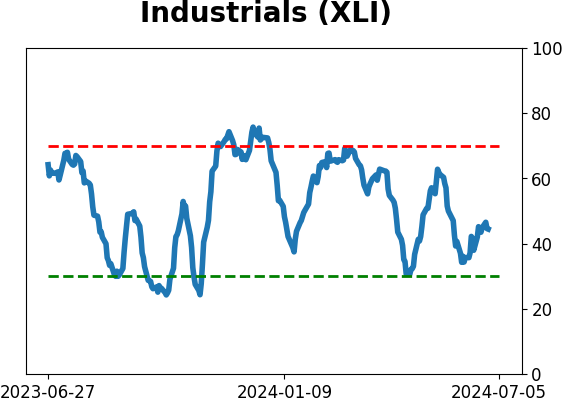
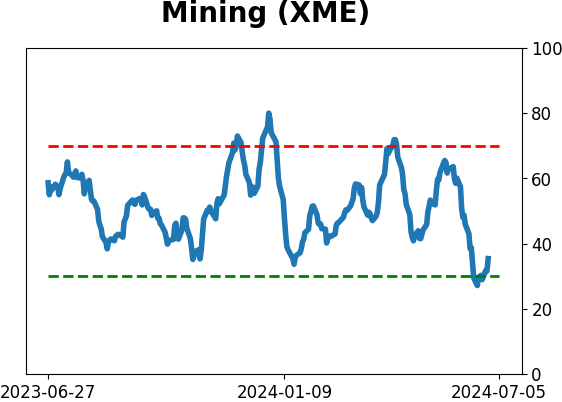
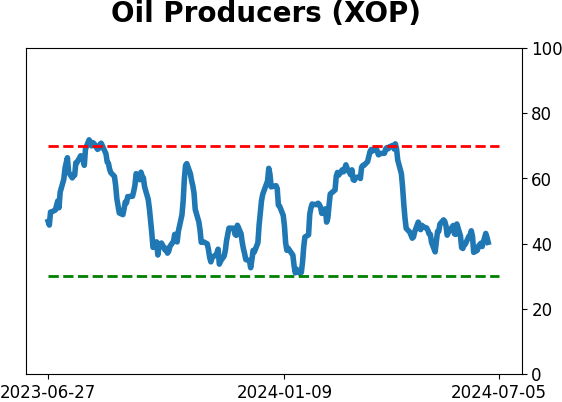
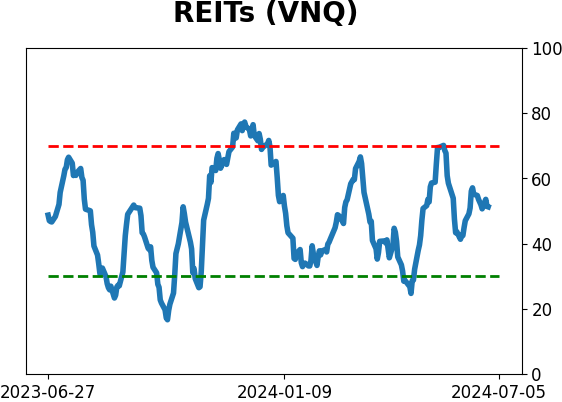
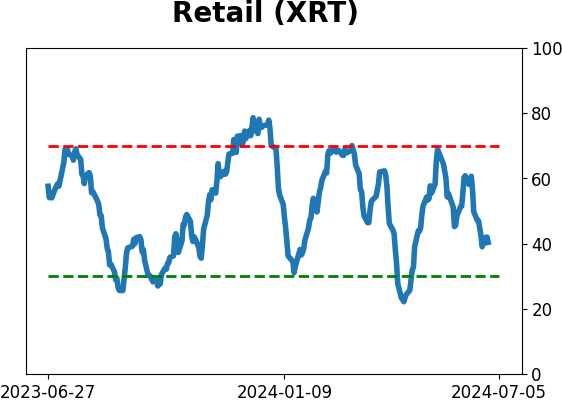
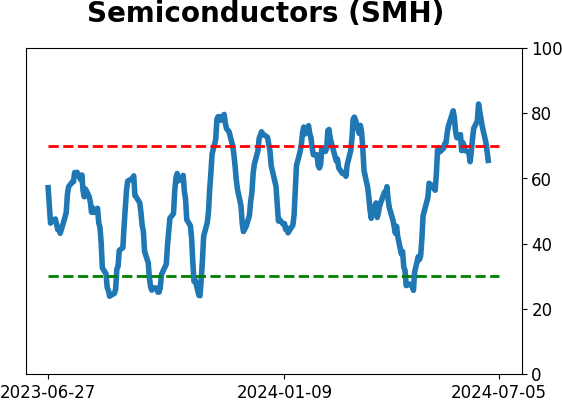
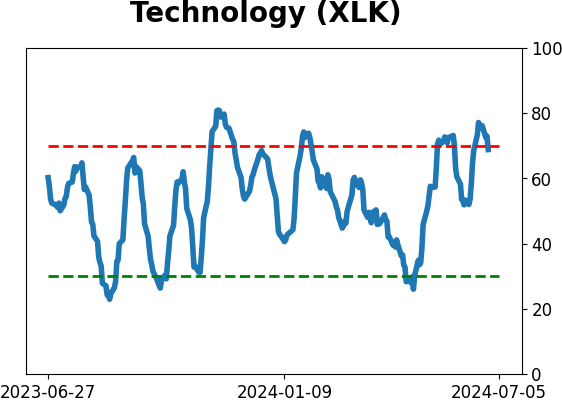
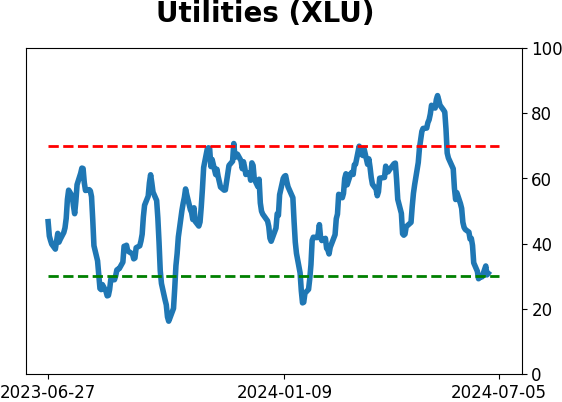
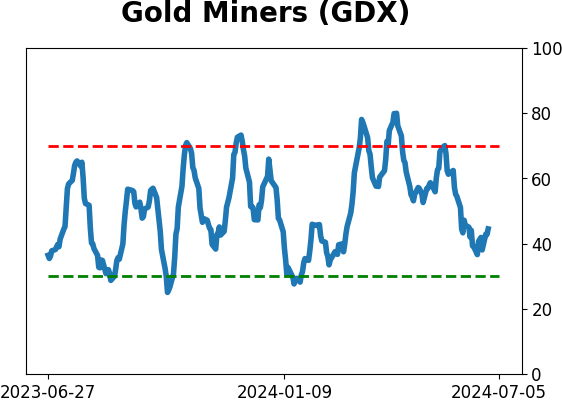
Sector ETF's - 10-Day Moving Average
|
|
|
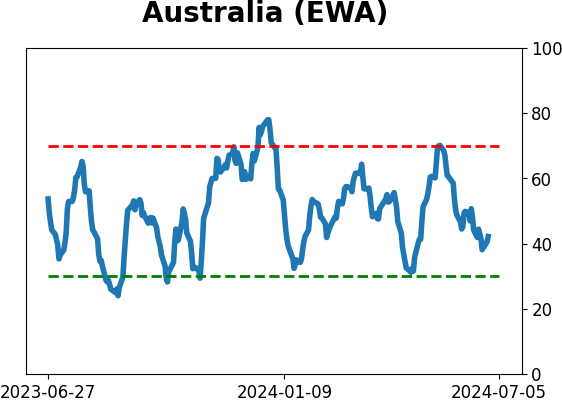
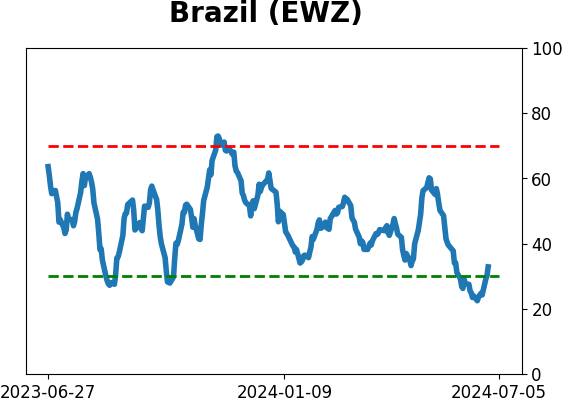
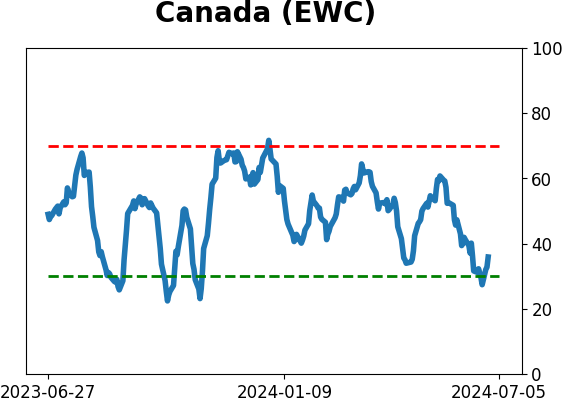
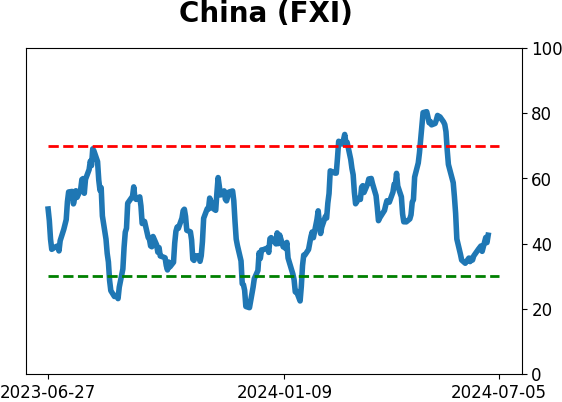
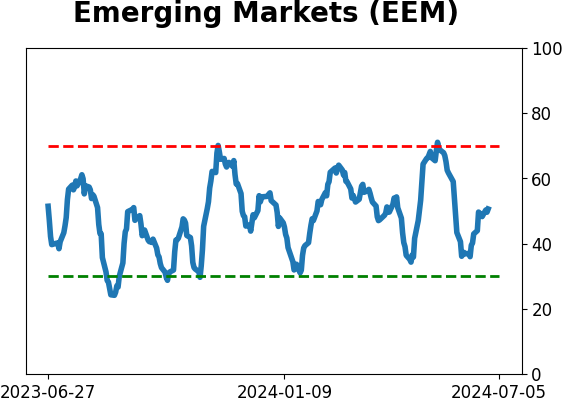
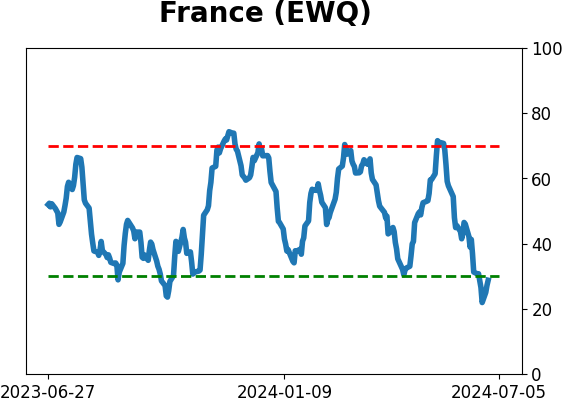
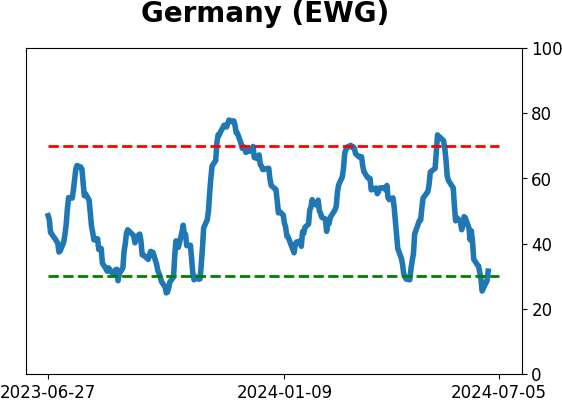
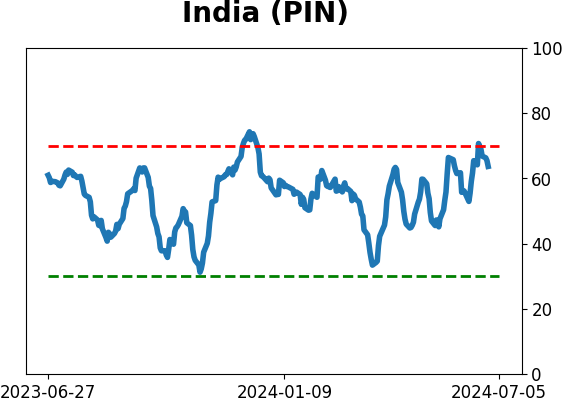
Country ETF's - 10-Day Moving Average
|
|
|
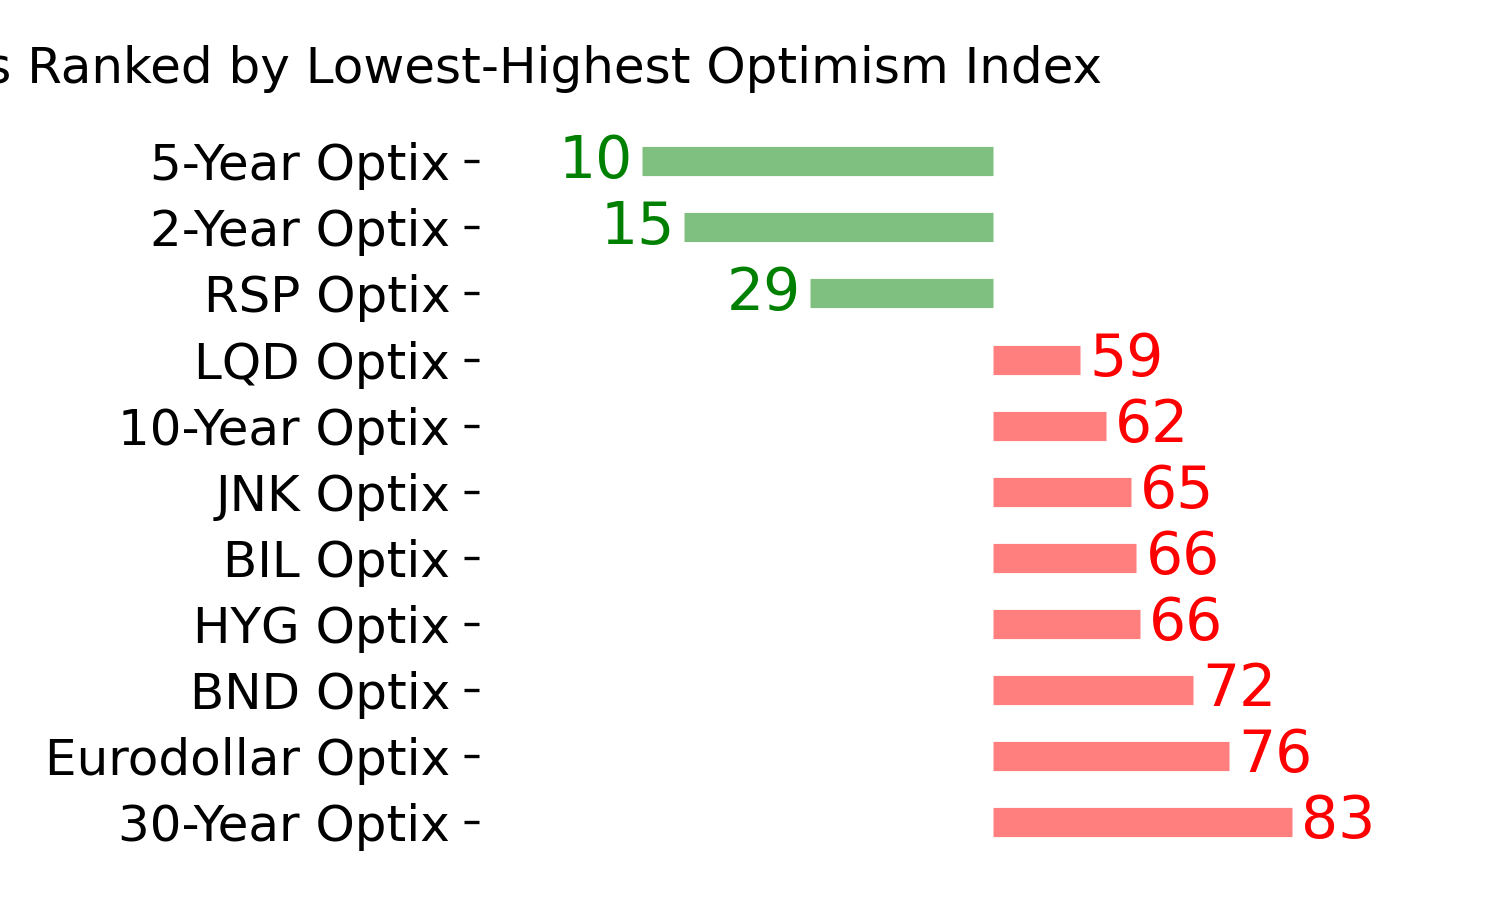
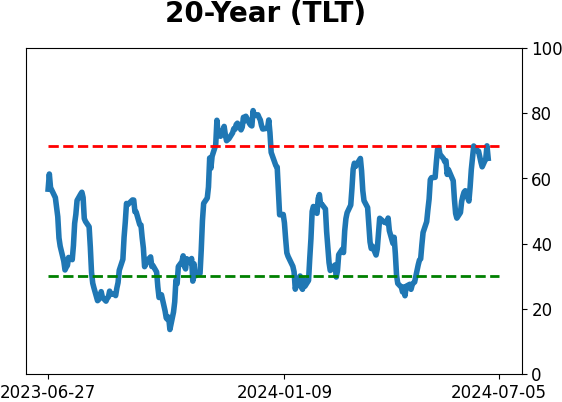
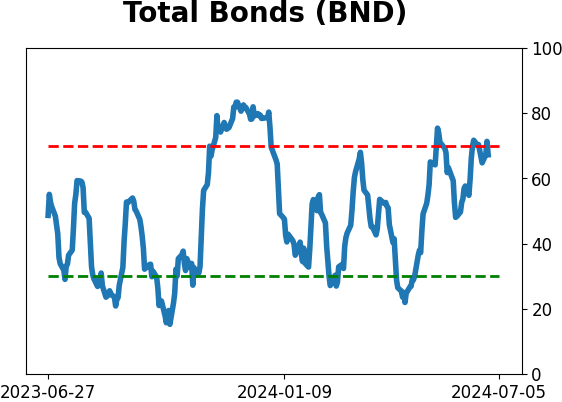
Bond ETF's - 10-Day Moving Average
|
|
|
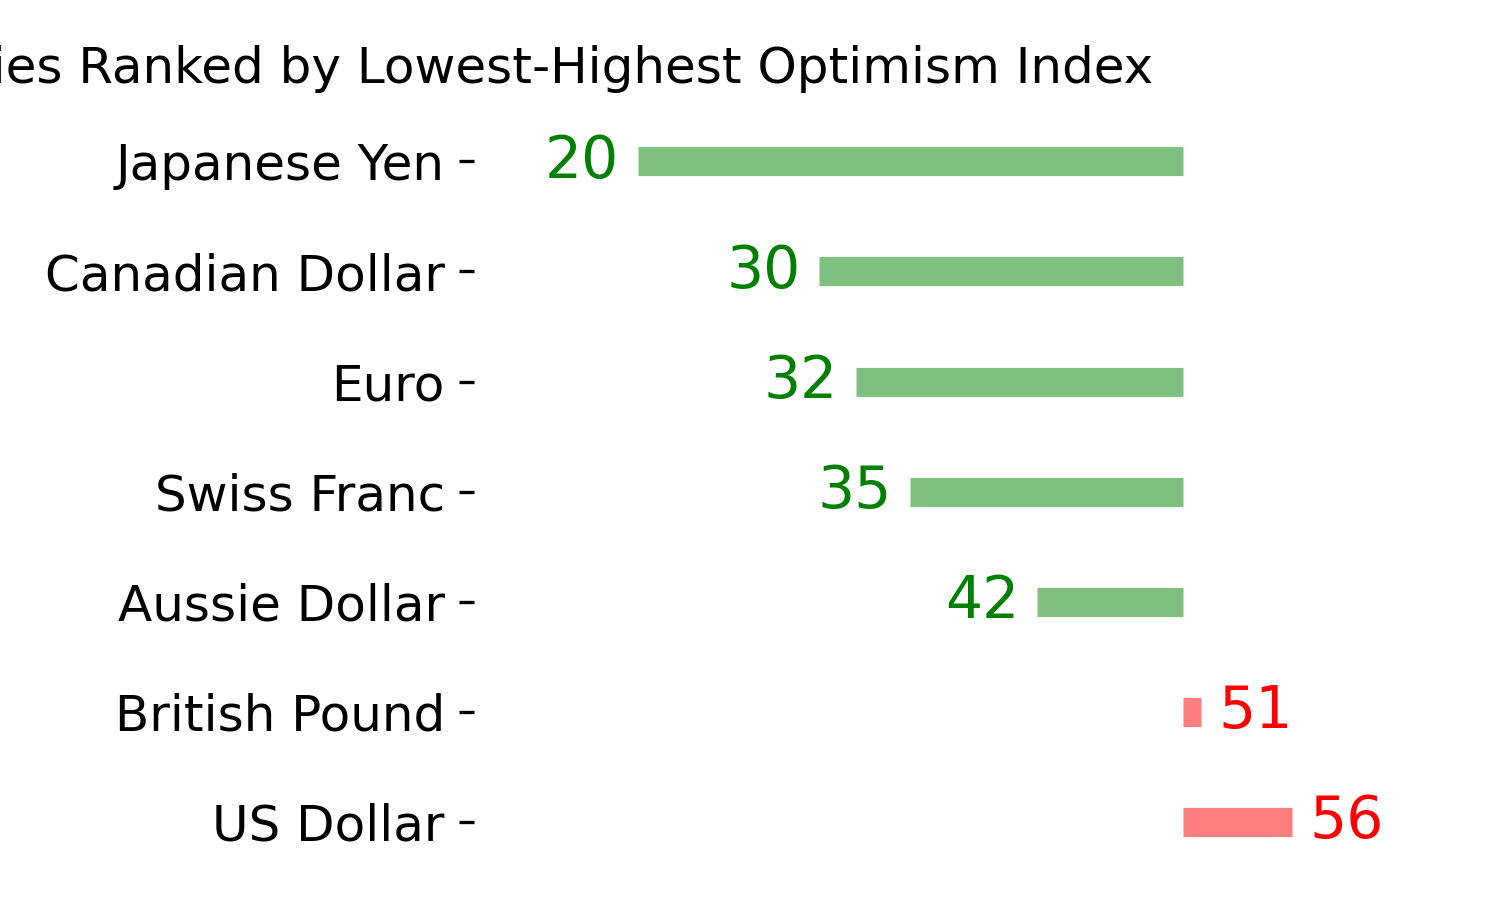
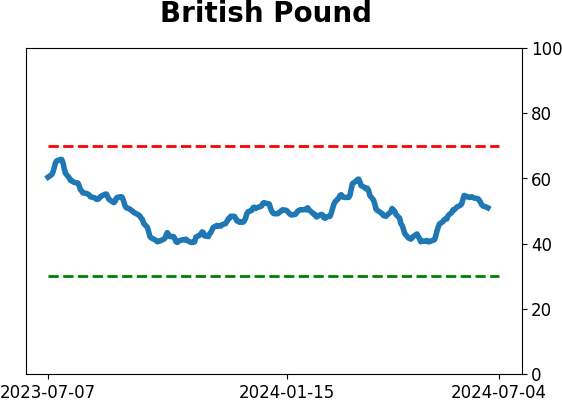
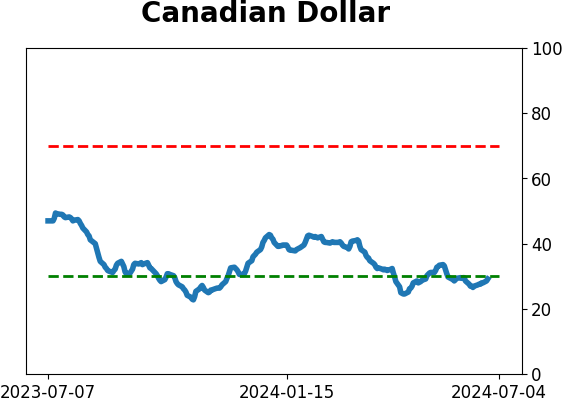
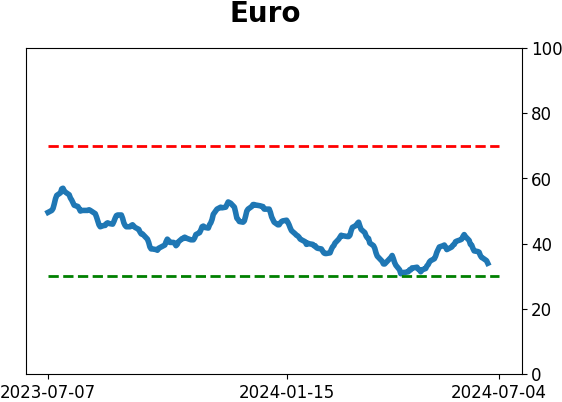
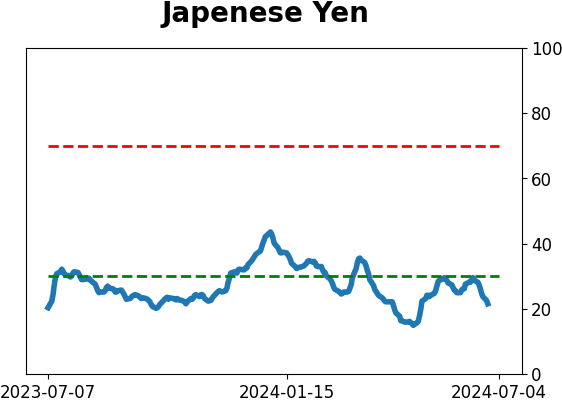
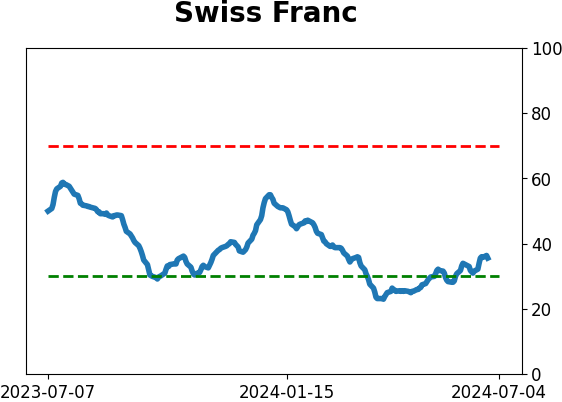
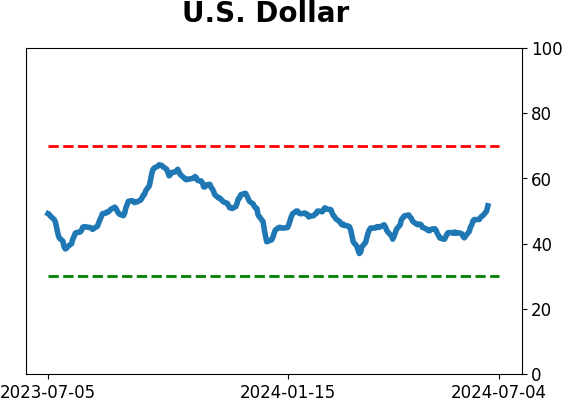
Currency ETF's - 5-Day Moving Average
|
|
|
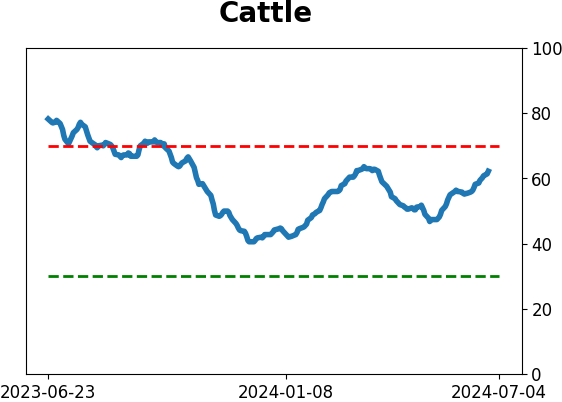
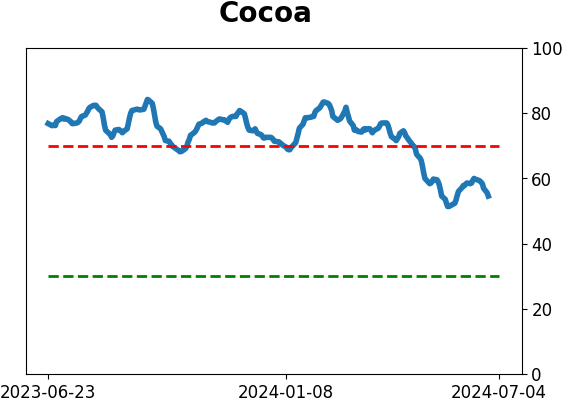
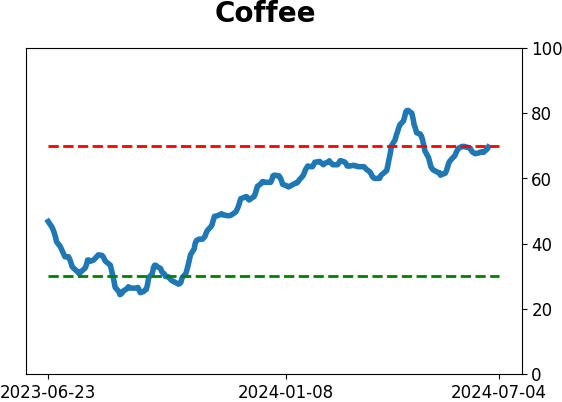
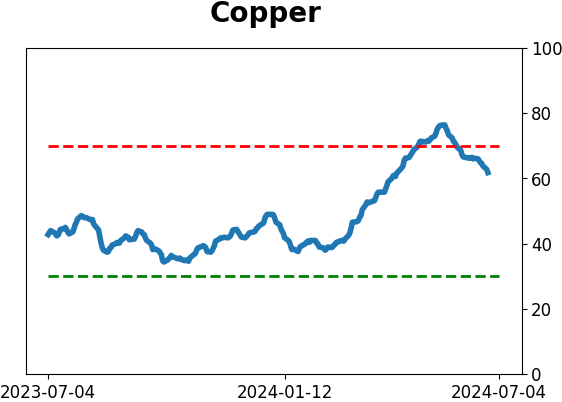
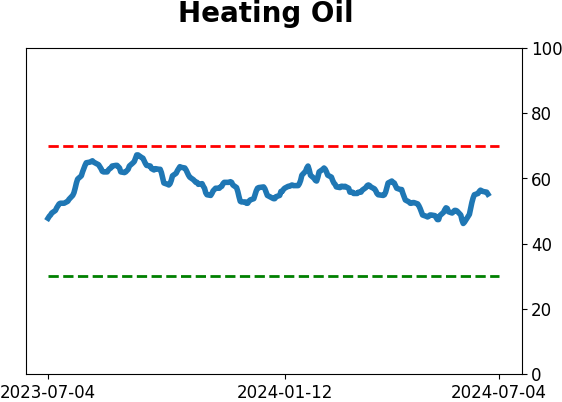
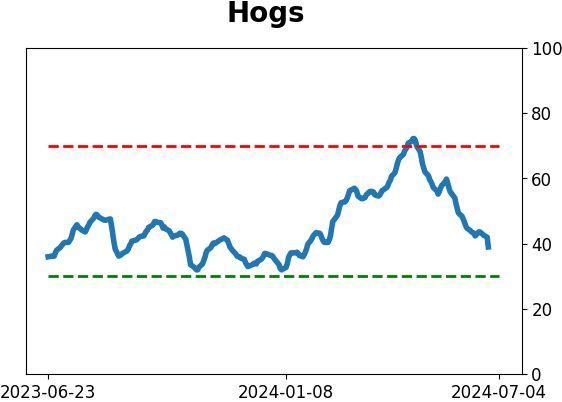
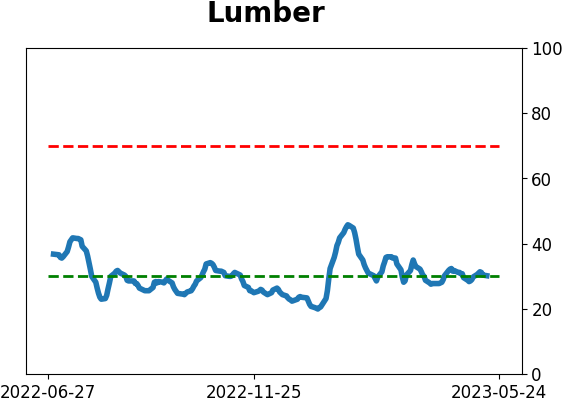
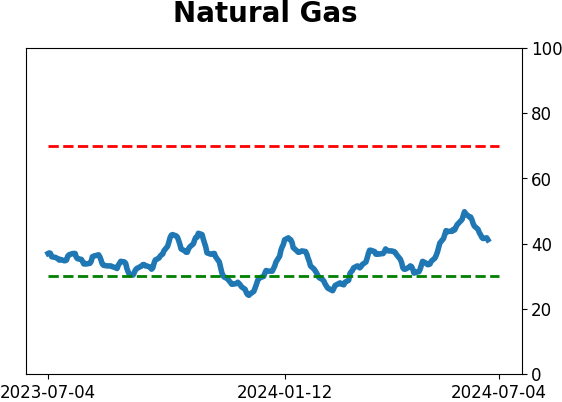
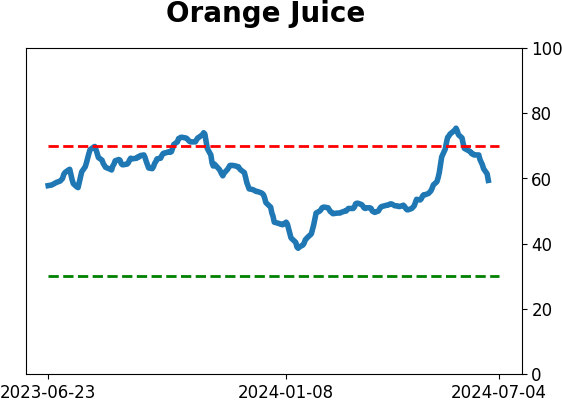
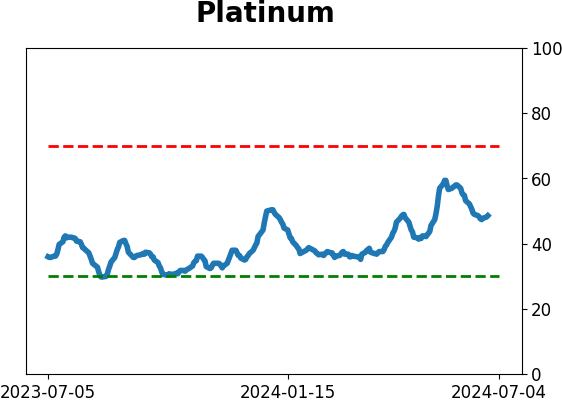
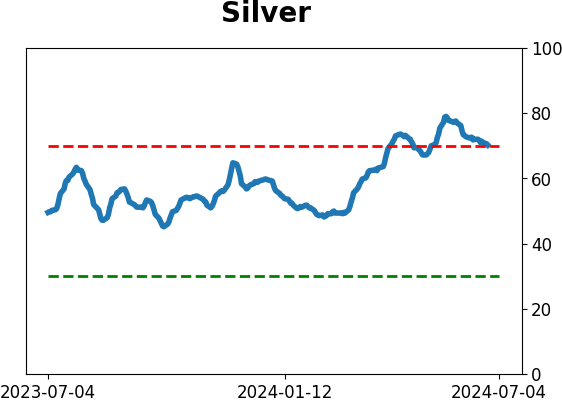
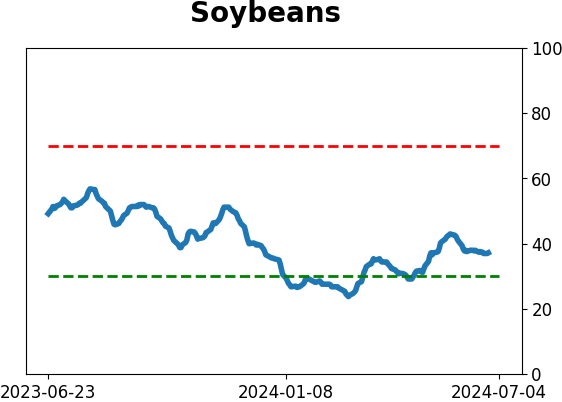
Commodity ETF's - 5-Day Moving Average
|
|