Headlines
|
|
Strategists stay put on price targets while others regain confidence:
Wall Street strategists haven't been too keen to upgrade their year-end price targets for the S&P 500, leading to one of the most "overvalued" readings in more than two decades. At the same time, other investors have become extremely confident. Similar behavior has tended to precede muted returns at best.
|
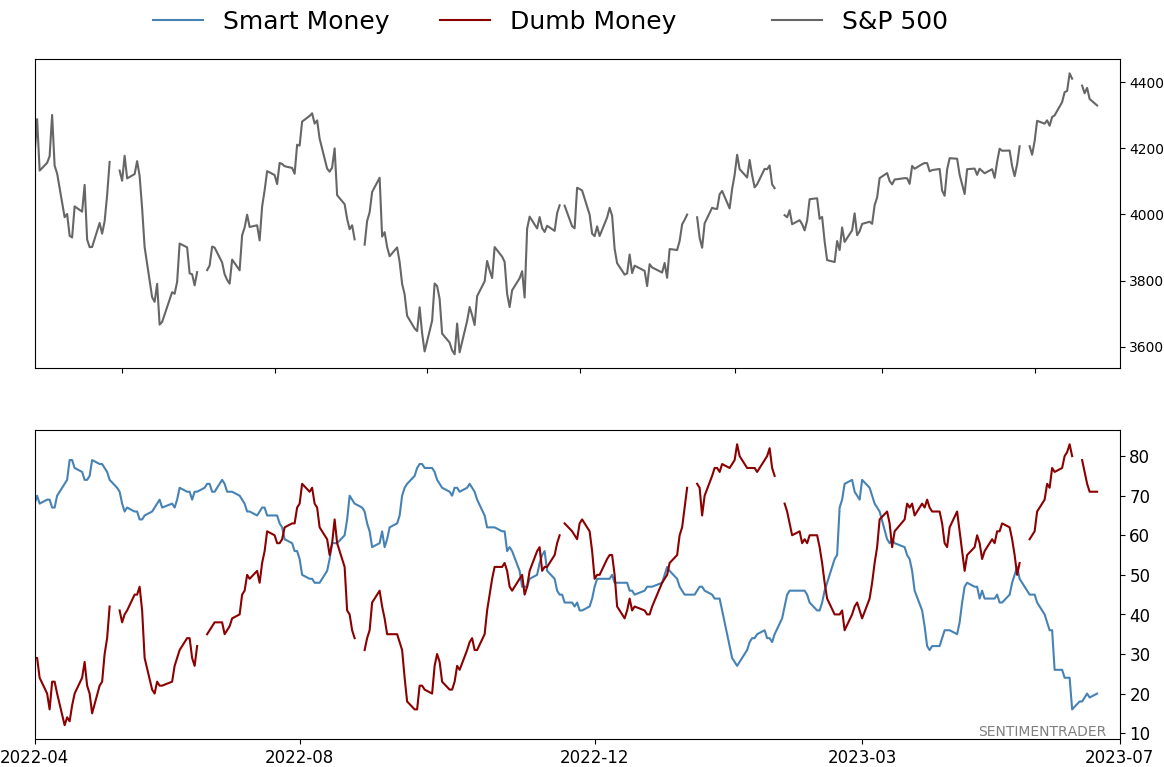
Smart / Dumb Money Confidence
|
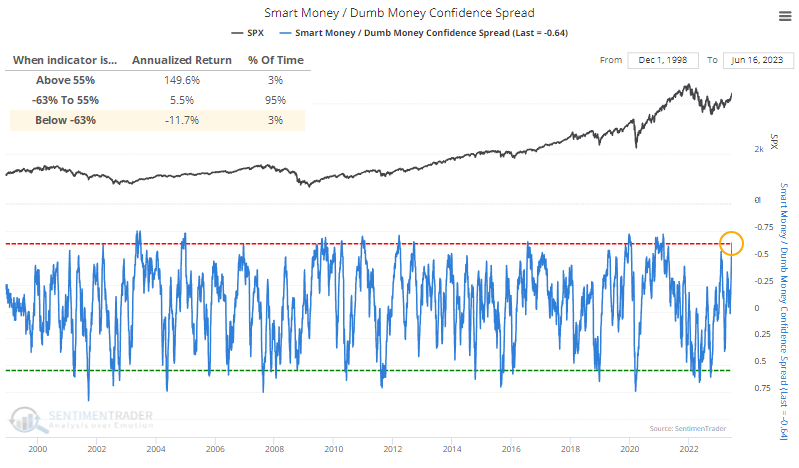
Smart Money Confidence: 20%
Dumb Money Confidence: 71%
|
|
Risk Levels
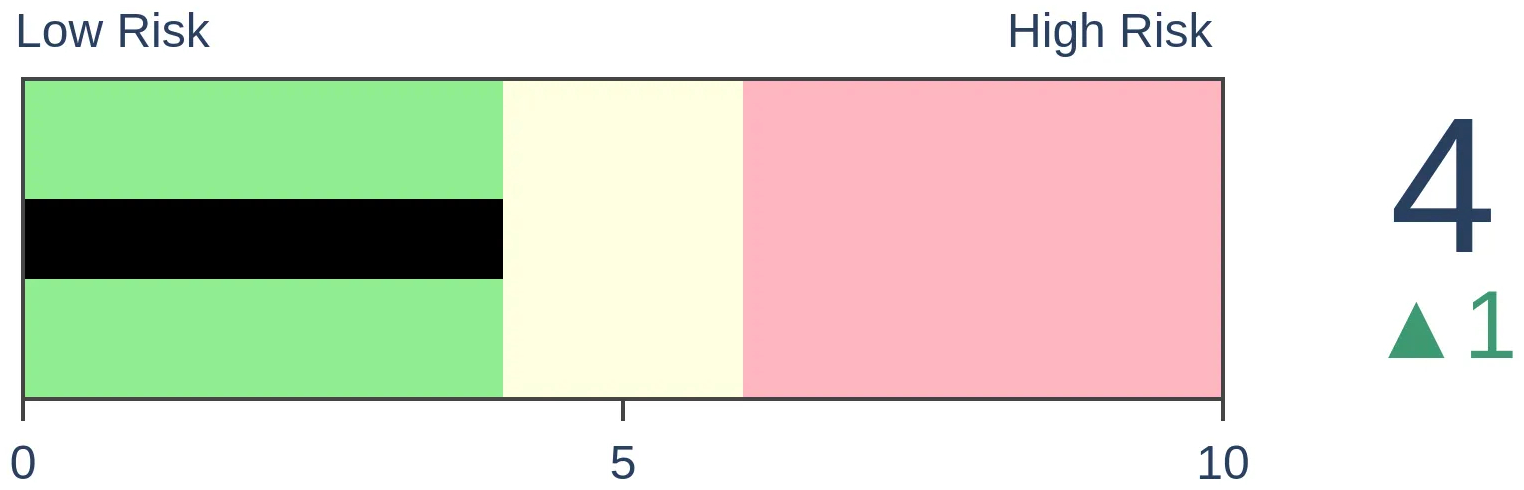
Stocks Short-Term
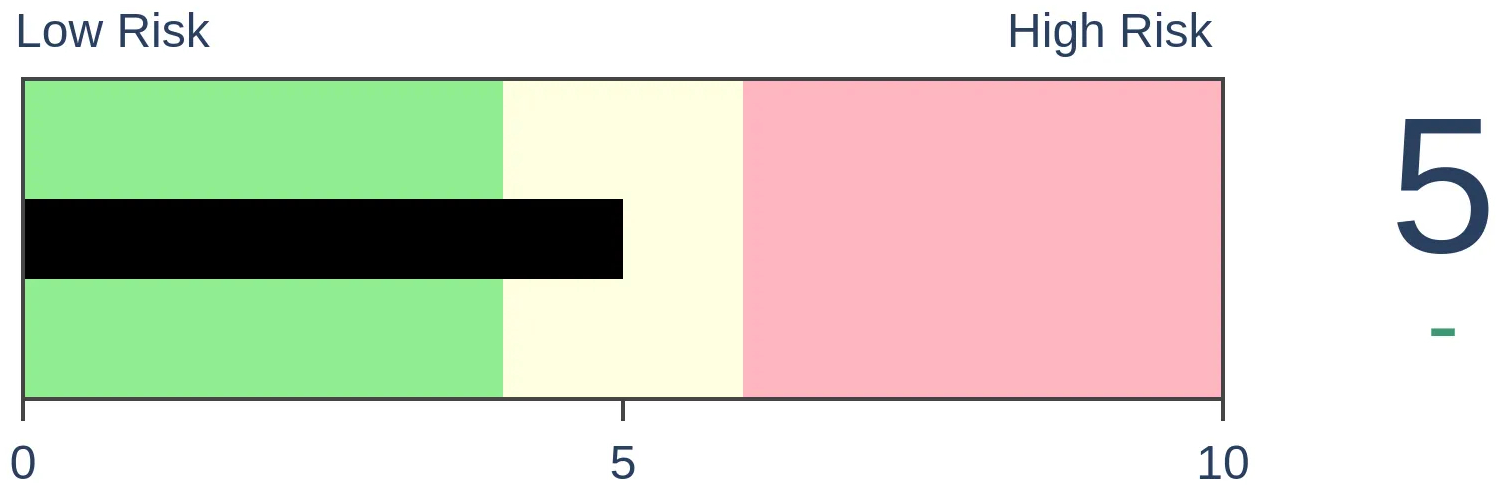
|
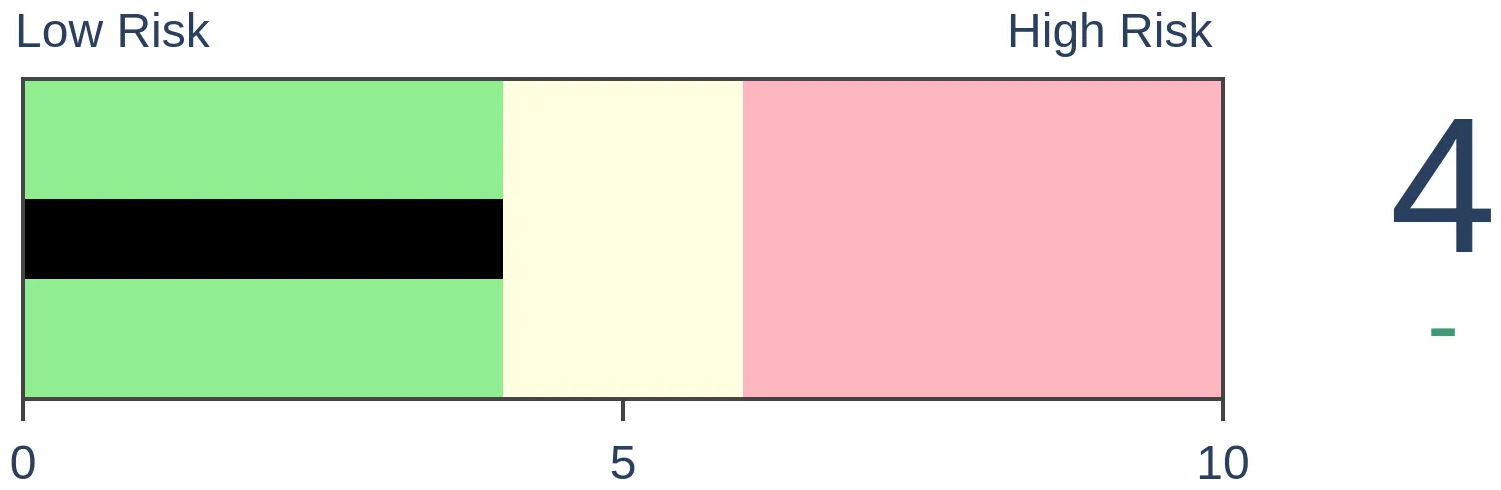
Stocks Medium-Term
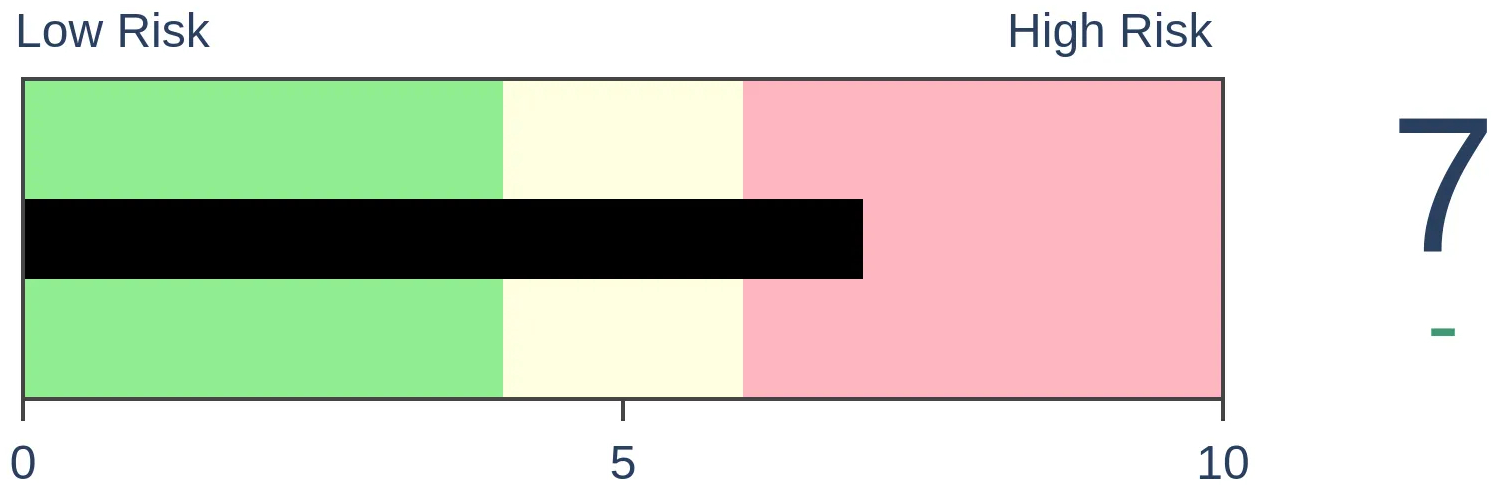
|
|
Bonds
|
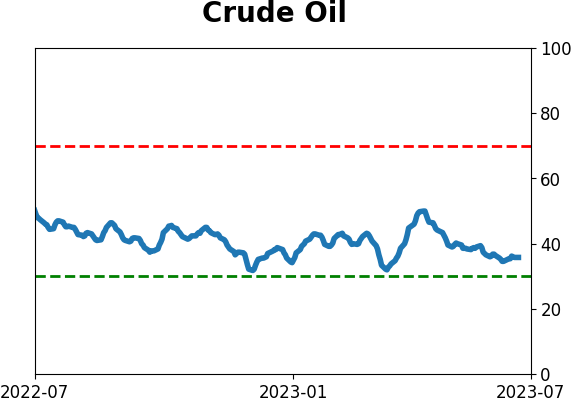
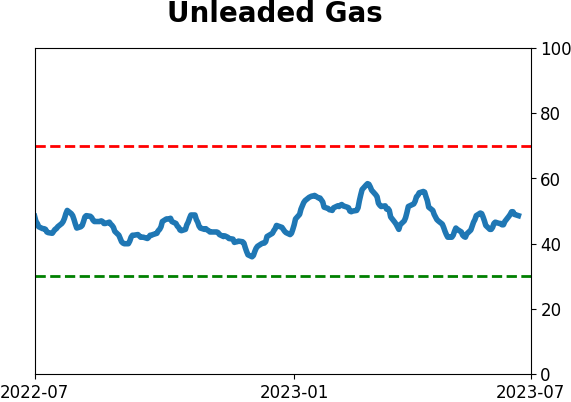
Crude Oil

|
|
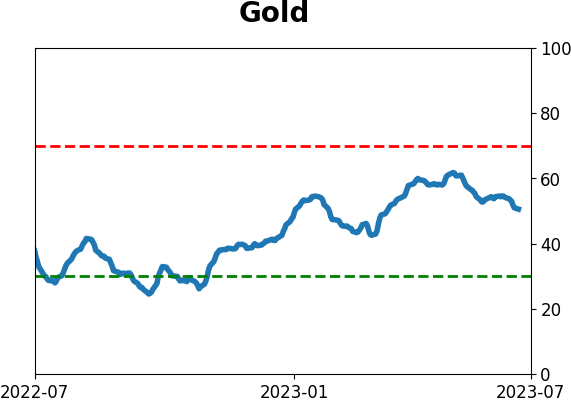
Gold

|
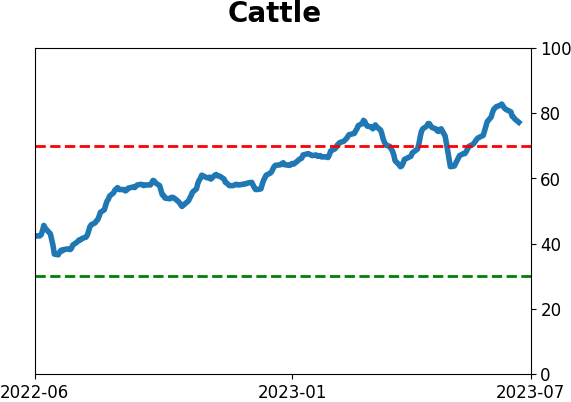
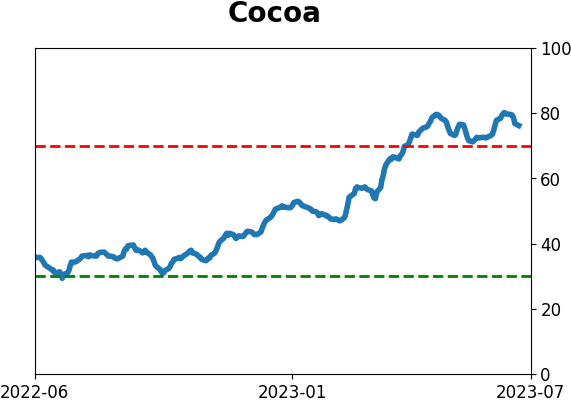
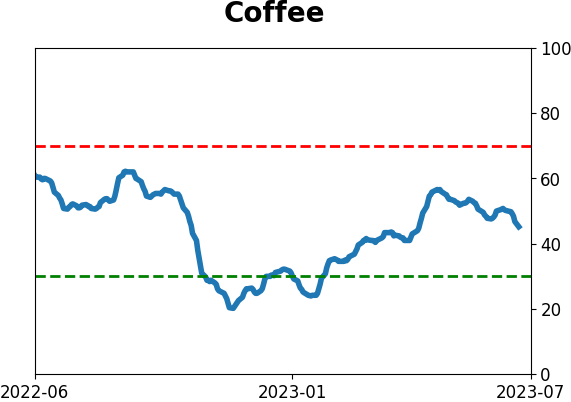
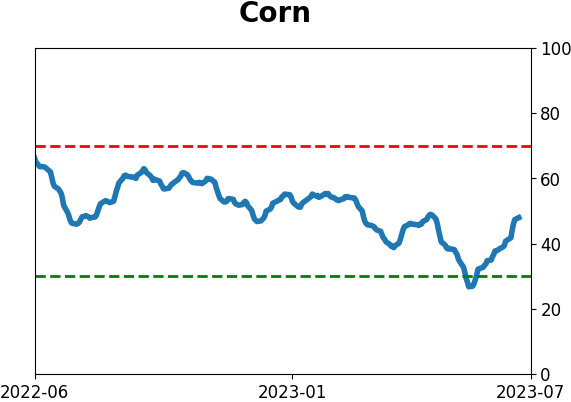
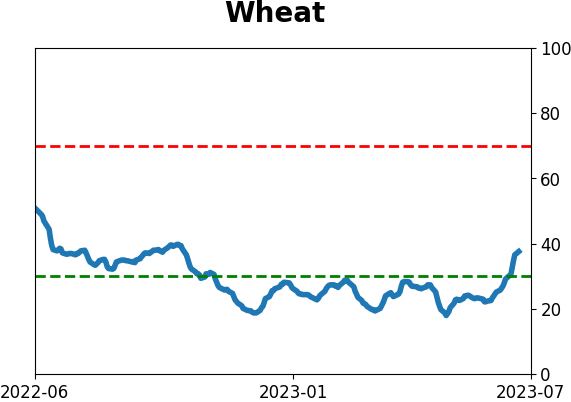
Agriculture
|
|
Research
By Jason Goepfert
BOTTOM LINE
Wall Street strategists haven't been too keen to upgrade their year-end price targets for the S&P 500, leading to one of the most "overvalued" readings in more than two decades. At the same time, other investors have become extremely confident. Similar behavior has tended to precede muted returns at best.
FORECAST / TIMEFRAME
None
|
Key points:
- The S&P 500 has roared ahead of Wall Street strategists' year-end price targets
- Other investors have been much more optimistic, pushing models to extreme levels
- Similar behavior tended to precede muted forward returns for stocks
Strategists haven't been hiking up their price targets
Stocks have been going gangbusters, but at least some folks aren't eager to hop on board. Like Wall Street strategists.
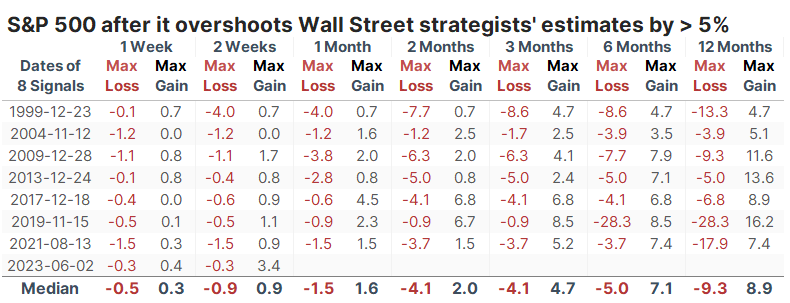
Despite what has been a runaway market, strategists haven't been upgrading their year-end price targets much at all for the S&P 500. As a result, the index is more than 8% higher than what strategists, on average, guessed it would be six months from now. That's the 2nd-largest overshoot in 24 years.
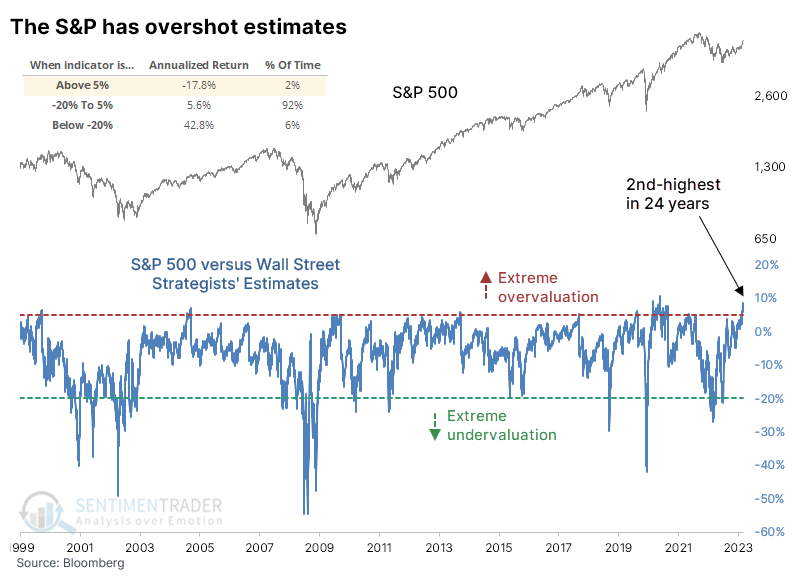
The S&P has tended to show poor annualized returns after the small number of days when it gets so far ahead of the strategists. The table below shows how it has offered weak returns in the short term following a 5% overshoot. It did so this time around early in June and shows the best two-week return out of all the signals. This is also the earliest in any year - by a lot - that the S&P overshot strategists by so much.
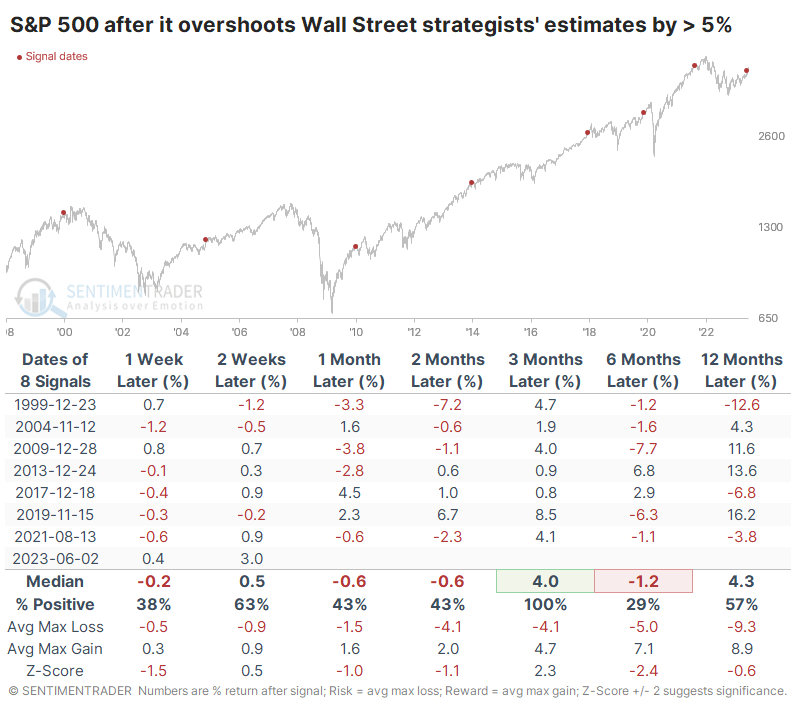
Even though the S&P sported a positive six-month return every time, the time frames surrounding that were weak. The back-and-forth in price can also be seen in the table of maximum gains and losses across time frames. Over the next six months, there was only a single double-digit return either way.
Strategists seem to be some of the few who aren't buying into the rally's longevity. The strategy of buying calls to open has exploded among large and small traders alike, though put buying is still elevated, so the ROBO and LOBO put/call ratios aren't at true extremes just yet.
The spread between Smart and Dumb Money Confidence reached rarified air last week before reversing a bit with a few minor down days. When the spread reached the type of level it recently hit, the S&P's annualized return was relatively poor.
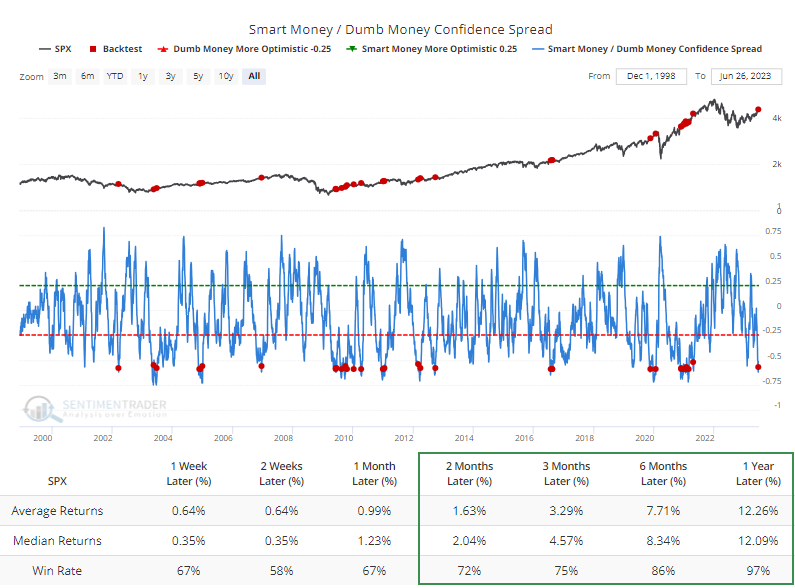
But here's the thing about sentiment - it doesn't tend to get this stretched during ongoing bear markets. The Backtest Engine shows that when the spread reverses from such a wide extreme, it occurred only once during a protracted bear, in 2002. All the others were triggered during bull cycles when investors are more willing to take risks and keep doing so.
What the research tells us...
Even though there are pockets of skepticism like Wall Street strategists, sentiment models indicate that most investors appear to be enamored with the idea of a new bull market. They have good reasons for it, too, based on a plethora of technical developments we've outlined since October. But when stocks get as far ahead of strategists' year-end estimates as they have now, and when investors believe so strongly in a rally, as they do now, then returns tend to be muted for a while. It doesn't necessarily mean another failed bear market rally - sentiment rarely gets this stretched during bear markets - but it likely means gains have been pulled ahead.
Indicators at Extremes
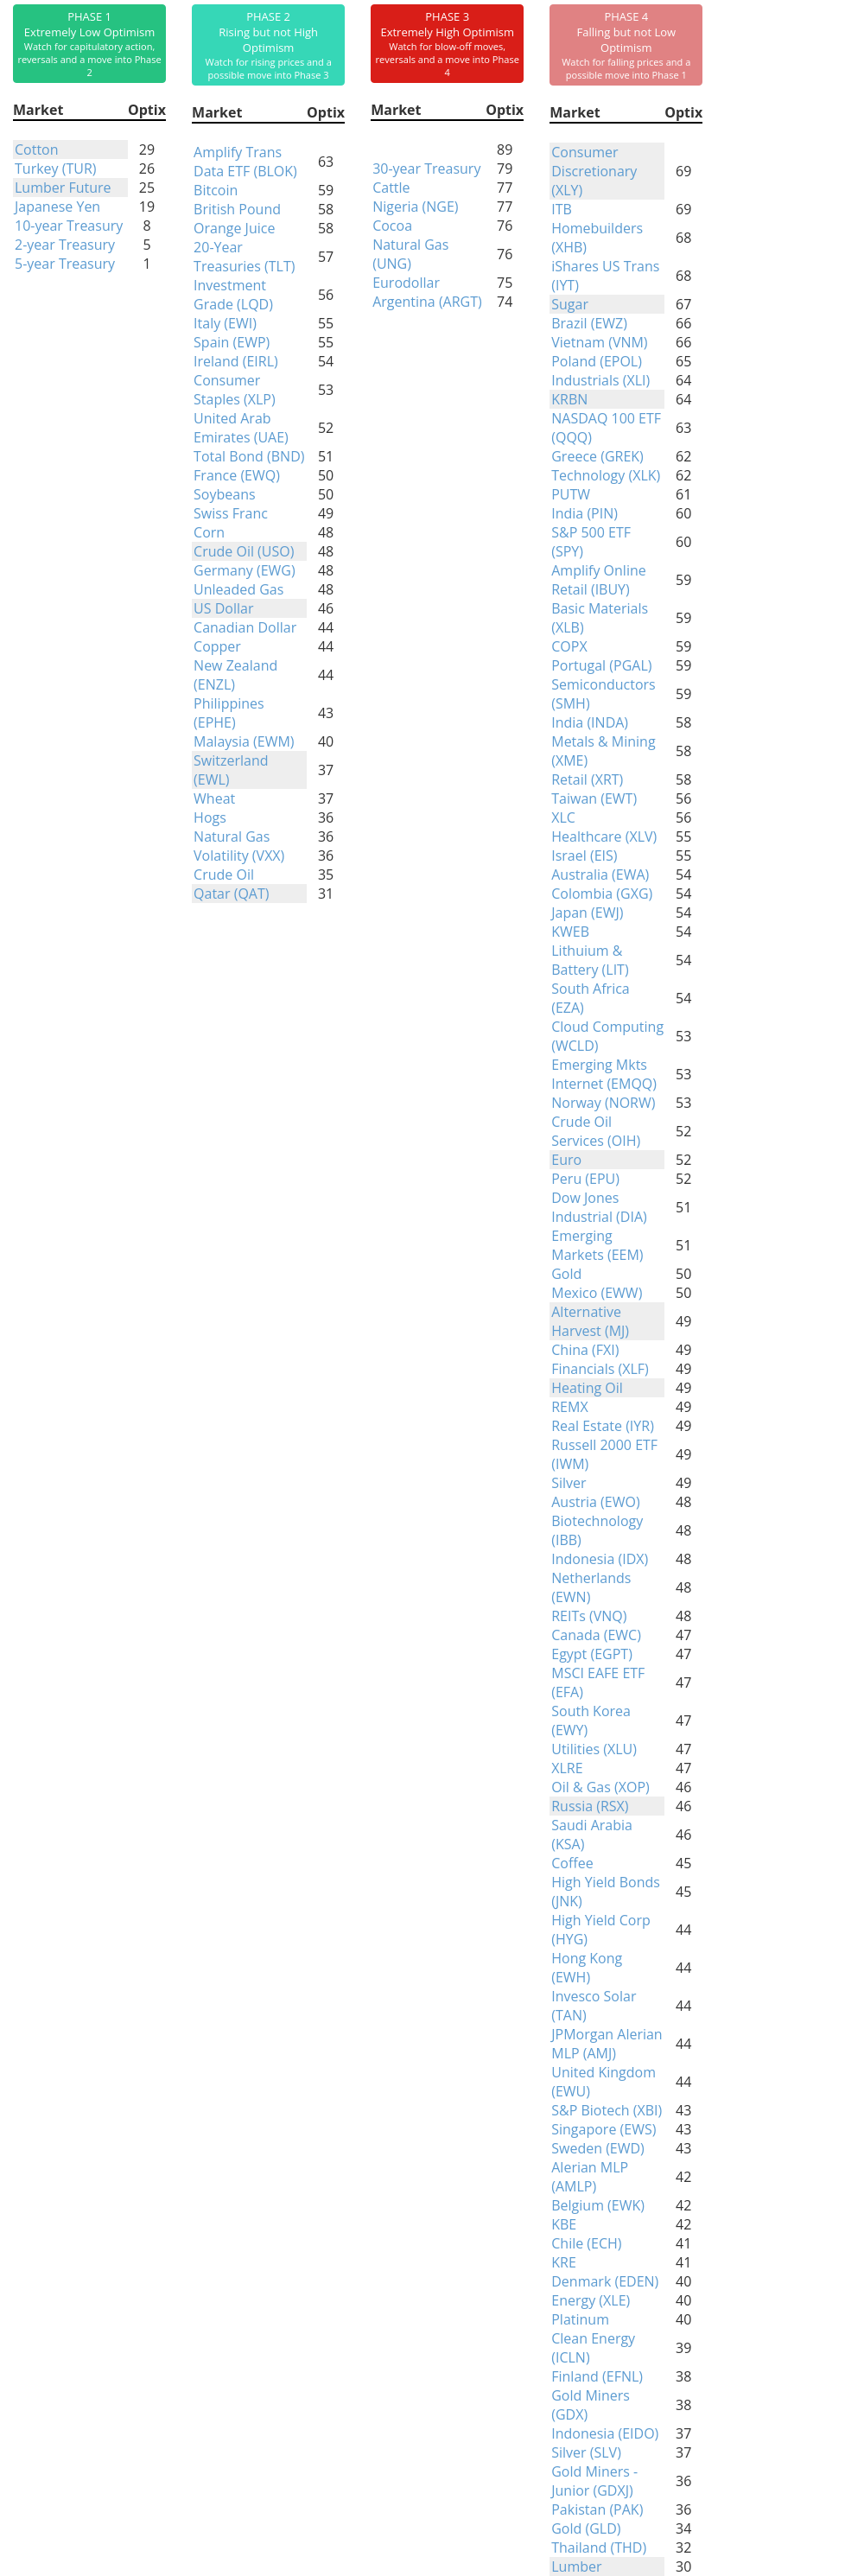
Phase Table
Ranks
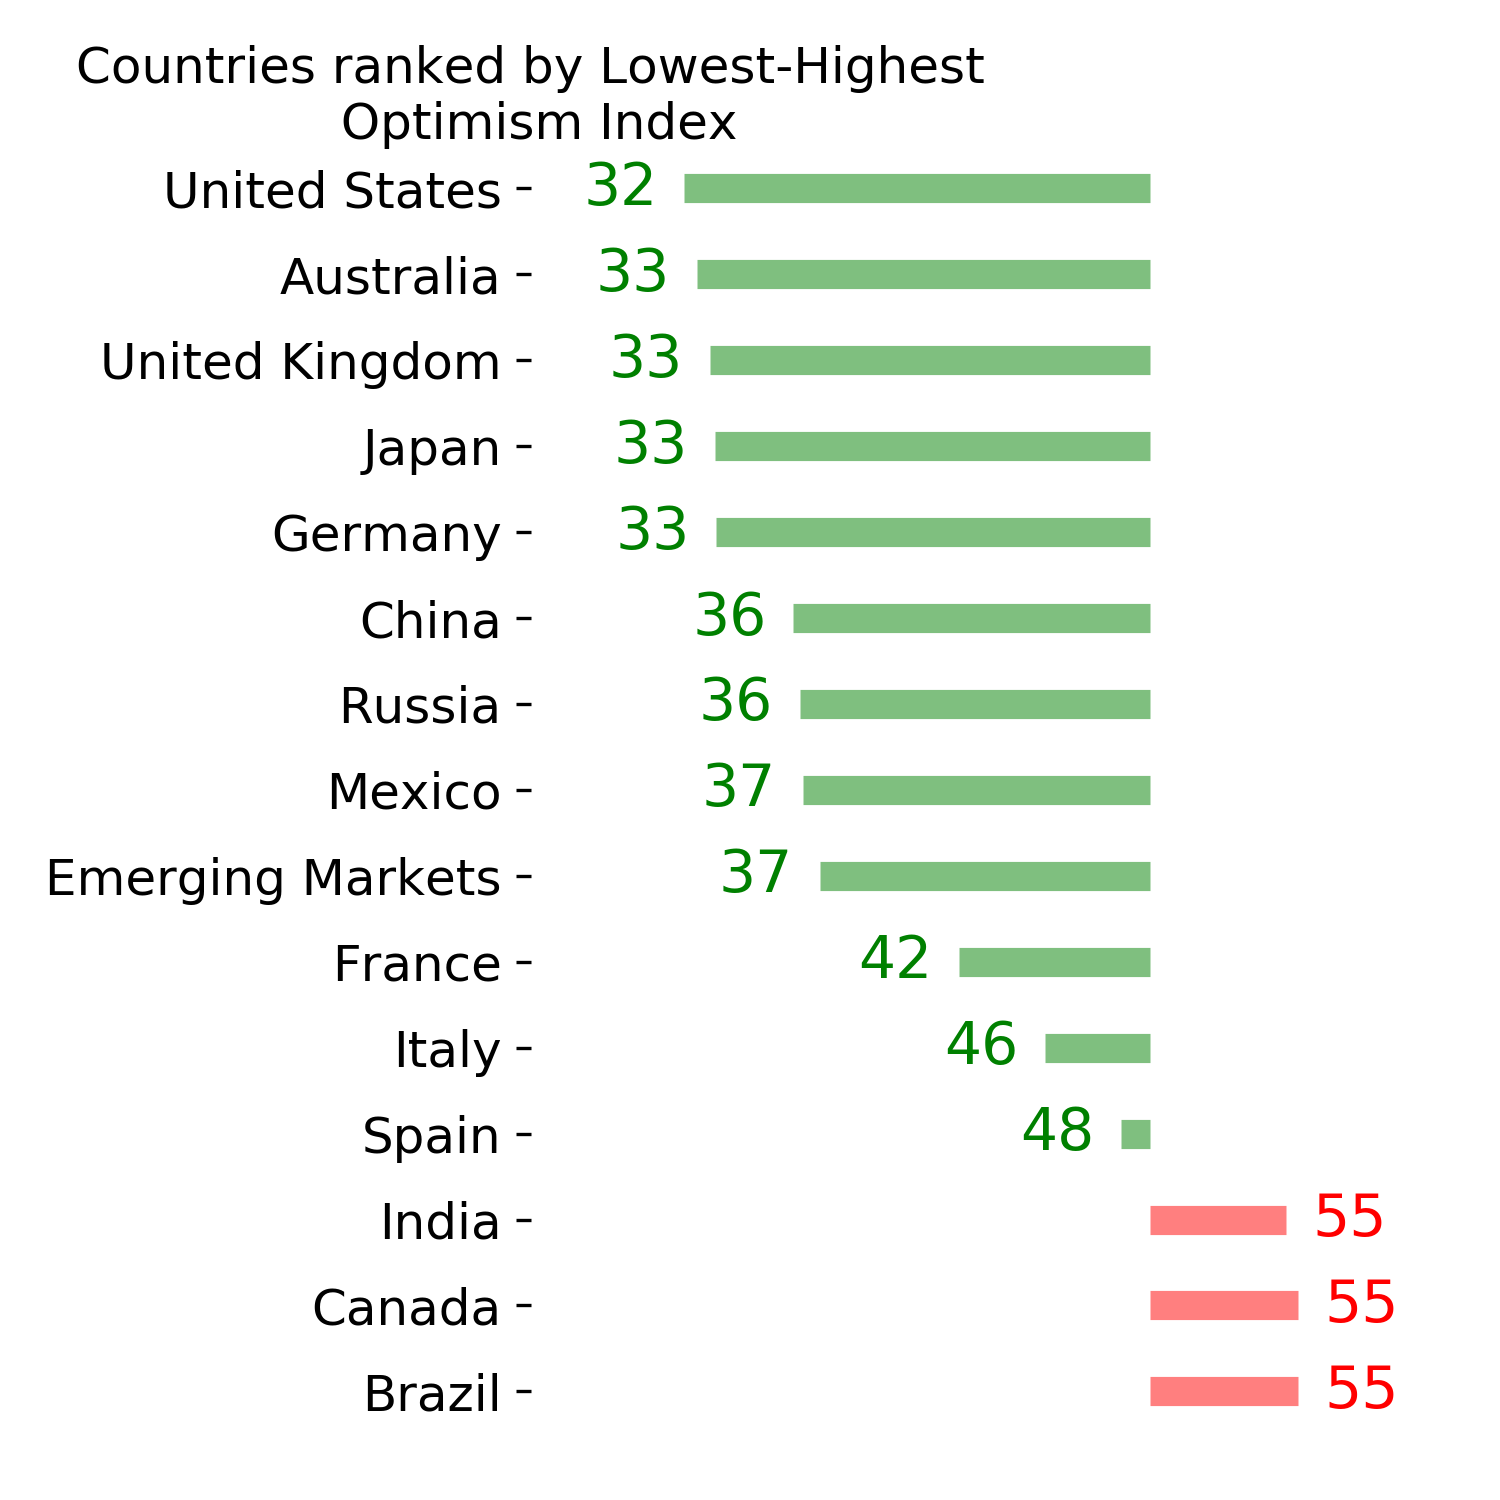
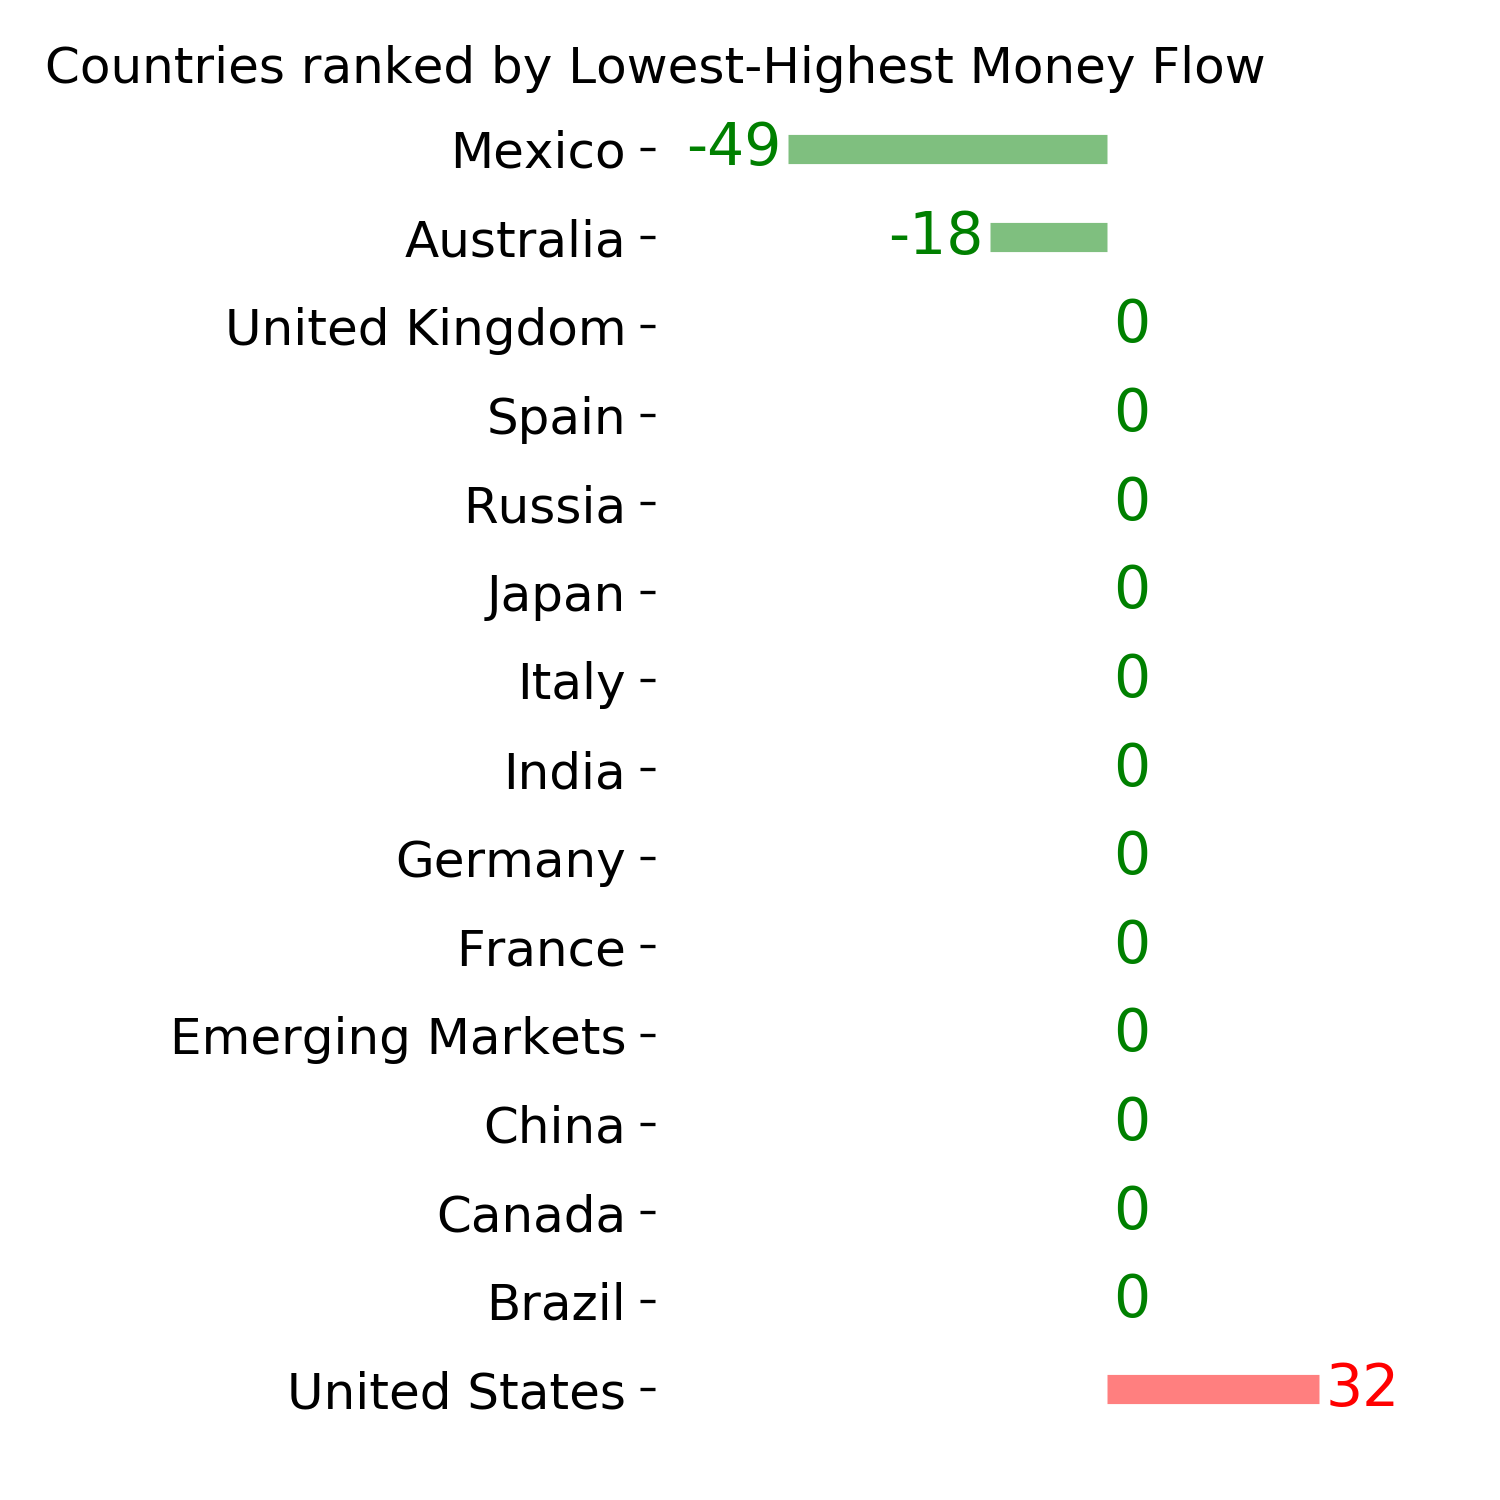
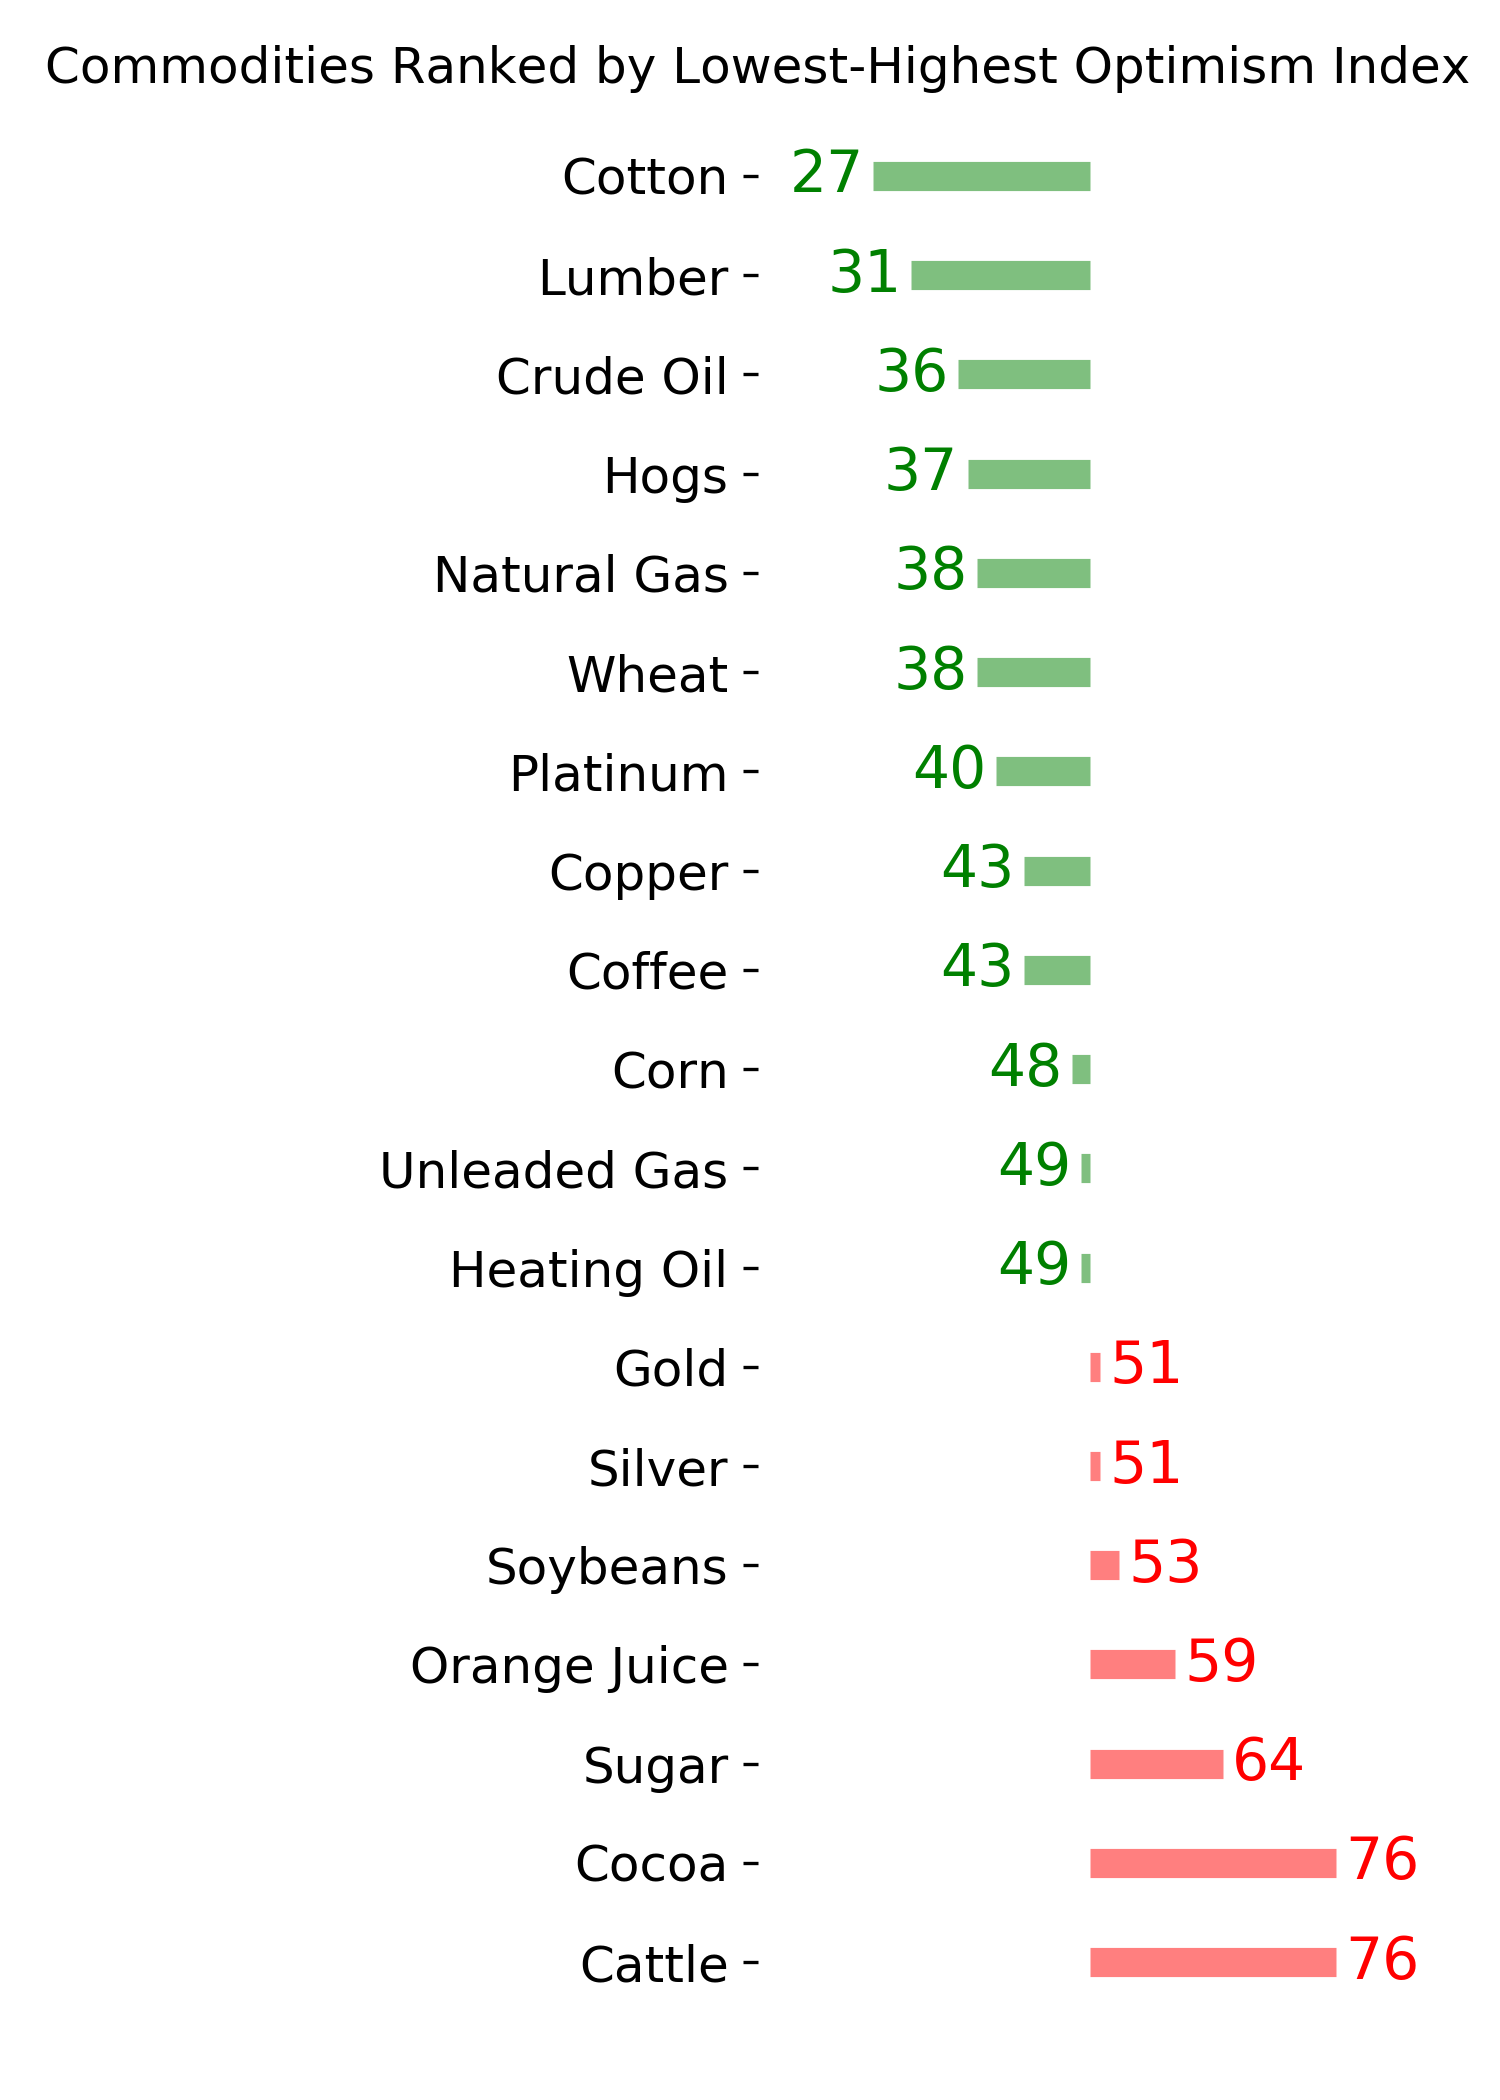
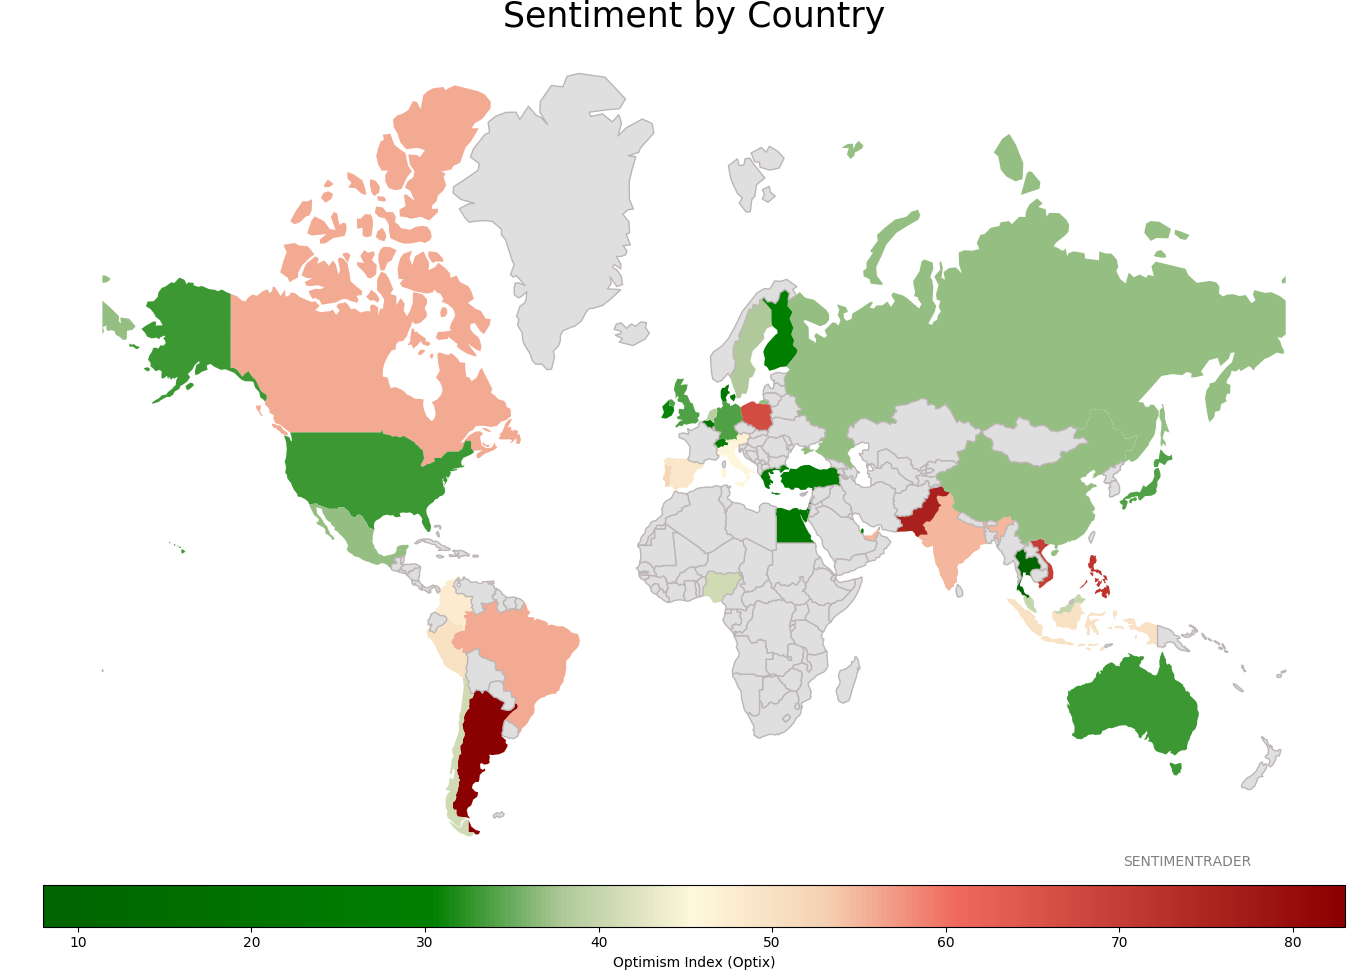
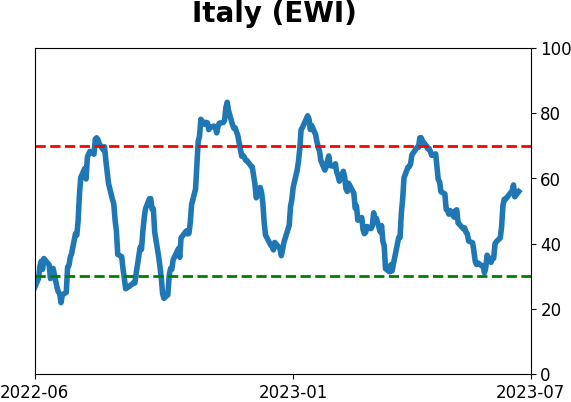
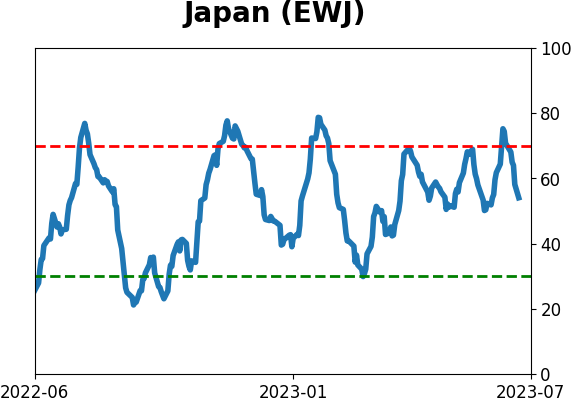
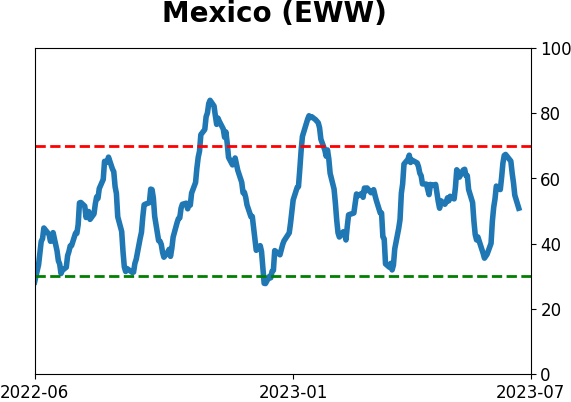
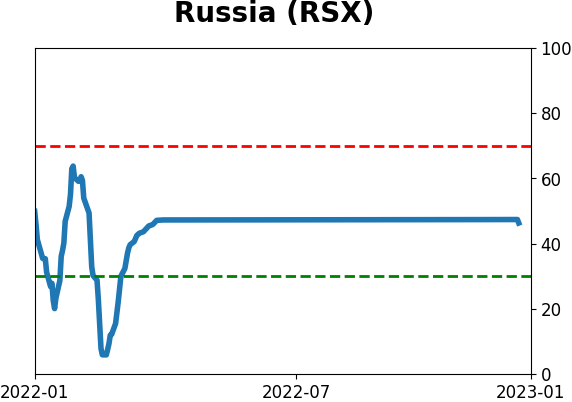
Sentiment Around The World
Optimism Index Thumbnails
|
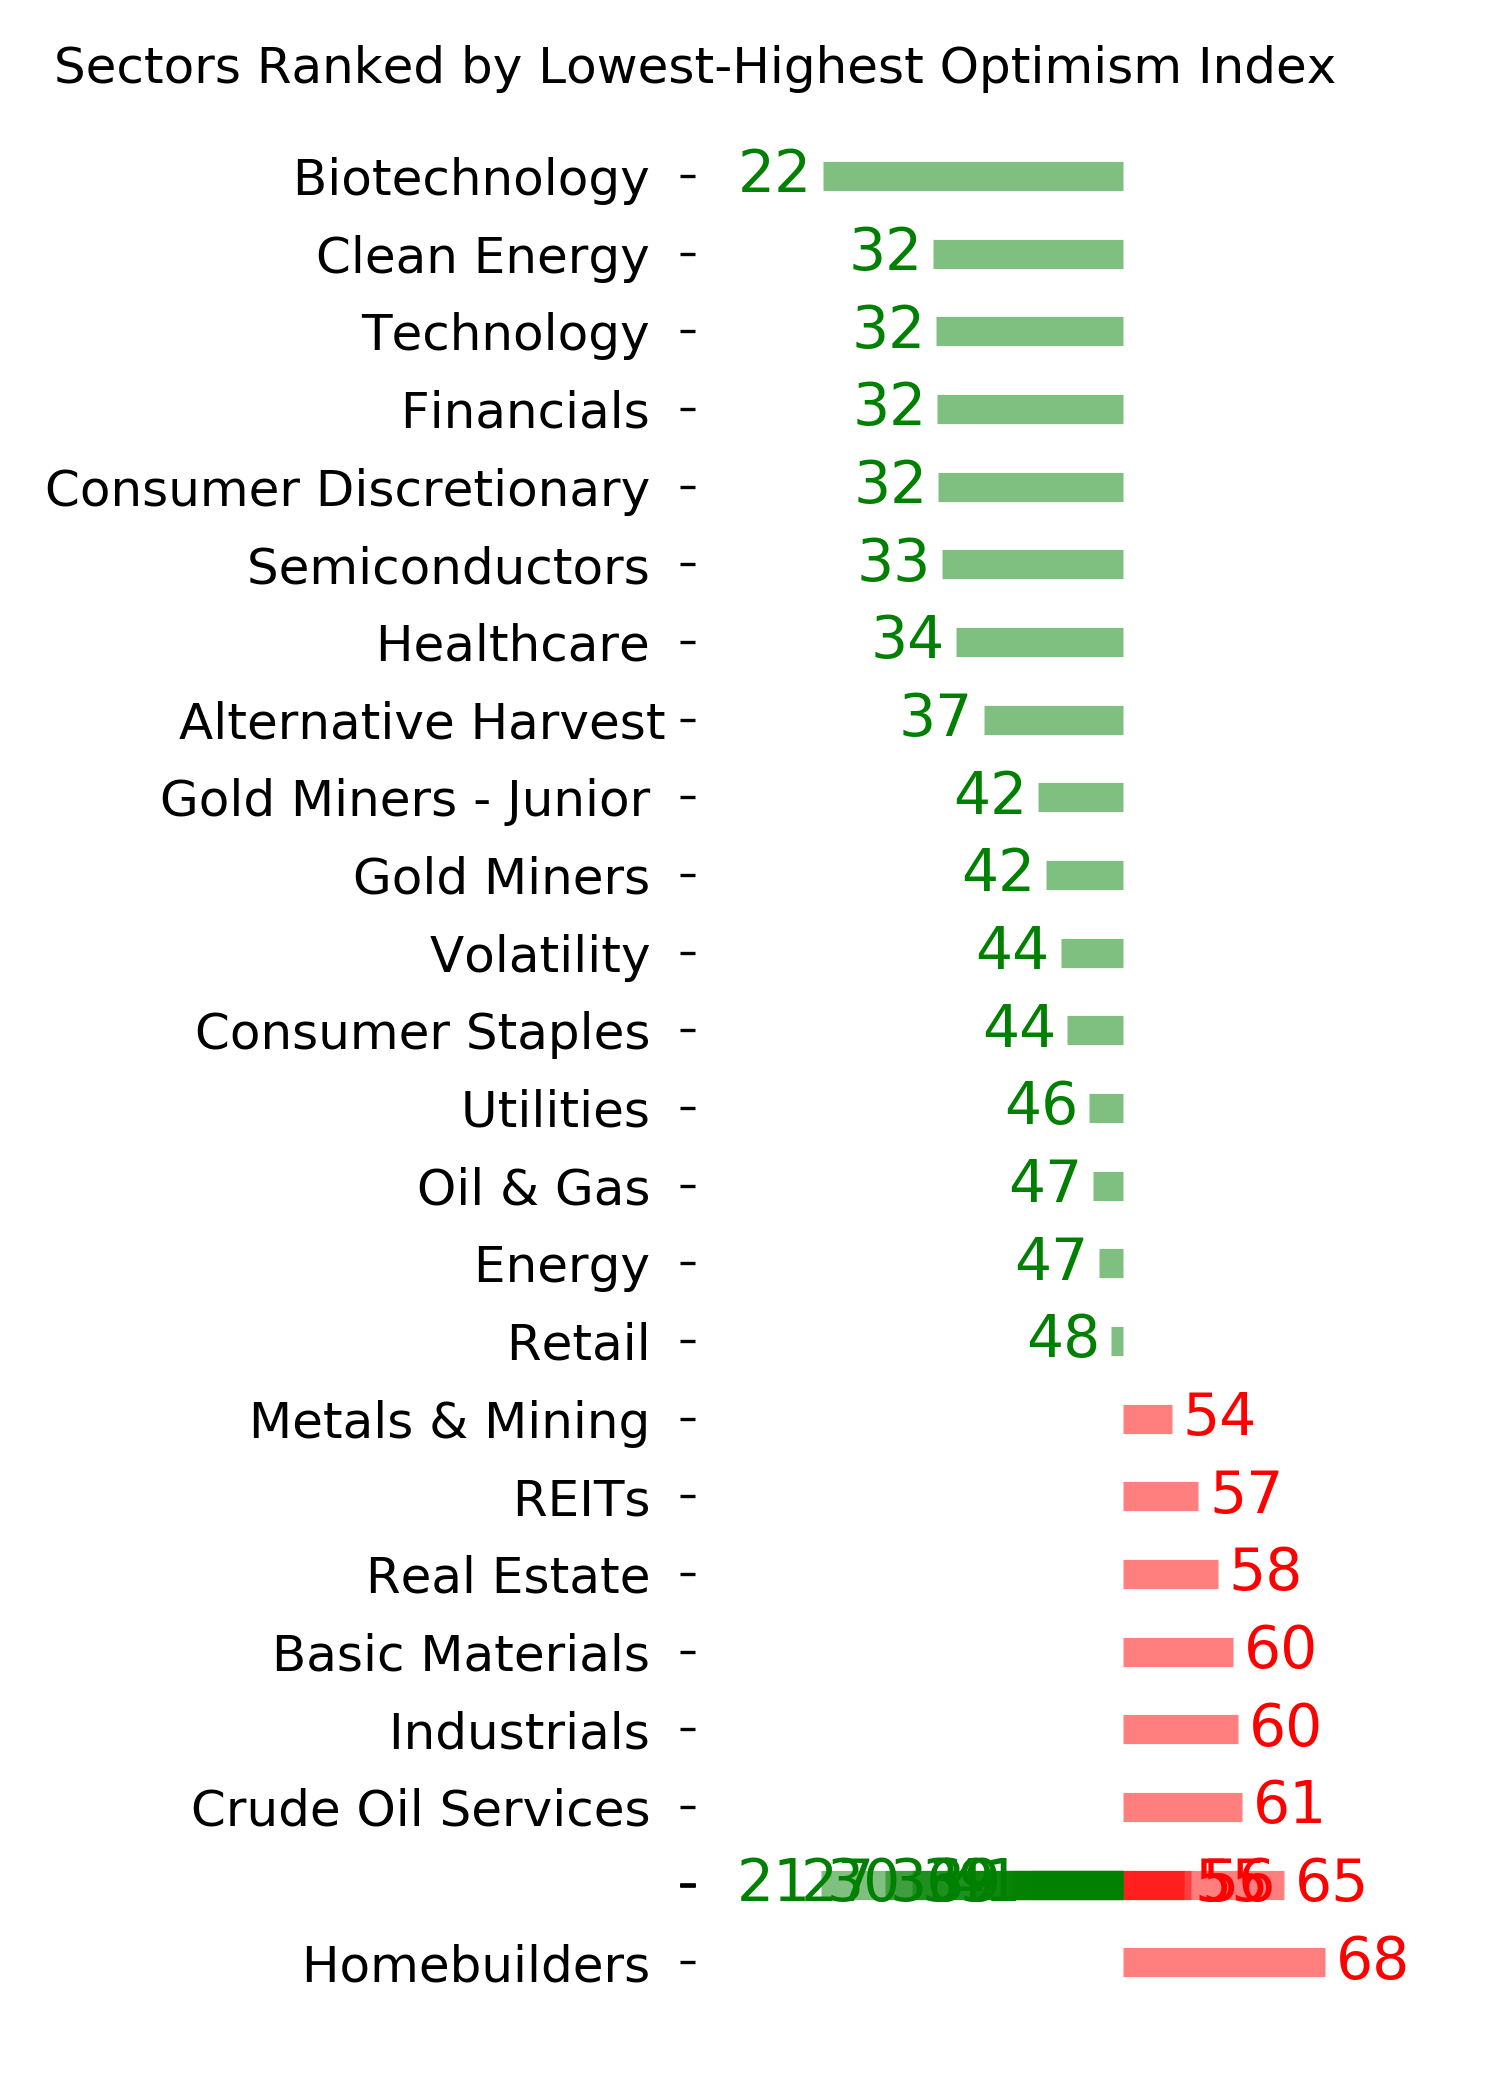
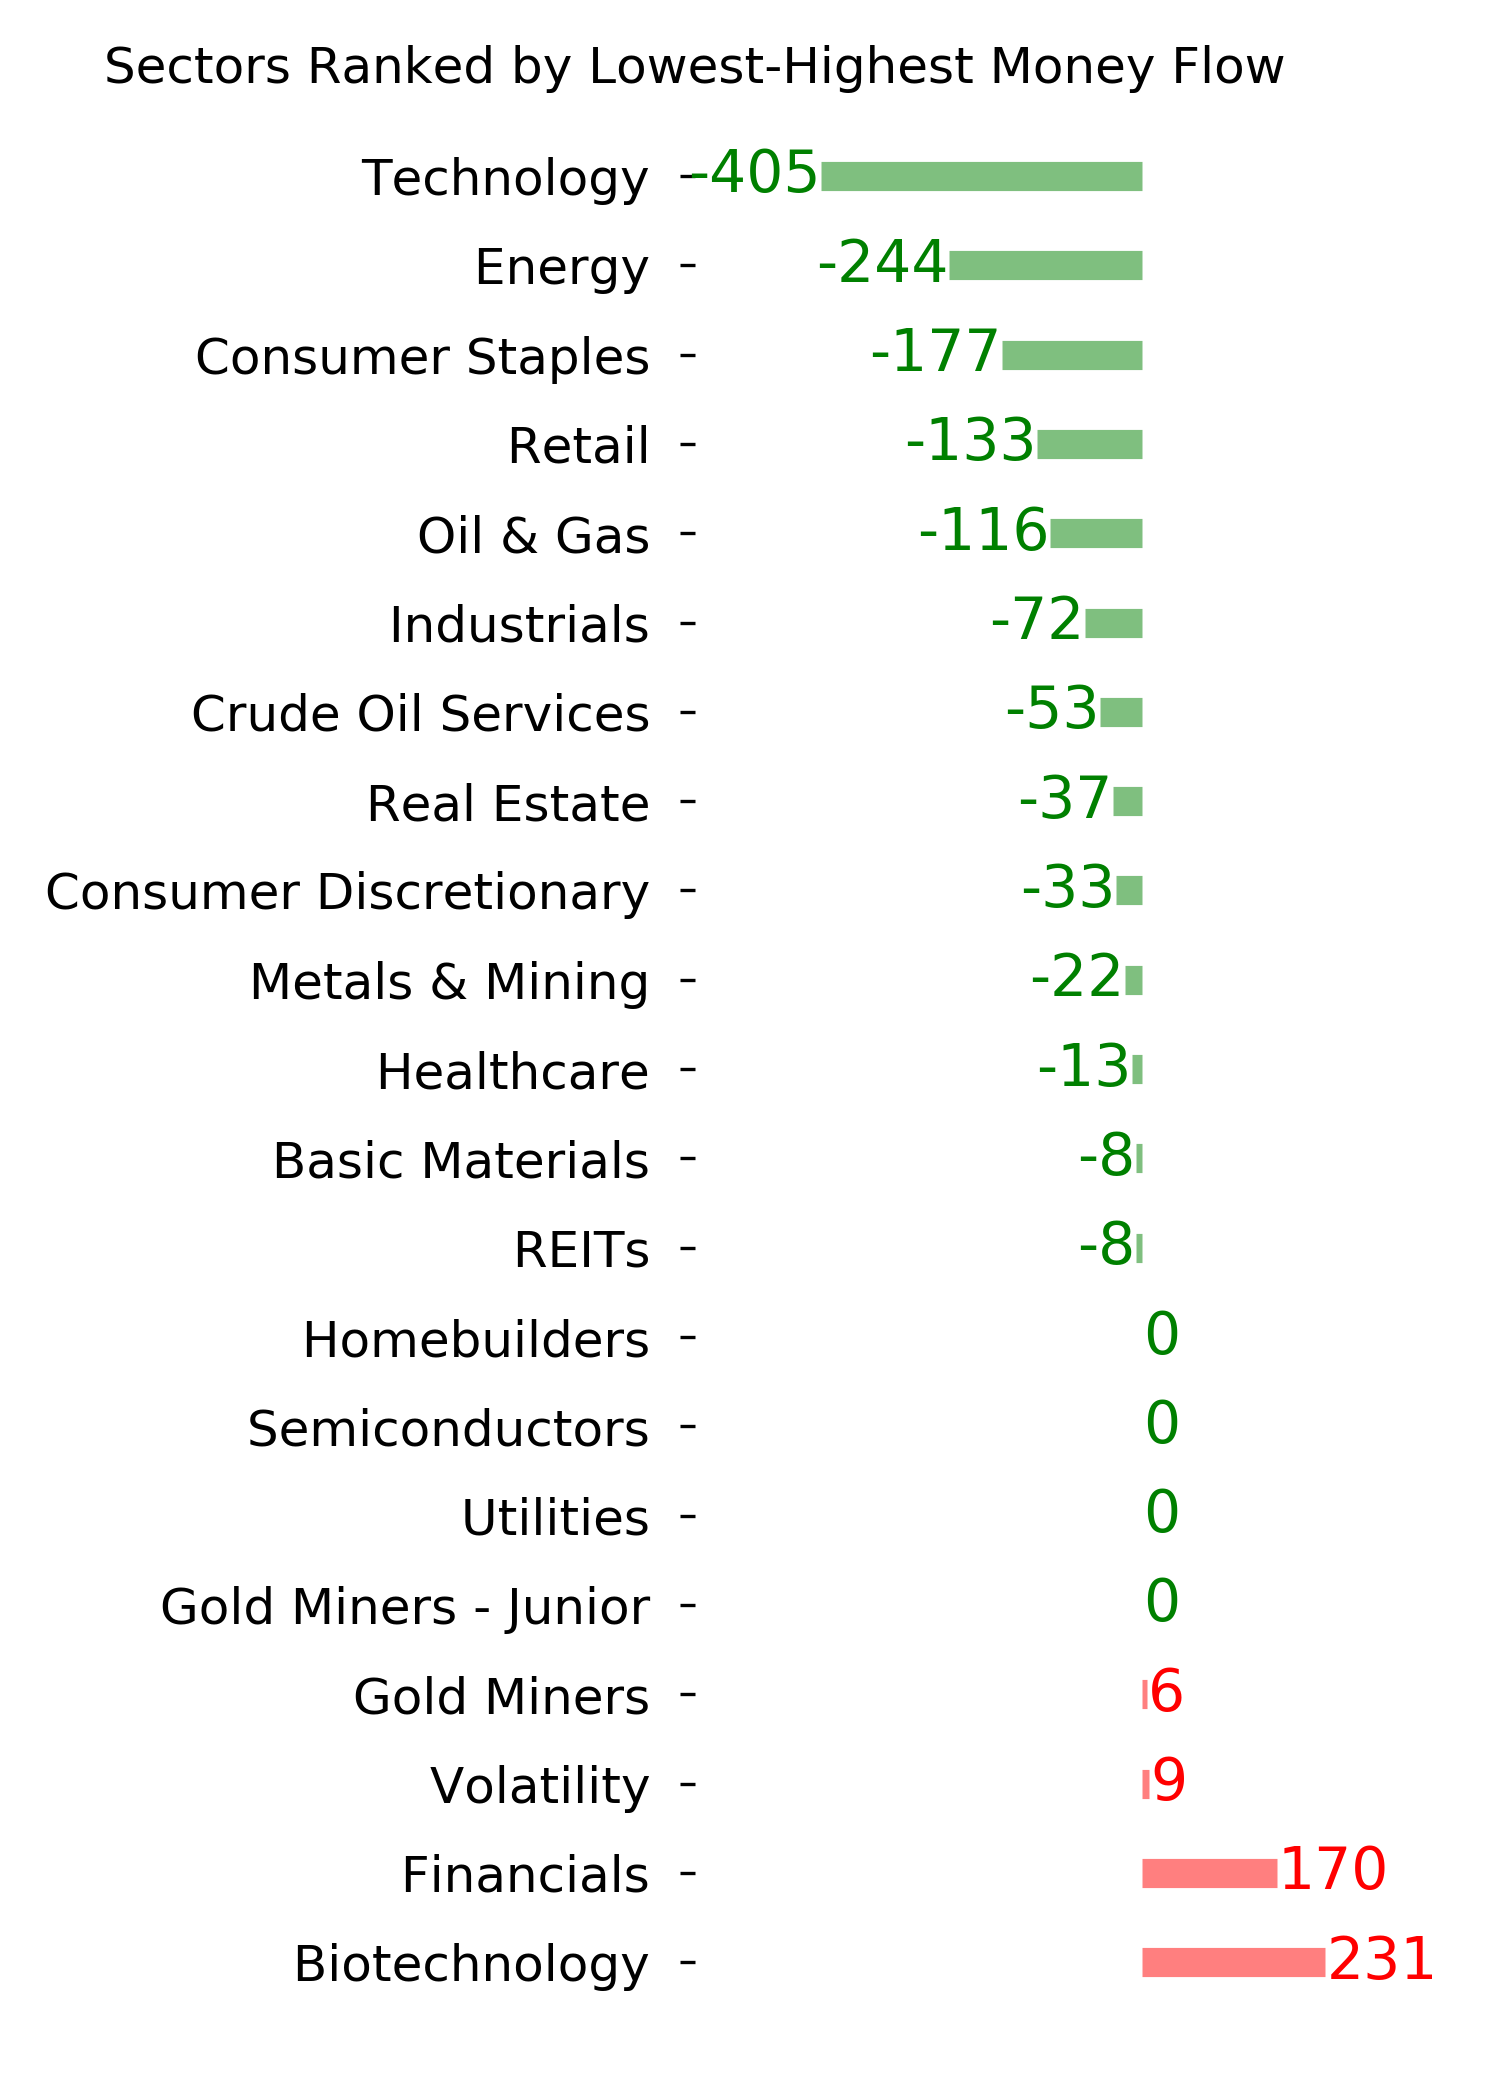
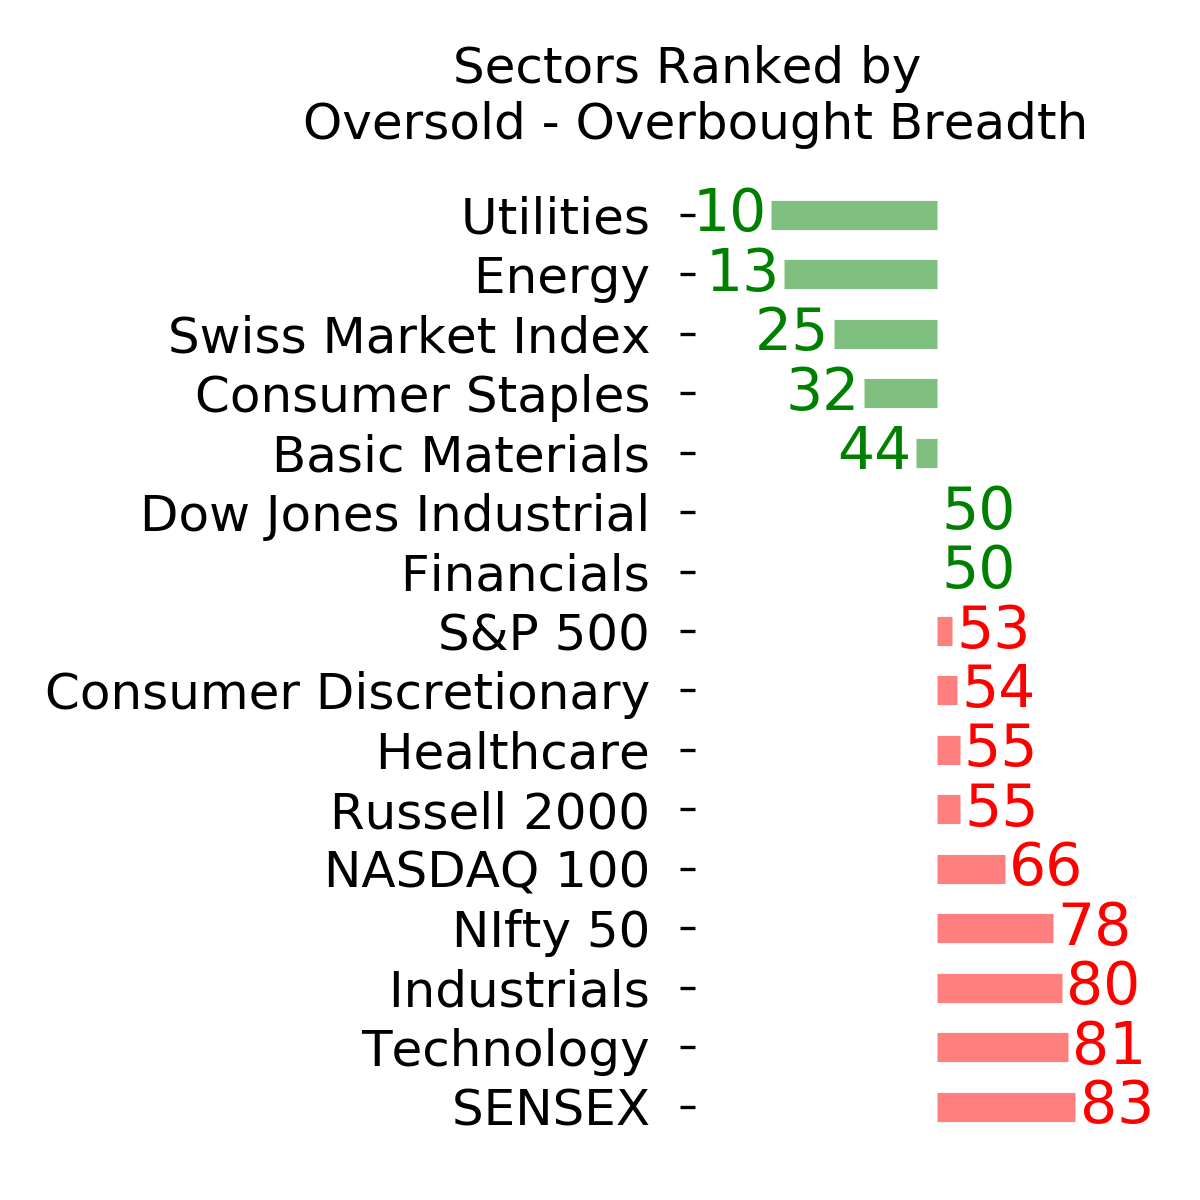
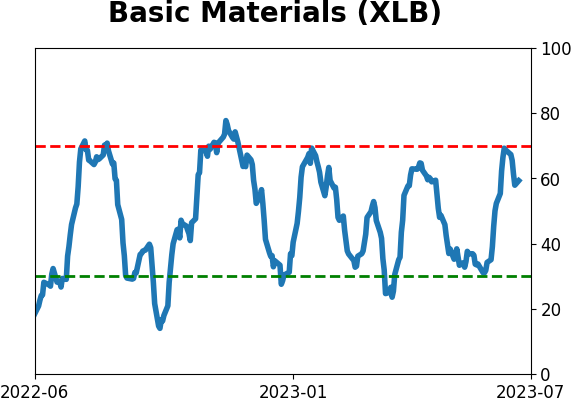
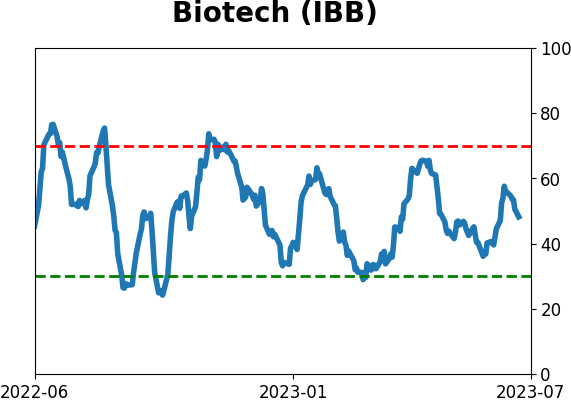
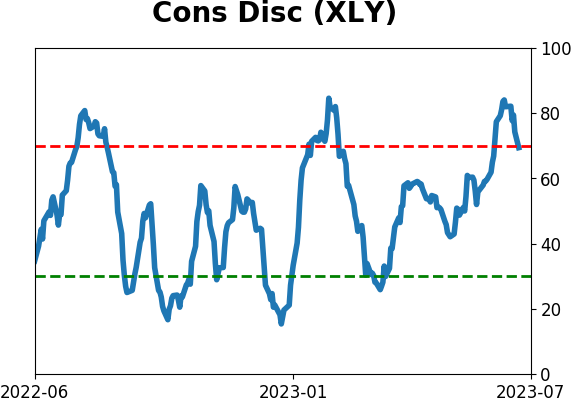
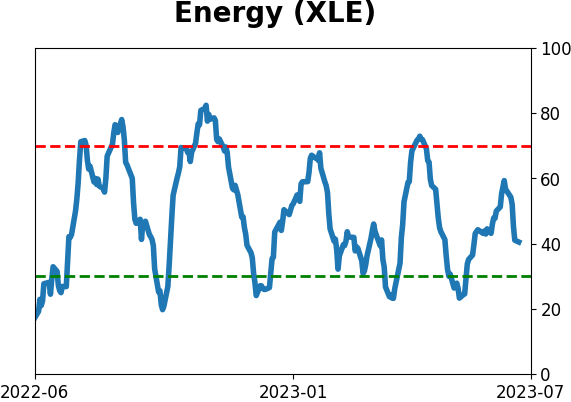
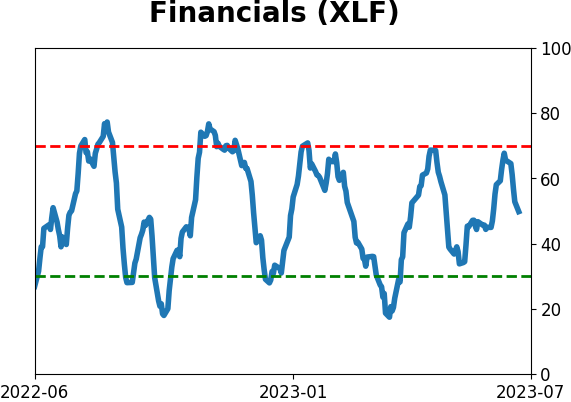
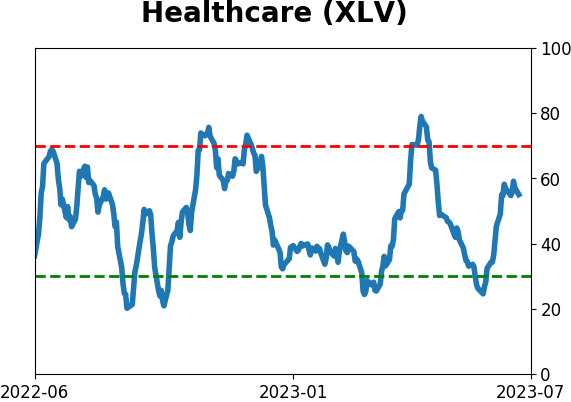
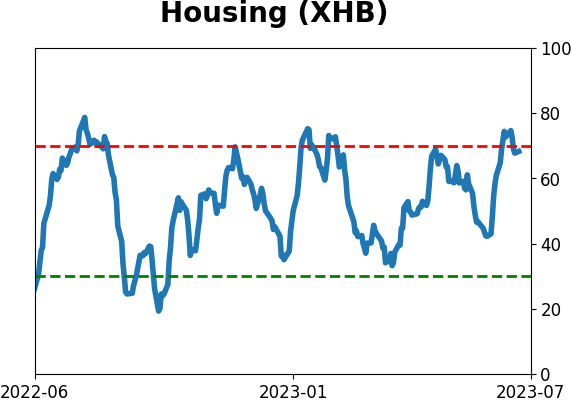
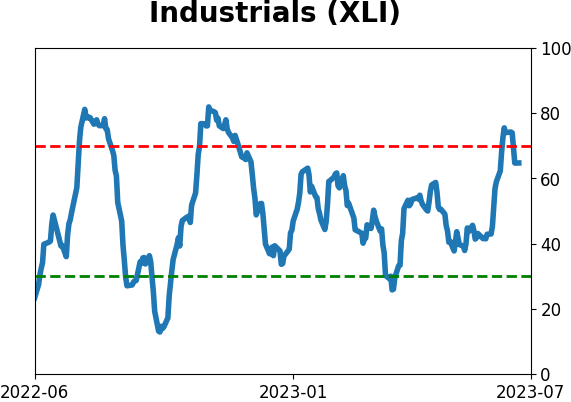
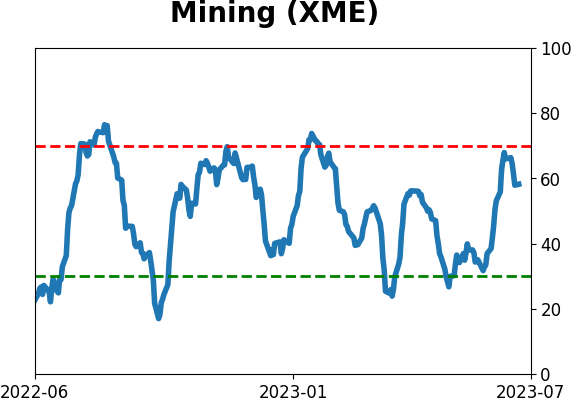
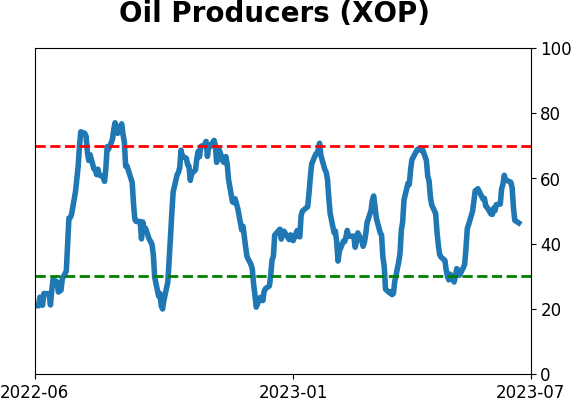
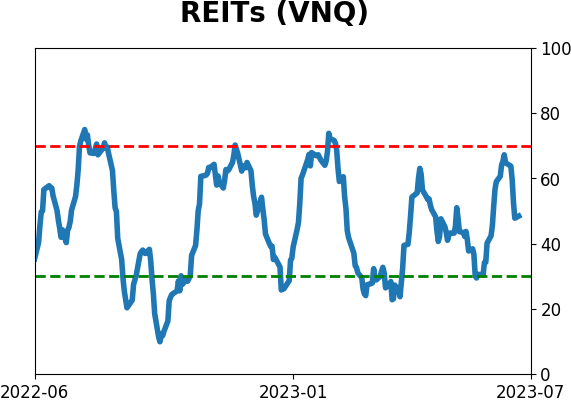
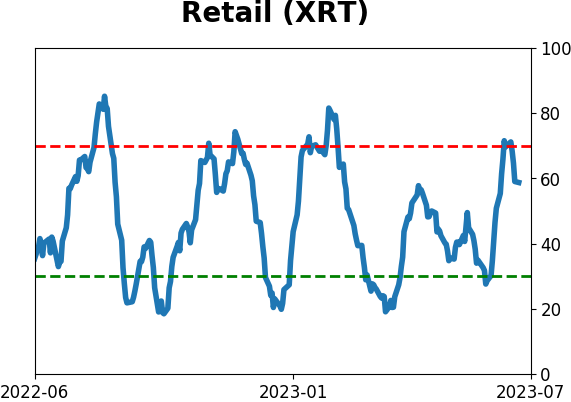
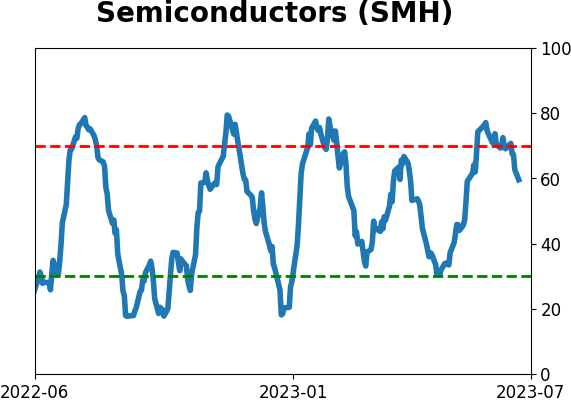
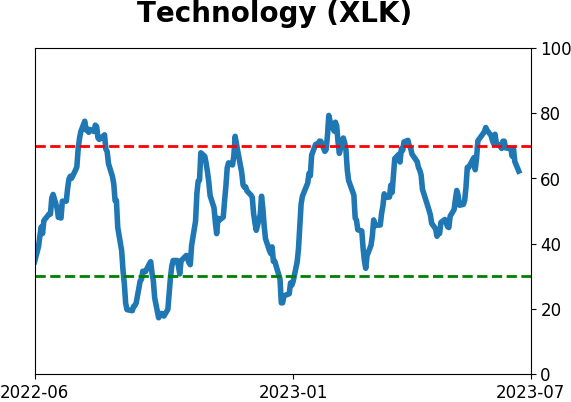
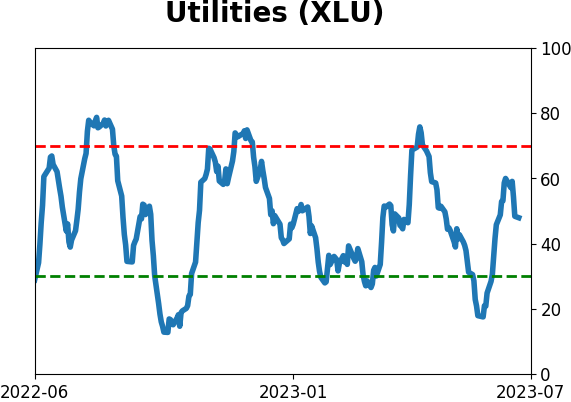
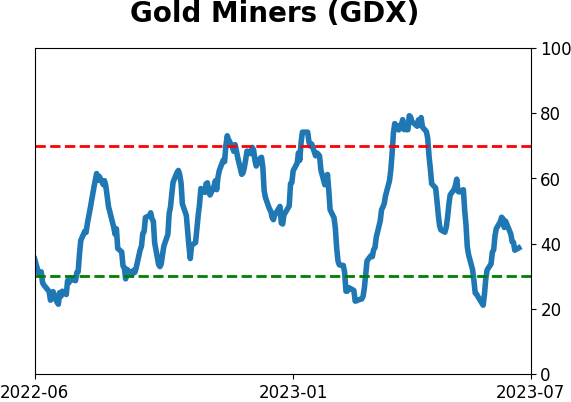
Sector ETF's - 10-Day Moving Average
|
|
|
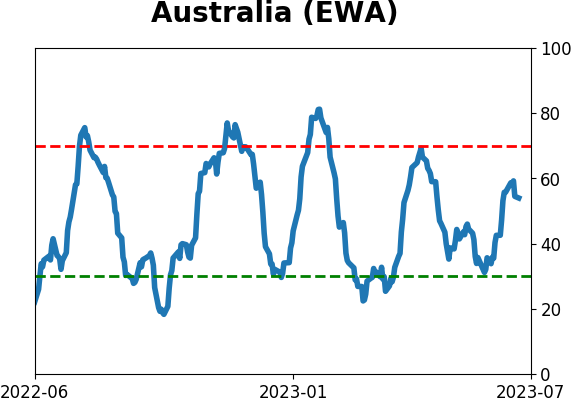
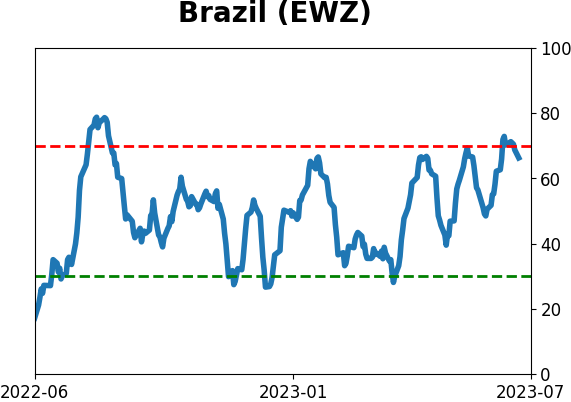
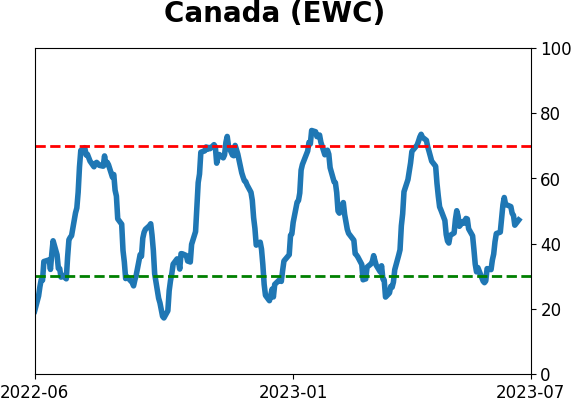
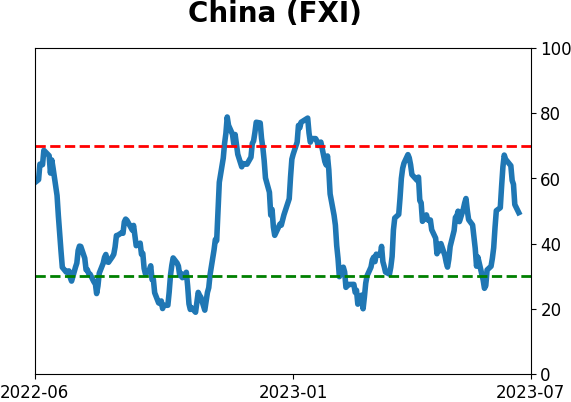
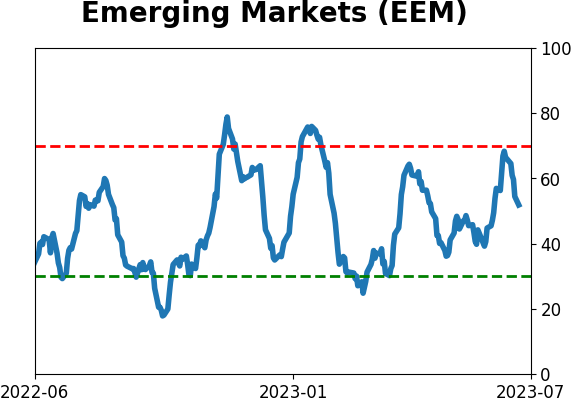
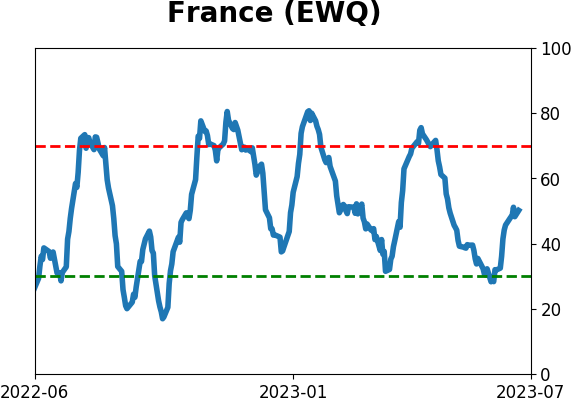
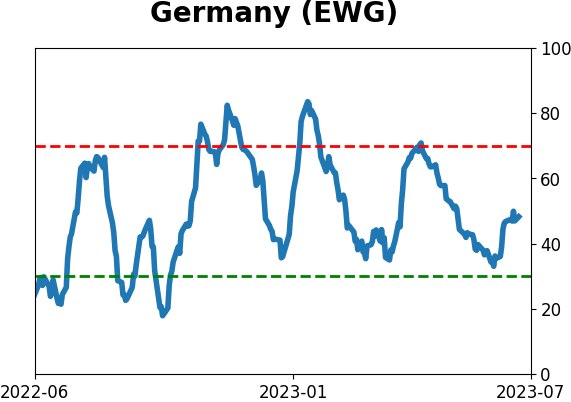
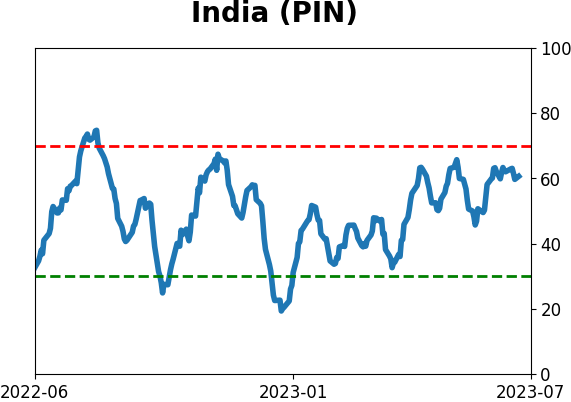
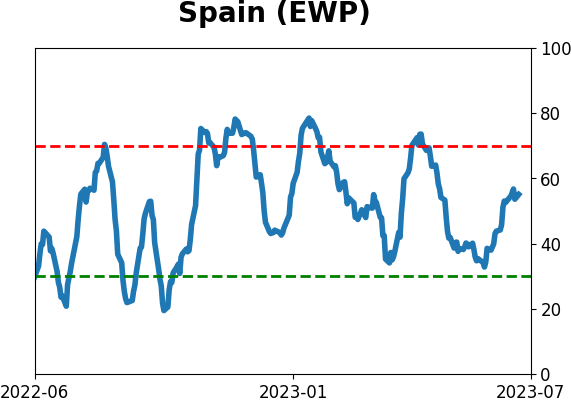
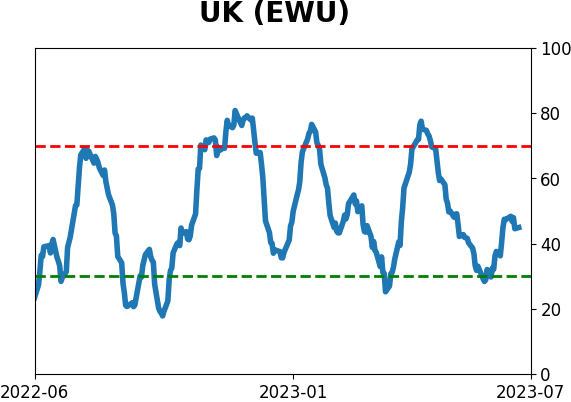
Country ETF's - 10-Day Moving Average
|
|
|
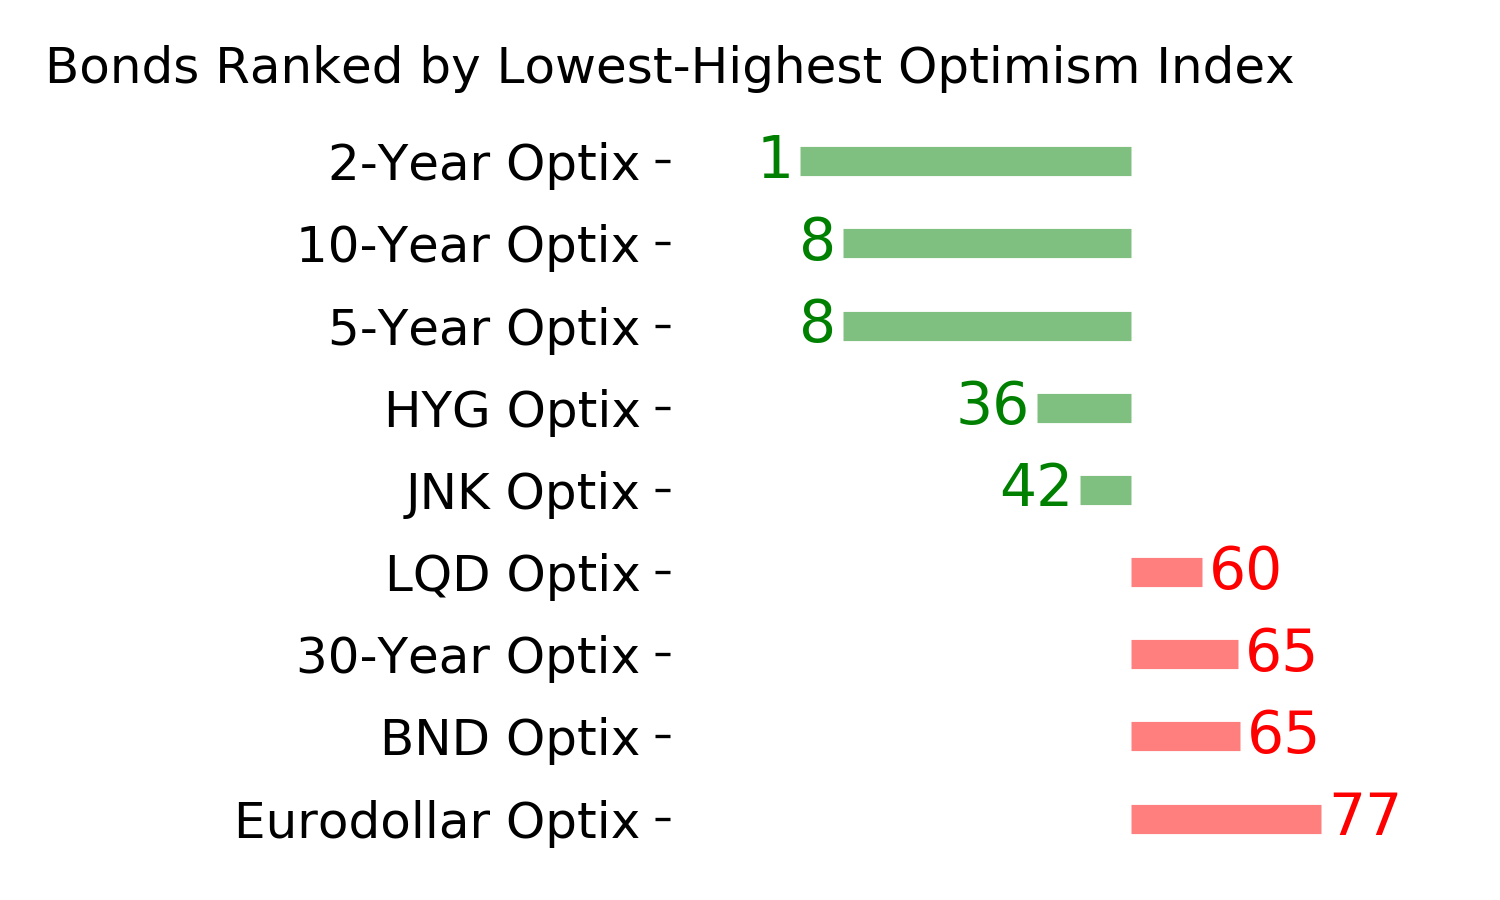
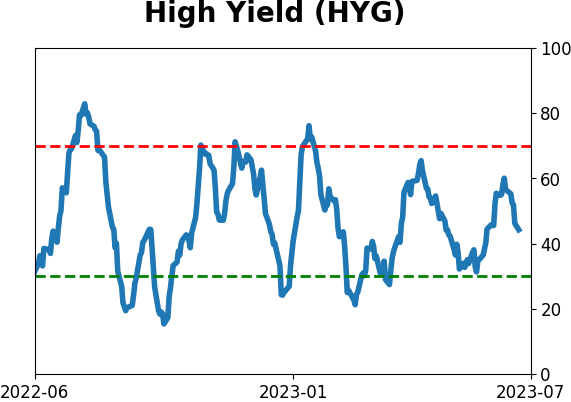
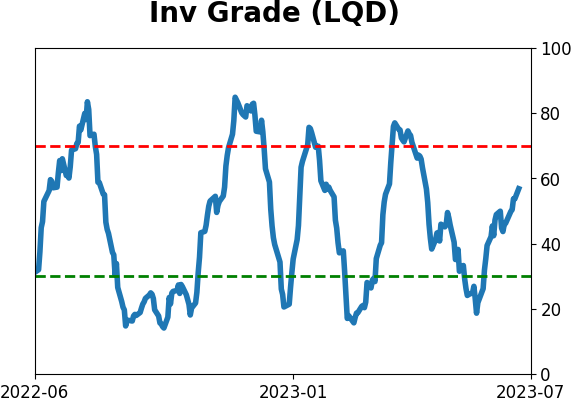
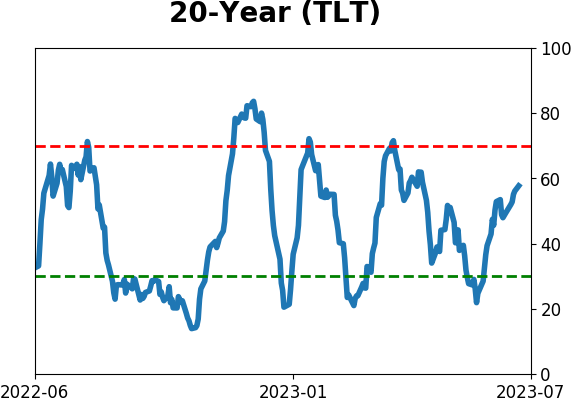
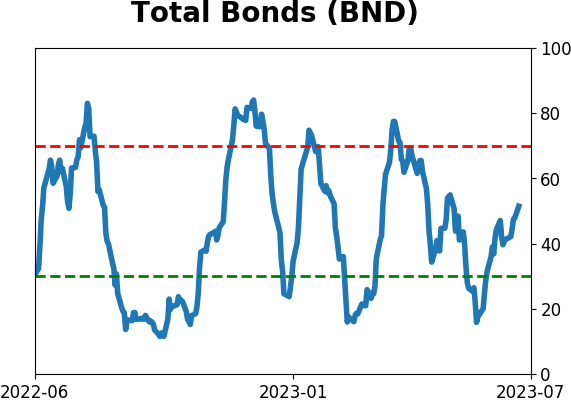
Bond ETF's - 10-Day Moving Average
|
|
|
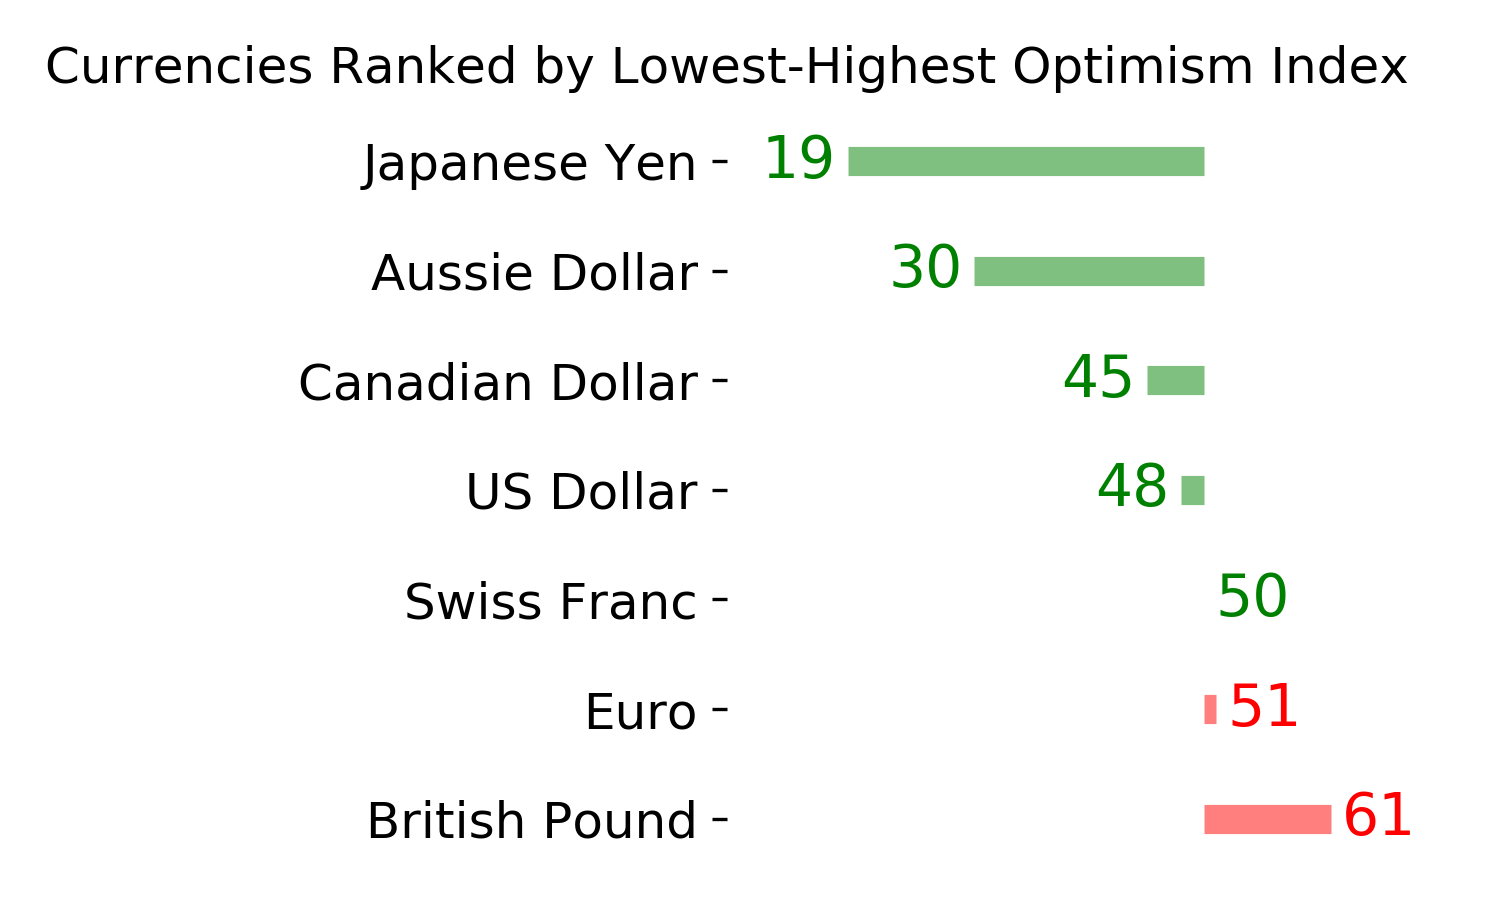
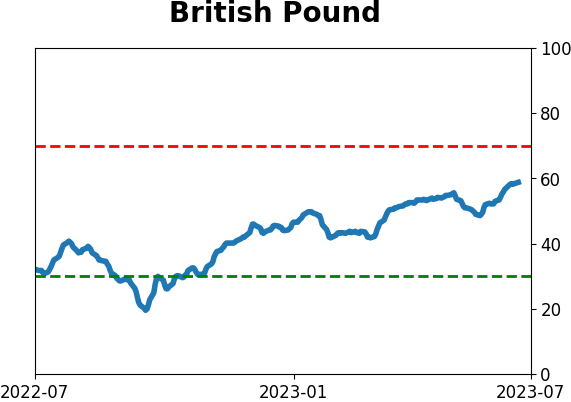
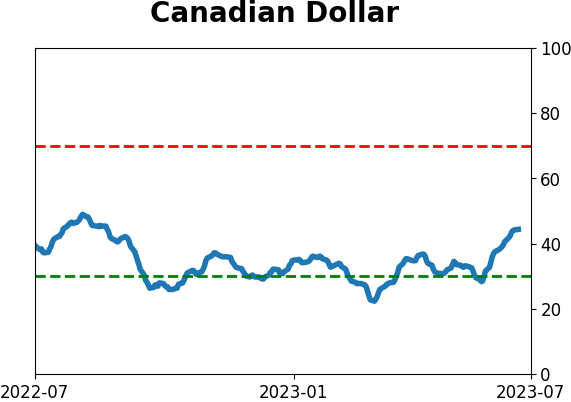
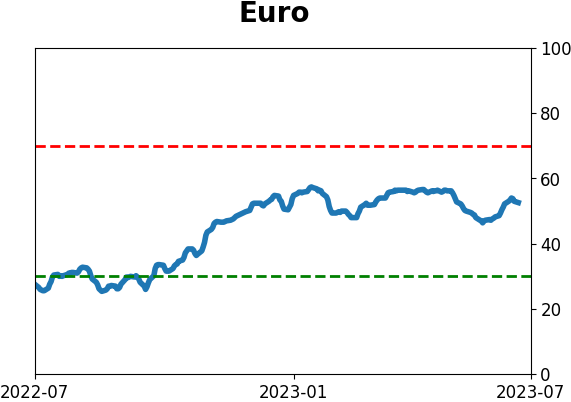
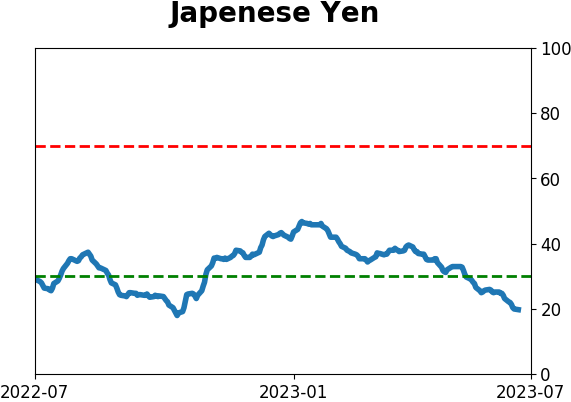
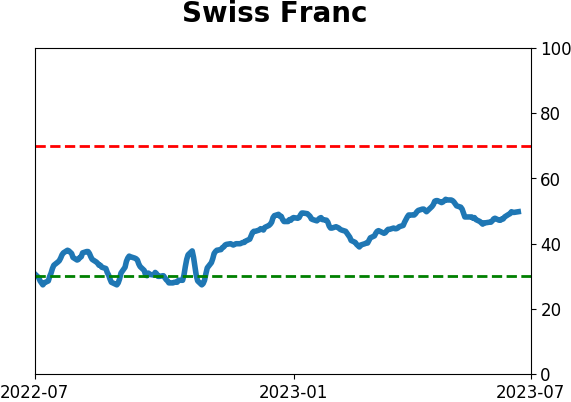
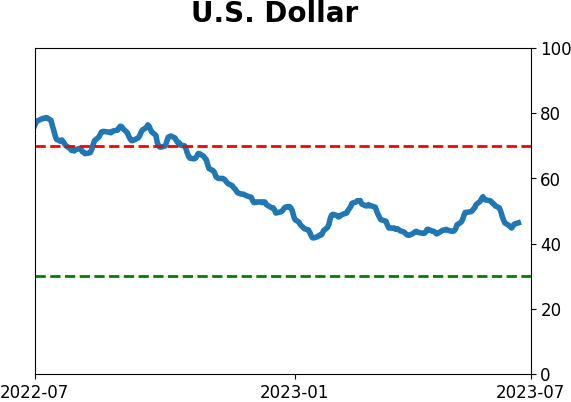
Currency ETF's - 5-Day Moving Average
|
|
|
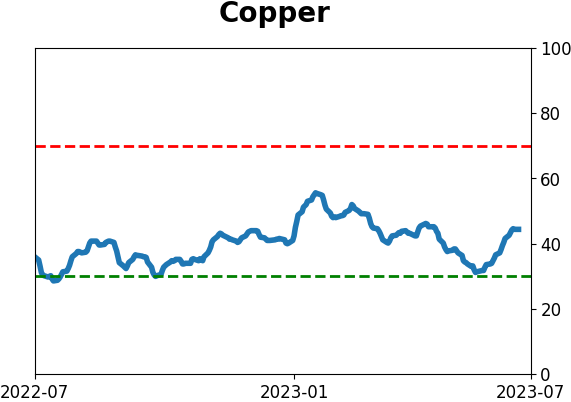
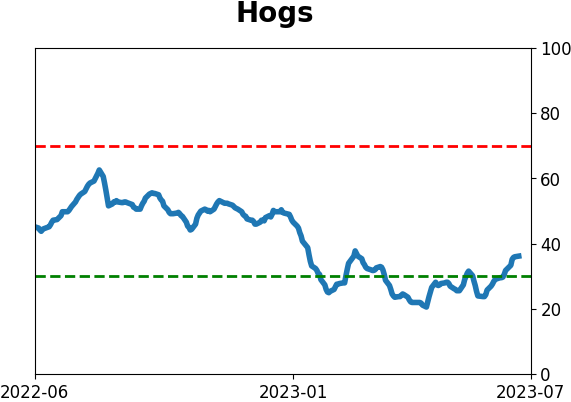
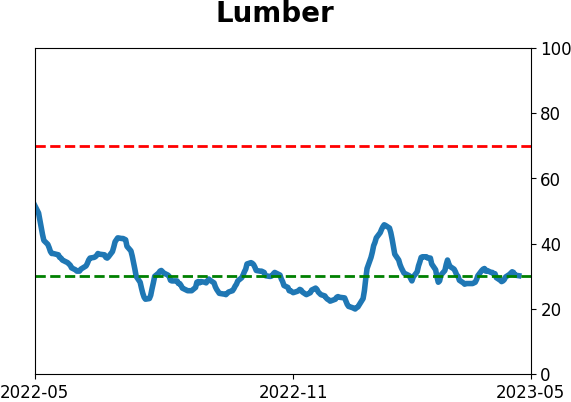
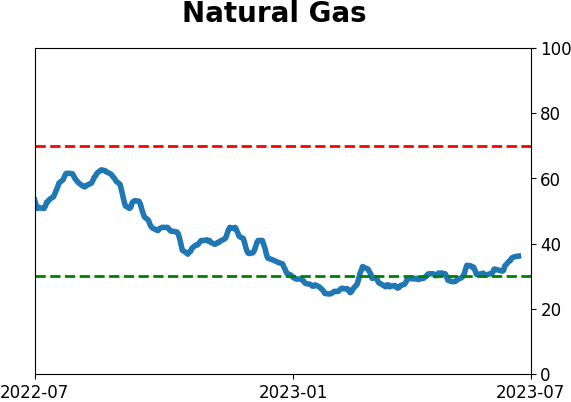
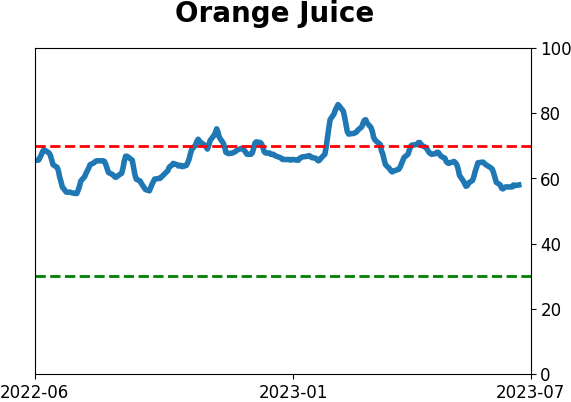
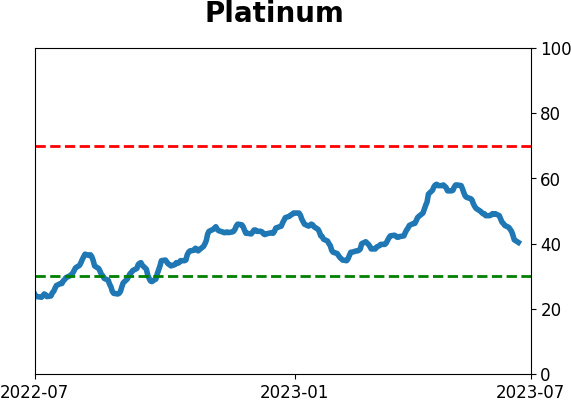
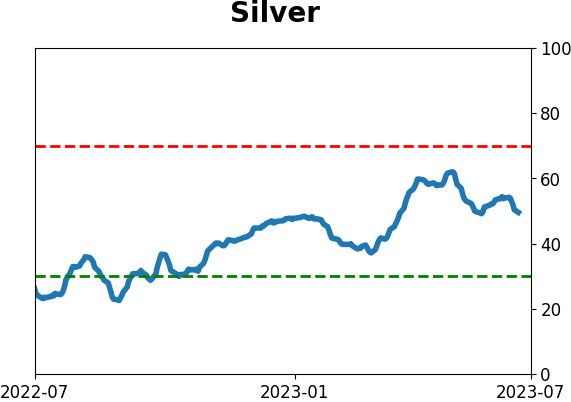
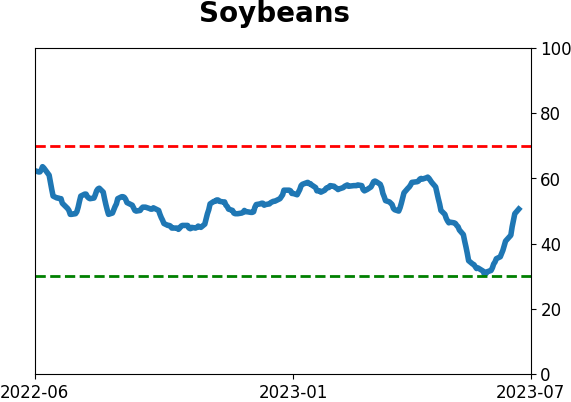
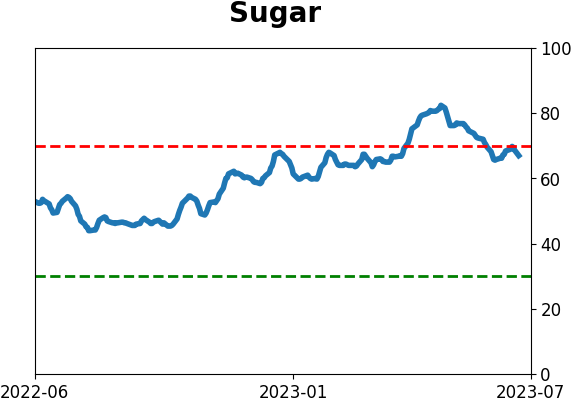
Commodity ETF's - 5-Day Moving Average
|
|