Headlines
|
|
The average S&P 500 stock is faring much better than a Nasdaq one:
Many more stocks in the S&P 500 are holding above their 200-day averages than stocks in the Nasdaq Composite. The spread in breadth between stocks in the two indices is at one of the widest points in 50 years. There is some evidence of mean reversion after these conditions, with the Nasdaq tended to outperform the S&P.
|
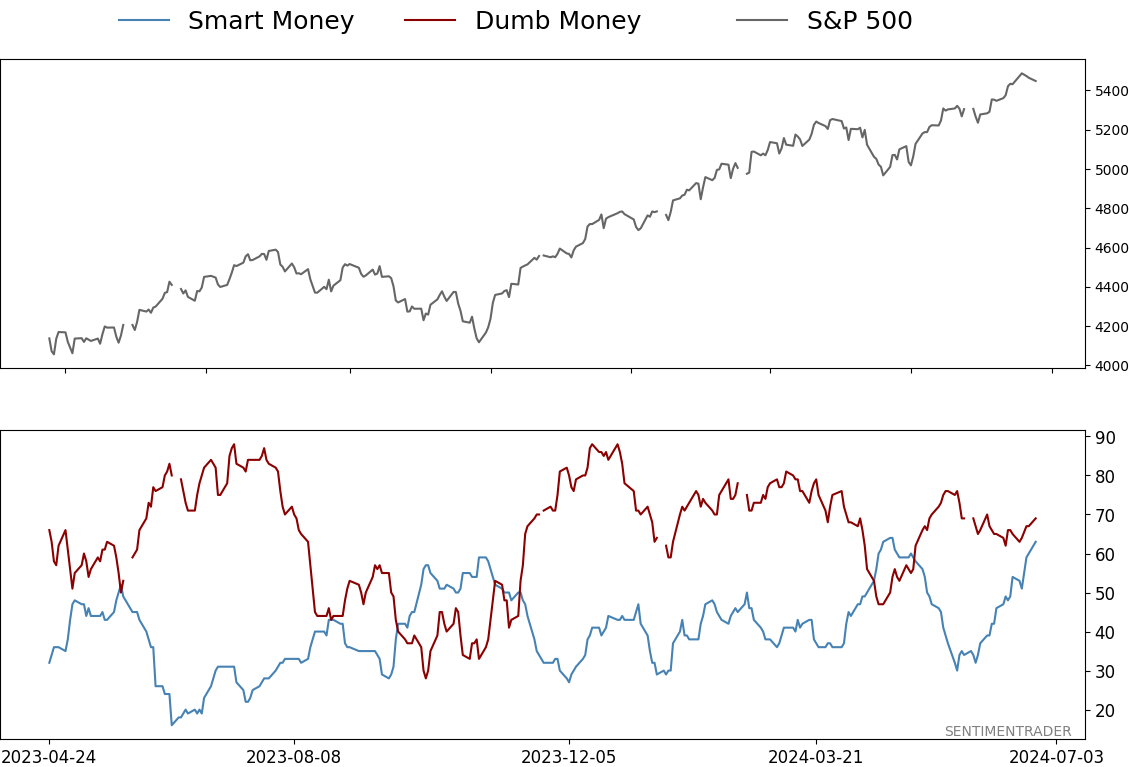
Smart / Dumb Money Confidence
|
Smart Money Confidence: 63%
Dumb Money Confidence: 69%
|
|
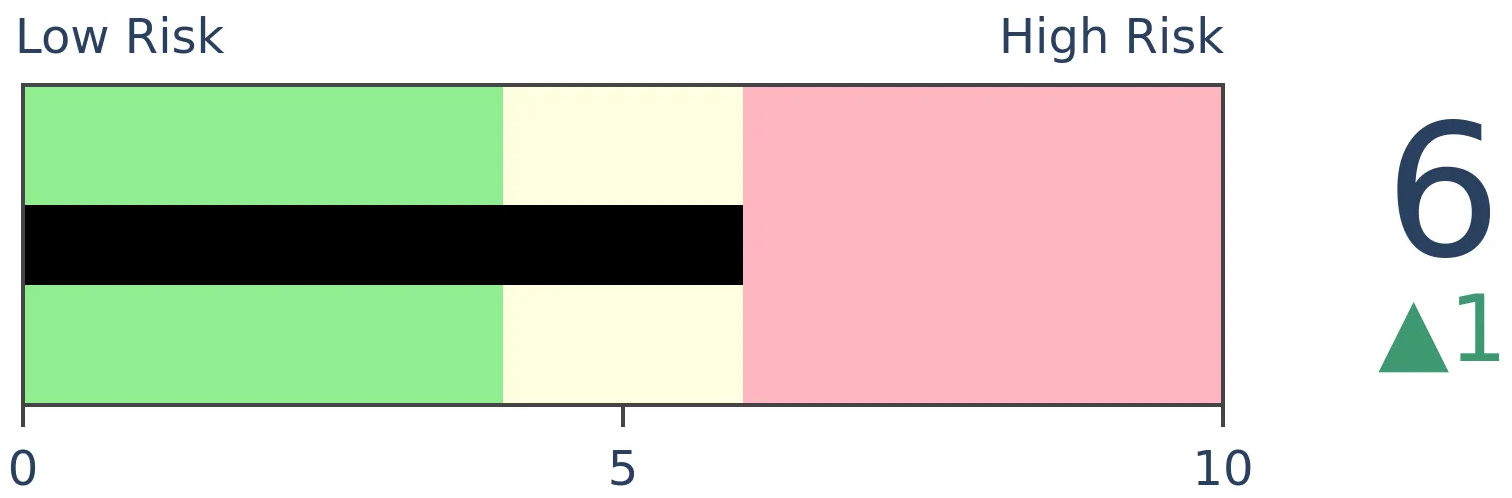
Risk Levels
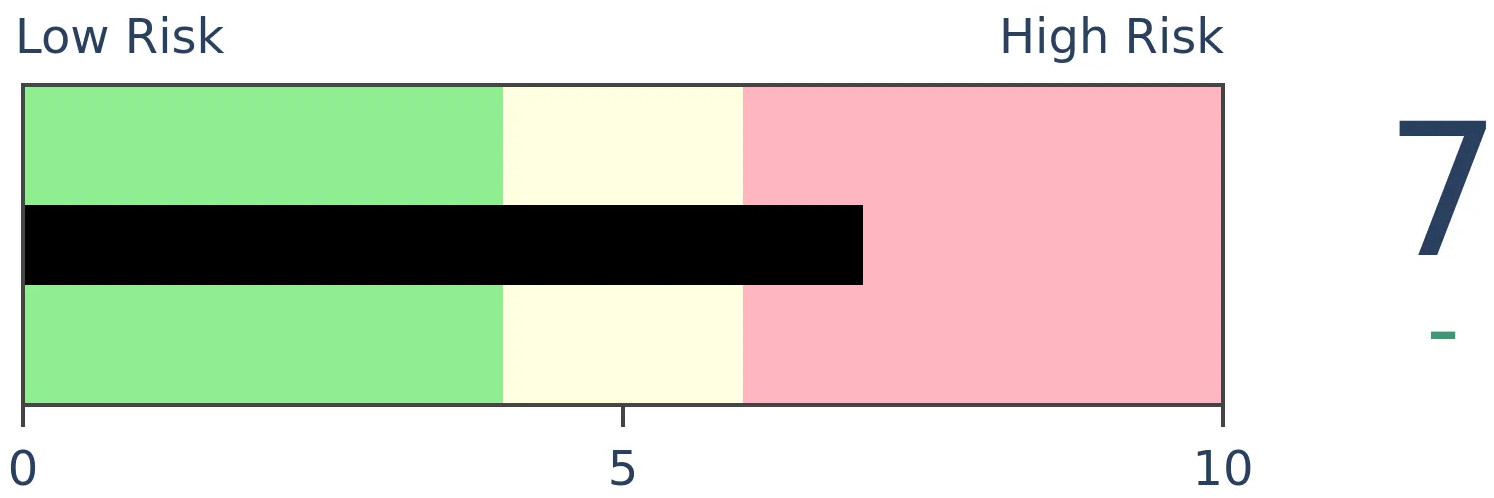
Stocks Short-Term
|
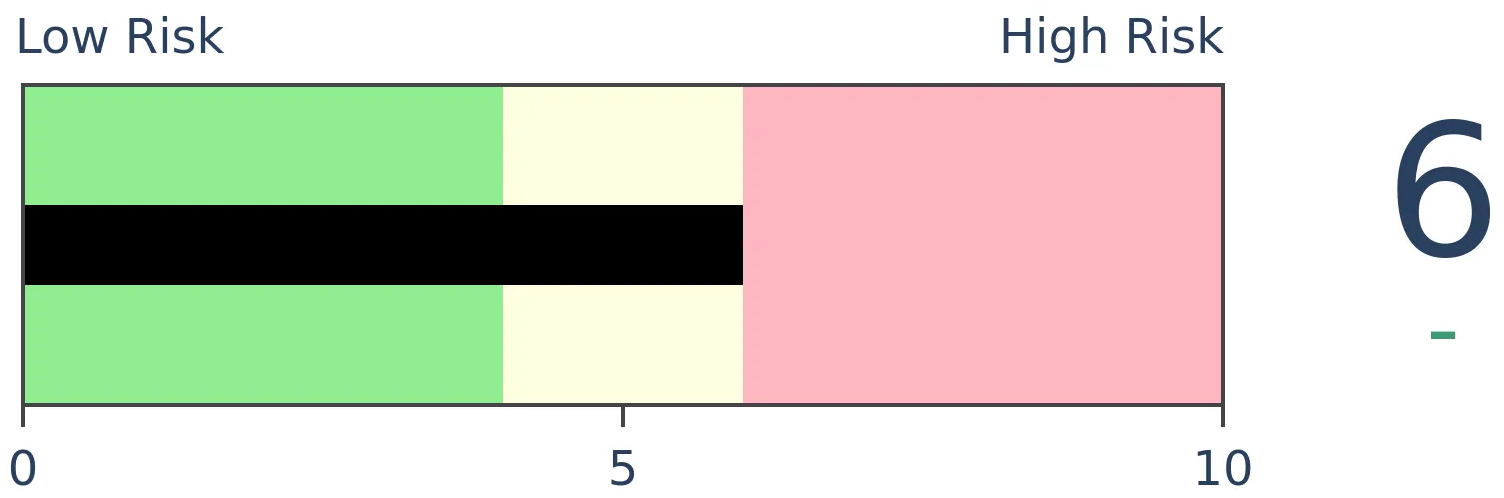
Stocks Medium-Term
|
|
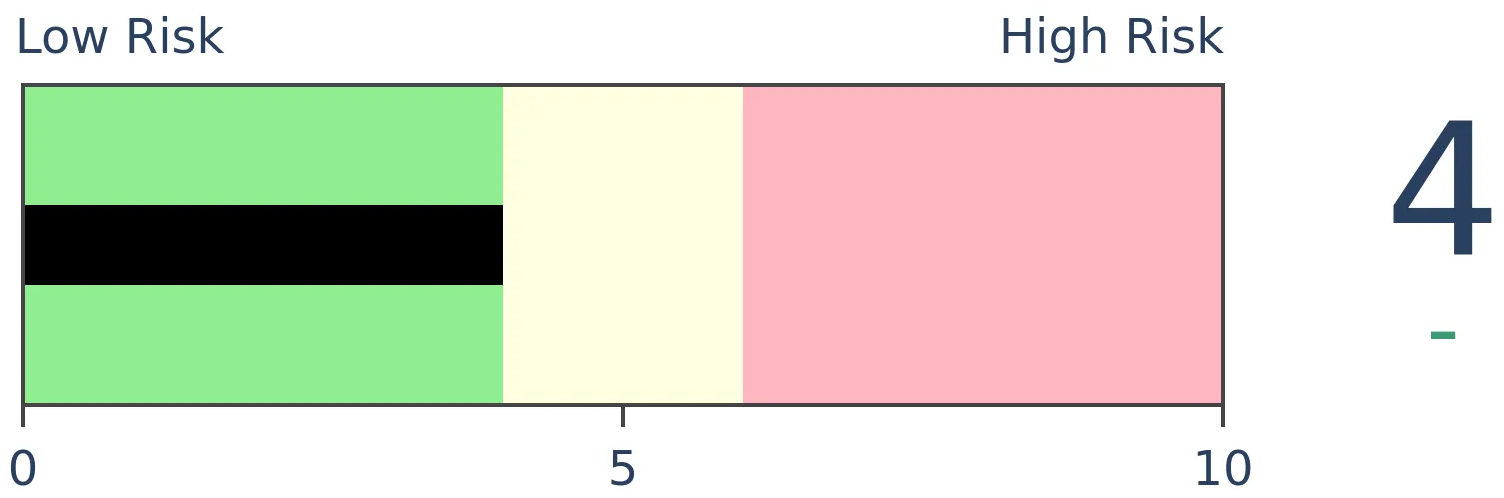
Bonds

|
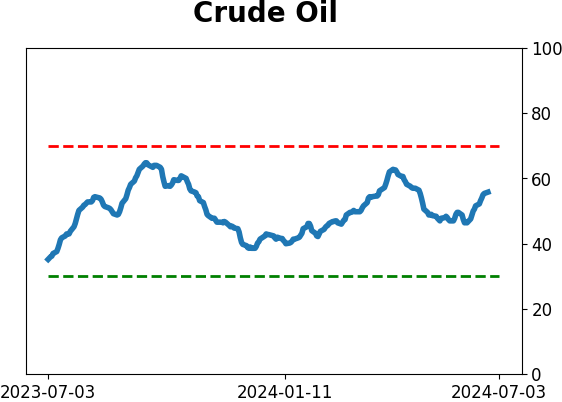
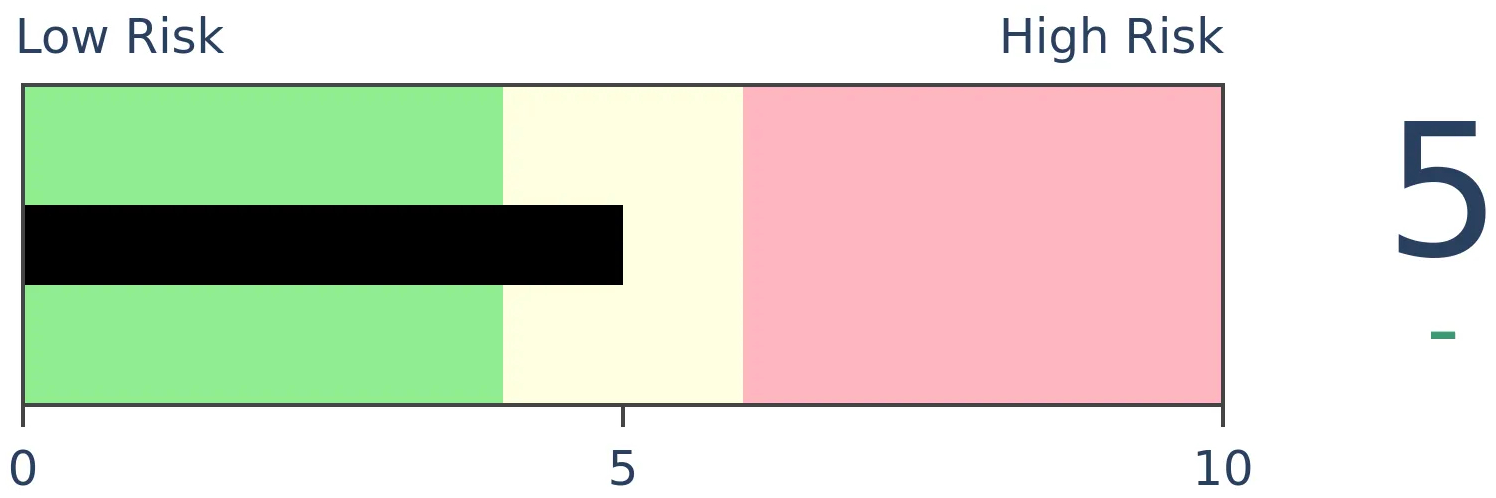
Crude Oil
|
|
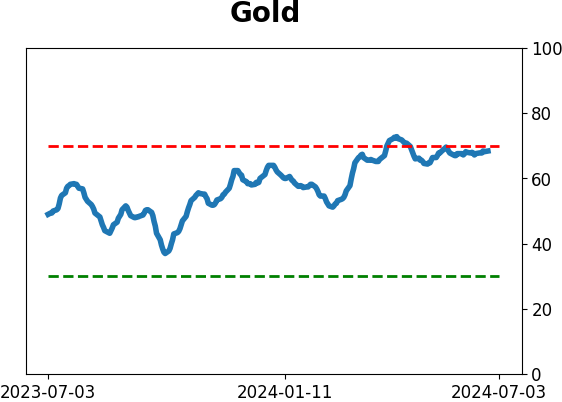
Gold
|
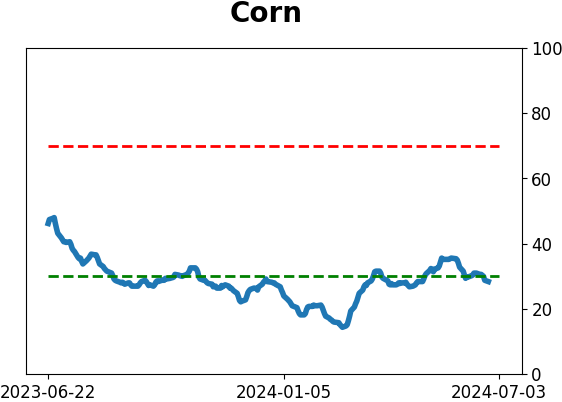
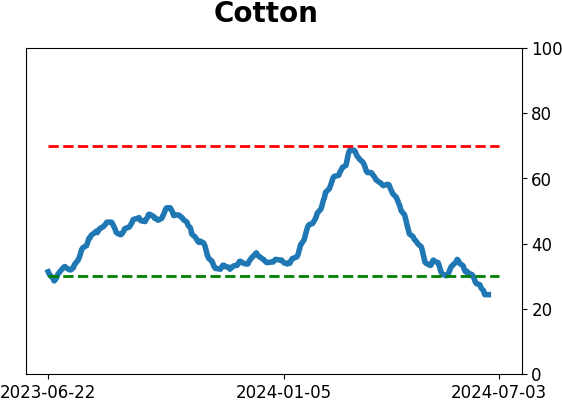
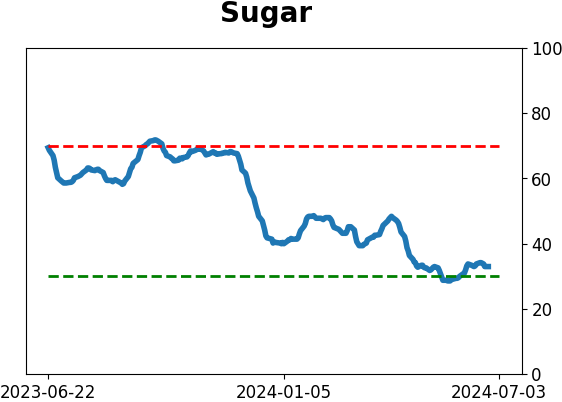
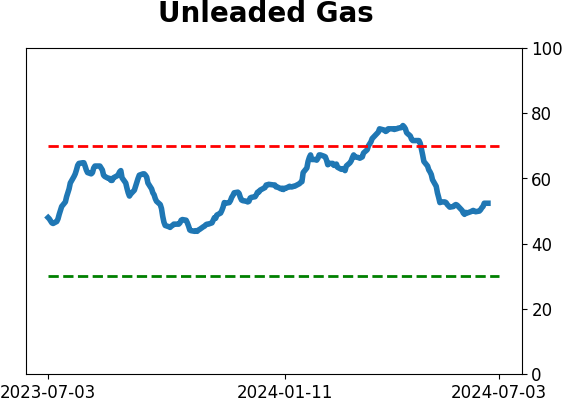
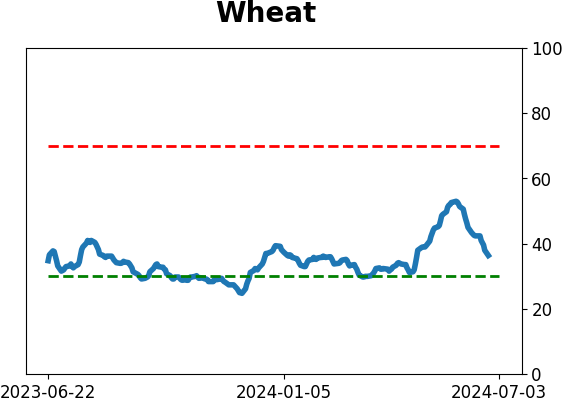
Agriculture
|
|
Research
By Jason Goepfert
BOTTOM LINE
Many more stocks in the S&P 500 are holding above their 200-day averages than stocks in the Nasdaq Composite. The spread in breadth between stocks in the two indices is at one of the widest points in 50 years. There is some evidence of mean reversion after these conditions, with the Nasdaq tended to outperform the S&P.
FORECAST / TIMEFRAME
None
|
Key points:
- Many more stocks in the S&P 500 are in long-term uptrends relative to those in the Nasdaq Composite
- The spread in fortunes between members of the two indexes has rarely been this stark
- Counter to many rules-of-thumb, the Nasdaq tended to outperform the S&P by more than usual after similar conditions
The benefit of committee selection
We've noted the internal weakness on the Nasdaq and Nasdaq 100 multiple times in recent weeks. It hasn't gotten any better, and it's in stark contrast to other areas of the market.
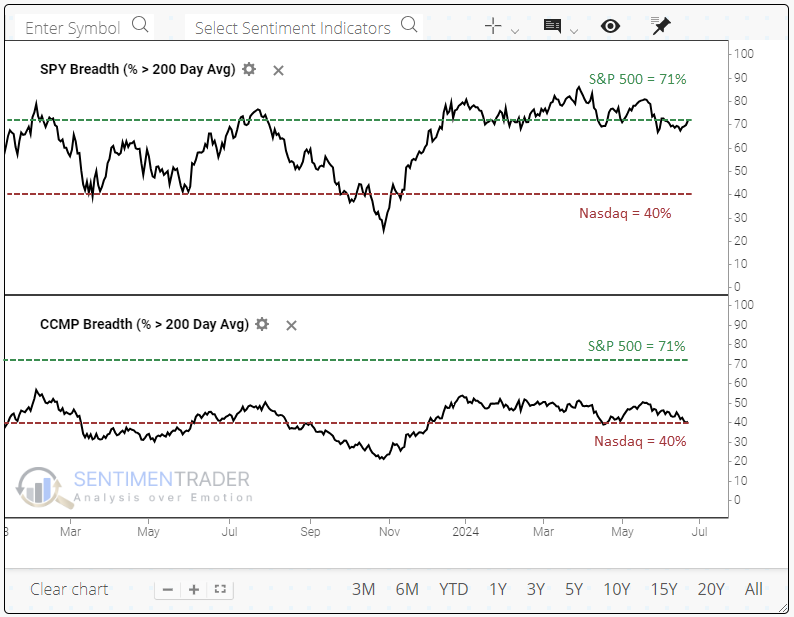
The divergences are across time frames, including the longest one we monitor. The percentage of stocks holding above their 200-day averages has consistently held above 70% in the S&P 500, while on the Nasdaq, it is dipping to 40%.
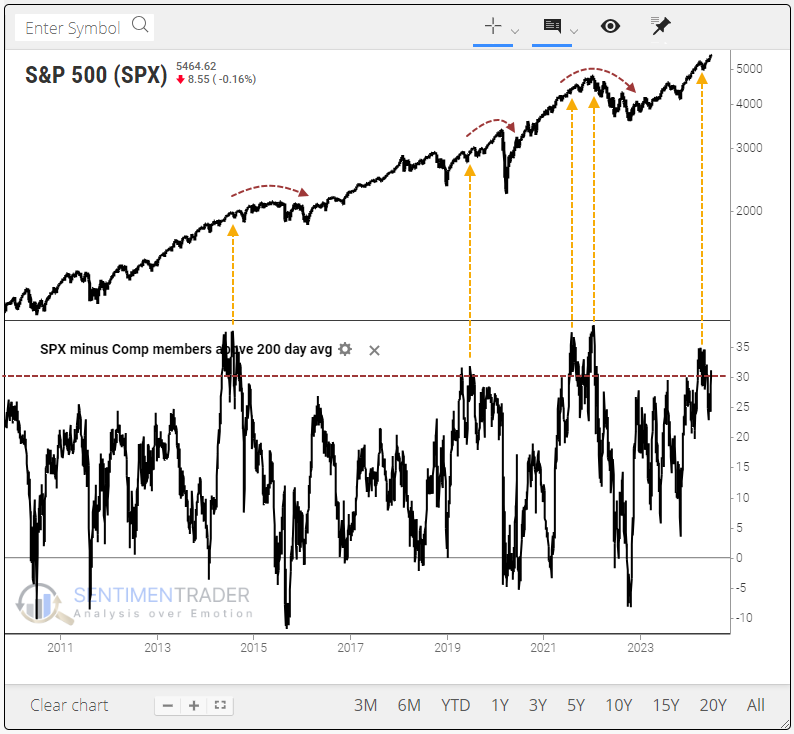
Using the My Indicator function, a user can examine the spread between these two measures and test what it means for stocks going forward. Below, we can see that a spread of 30% has been rare over the past decade and generally coincided with markets in broad topping formations.
Big disparities typically favored the Nasdaq
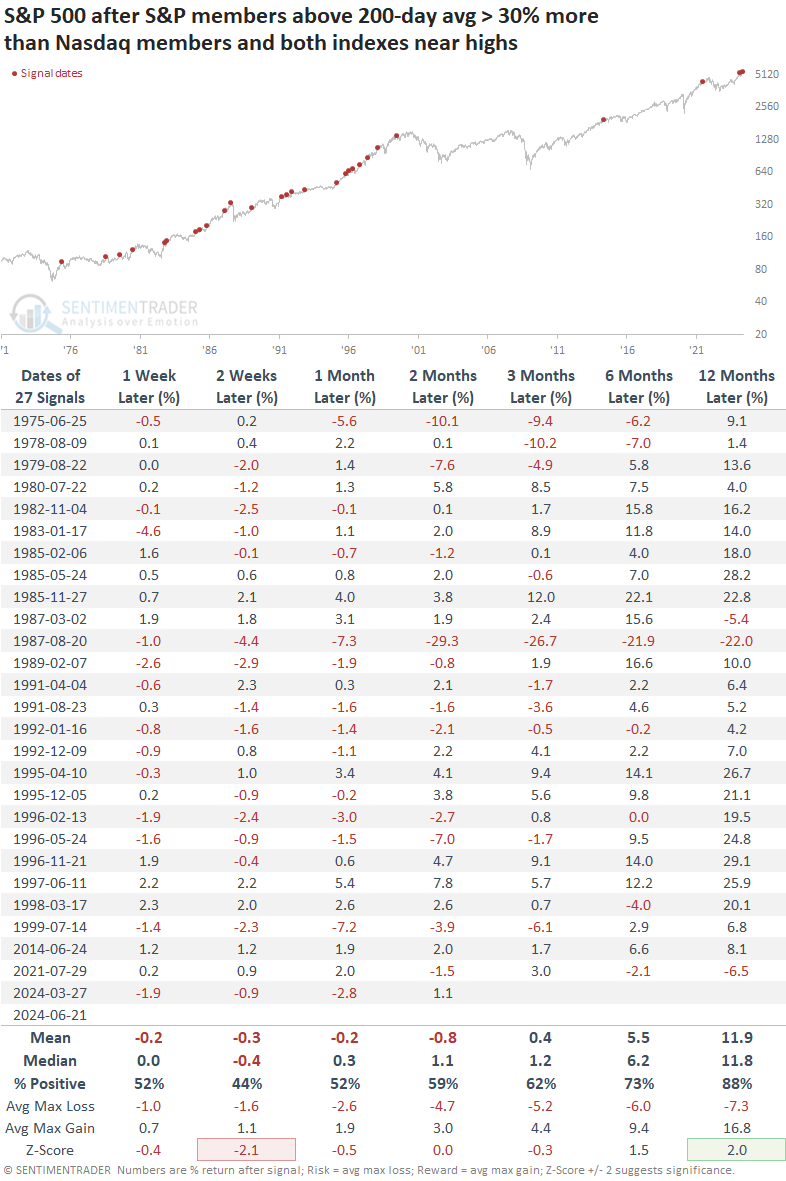
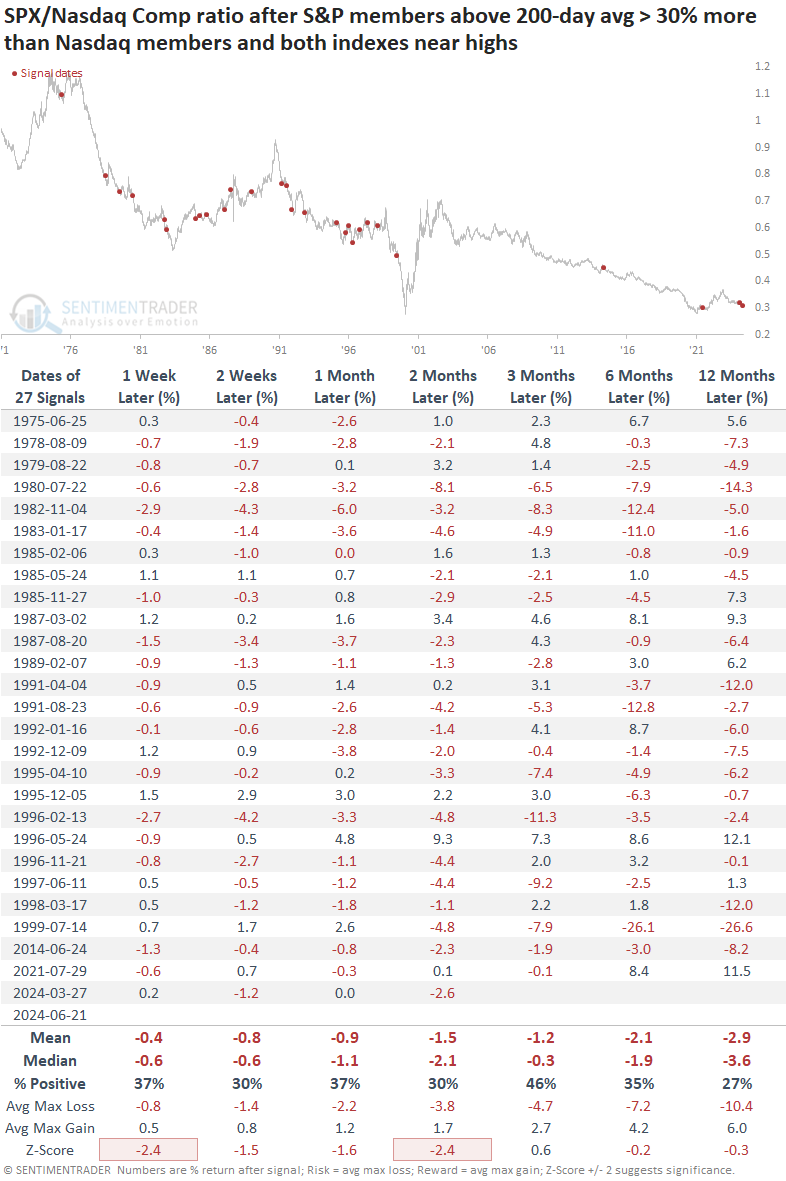
The table below shows future returns in the S&P 500 when it and the Nasdaq Composite were both within 1% of 52-week highs. At the time, at least 30% more stocks in the S&P were above their 200-day averages than those in the Nasdaq. It shows times when internal participation in the S&P was much better than in the Nasdaq, despite both indexes holding near their highs.
For the S&P, it wasn't a great sign up to two months later, with a negative mean return. The risk/reward ratio was skewed to the downside up to three months later. Even though the win rate wasn't too bad after a few months, these conditions preceded some nasty spills.
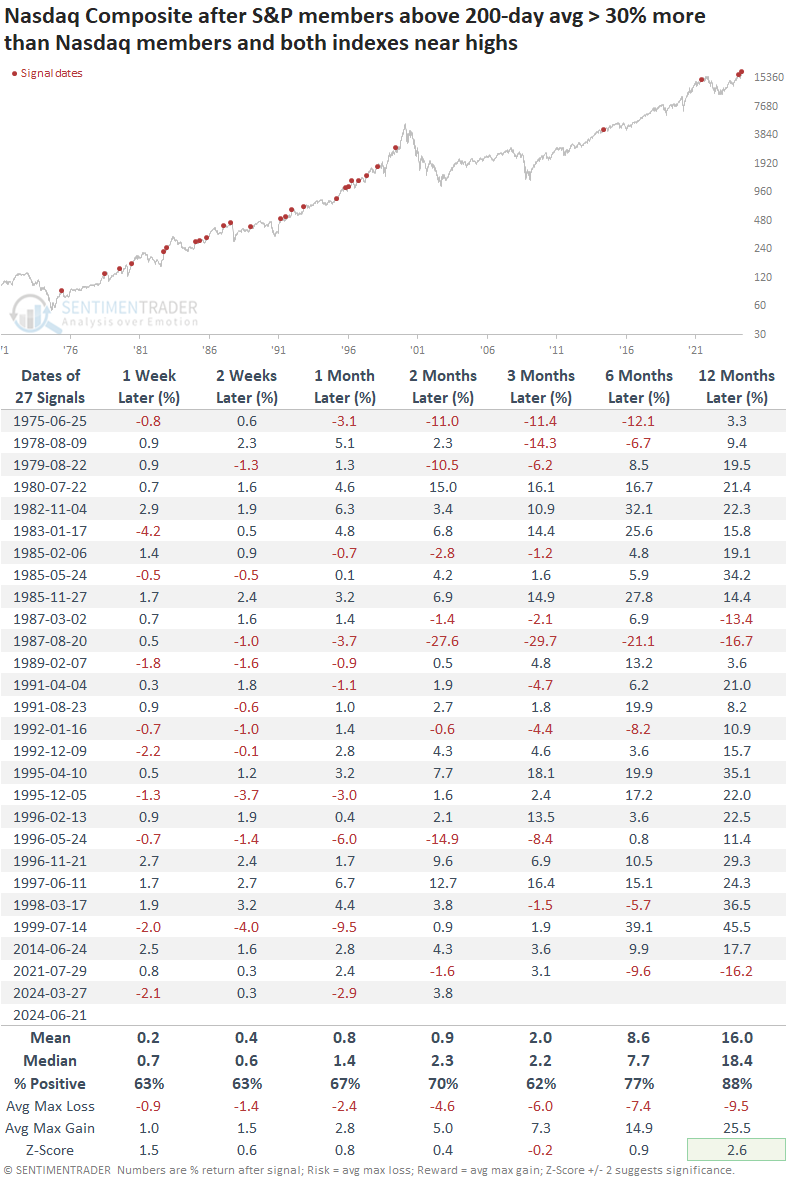
We've all been told to sell the weak and buy the strong, but that didn't pan out well under these conditions. Despite terribly lagging internal uptrends, the Nasdaq Composite index held up significantly better than the S&P across time frames. That's not to say it did well - returns were about in line with random, with some large losses - but at least the returns were better than the S&P.
We can see the difference in returns more clearly by looking at the ratio between the S&P and Nasdaq after these signals. Even though the secular trend is down (meaning the S&P tended to underperform the Nasdaq over time), the trend was even worse after these signals, especially up to two months later when the risk was more than double the reward.
What the research tells us...
Trend and momentum are important concepts in markets, as is mean reversion. To put it mildly, determining when one is more likely than the other is challenging.
There are clues like we saw after the thrusts in the fall of 2022 and again in 2023. After that type of activity, momentum tends to rule for quite a while. We've seen more clues lately that mean reversion may become more of a factor, which isn't unusual after a run like we've seen over the past six months.
The study above suggests that despite the big run in many Nasdaq-listed stocks, many others have struggled. While momentum traders would suggest that it means continuing to expect more weakness on the Nasdaq, these divergences have not confirmed that. It certainly doesn't suggest a raging bullish outlook for the Nasdaq; all it suggests is that the wide disparity in uptrends between the two indexes has typically been resolved over the next couple of months by the Nasdaq outperforming the S&P by more than it usually did.
Indicators at Extremes
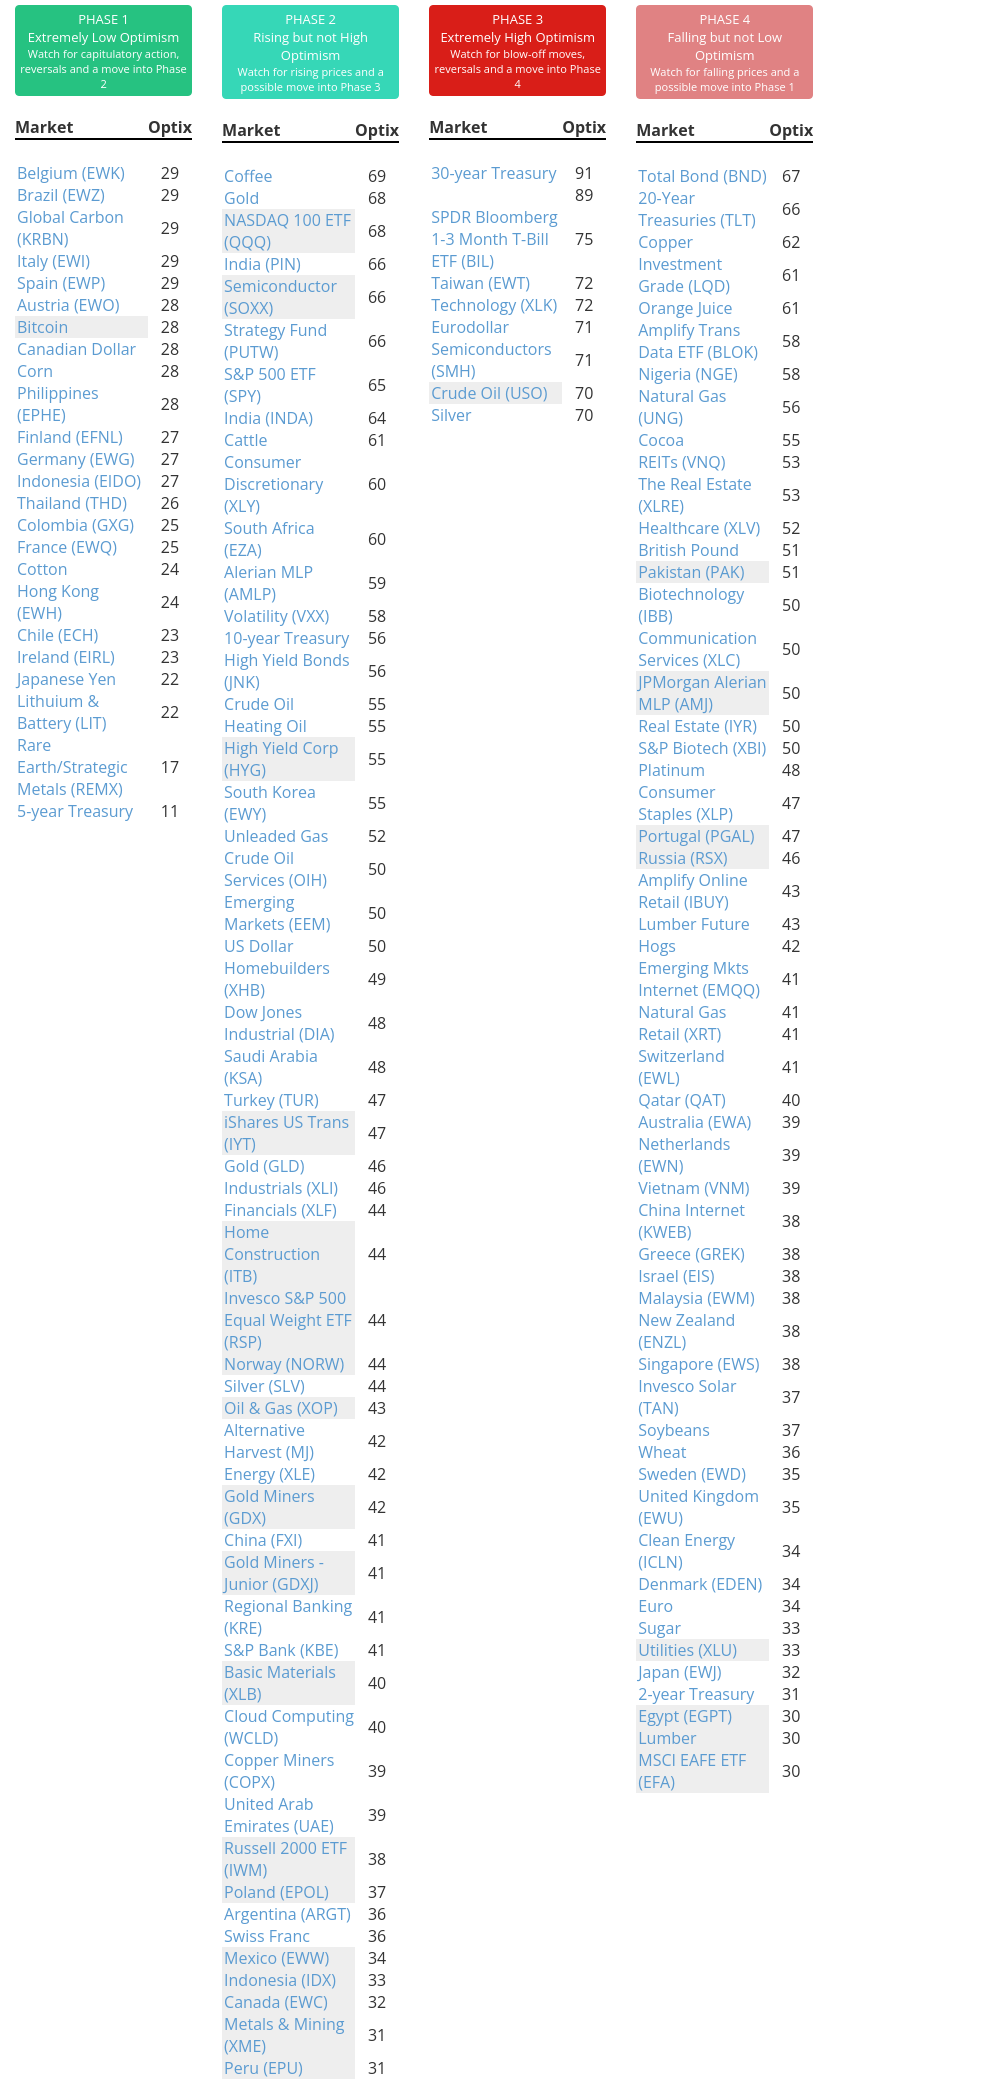
Phase Table
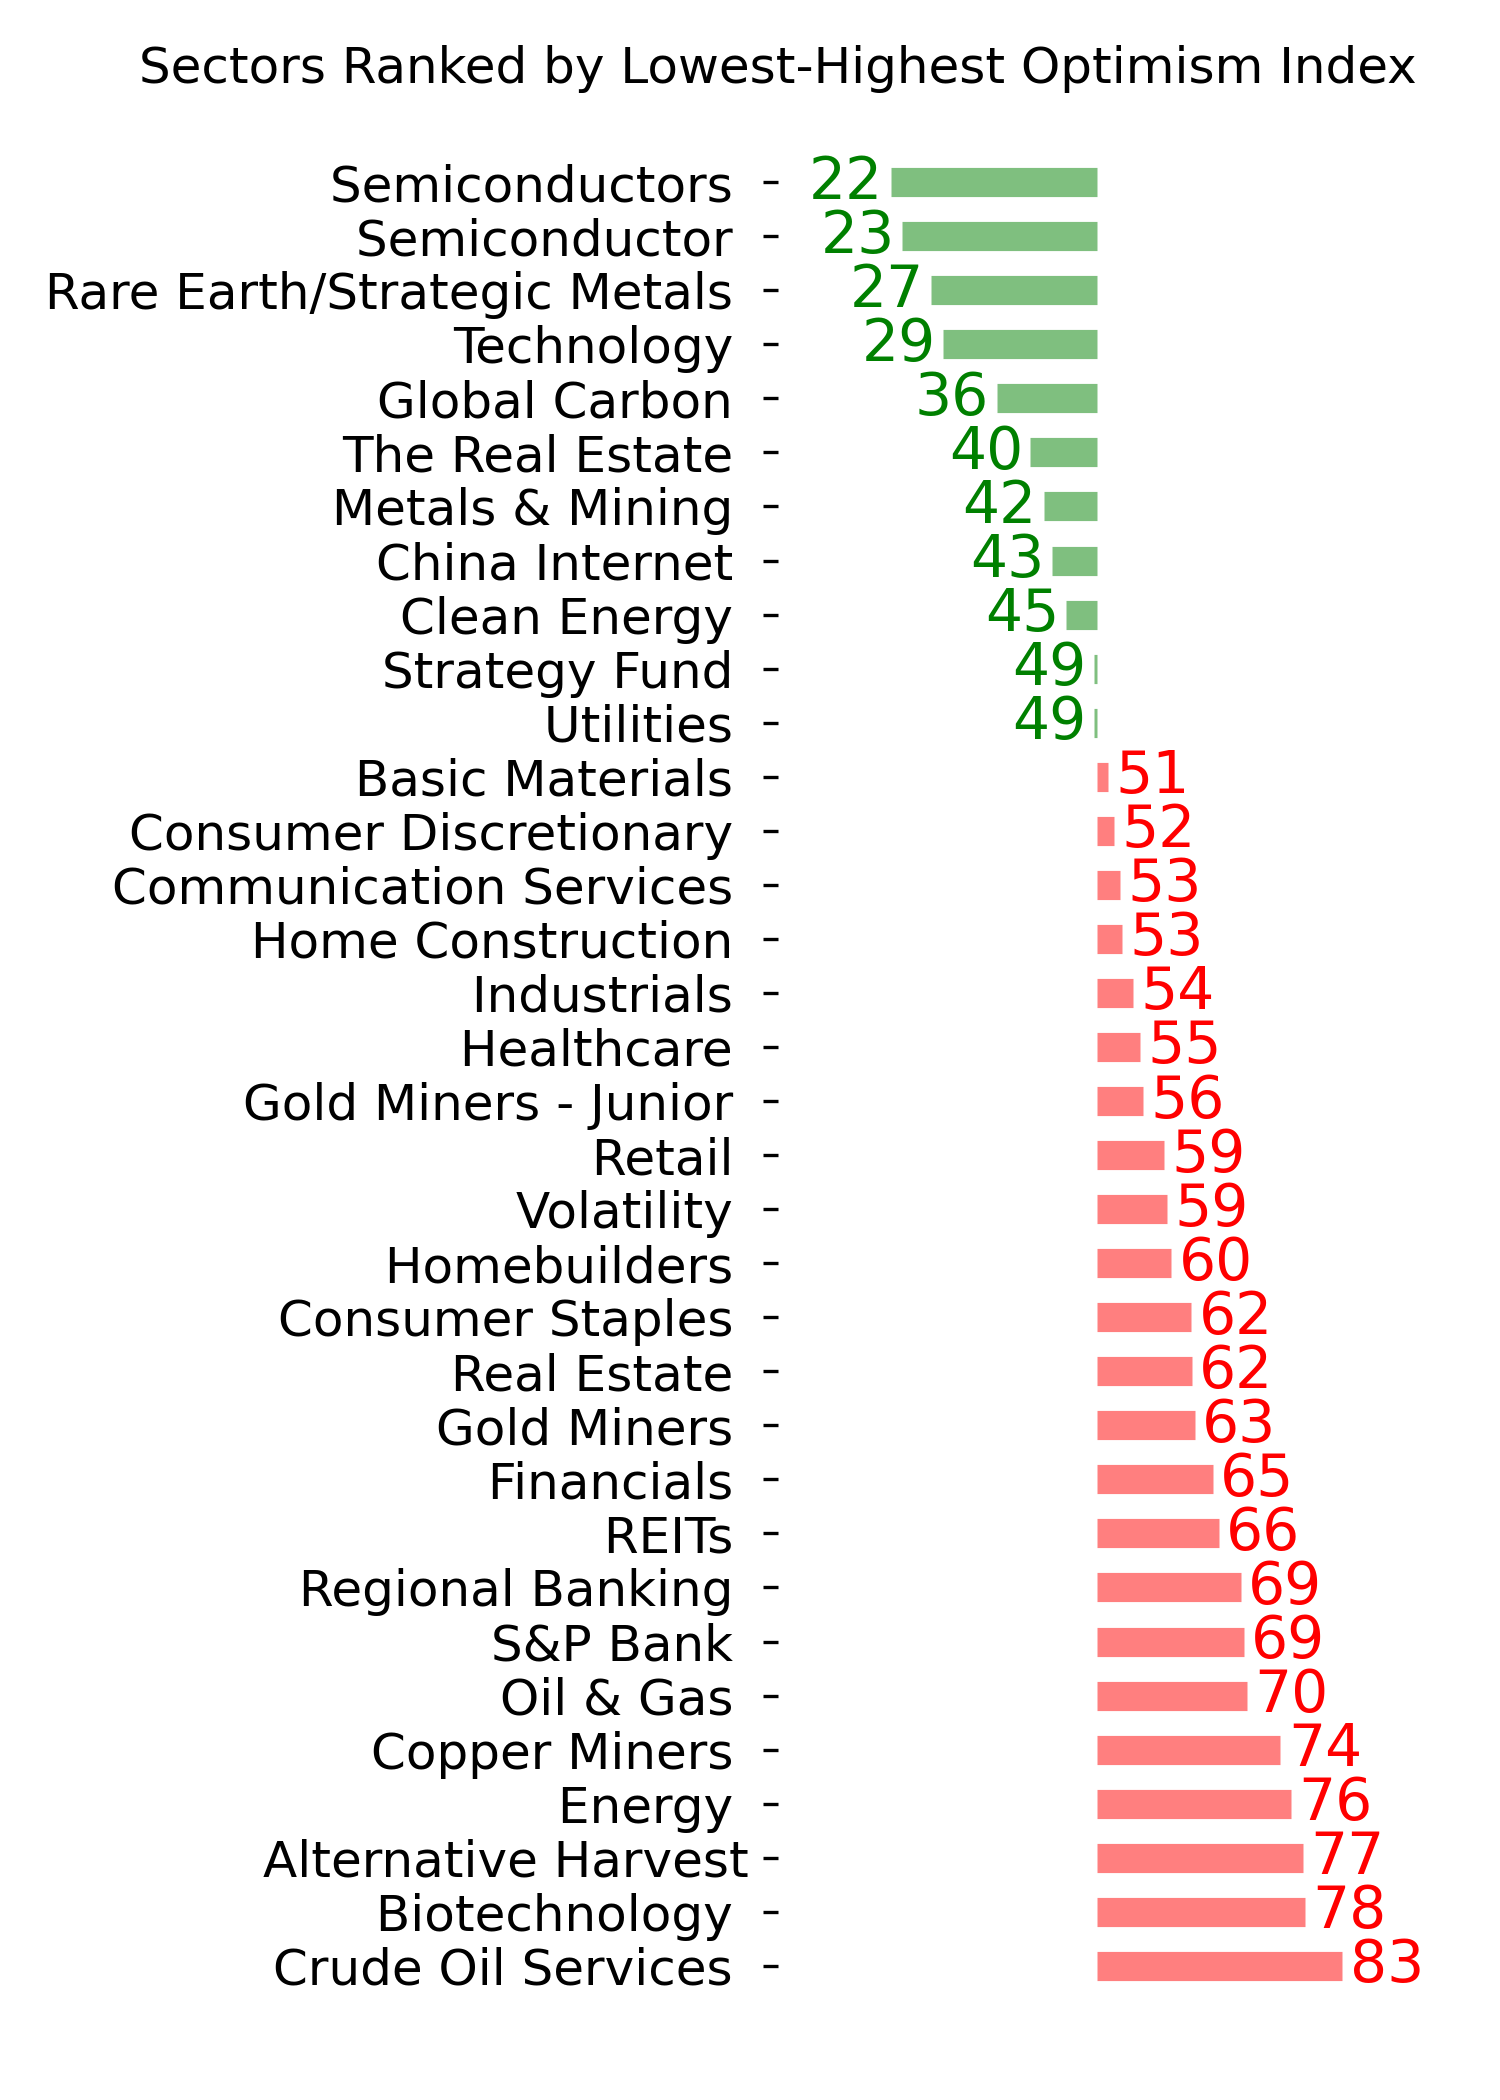
Ranks
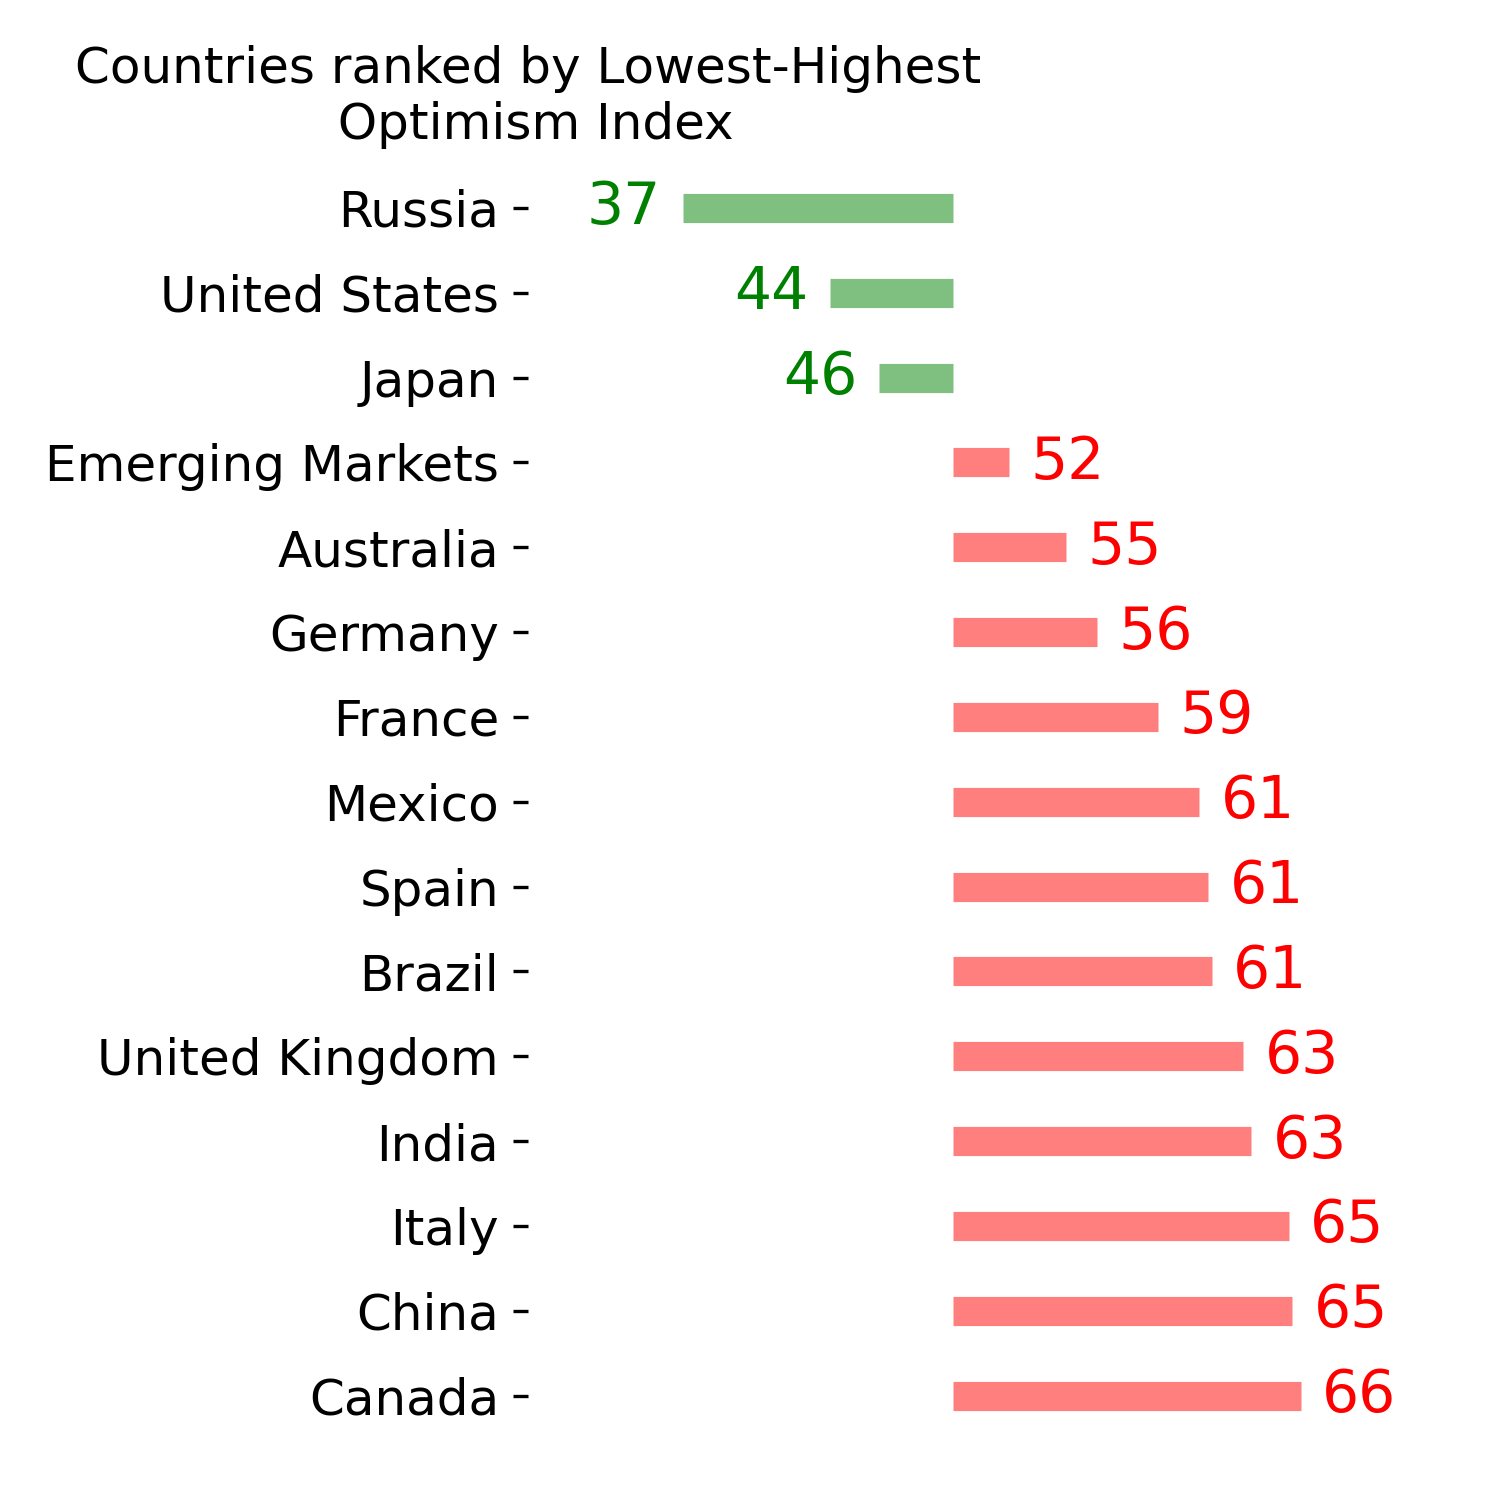
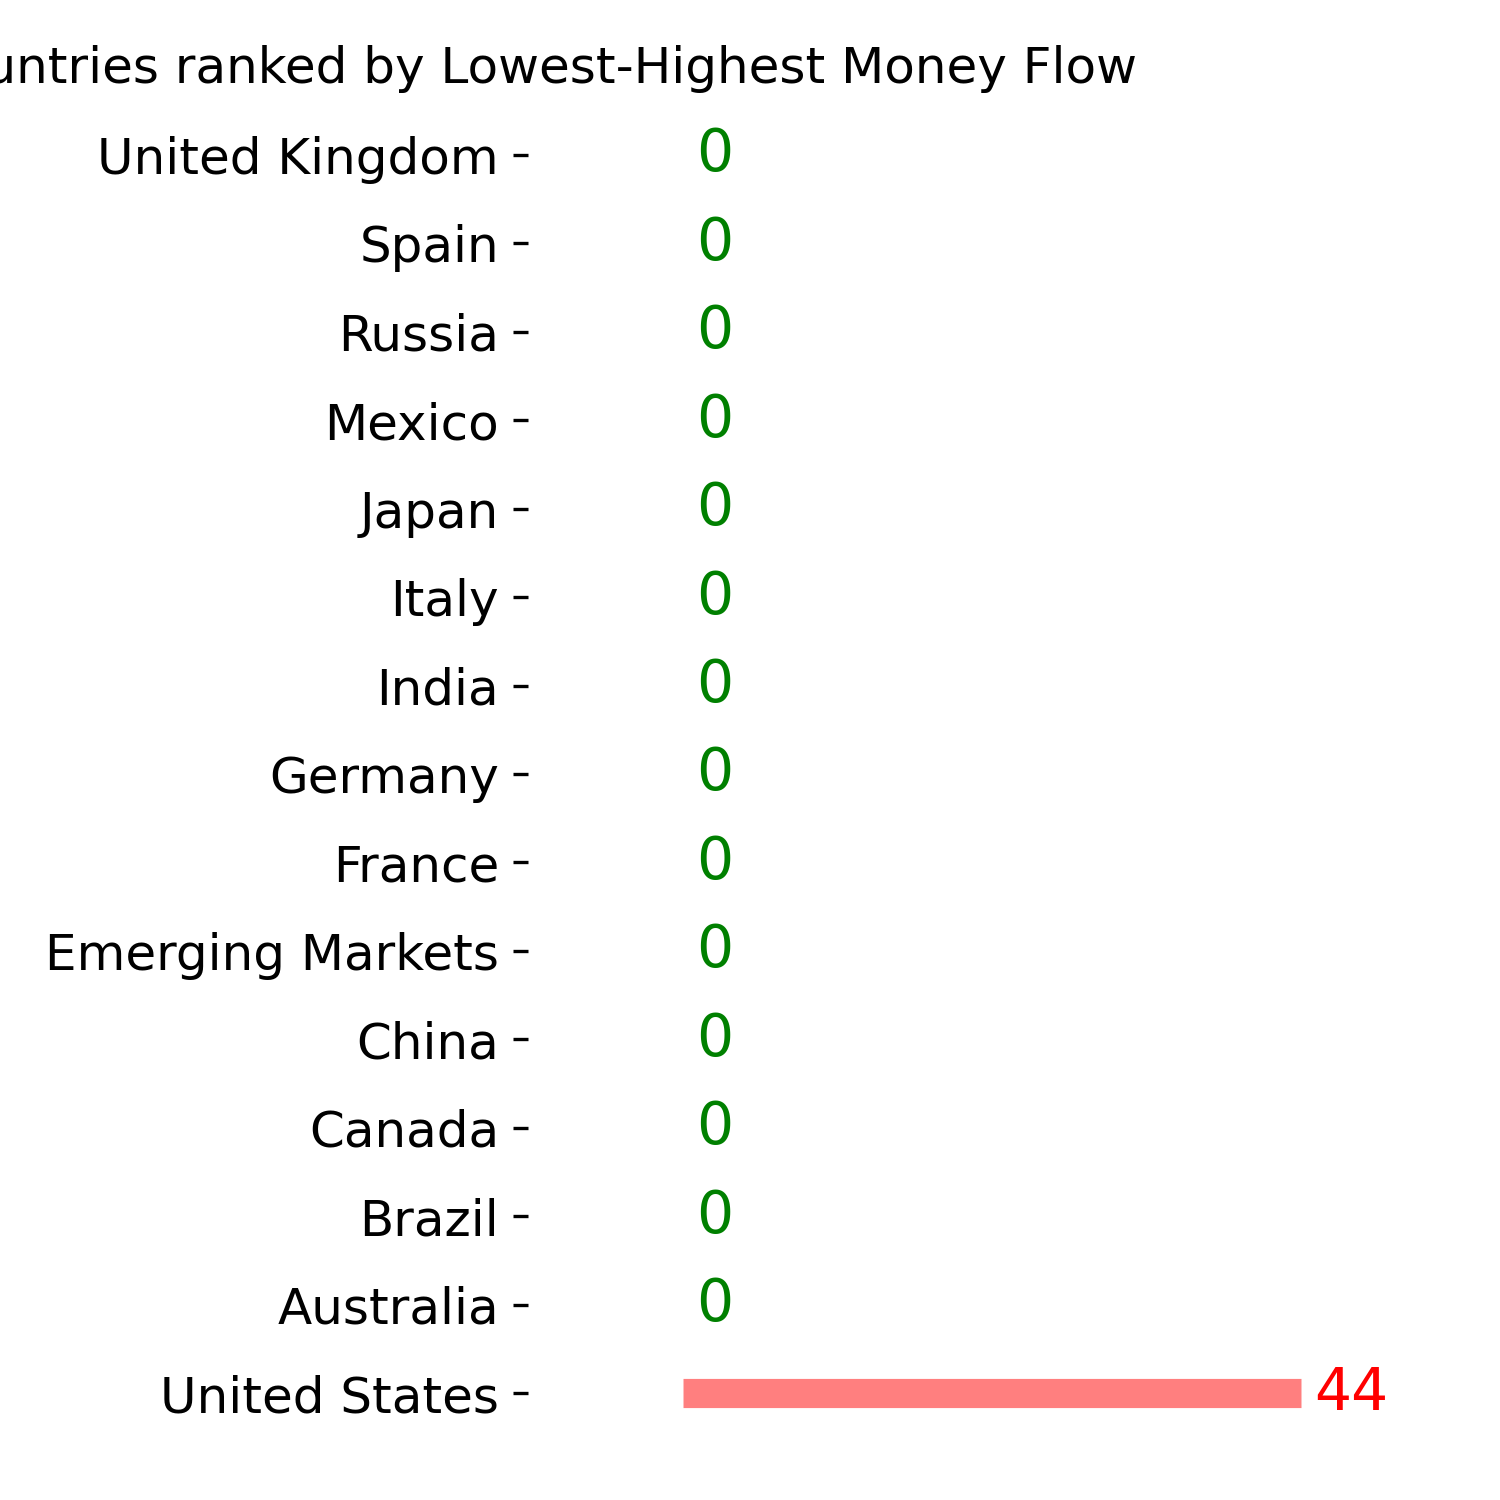
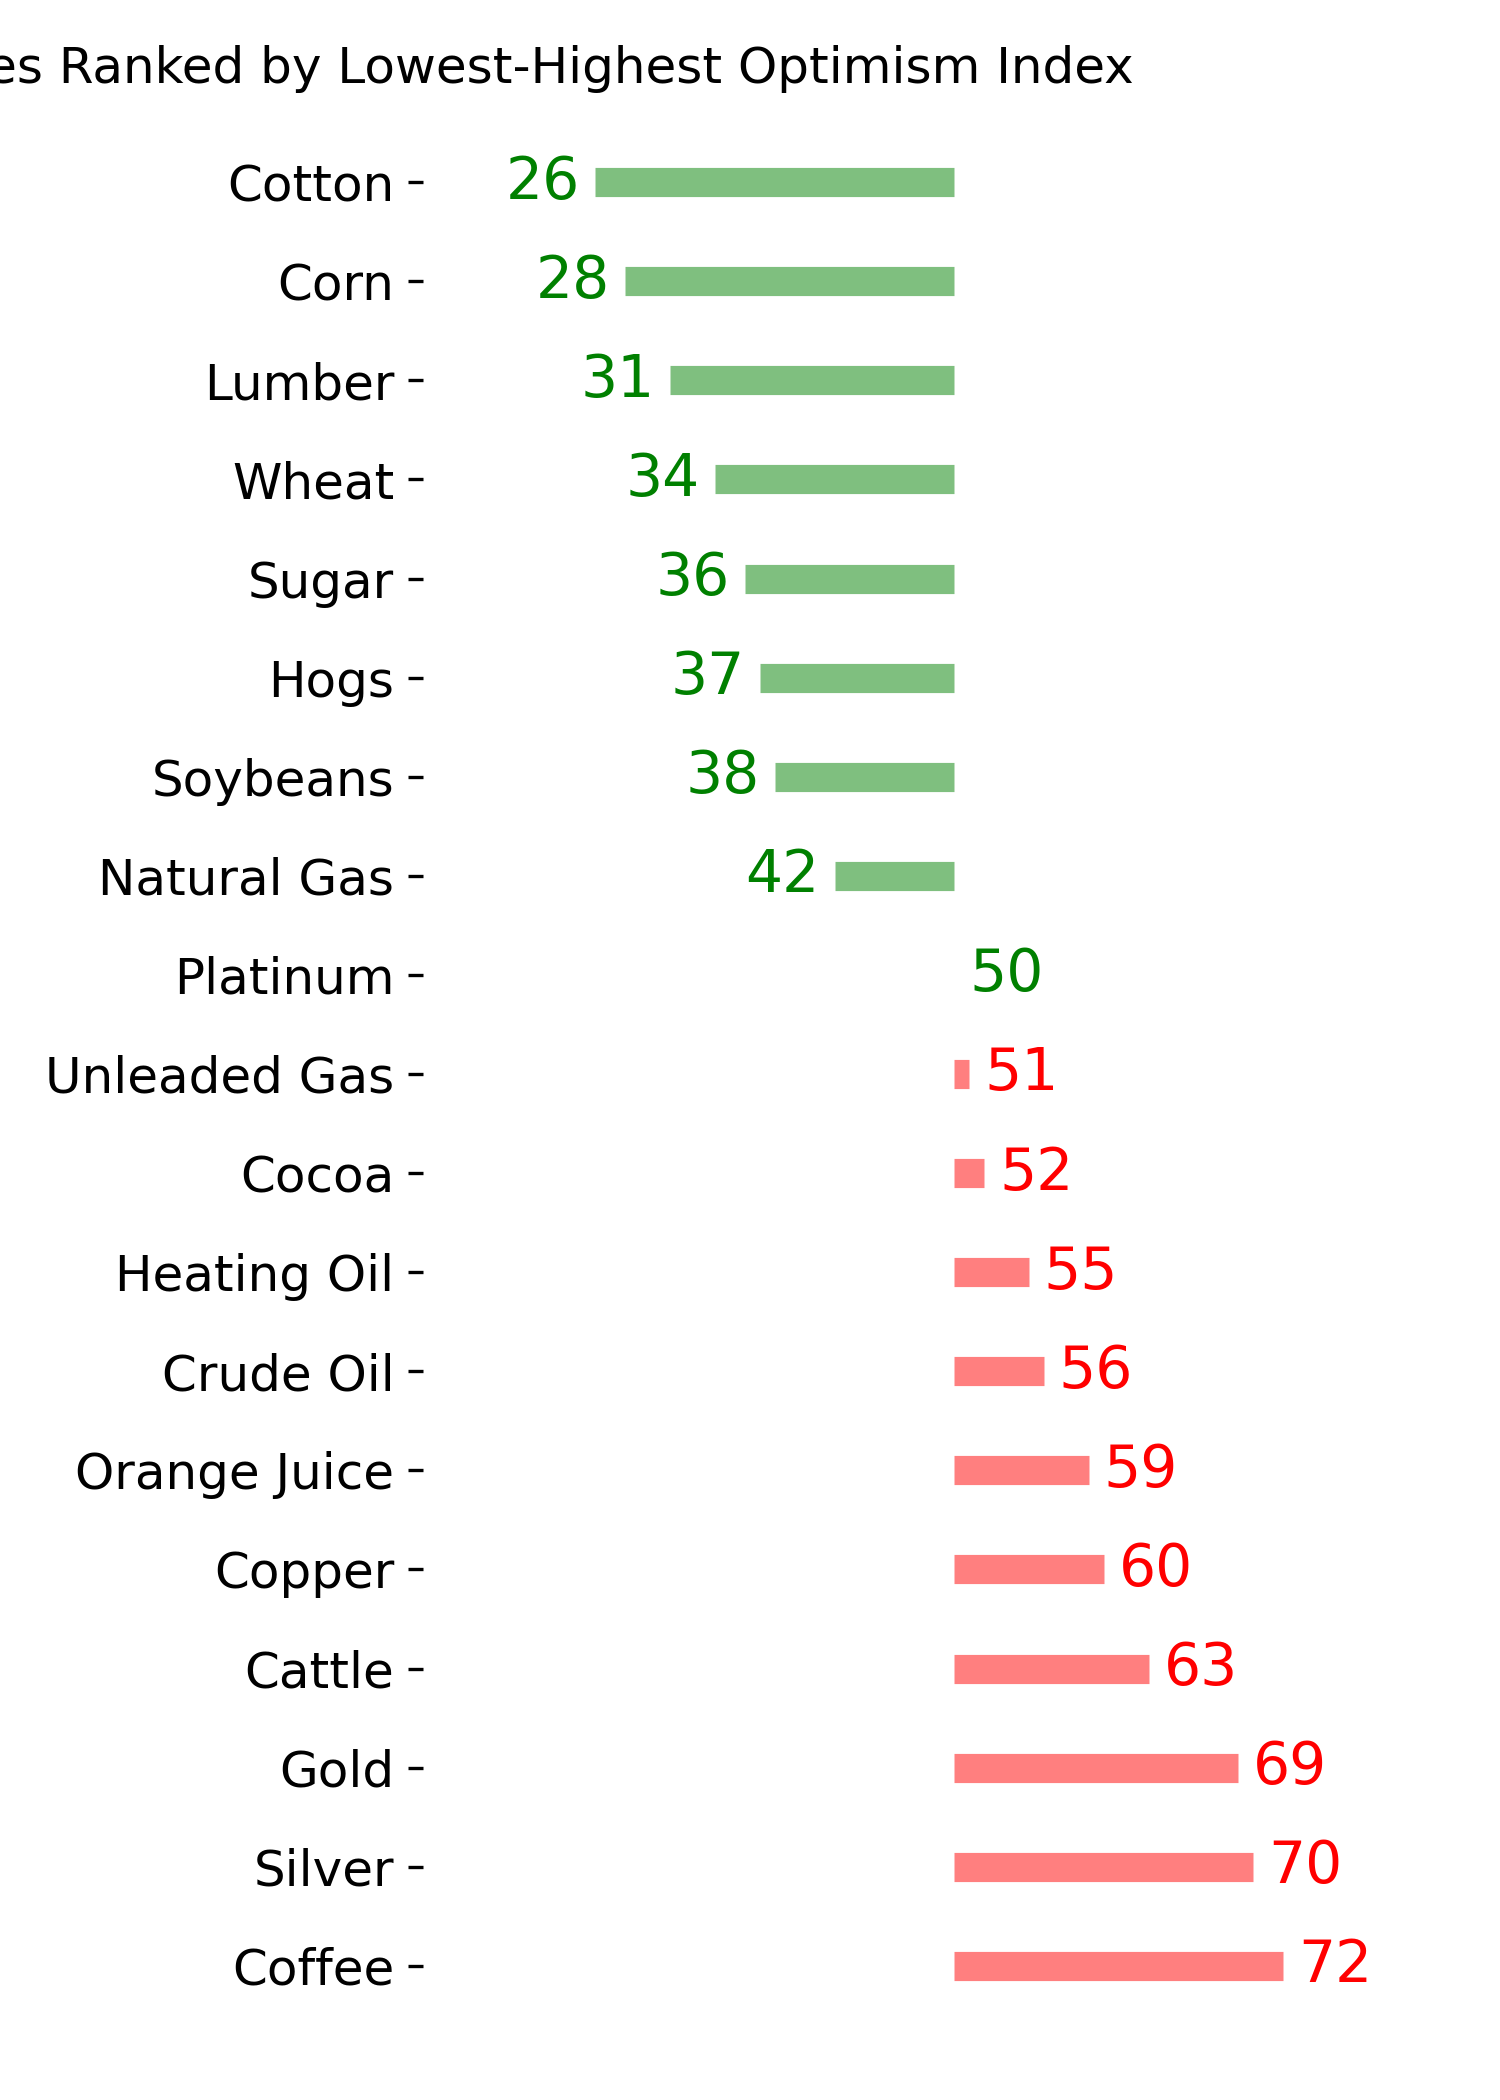
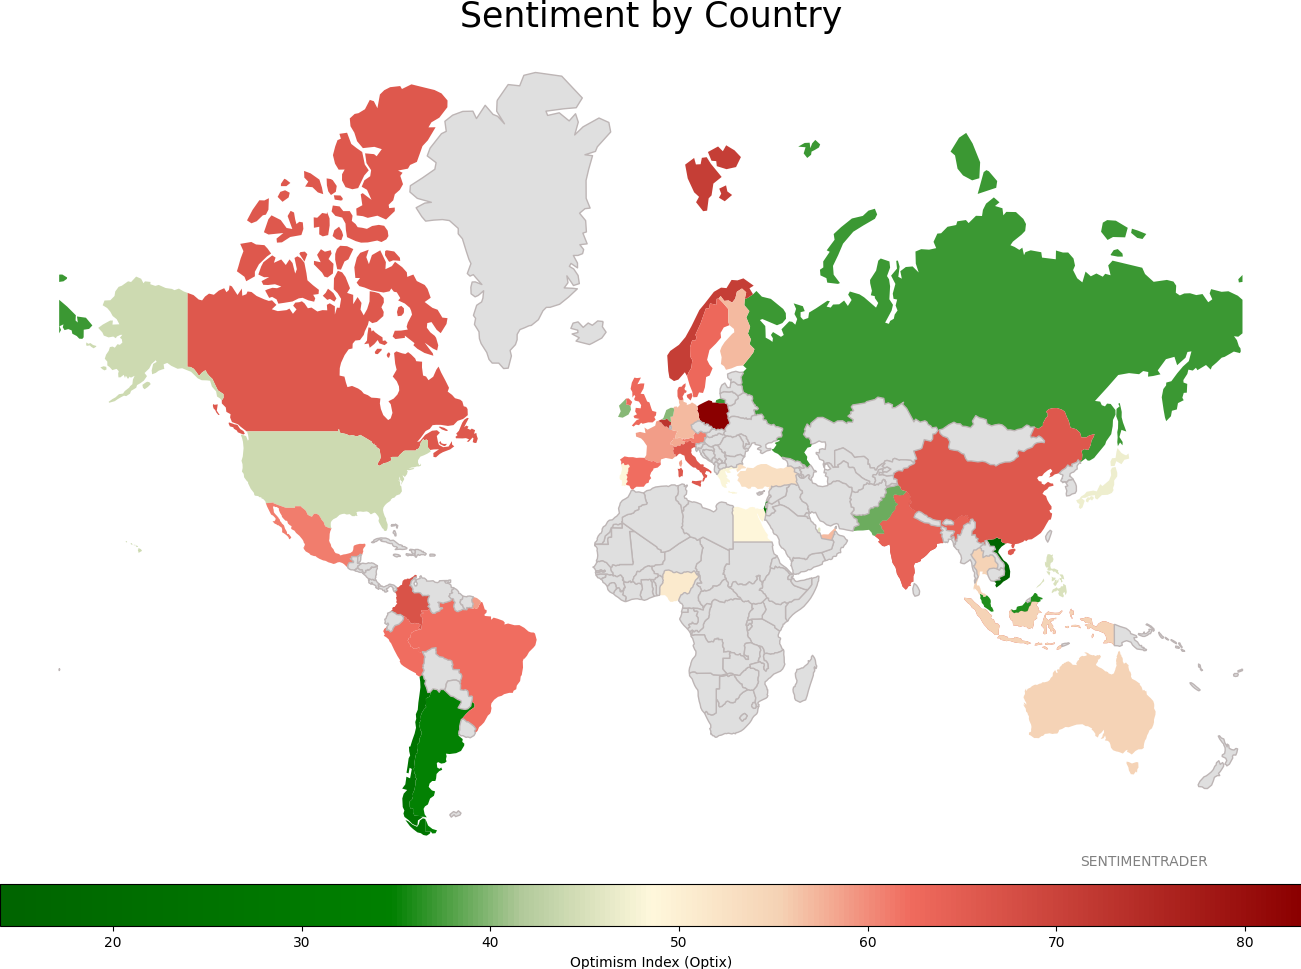
Sentiment Around The World
Optimism Index Thumbnails
|
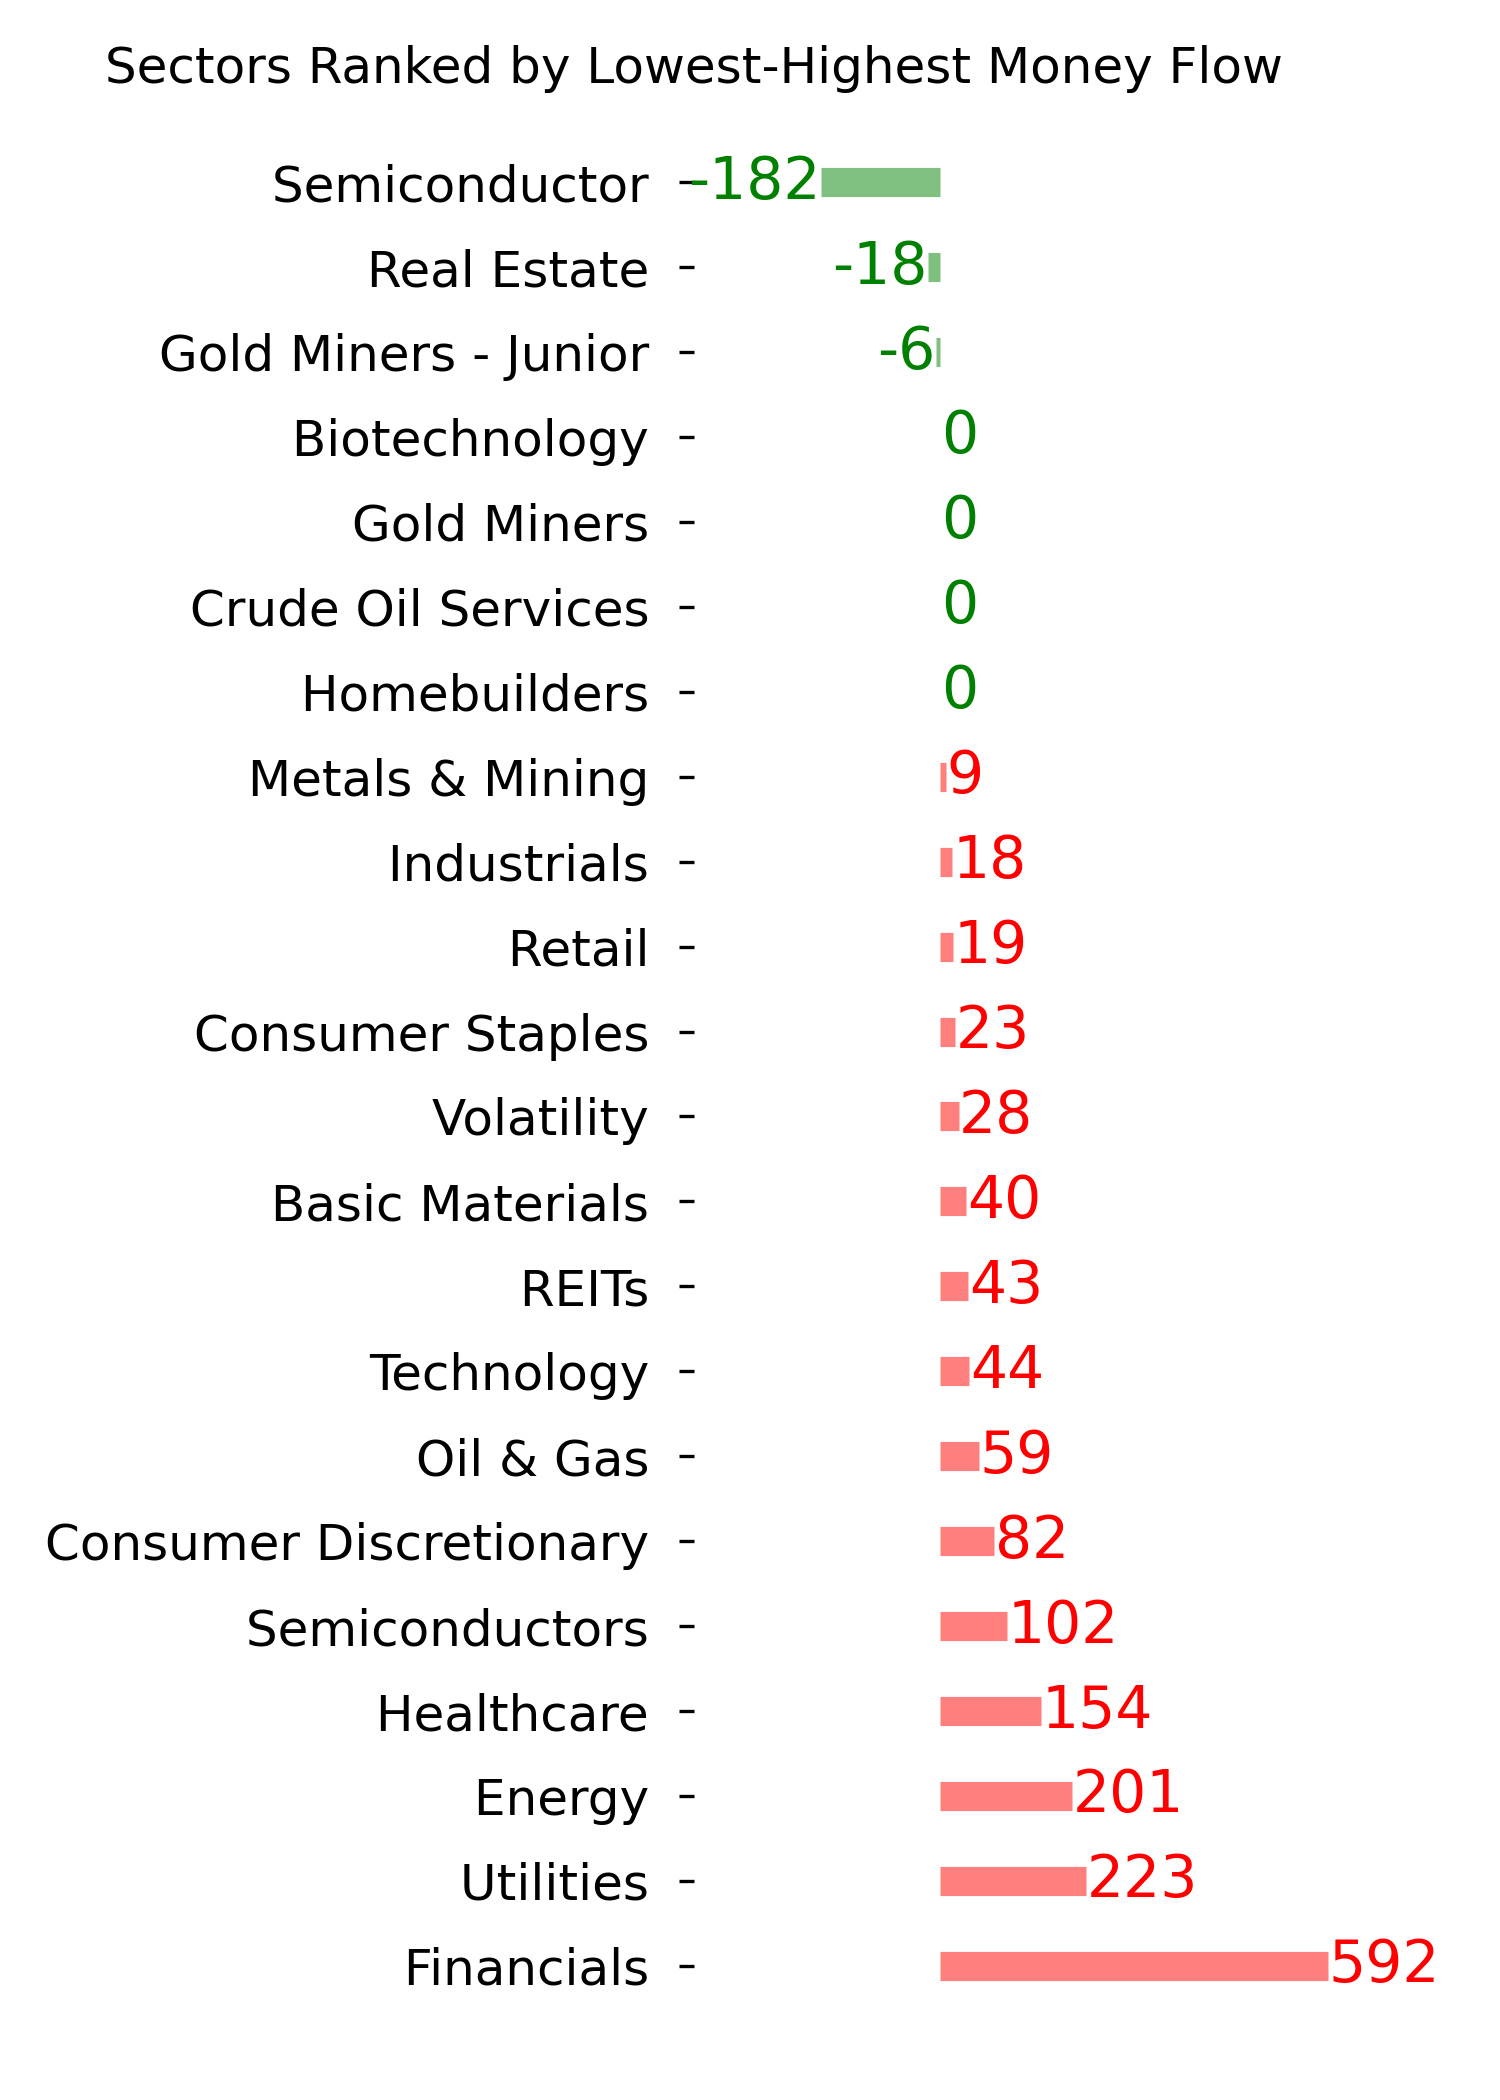
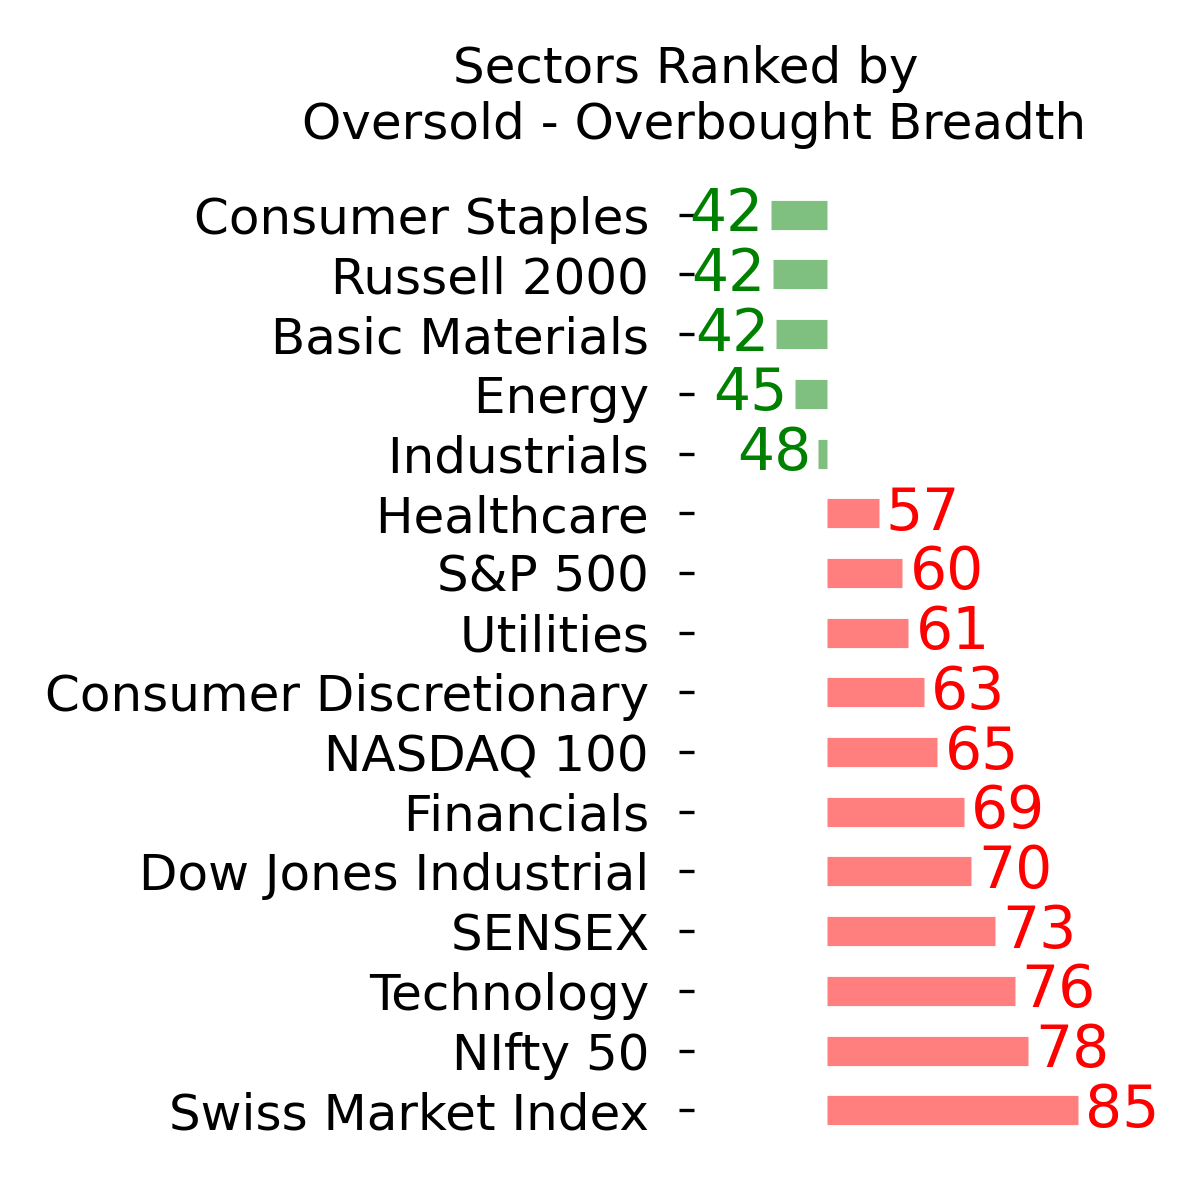
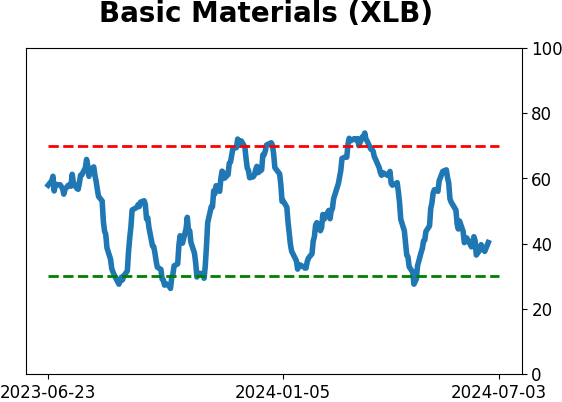
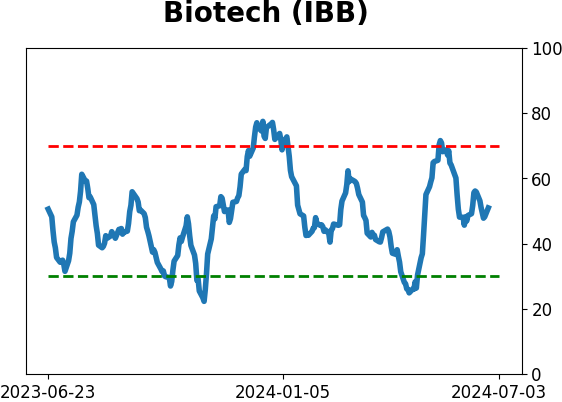
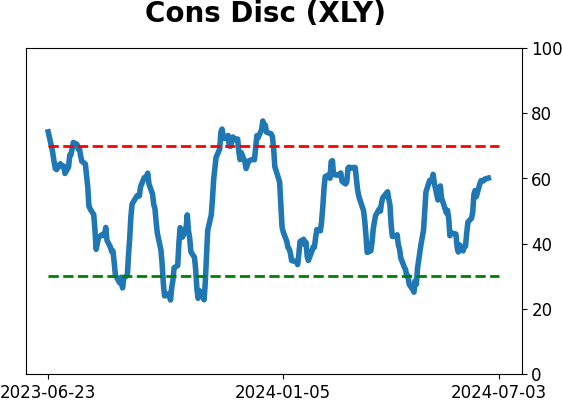
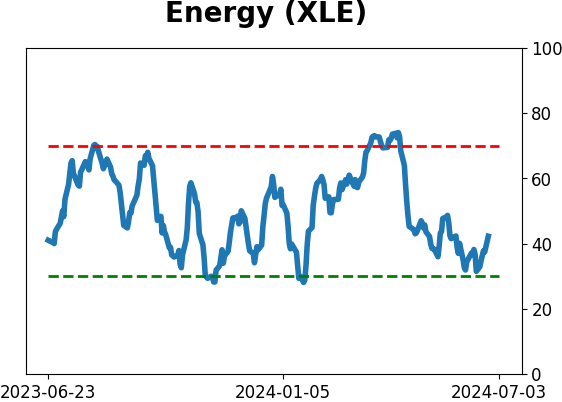
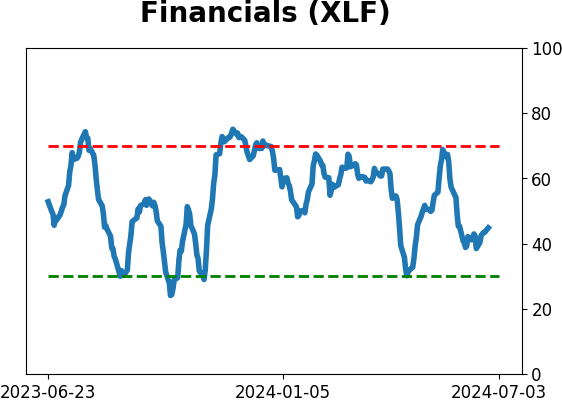
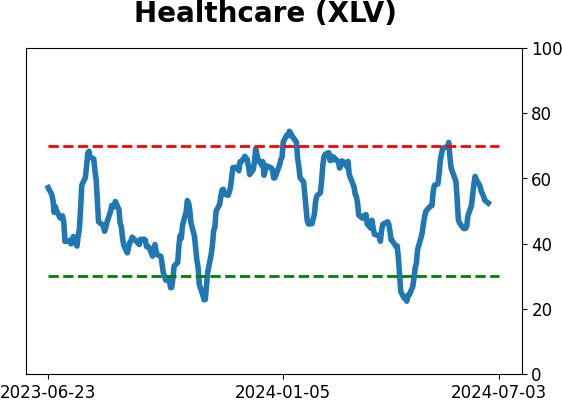
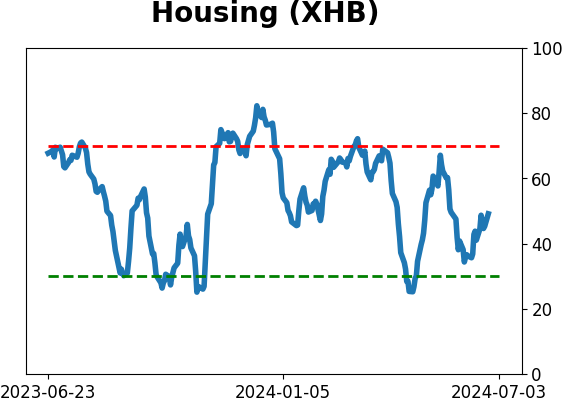
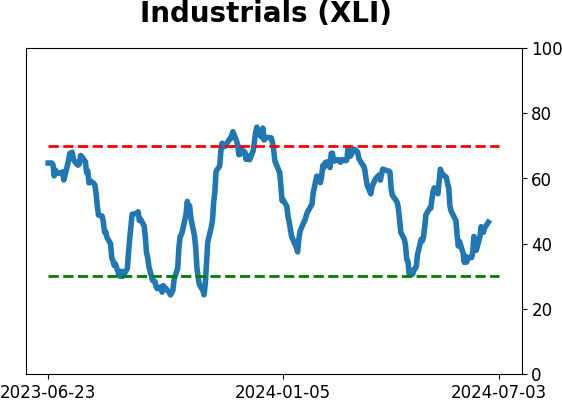
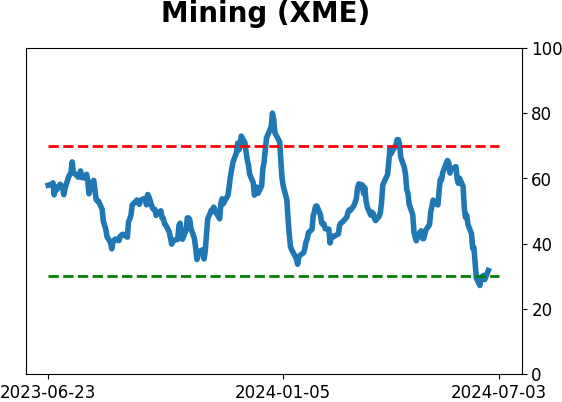
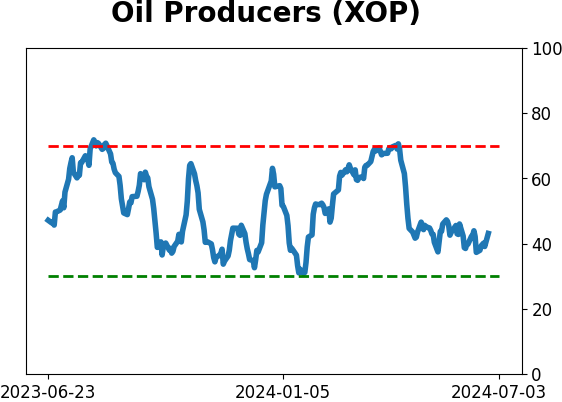
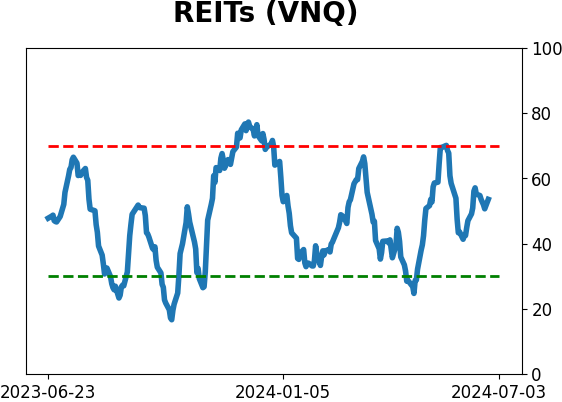
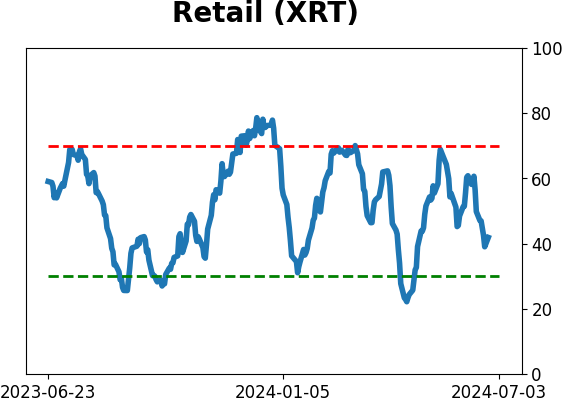
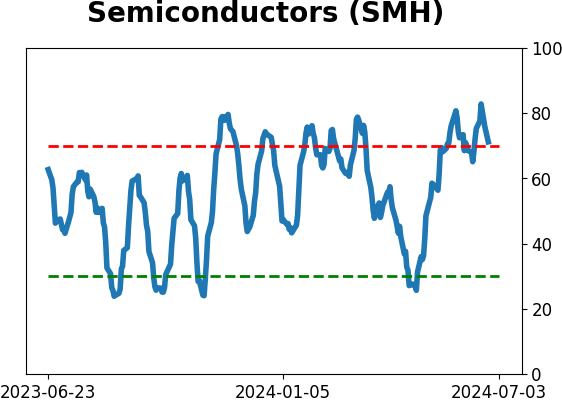
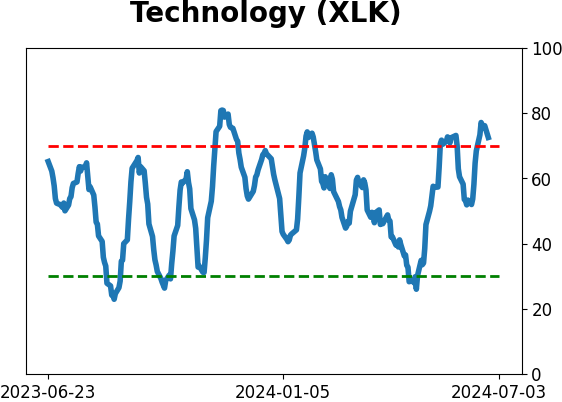
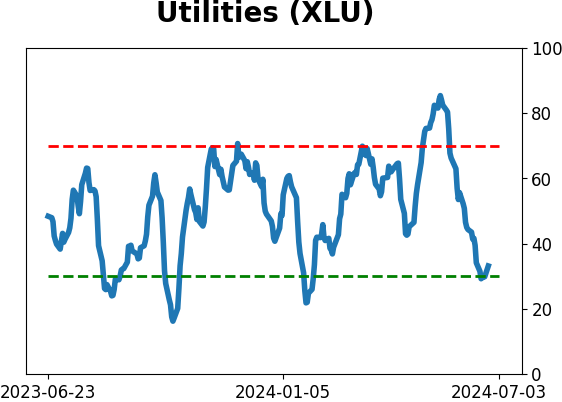
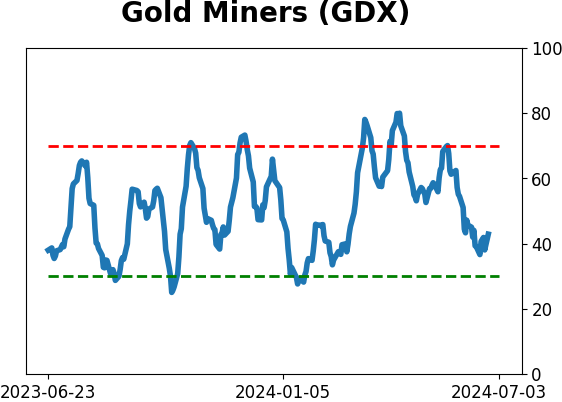
Sector ETF's - 10-Day Moving Average
|
|
|
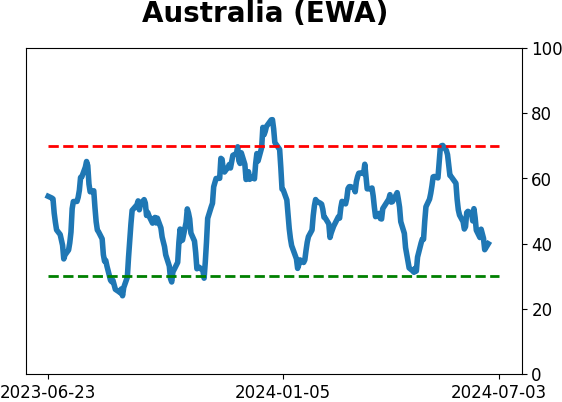
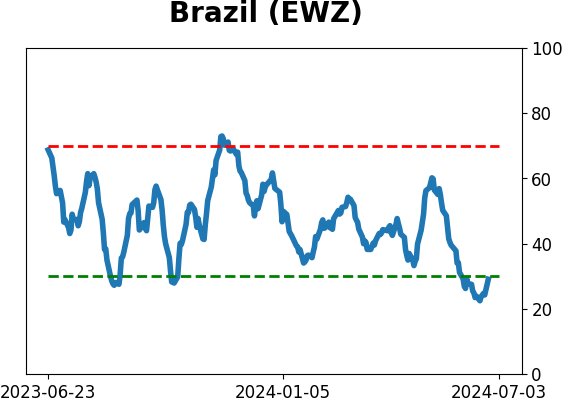
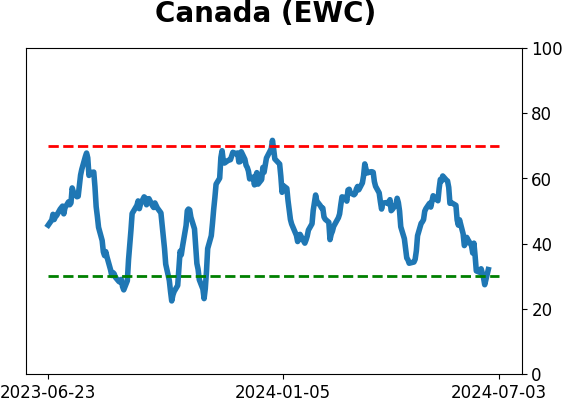
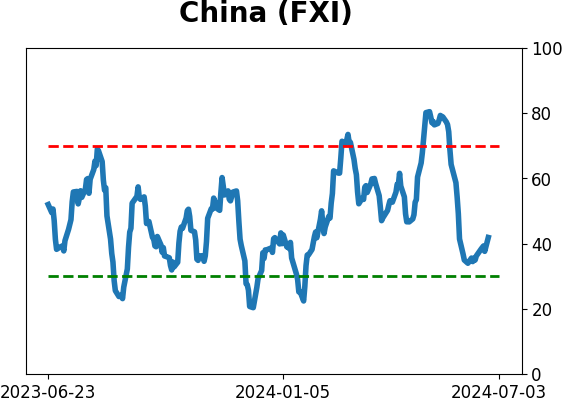
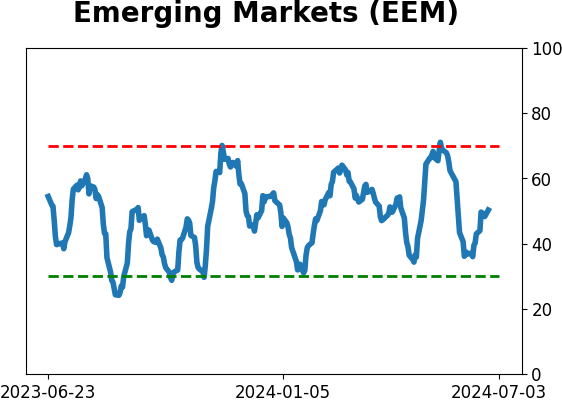
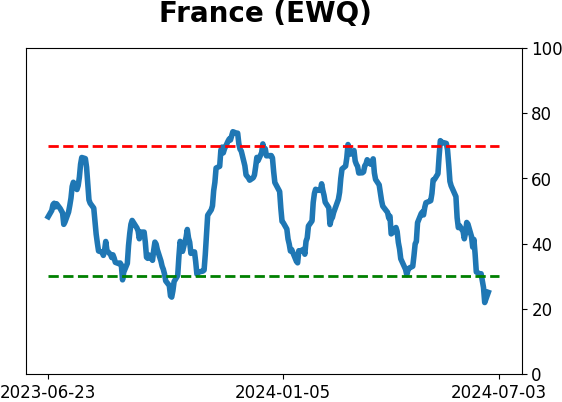
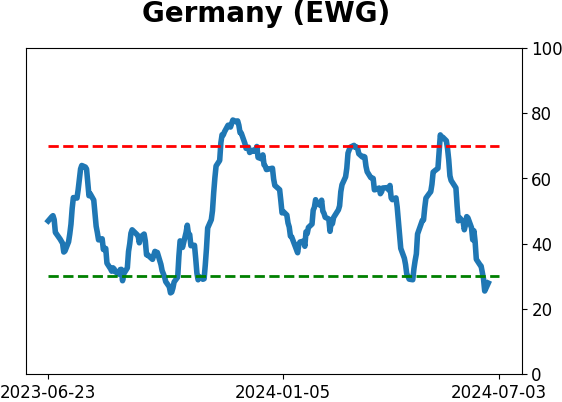
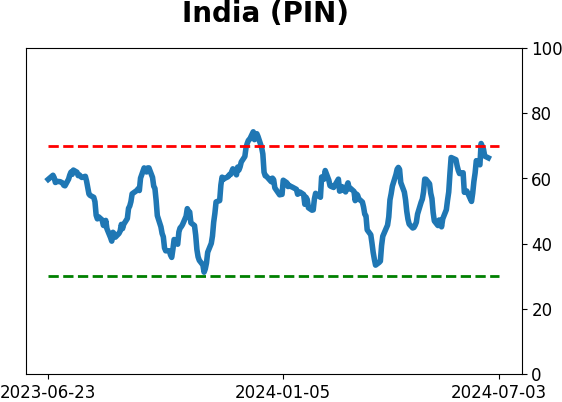
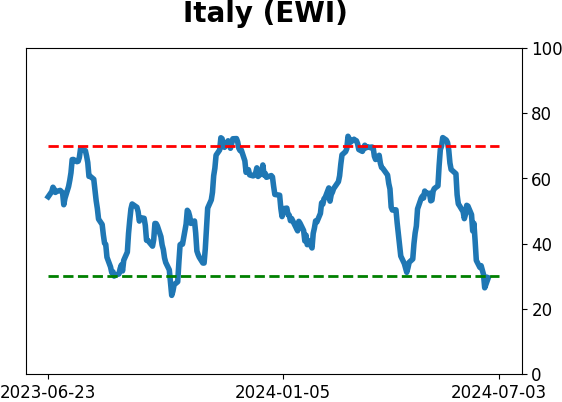
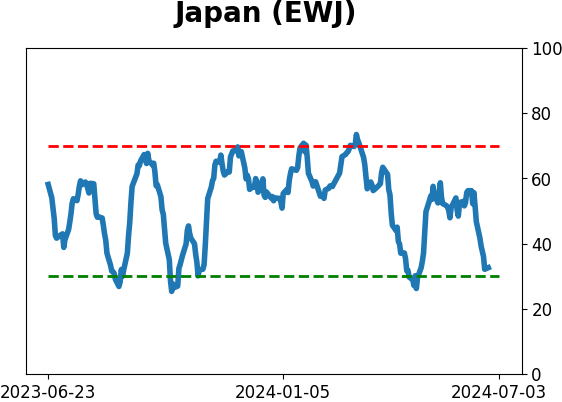
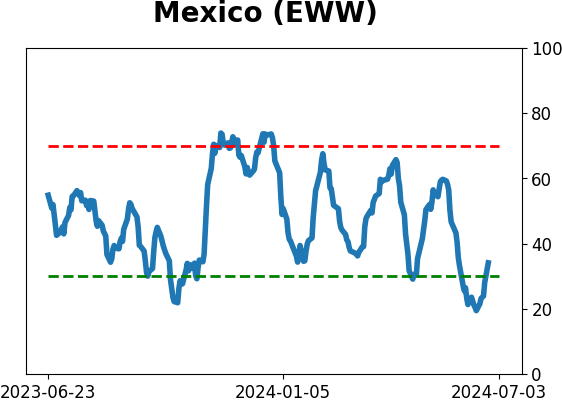
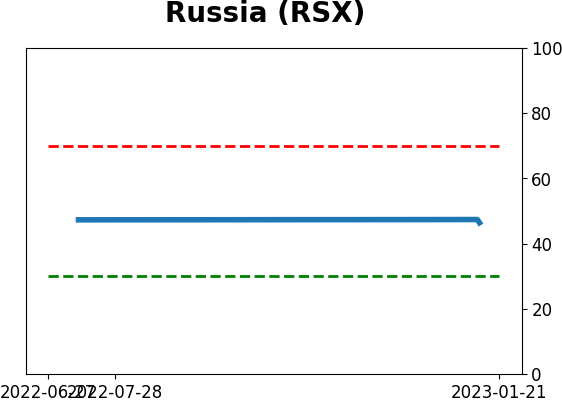
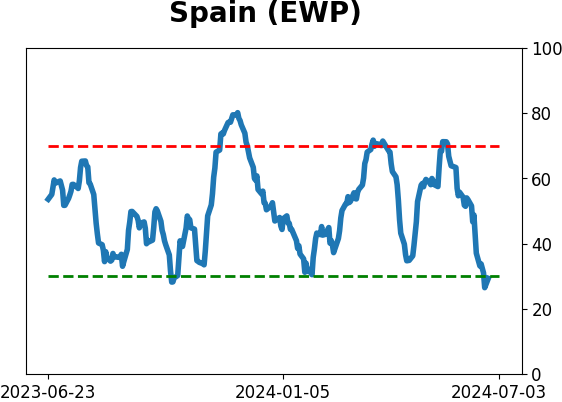
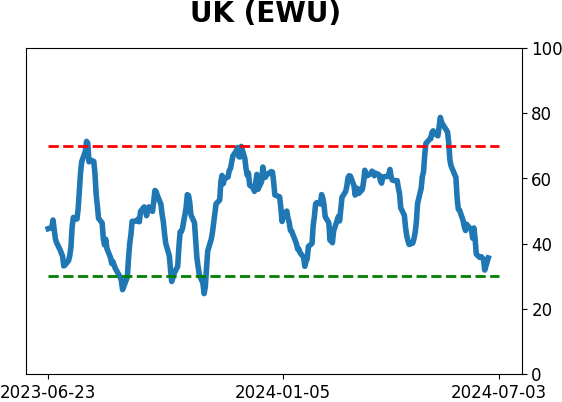
Country ETF's - 10-Day Moving Average
|
|
|
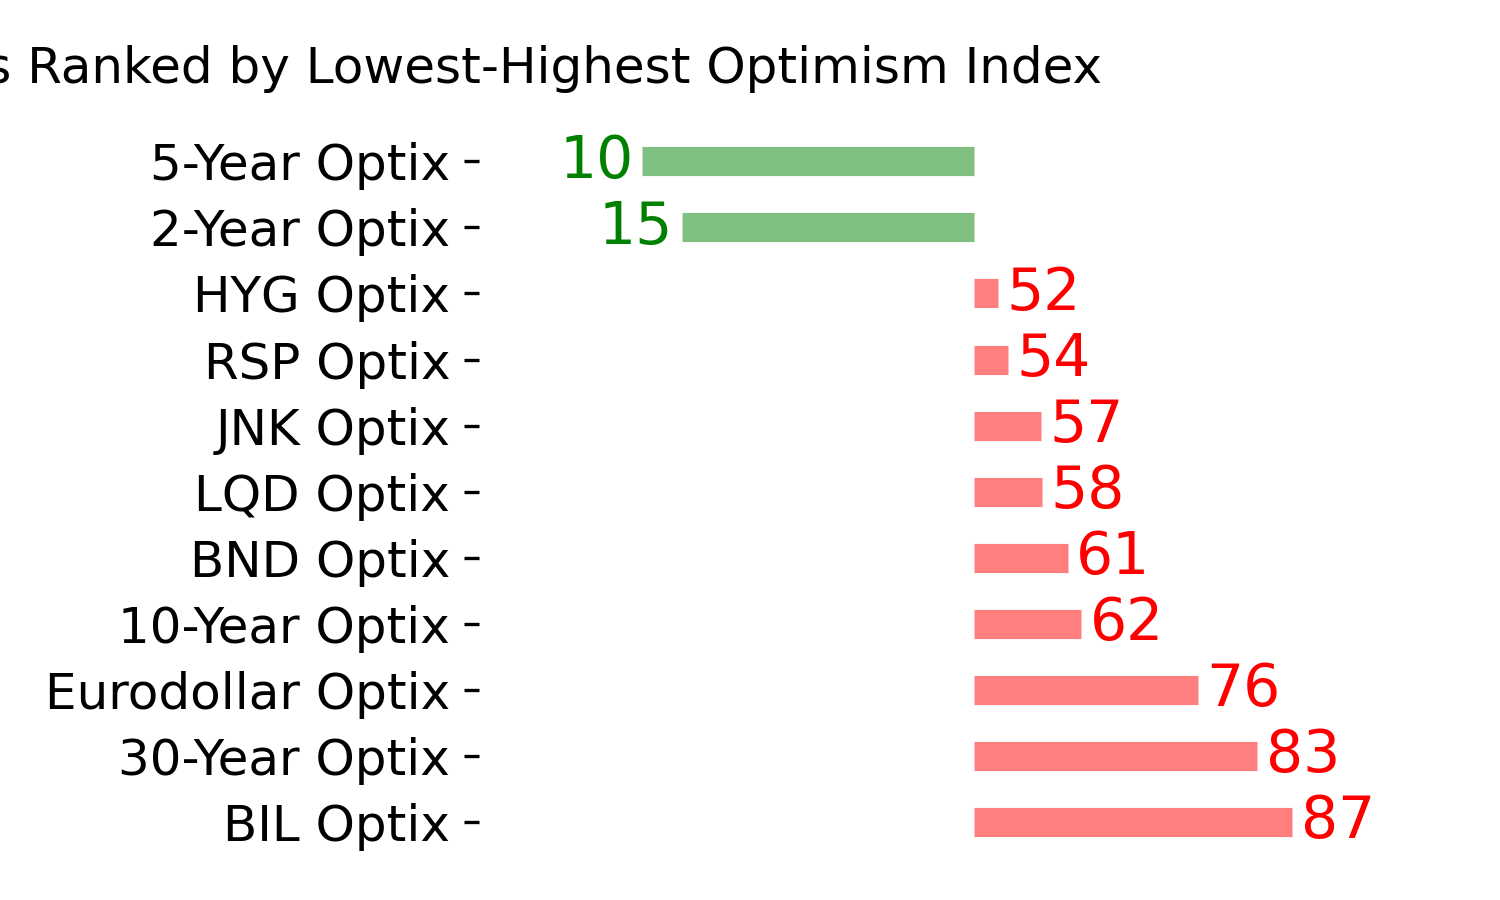
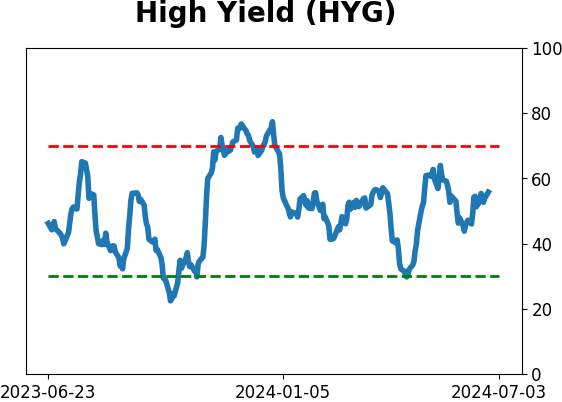
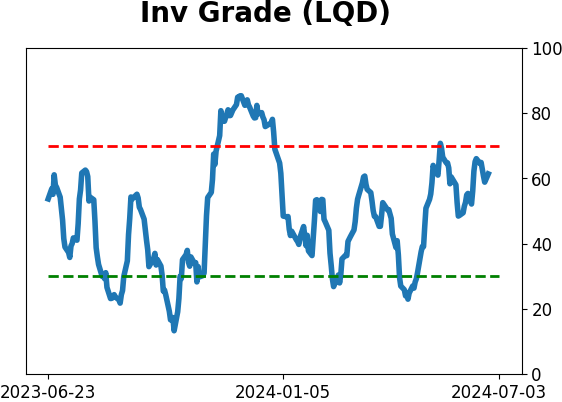
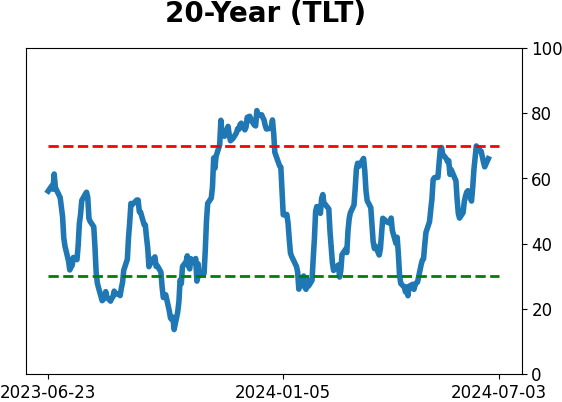
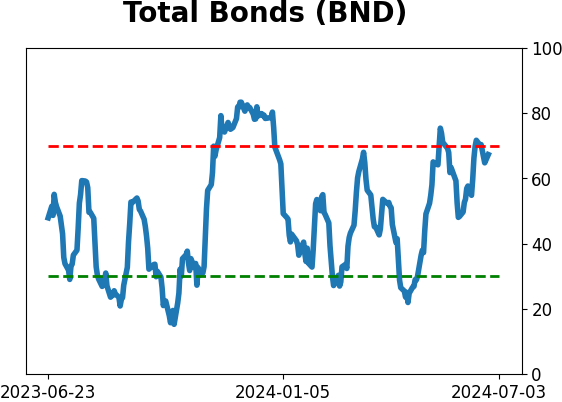
Bond ETF's - 10-Day Moving Average
|
|
|
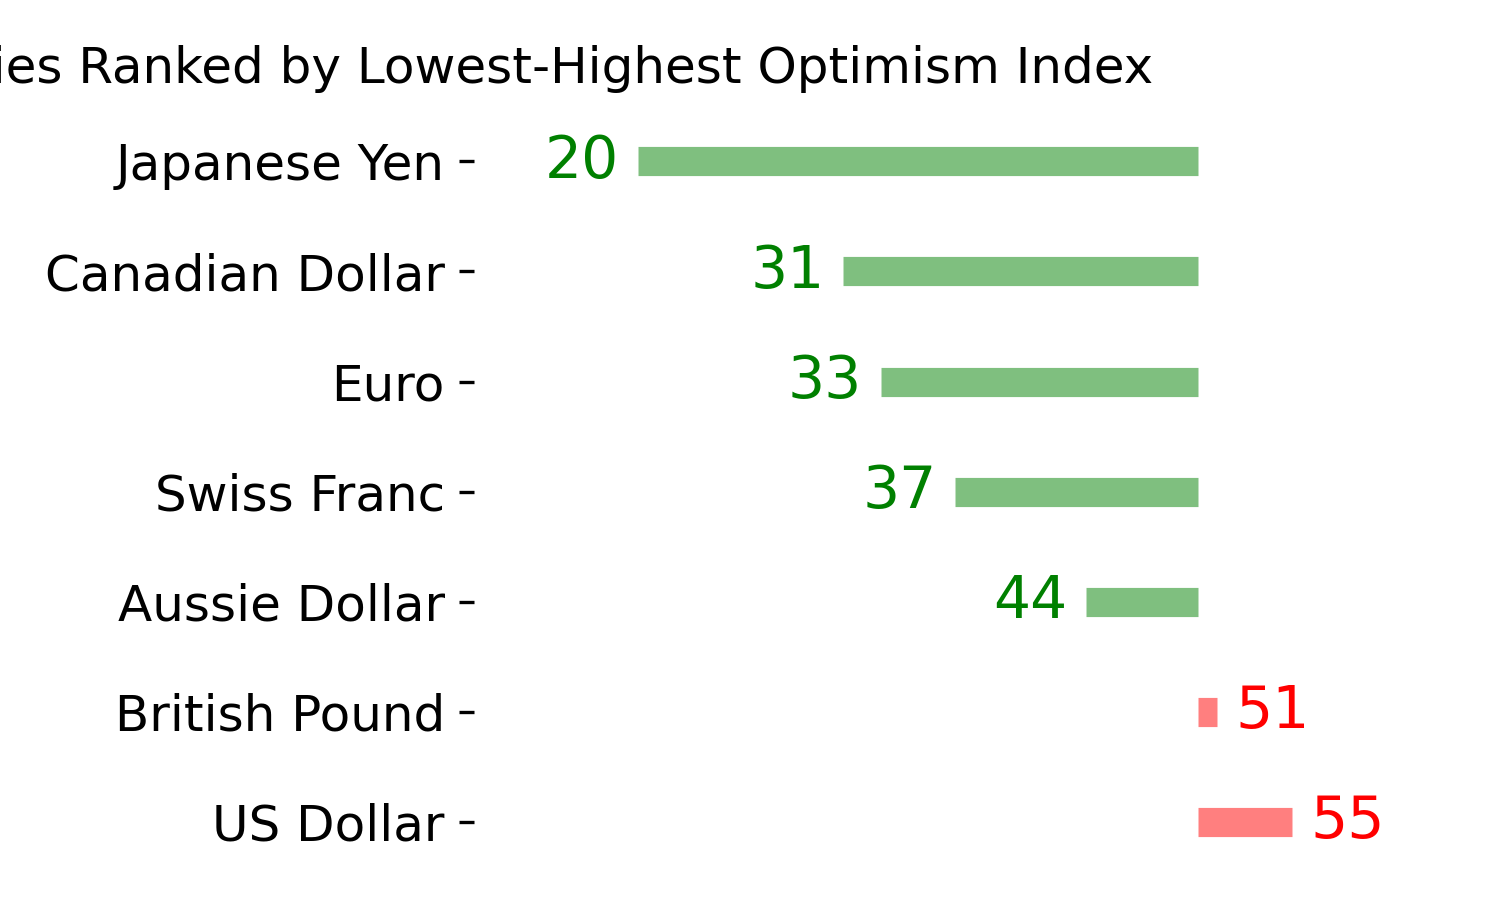
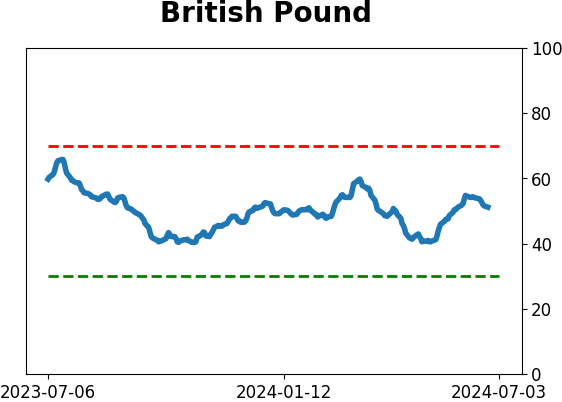
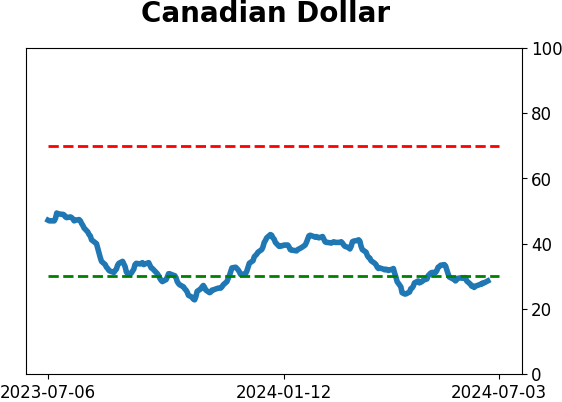
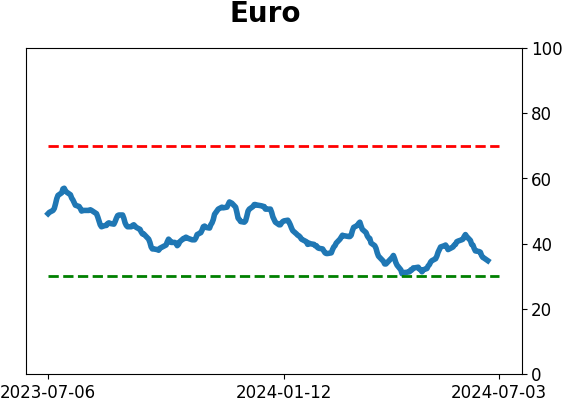
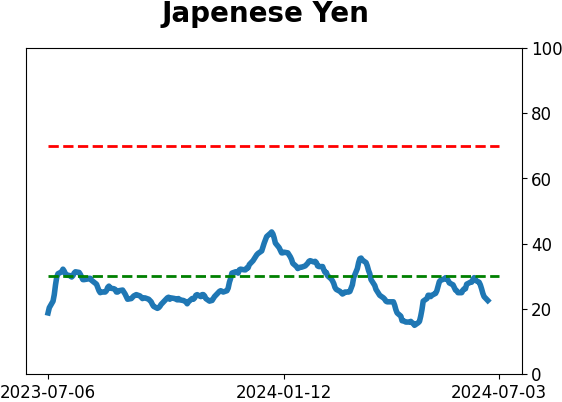
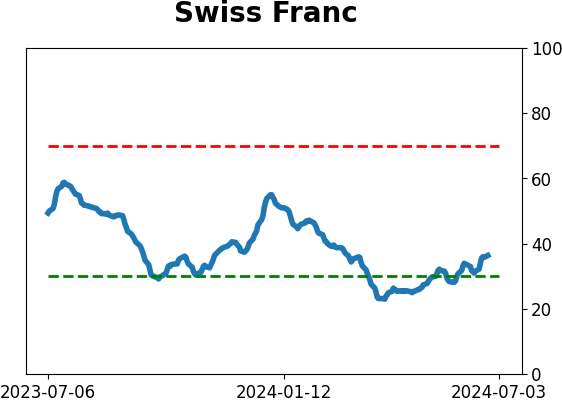
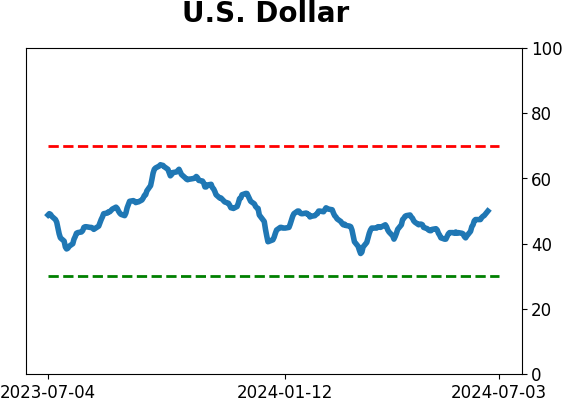
Currency ETF's - 5-Day Moving Average
|
|
|
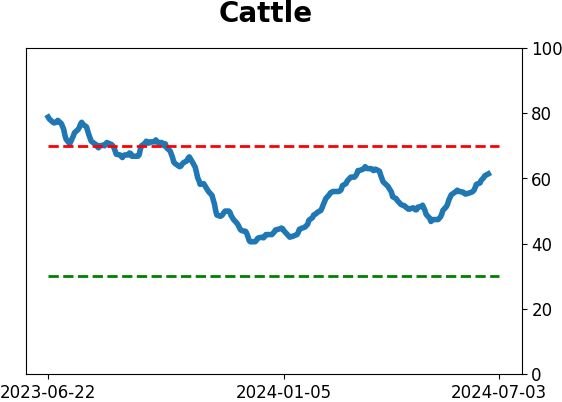
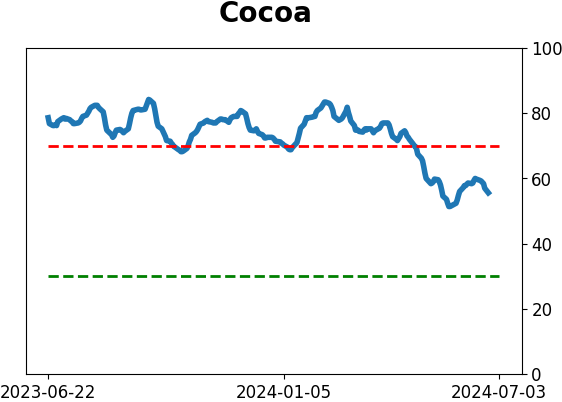
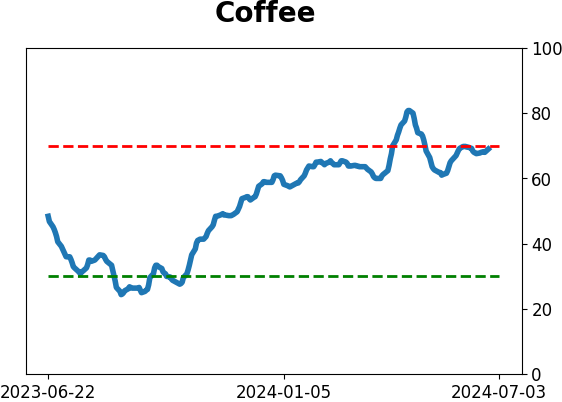
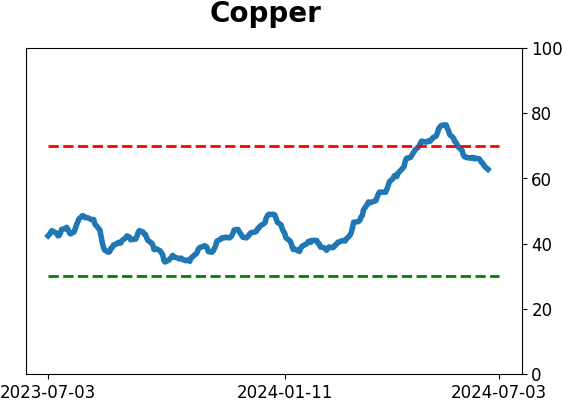
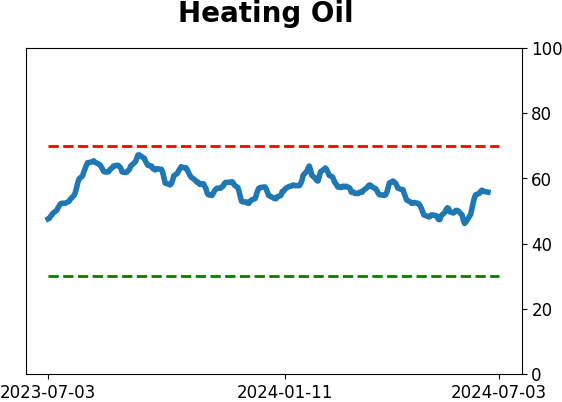
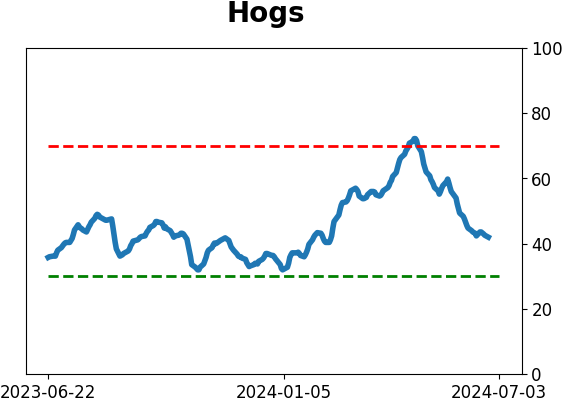
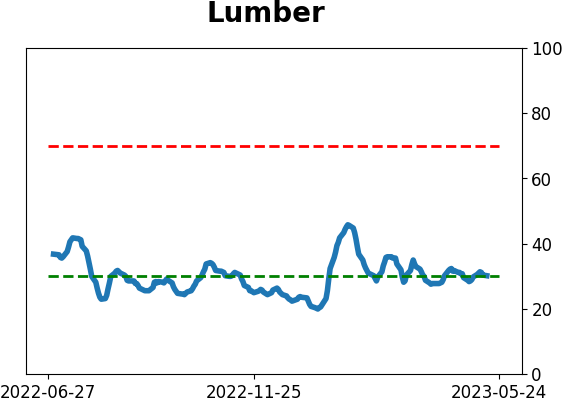
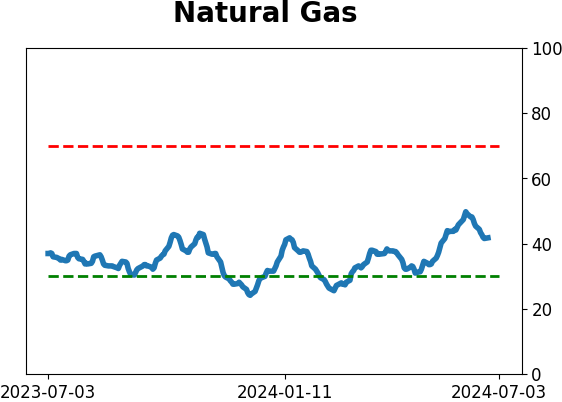
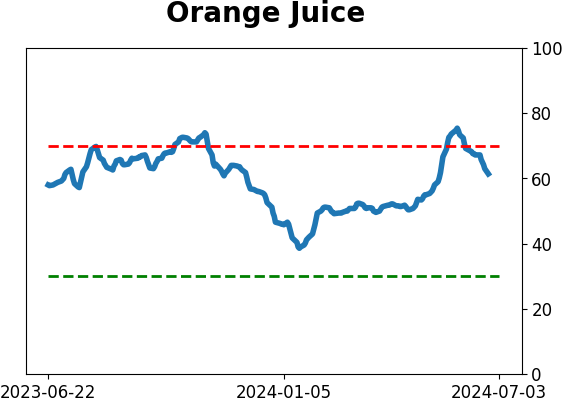
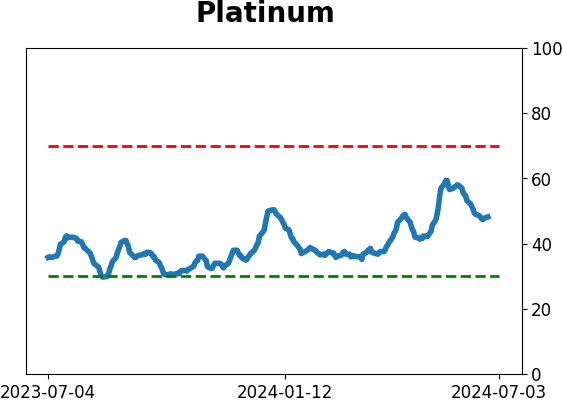
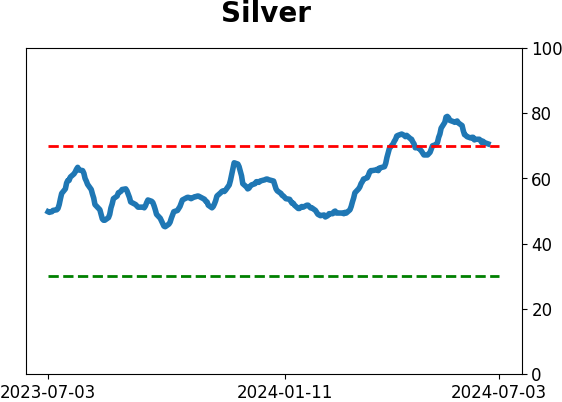
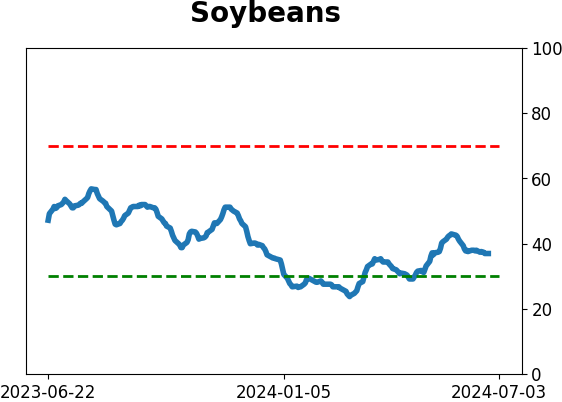
Commodity ETF's - 5-Day Moving Average
|
|