Daily Report : TradingEdge Weekly for Jun 24 - A lifting of extreme pessimism, commodity reversals, energy sell-off

| View/Print a PDF version of this Report |
Headlines
|
TradingEdge Weekly for Jun 24 - A lifting of extreme pessimism, commodity reversals, energy sell-off: This week, sentiment on stocks was extremely poor. Small options traders had record bets against them, and all of our risk indicators were in risk-off territory. Fundamentals are still a worry, as the earnings yield is well below the inflation rate. Copper, and other commodities, have suffered large reversals after impressive upside momentum. Energy stocks may have fallen too far, too fast, especially if the dollar reverses. |
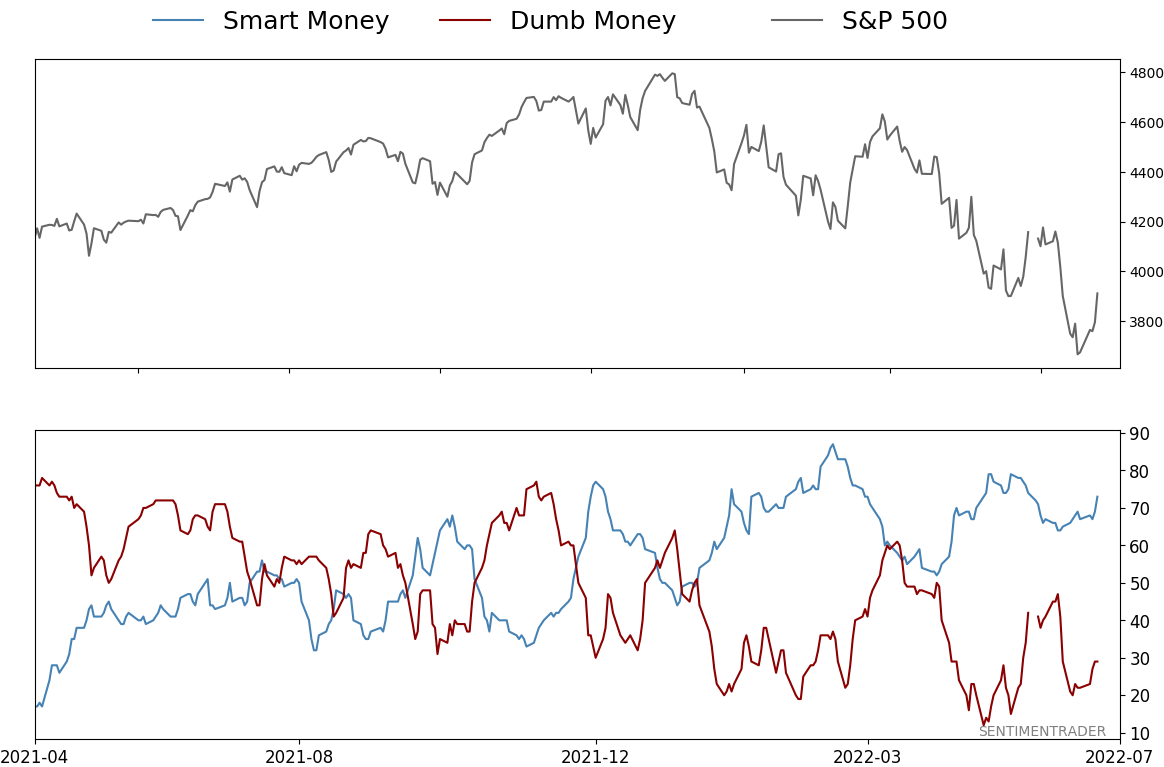
Smart / Dumb Money Confidence
|
|
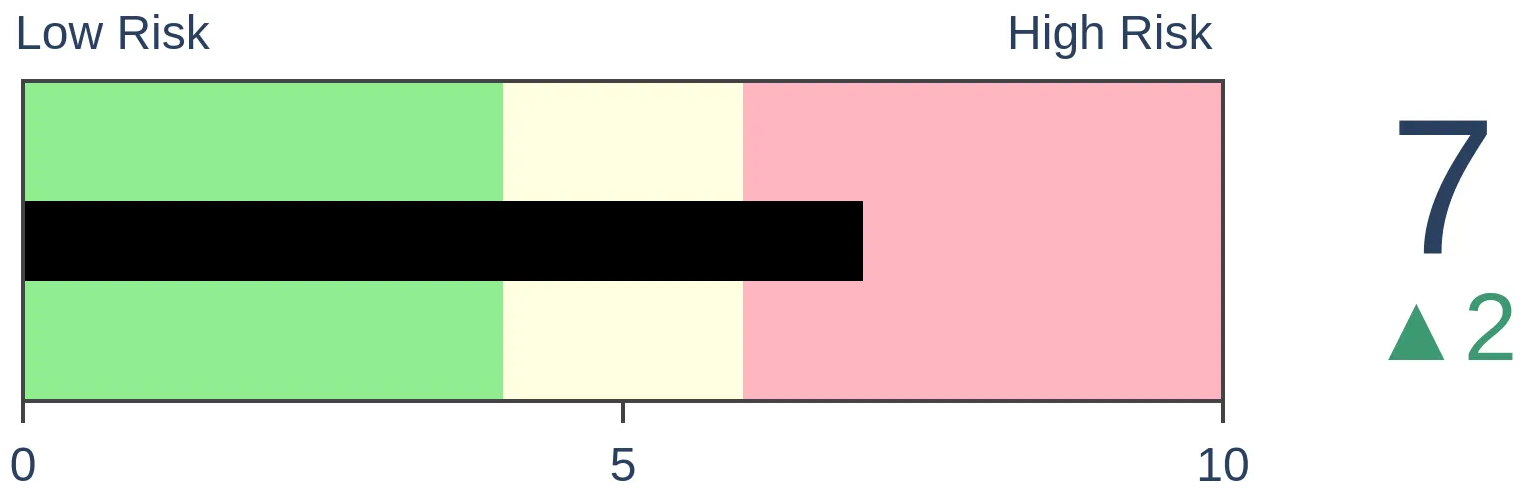
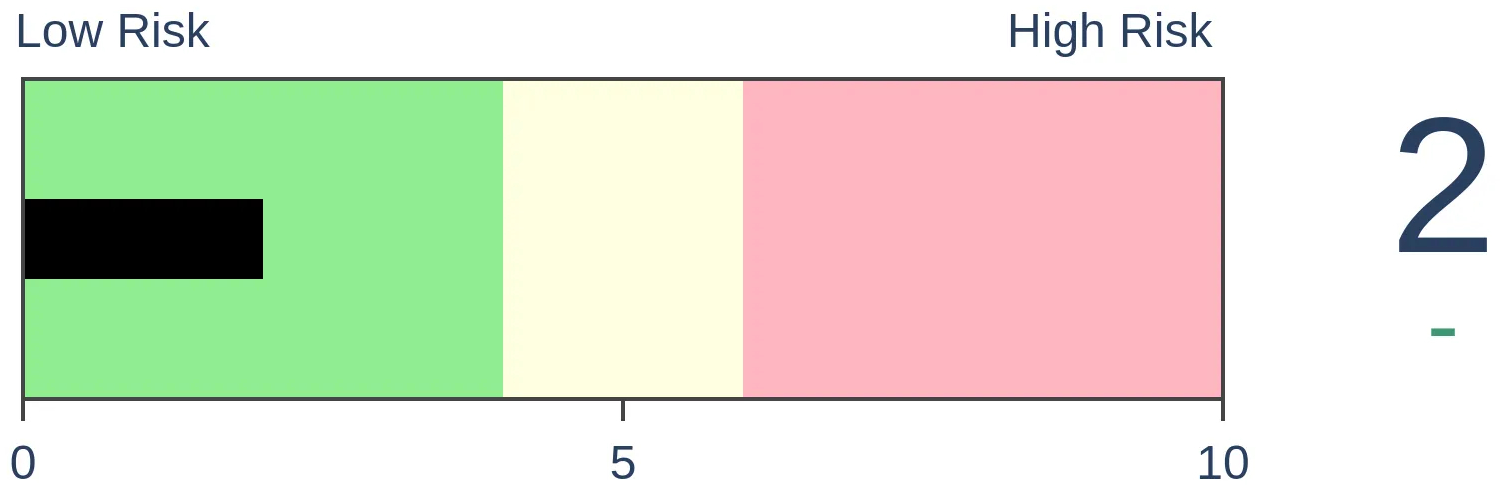
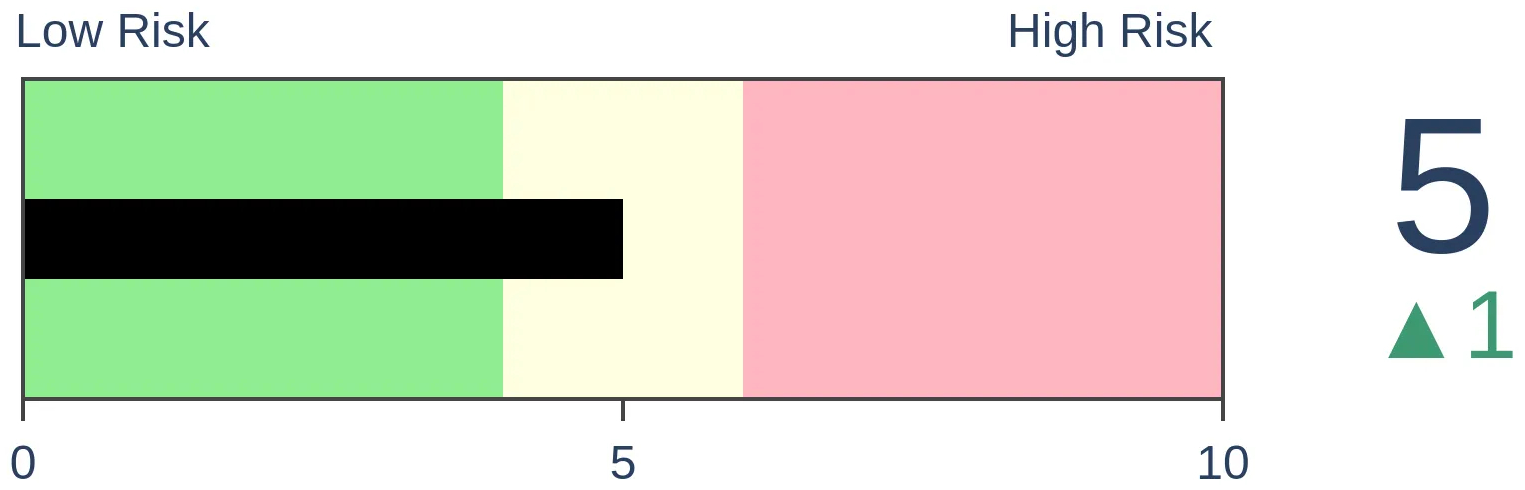
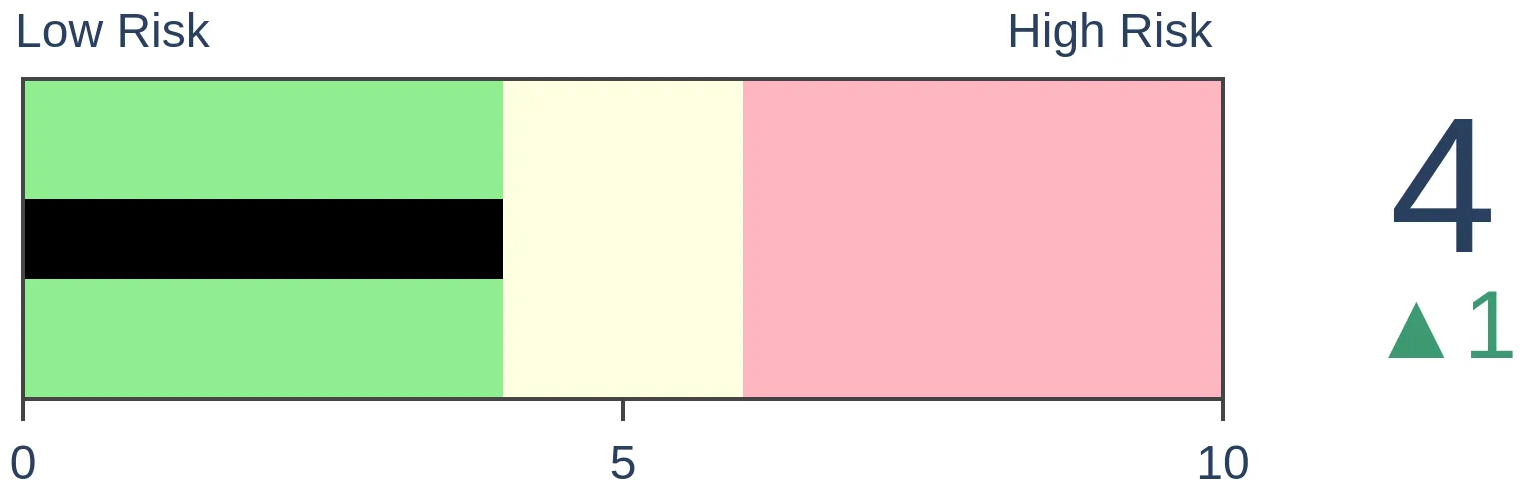
Risk Levels
|
|

|
Research
TradingEdge Weekly for Jun 24 - A lifting of extreme pessimism, commodity reversals, energy sell-offBy Jason GoepfertBOTTOM LINEThis week, sentiment on stocks was extremely poor. Small options traders had record bets against them, and all of our risk indicators were in risk-off territory. Fundamentals are still a worry, as the earnings yield is well below the inflation rate. Copper, and other commodities, have suffered large reversals after impressive upside momentum. Energy stocks may have fallen too far, too fast, especially if the dollar reverses. FORECAST / TIMEFRAME |
Key points:
- Small options traders had record bets against stocks entering this week
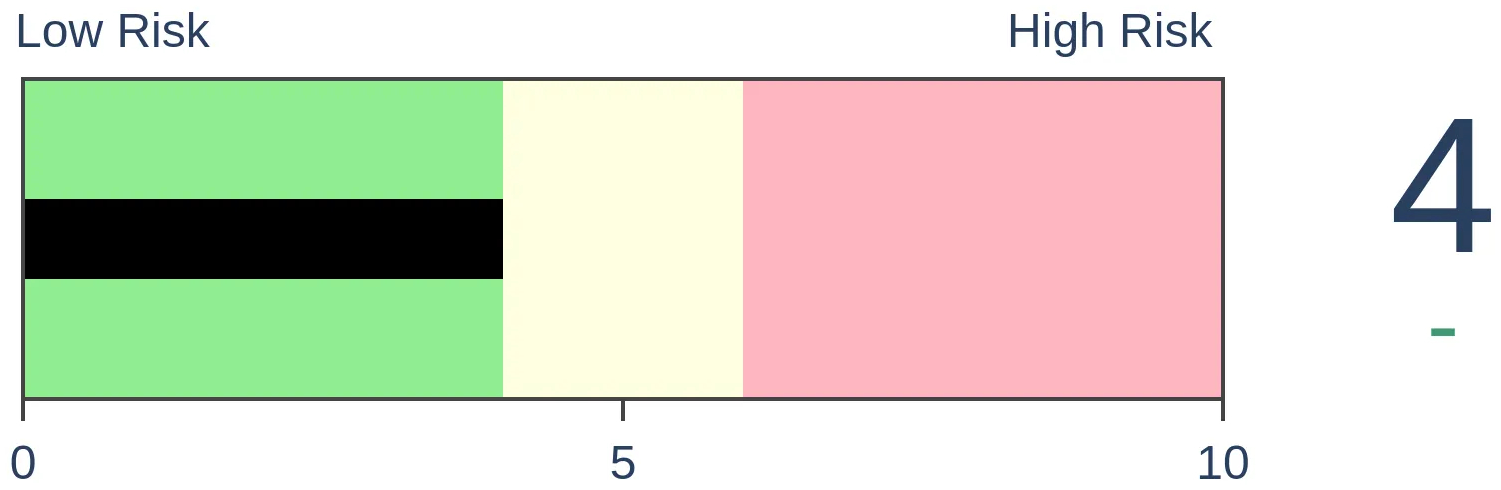
- With additional selling pressure, all of our "risk" indicators were in risk-off territory
- Fundamentals are still a worry, with a negative spread between earnings yields and inflation
- Copper has reversed quickly and severely
- Commodities, in general, have also reversed course and recently hit a 3-month low
- Energy stocks may have fallen too far, too fast
- They could get a boost if the dollar follows through on its seasonal and sentiment tendencies
- A couple of signs point higher for bonds
Small options traders with record bearish bets
Losses are mounting, and small traders were panicking to start the week.
Ostensibly the least sophisticated investors in the market, using leveraged and expiring instruments, the smallest of options traders tend to be a consistent contrary indicator. A back-of-the-envelope analysis suggests that these traders could be sitting on $600 million or more of losses on their options trades since Thanksgiving.
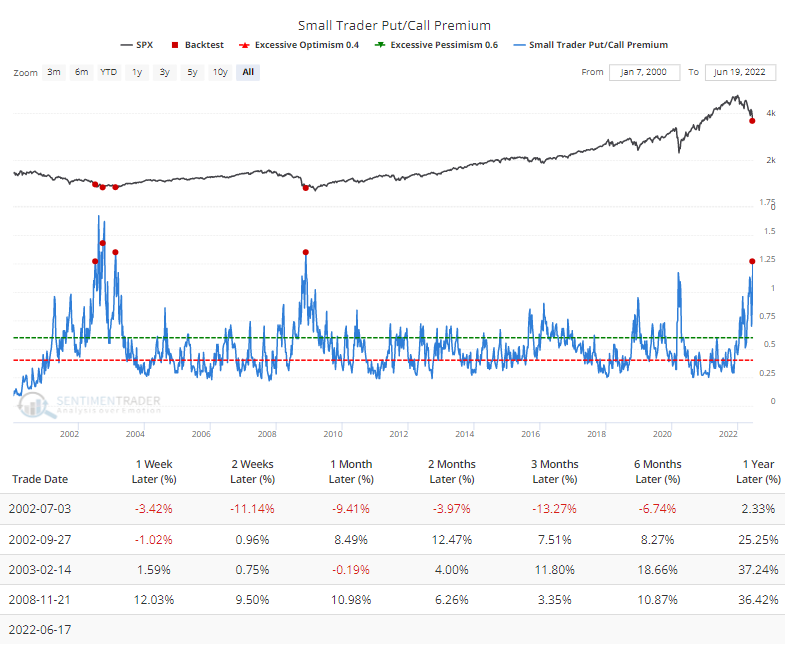
Thanks to recent losses, small traders have resumed a high level of put buying, accounting for 30% of their total options volume last week. A rise in put buying, combined with an increase in implied volatility, means that the traders spent more on those protective puts.
Last week, they spent 27% more on put option premiums than call option premiums. Since 2000, there were only a few weeks when these traders spent 25% more on protective puts than speculative calls. The Backtest Engine shows that the S&P 500 had more to fall during the waterfall decline in July 2002, but all four weeks led to gains over the next year.
If we look at what is perhaps the most accurate reflection of retail sentiment, net speculative options activity as a percentage of U.S. stock market cap, we just fell to a record low.
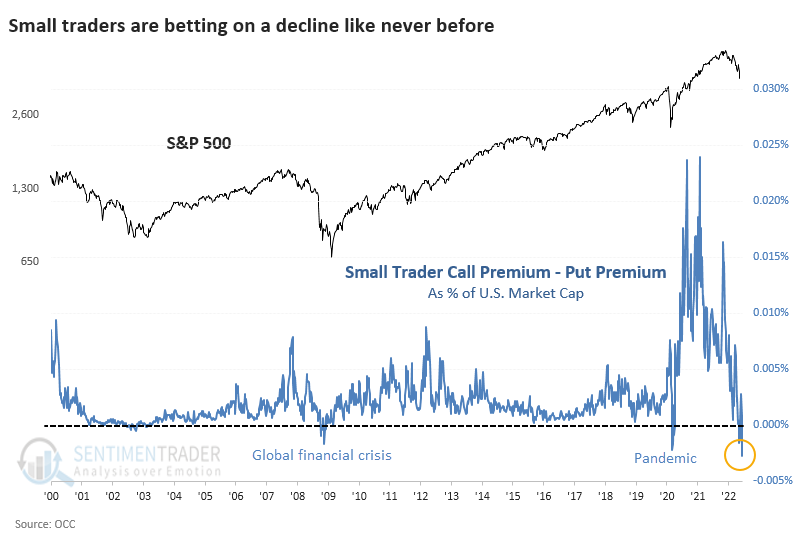
It's rare for the smallest traders to bet against the stock market, and when they do, stocks have never failed to fail them. Last week's net relative bets against stocks exceed the previous records from November 21, 2008, and March 13-20, 2020.
Other investors fled too, with everything showing "risk off"
Dean noted that for only the 6th time in the last 23 years, the SentimenTrader risk on/off indicator declined to zero. The indicator utilizes a weight-of-the-evidence approach by combining 21 diverse components into a single model to assess the current market environment.
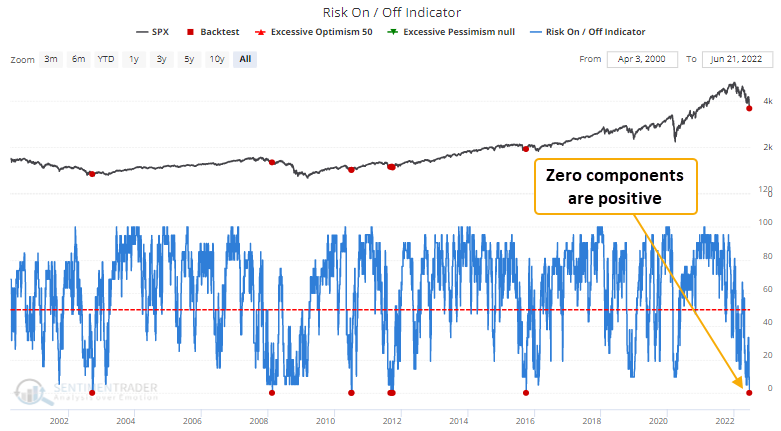
This model generated a signal 5 times over the past 20 years. After the others, the S&P 500 ETF's future returns, win rates, and z-scores look excellent across almost all time frames.
The 2-week window should be a friendly reminder that markets typically chop around and retest capitulation lows. Interestingly, the indicator did not fall to zero after several severe risk-off periods like September 2001, December 2018, and March 2020.
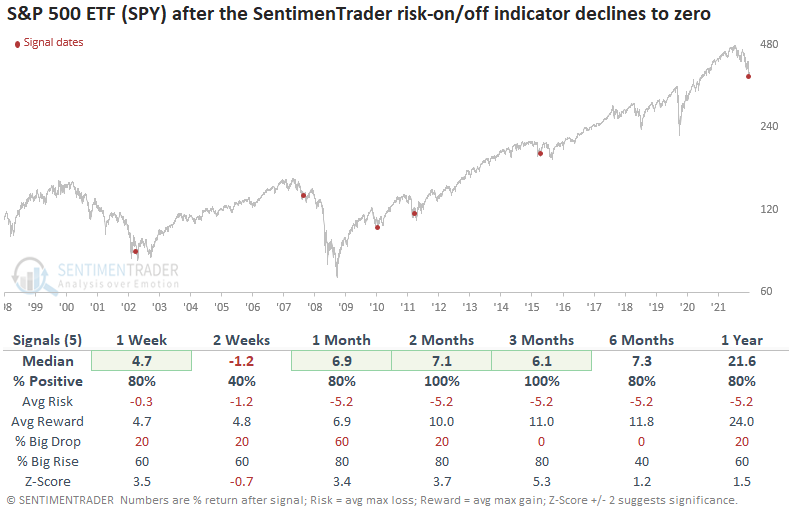
When Dean increased the threshold level for the indicator to identify a cross below 6%, the study generated 10 other signals. After the others, SPY future returns, win rates, and z-scores were solid across medium-term time frames.
Fundamentals are still a boogeyman
Low inflation makes a dollar of earnings more valuable, and high inflation makes a dollar of earnings less valuable. This relationship has recently reached a historic extreme and Jay showed what trends in this relationship matter most for stock investors.
To create the indicator, he expressed the Shiller P/E Ratio for the S&P 500 as an earnings yield and subtracted the 12-month % change in the CPI.
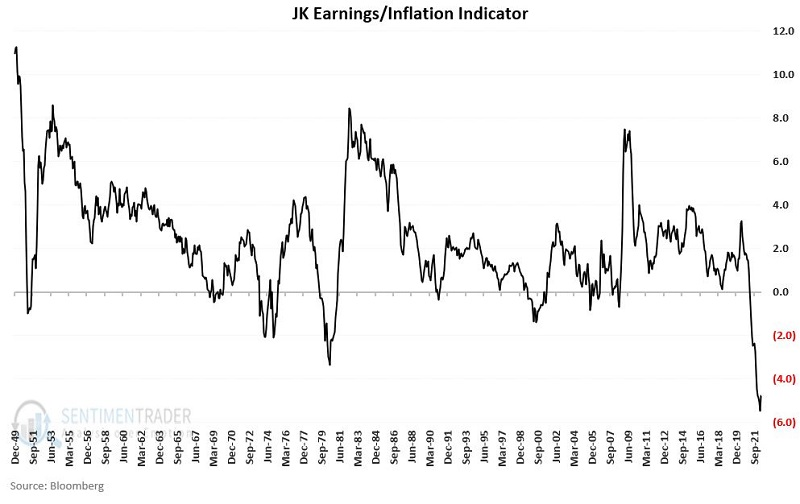
The system is simple:
- If JK Earnings/Inflation Indicator > 0 at month-end = Bullish for the next month
- If JK Earnings/Inflation Indicator < 0 at month-end = Bearish for next month
For testing purposes, each variable's values and the indicator itself are updated on the last day of the month. If the indicator is positive at the end of a month, the stock market is deemed "bullish" for the next month, and if the indicator is negative at the end of the month, it is considered "bearish" for the next month.
The cumulative hypothetical SPX % gain from January 1950 through May 2022 is +31,314% when the indicator is bullish.
The chart below displays the cumulative growth for the S&P 500 Index held long only when the JK Earnings/Inflation Indicator is bearish. The cumulative hypothetical SPX % gain from January 1950 through May 2022 is -21.5%. The indicator is deemed bearish for June 2022.
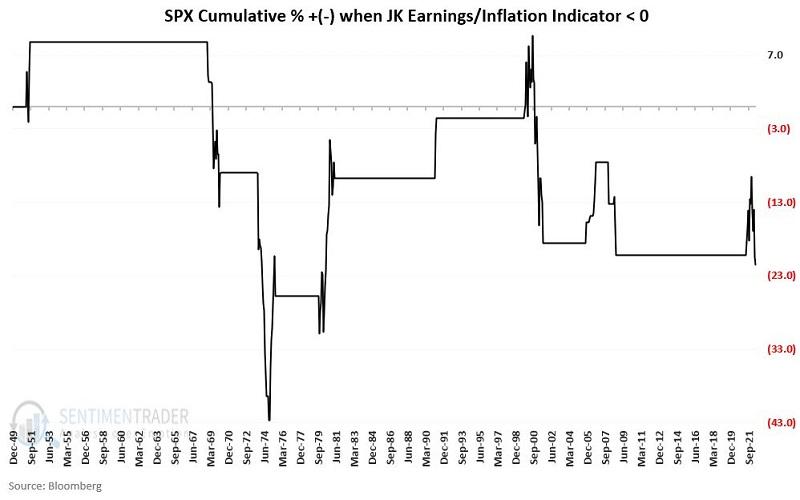
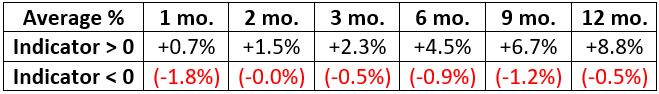
The table below displays the average one to twelve-month % +(-) for the S&P 500 Index depending on whether the current month-end reading for the JK Earnings/Inflation Indicator is above 0 (bullish) or below 0 (bearish).
Barring a massive decline in the Shiller PE Ration between now and the end of June, this indicator will remain "Bearish" for July 2022.
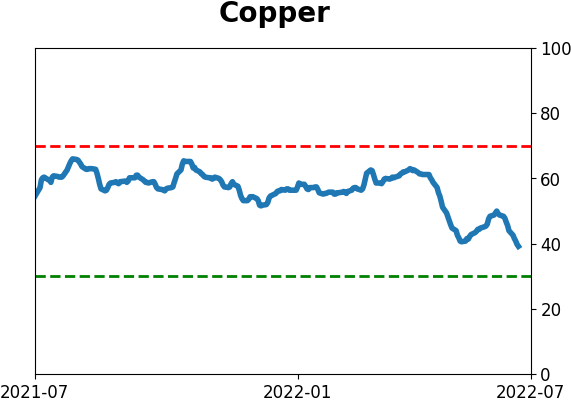
A big reversal in copper
Copper registered a new 252-day low last Friday, representing the first occurrence since its previous 252-day high in March. Dean assessed the outlook for copper, commodities, and stocks after copper futures register their first 252-day low after a 252-day high.
After the 2nd highest number of 252-day highs in history, copper has lost momentum and is now registering a 252-day low.
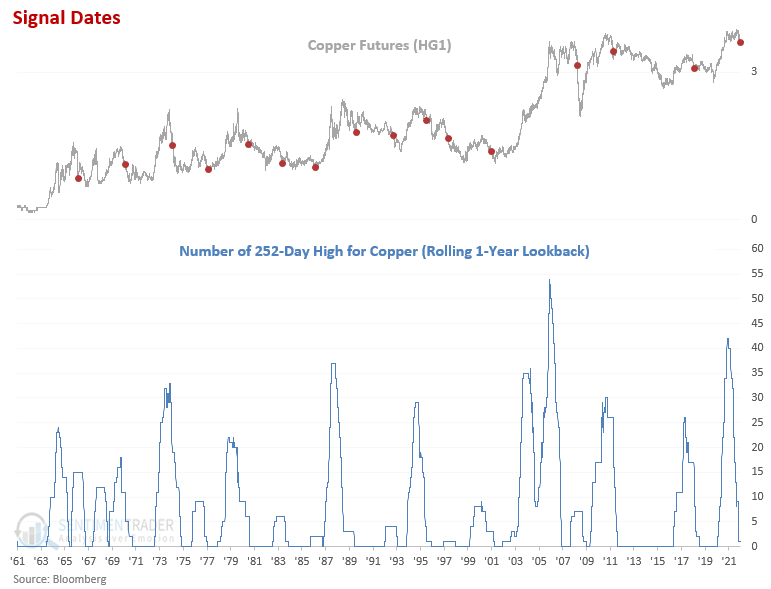
This study generated a signal 16 other times over the past 62 years. After the others, copper returns and win rates look unfavorable across almost all time frames, especially on a medium-term basis. The 1-6 month window shows a loss at some point in 12 out of 16 cases.
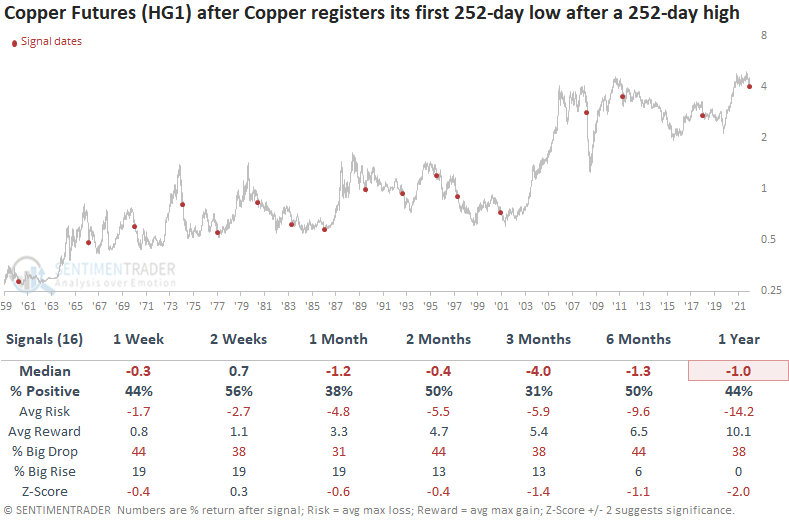
Commodities tend to struggle in the next few months and show little upside progress over the next year.
Stocks tend to struggle in the next few months. However, the 1-year return and win rate suggest better days ahead, especially if we can avoid a recessionary bear market like 2000-02 and 2007-08.
Commodities in general have pulled back
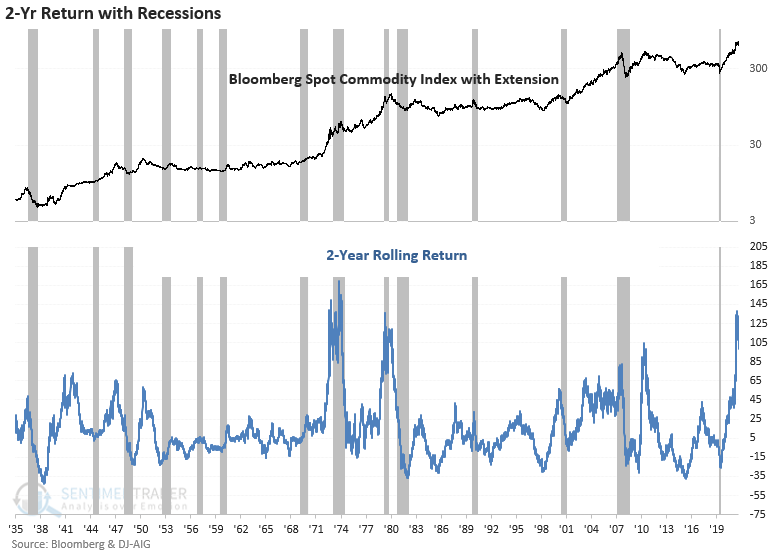
With commodities crumbling on recession fears, Dean assessed the outlook for the Bloomberg Spot Commodity index when the index reverses from a 252-day high to a 63-day low in 25 trading sessions or fewer.
Commodity momentum since the pandemic low has been historic, registering the 2nd highest 2-year rolling return in history. The two previous momentum surges preceded or coincided with recessions in 1973-75 and 1980. While the sample size is small, potential recession fears are not unfounded. Interestingly, commodities suffered several sharp setbacks in the 1973-75 recession while maintaining a bullish secular trend.
This study generated a signal 17 other times over the past 88 years. After the others, commodity returns, win rates, and z-scores look unfavorable across short and medium-term time frames. The 1-4 week window shows a loss at some point in 14 out of 17 cases.
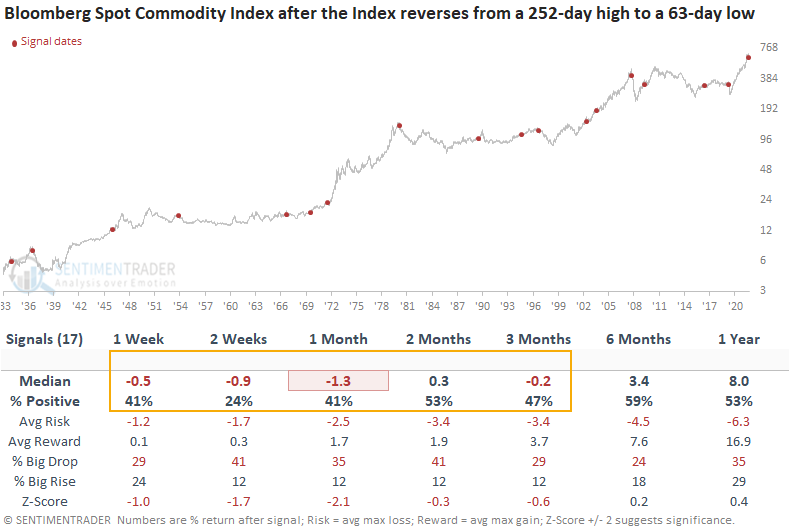
As with the commodity index, copper returns and win rates look unfavorable across short and medium-term time frames. Stocks show a positive return across all time frames, with the 1-year window looking solid except for the recessionary bear markets in 1937, 1980, and 2008.
Maybe too far, too fast, for the energy sell-off
After a terrific run, the energy sector has hit a severe air pocket in recent weeks. Jay highlighted some of the concerns recently - most notably, insider selling and a weaker seasonal trend.
The "Energy is Dead" chorus seems to already be at full volume, but before investors completely throw in the towel, there are a variety of potentially favorable signals to consider, a couple of which are shown below.
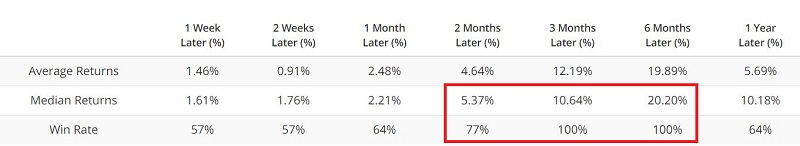
The figures below display those times when the % of stocks that comprise ticker XLE that were below their respective Bollinger Bands was equal to 100%. It's only been this high two other times in more than 20 years of history, both preceding bounces.
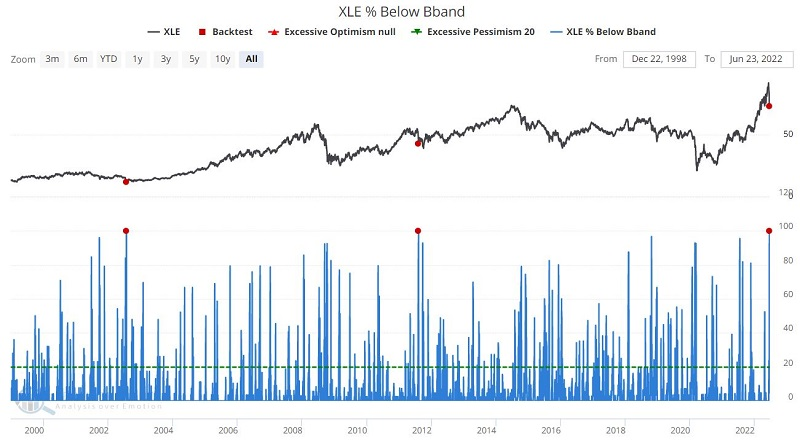
This is an exceptionally small sample size, so we should not get too carried away about all of the 100% Win Rates. Still, at the very least, it constitutes a potentially positive development as an opening salvo.
The figures below display those times when the Optimism Index on XLE was below 5% while XLE was above its 200-day moving average.
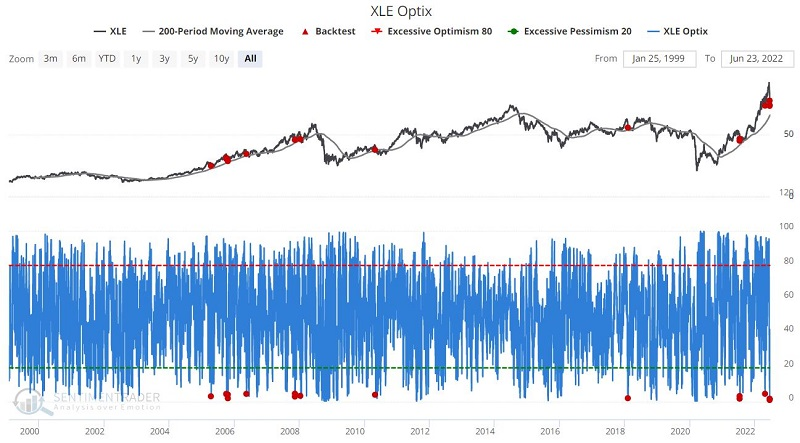
Is it possible that fossil fuel prices have finally peaked once and for all and that the traditional energy sector XLE represents will struggle going forward? Absolutely. Nevertheless, investors are encouraged to consider the evidence above before concluding that the good times are entirely over for the energy sector.
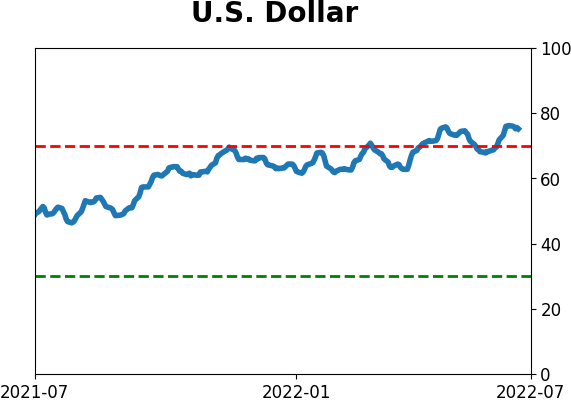
A declining dollar would help for now
Jay noted that the dollar is at a crossroads.
Note that over 36 years, the price of the dollar has traded above 106 only about 7.8% of the time.
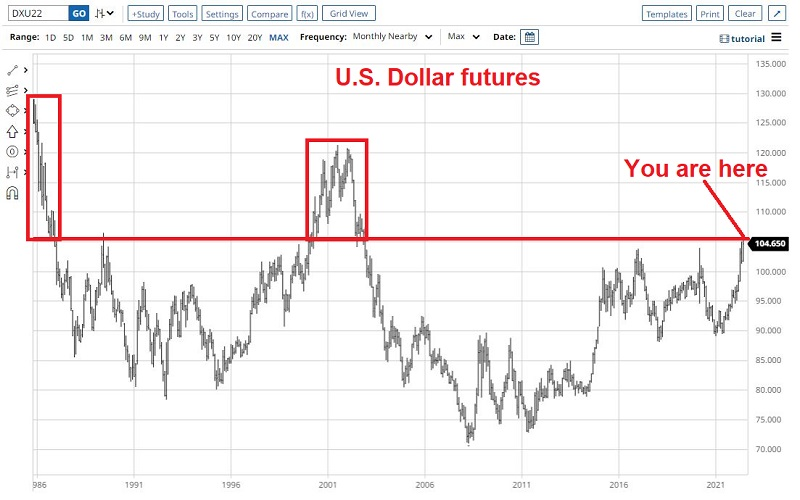
Intuitively, one might view this chart as a negative for the dollar - i.e., "it is running into resistance that it probably won't break through." But there is no prediction implied here.
A sharply rising or falling U.S. dollar can have a broad ripple effect across the financial markets and world economy. At the very least, an upside breakout would likely cause commodities to cool off dramatically from their torrid pace of the last several years. Conversely, commodities could be off to the races again if the dollar breaks down - especially if high inflation persists.
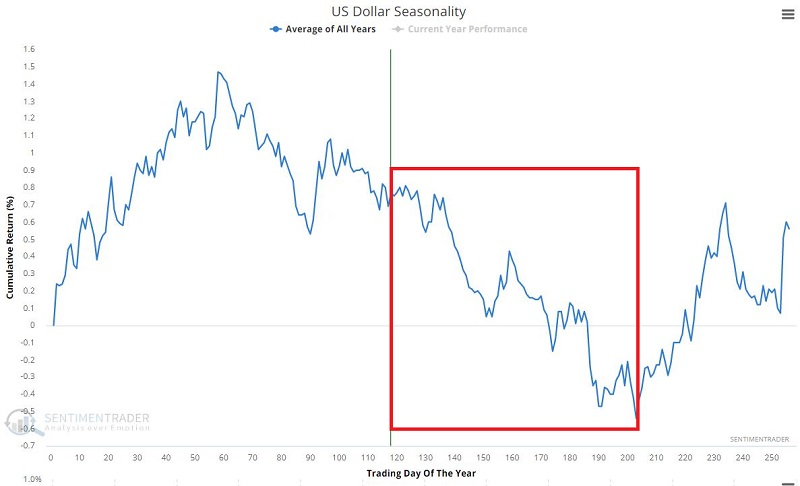
The chart below displays the annual seasonal trend for U.S. dollar futures. Note that the traditional period of seasonal weakness began a while ago - and extends through Trading Day of the Year (TDY) #203 (10/20/2022).
The 50-day average for the U.S. Dollar Optix indicator just crossed above 72 for just the fifth time in the past 17 years. The chart below displays those occurrences.
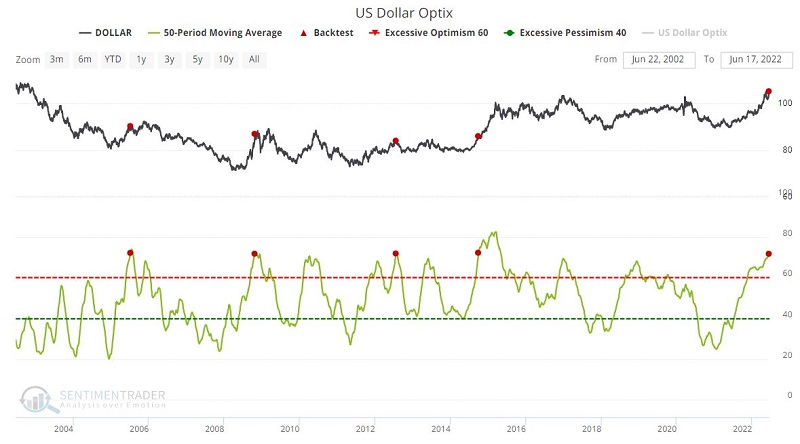
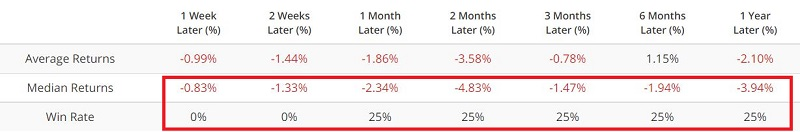
This is a tiny sample size, so it isn't easy to draw solid conclusions. Nevertheless, this does argue for the potential for price weakness if the dollar fails to break out above the price resistance level discussed above.
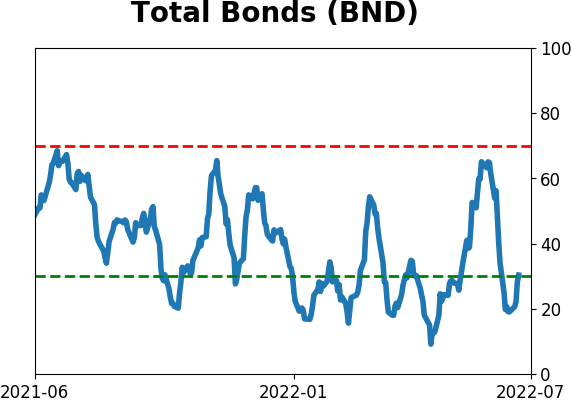
More of a reprieve for bonds?
The trend-following method Jay uses suggests we are in the early stages of a long-term rise in interest rates. Given this potential new trend in rates, the relatively low yield available, and current high inflation, long-term investors may be wise to avoid holding long-term treasuries.
Despite this, several factors suggest the potential for a rally in bond prices (even long-term bonds) in the near term. Jay noted that bond traders could be looking for opportunities to play the long side, given a variety of seasonal and technical factors.
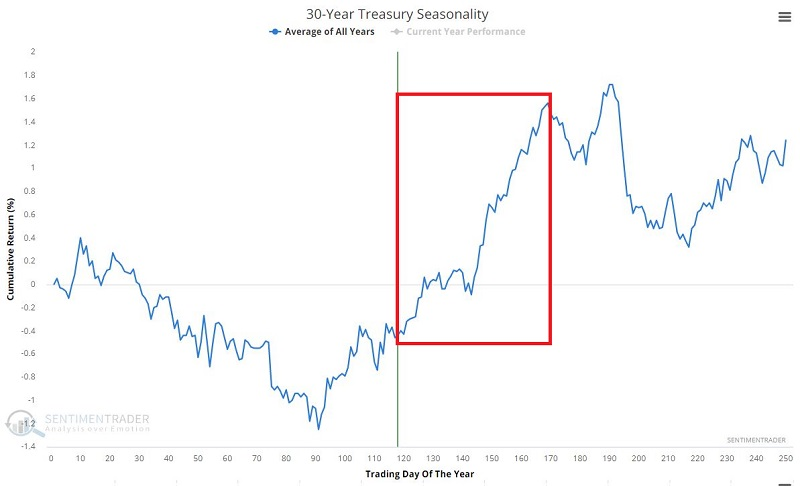
Treasury bonds are still within the most favorable time of the year - as shown in the chart below. IF bonds are going to stage a rally, the next several months seem like the most likely time.
This data series calculates the number of outstanding put options divided by the number of outstanding call options on ticker TLT (iShares 20+ Year Treasury Bond ETF). When traders have been holding many more puts relative to calls in TLT, they have tended to struggle going forward. When there were few puts relative to calls, TLT tended to rise. The chart below displays those times when the reading for this indicator was below 0.50.
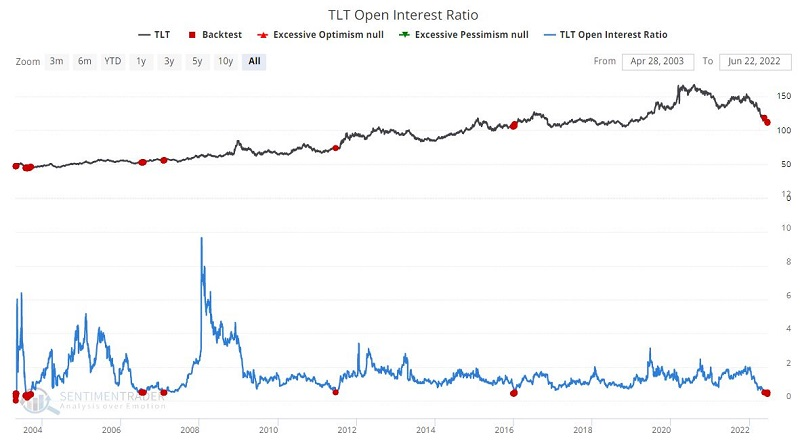
It is important to note that all readings before 2022 occurred within the context of a declining trend in interest rates, so it is reasonable to question the likelihood that the latest signal will play out as well as in previous instances.
Still - like seasonality - it offers shorter-term bond trading bulls a potential reason to look for a buying opportunity. For those familiar with options trading, using a bull call spread can provide a defined-risk way to trade this potential without losing too much if the larger trend asserts itself.
About TradingEdge Weekly...
The goal of TradingEdge Weekly is to summarize the research published to SentimenTrader over the past week. Sometimes there is a lot to digest and this summary is meant to highlight the highest conviction or most compelling ideas we discussed. This is NOT the full research that's published, rather it pulls out some of the most relevant parts. It includes links to the published research for convenience; if you don't subscribe to those products it will present the options for access.
Indicators at Extremes
|
|
|
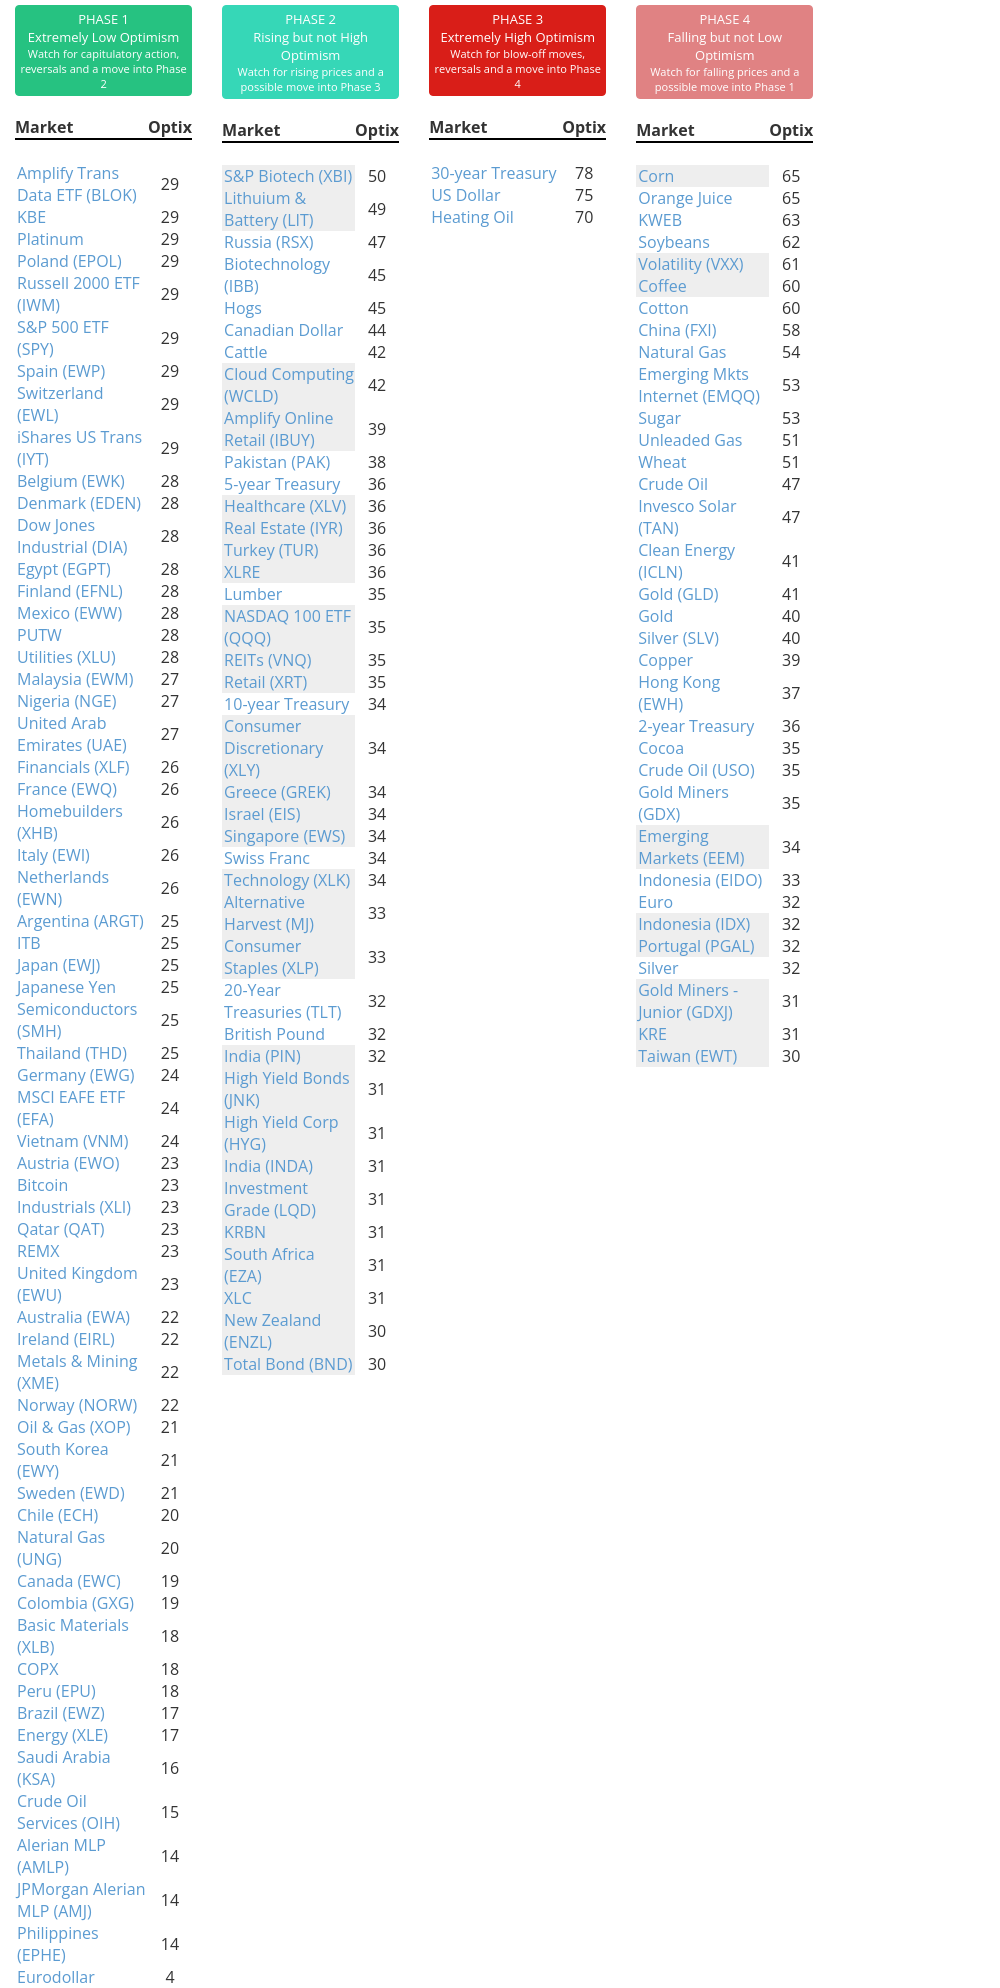
Phase Table
|
|
|
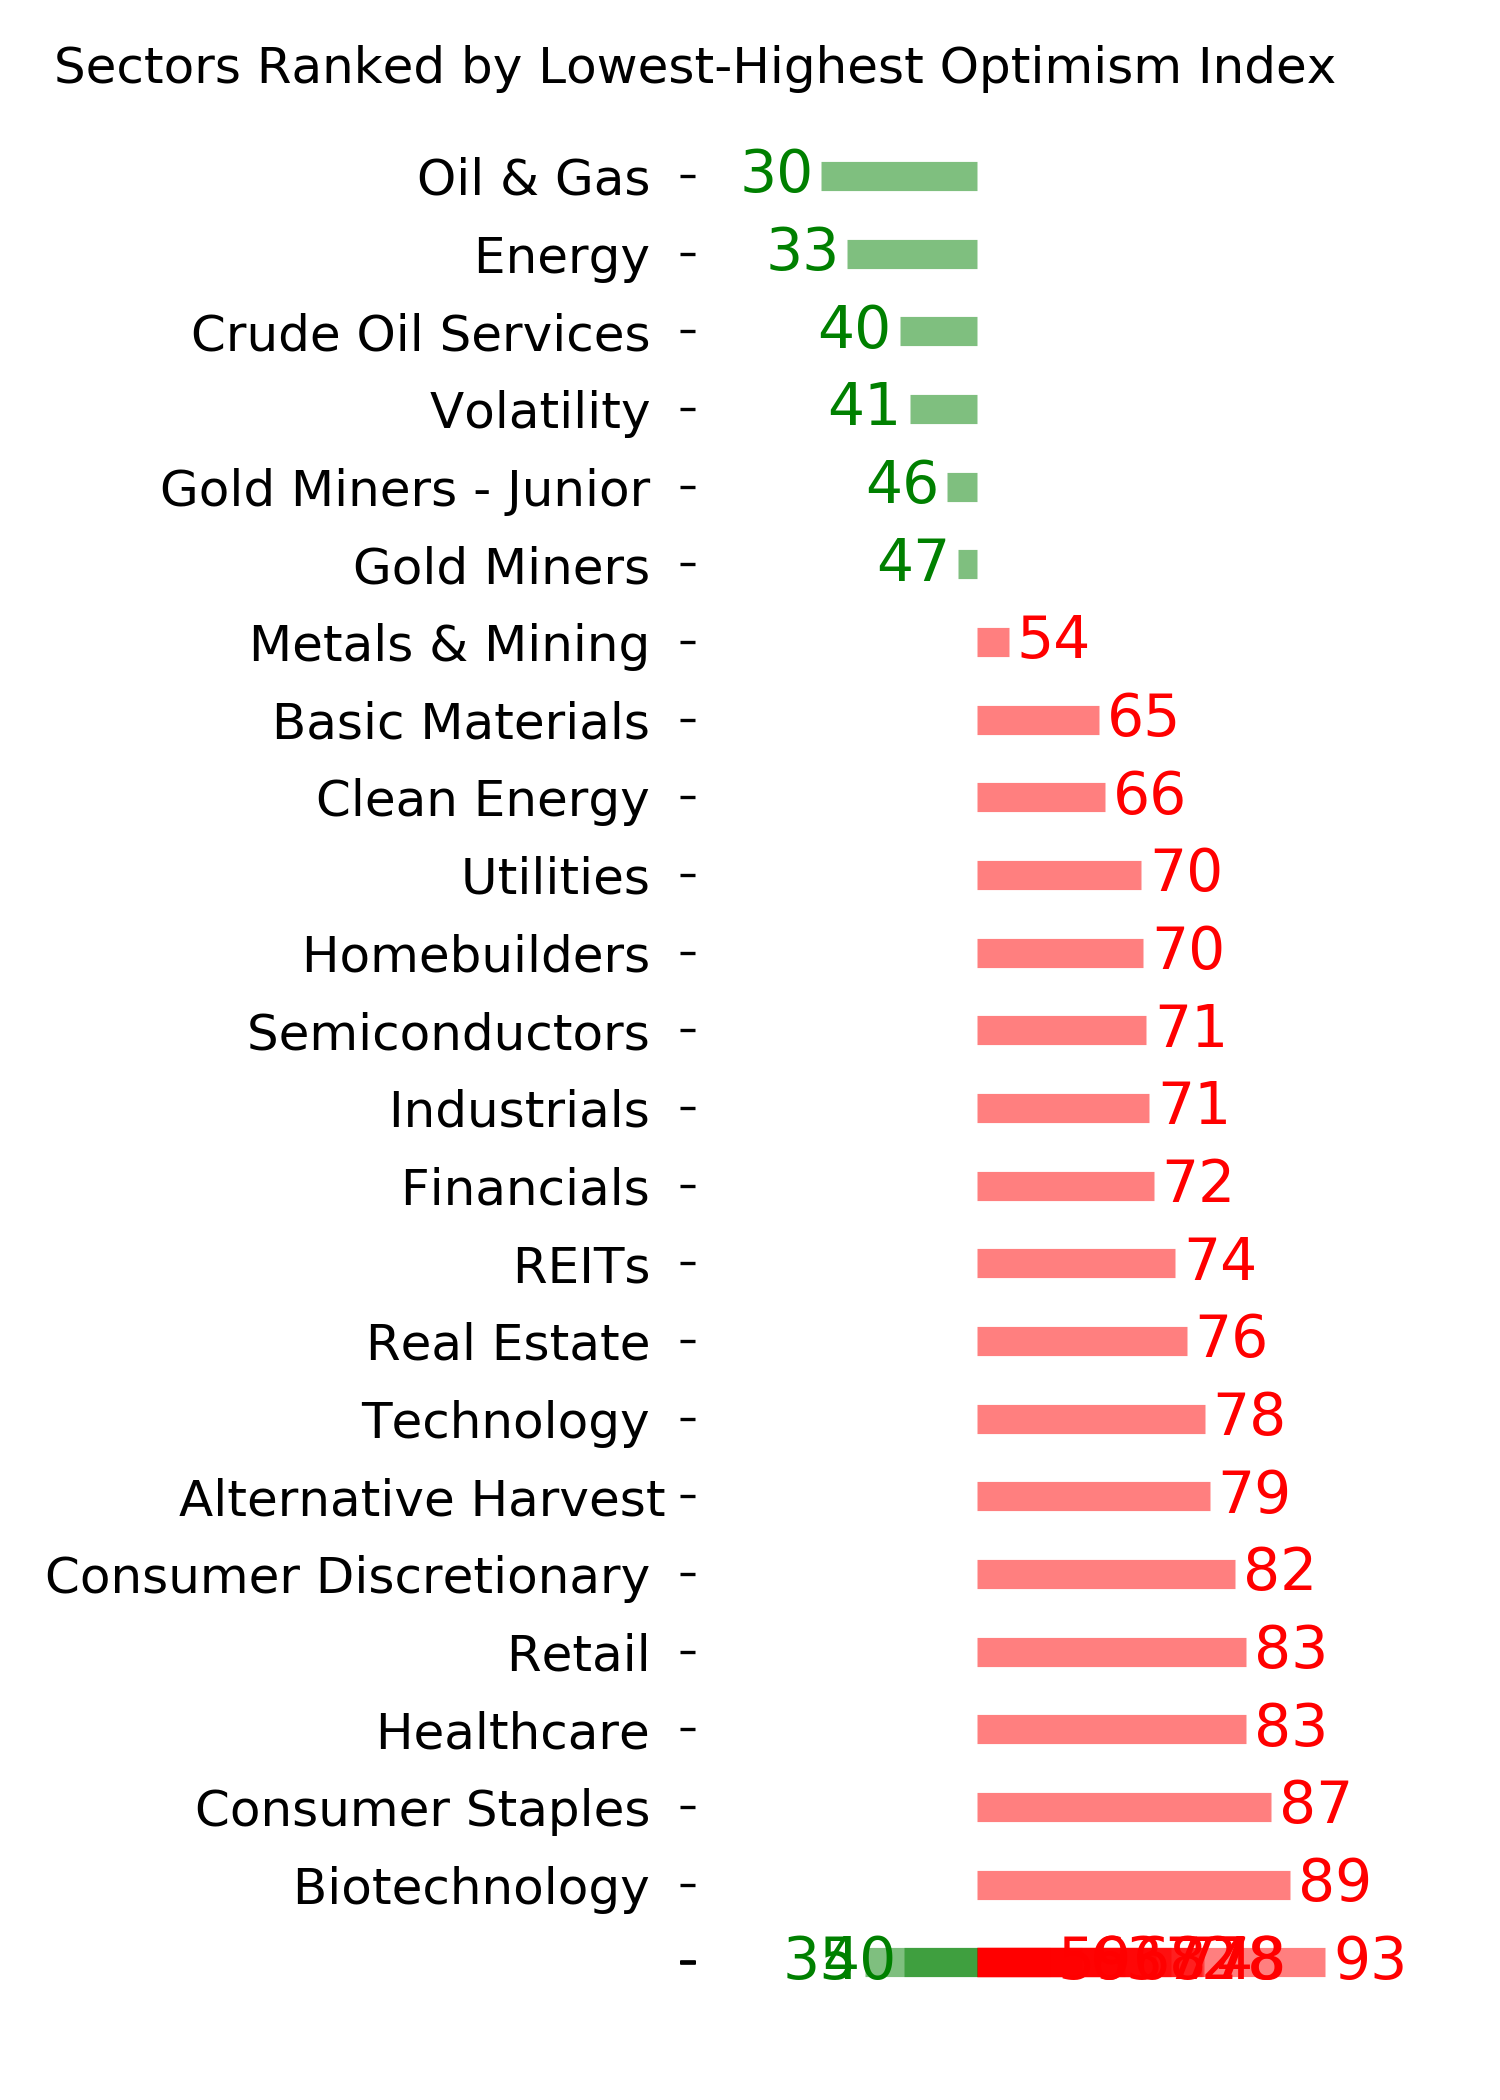
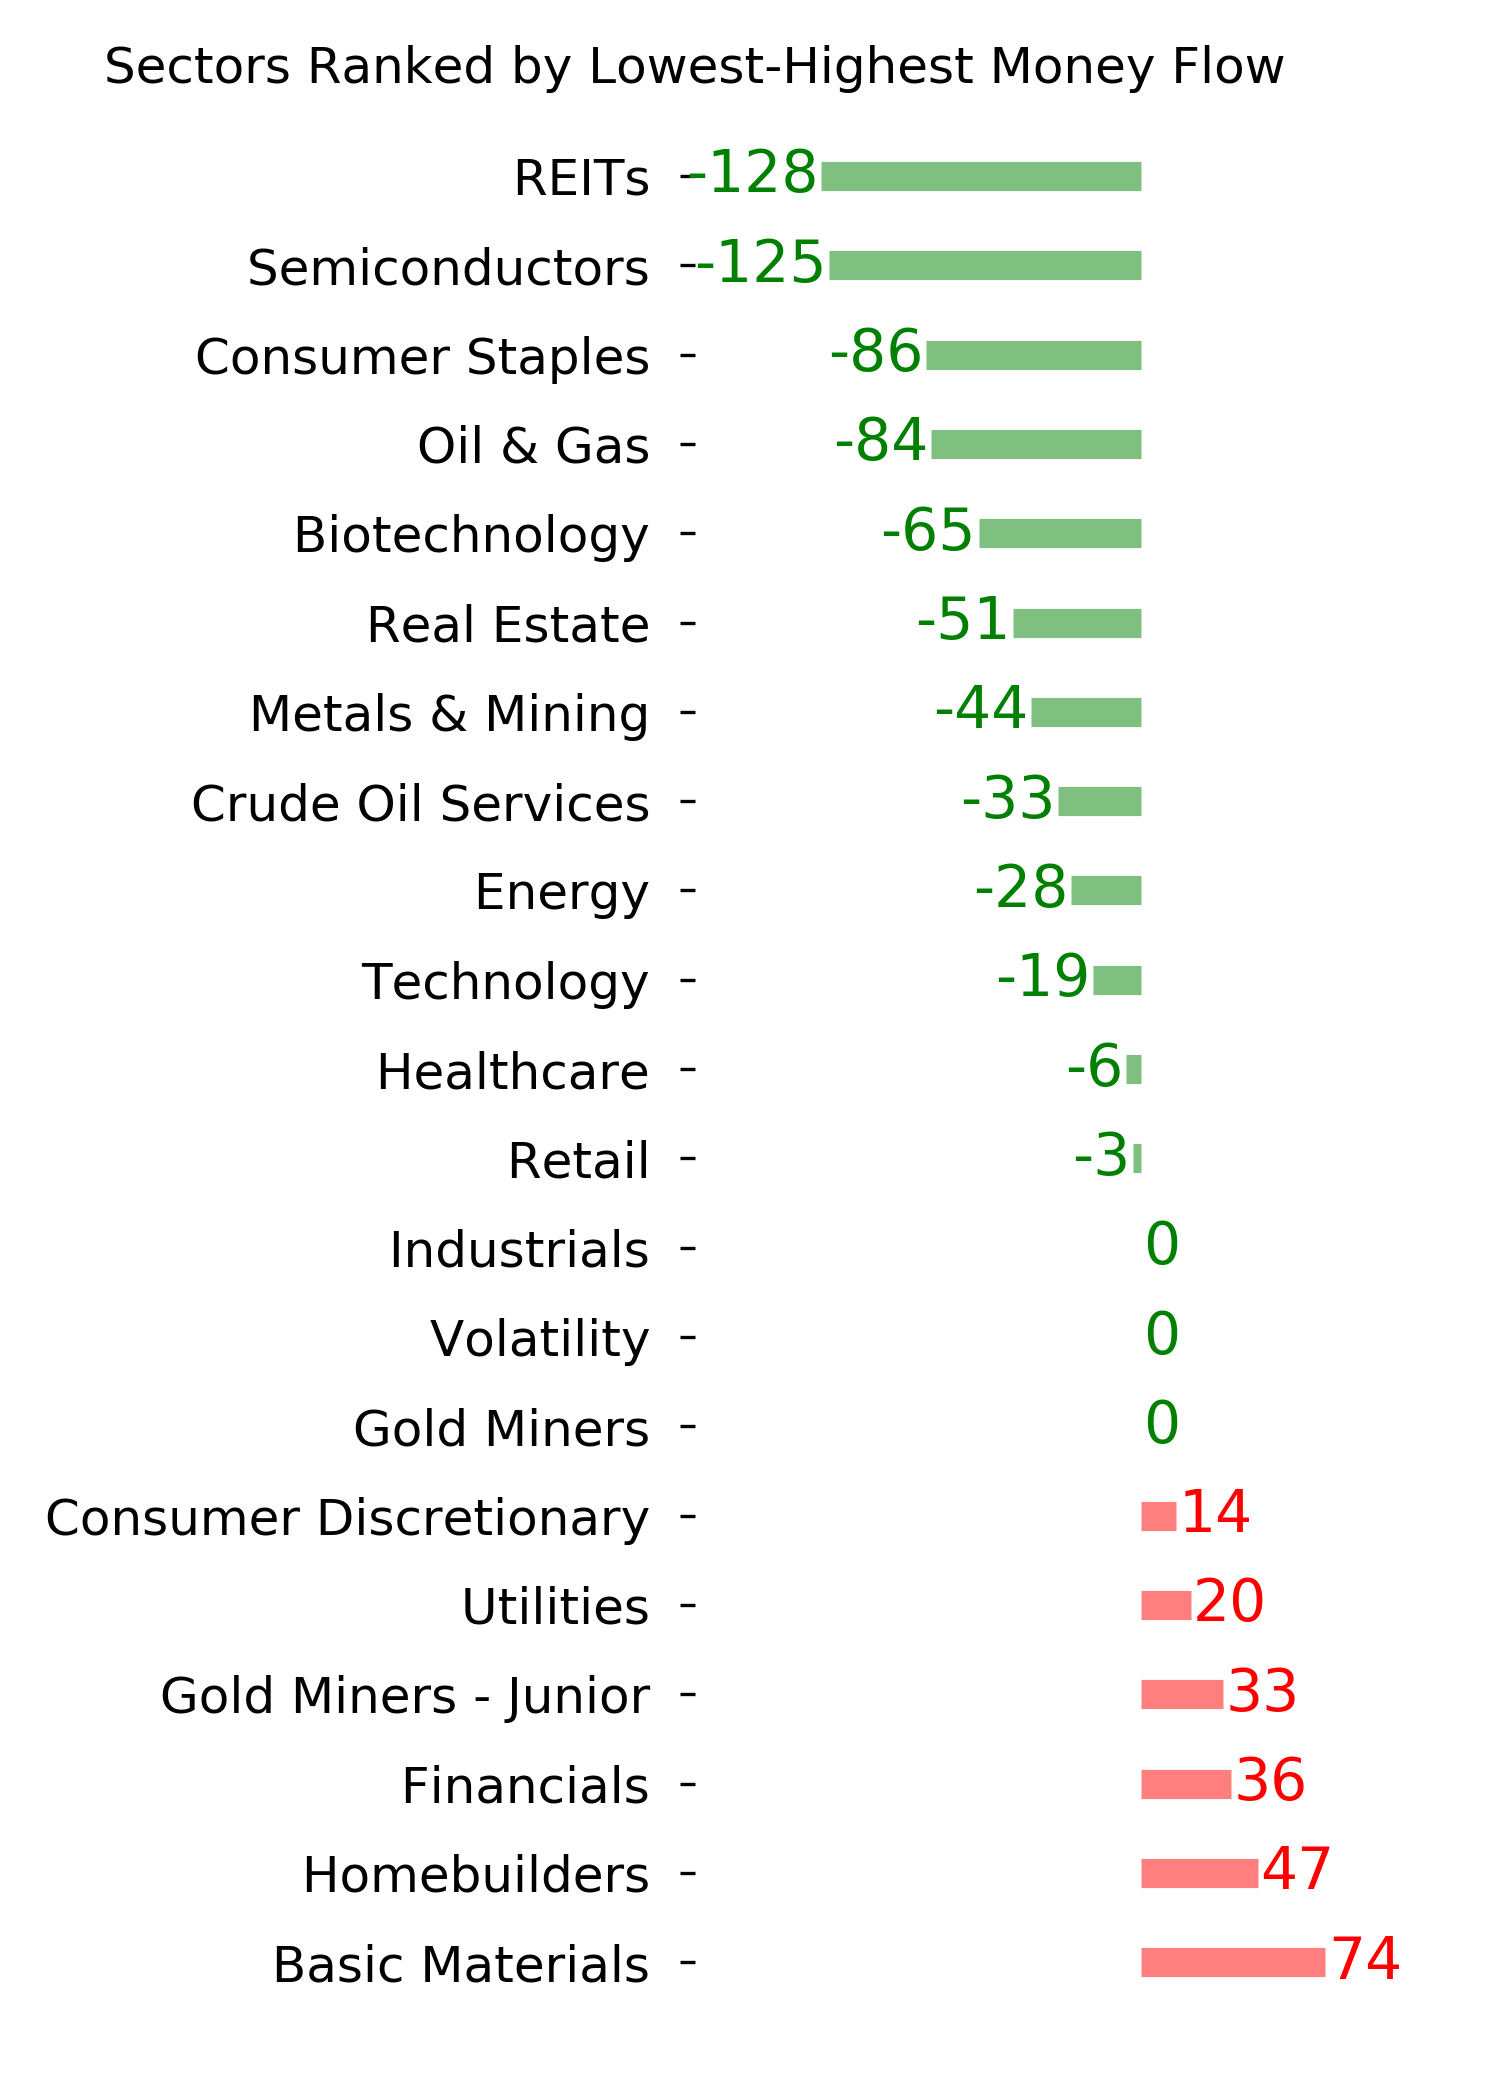
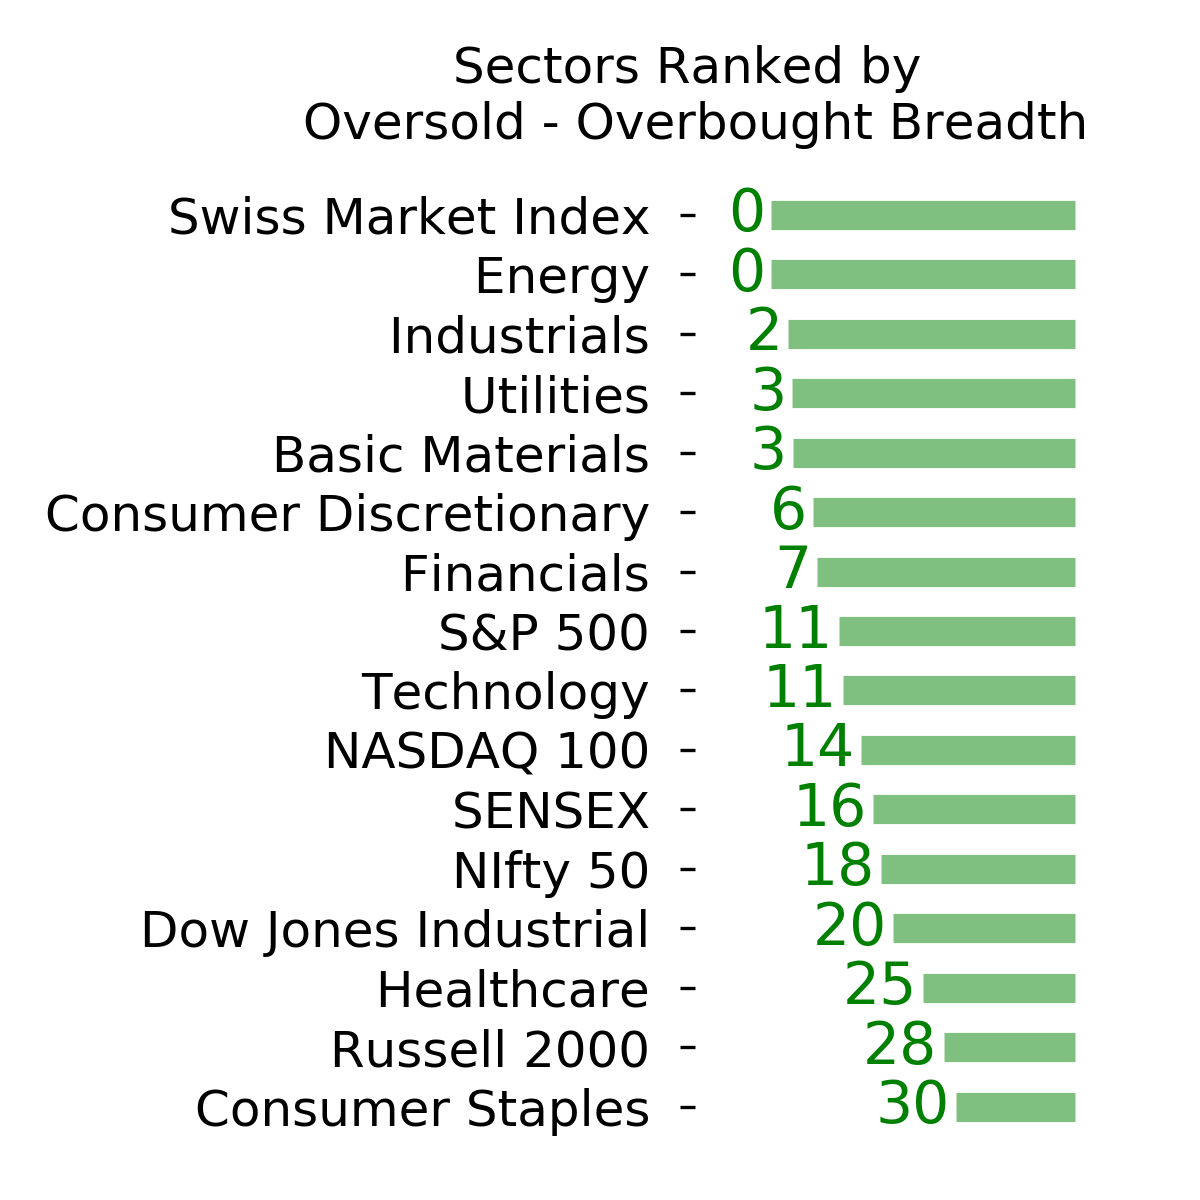
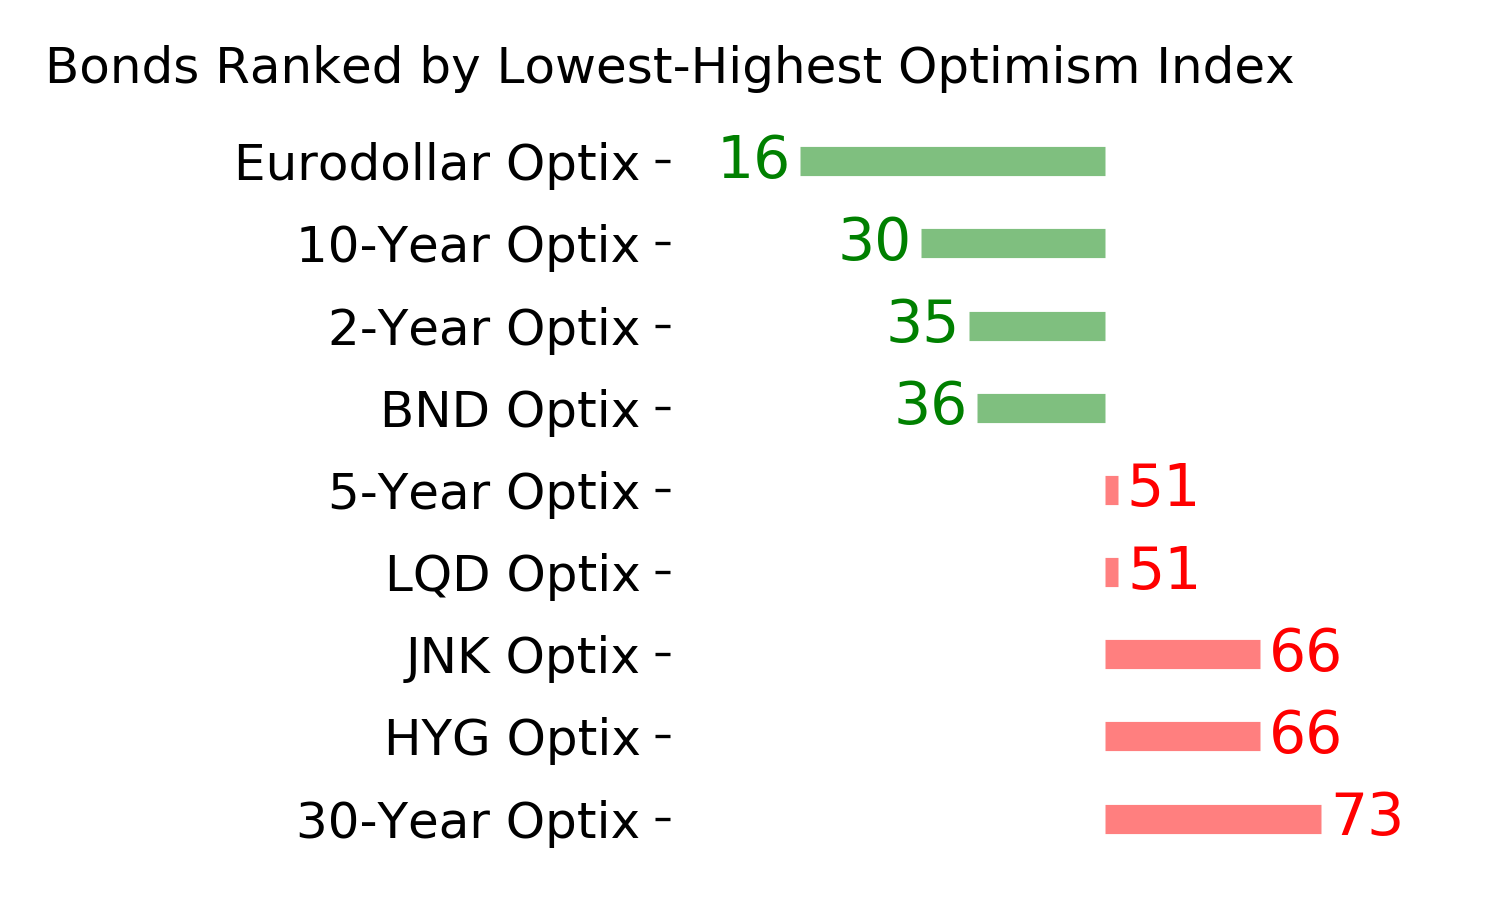
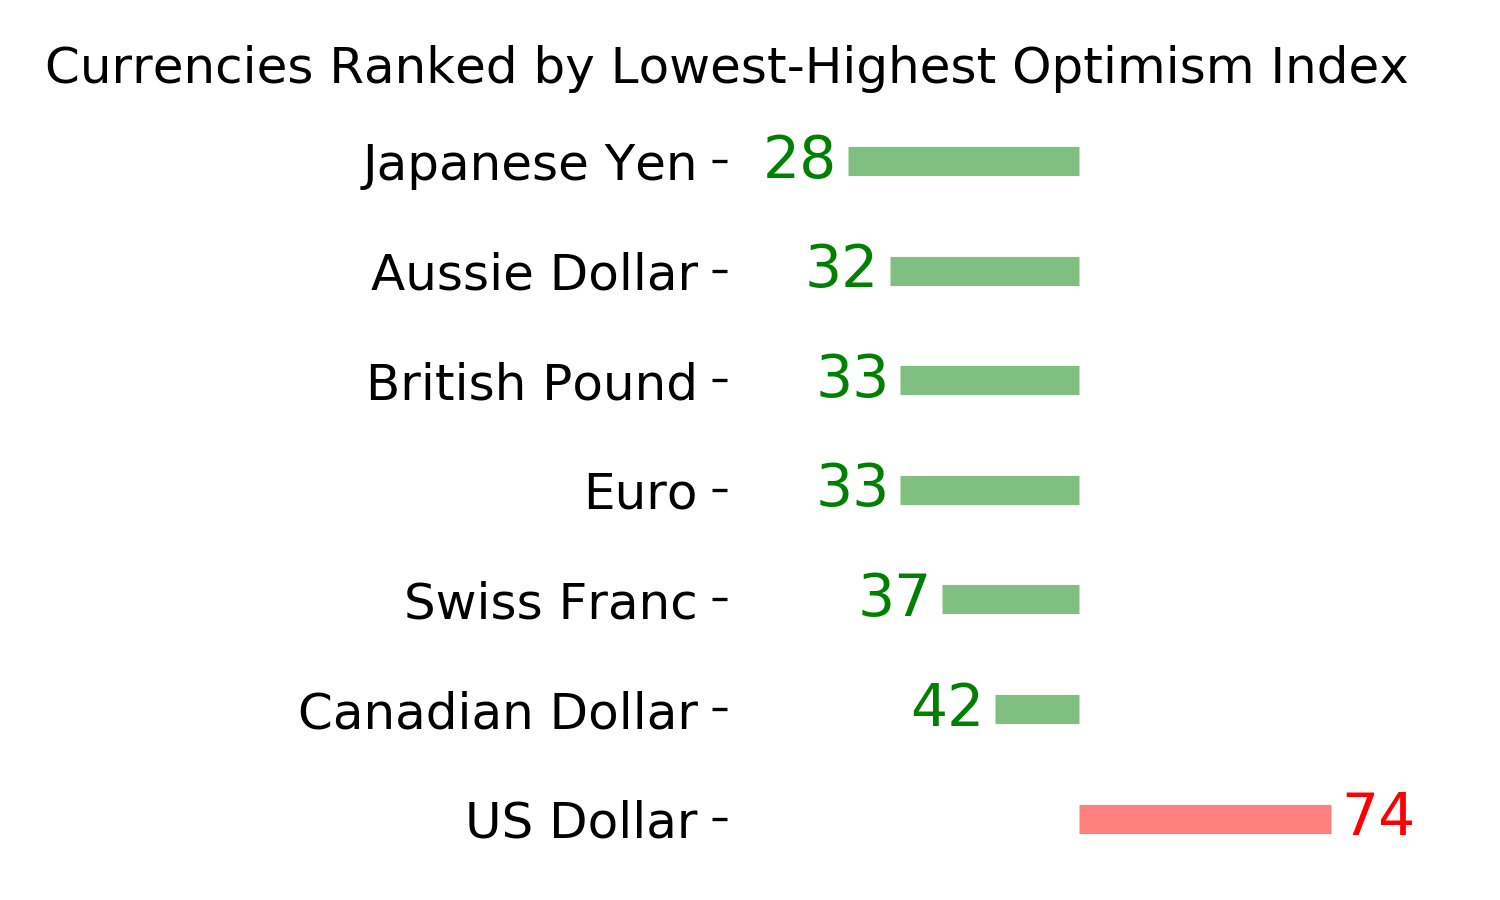
Ranks
|
|
|
|
|
|
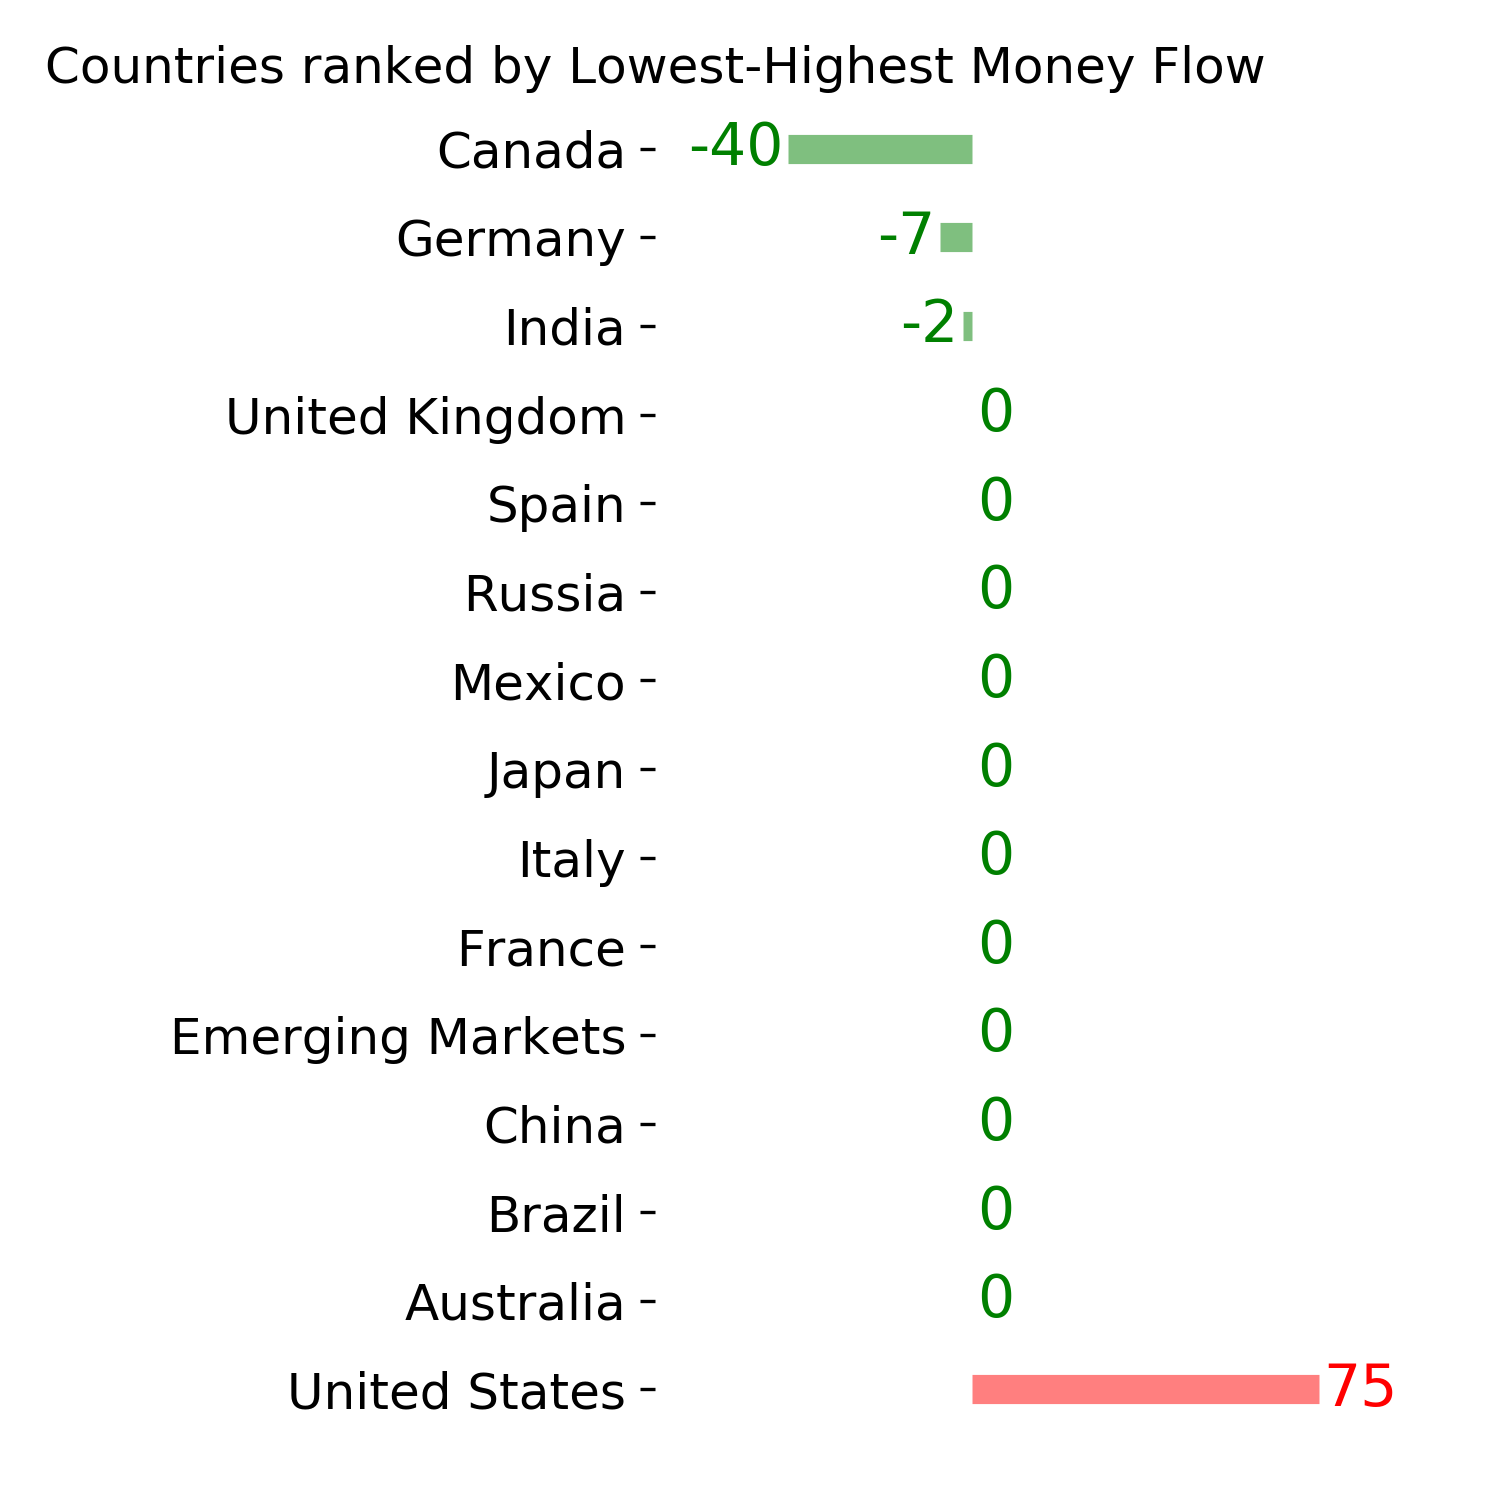
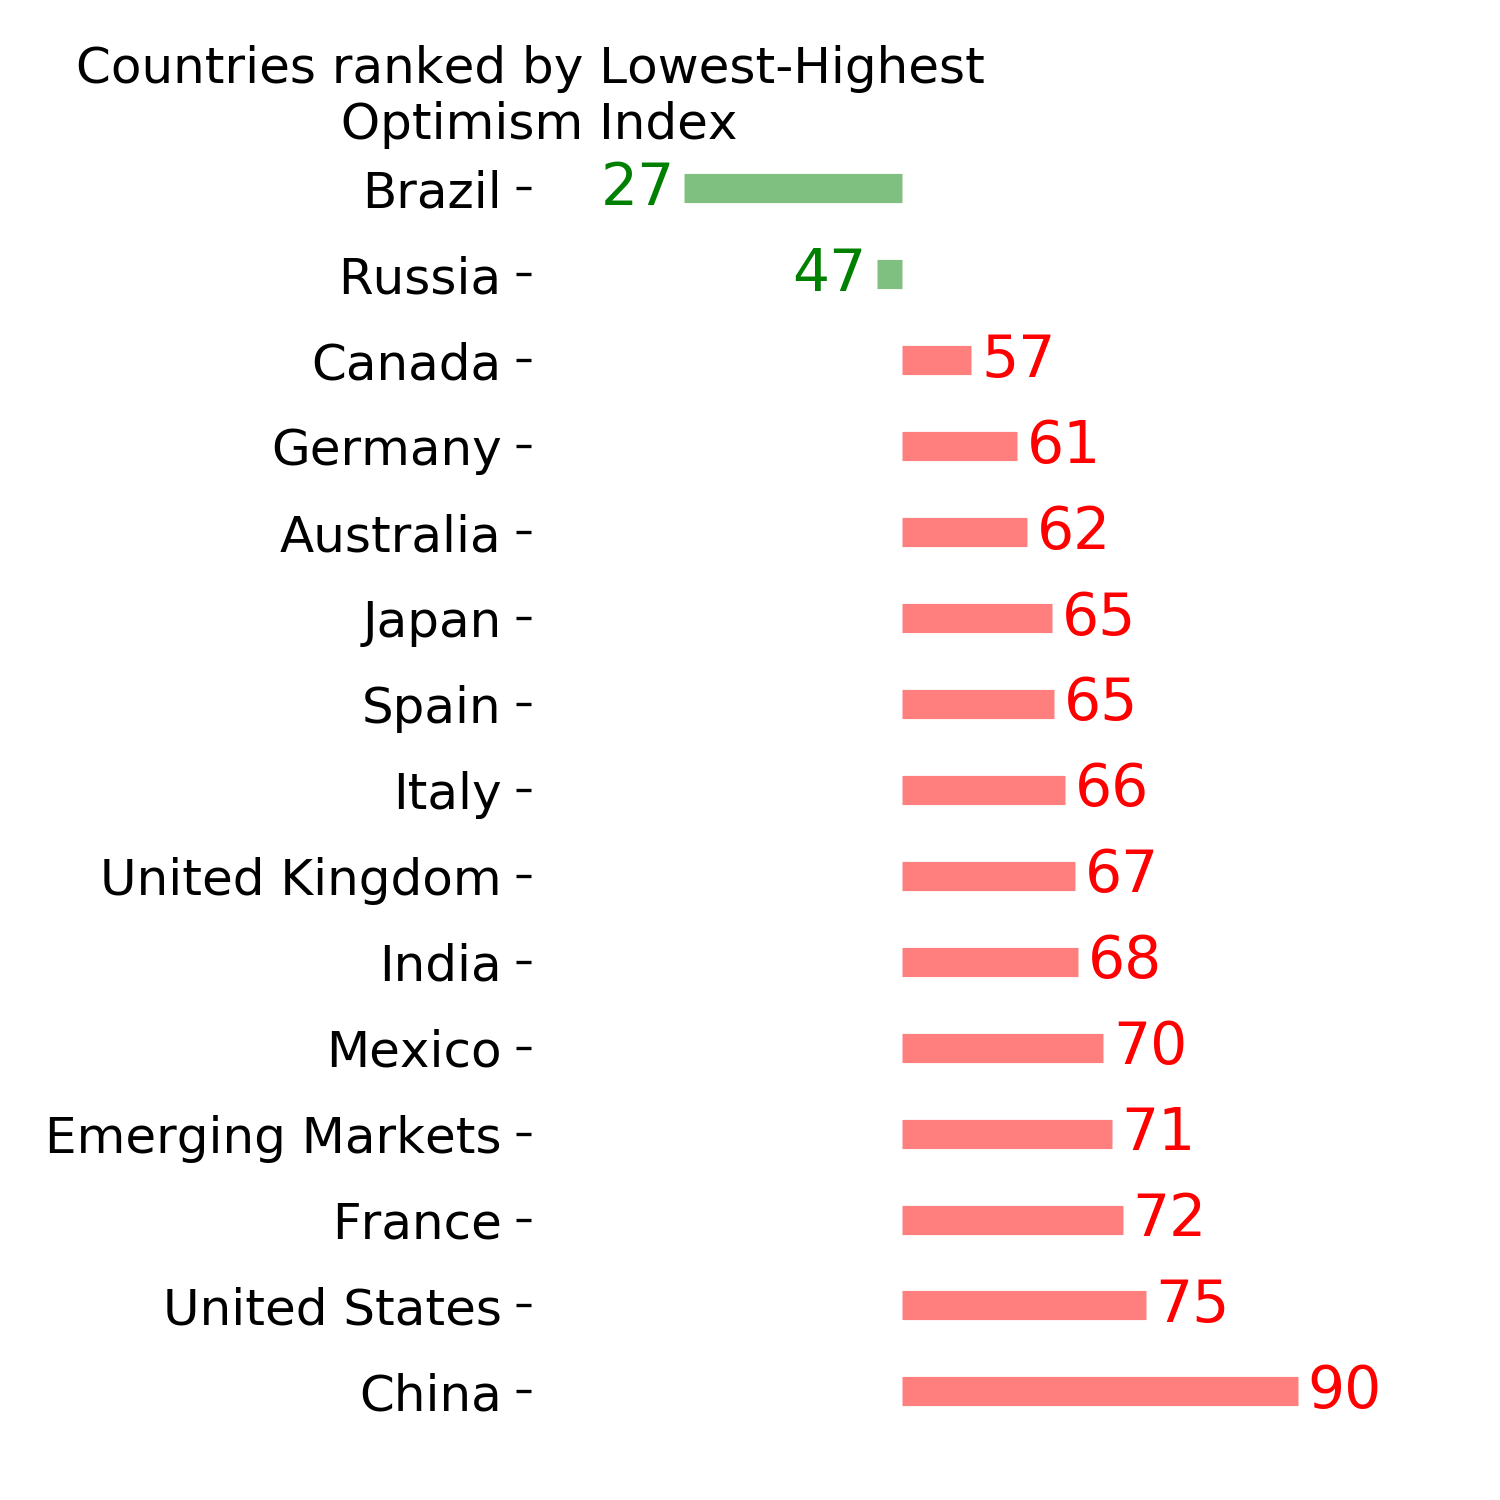
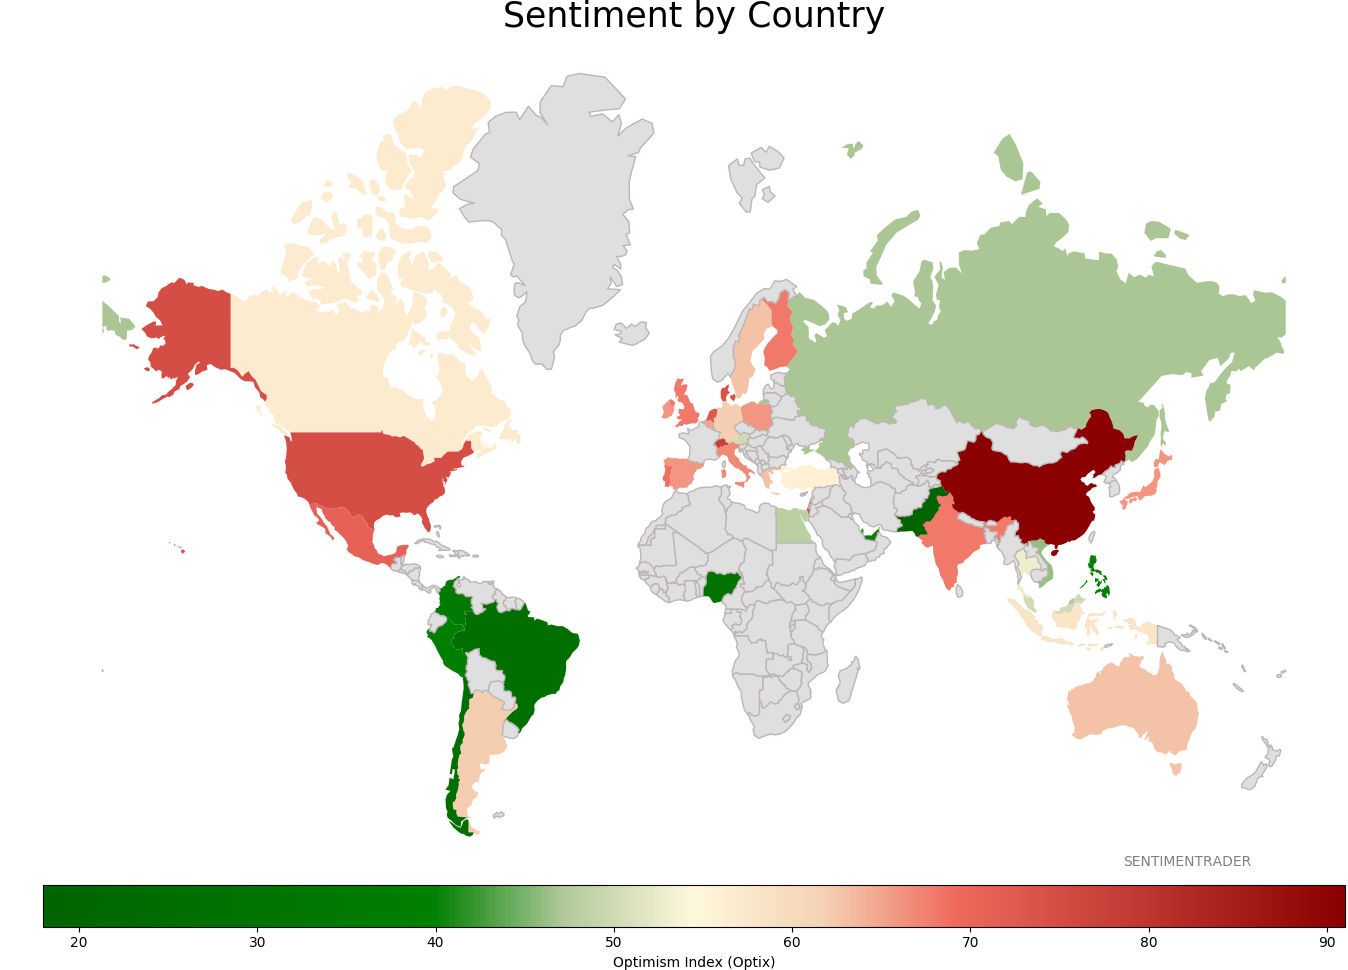
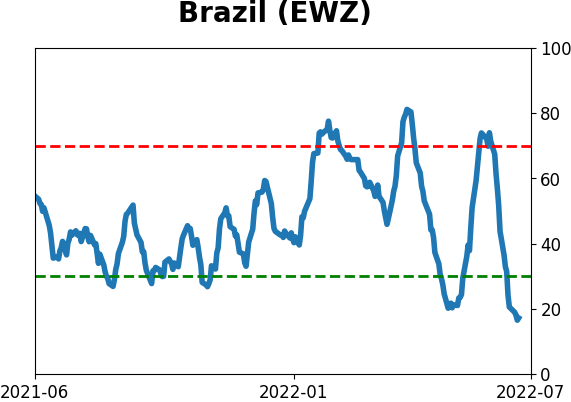
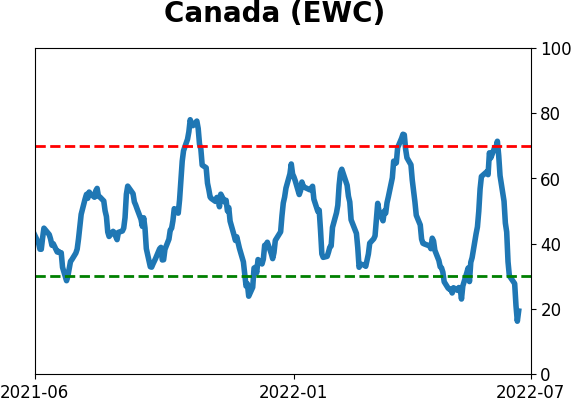
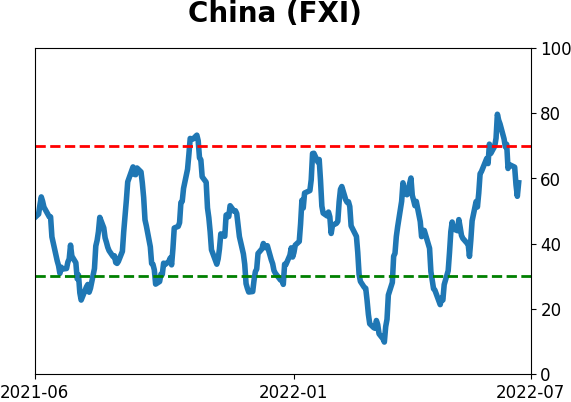
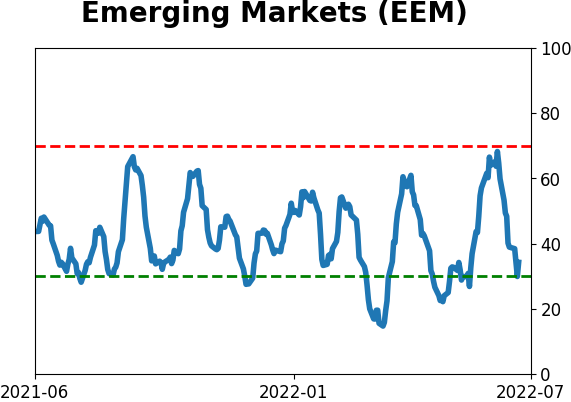
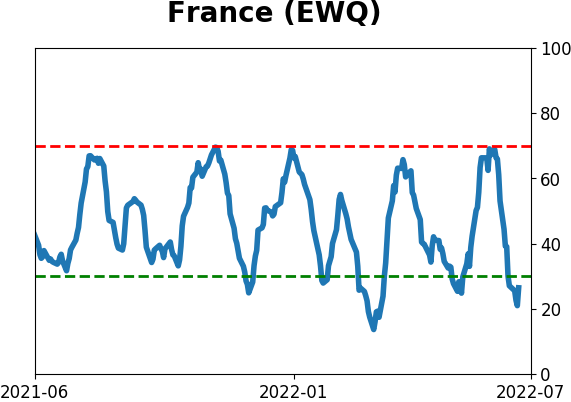
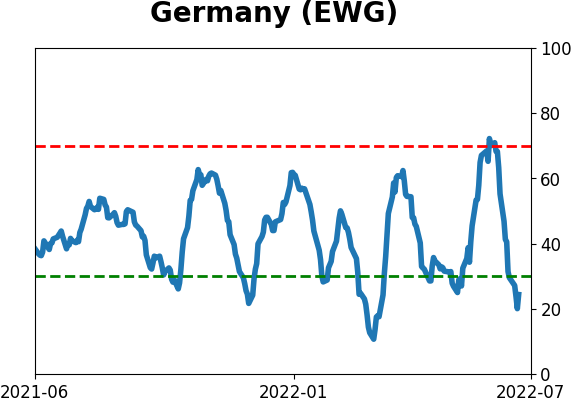
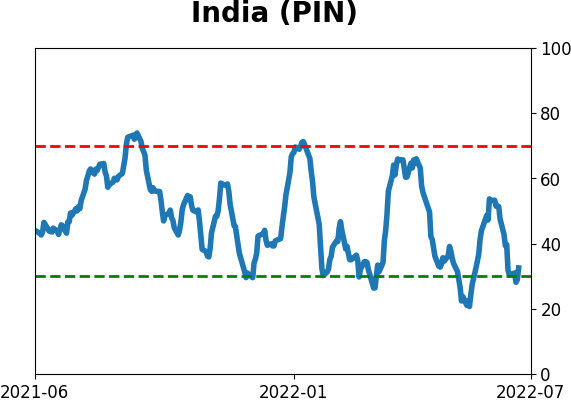
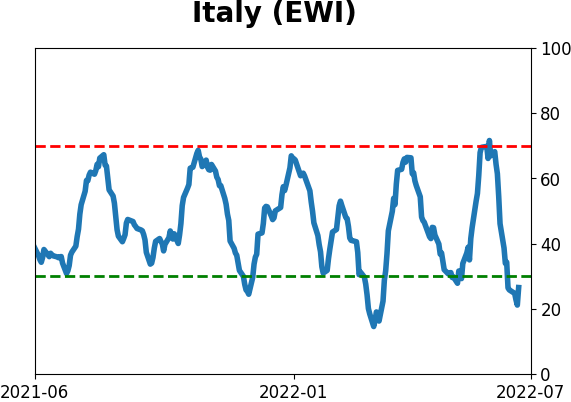
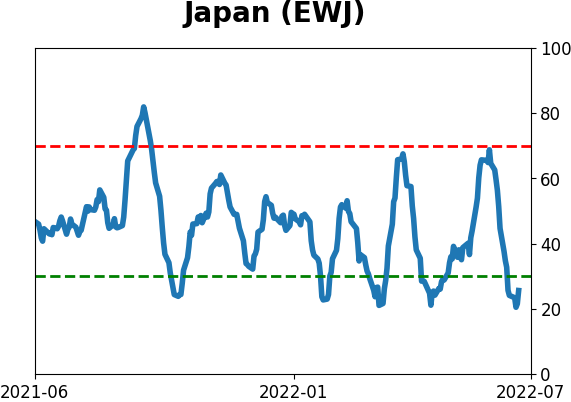
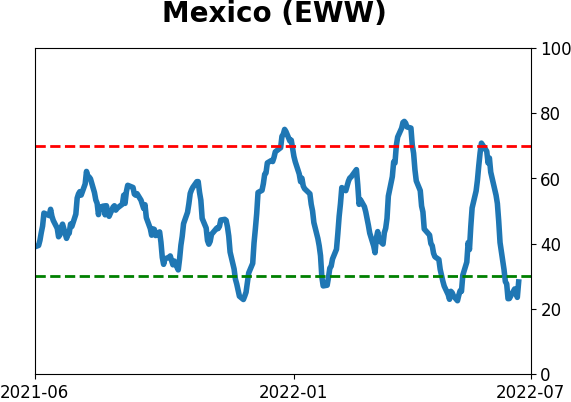
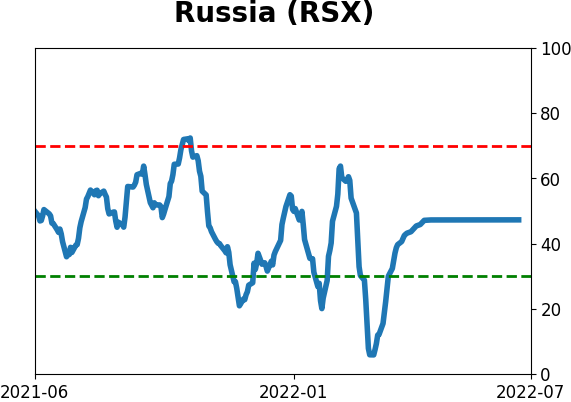
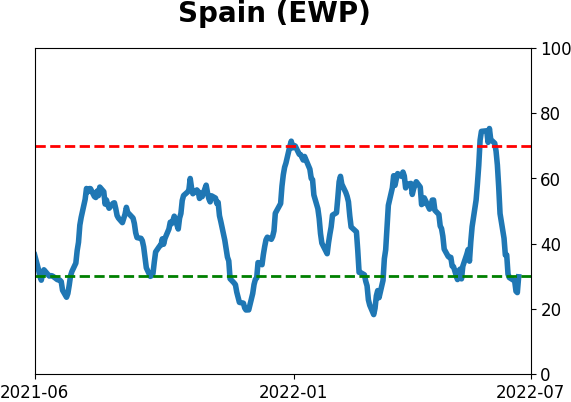
Sentiment Around The World
|
|
|
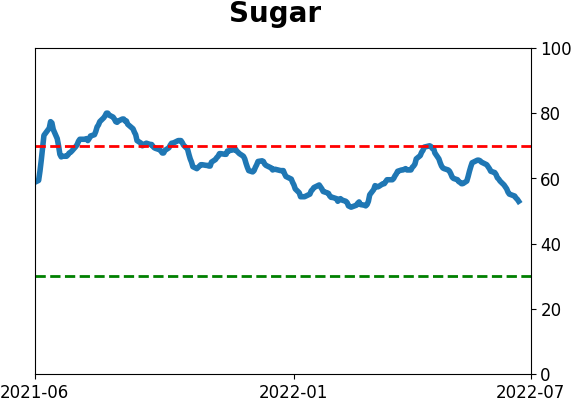
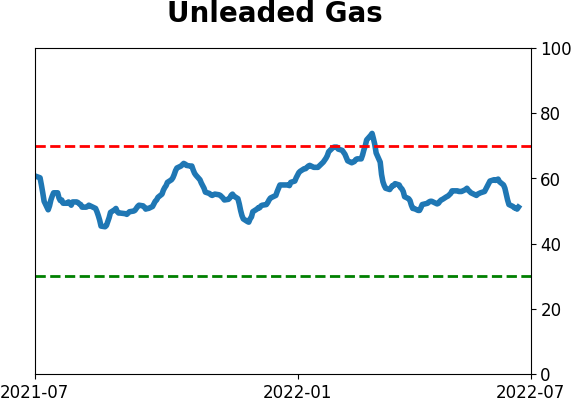
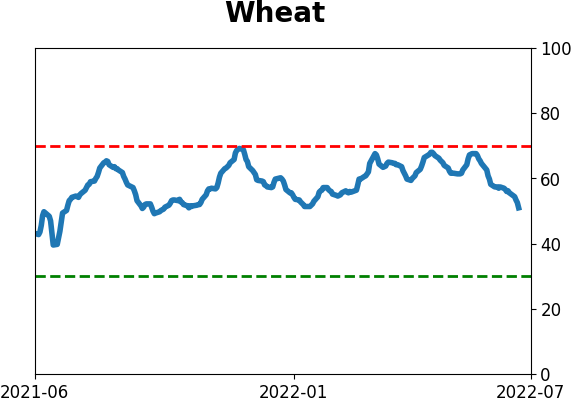
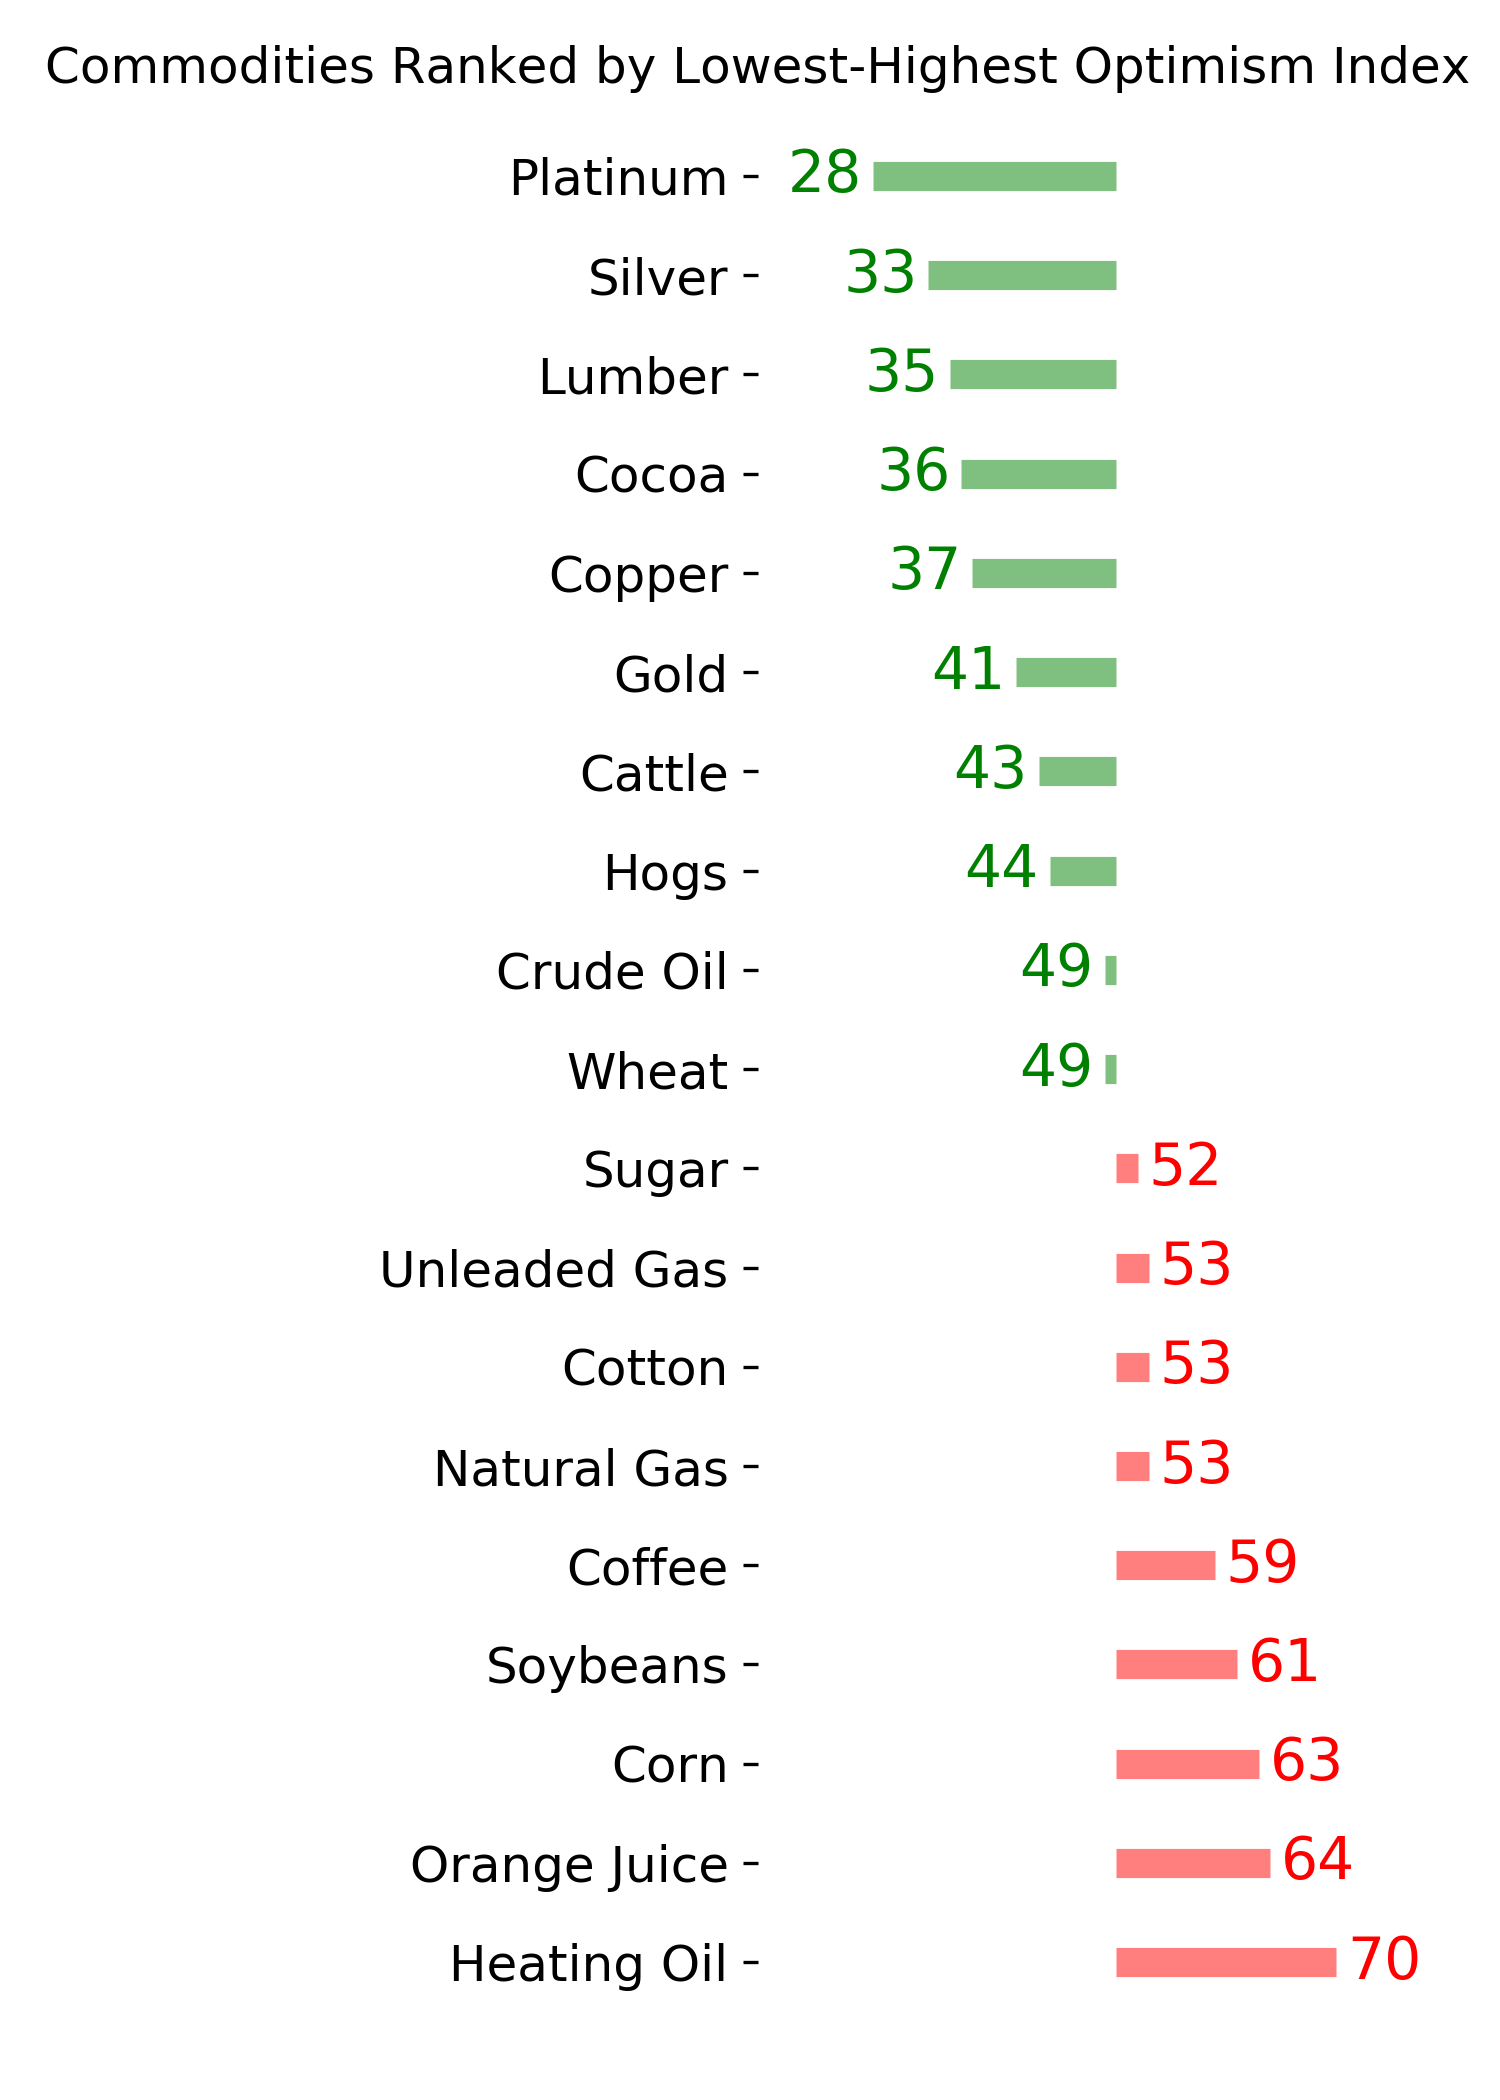
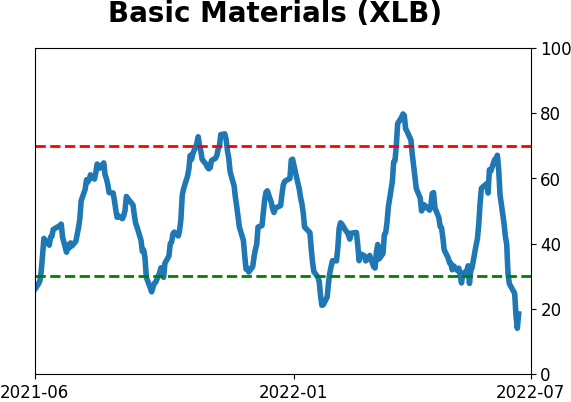
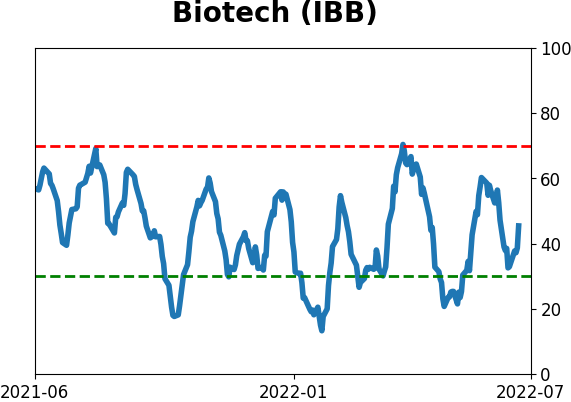
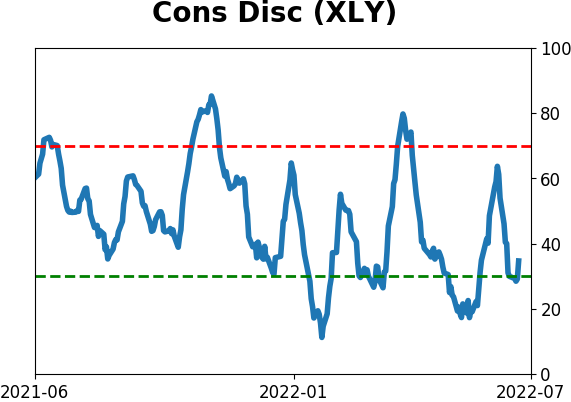
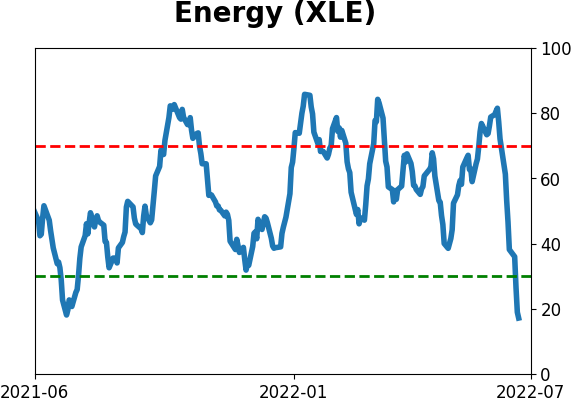
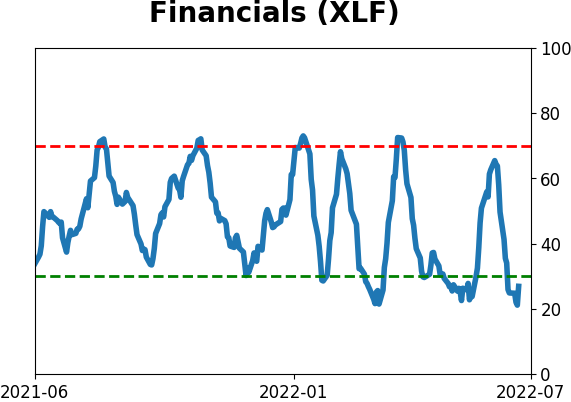
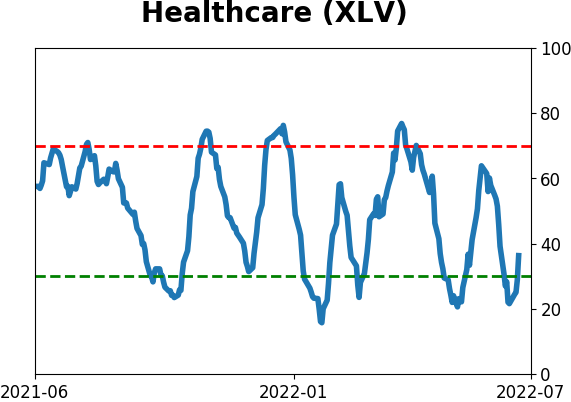
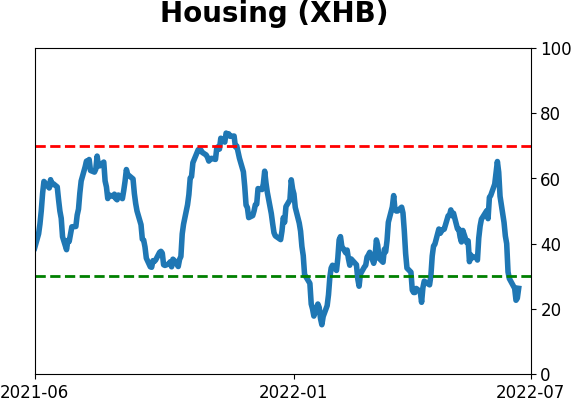
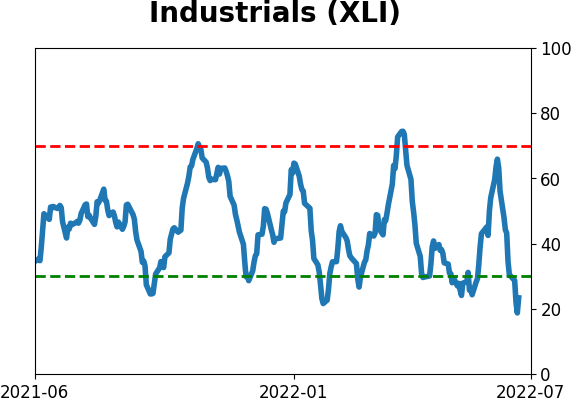
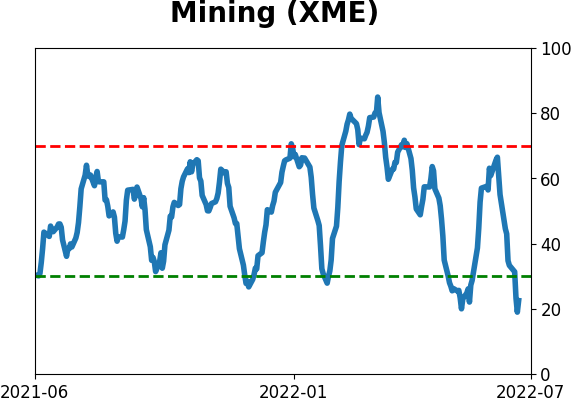
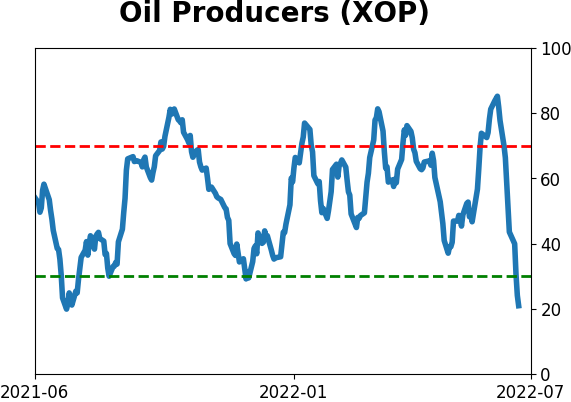
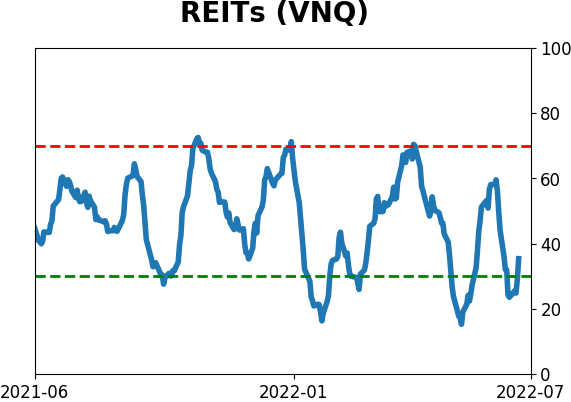
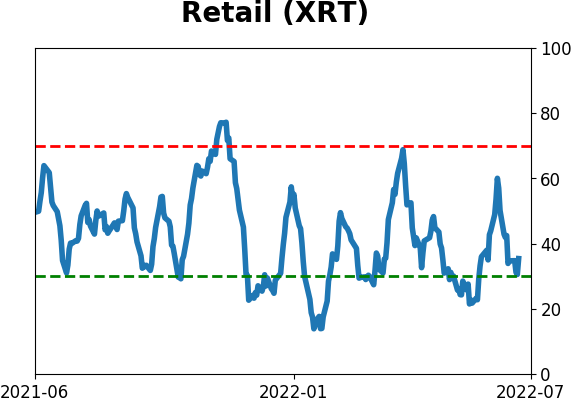
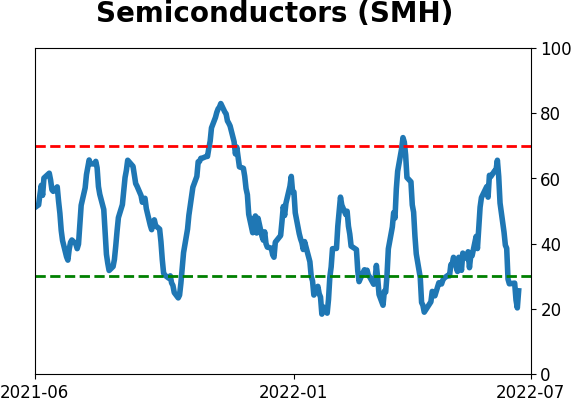
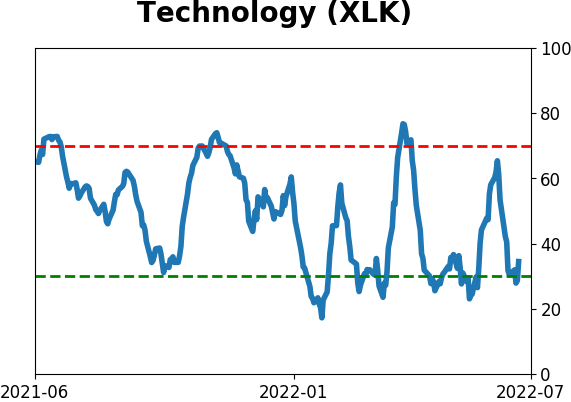
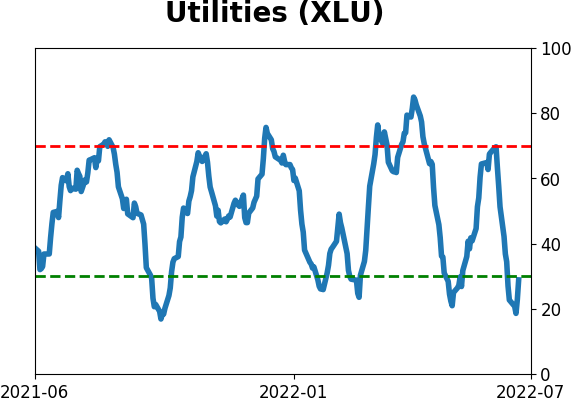
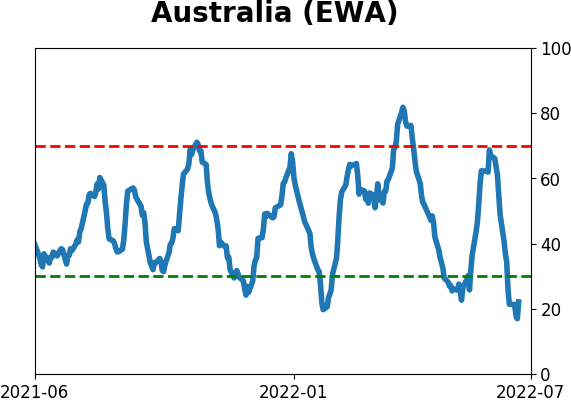
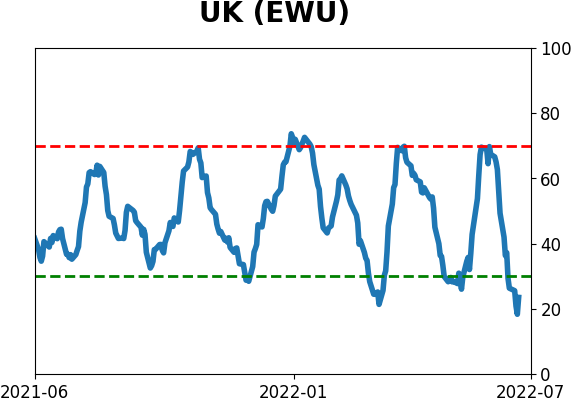
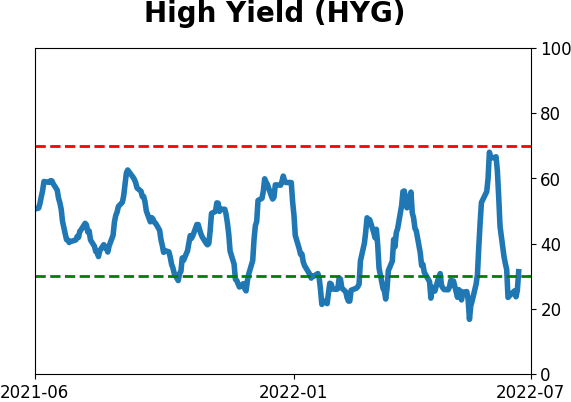
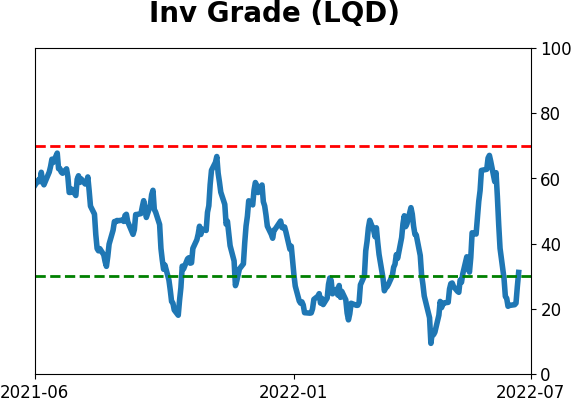
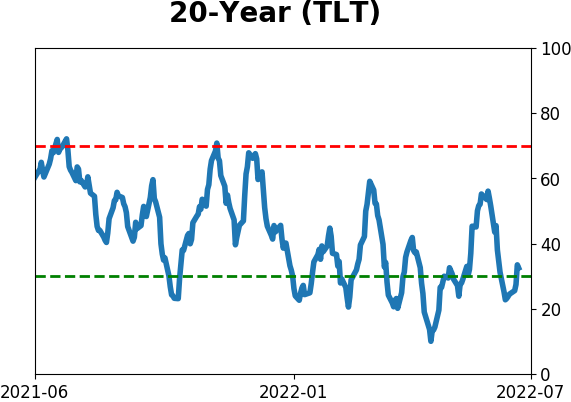
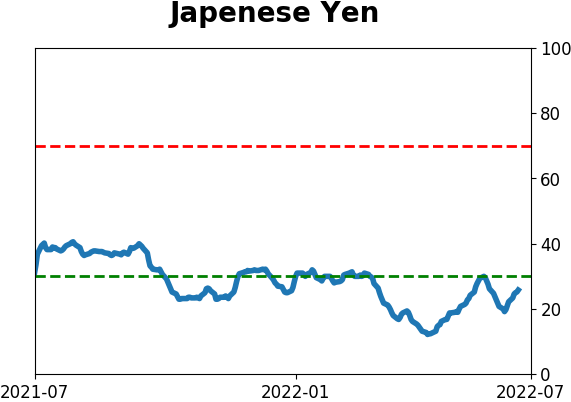
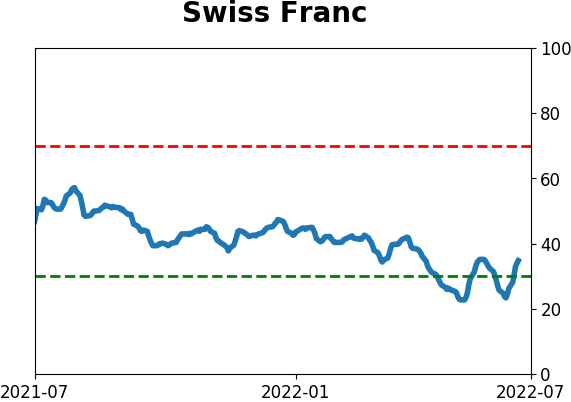
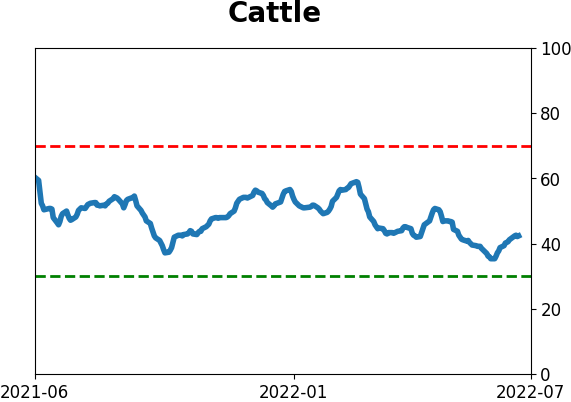
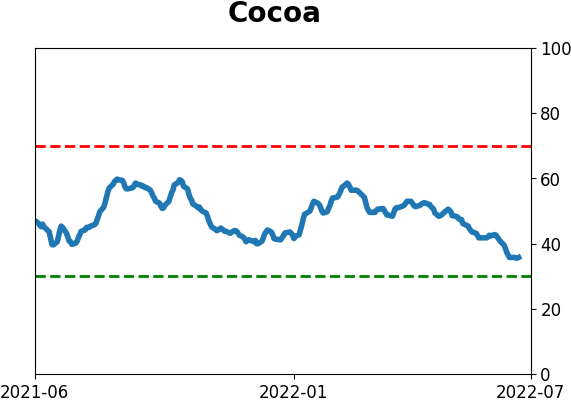
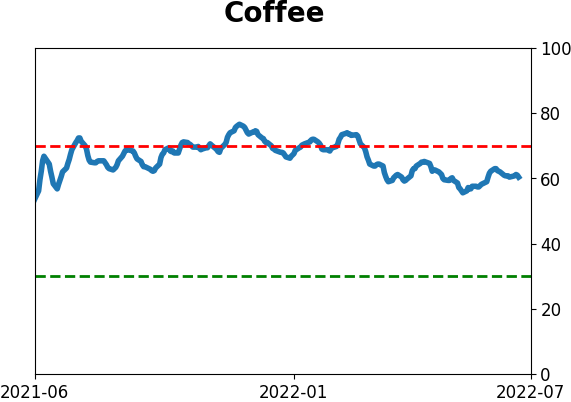
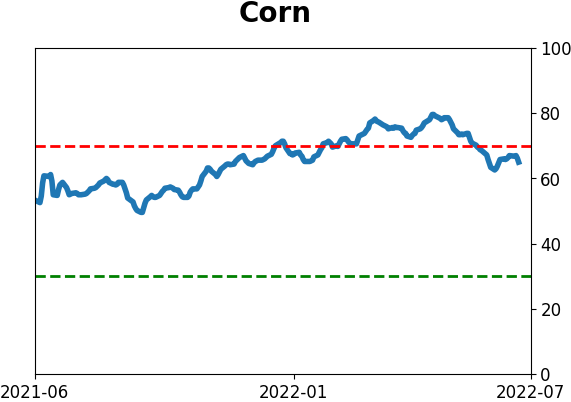
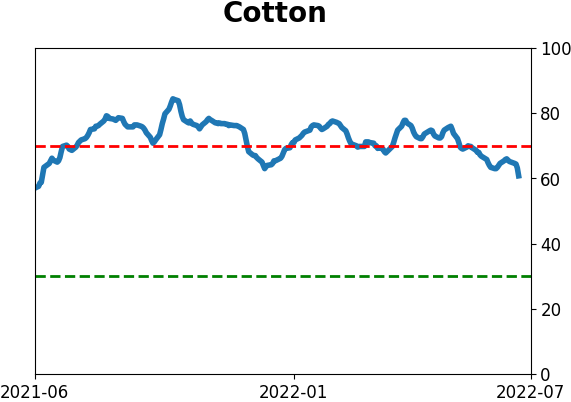
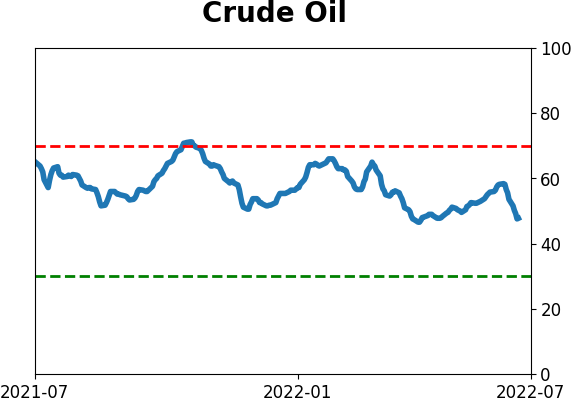
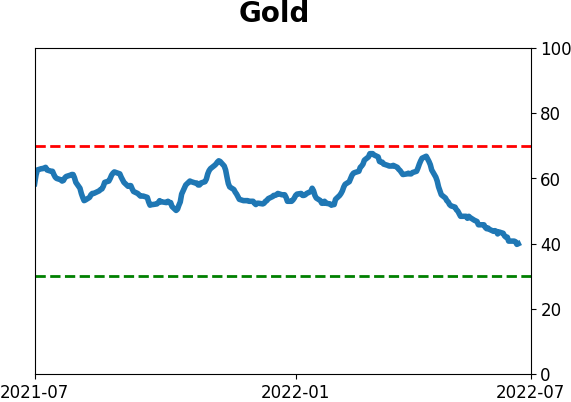
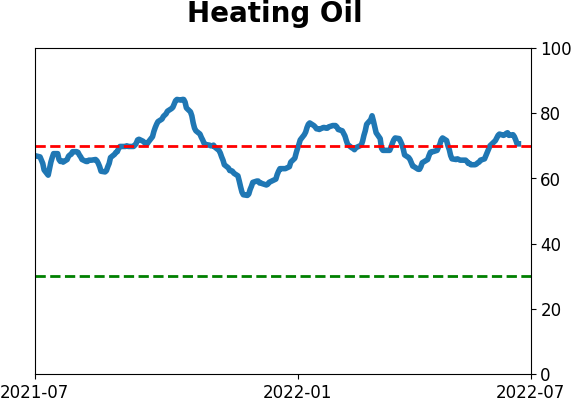
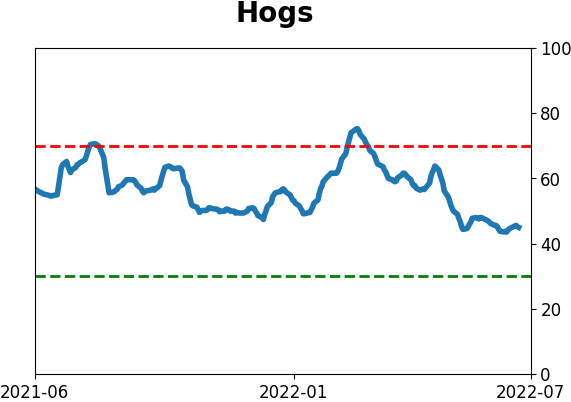
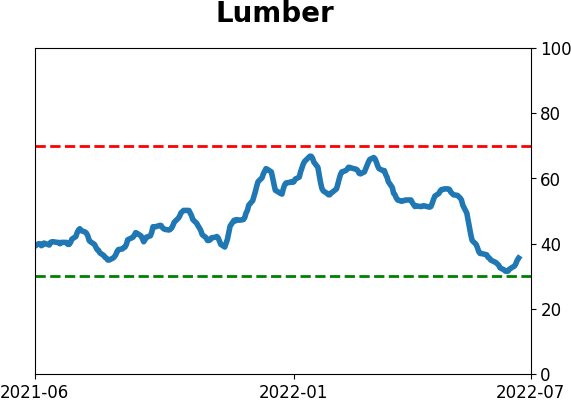
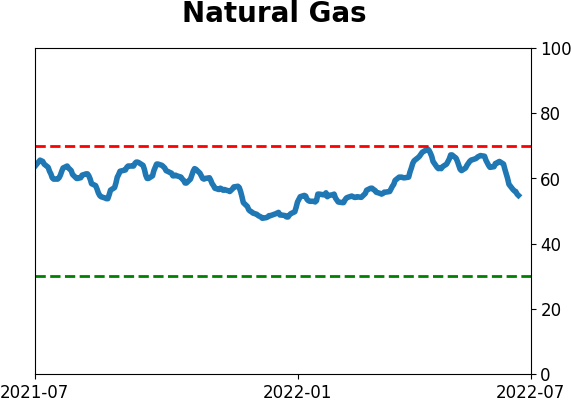
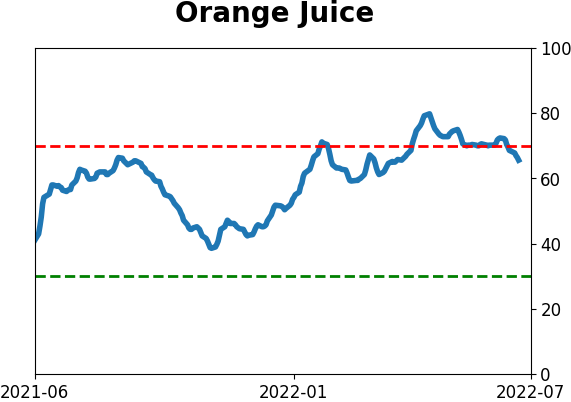
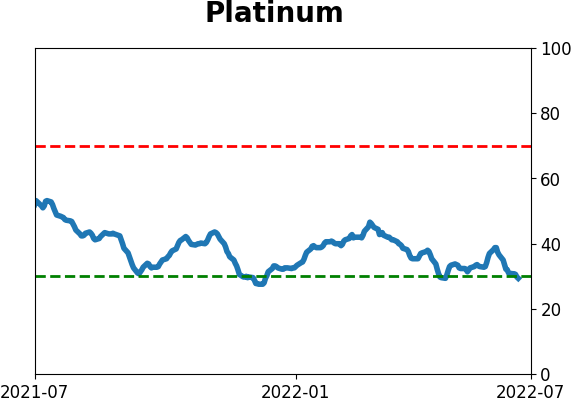
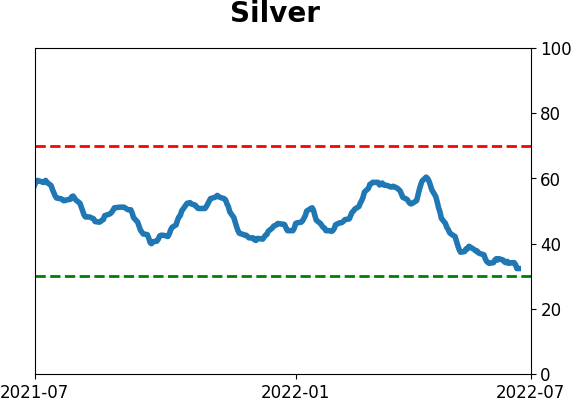
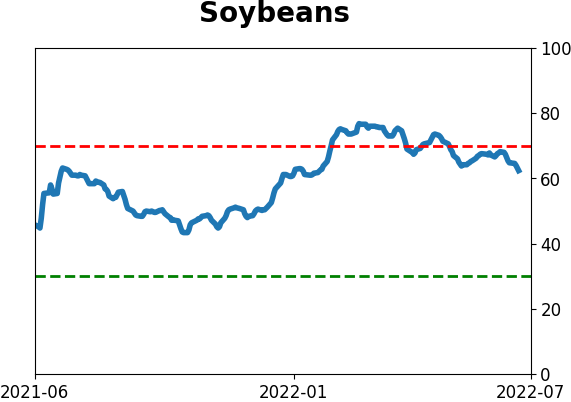
Optimism Index Thumbnails
|
|
|
|
|
|
|
|
|
|
|
|
|
|
|
|
|
|
|
|
|