Headlines
|
|
The Dollar Pain Trade:
The FX Pain indicator from Citigroup is showing heavy short positioning against the U.S. dollar. If markets follow through like they have after other periods during the last 15 years, the dollar should rally, causing problems for gold, commodities, and emerging markets.
Bottom Line:
See the Outlook & Allocations page for more details on these summaries STOCKS: Hold
The speculative frenzy in February is wrung out. Internal dynamics have mostly held up, with some exceptions. Many of our studies still show a mixed to poor short-term view, with medium- and long-term ones turning more positive. BONDS: Hold
Various parts of the market got hit in March, with the lowest Bond Optimism Index we usually see during healthy environments. After a shaky couple of weeks, the broad bond market has modestly recovered. Not a big edge here either way. GOLD: Hold
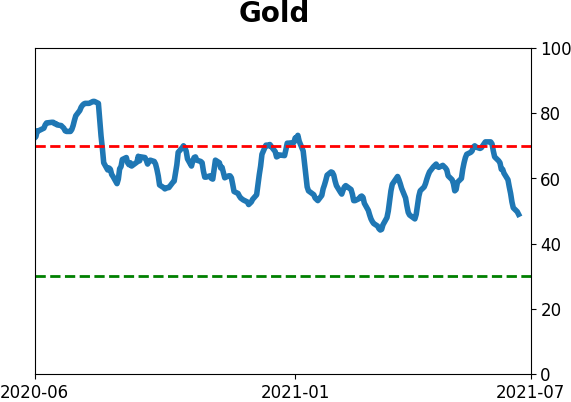
Gold and miners have done very well, recovering above long-term trend lines. The issue is that both have tended to perform poorly after similar situations - will have to wait and see how it plays out.
|
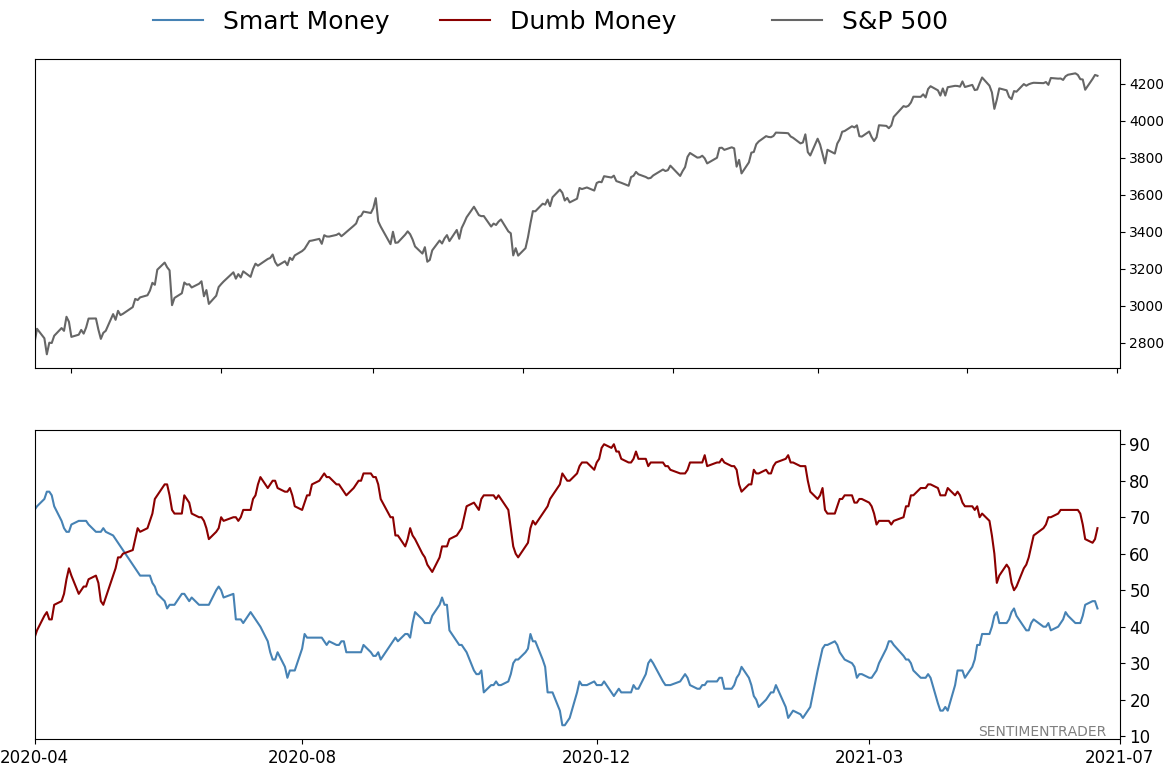
Smart / Dumb Money Confidence
|
Smart Money Confidence: 45%
Dumb Money Confidence: 67%
|
|
Risk Levels
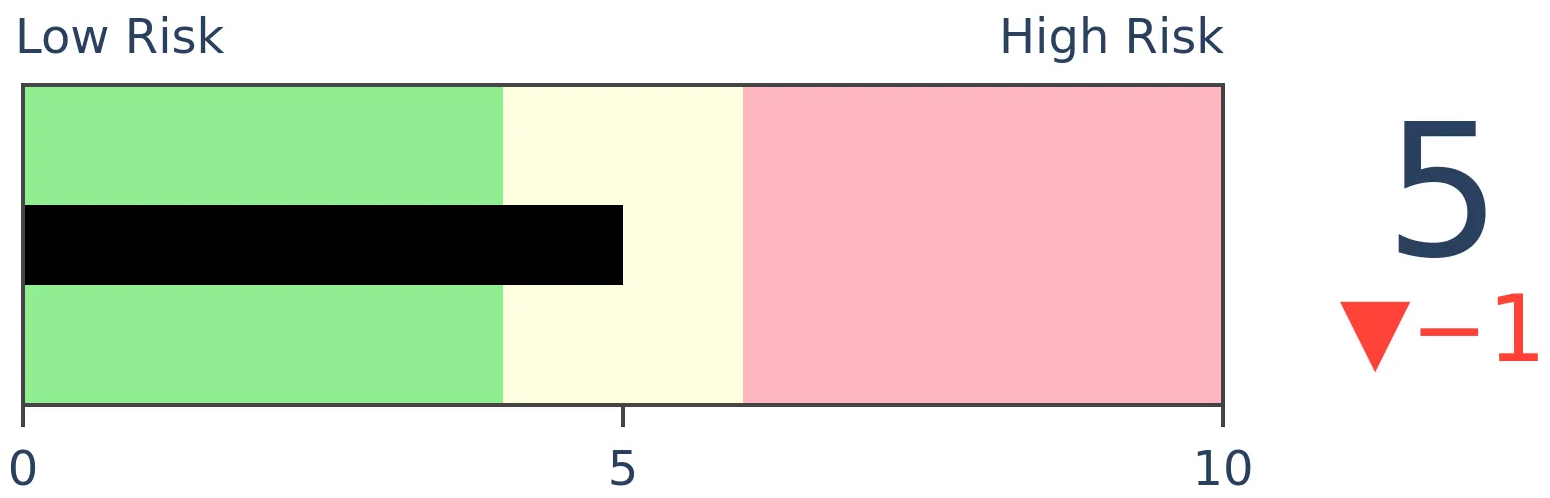
Stocks Short-Term

|
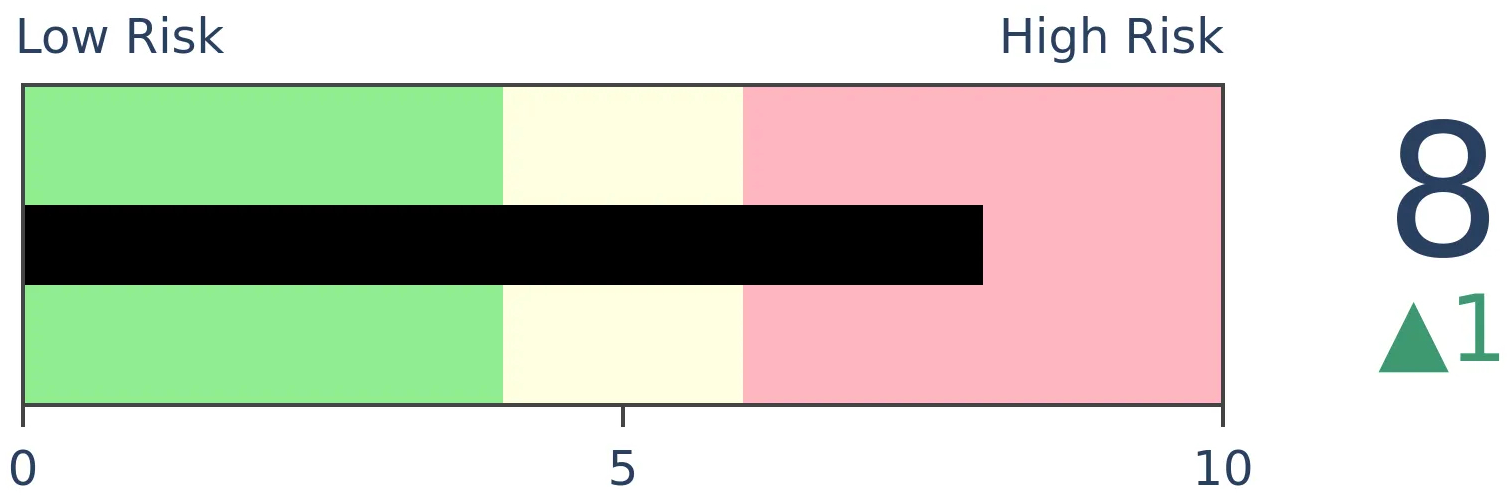
Stocks Medium-Term
|
|
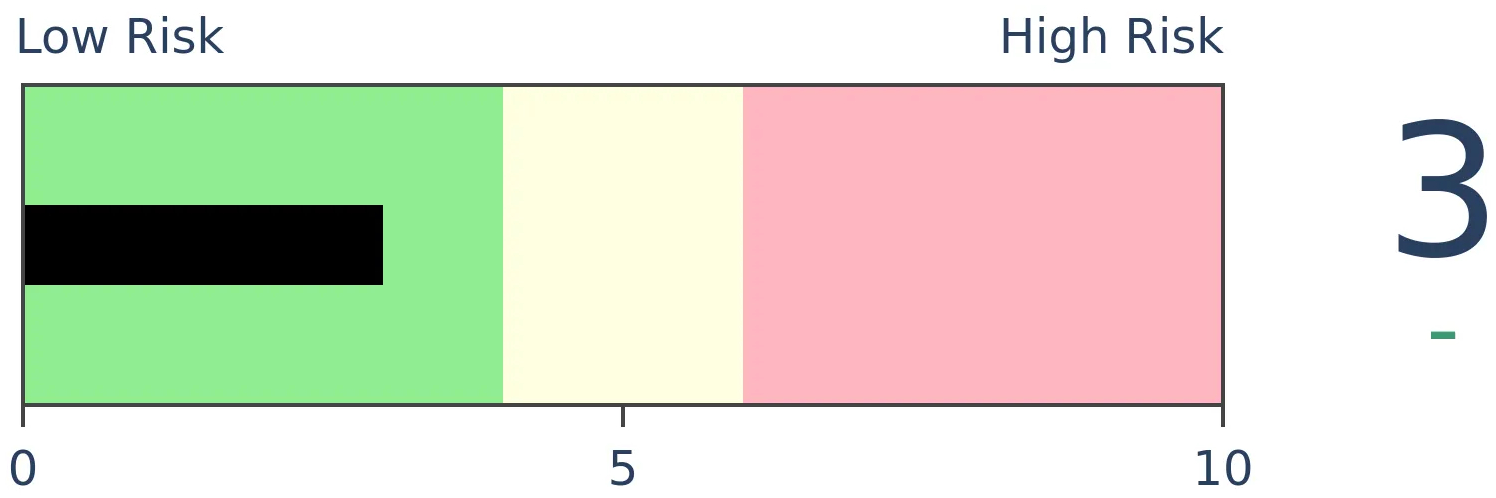
Bonds
|
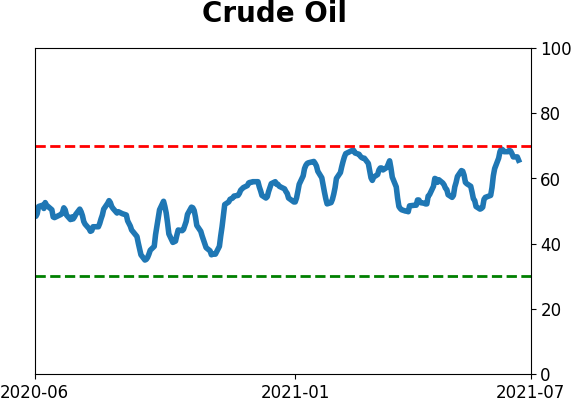
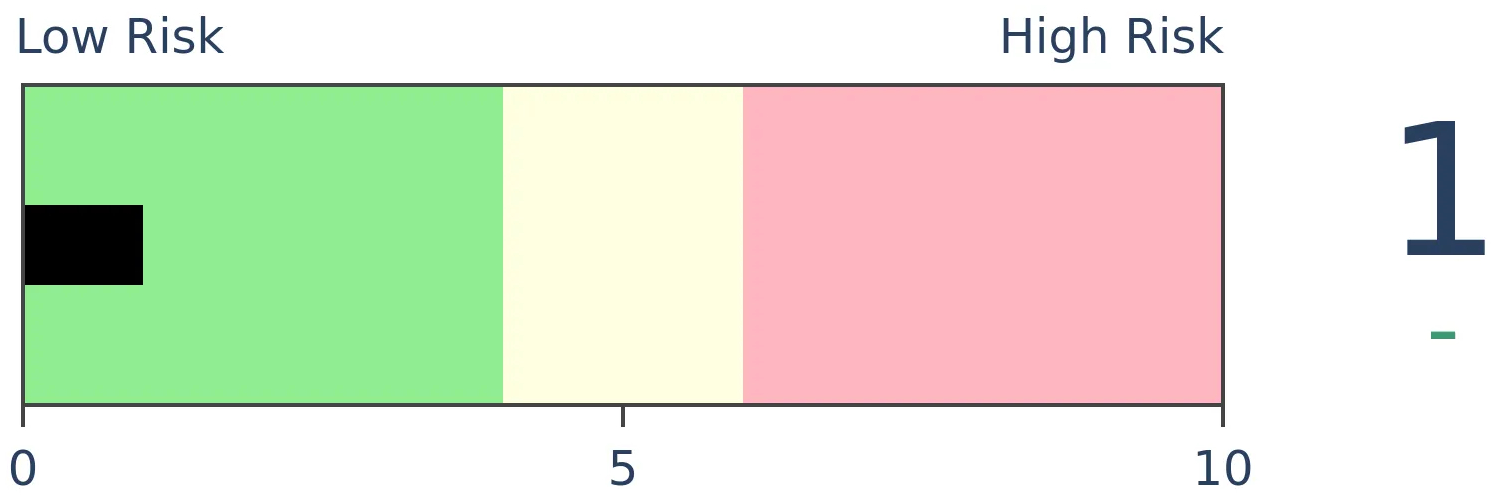
Crude Oil
|
|
Gold
|
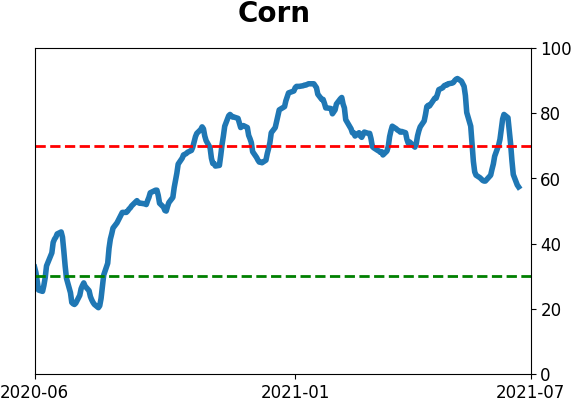
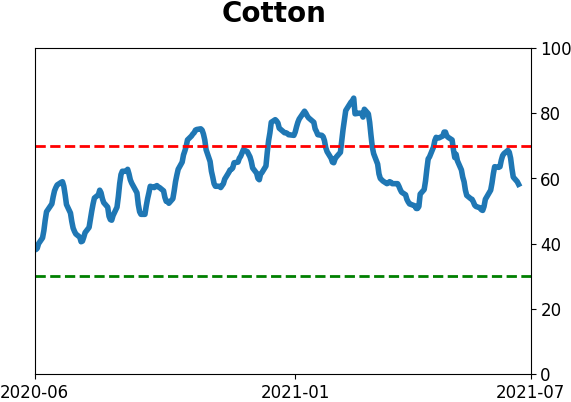
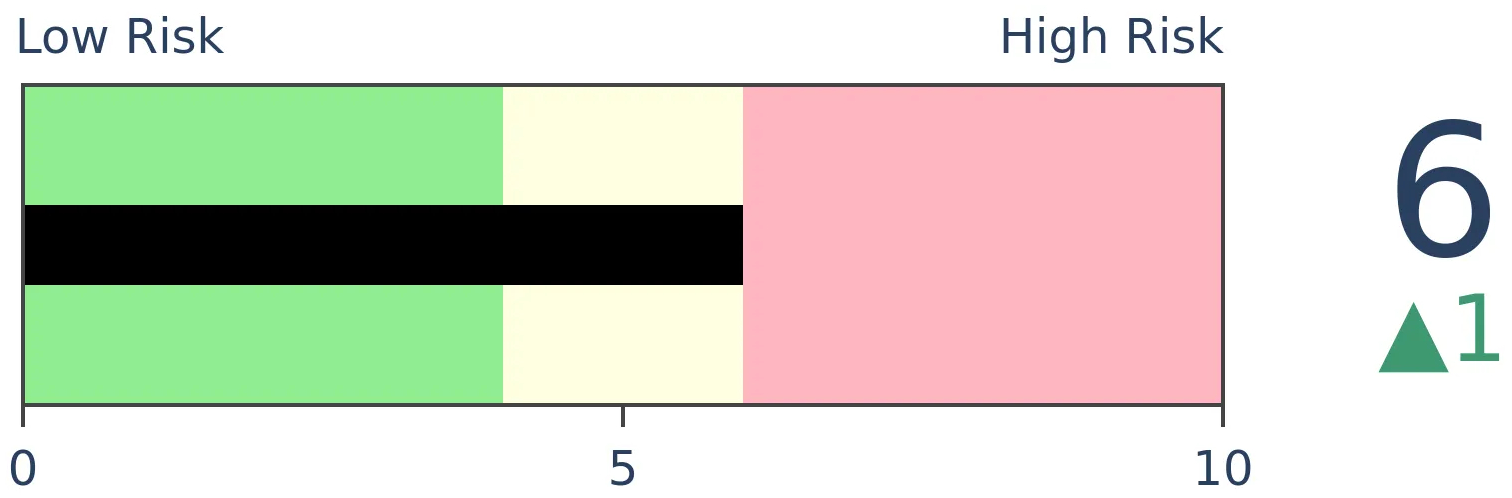
Agriculture
|
|
Research
BOTTOM LINE
The FX Pain indicator from Citigroup is showing heavy short positioning against the U.S. dollar. If markets follow through like they have after other periods during the last 15 years, the dollar should rally, causing problems for gold, commodities, and emerging markets.
FORECAST / TIMEFRAME
UUP -- Up, Medium-Term
|
Following the Federal Open Market Committee's explanation of their thinking on the economy and interest rates, the U.S. dollar exploded to the upside. It followed through for a few days before pulling back this week.
Speculators have been short the dollar (meaning "smart money" commercial hedgers have been net long), suggesting that the pain trade is to the upside. A "pain trade" is a move that will seemingly hurt the most participants, usually when they've positioned too far in one direction or the other. This doesn't always work very well in the dollar or other trending currencies, but it seemed to have an impact over the past week.
Citigroup calculates a similar metric called FX Pain. Per Bloomberg:
The Citi FX Positioning Alert Indicators infer positioning of active currency traders from relationships between exchange rates and currency managers' returns. A positive reading suggests that currency traders have been net long the currency and a negative reading suggests that currency traders have been net short the currency.
This measure recently dove below -60, the lowest in almost a decade, suggesting that traders are heavily positioned for a dollar decline.
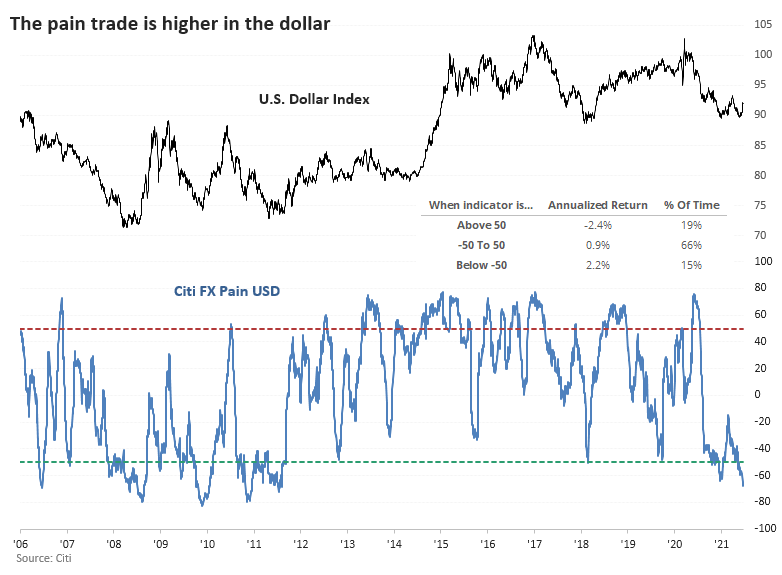
We can see from the chart that whenever FX Pain for the buck is below -50, the dollar returned an annualized +2.2%. That doesn't seem like much, but it's a pretty decent return for a currency. Conversely, it returned an annualized -2.4% when FX Pain was above +50, so a pretty decent contrary relationship there.
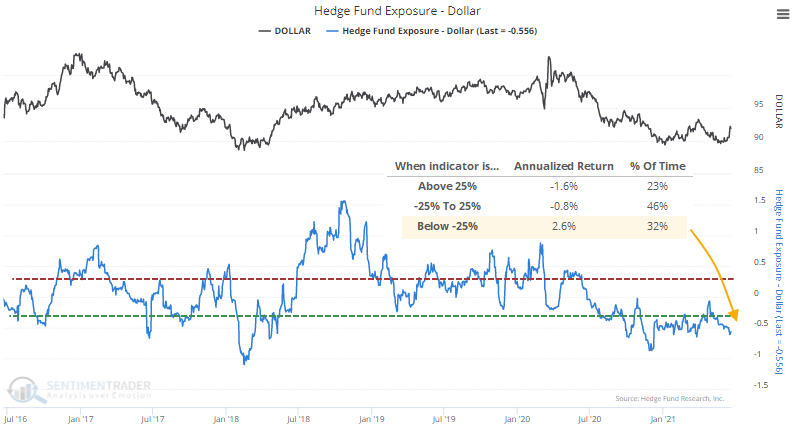
There is a similar message being given from Hedge Fund Exposure to the dollar. When it has been below 25%, the dollar's annualized return was +2.6%.
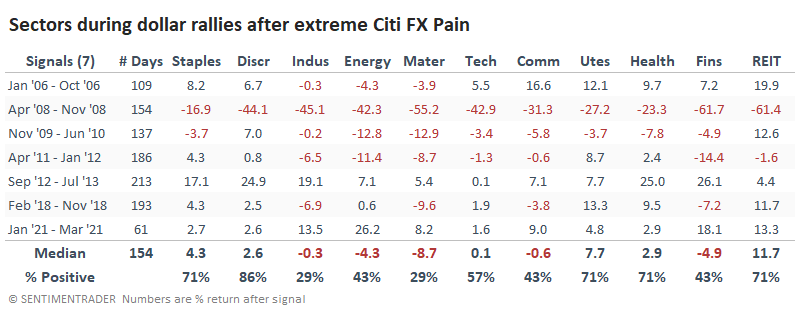
Let's assume that this pain trade is going to result in a similar setup this time. We'll go back and look at each time when FX Pain dropped deep into negative territory and look at the subsequent rallies in the dollar.
On average, the dollar rallied for 154 trading days, with a median gain of just over 10%. The table below shows how other assets and indexes performed during those stretches.
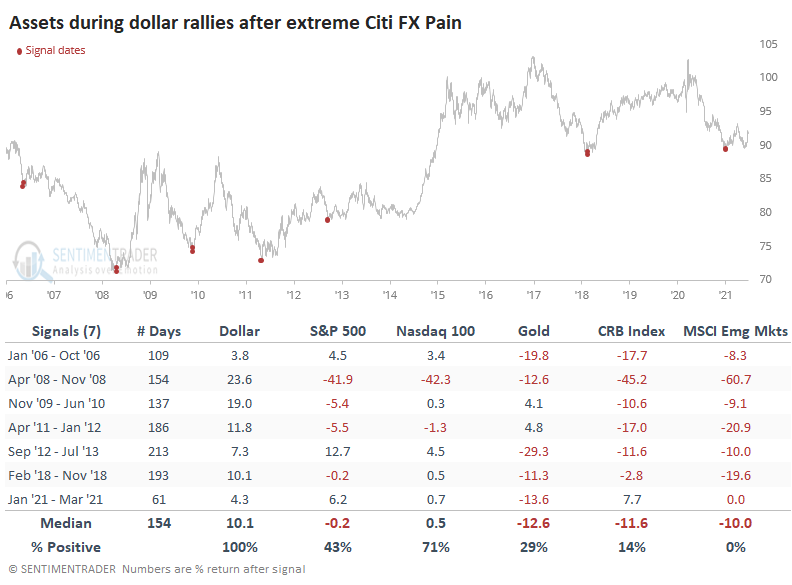
It was a mixed bag for stocks, with the big exception being the depths of the financial crisis. Big tech stocks in the Nasdaq 100 fared better overall. Not surprisingly, the assets with the most consistent negative correlation to the dollar did terribly. Gold, commodities, and especially emerging markets all suffered losses. If the dollar reacts as it has during the past 15 years, then it will be a major headwind to those three markets.
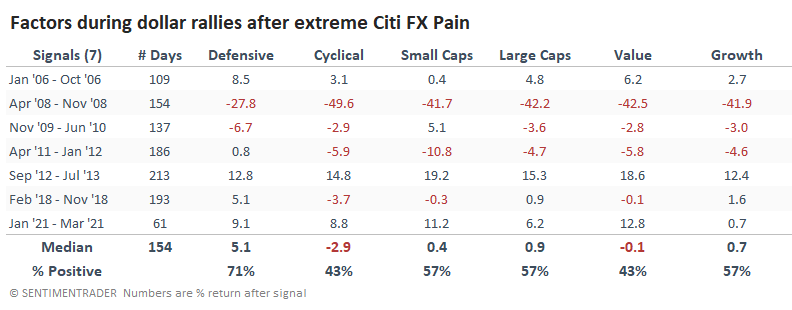
In terms of major equity factors, there wasn't anything that stood out overly compelling. Defensive stocks fared the best, with the others all showing "meh" returns.
For major sectors, Discretionary stocks did well, with the lone exception being the financial crisis. We don't see this kind of behavior very often, but defensive sectors like Utilities and Health Care did well along with Discretionary stocks. The worst performers were Industrials and Materials, with only two gains out of seven attempts (though those two were big exceptions).
After other bottoms coinciding with these dollar pain trades, the buck sometimes chopped around for a few weeks after an initial surge. The biggest caveat would be a complete give-back of all the recent gains, which would be entirely out of character with the regimes above. If traders are going to follow through the way they have during recent reversals, we should see minimal losses in the dollar and a series of higher highs. That's going to be painful for gold bugs and investors trying to hold cheaper emerging market stocks.
Active Studies
| Time Frame | Bullish | Bearish | | Short-Term | 0 | 1 | | Medium-Term | 2 | 12 | | Long-Term | 11 | 5 |
|
Indicators at Extremes
Portfolio
| Position | Description | Weight % | Added / Reduced | Date | | Stocks | RSP | 4.1 | Added 4.1% | 2021-05-19 | | Bonds | 23.9% BND, 6.9% SCHP | 30.7 | Reduced 7.1% | 2021-05-19 | | Commodities | GCC | 2.6 | Reduced 2.1%
| 2020-09-04 | | Precious Metals | GDX | 5.6 | Reduced 4.2% | 2021-05-19 | | Special Situations | 4.3% XLE, 2.2% PSCE | 7.6 | Reduced 5.6% | 2021-04-22 | | Cash | | 49.4 | | |
|
Updates (Changes made today are underlined)
Much of our momentum and trend work has remained positive for several months, with some scattered exceptions. Almost all sentiment-related work has shown a poor risk/reward ratio for stocks, especially as speculation drove to record highs in exuberance in February. Much of that has worn off, and most of our models are back toward neutral levels. There isn't much to be excited about here. The same goes for bonds and even gold. Gold has been performing well lately and is back above long-term trend lines. The issue is that it has a poor record of holding onto gains when attempting a long-term trend change like this, so we'll take a wait-and-see approach. RETURN YTD: 9.4% 2020: 8.1%, 2019: 12.6%, 2018: 0.6%, 2017: 3.8%, 2016: 17.1%, 2015: 9.2%, 2014: 14.5%, 2013: 2.2%, 2012: 10.8%, 2011: 16.5%, 2010: 15.3%, 2009: 23.9%, 2008: 16.2%, 2007: 7.8%
|
|
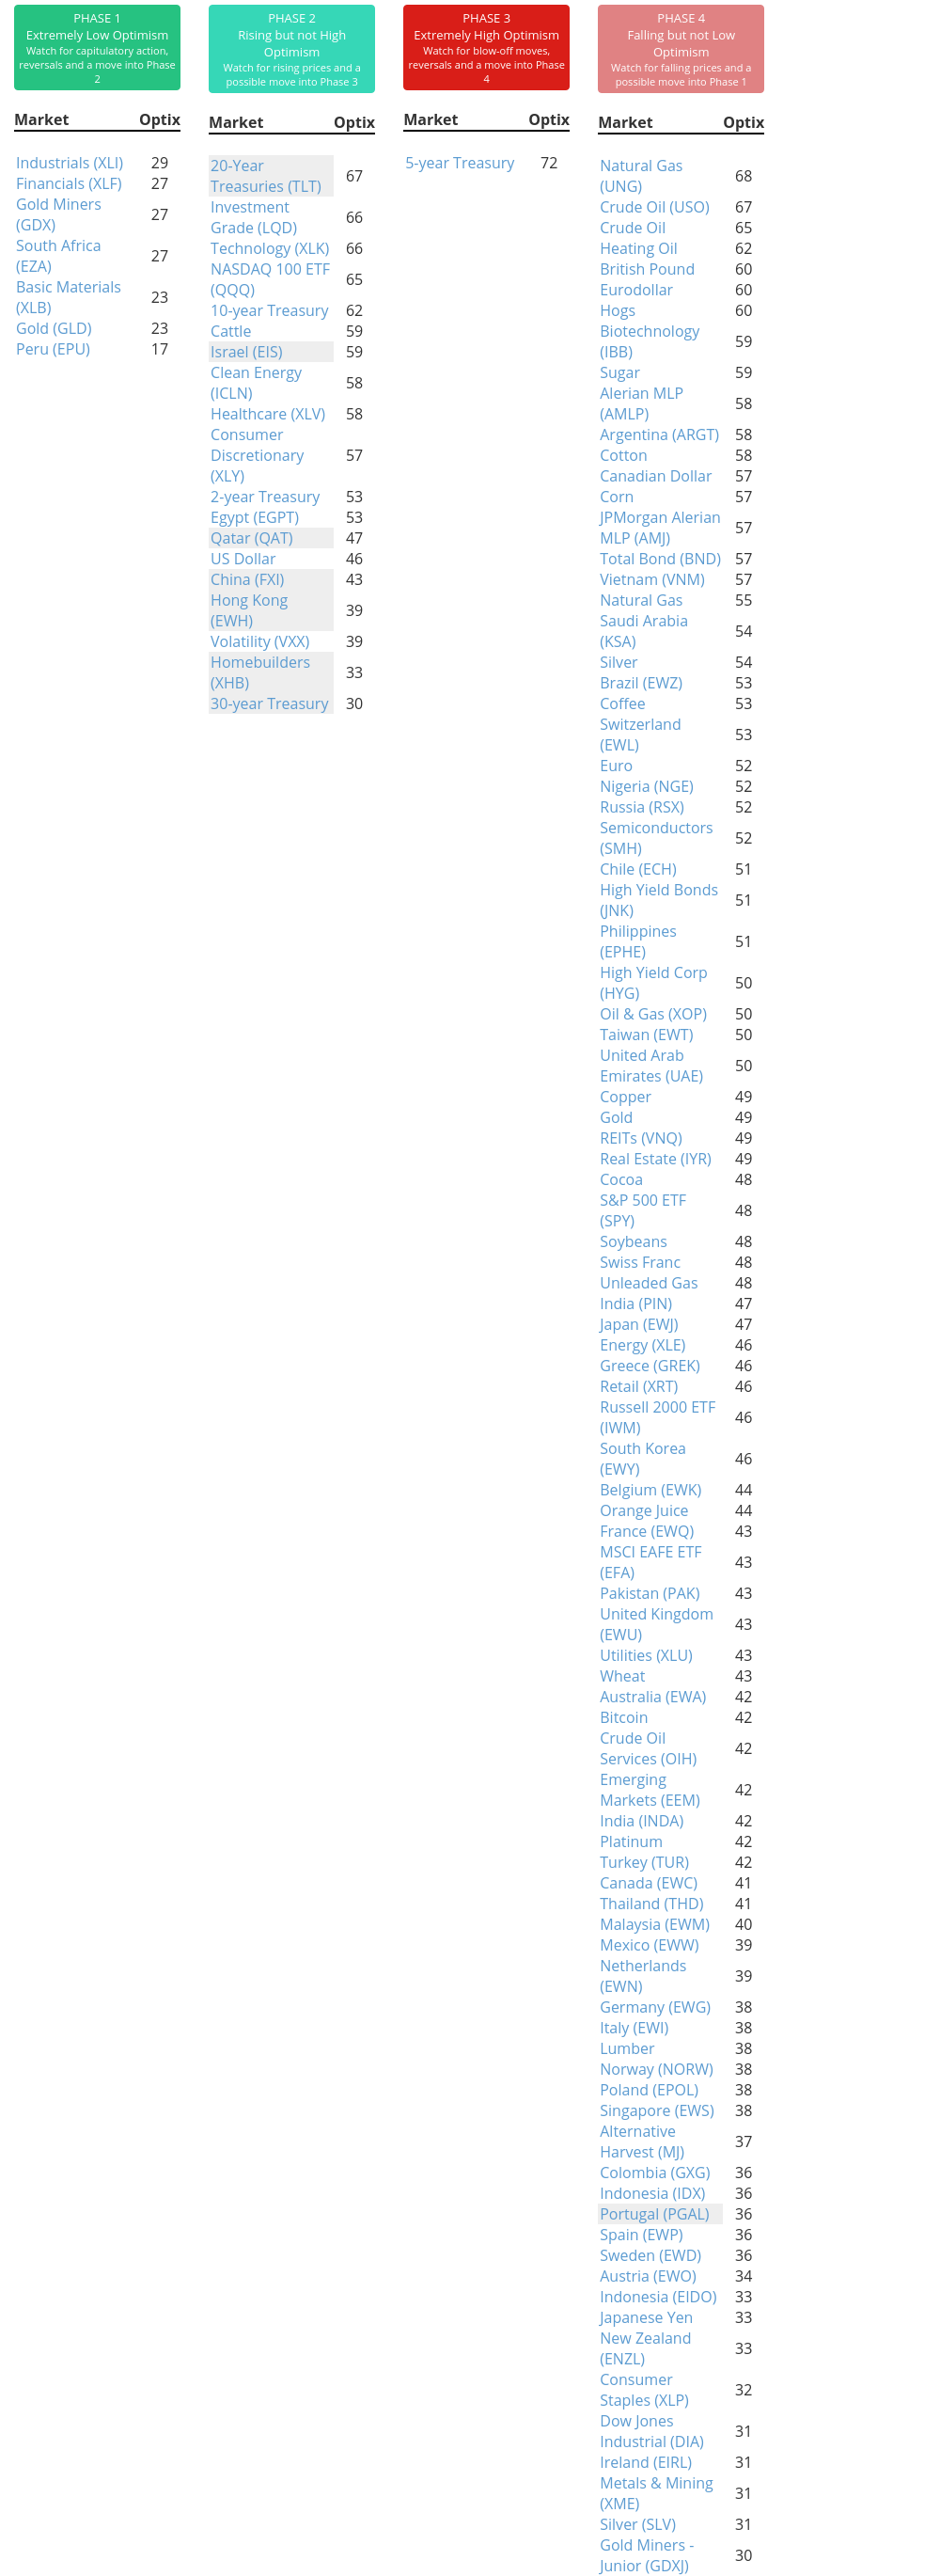
Phase Table
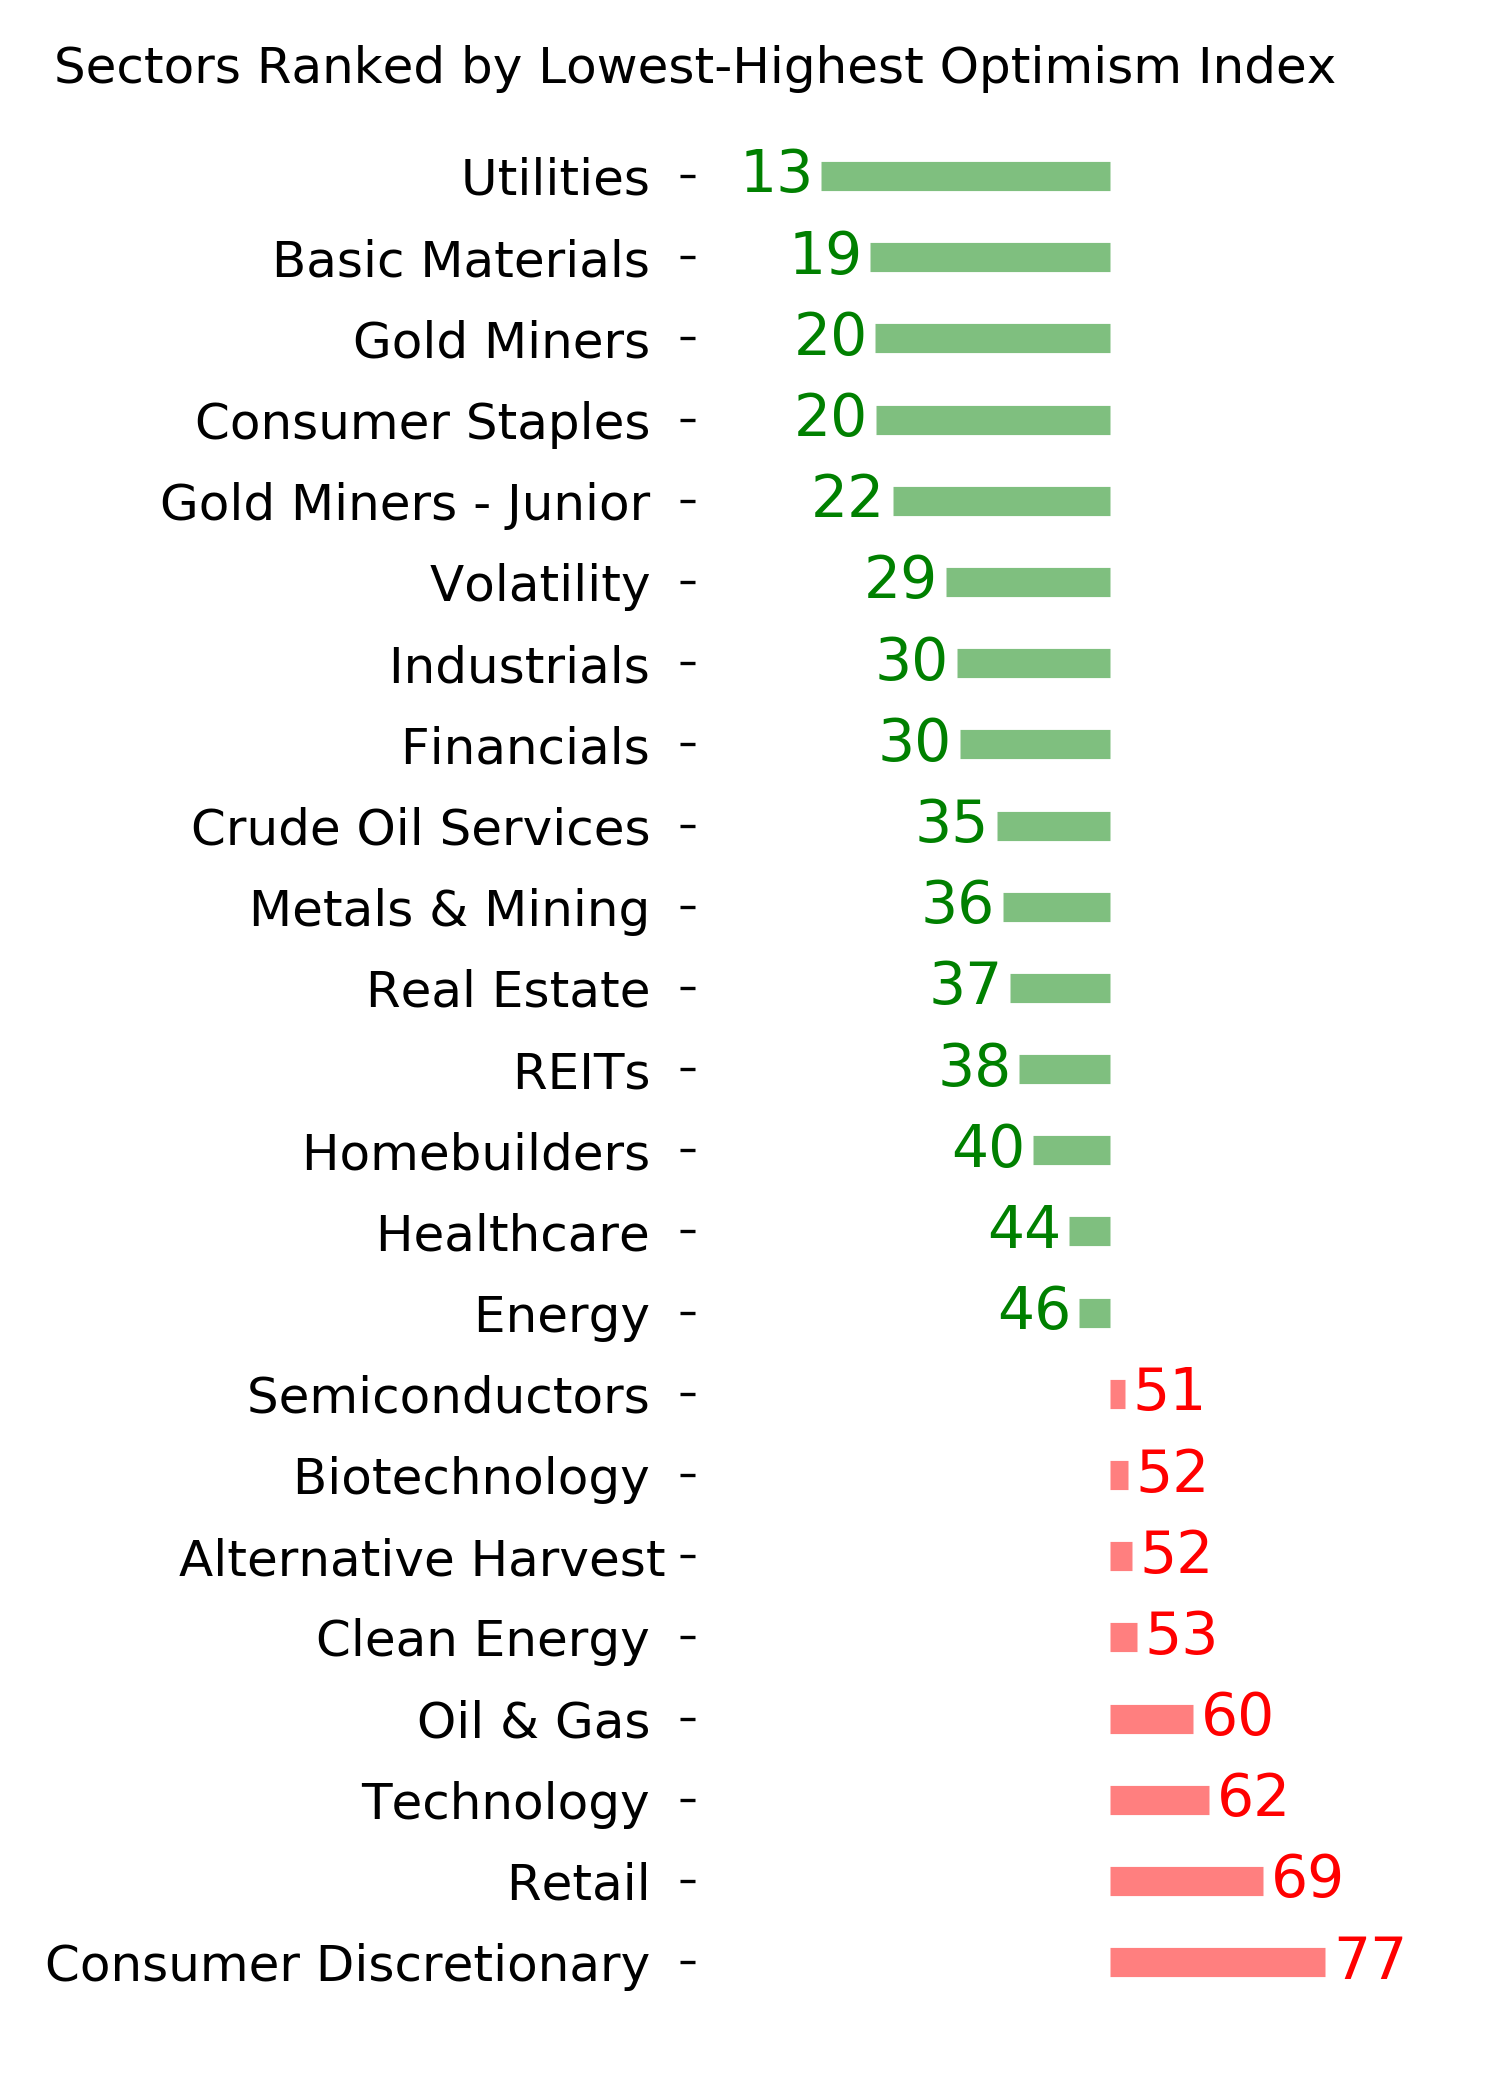
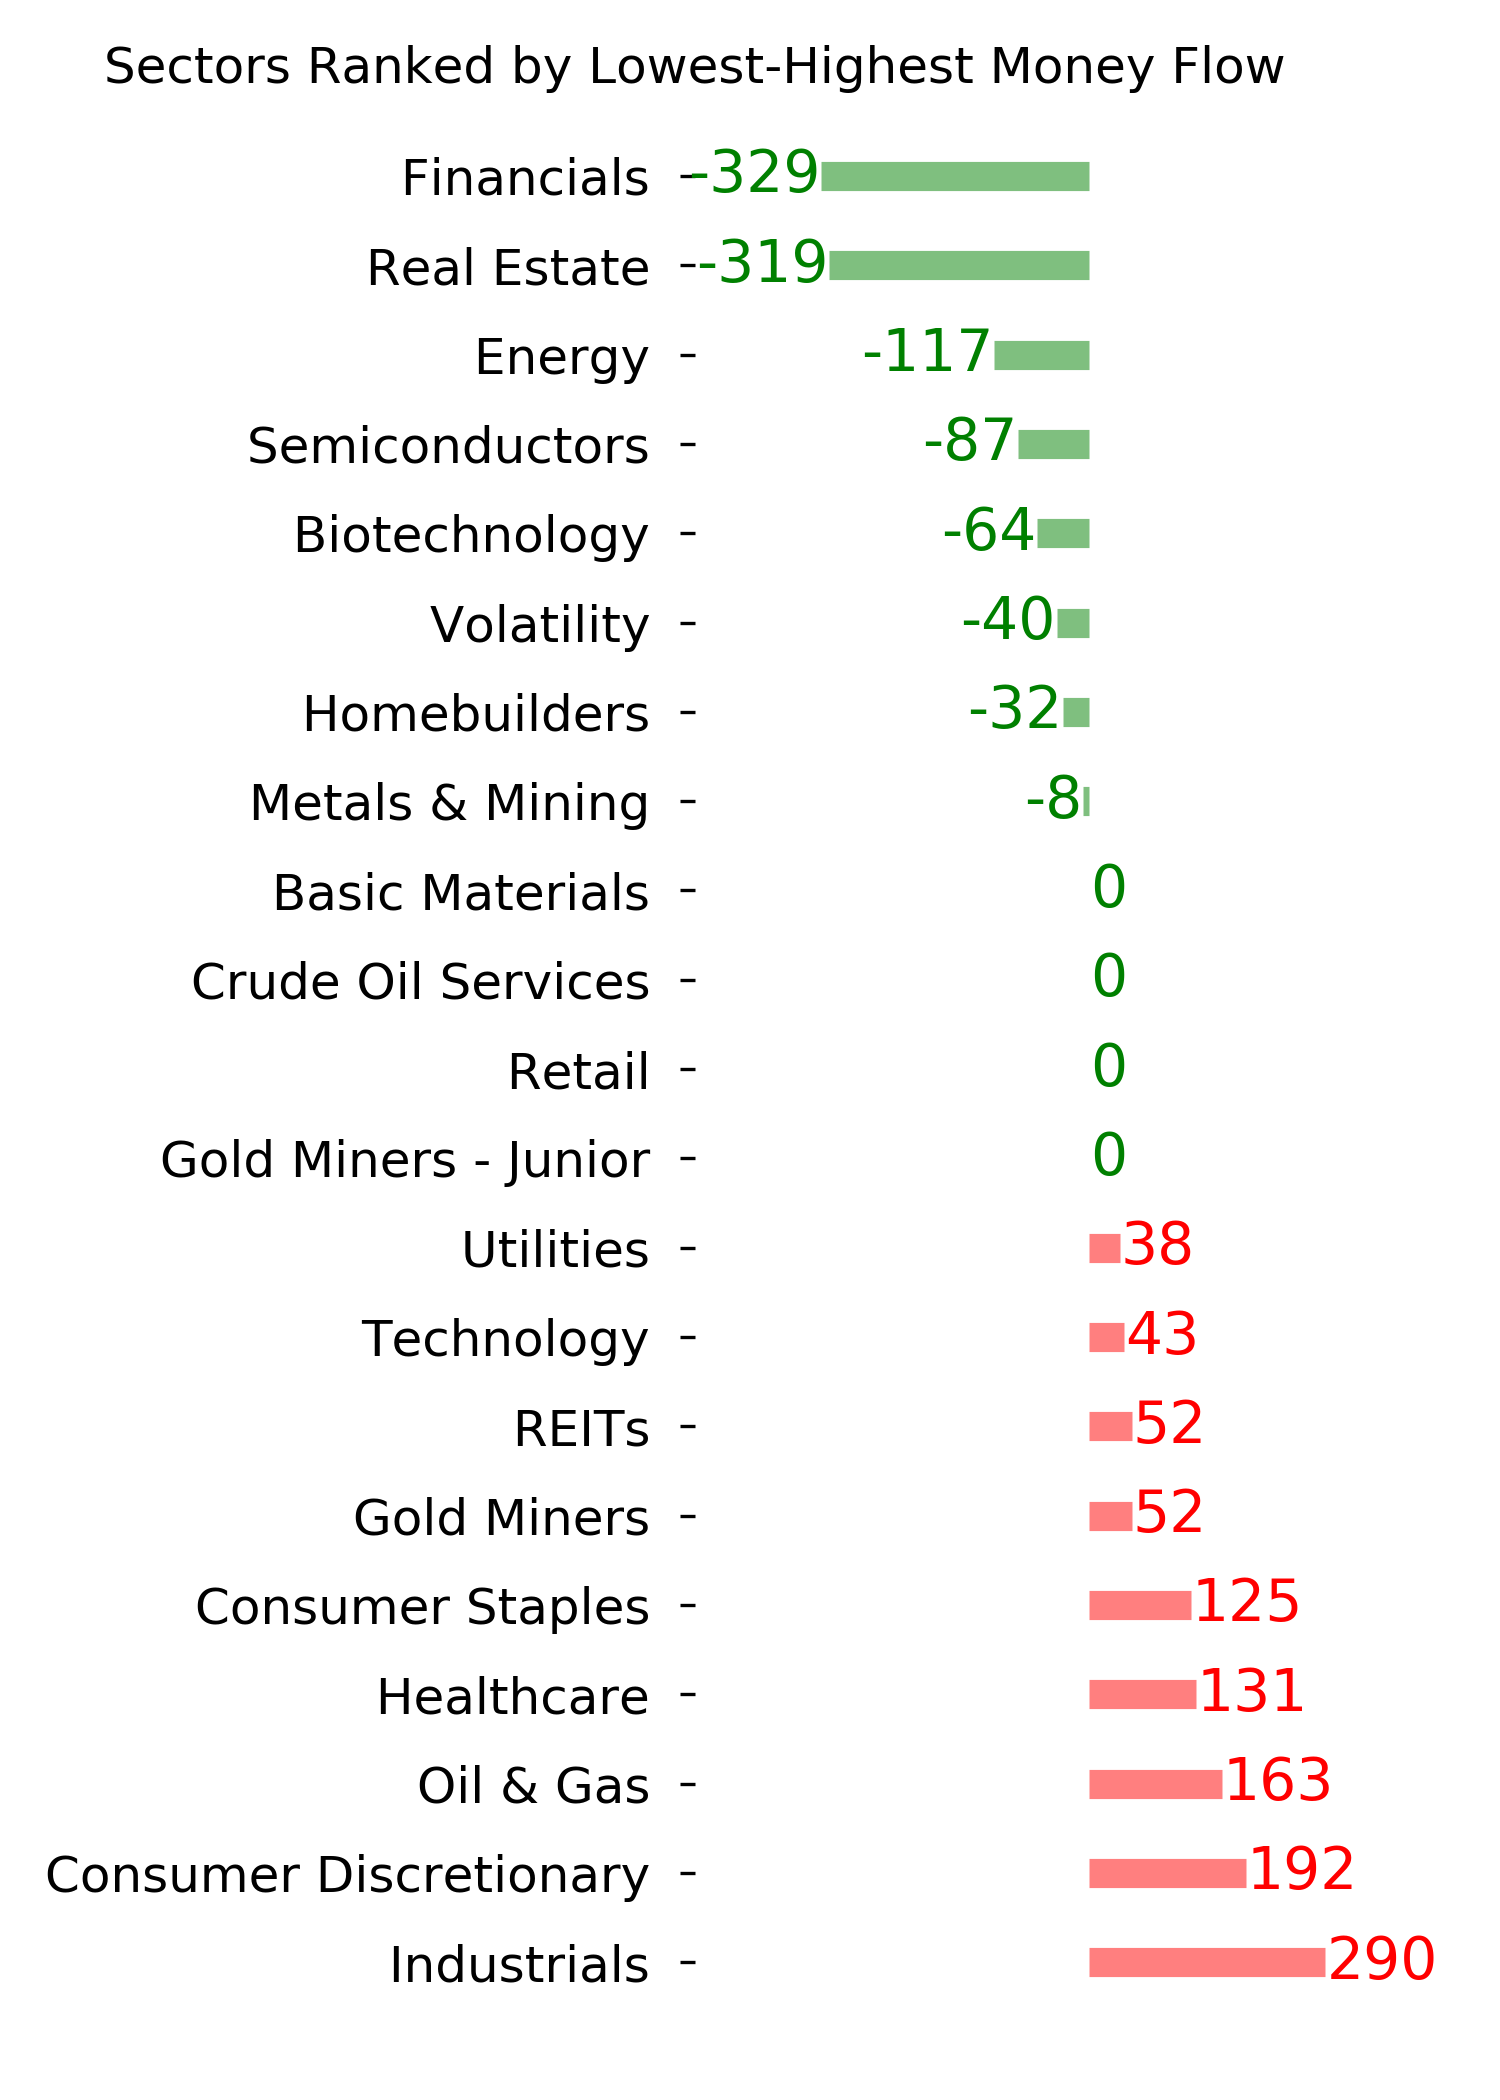
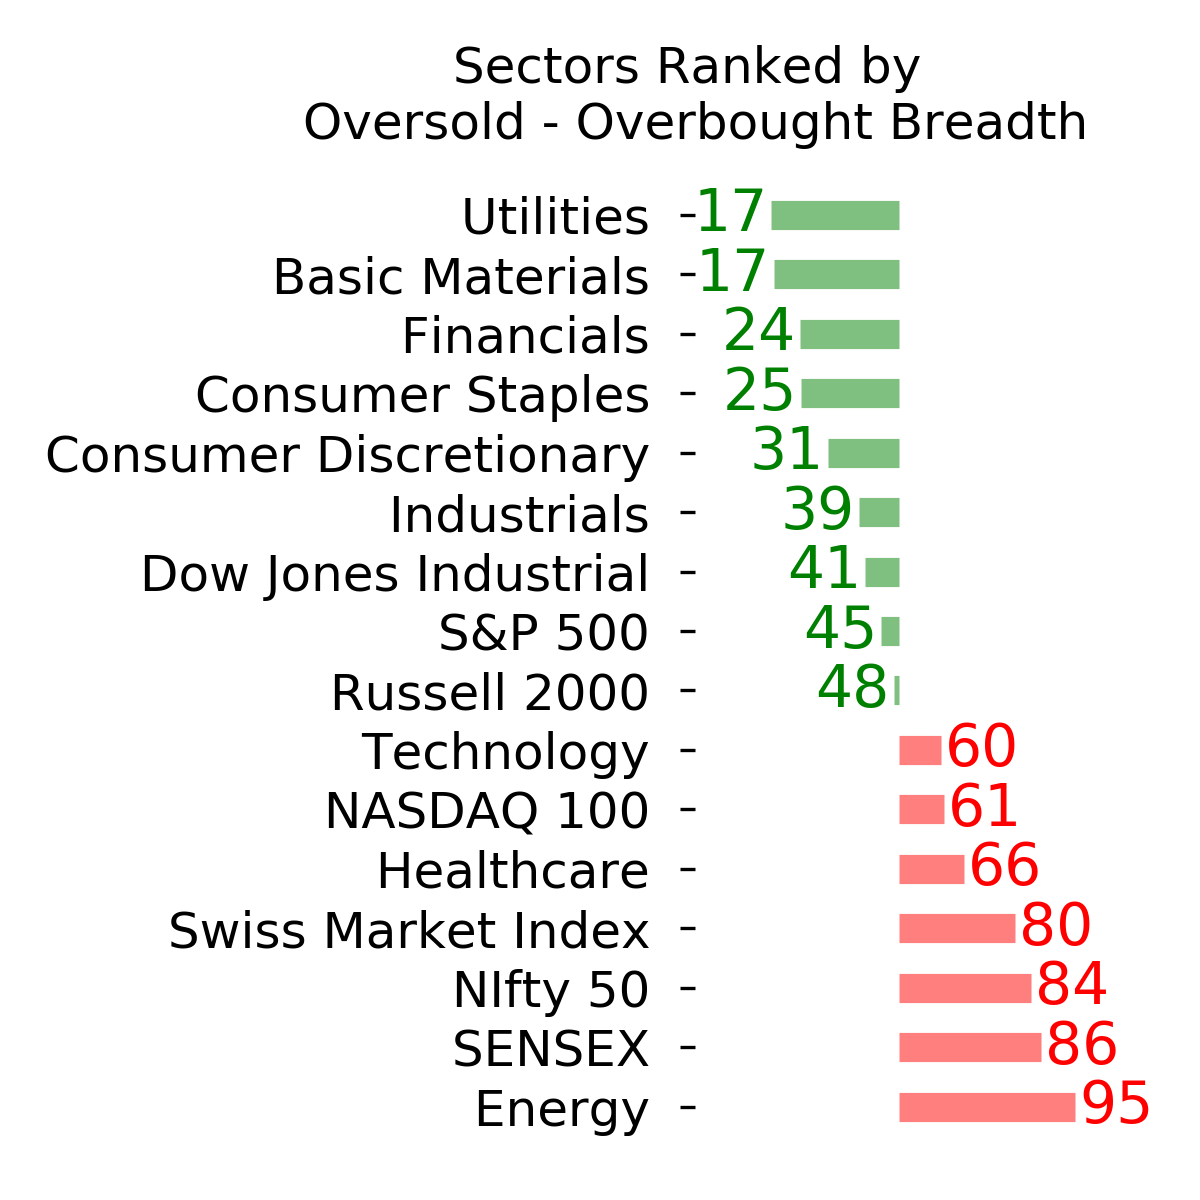
Ranks
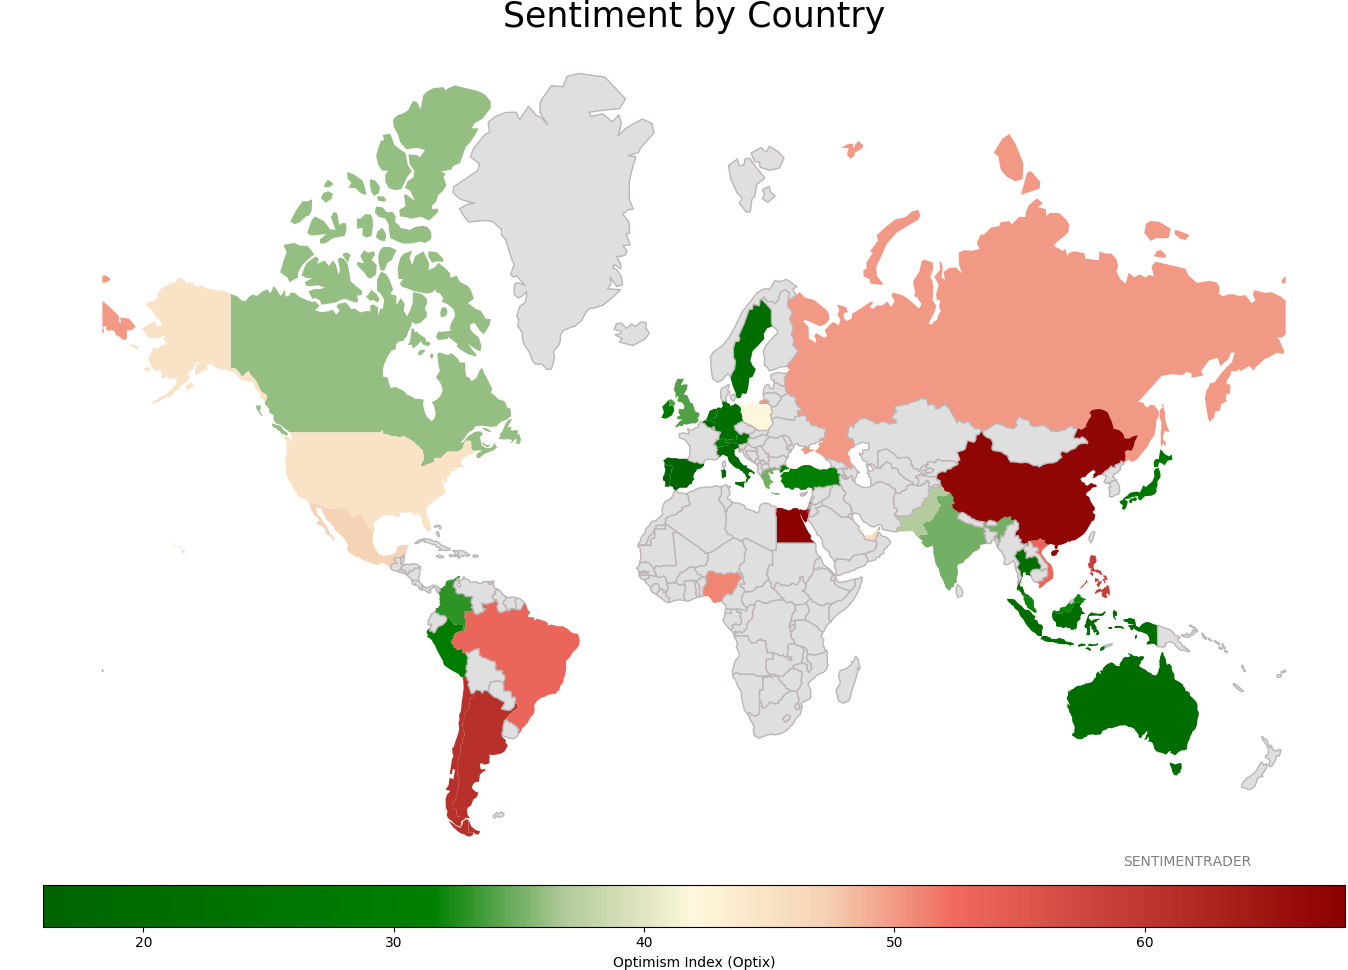
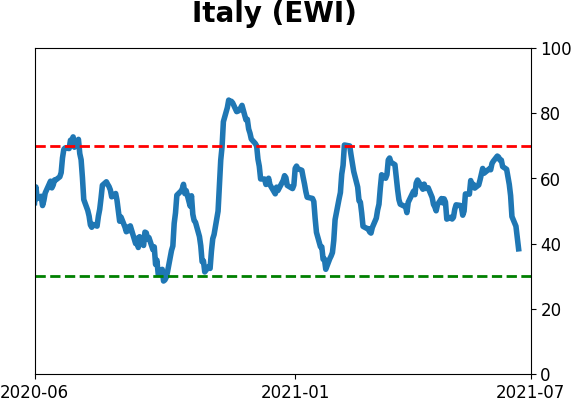
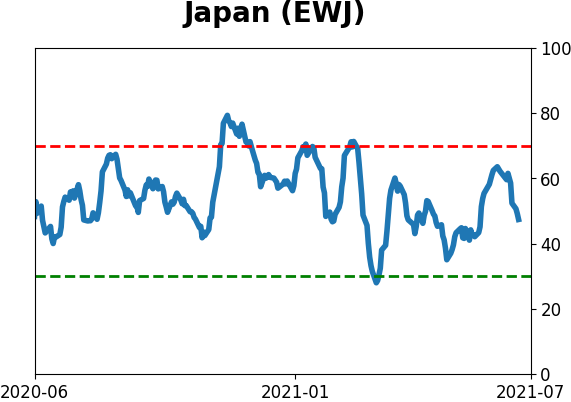
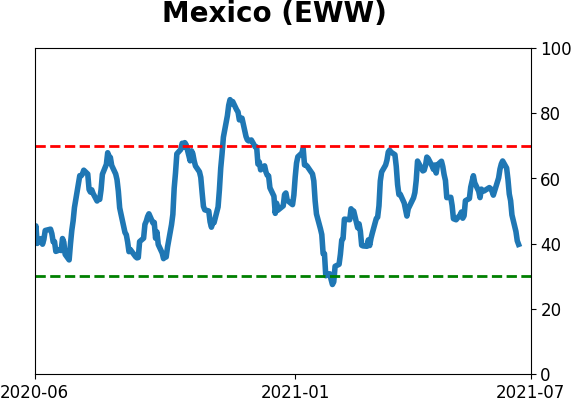
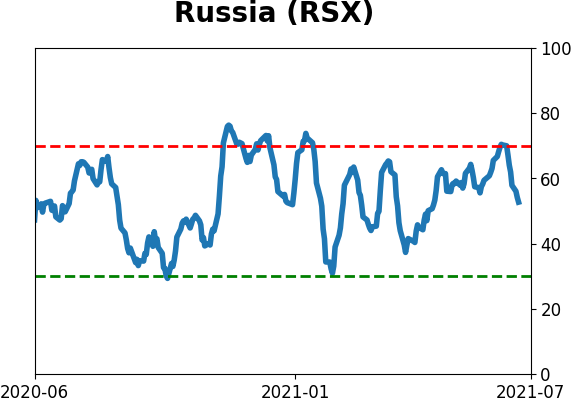
Sentiment Around The World
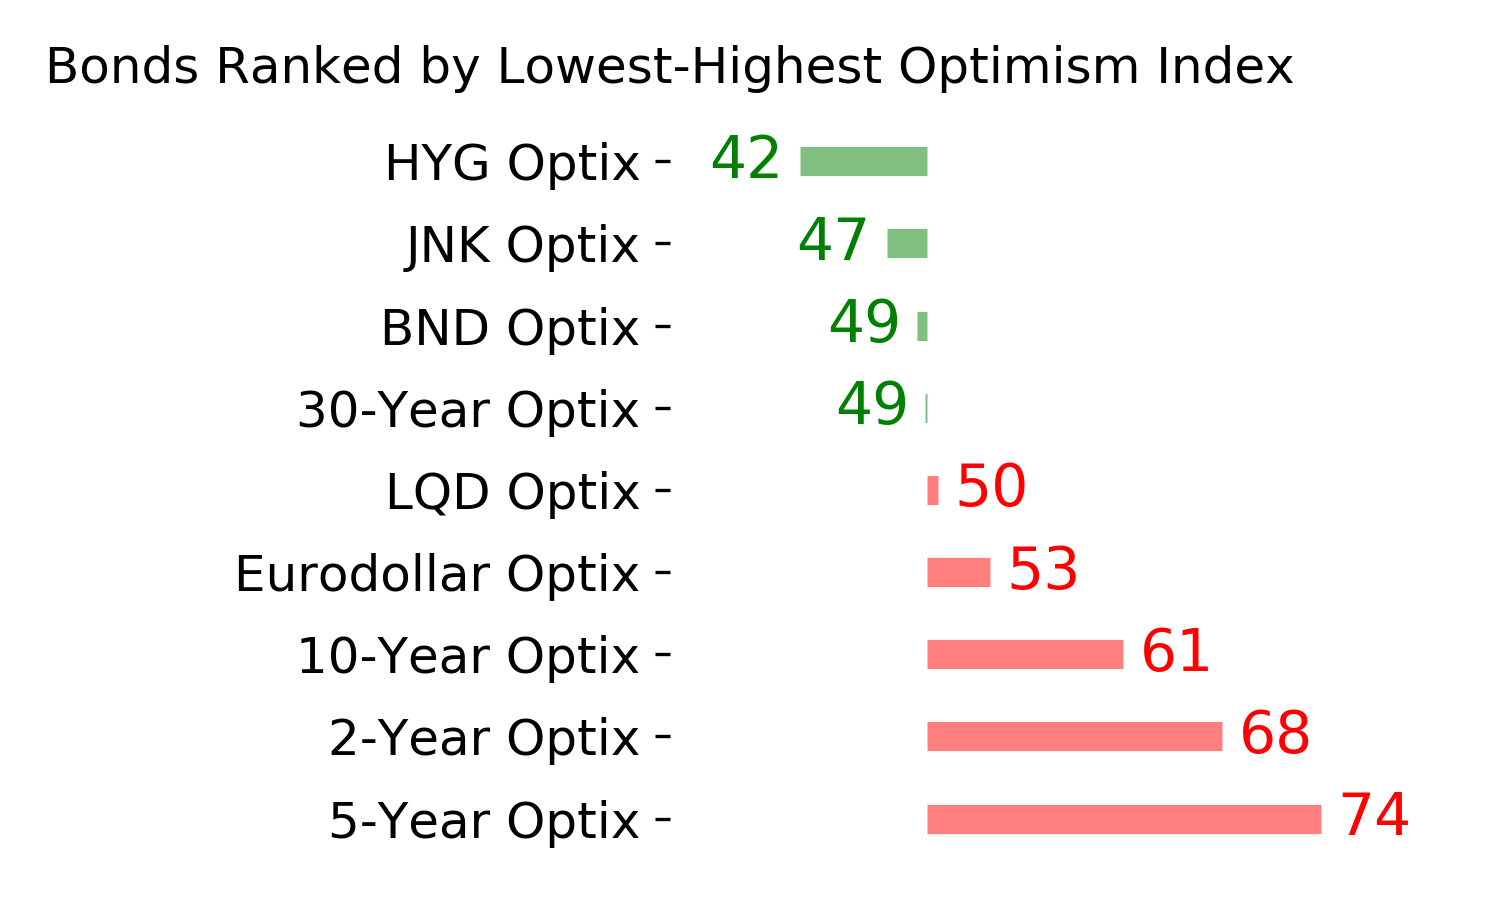
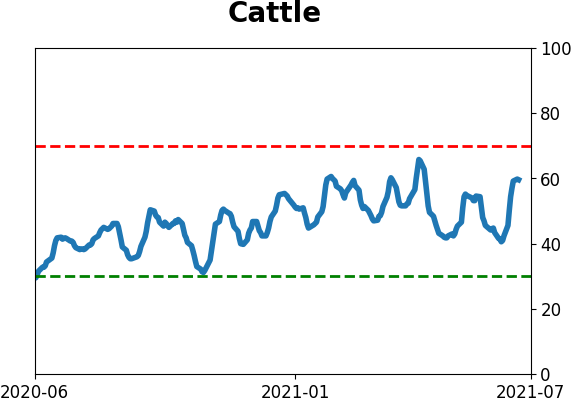
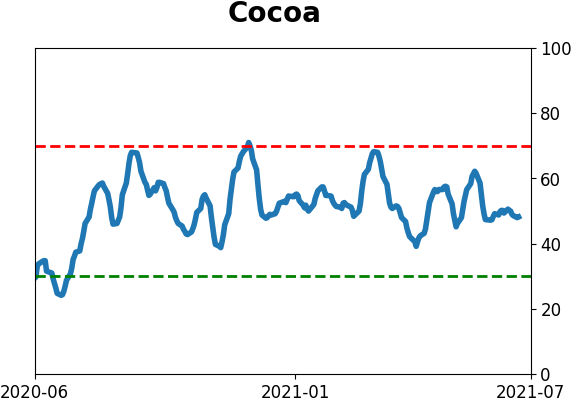
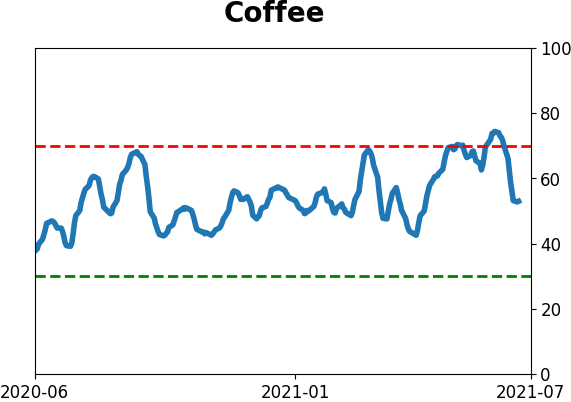
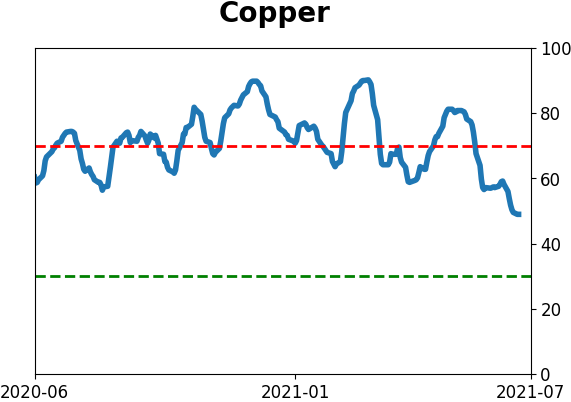
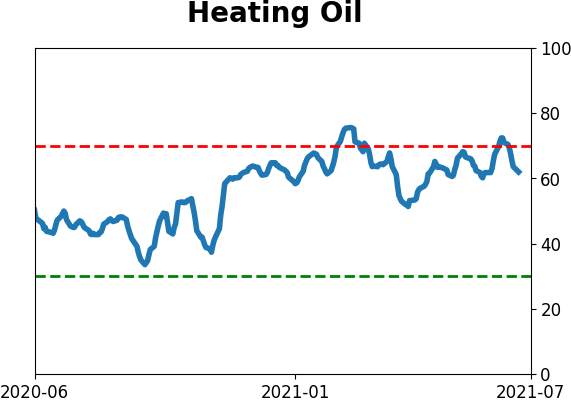
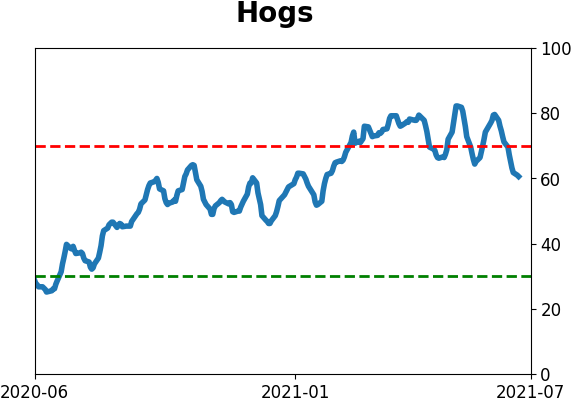
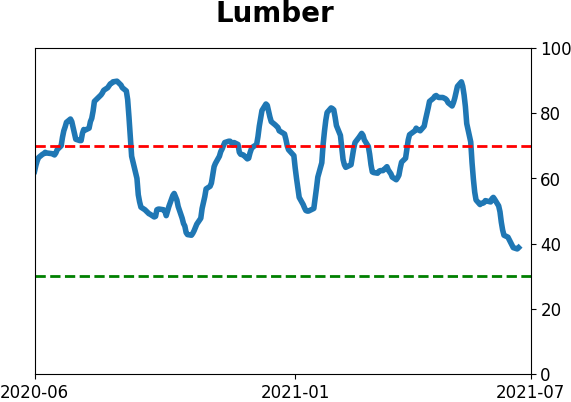
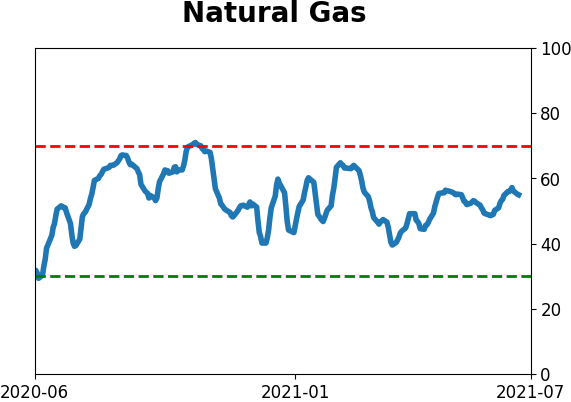
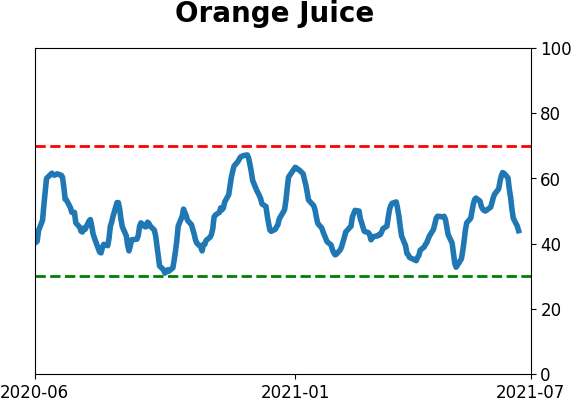
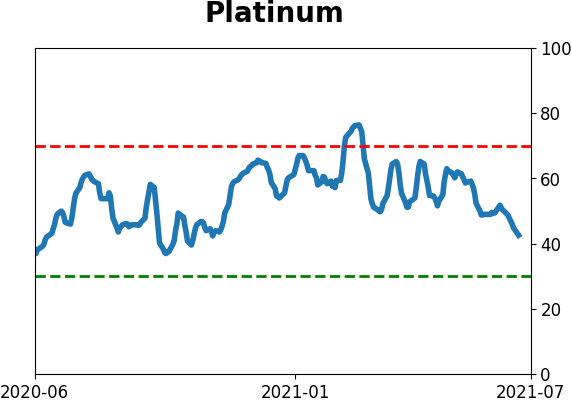
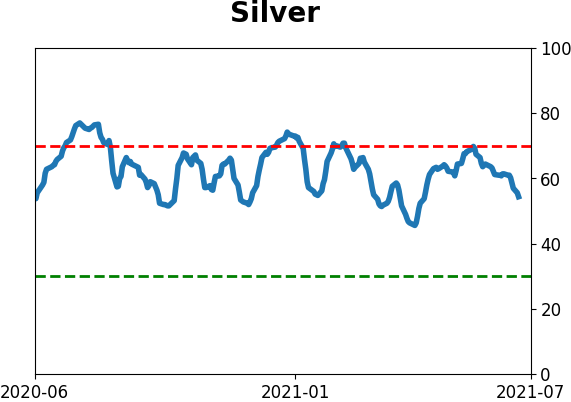
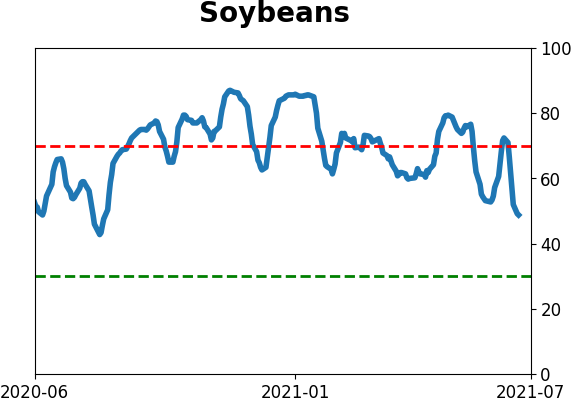
Optimism Index Thumbnails
|
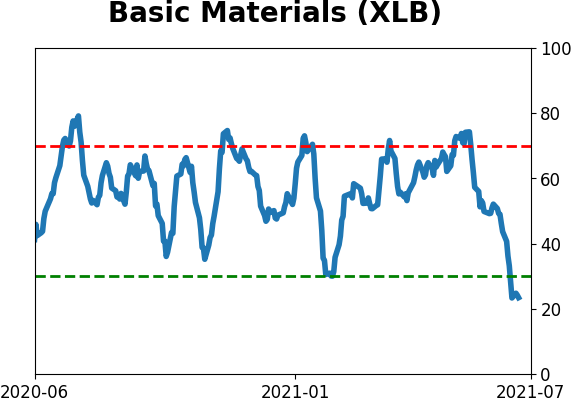
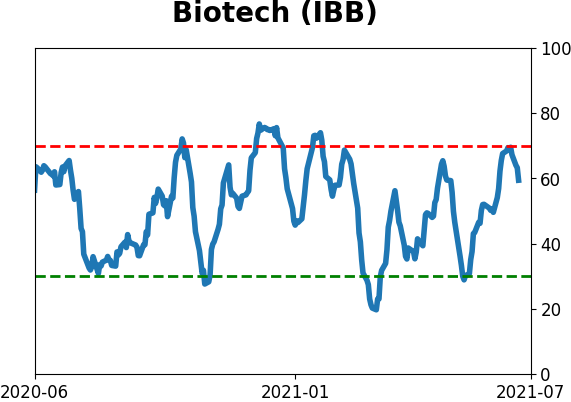
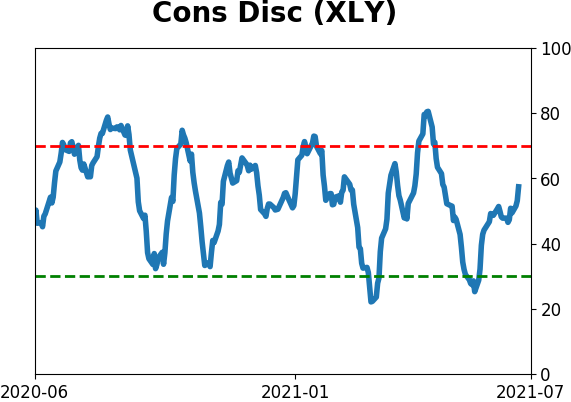
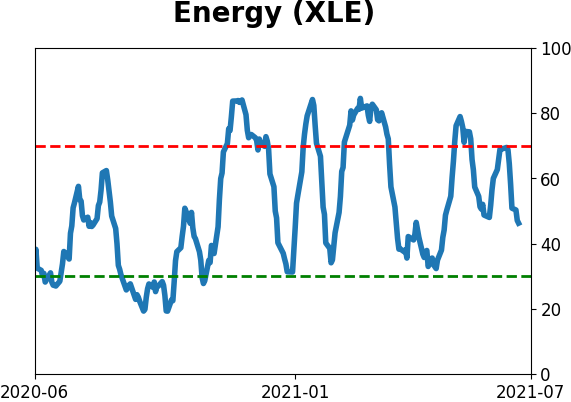
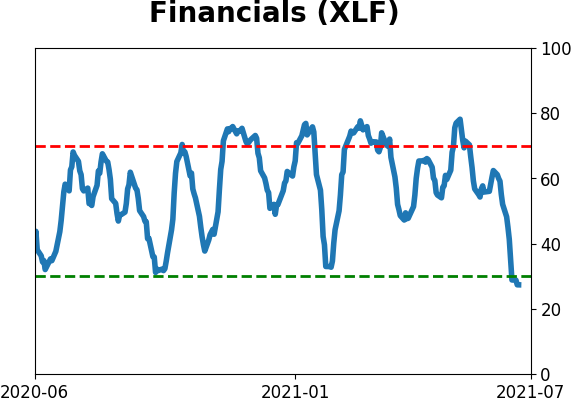
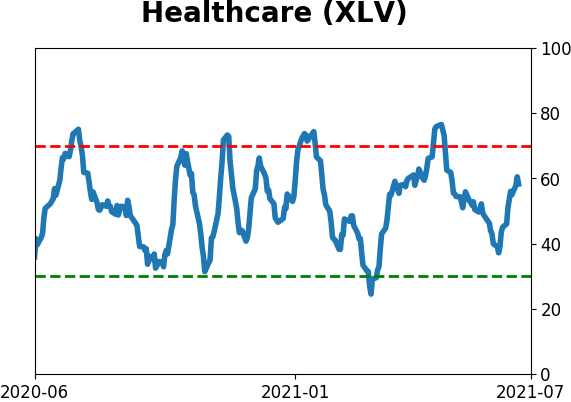
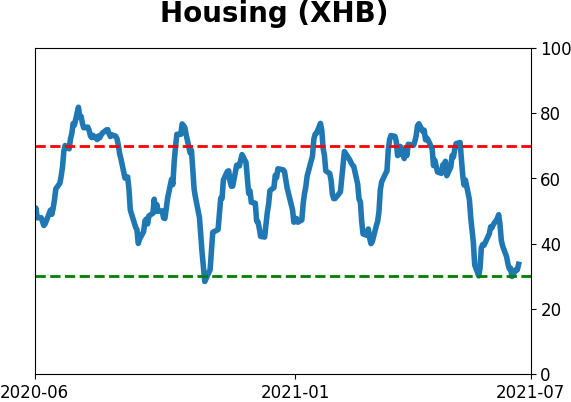
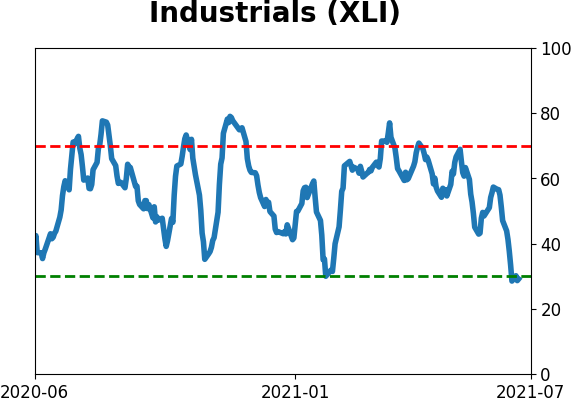
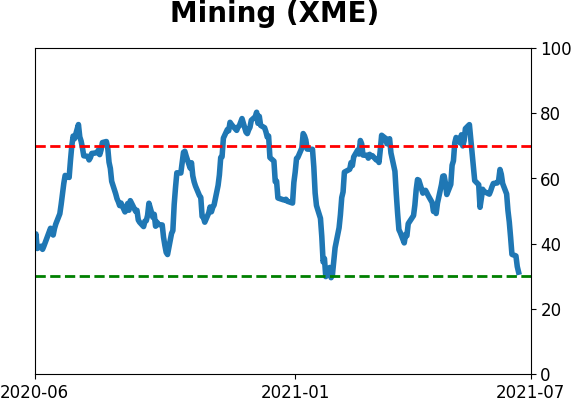
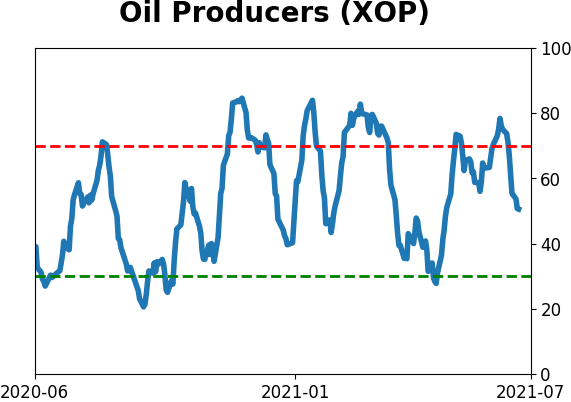
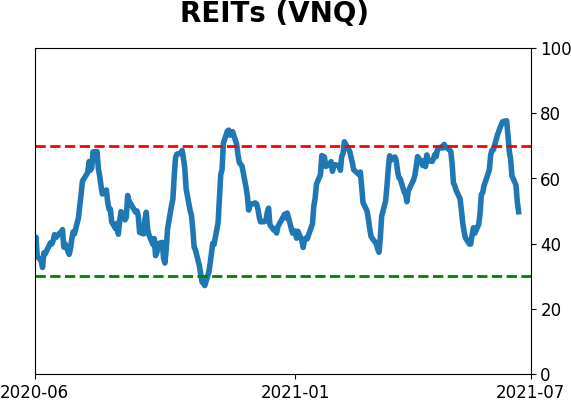
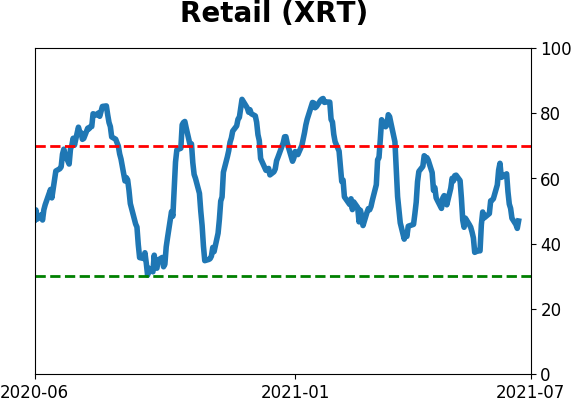
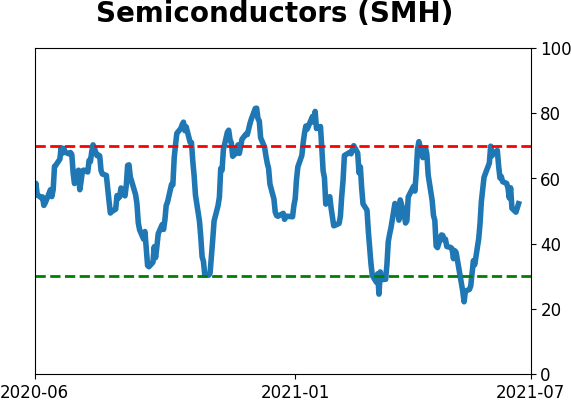
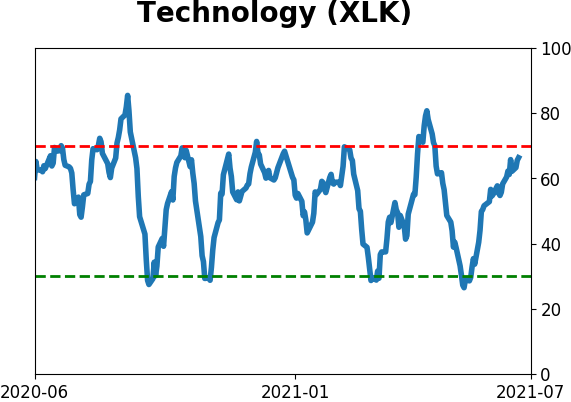
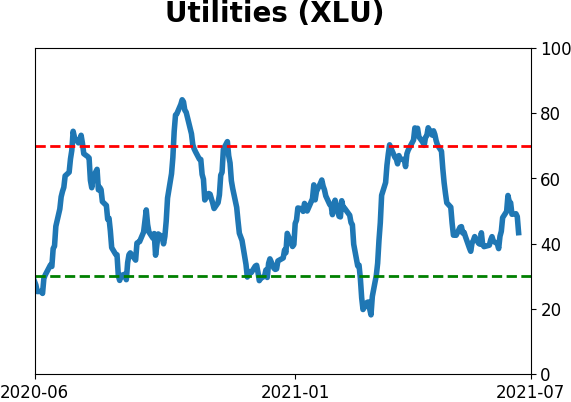
Sector ETF's - 10-Day Moving Average
|
|
|
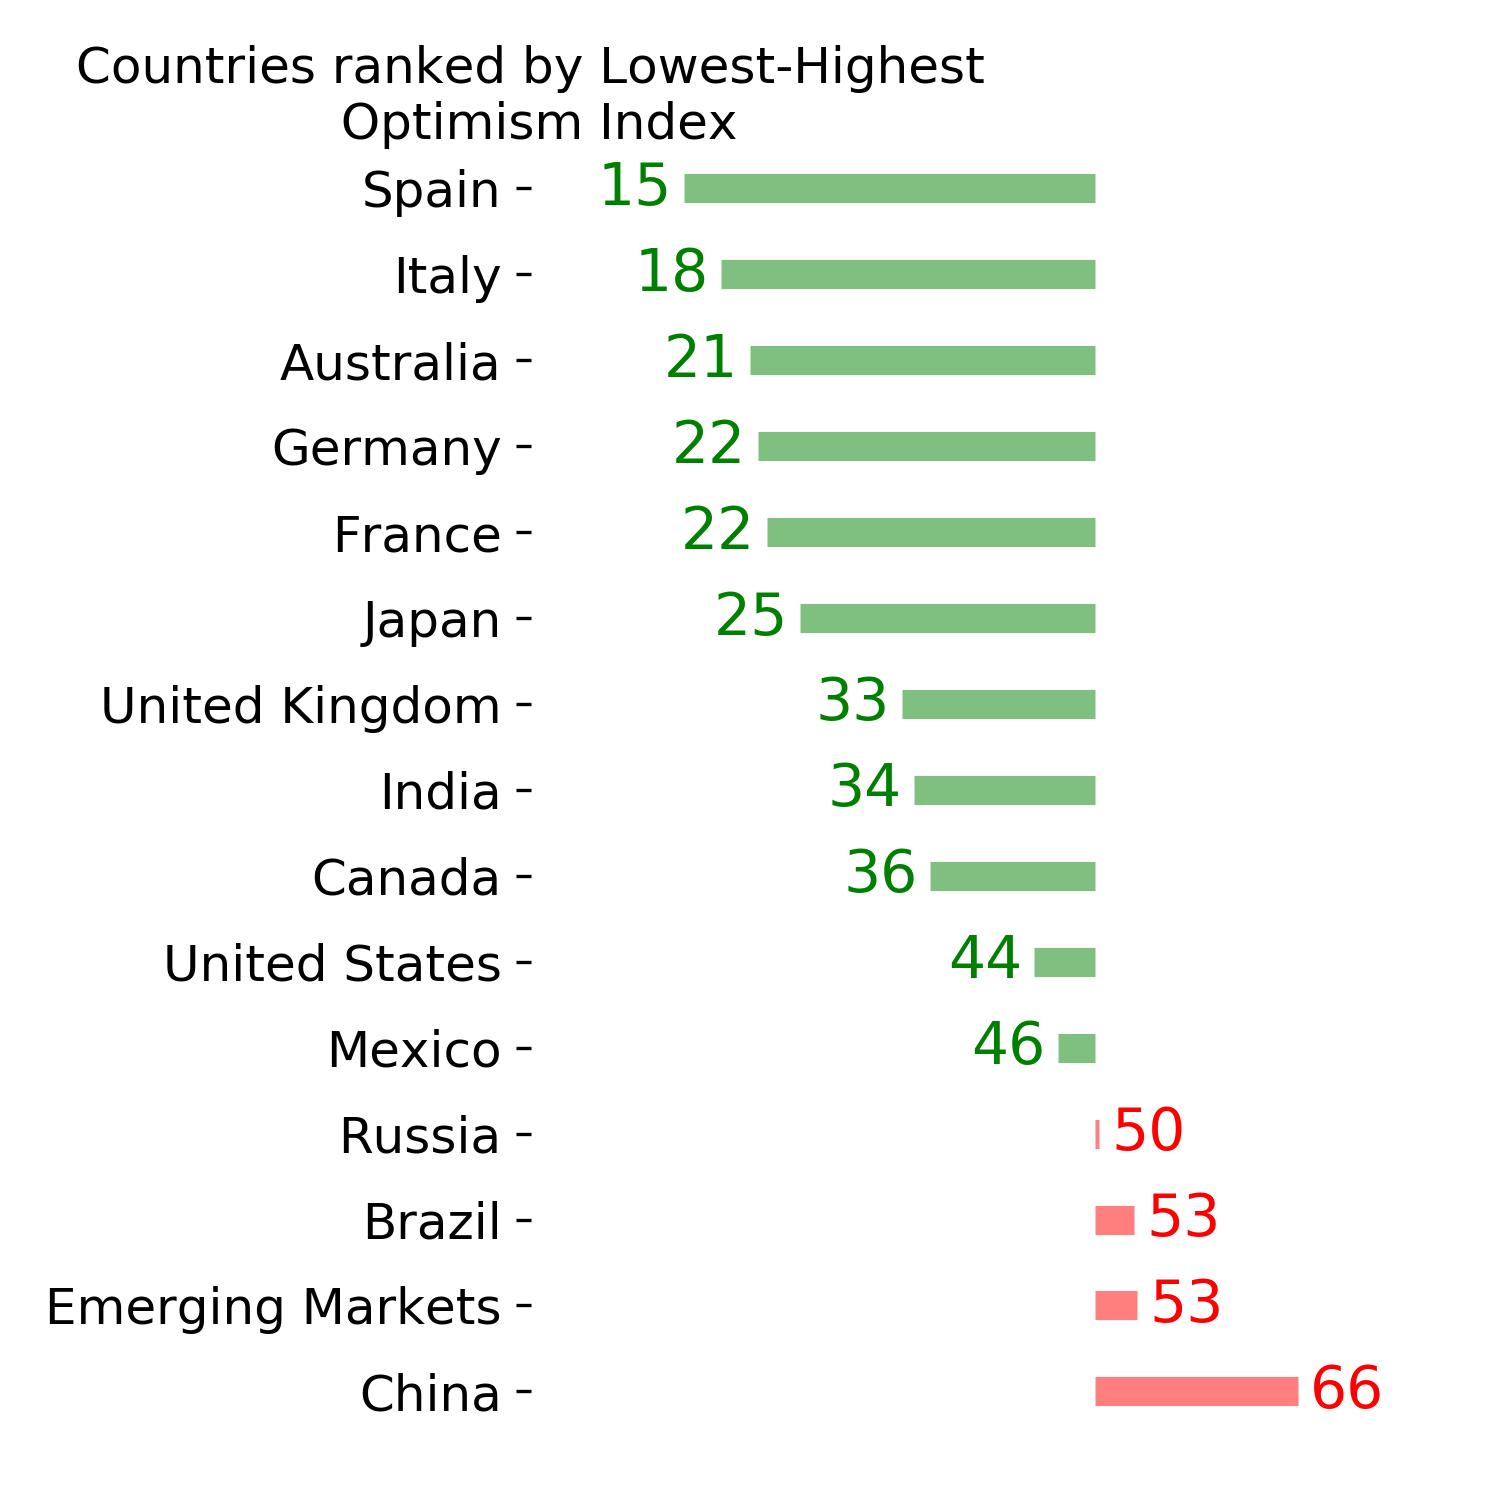
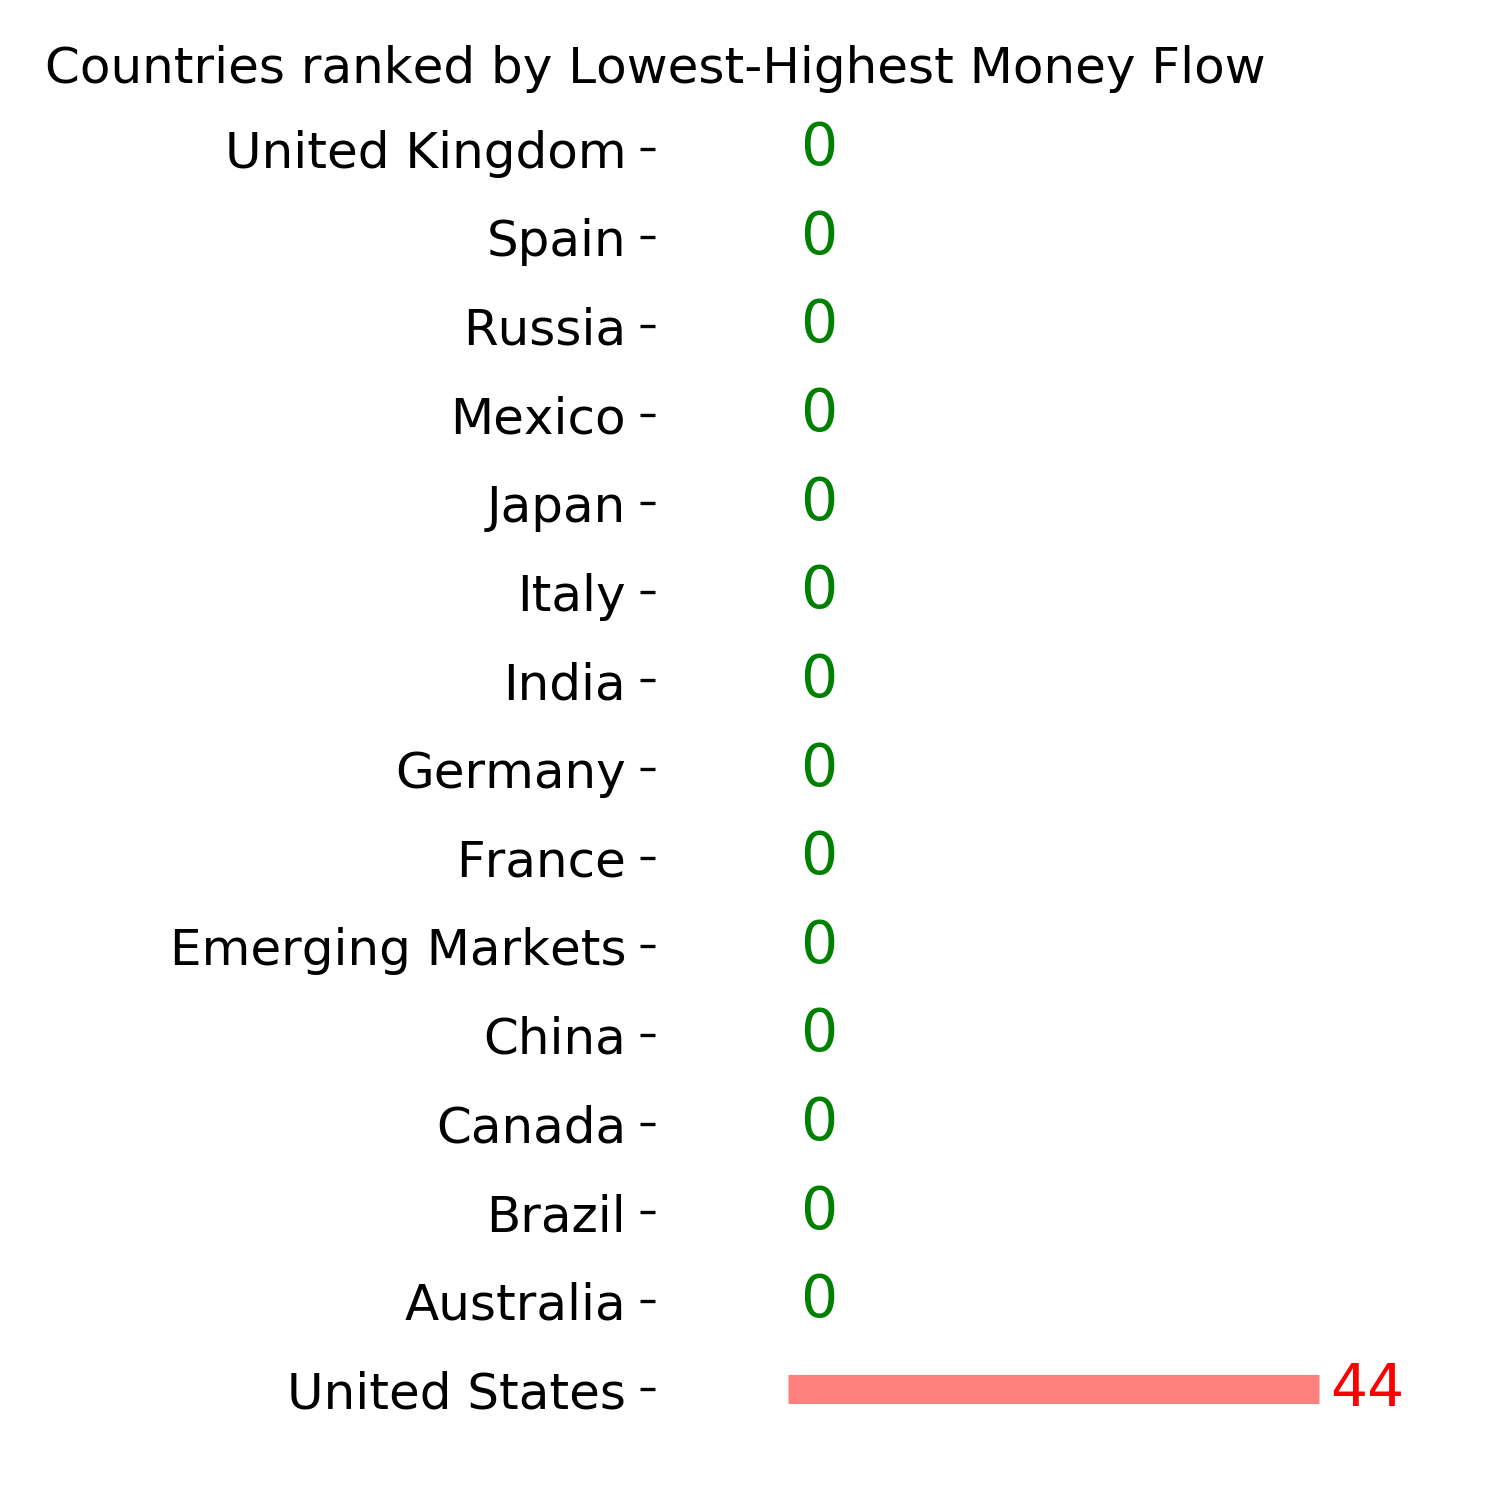
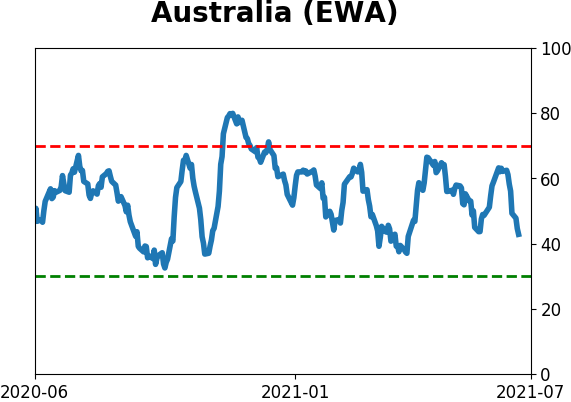
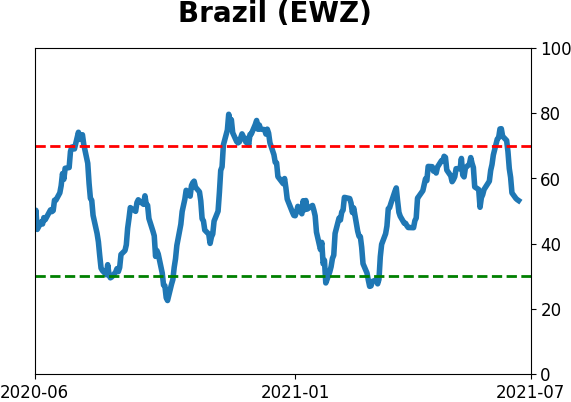
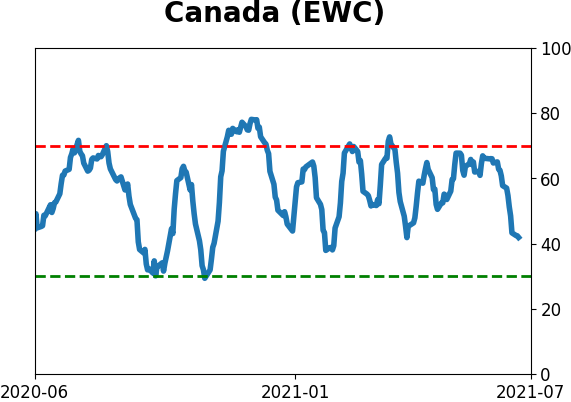
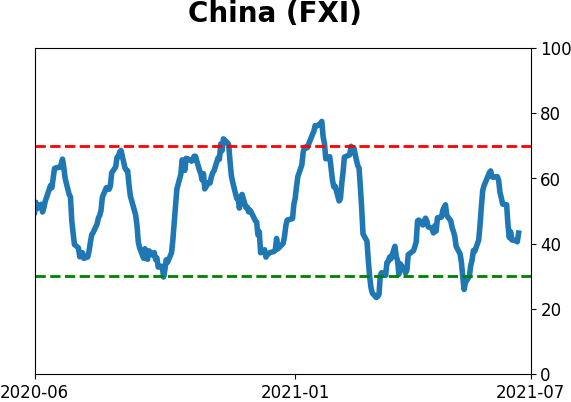
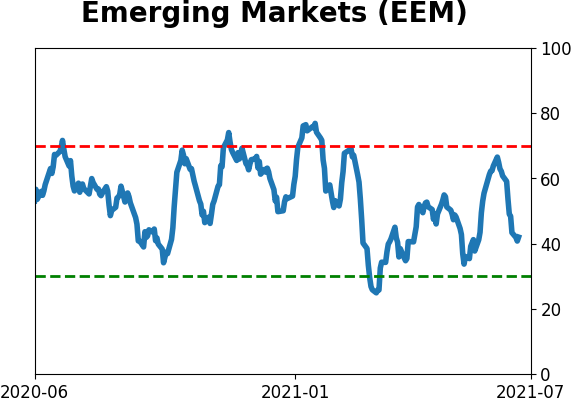
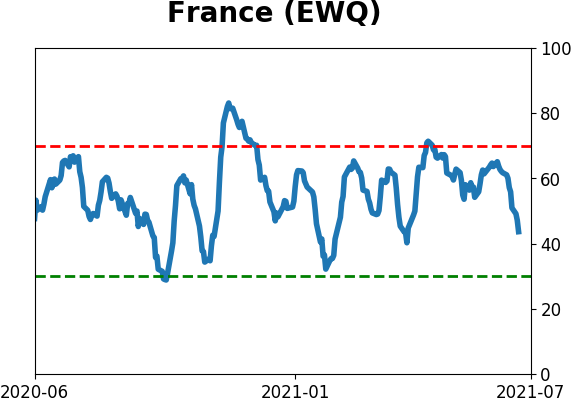
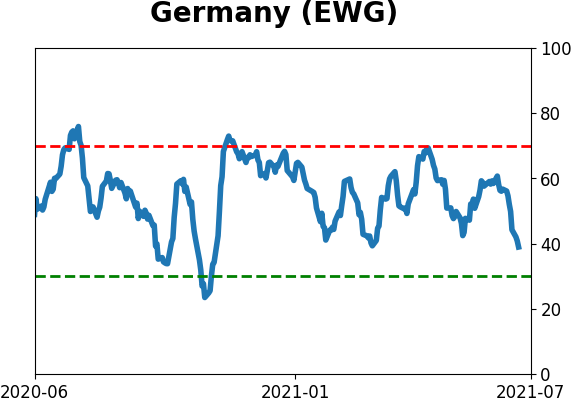
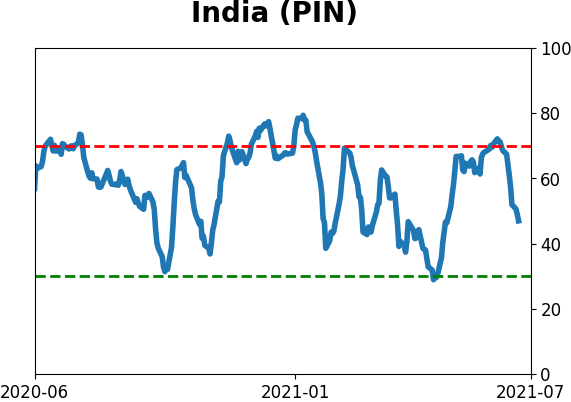
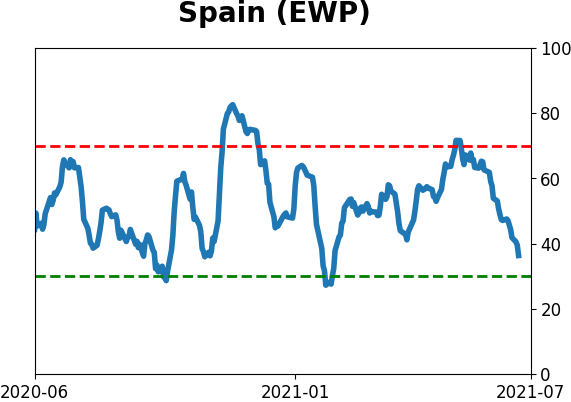
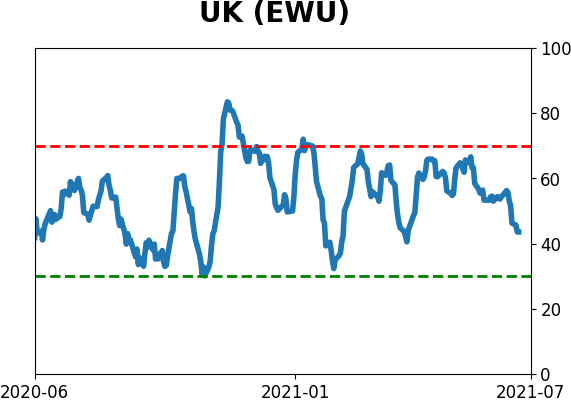
Country ETF's - 10-Day Moving Average
|
|
|
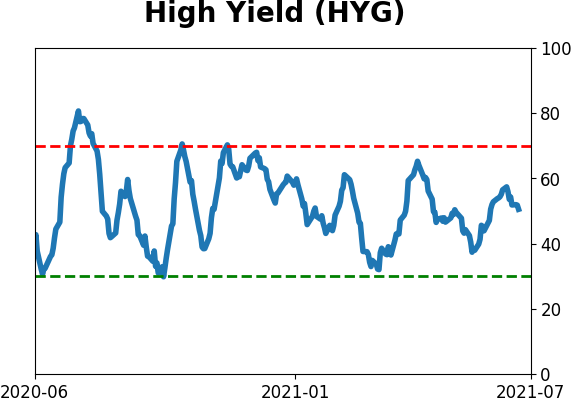
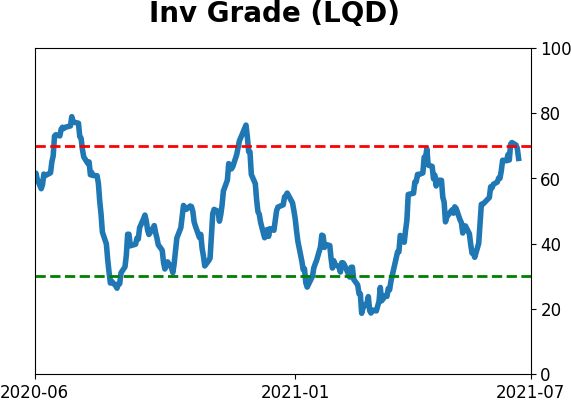
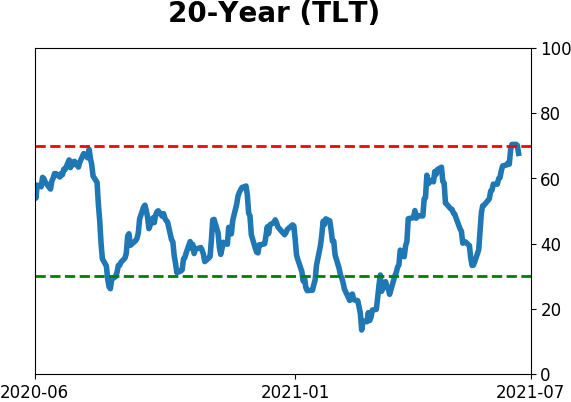
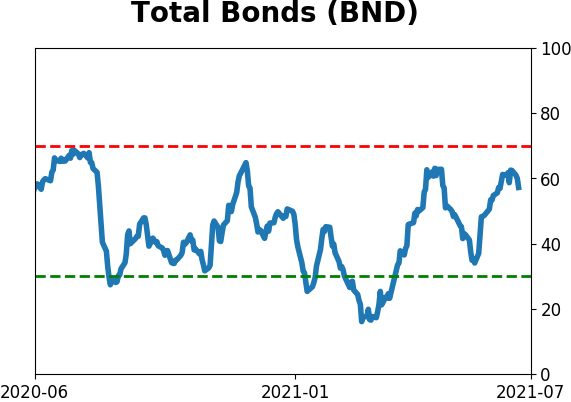
Bond ETF's - 10-Day Moving Average
|
|
|
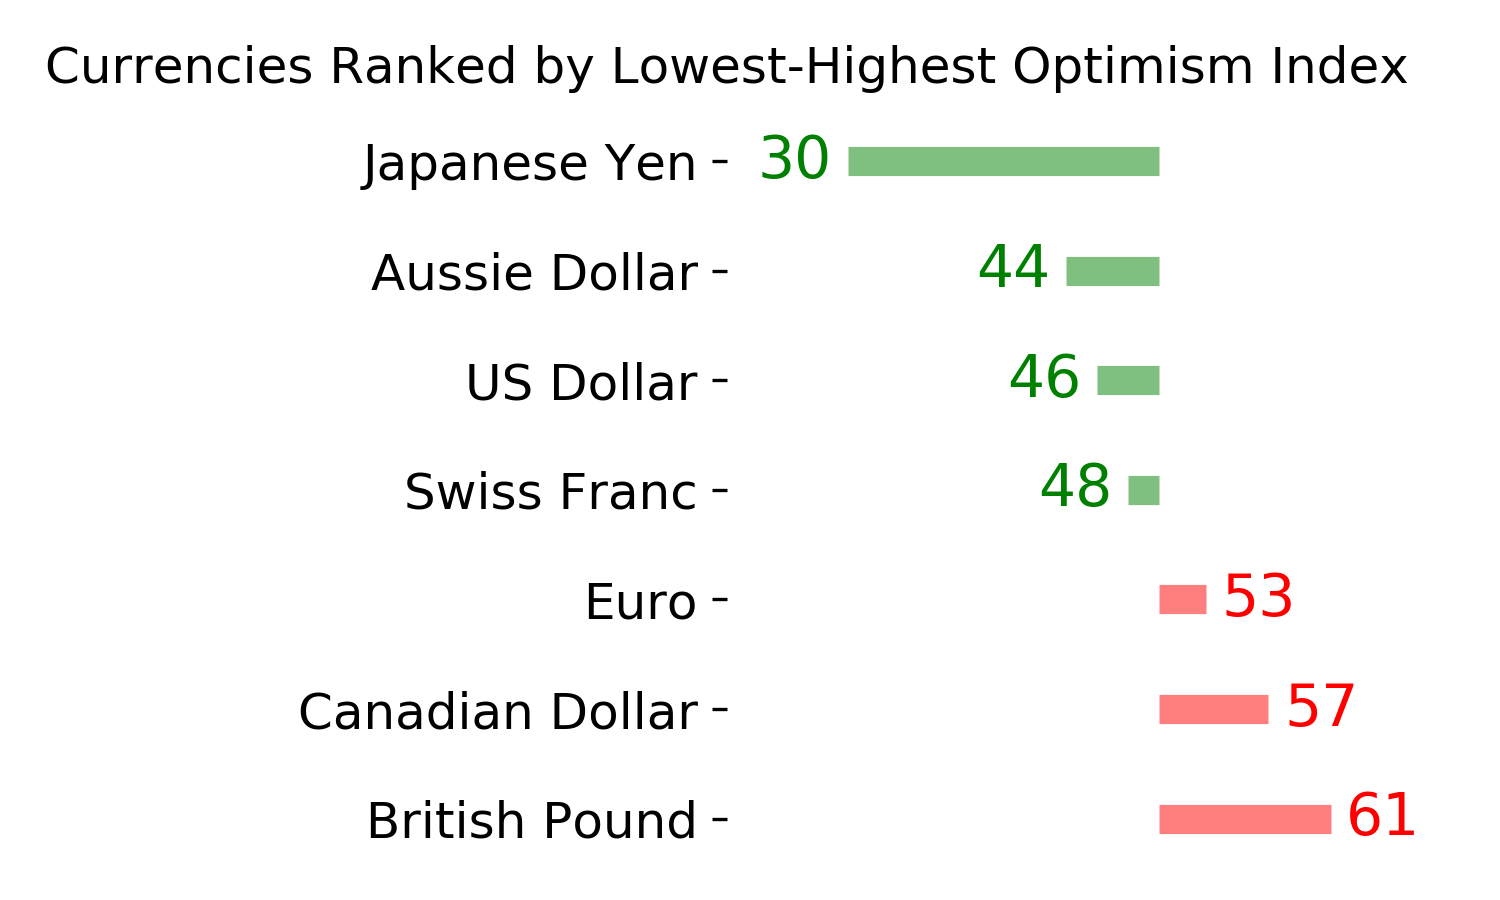
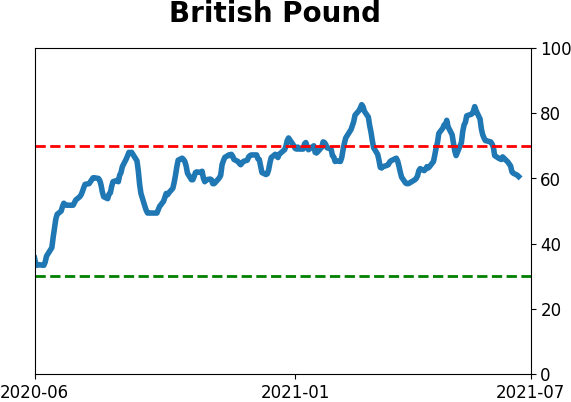
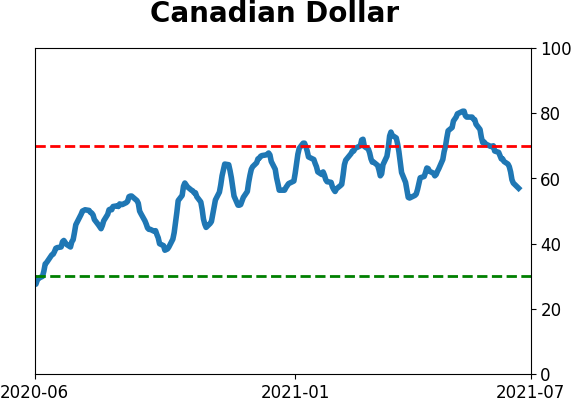
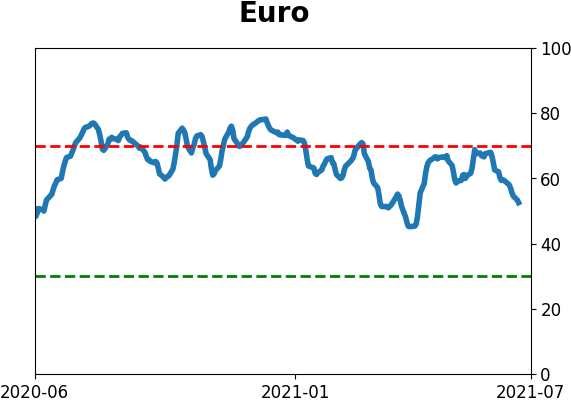
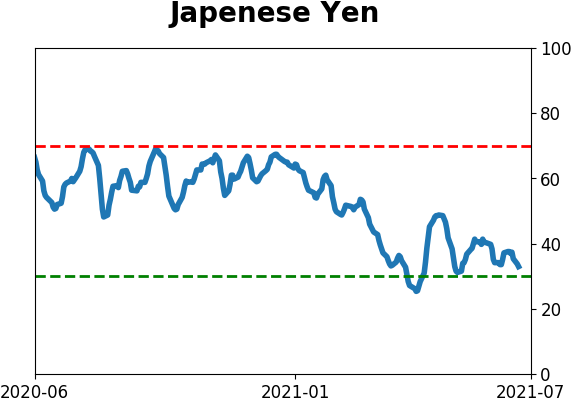
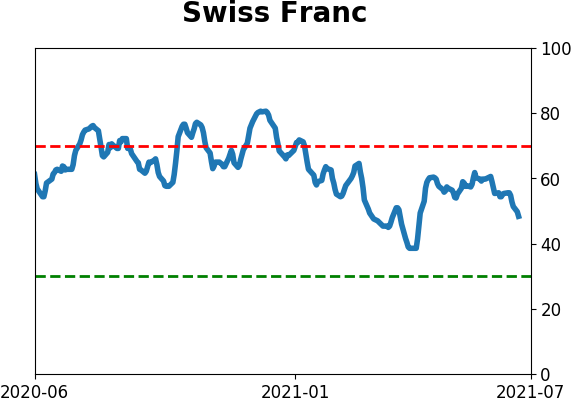
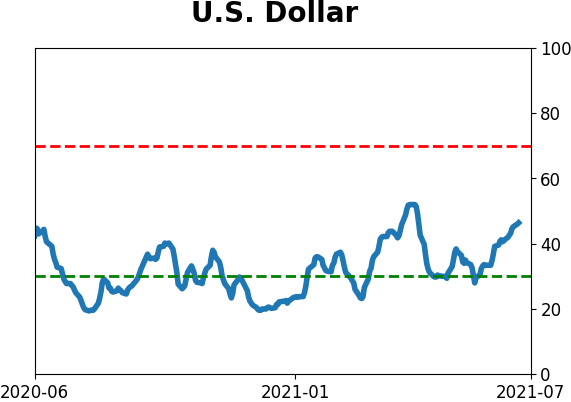
Currency ETF's - 5-Day Moving Average
|
|
|
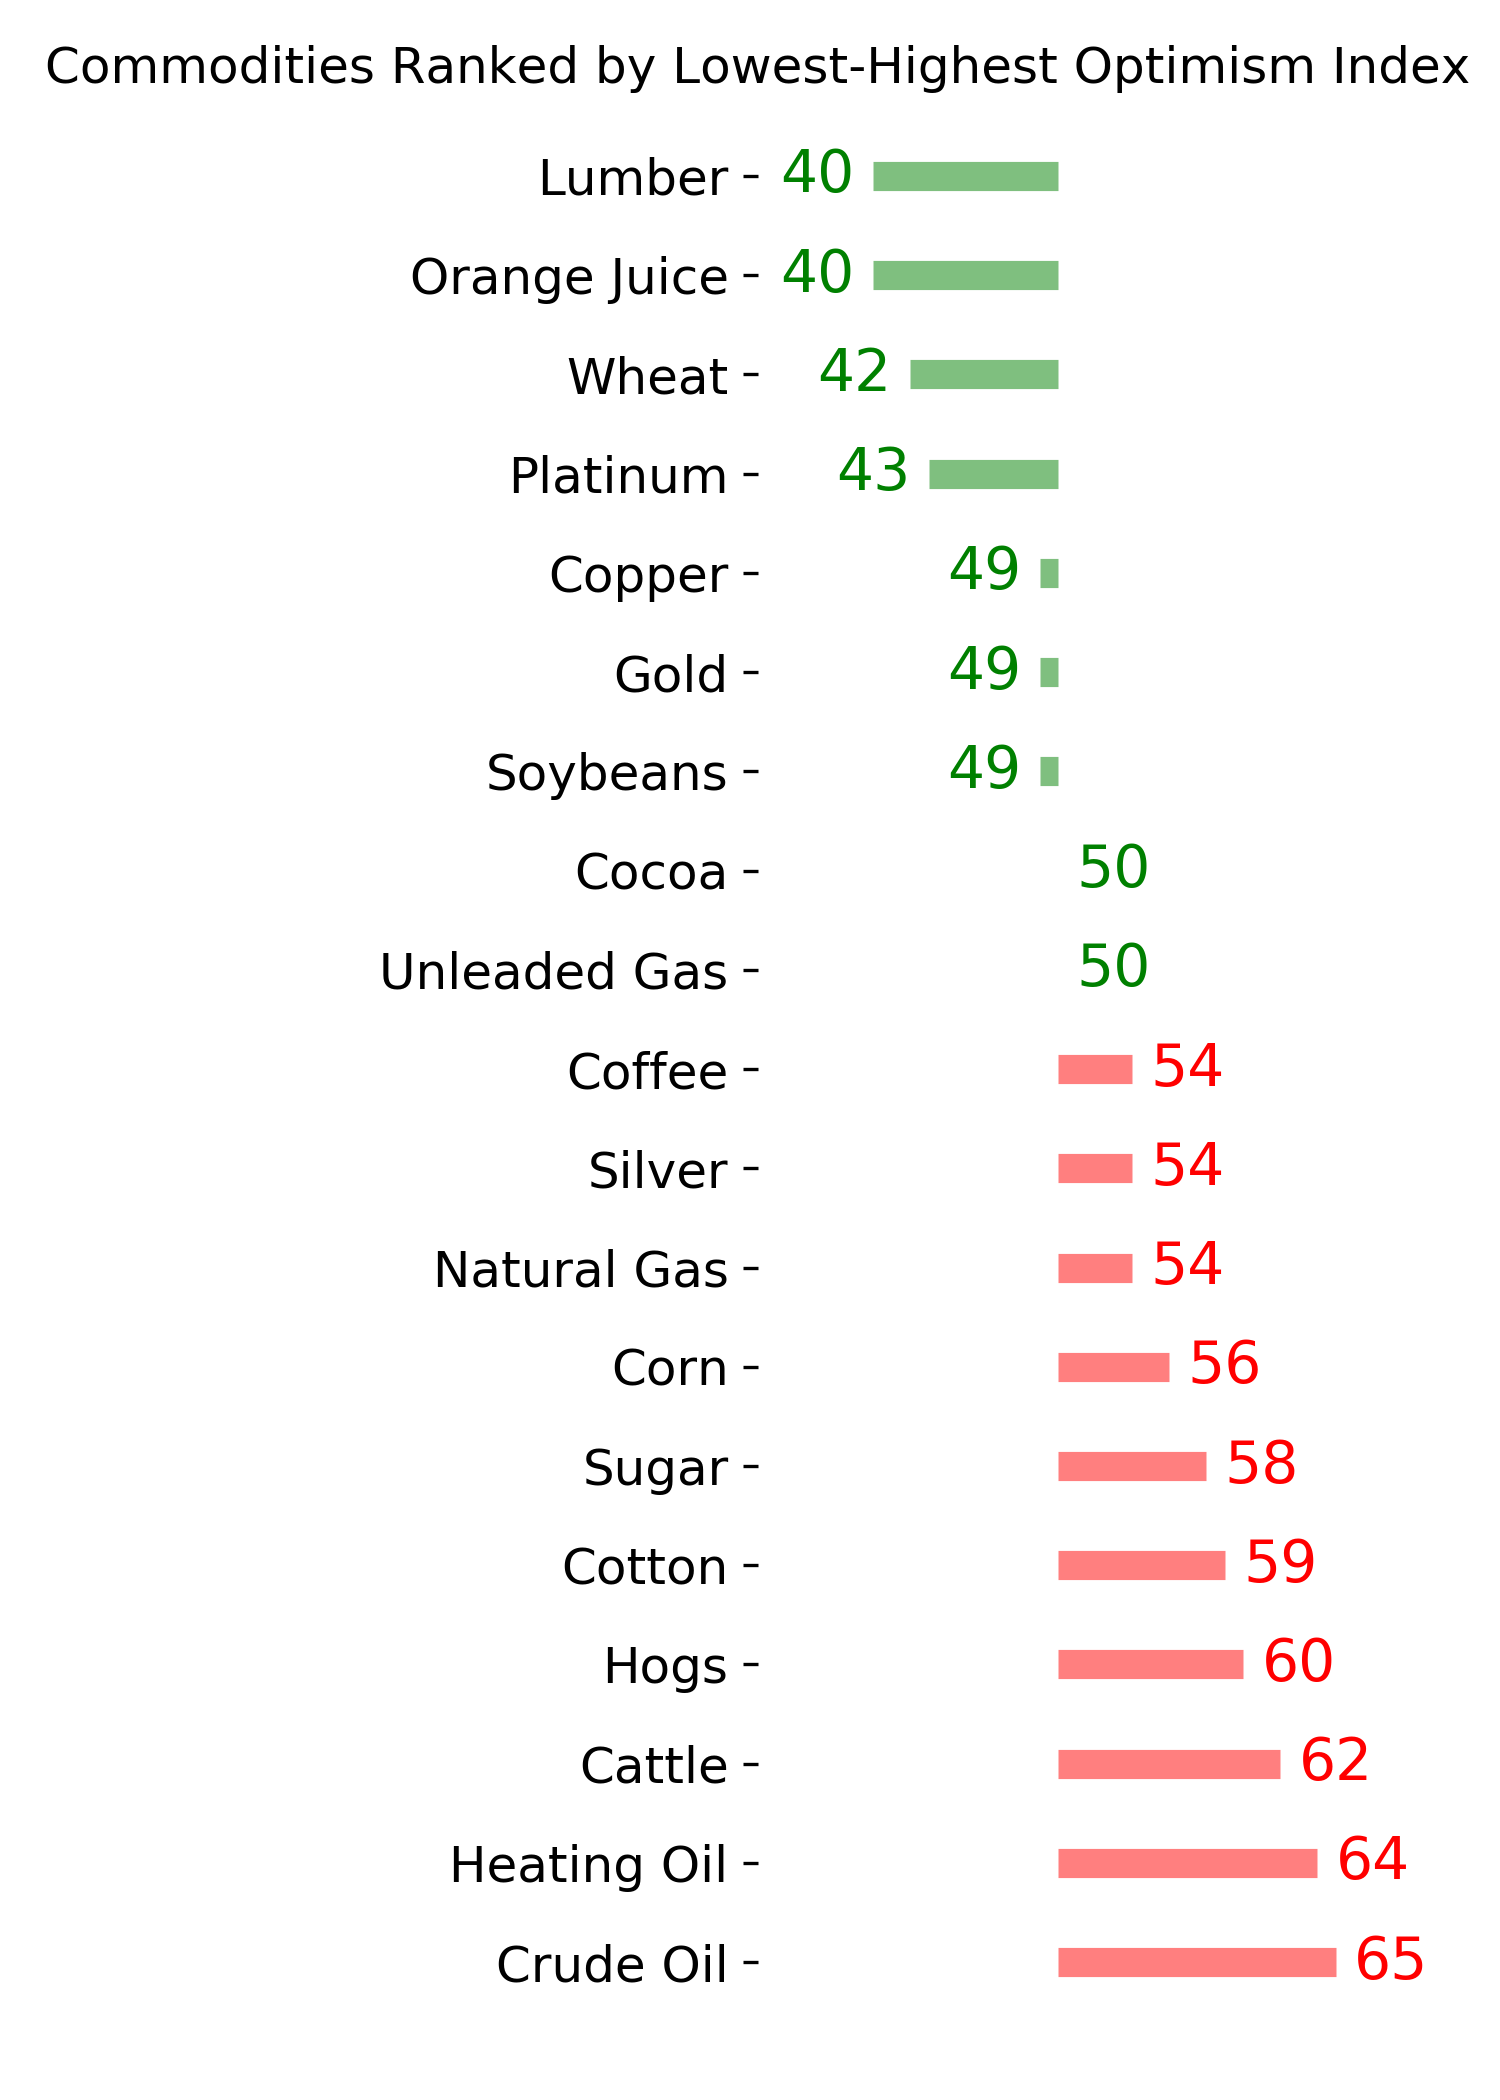
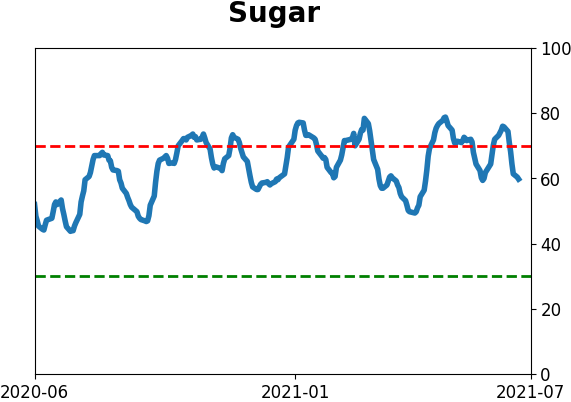
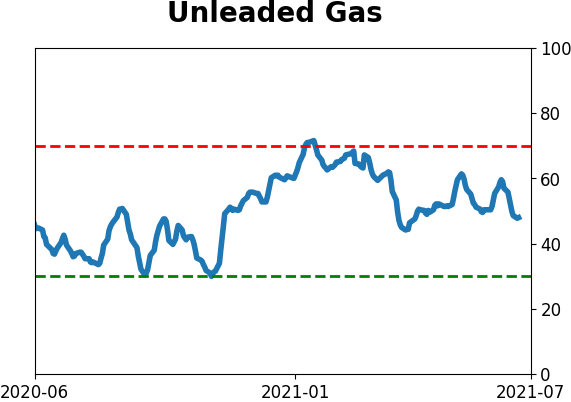
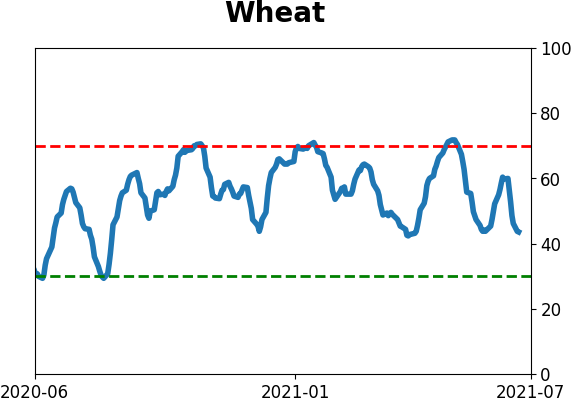
Commodity ETF's - 5-Day Moving Average
|
|