Headlines
|
|
The stock market and July the 4th:
The stock market has demonstrated a long-term tendency to perform well directly before and after the July 4th U.S. market holiday. On the other hand, a particular group of days leading up to that period has tended to show weakness. In this piece, we separate the two and closely examine the results.
|
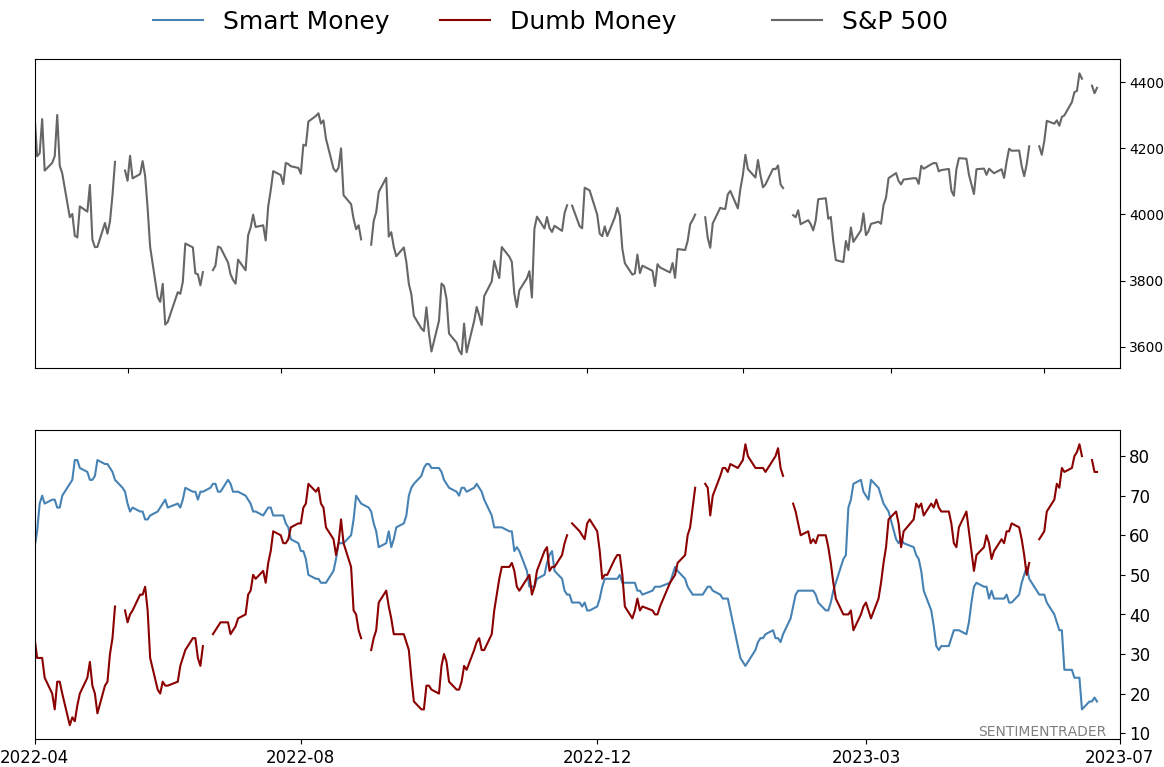
Smart / Dumb Money Confidence
|
Smart Money Confidence: 18%
Dumb Money Confidence: 76%
|
|
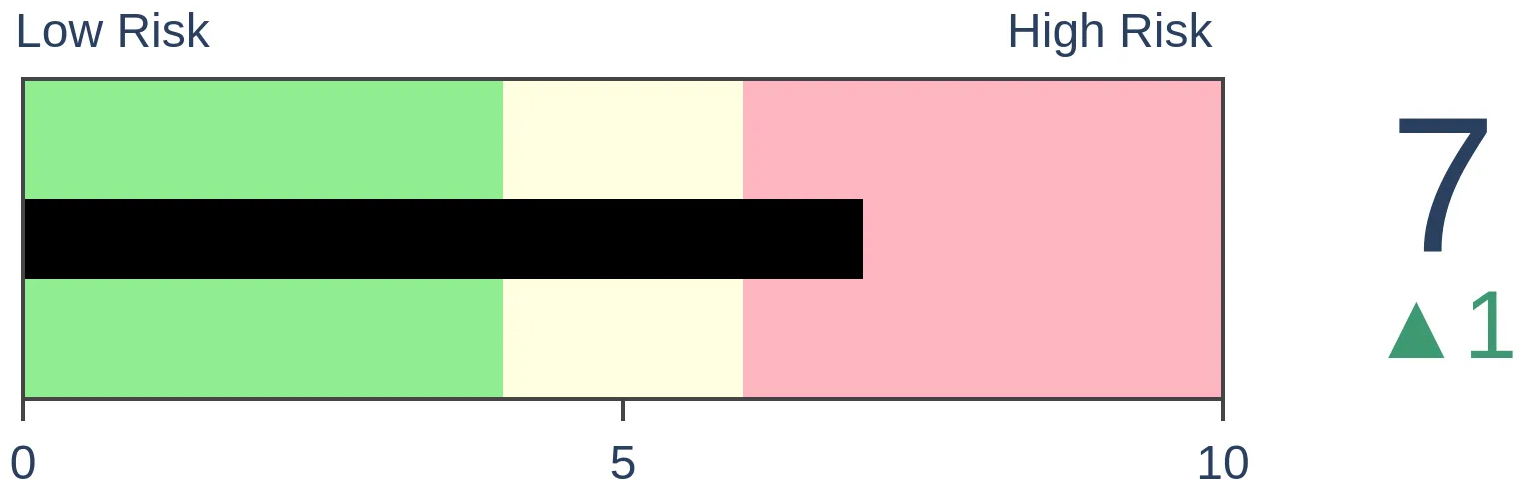
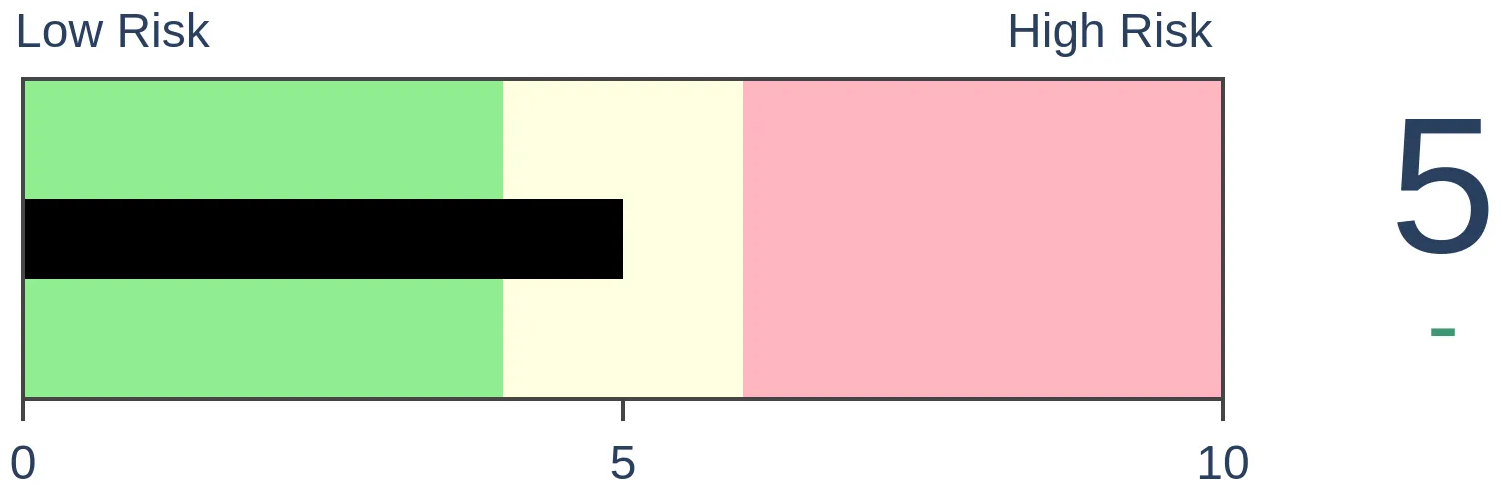
Risk Levels
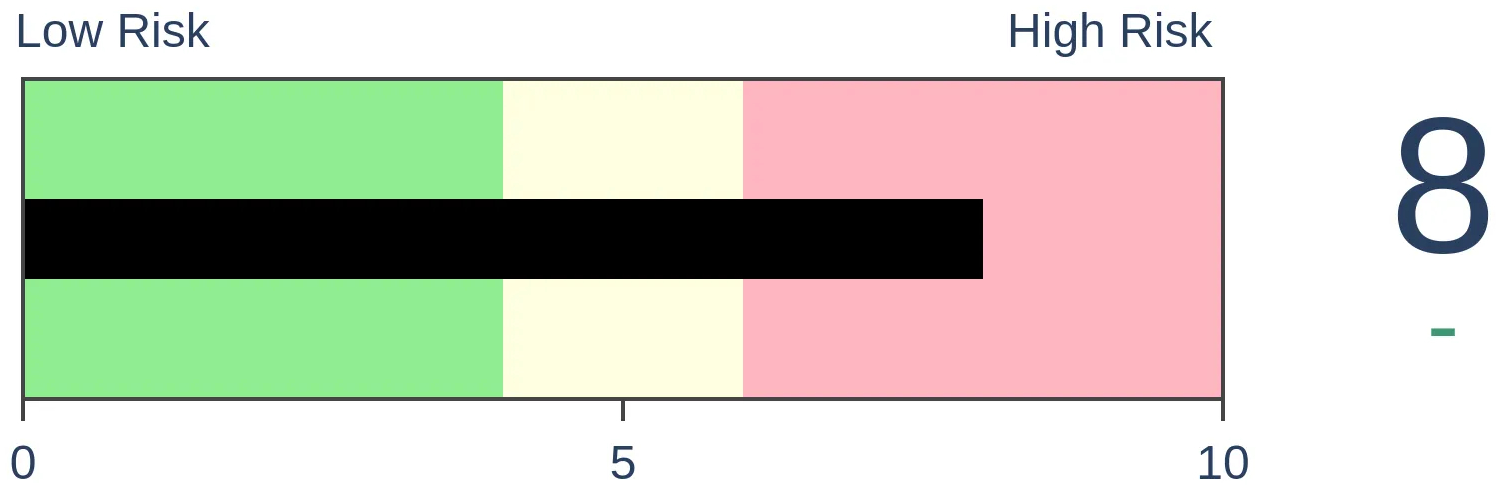
Stocks Short-Term
|
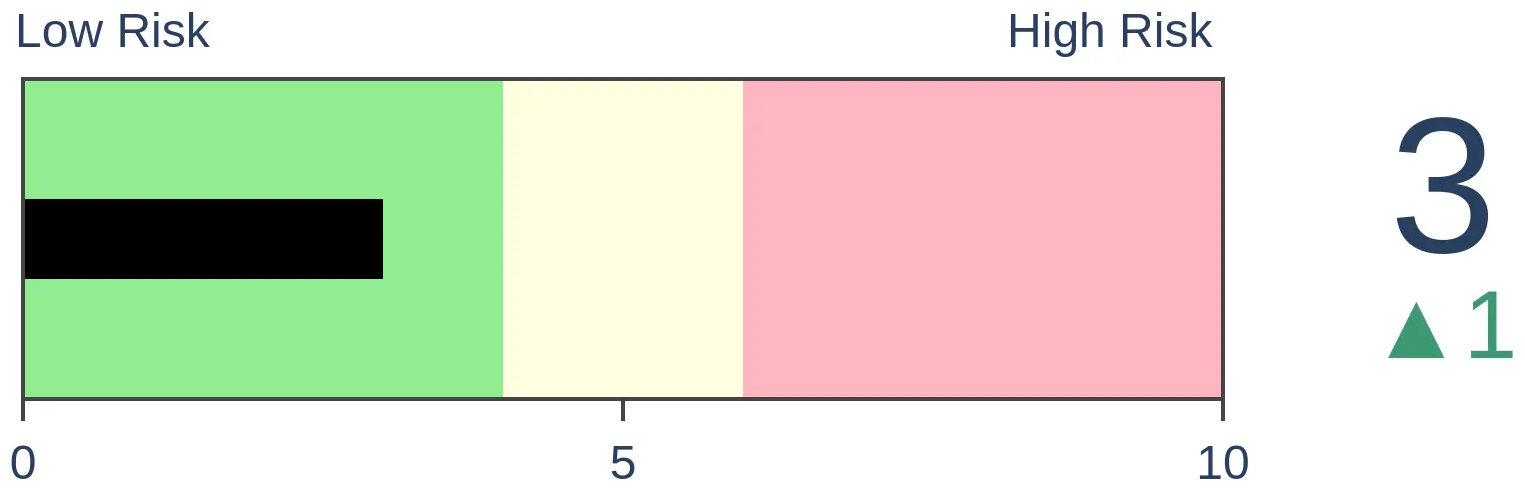
Stocks Medium-Term
|
|
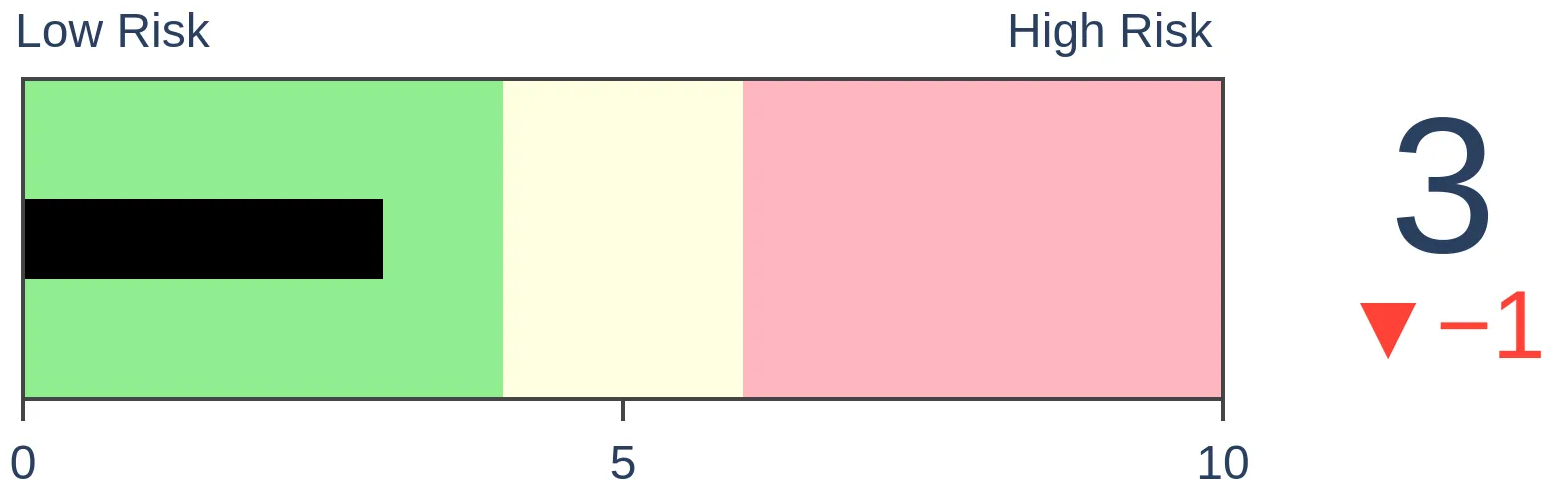
Bonds
|
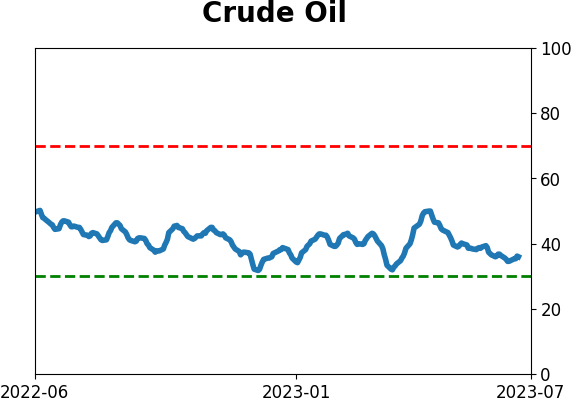
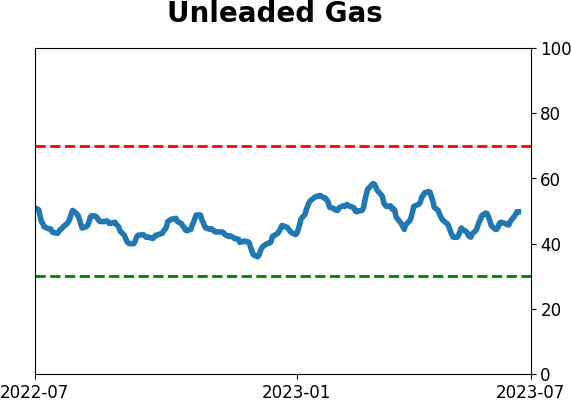
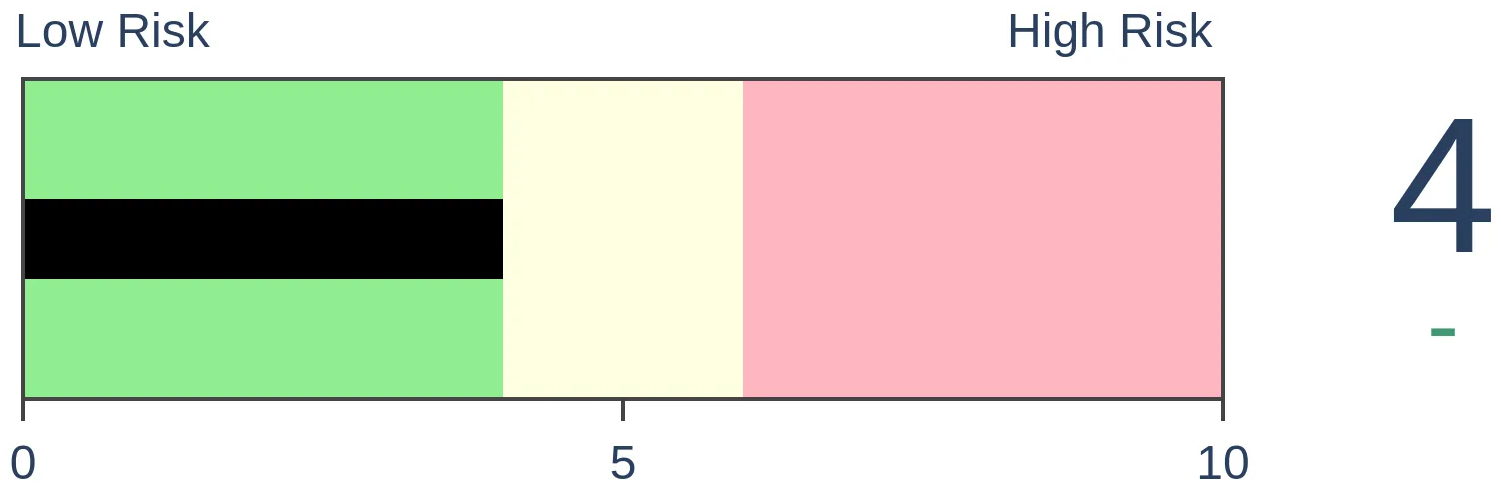
Crude Oil
|
|
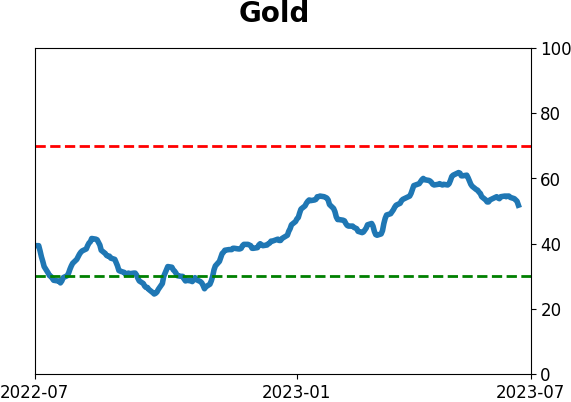
Gold
|
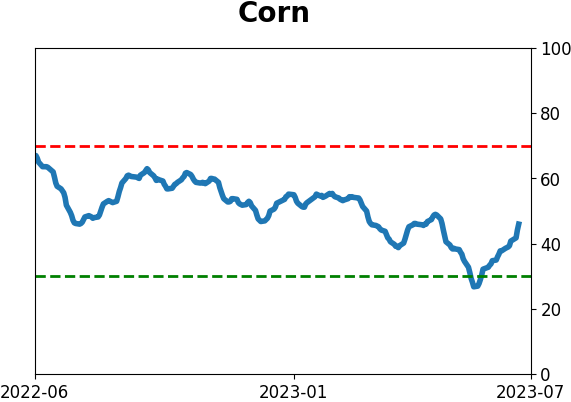
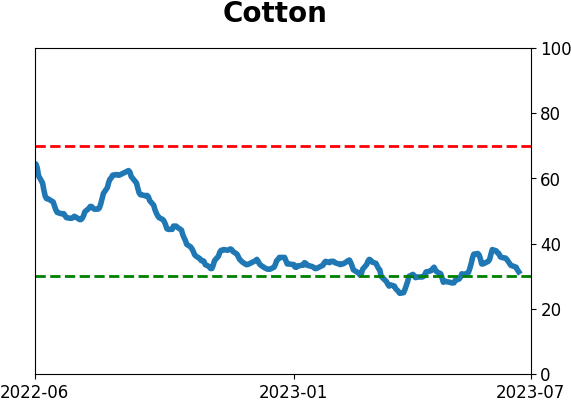
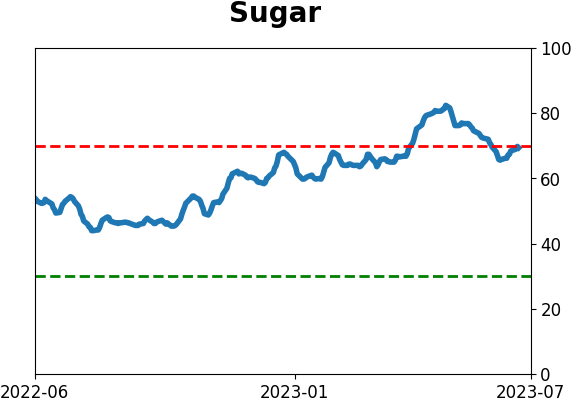
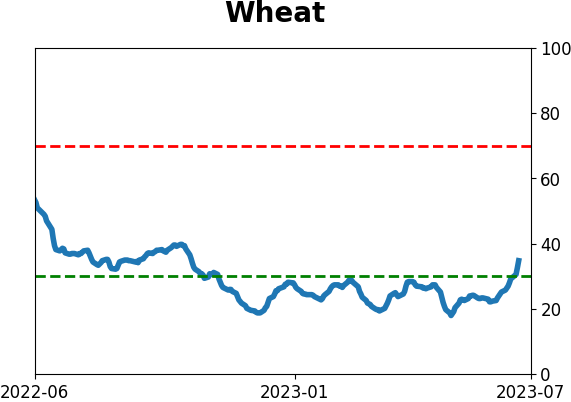
Agriculture
|
|
Research
By Jay Kaeppel
BOTTOM LINE
The stock market has demonstrated a long-term tendency to perform well directly before and after the July 4th U.S. market holiday. On the other hand, a particular group of days leading up to that period has tended to show weakness. In this piece, we separate the two and closely examine the results.
FORECAST / TIMEFRAME
None
|
Key Points
- The stock market has shown favorable and unfavorable certain tendencies in the period leading up to and just before and after July 4th
- A trader aware of these tendencies may be able to find short-term trading opportunities
The "July 4th periods"
Before creating two parts to the July 4th period, first note that I designate the trading day directly before the July 4th holiday (i.e., the day the stock market is closed to honor the July 4th holiday) as TDY -1. The first trading day directly after the July 4th holiday is designated as TDY +1.
We will break the July 4th period into two parts:
- Part 1 (Unfavorable): From the close of TDY -13 through the close of TDY -5
- Part 2 (Favorable): From the close of TDY -5 through the close of TDY +3
Huh?
Let's try it in English once and see if that helps.
- The four trading days before AND the three trading days after July 4th are deemed "favorable" as the market has tended to rally near market holidays
- The eight trading days BEFORE the start of this favorable period are deemed "unfavorable"
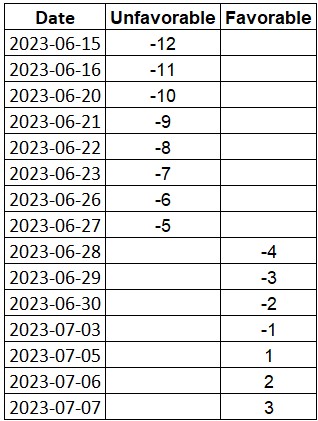
An example
The table below displays the pattern described above applied to 2023. The unfavorable period extends from the close on 2023-06-14 through the close on 2023-06-28. The favorable period extends from the close on 2023-06-28 through the close on 2023-07-07.
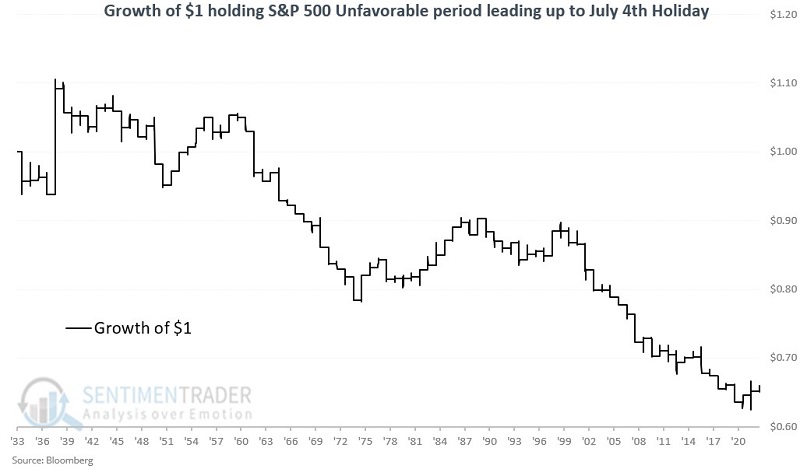
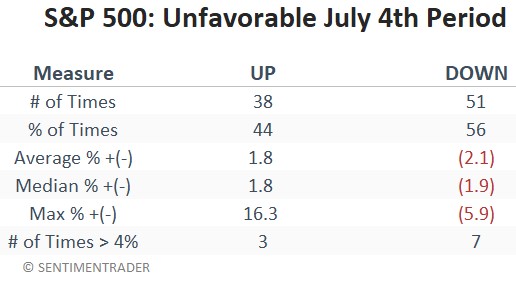
A closer look at Unfavorable Periods
We started our test in 1934 using daily closing price data for the S&P 500 Index. The chart and table below display S&P 500 performance if held only during the nine unfavorable trading days starting in 1934.
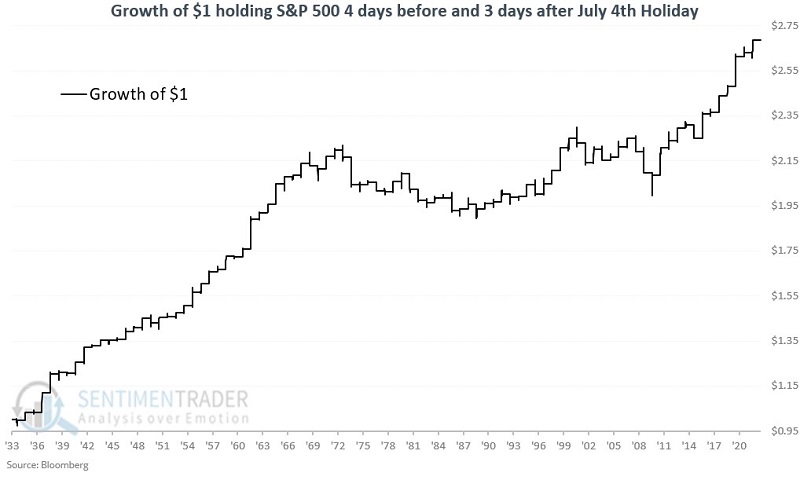
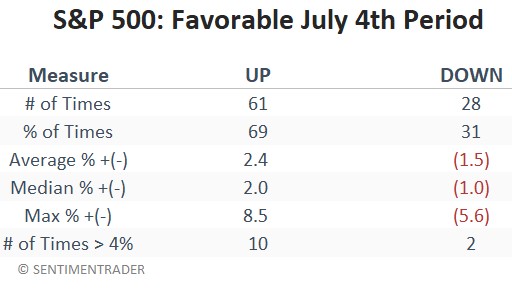
A closer look at Favorable Periods
The chart and table below display S&P 500 performance if held only during the seven favorable trading days starting in 1934.
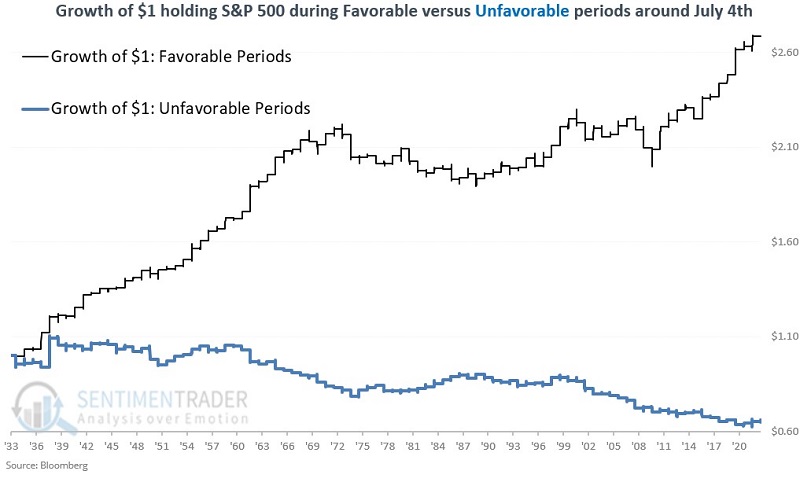
Comparing the two periods
The chart below displays the growth of $1 and the S&P 500 performance for the favorable and unfavorable periods together.
- The favorable period has achieved a hypothetical total gain of +169%
- In contrast, the unfavorable period has achieved a hypothetical loss of -35%
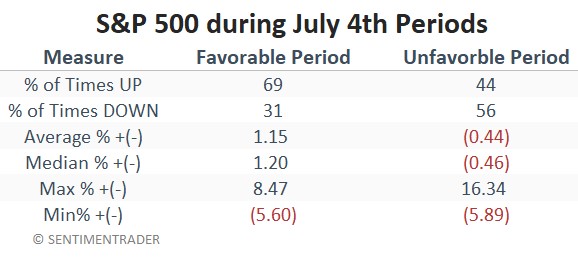
The table below summarizes performance for the favorable and unfavorable periods.
What the research tells us…
Seasonal tendencies are never a sure thing. As the name implies, they are merely tendencies. Still, for short-term traders, this information can help to tell you "which way to lean" around the July 4th holiday. This information - combined with your favorite long or short entry setup - can help identify potential trading opportunities.
Indicators at Extremes
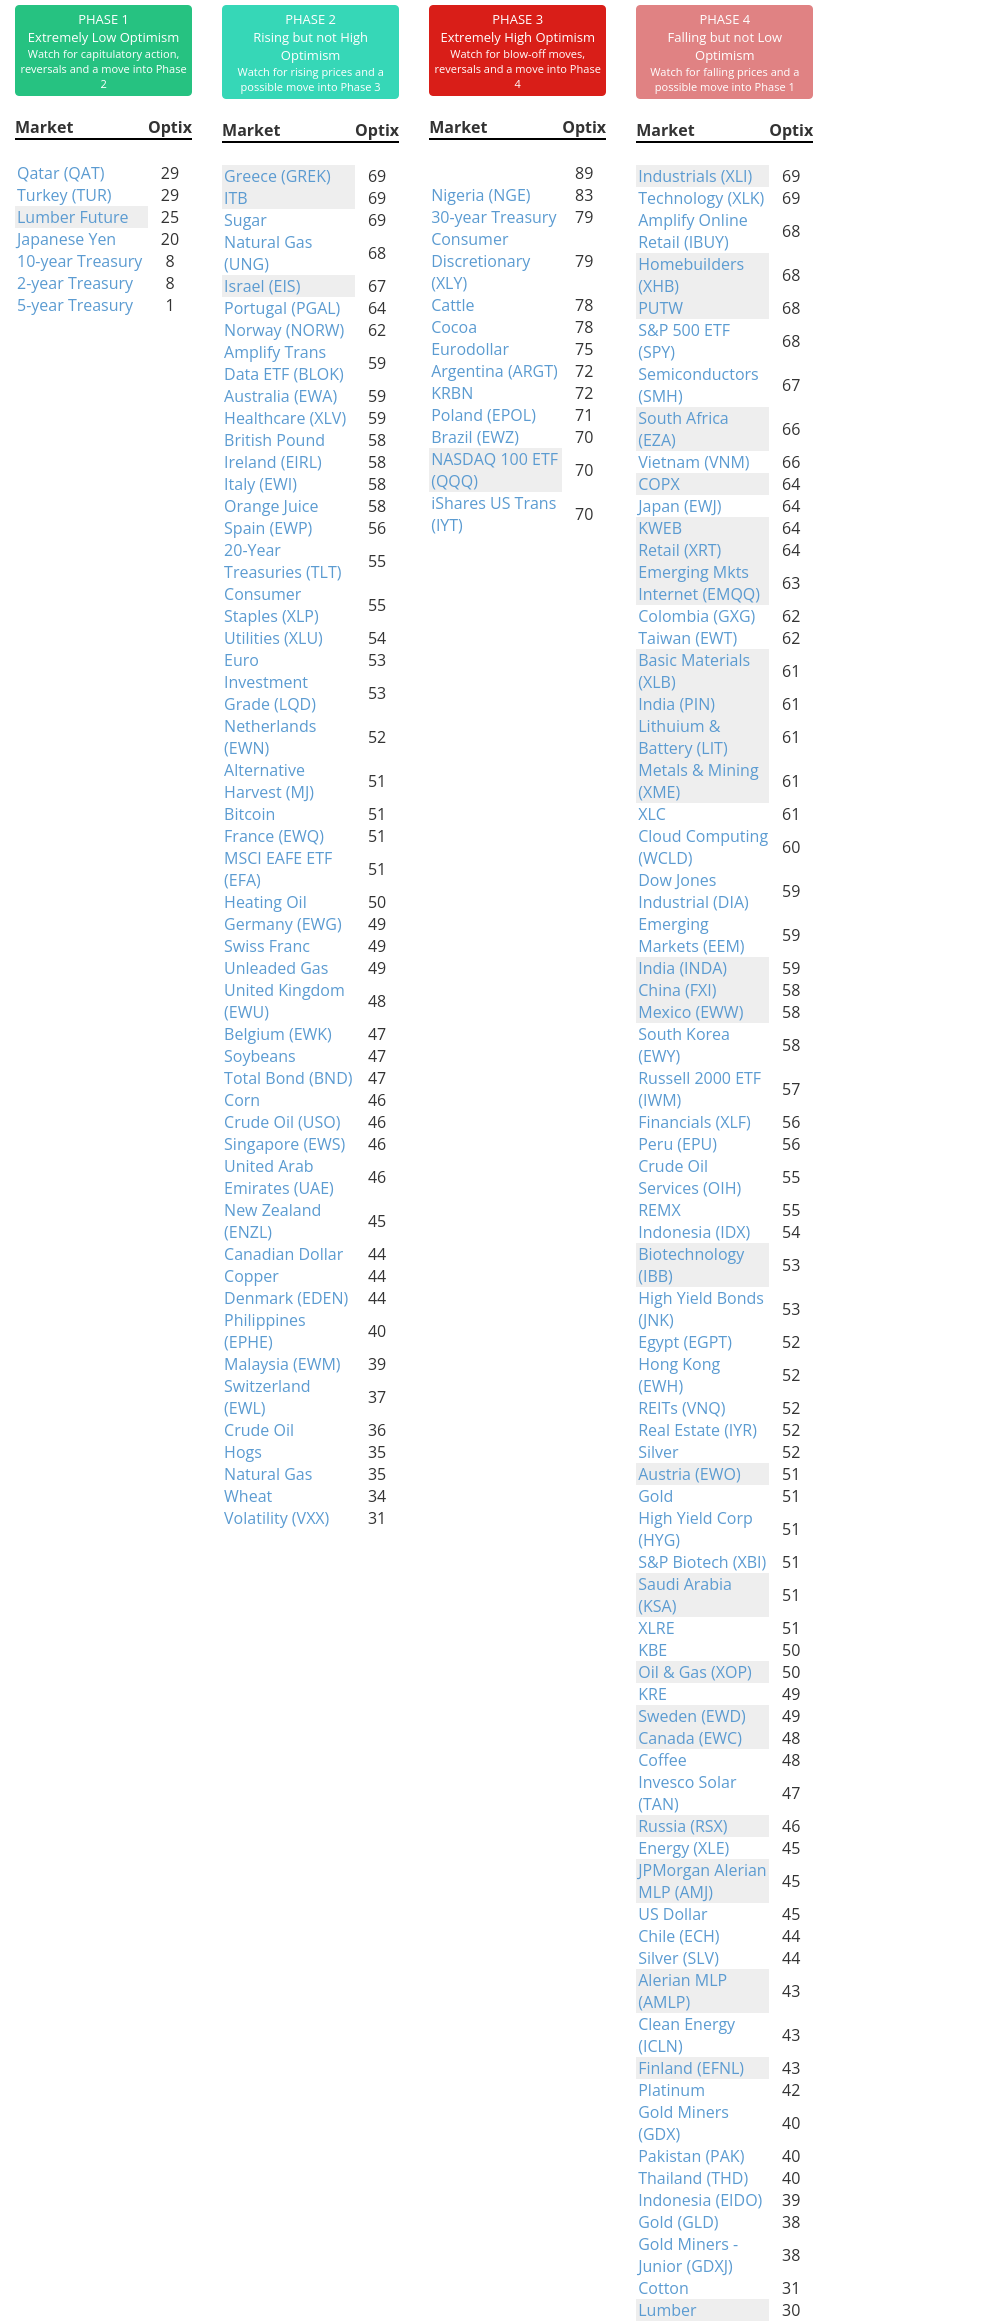
Phase Table
Ranks
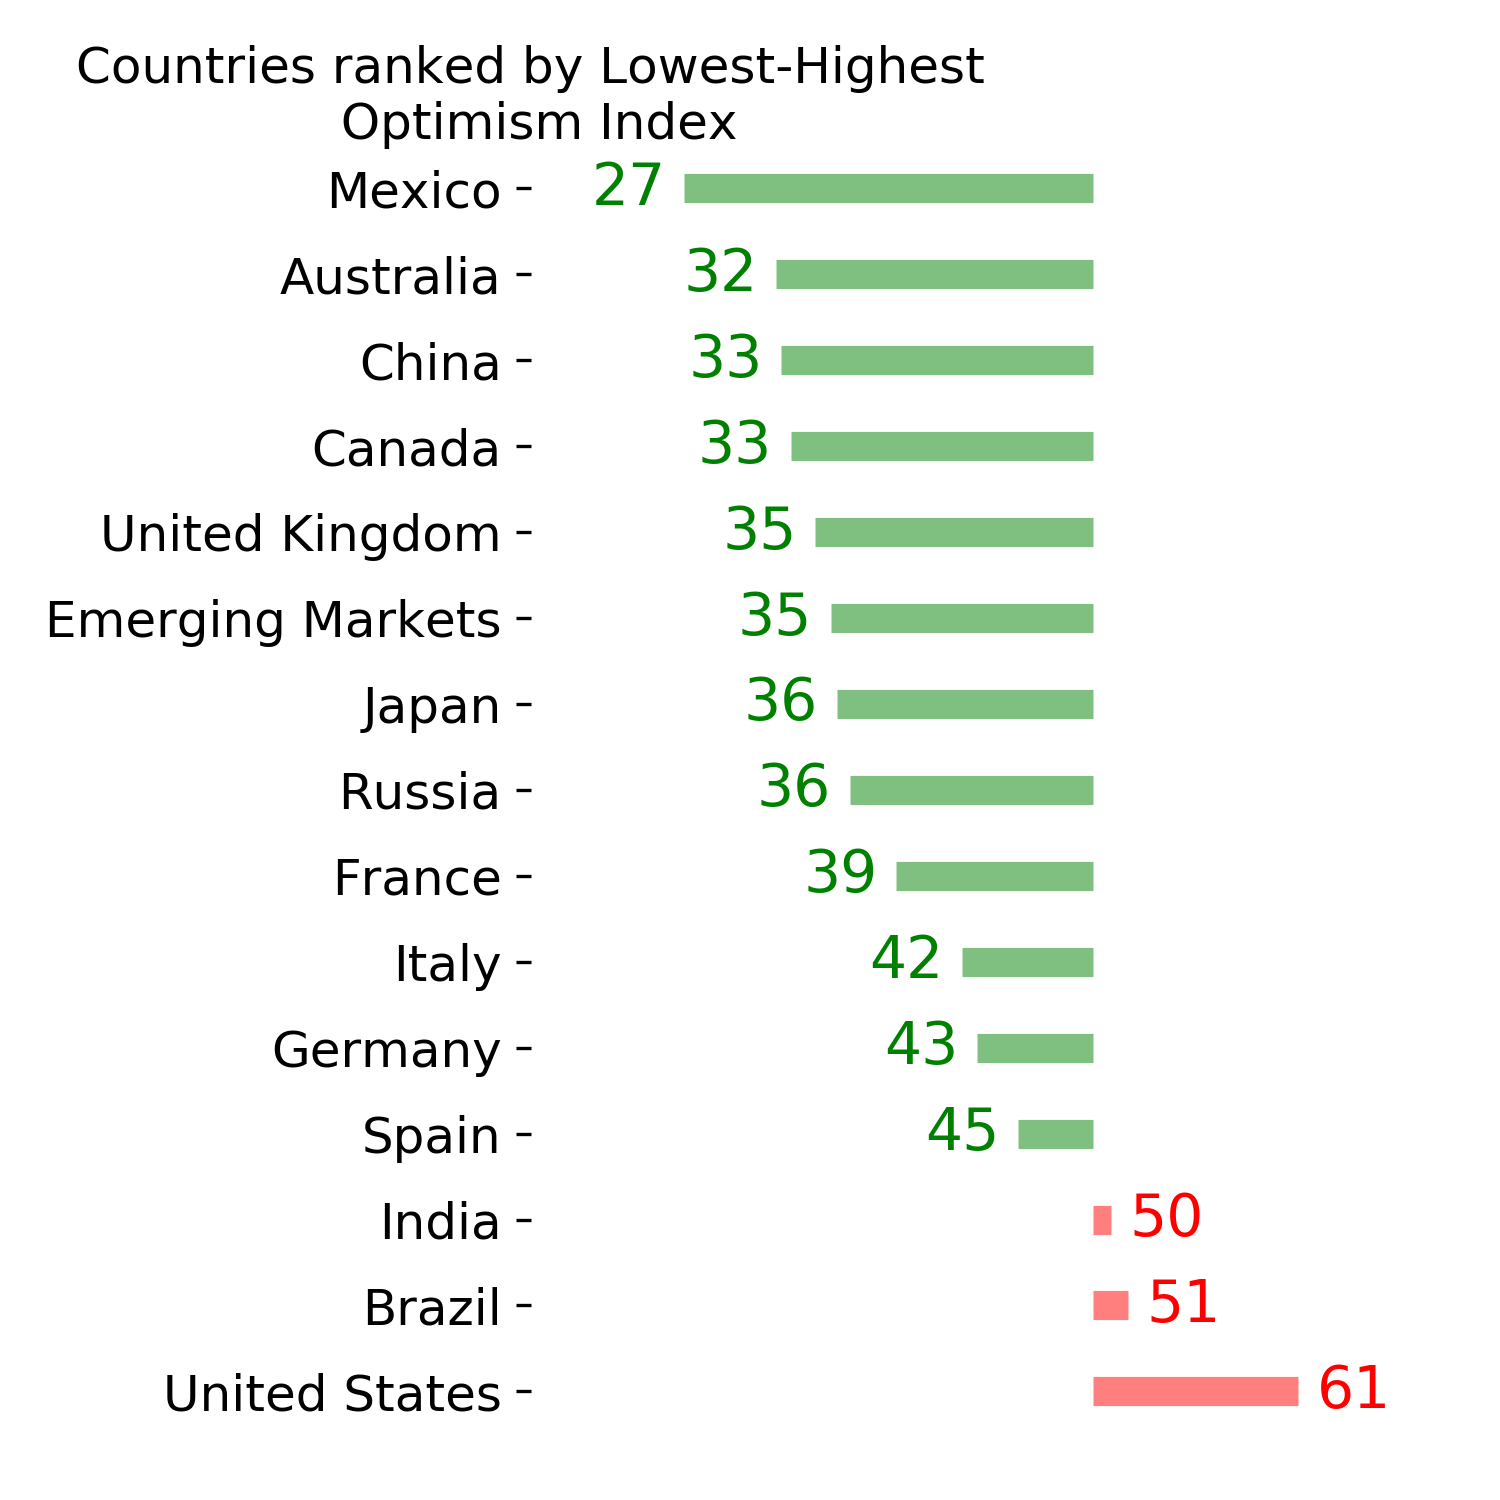
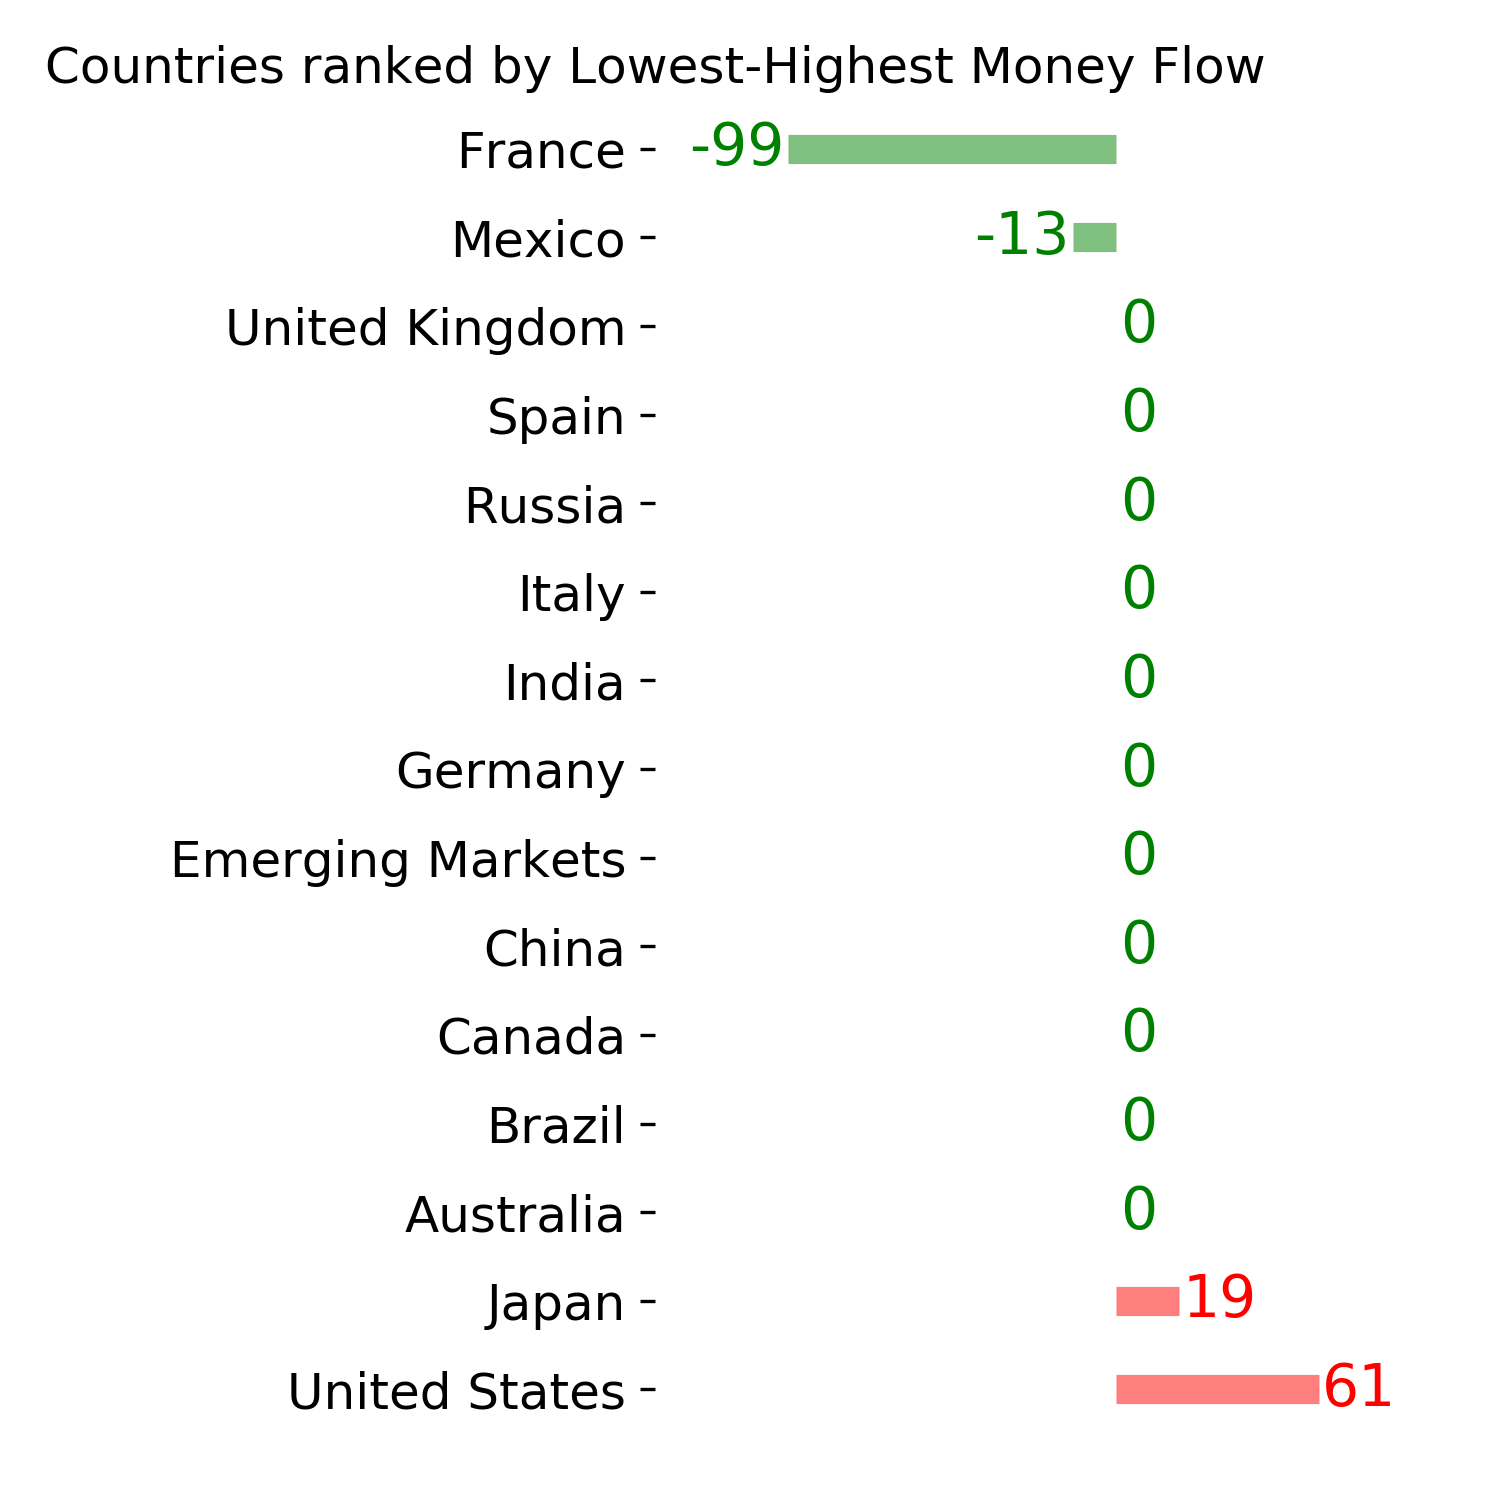
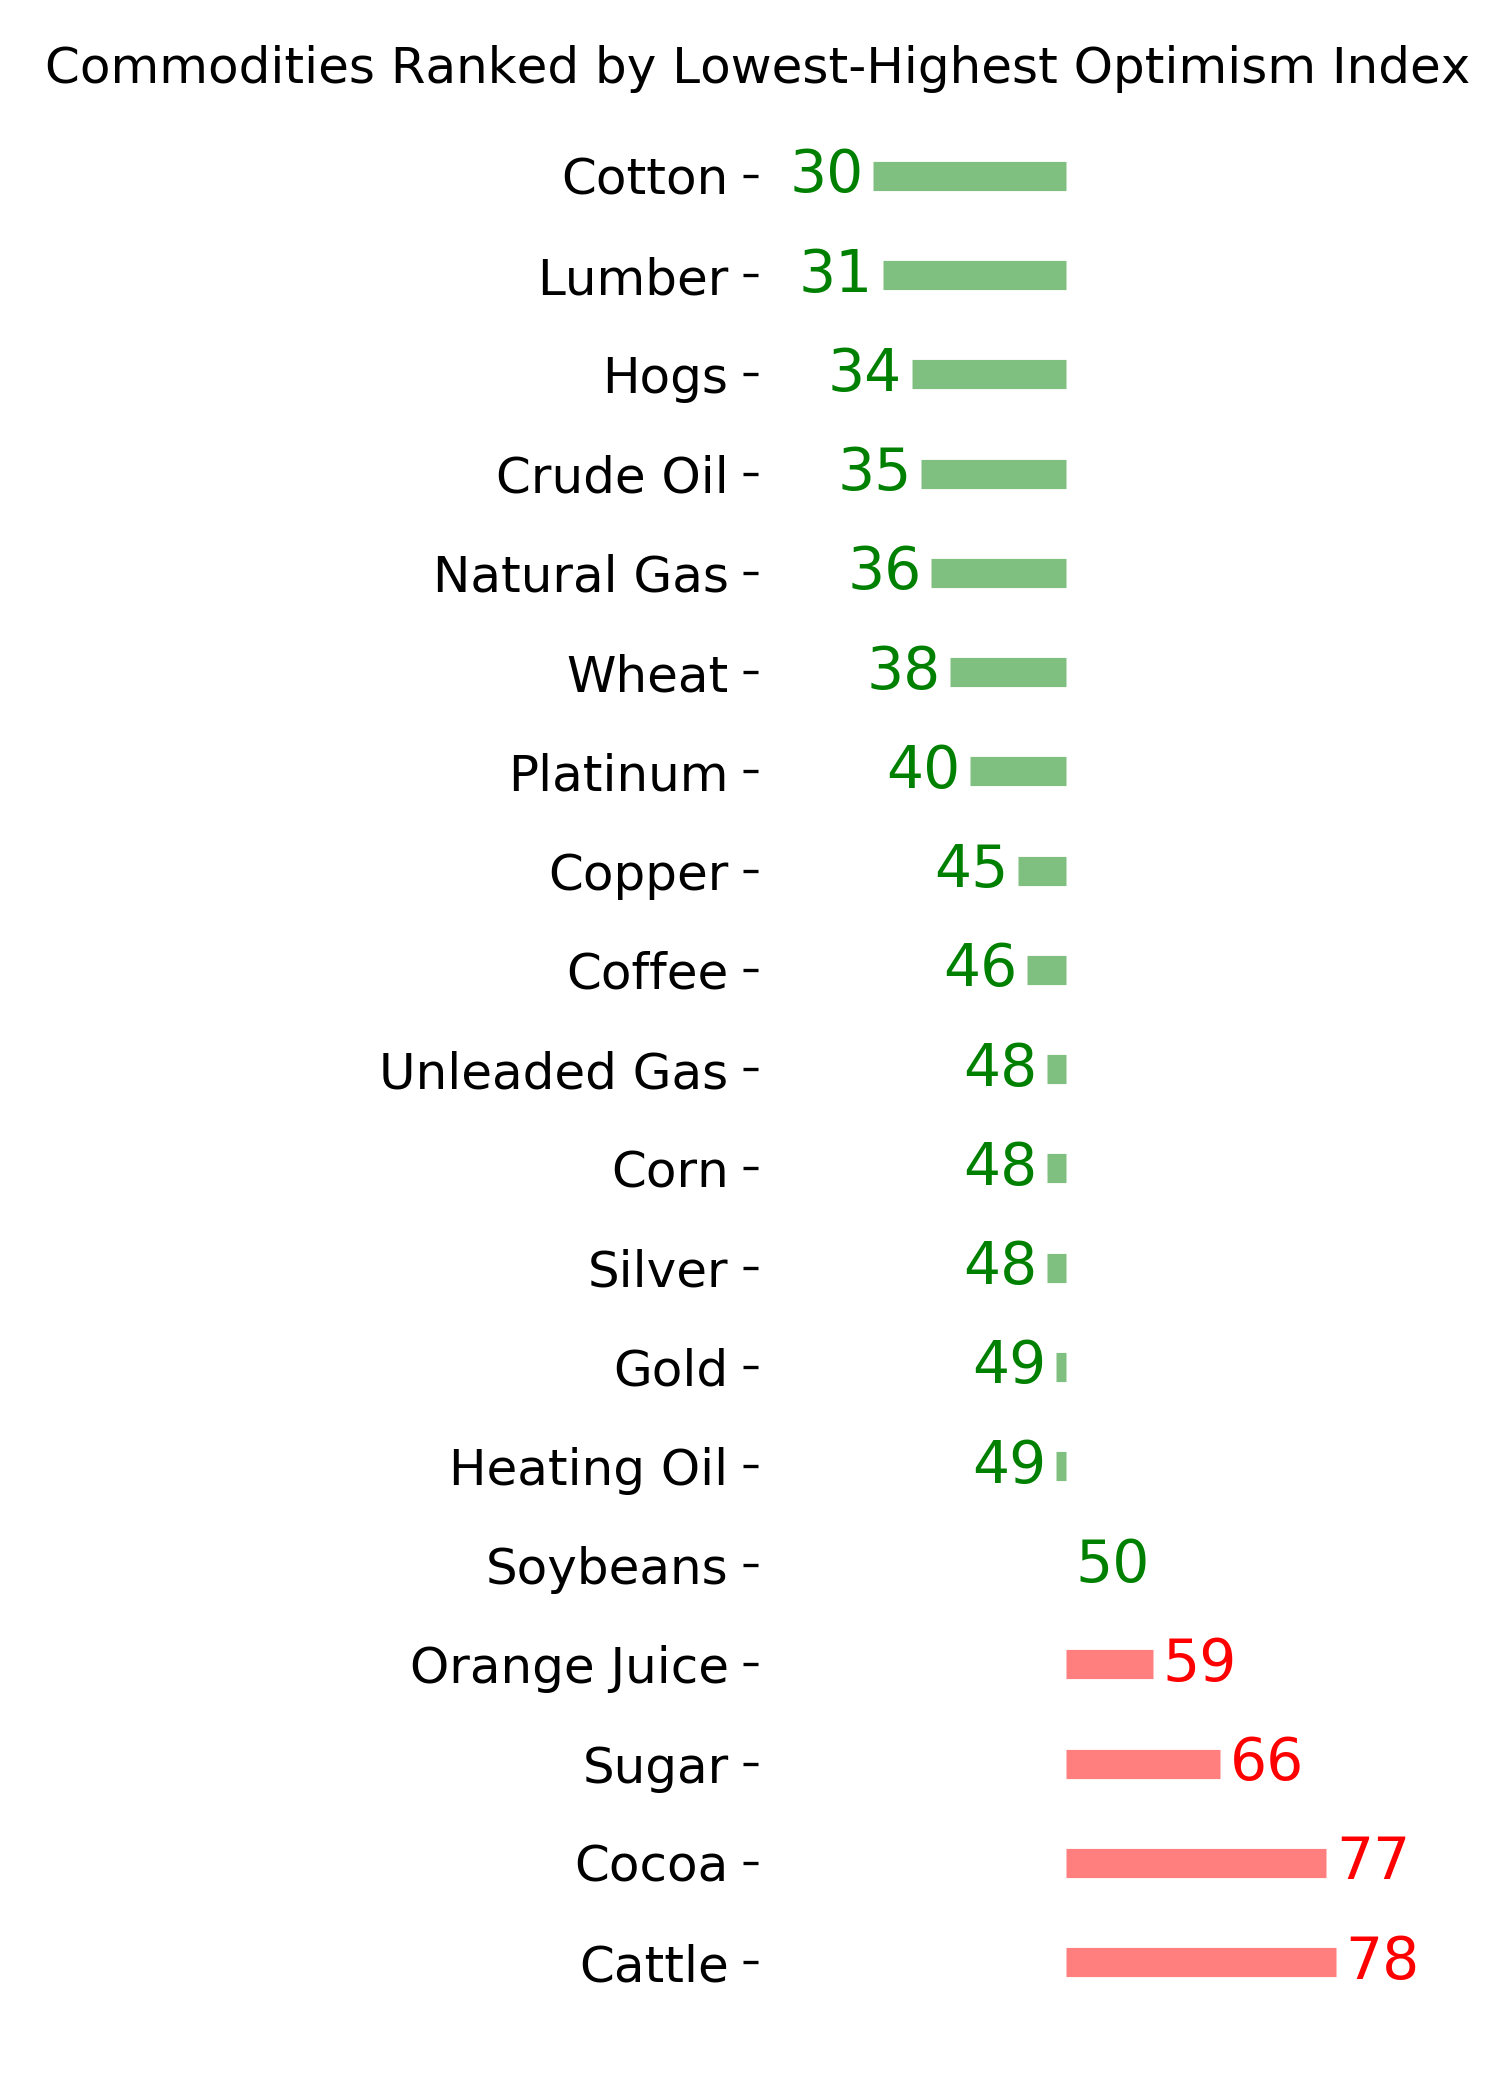
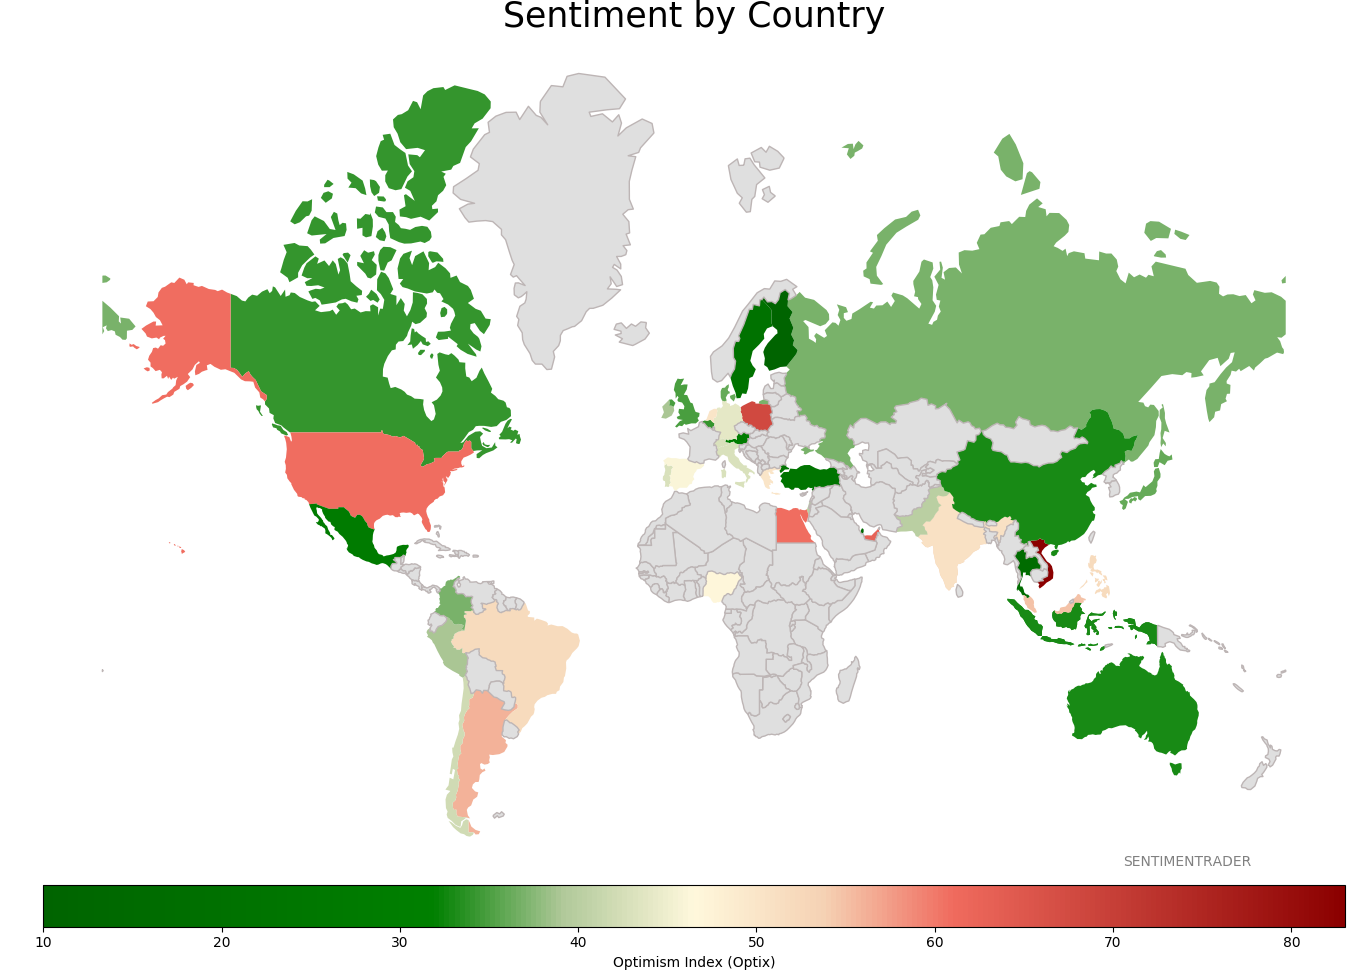
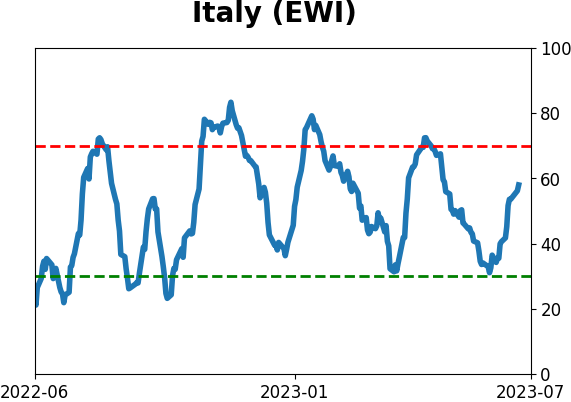
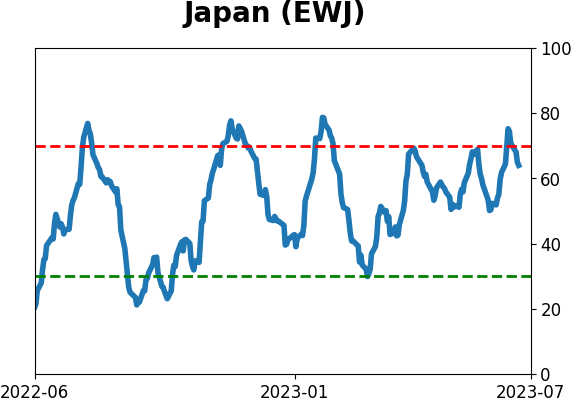
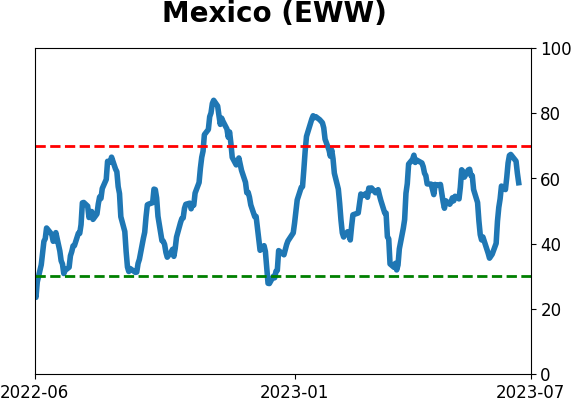
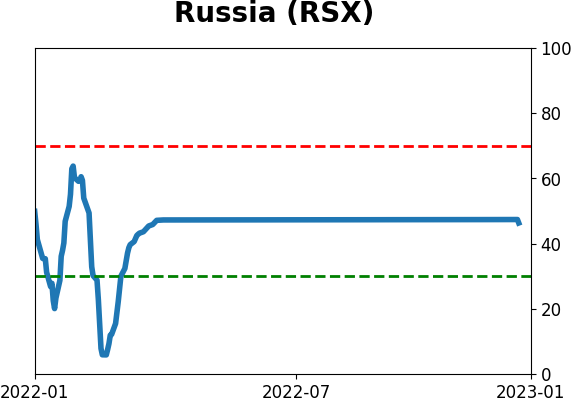
Sentiment Around The World
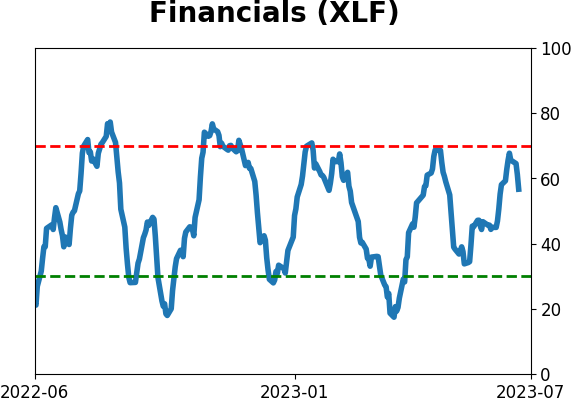
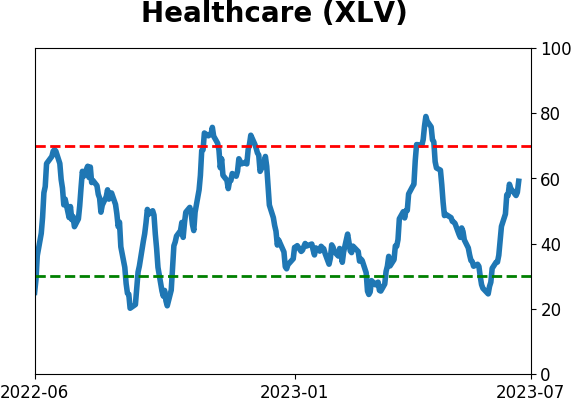
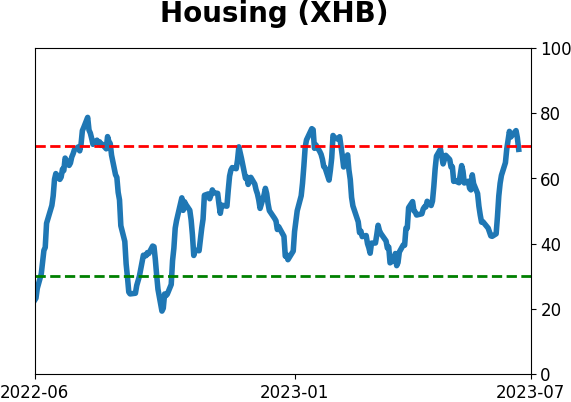
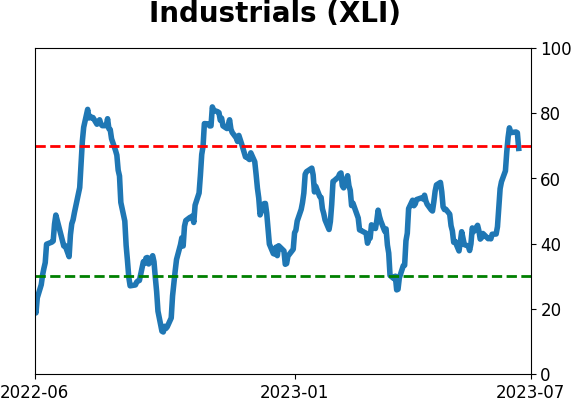
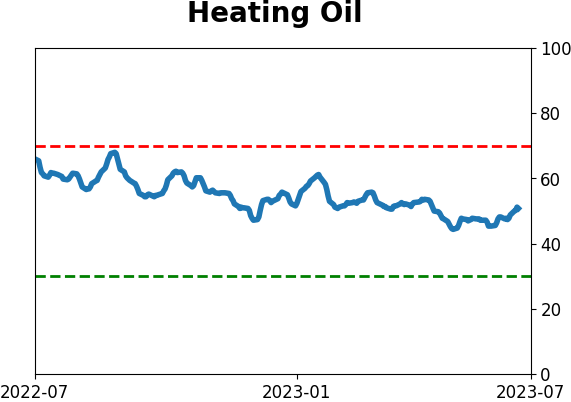
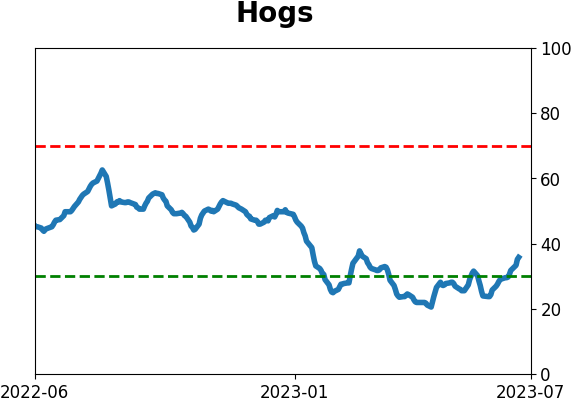
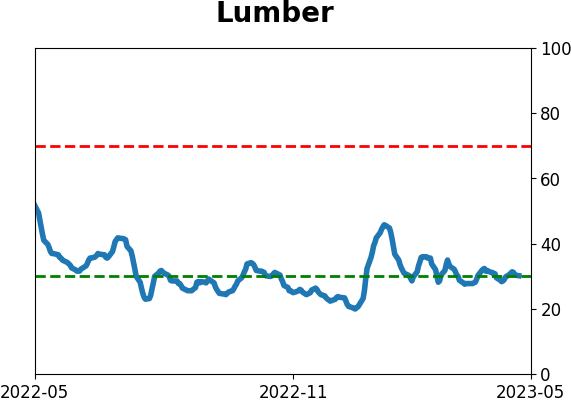
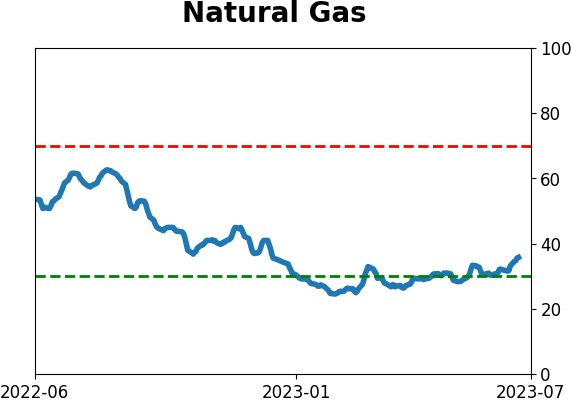
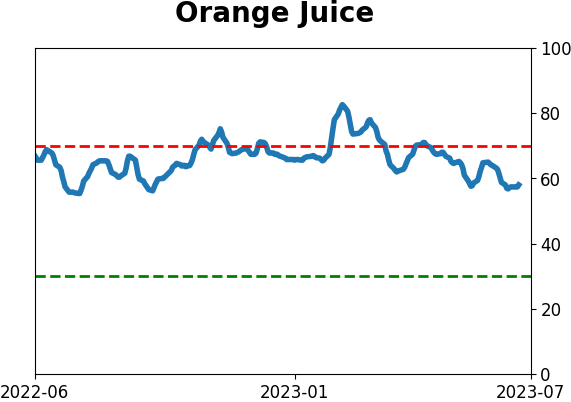
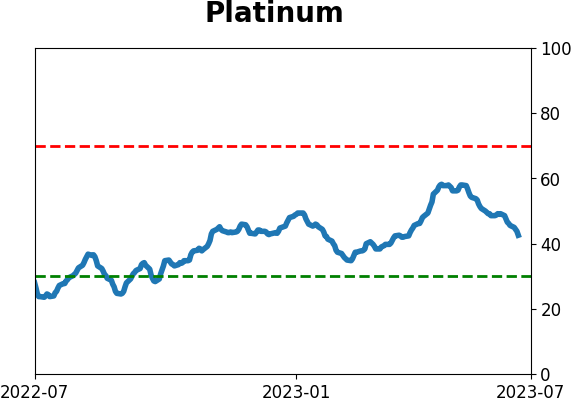
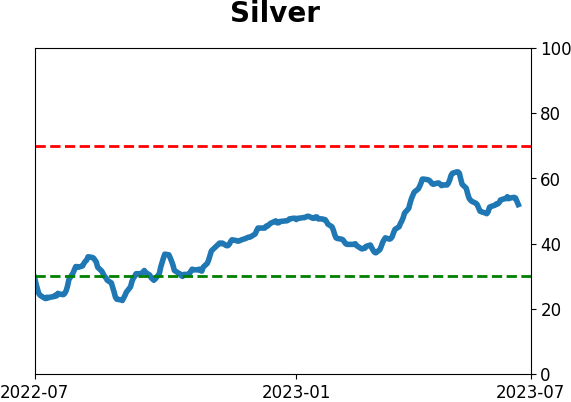
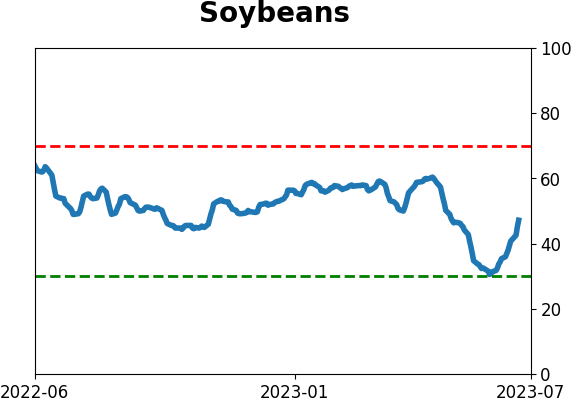
Optimism Index Thumbnails
|
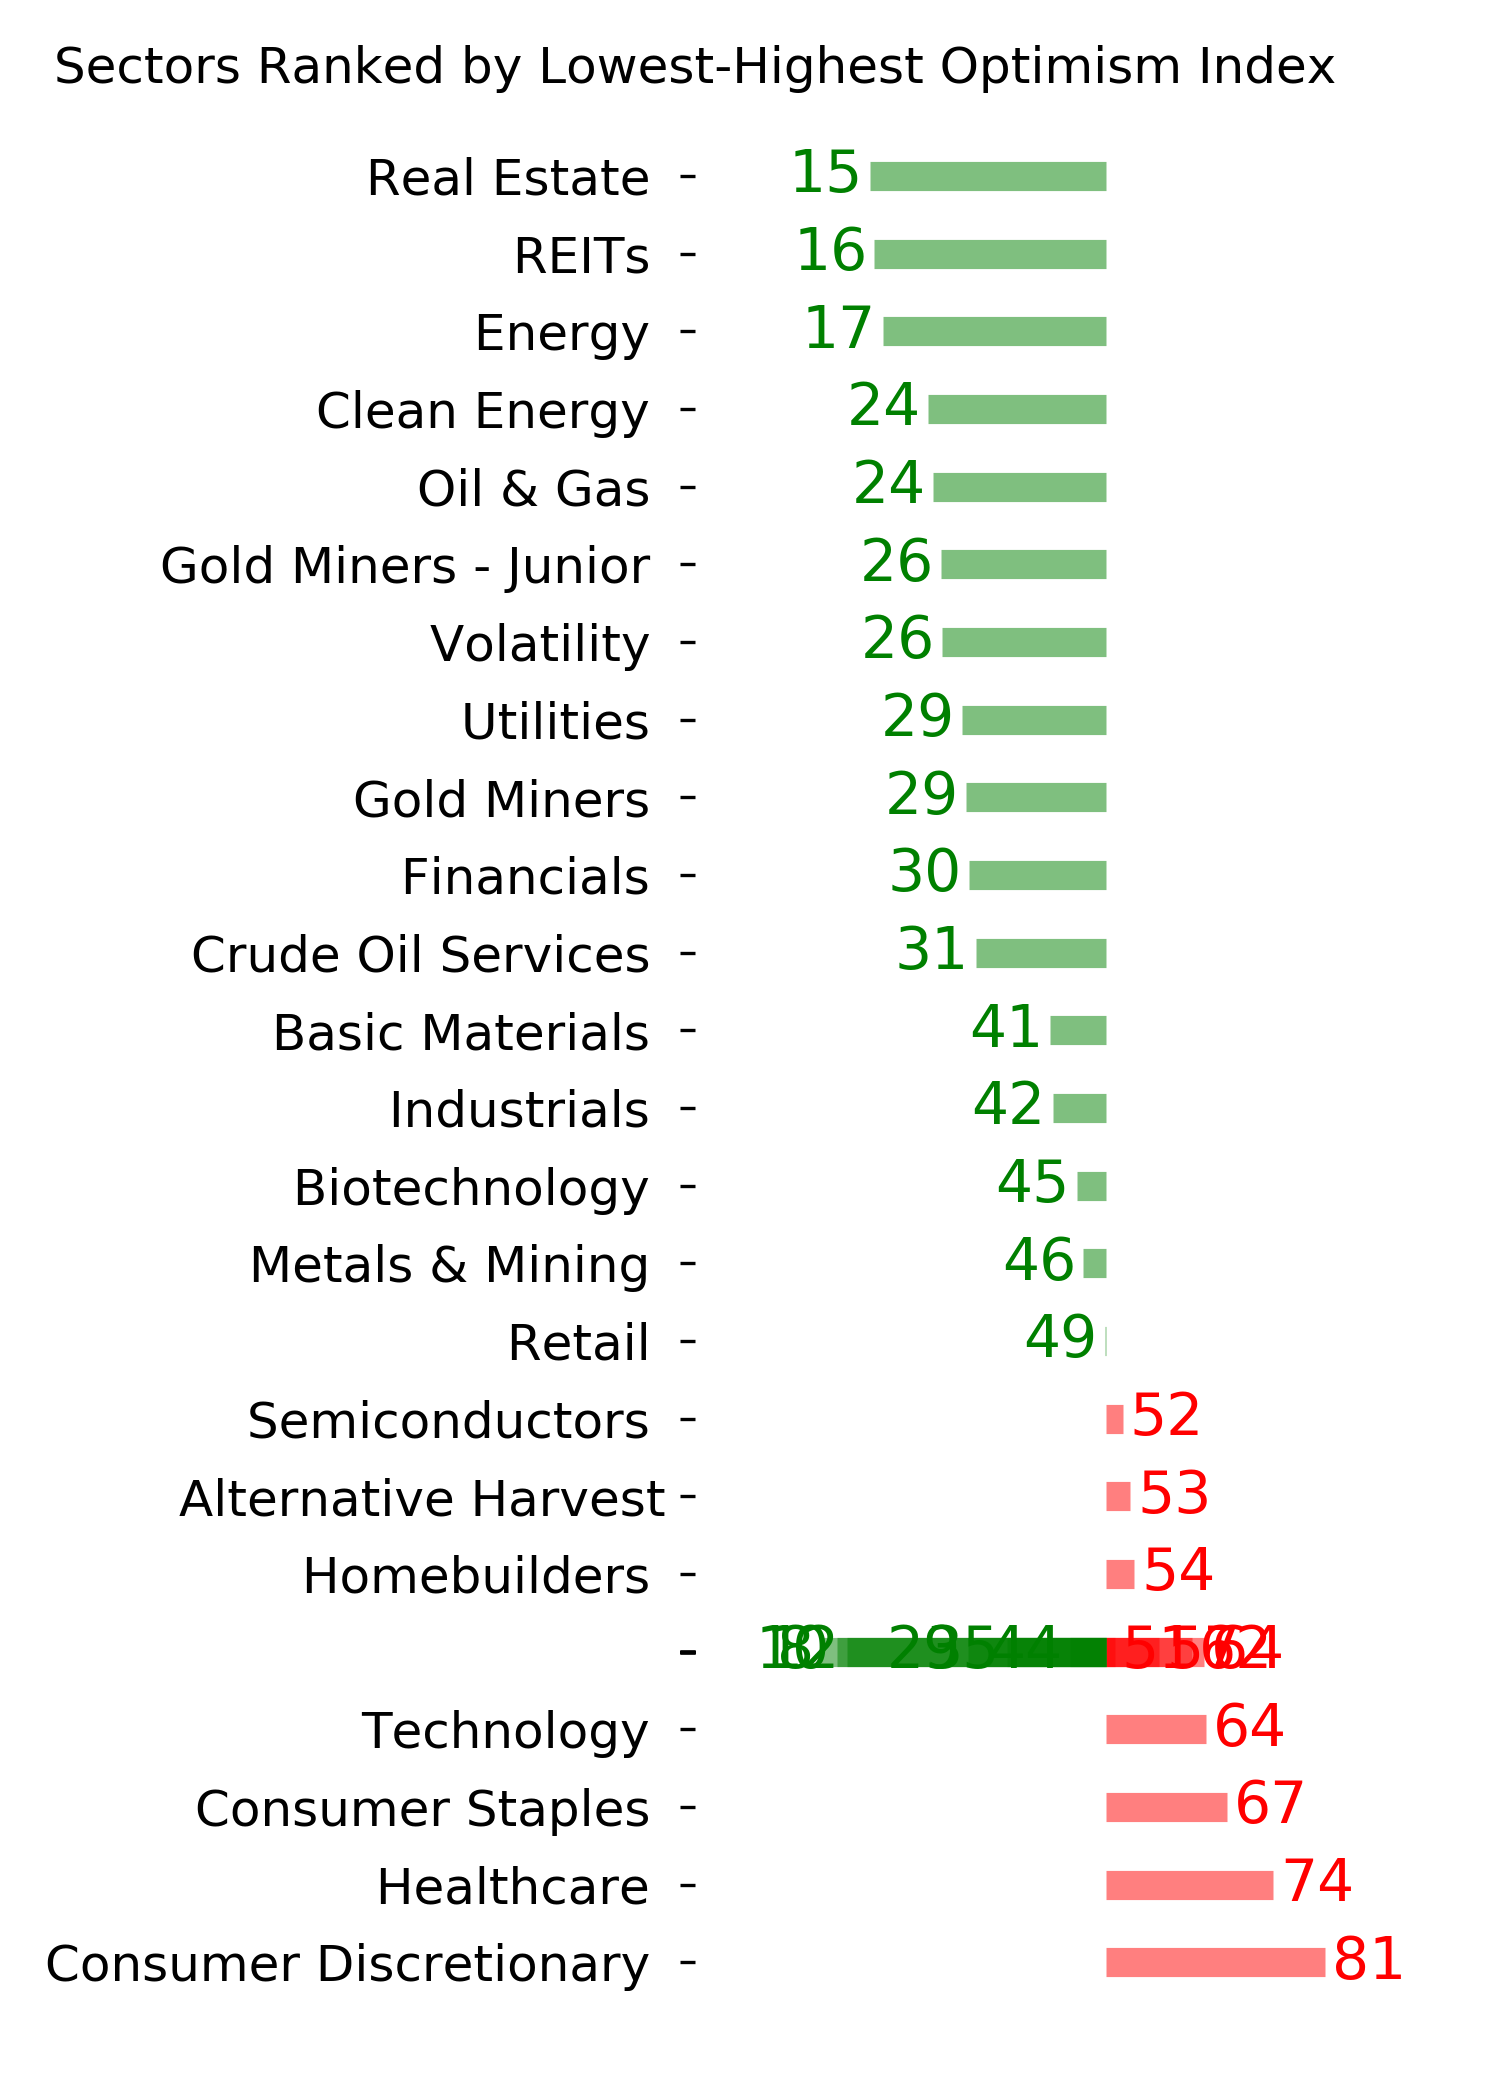
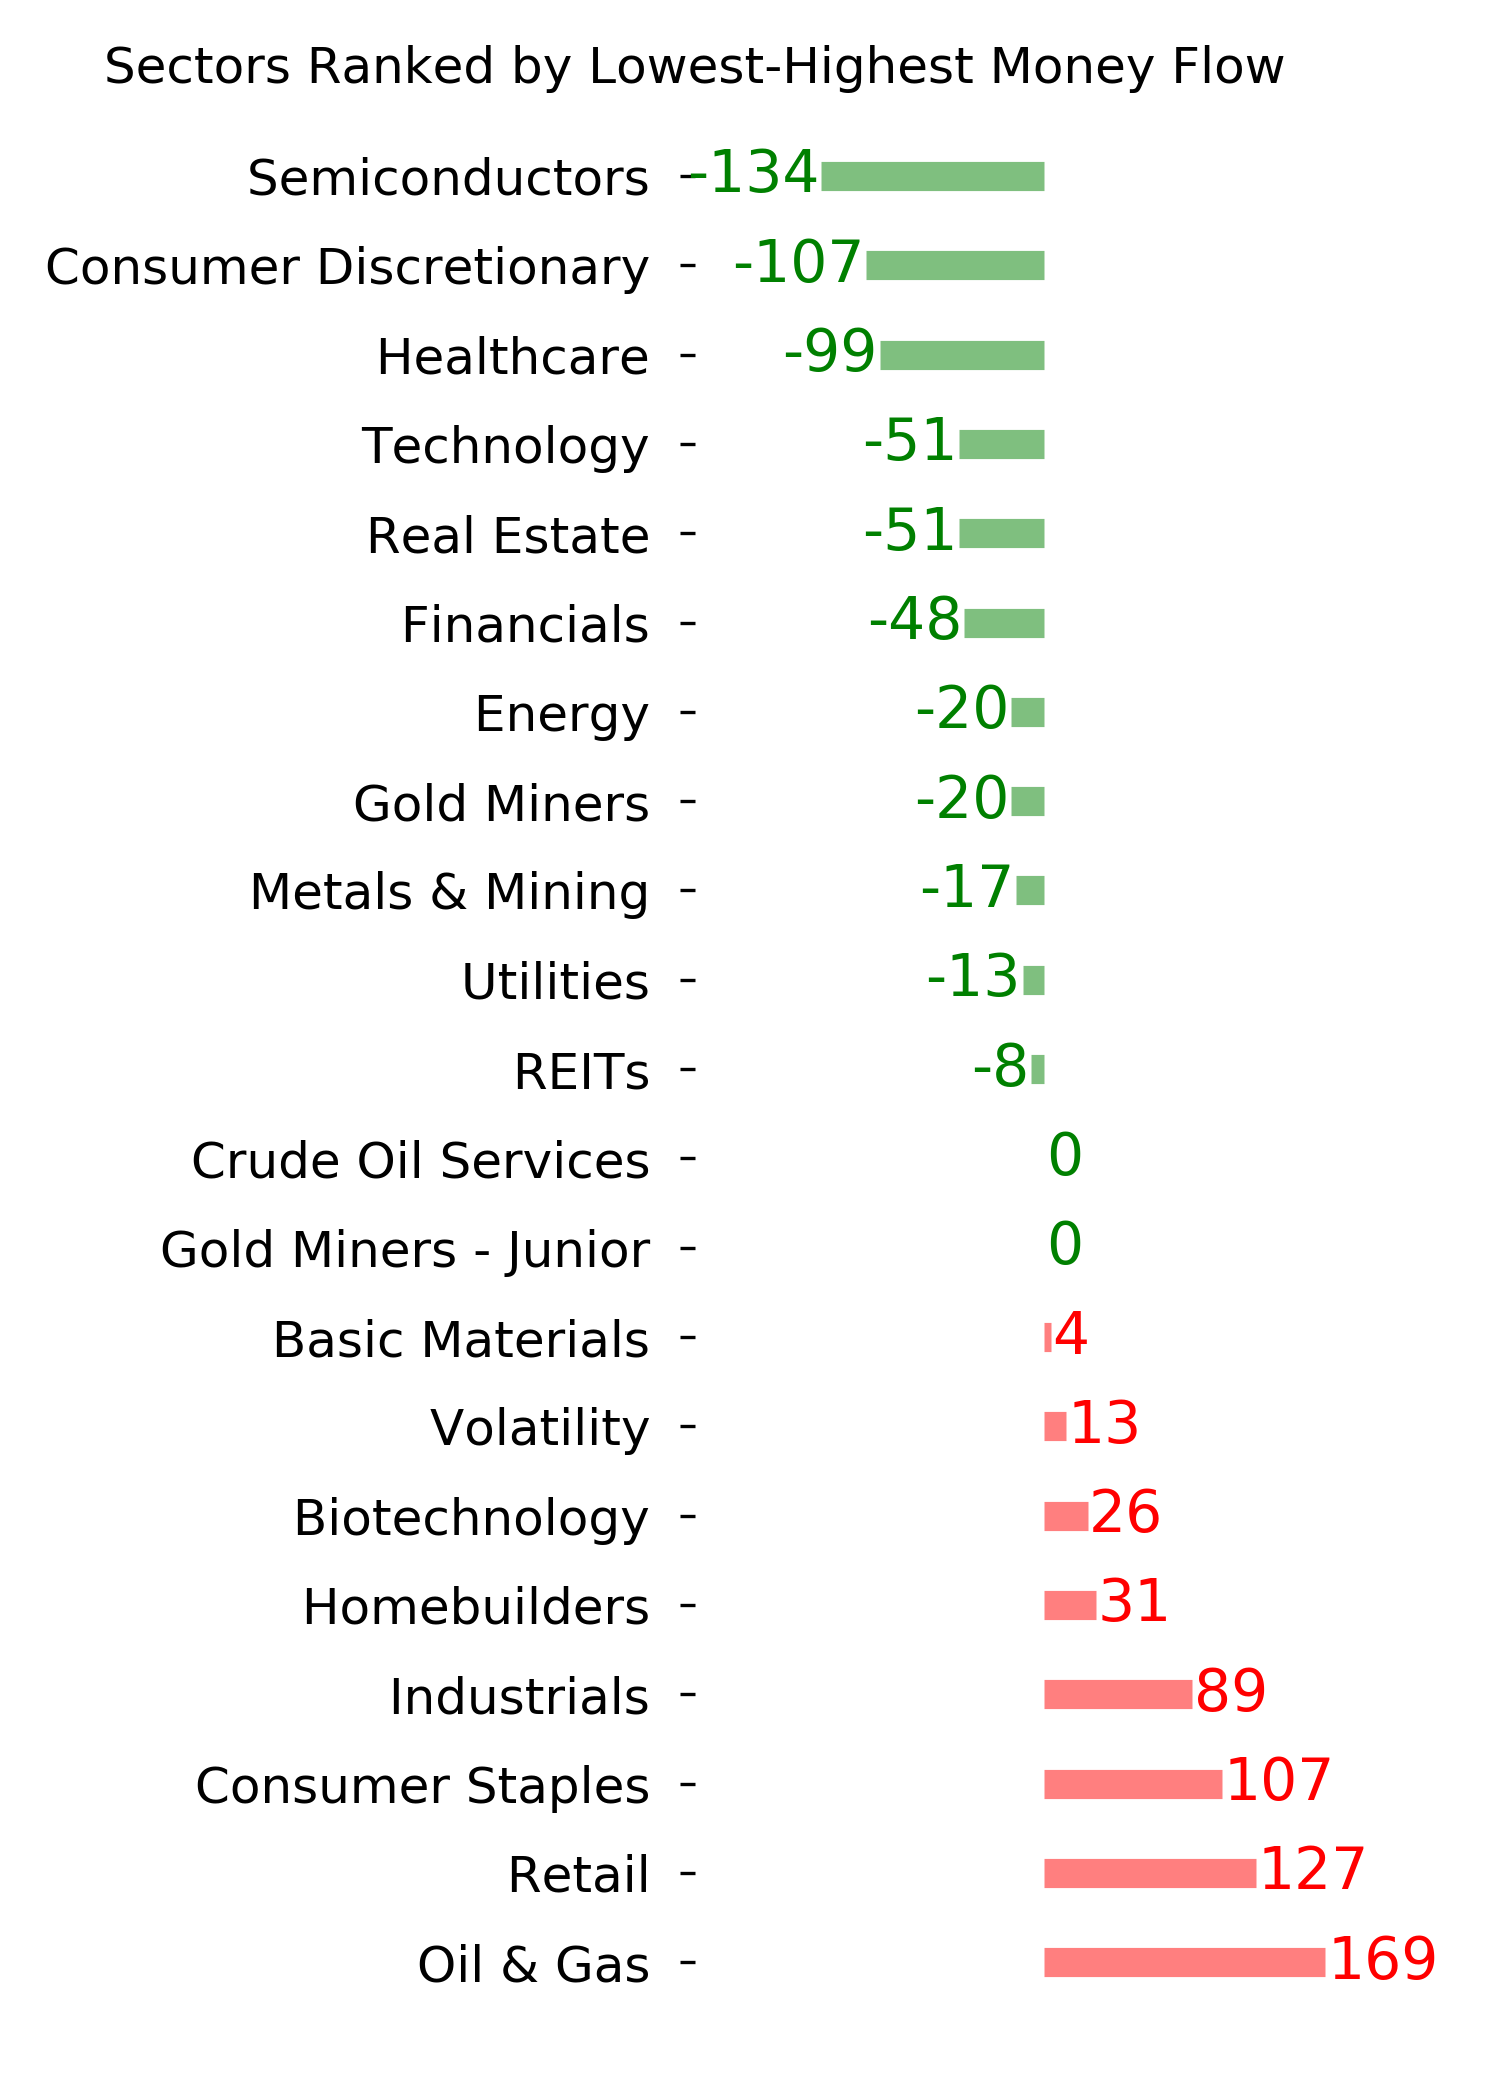
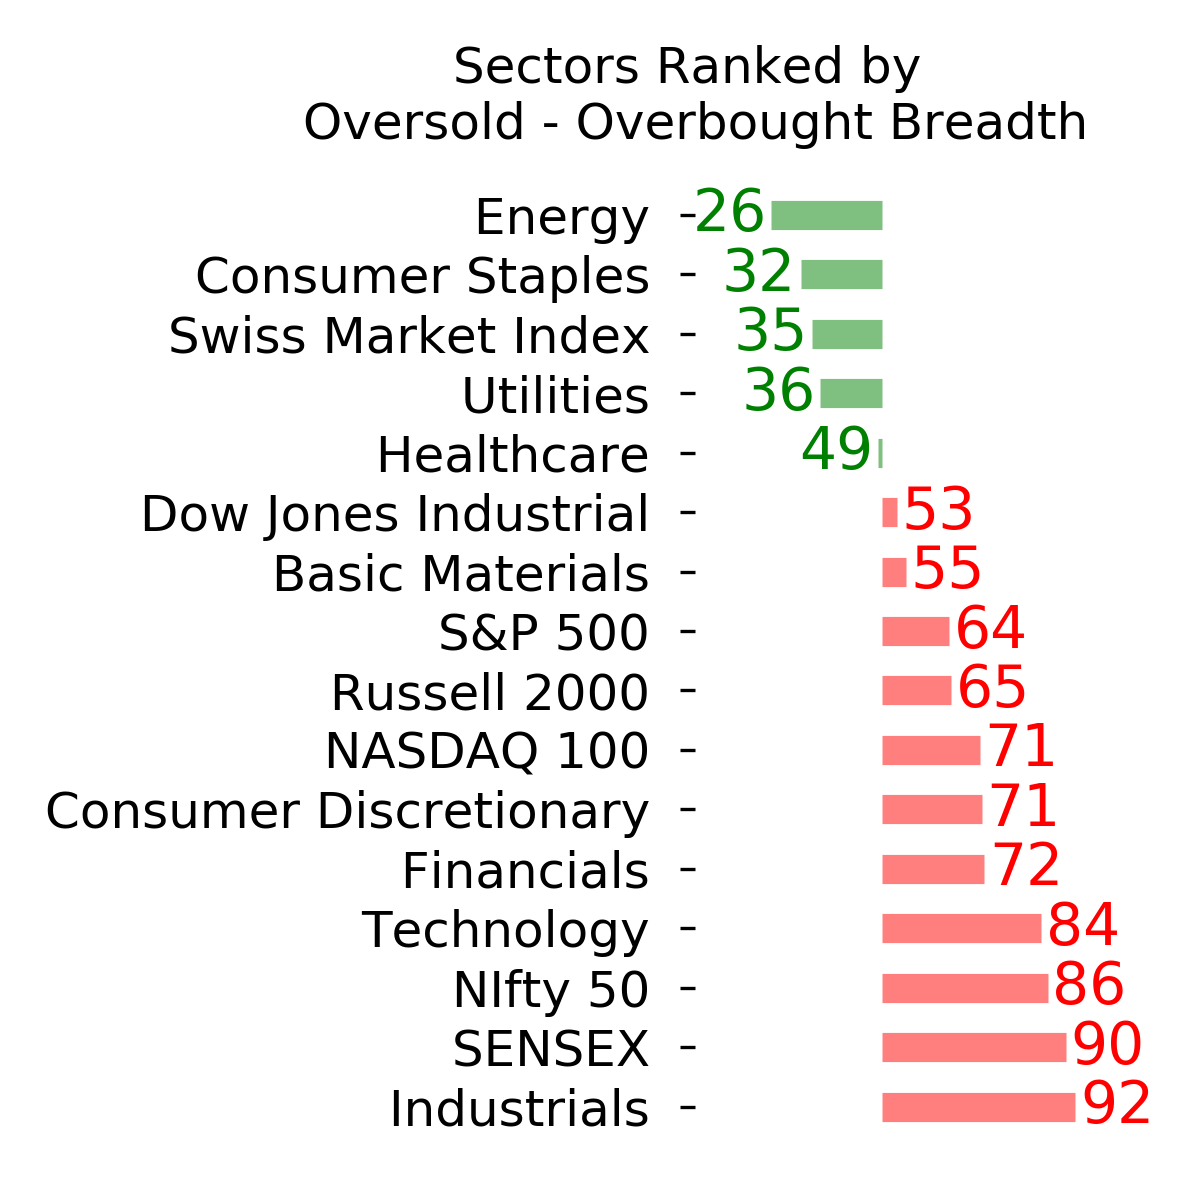
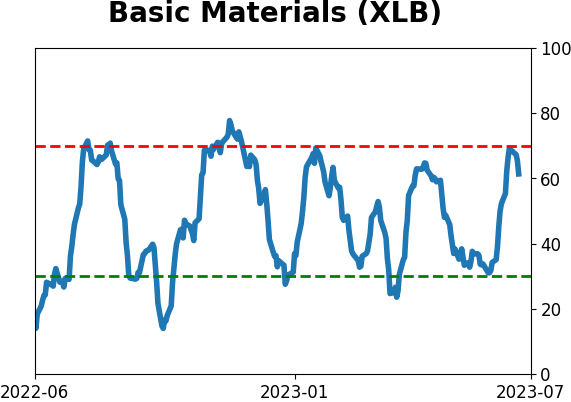
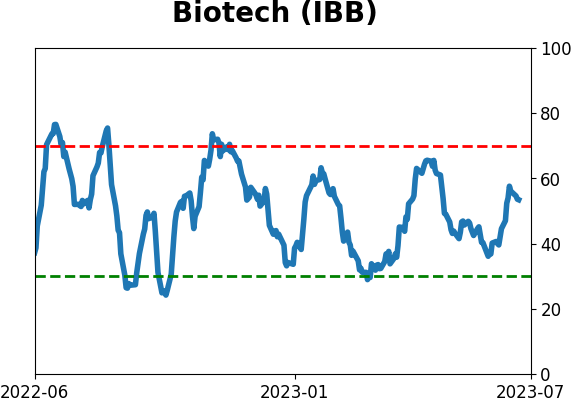
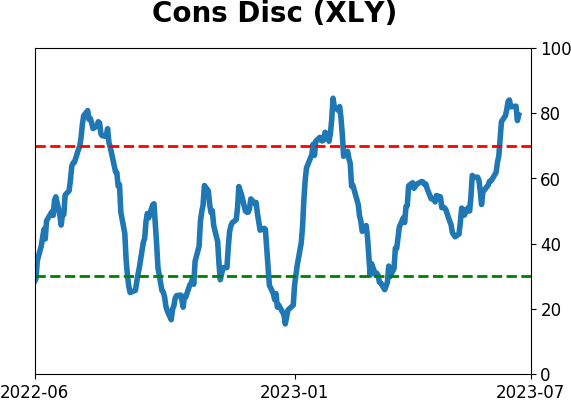
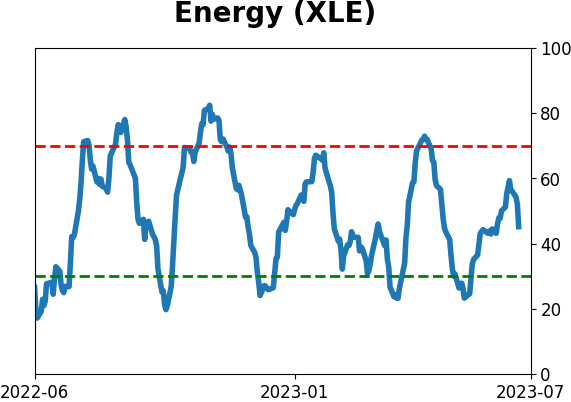
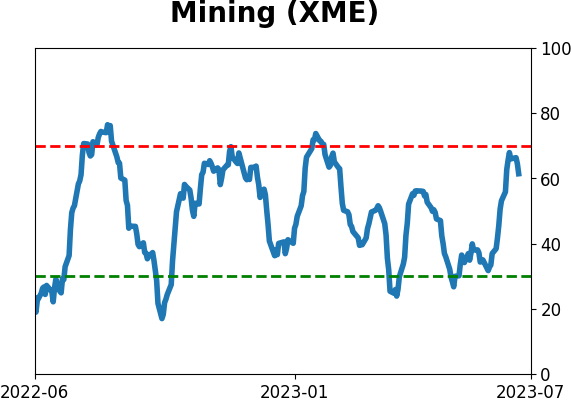
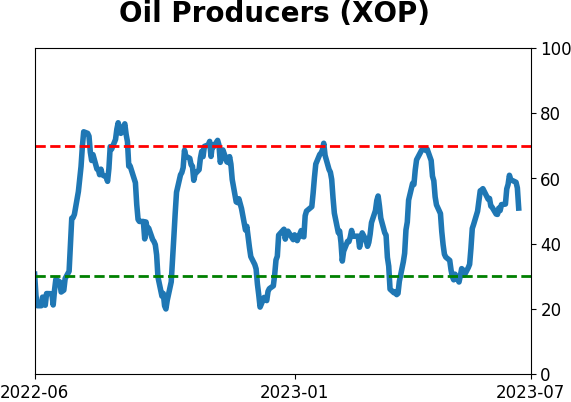
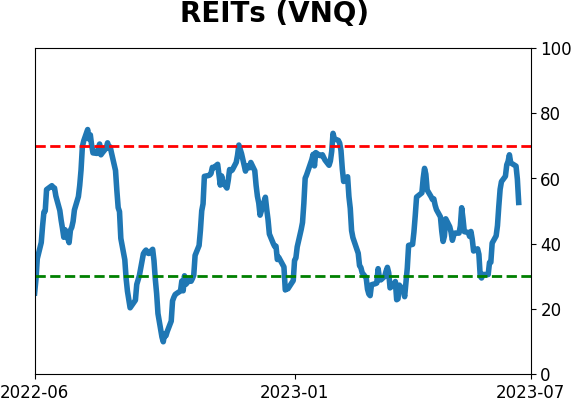
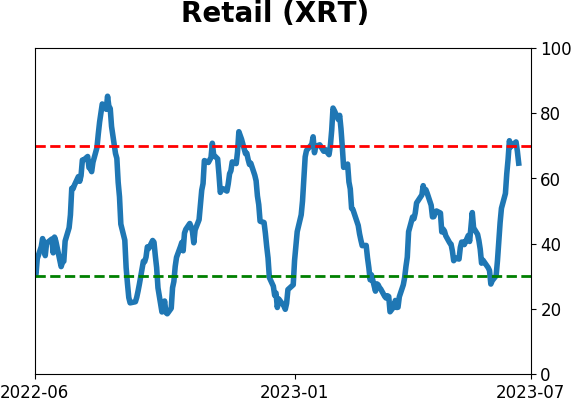
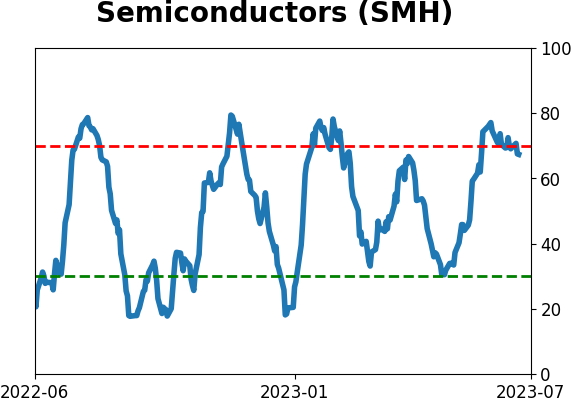
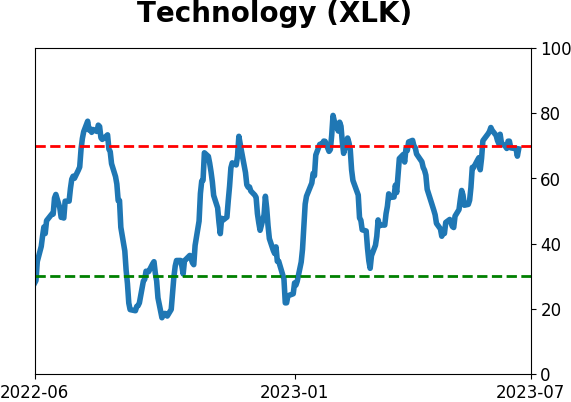
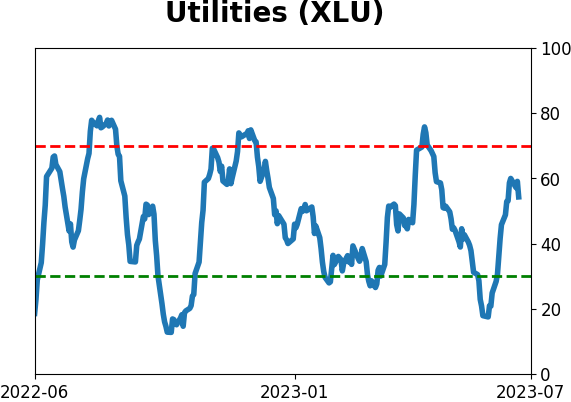
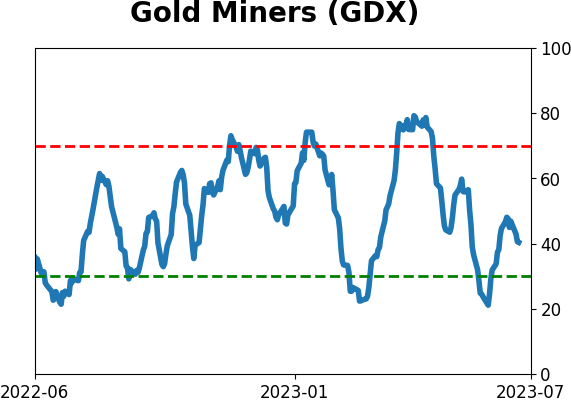
Sector ETF's - 10-Day Moving Average
|
|
|
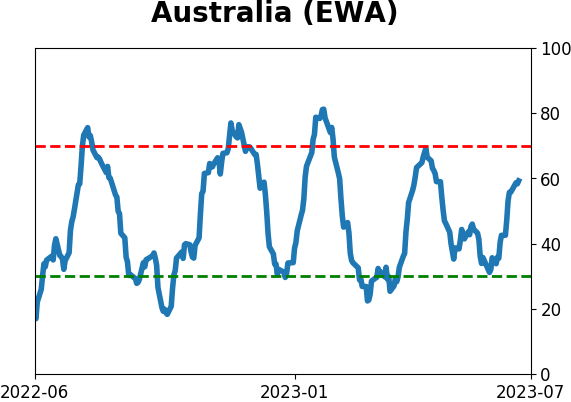
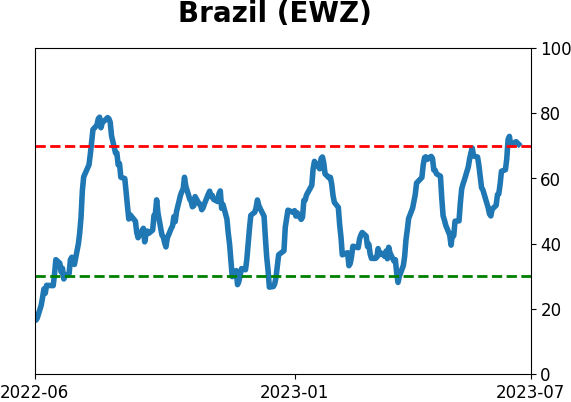
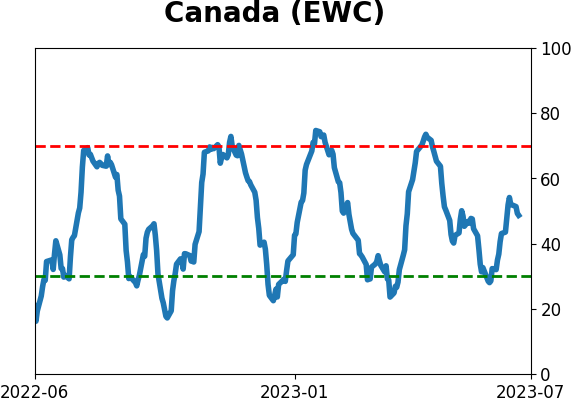
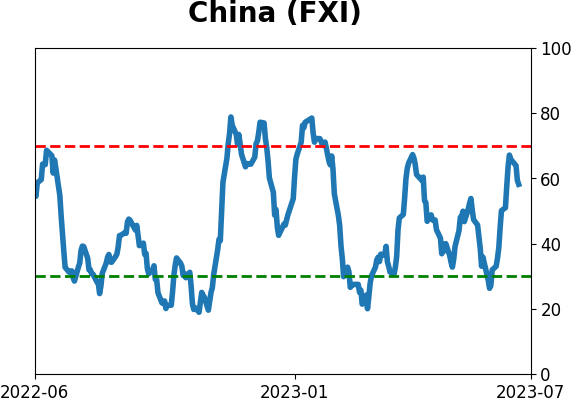
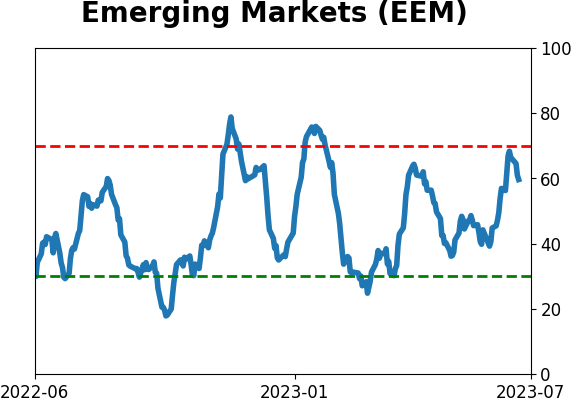
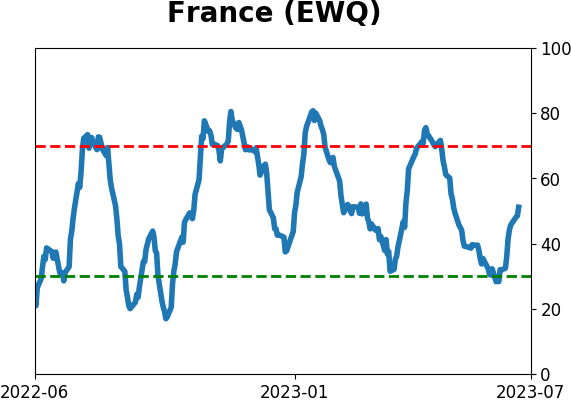
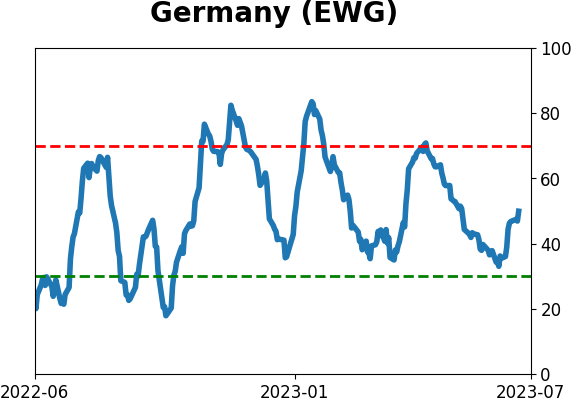
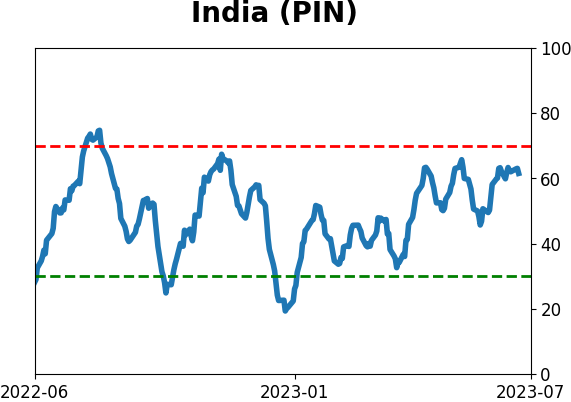
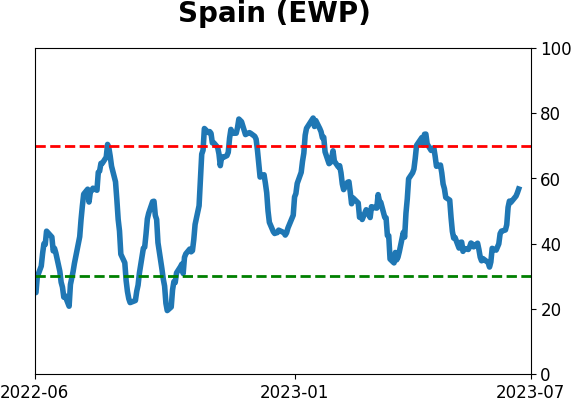
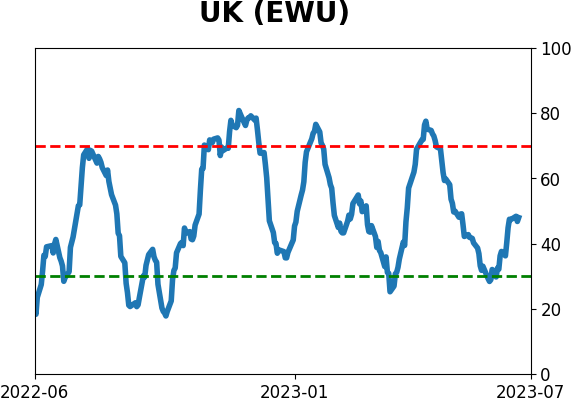
Country ETF's - 10-Day Moving Average
|
|
|
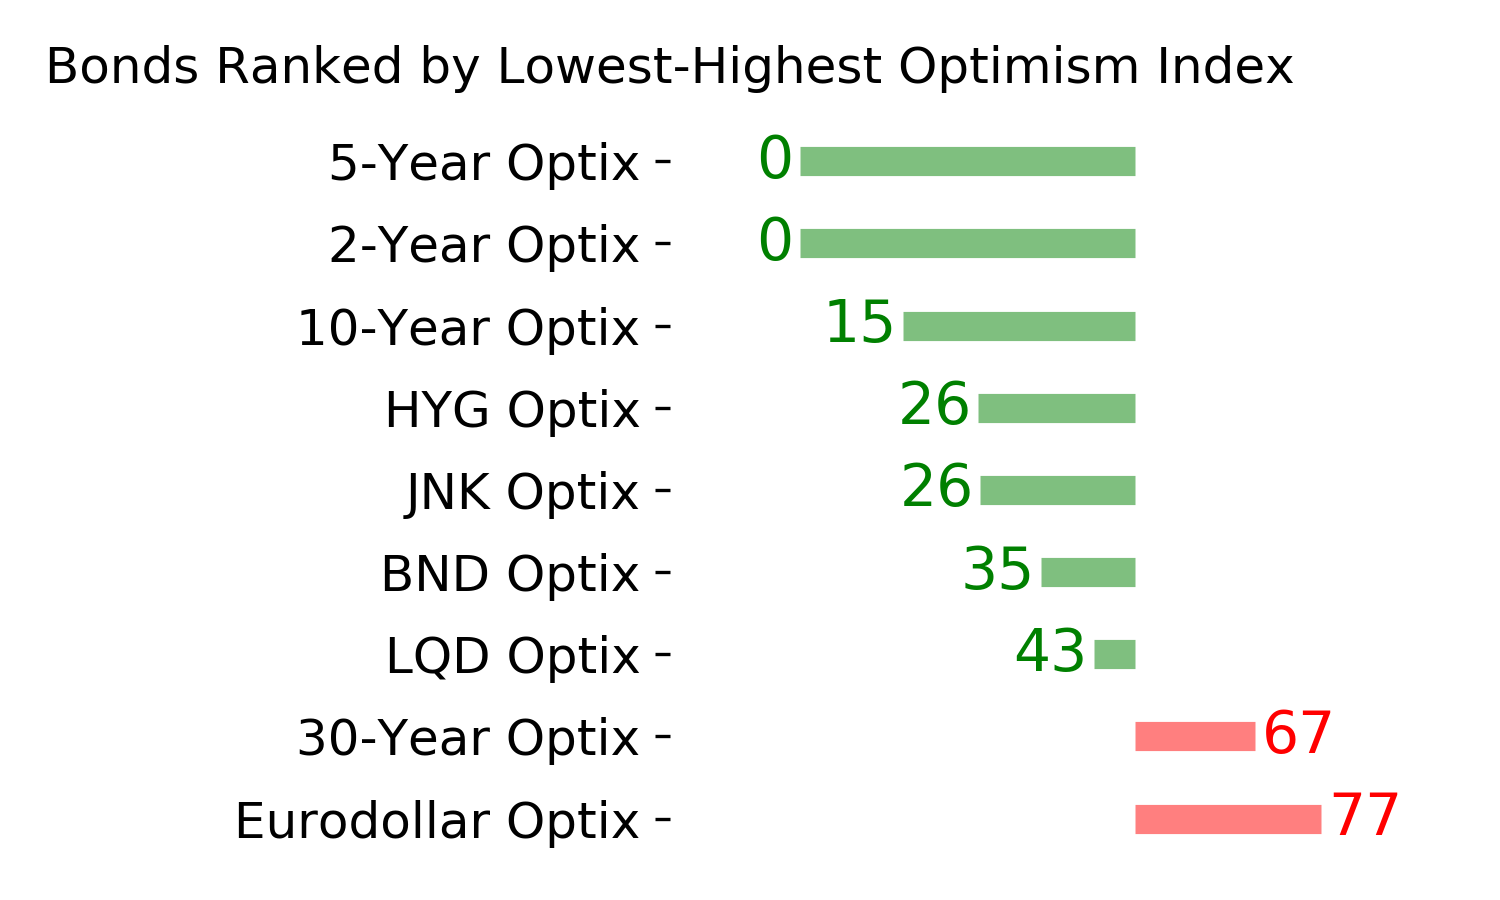
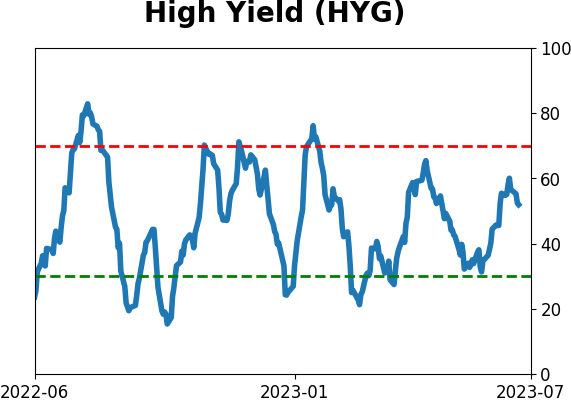
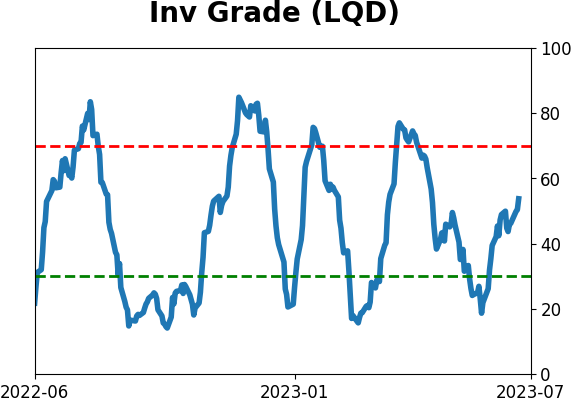
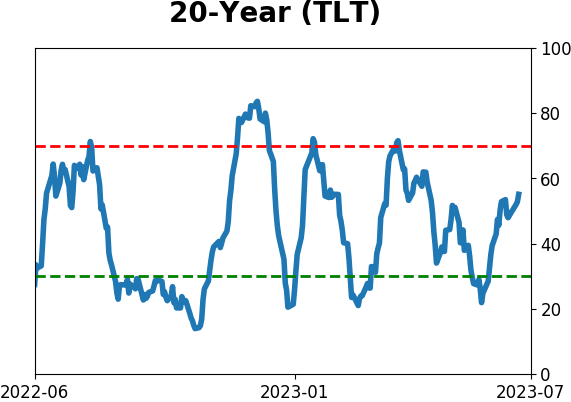
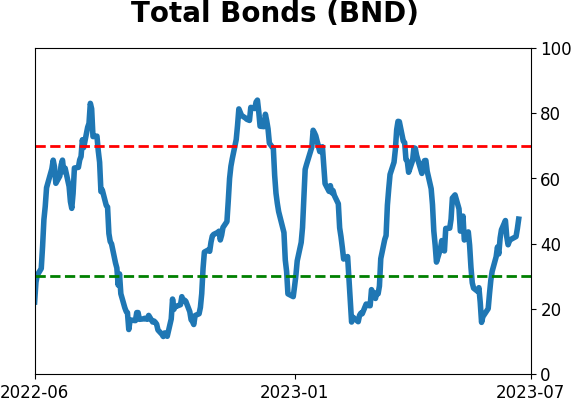
Bond ETF's - 10-Day Moving Average
|
|
|
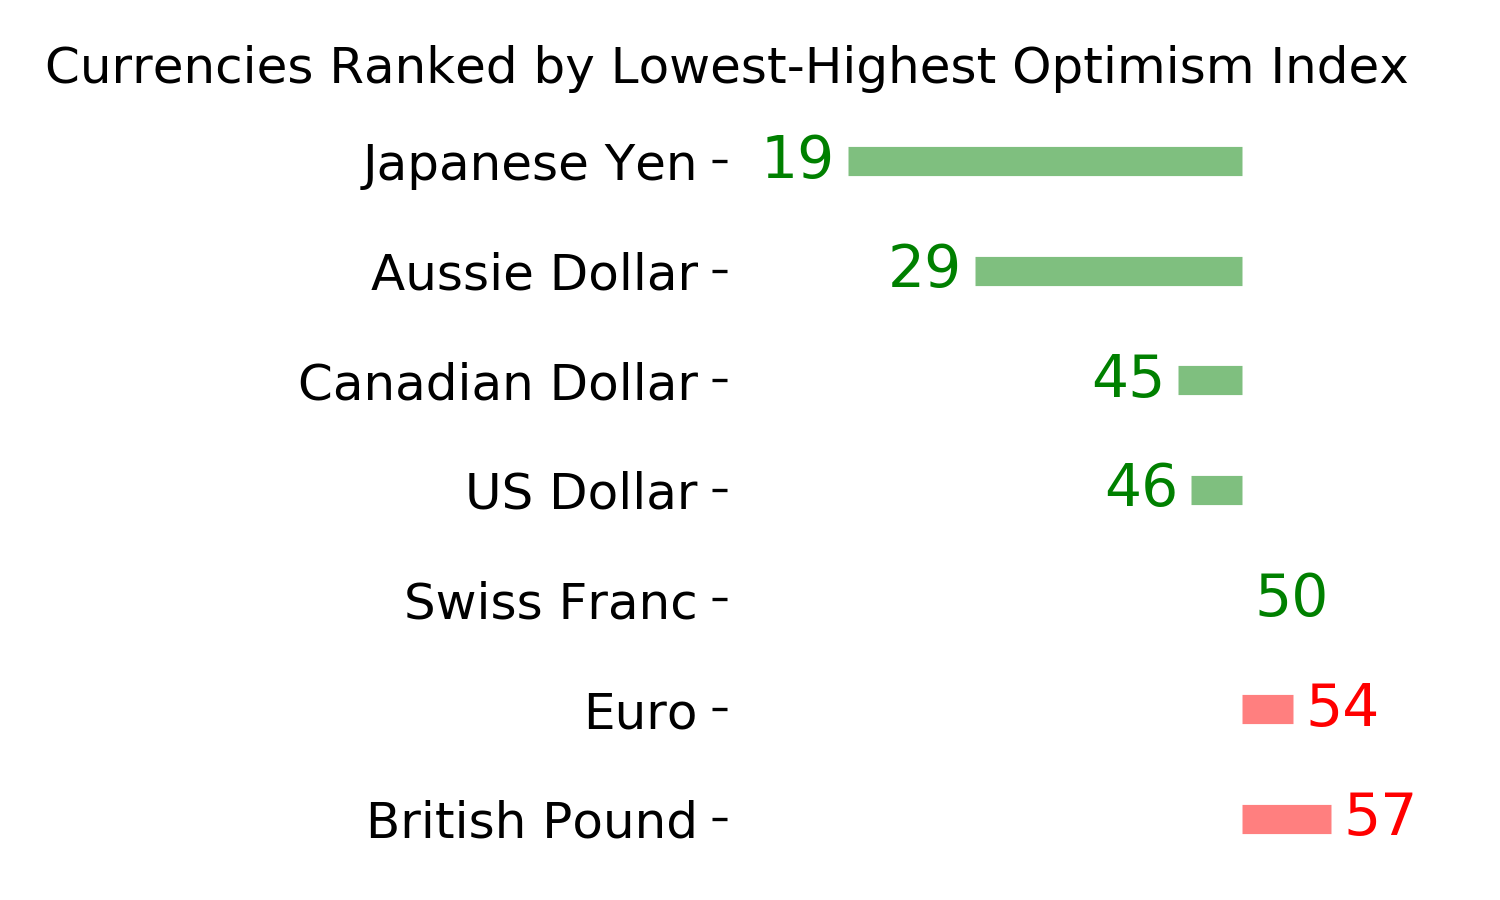
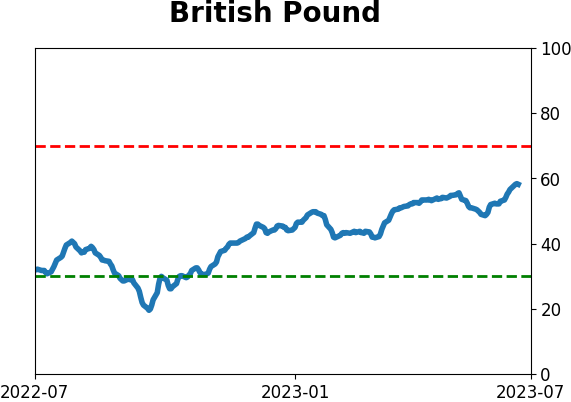
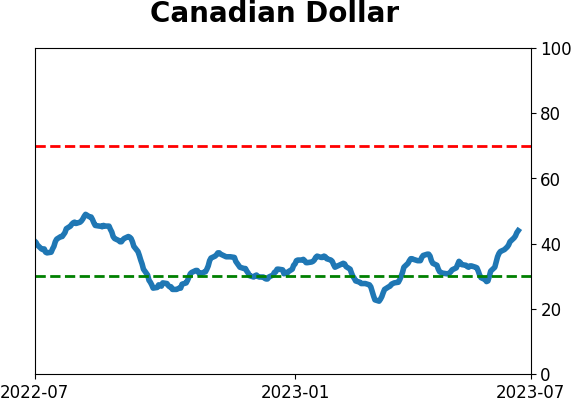
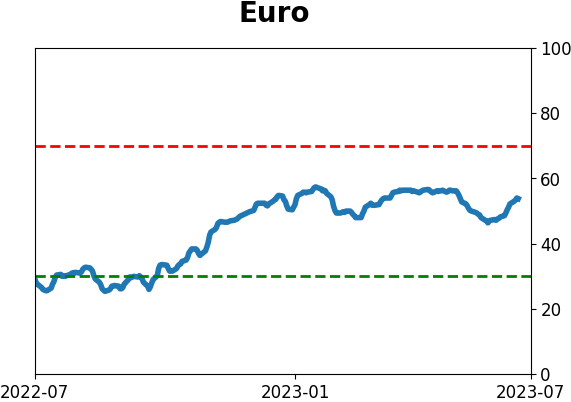
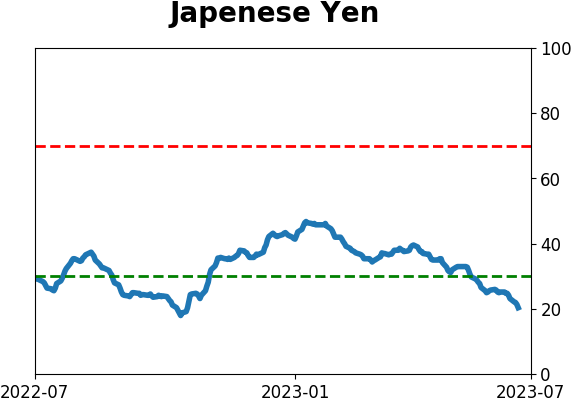
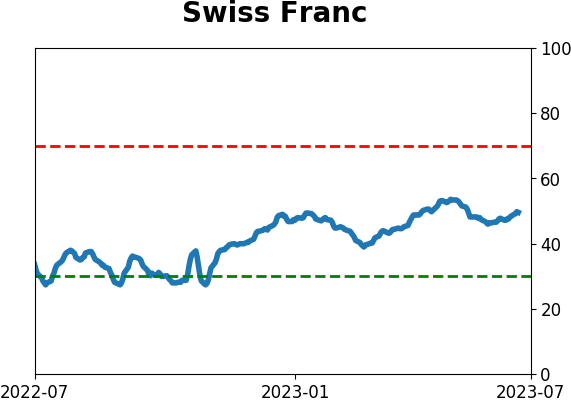
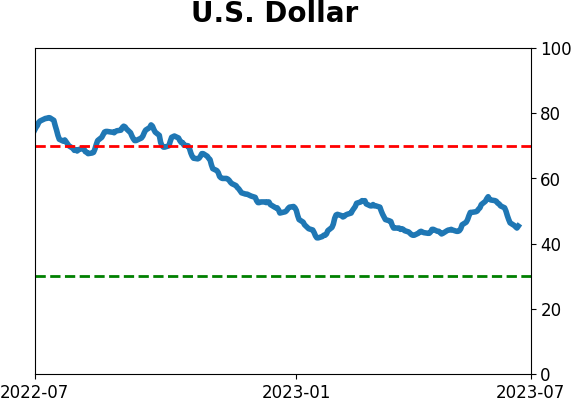
Currency ETF's - 5-Day Moving Average
|
|
|
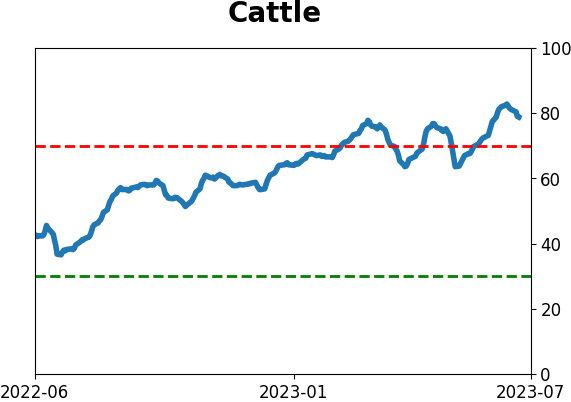
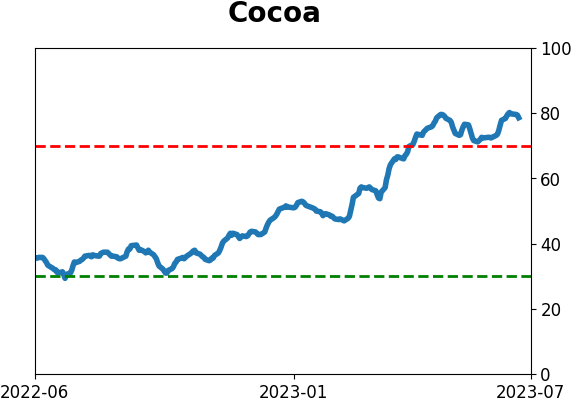
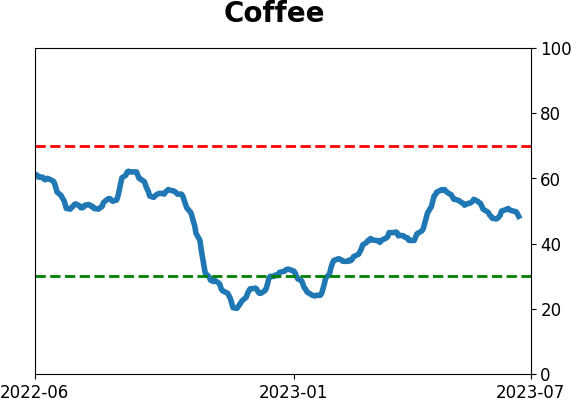
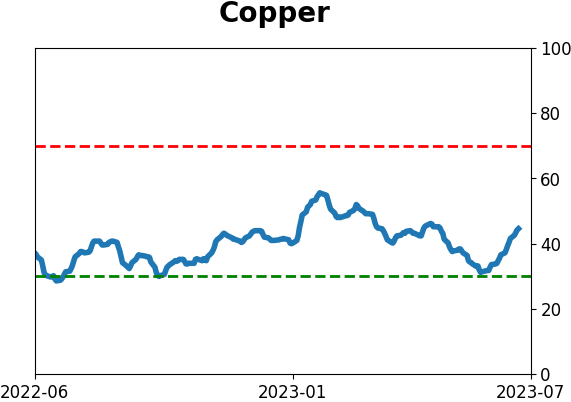
Commodity ETF's - 5-Day Moving Average
|
|