Headlines
|
|
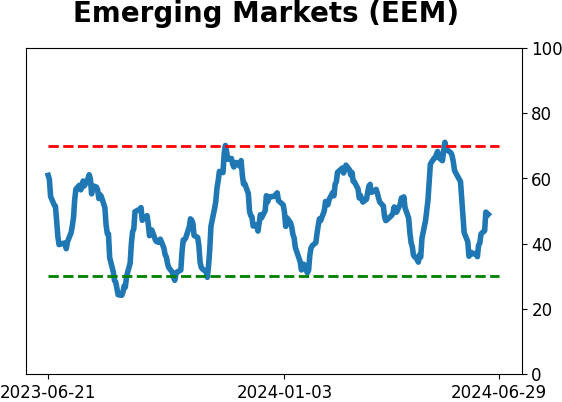
It's time to keep an eye on ticker EEM:
Emerging markets have essentially been dead money for almost 17 years. Despite this, trading opportunities do arise. With price action and seasonality on the cusp of aligning, aggressive traders may find an opportunity in ticker EEM starting soon and throughout the month of July.
|
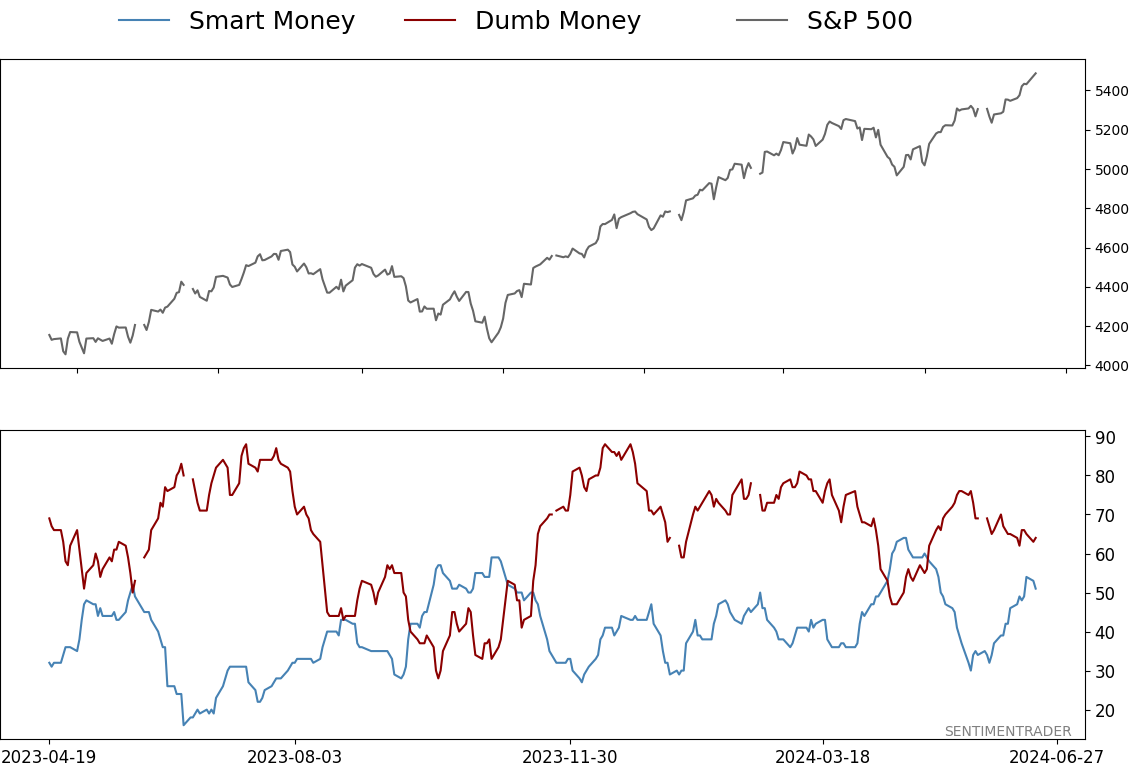
Smart / Dumb Money Confidence
|
Smart Money Confidence: 51%
Dumb Money Confidence: 64%
|
|
Risk Levels
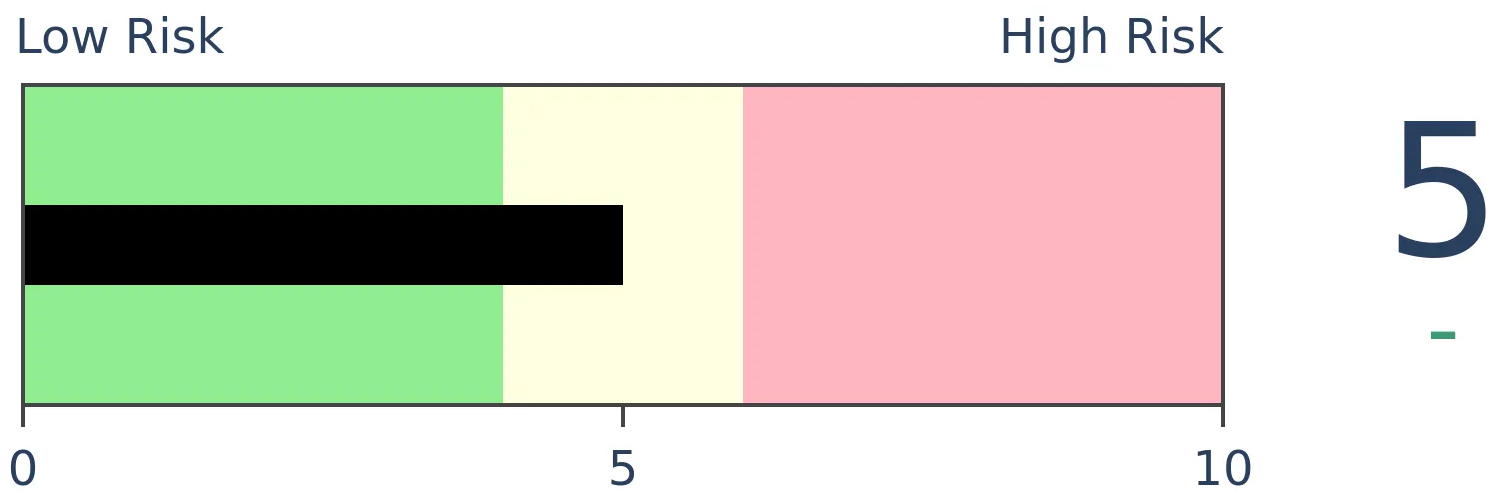
Stocks Short-Term
|
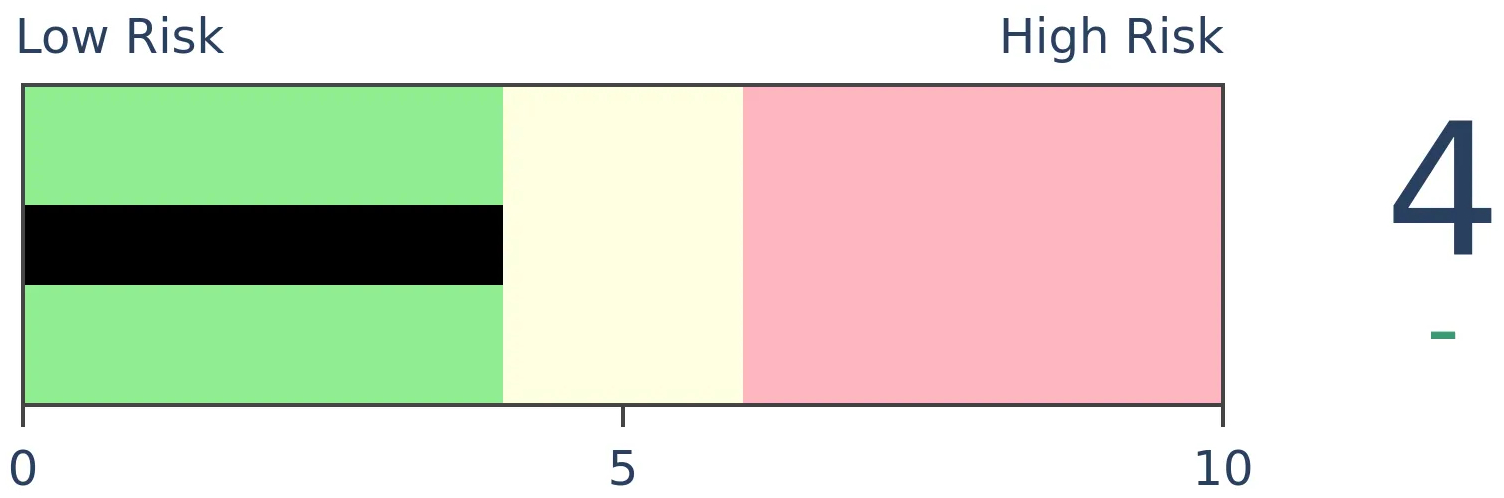
Stocks Medium-Term

|
|
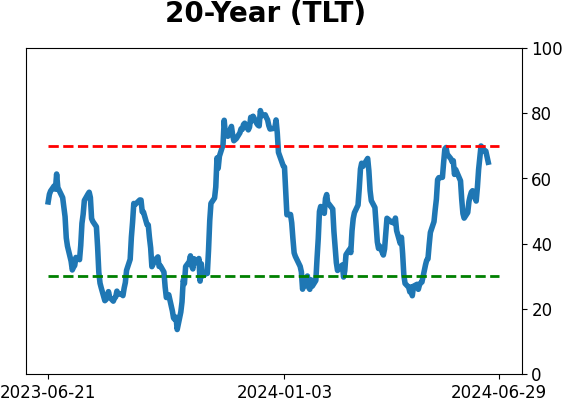
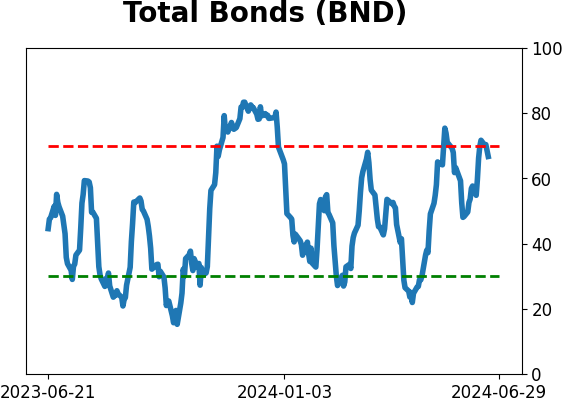
Bonds
|
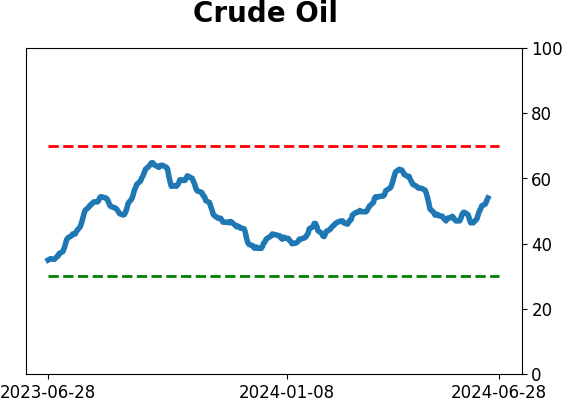
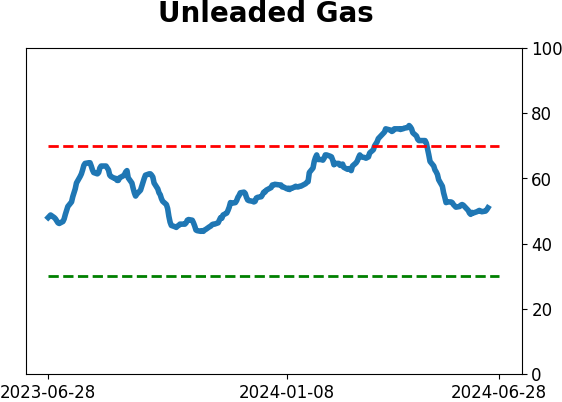
Crude Oil
|
|
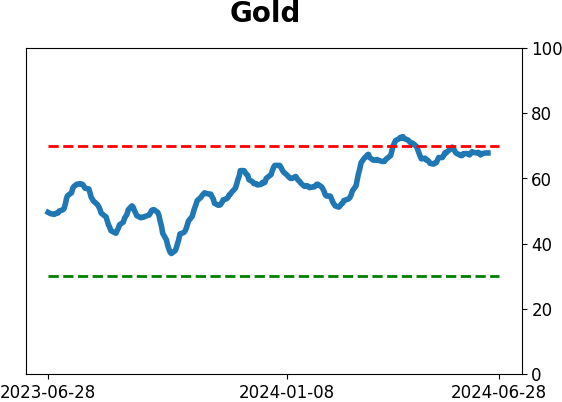
Gold
|
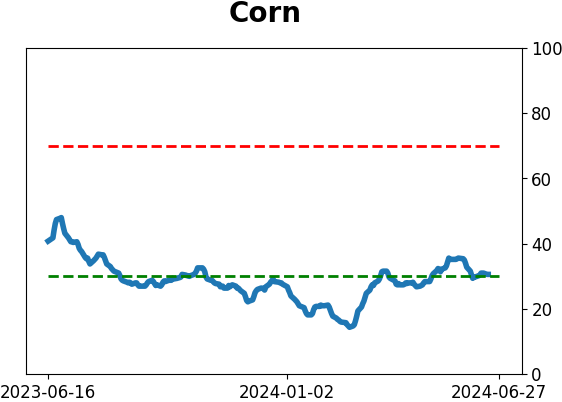
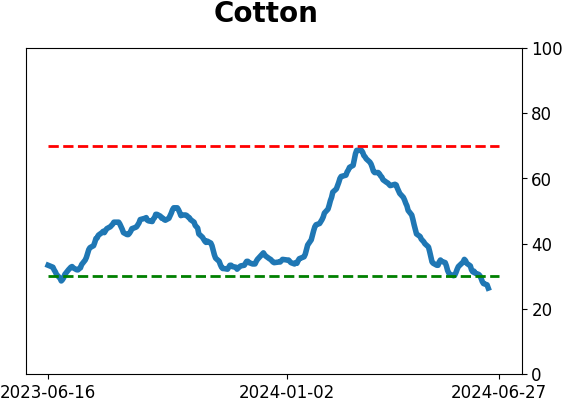
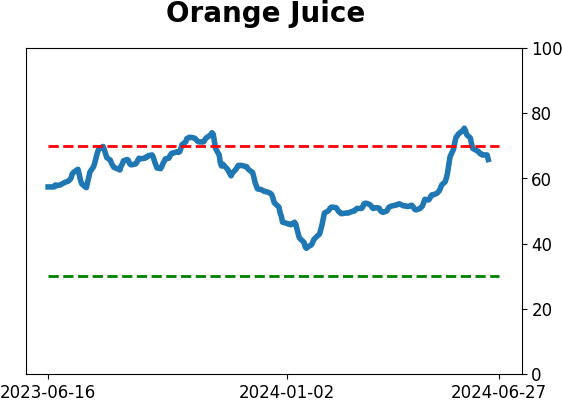
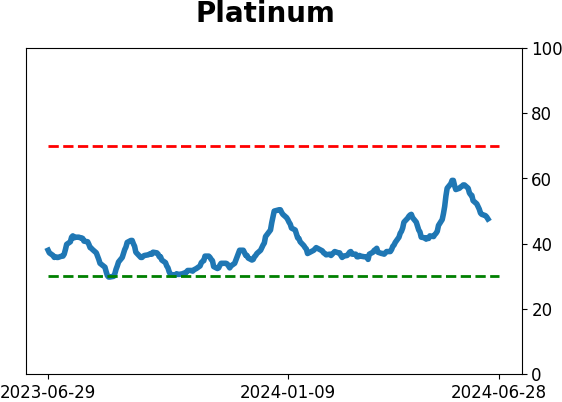
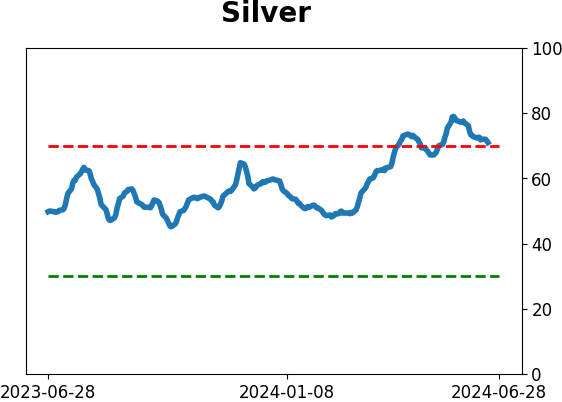
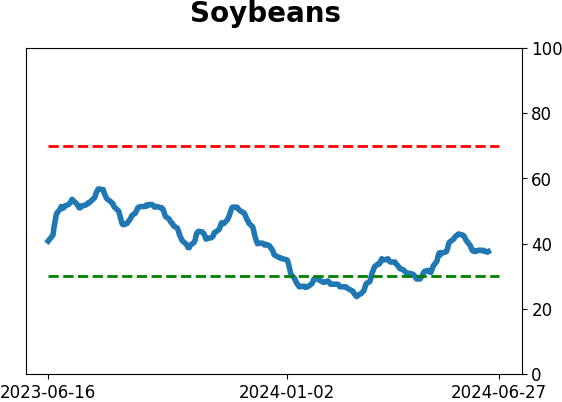
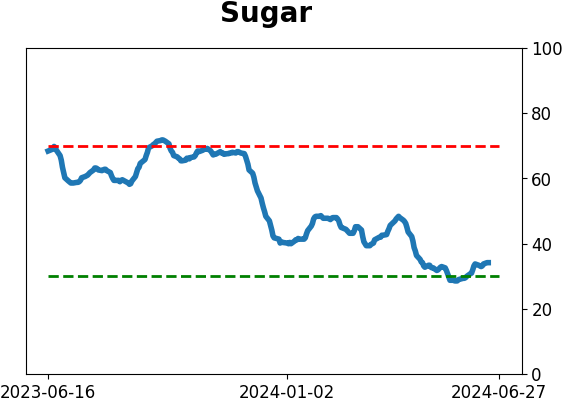
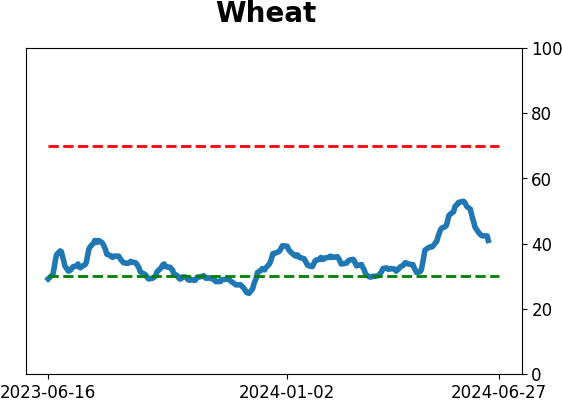
Agriculture

|
|
Research
By Jay Kaeppel
BOTTOM LINE
Emerging markets have essentially been dead money for almost 17 years. Despite this, trading opportunities do arise. With price action and seasonality on the cusp of aligning, aggressive traders may find an opportunity in ticker EEM starting soon and throughout the month of July.
FORECAST / TIMEFRAME
None
|
Key points
- Emerging markets have been dead money for roughly 17 years
- On a shorter-term basis, price action has improved in recent months
- Ticker EEM is entering its most favorable seasonal period of the year - and most favorable calendar month
- This may offer a trading opportunity for aggressive traders
Emerging markets have most definitely NOT emerged
The chart below displays monthly price action for the iShares MSCI Emerging Markets ETF (ticker EEM).
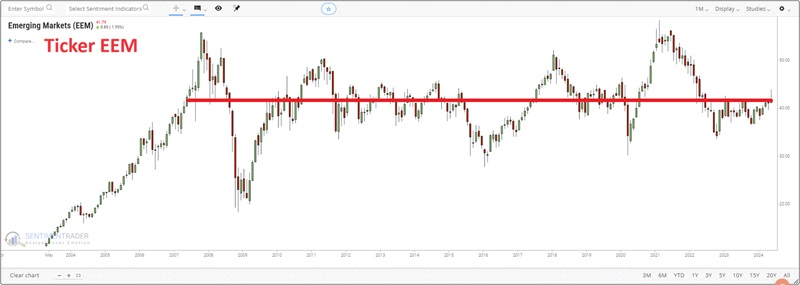
After staging a terrific advance from 2004 into early 2008, this ETF has gone nowhere in the past 17 years, trading sideways in an extensive range. Anyone who confused "emerging" with "growing" has been sorely disappointed.
On a brighter note, performance has improved since EEM bottomed out in October 2023.
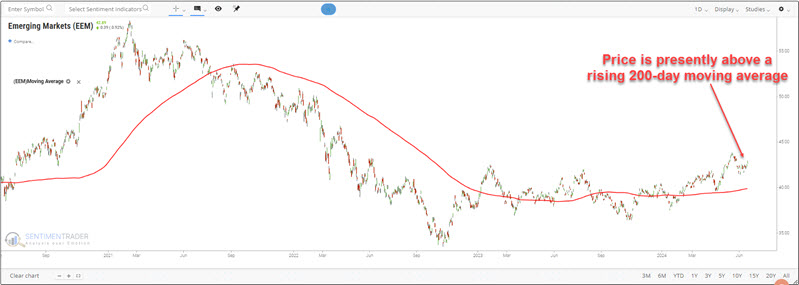
Nevertheless, on a relative basis, performance has still been disappointing. Since the October 2023 lows, EEM has gained over 17%, versus +33% for the S&P 500 Index. Still, opportunity is where you find it.
EEM is entering a favorable seasonal period with a favorable price trend in place
As always, an annual seasonal chart is simply an average of what has happened in the past and is NOT a roadmap to what will happen this time. That said, note in the annual seasonal chart below that EEM is entering a period of seasonal strength that extends from the close of trading day of the year (TDY) #119 through TDY #144. For 2024, this period extends from the close on 2024-06-21 through 2024-07-29.
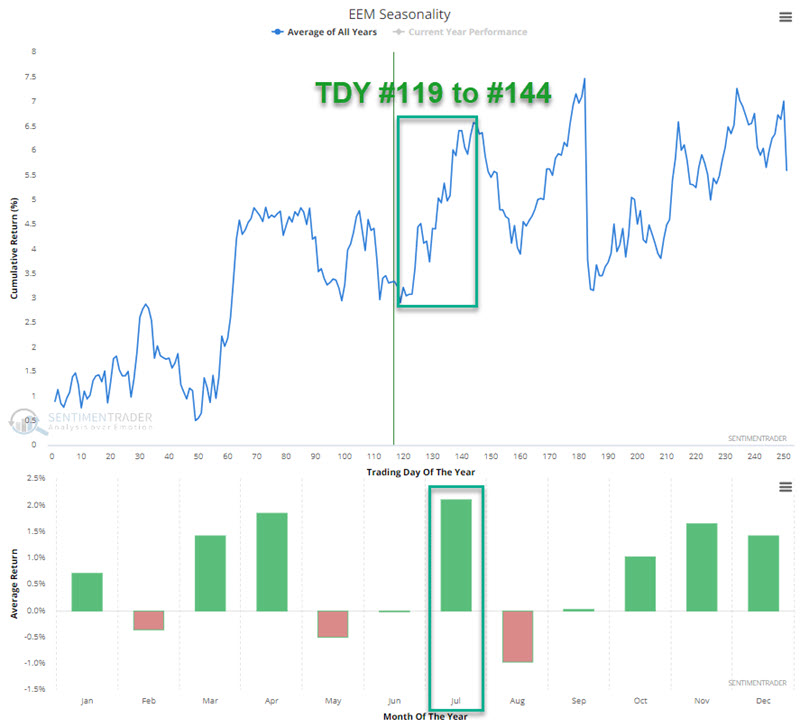
Note also in the chart above that historically, July has been the best calendar month for EEM. Again, this does not guarantee a barnburner of a month for EEM in July. Still, when combined with recent favorable price action, the seasonal tailwind may provide an "edge" for traders.
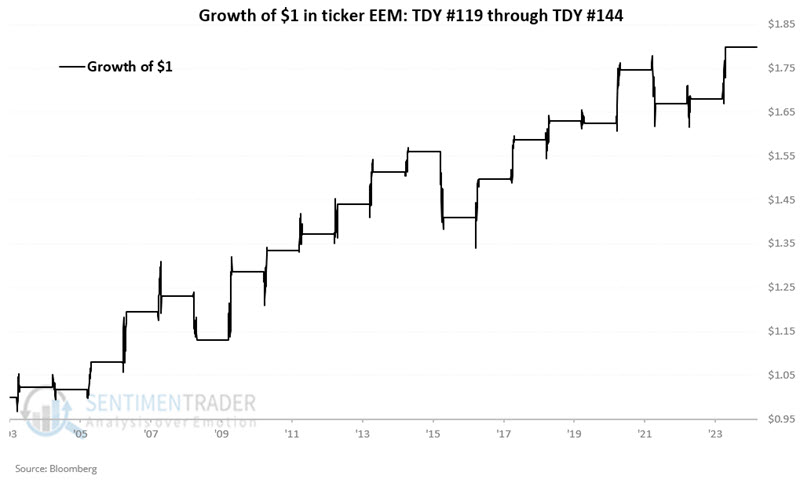
The chart below displays the hypothetical growth of $1 invested in ticker EEM only from TDY #119 through #144 each year since inception in 2004.
The table below summarizes EEM performance during this period.
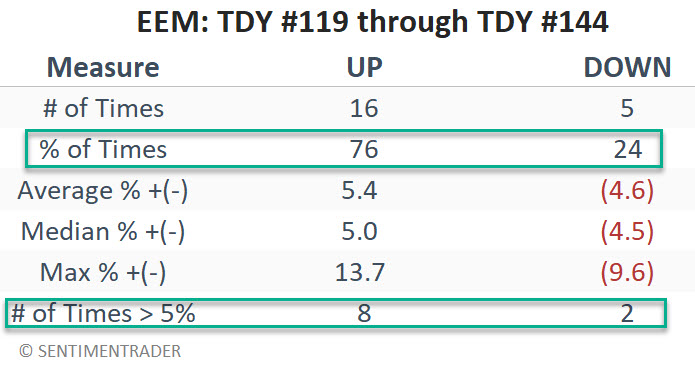
Historically, this period has seen EEM register a gain in three out of every four years. Also, note that 5% or more moves have skewed to the positive side by a factor of 8-to-2.
What the research tells us…
No seasonal trend is ever guaranteed to play out as it has tended to in the past. That said, the best time to try to exploit a potential seasonal edge is when price action is also trending in the direction of the seasonal edge. History suggests that traders look for an opportunity to play the long side of EEM in the month ahead. The real questions for traders are "Whether or not to take a trade, how much capital to commit, and how much of committed capital to risk."
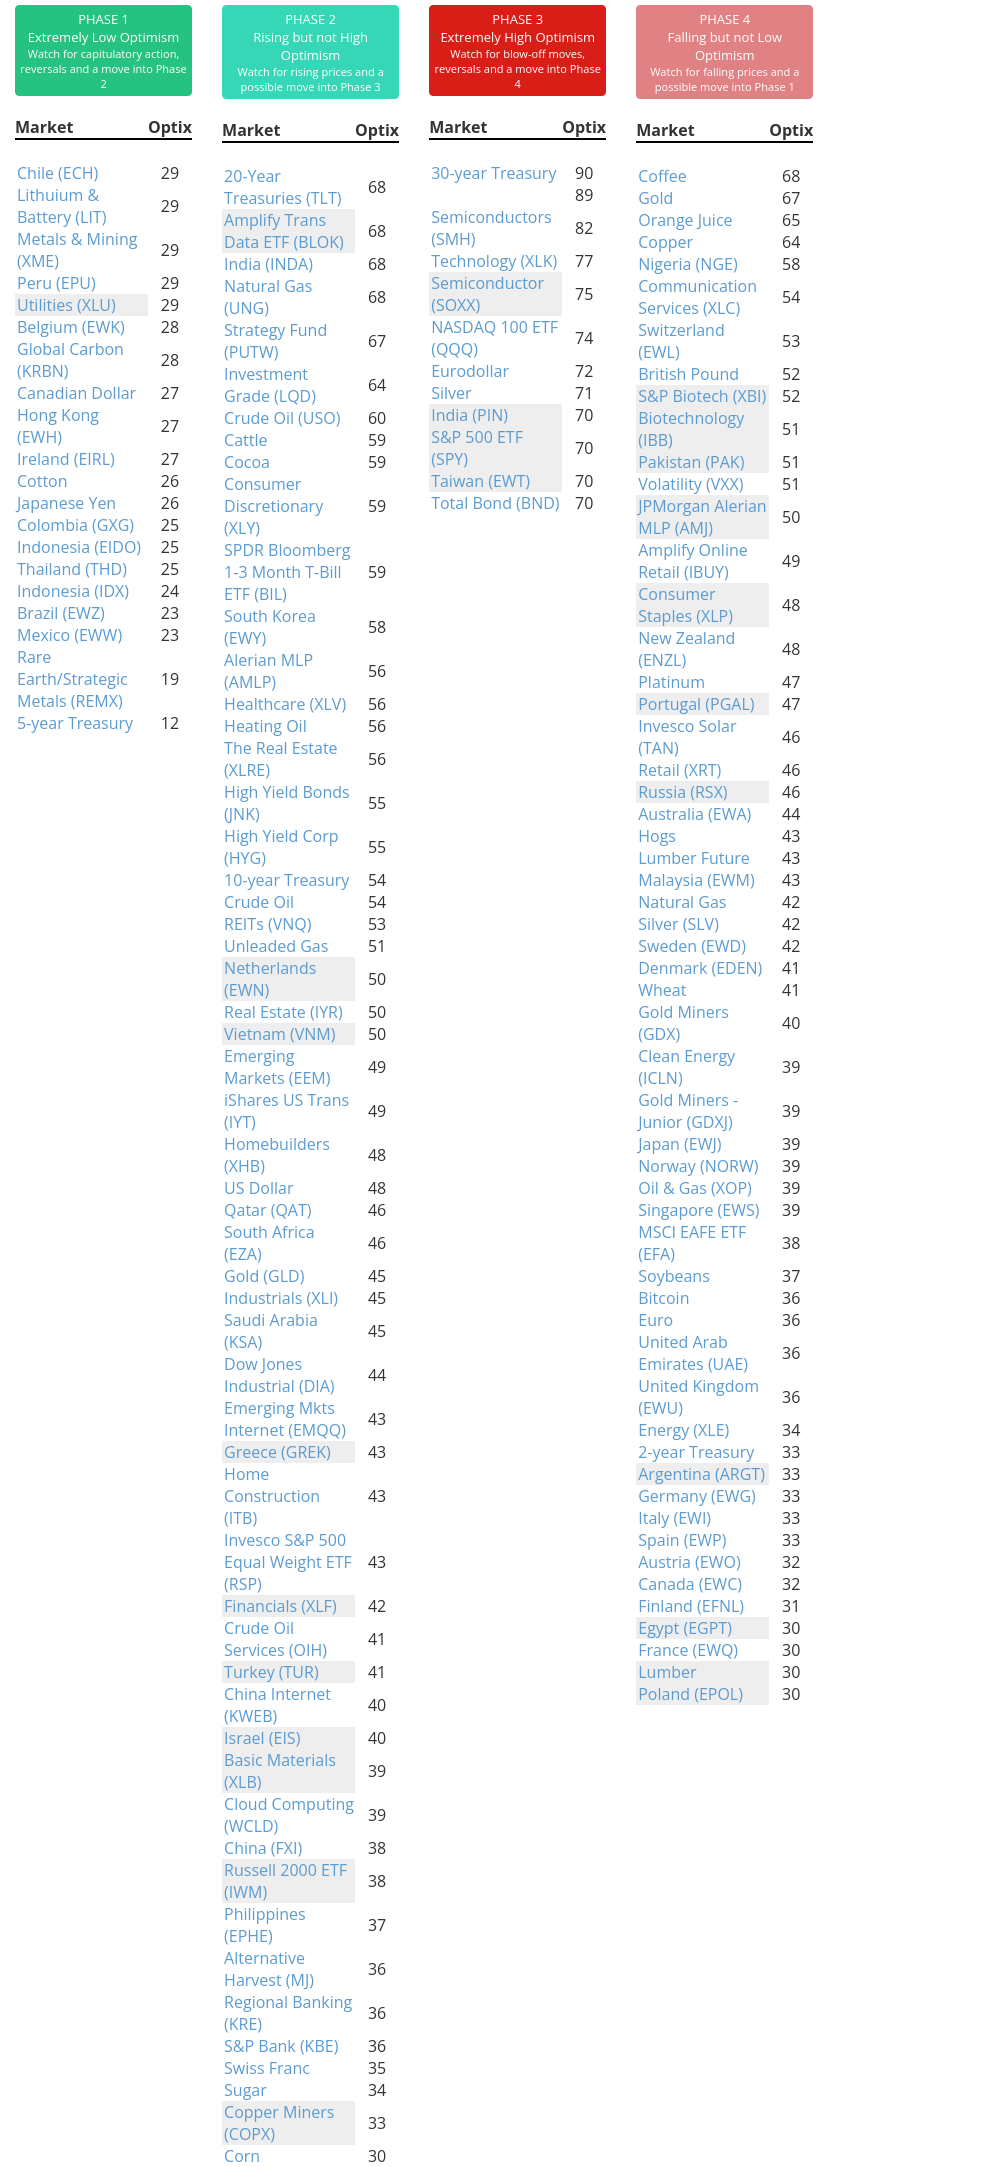
Indicators at Extremes
Phase Table
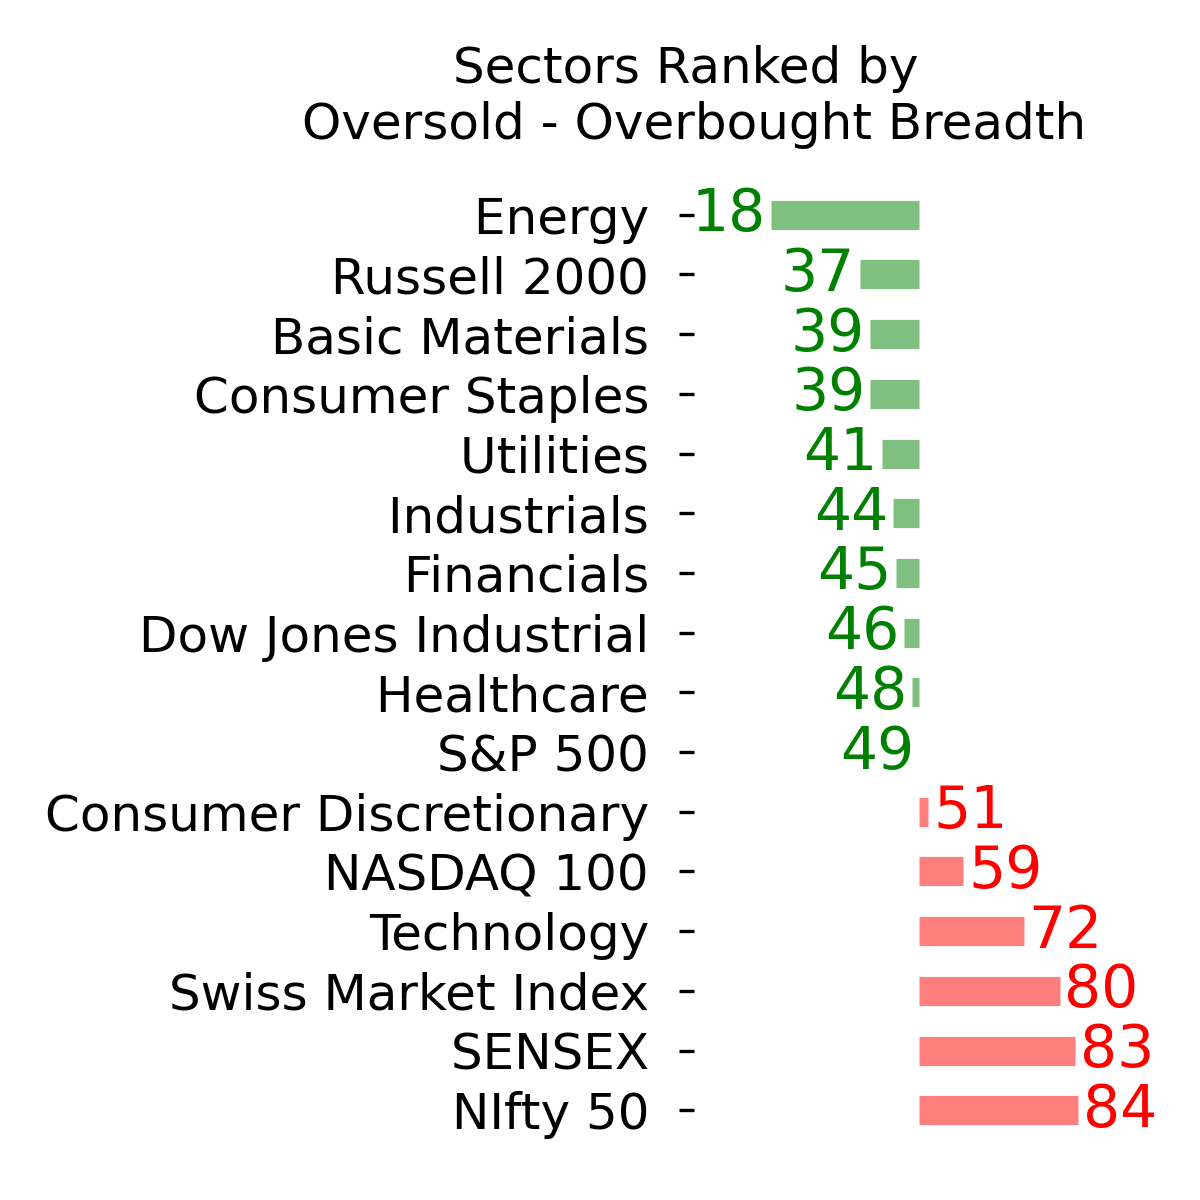
Ranks
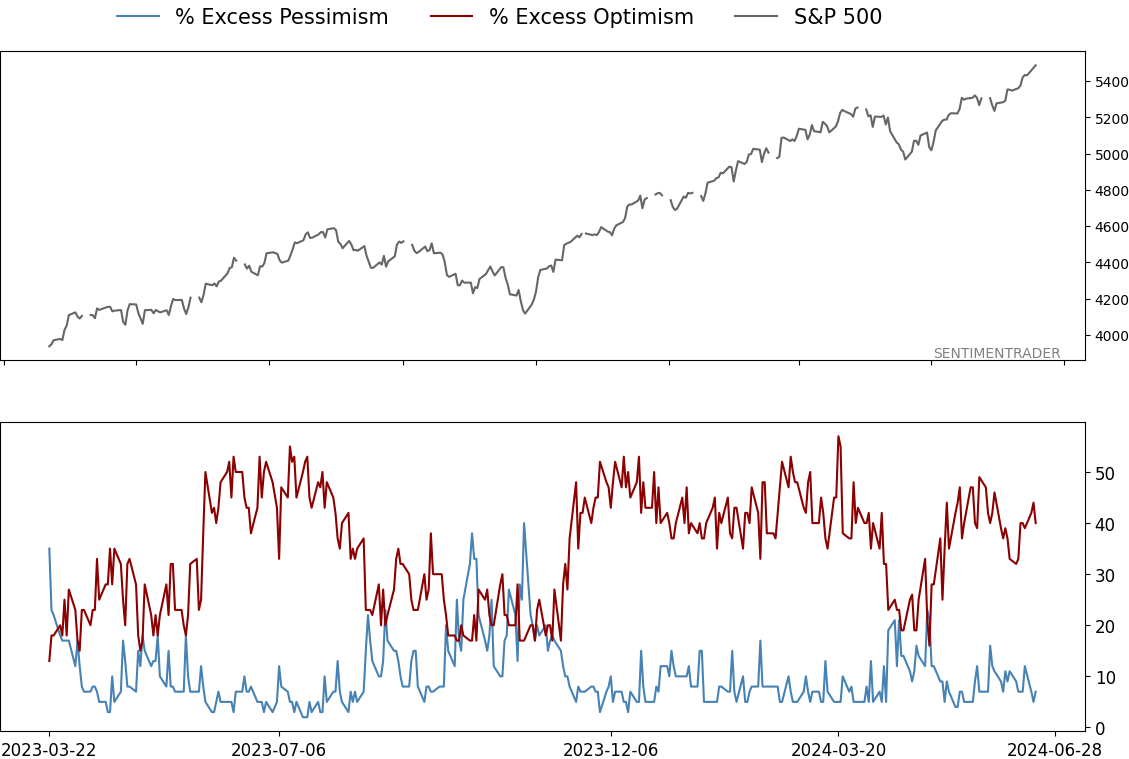
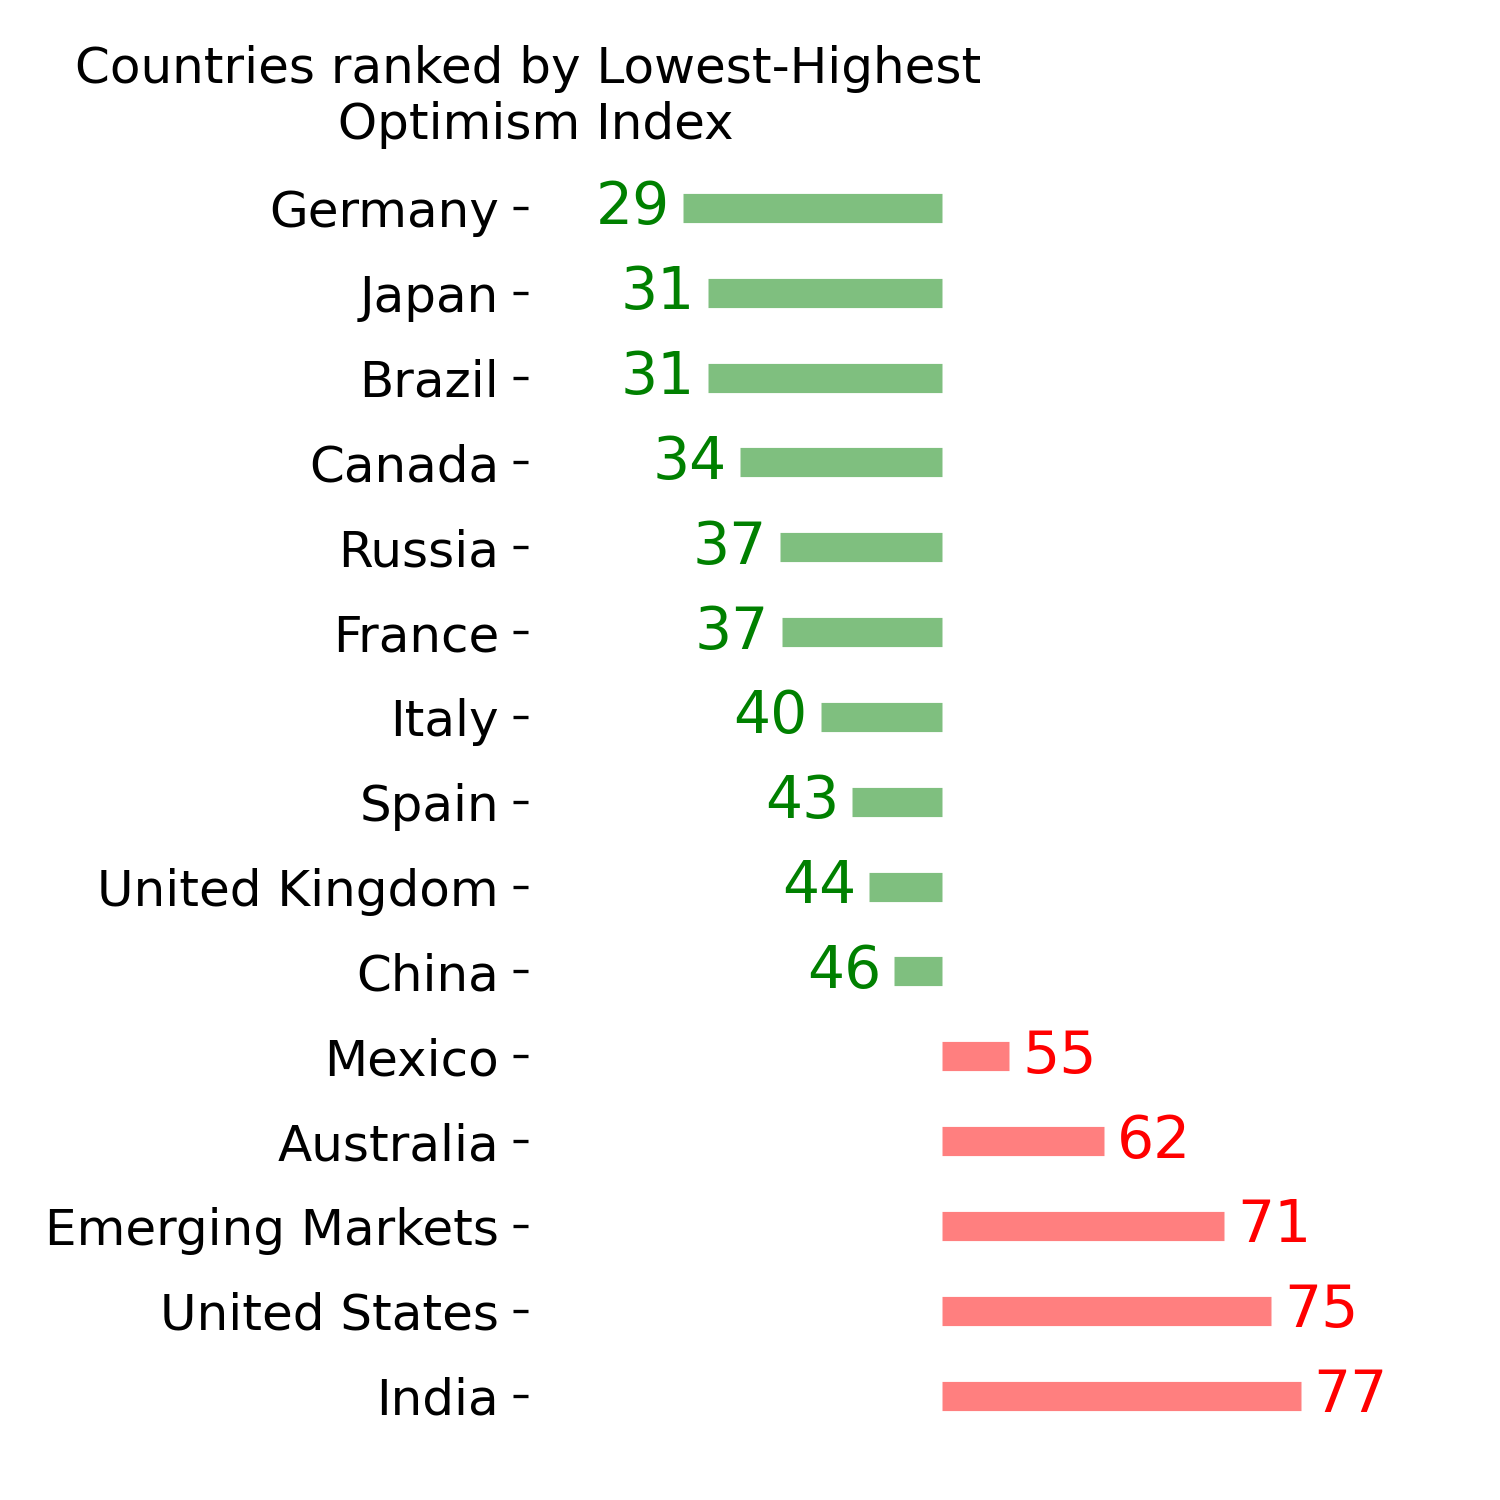
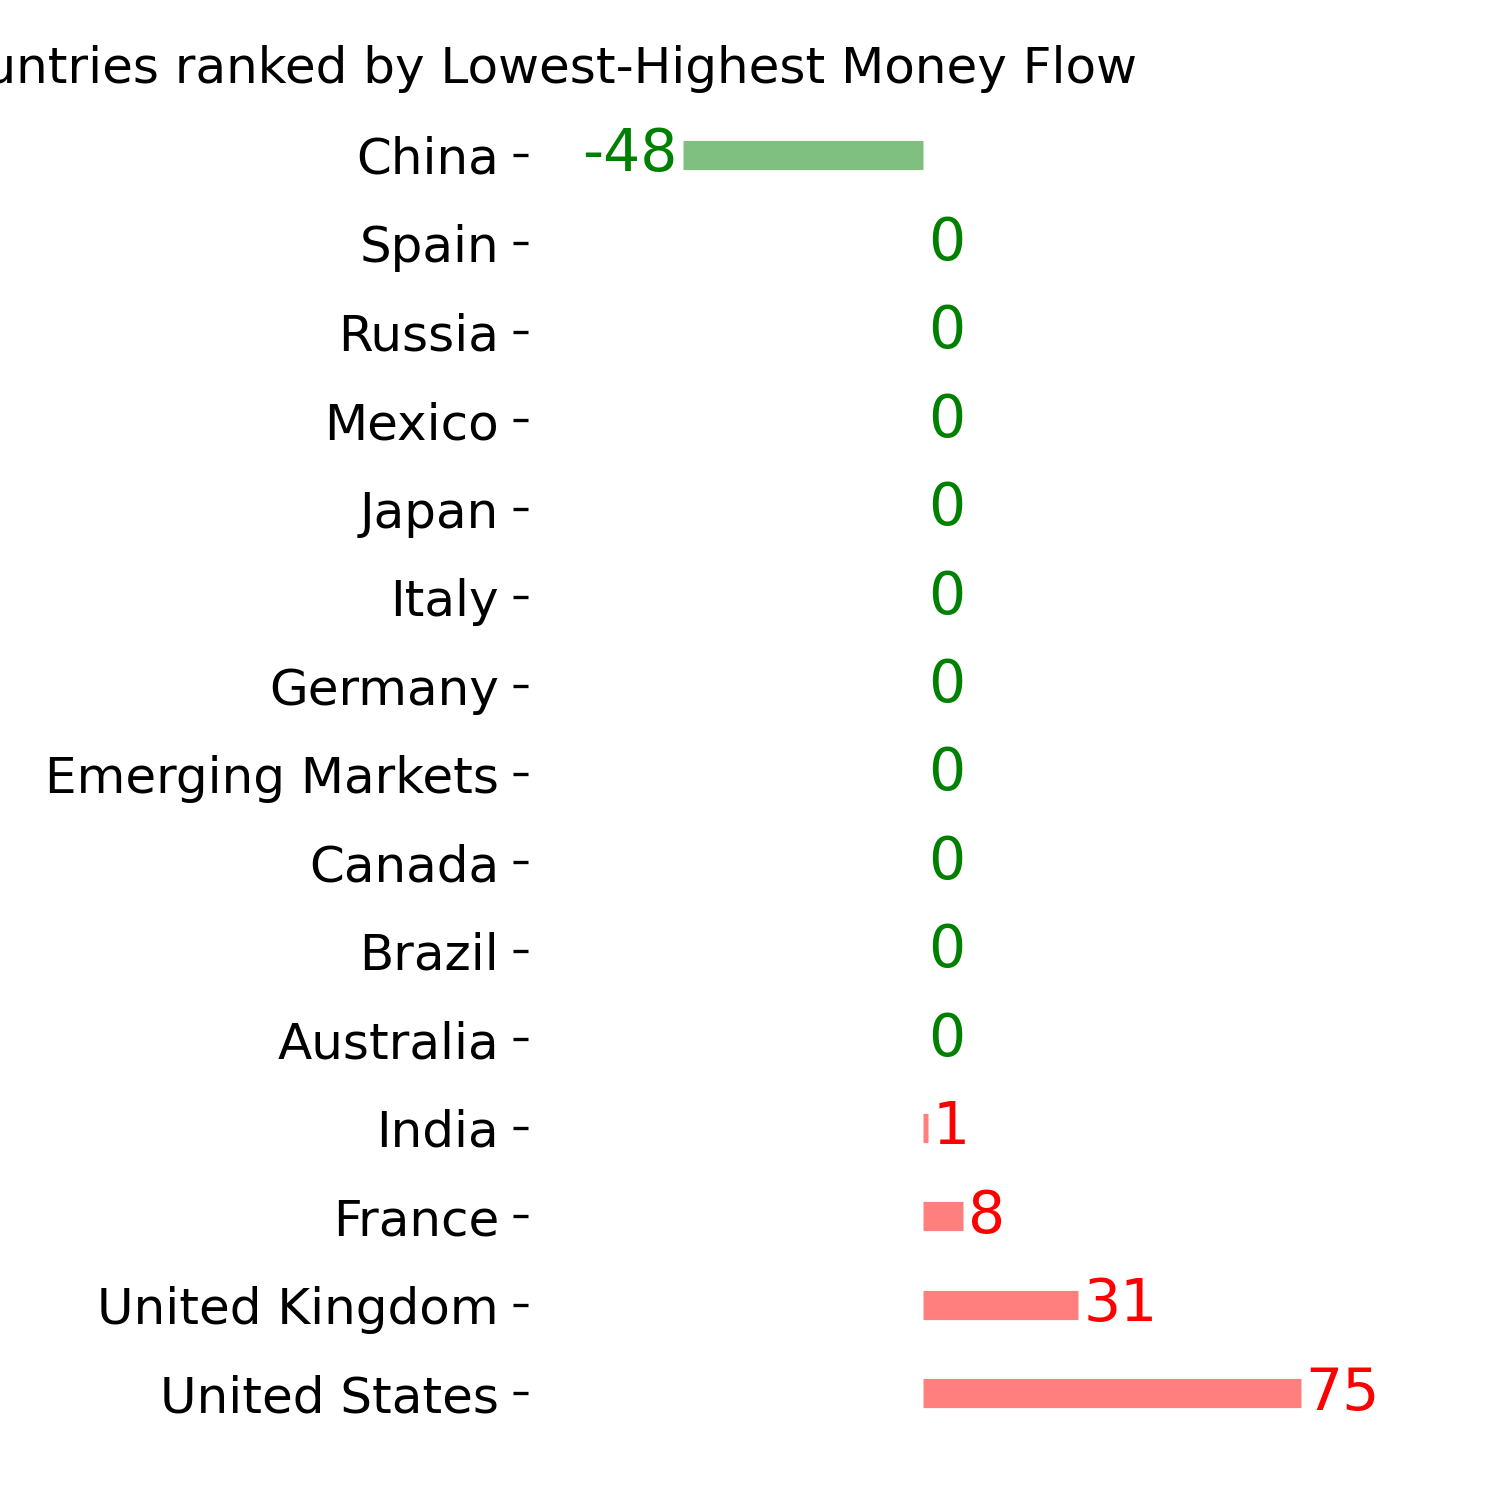
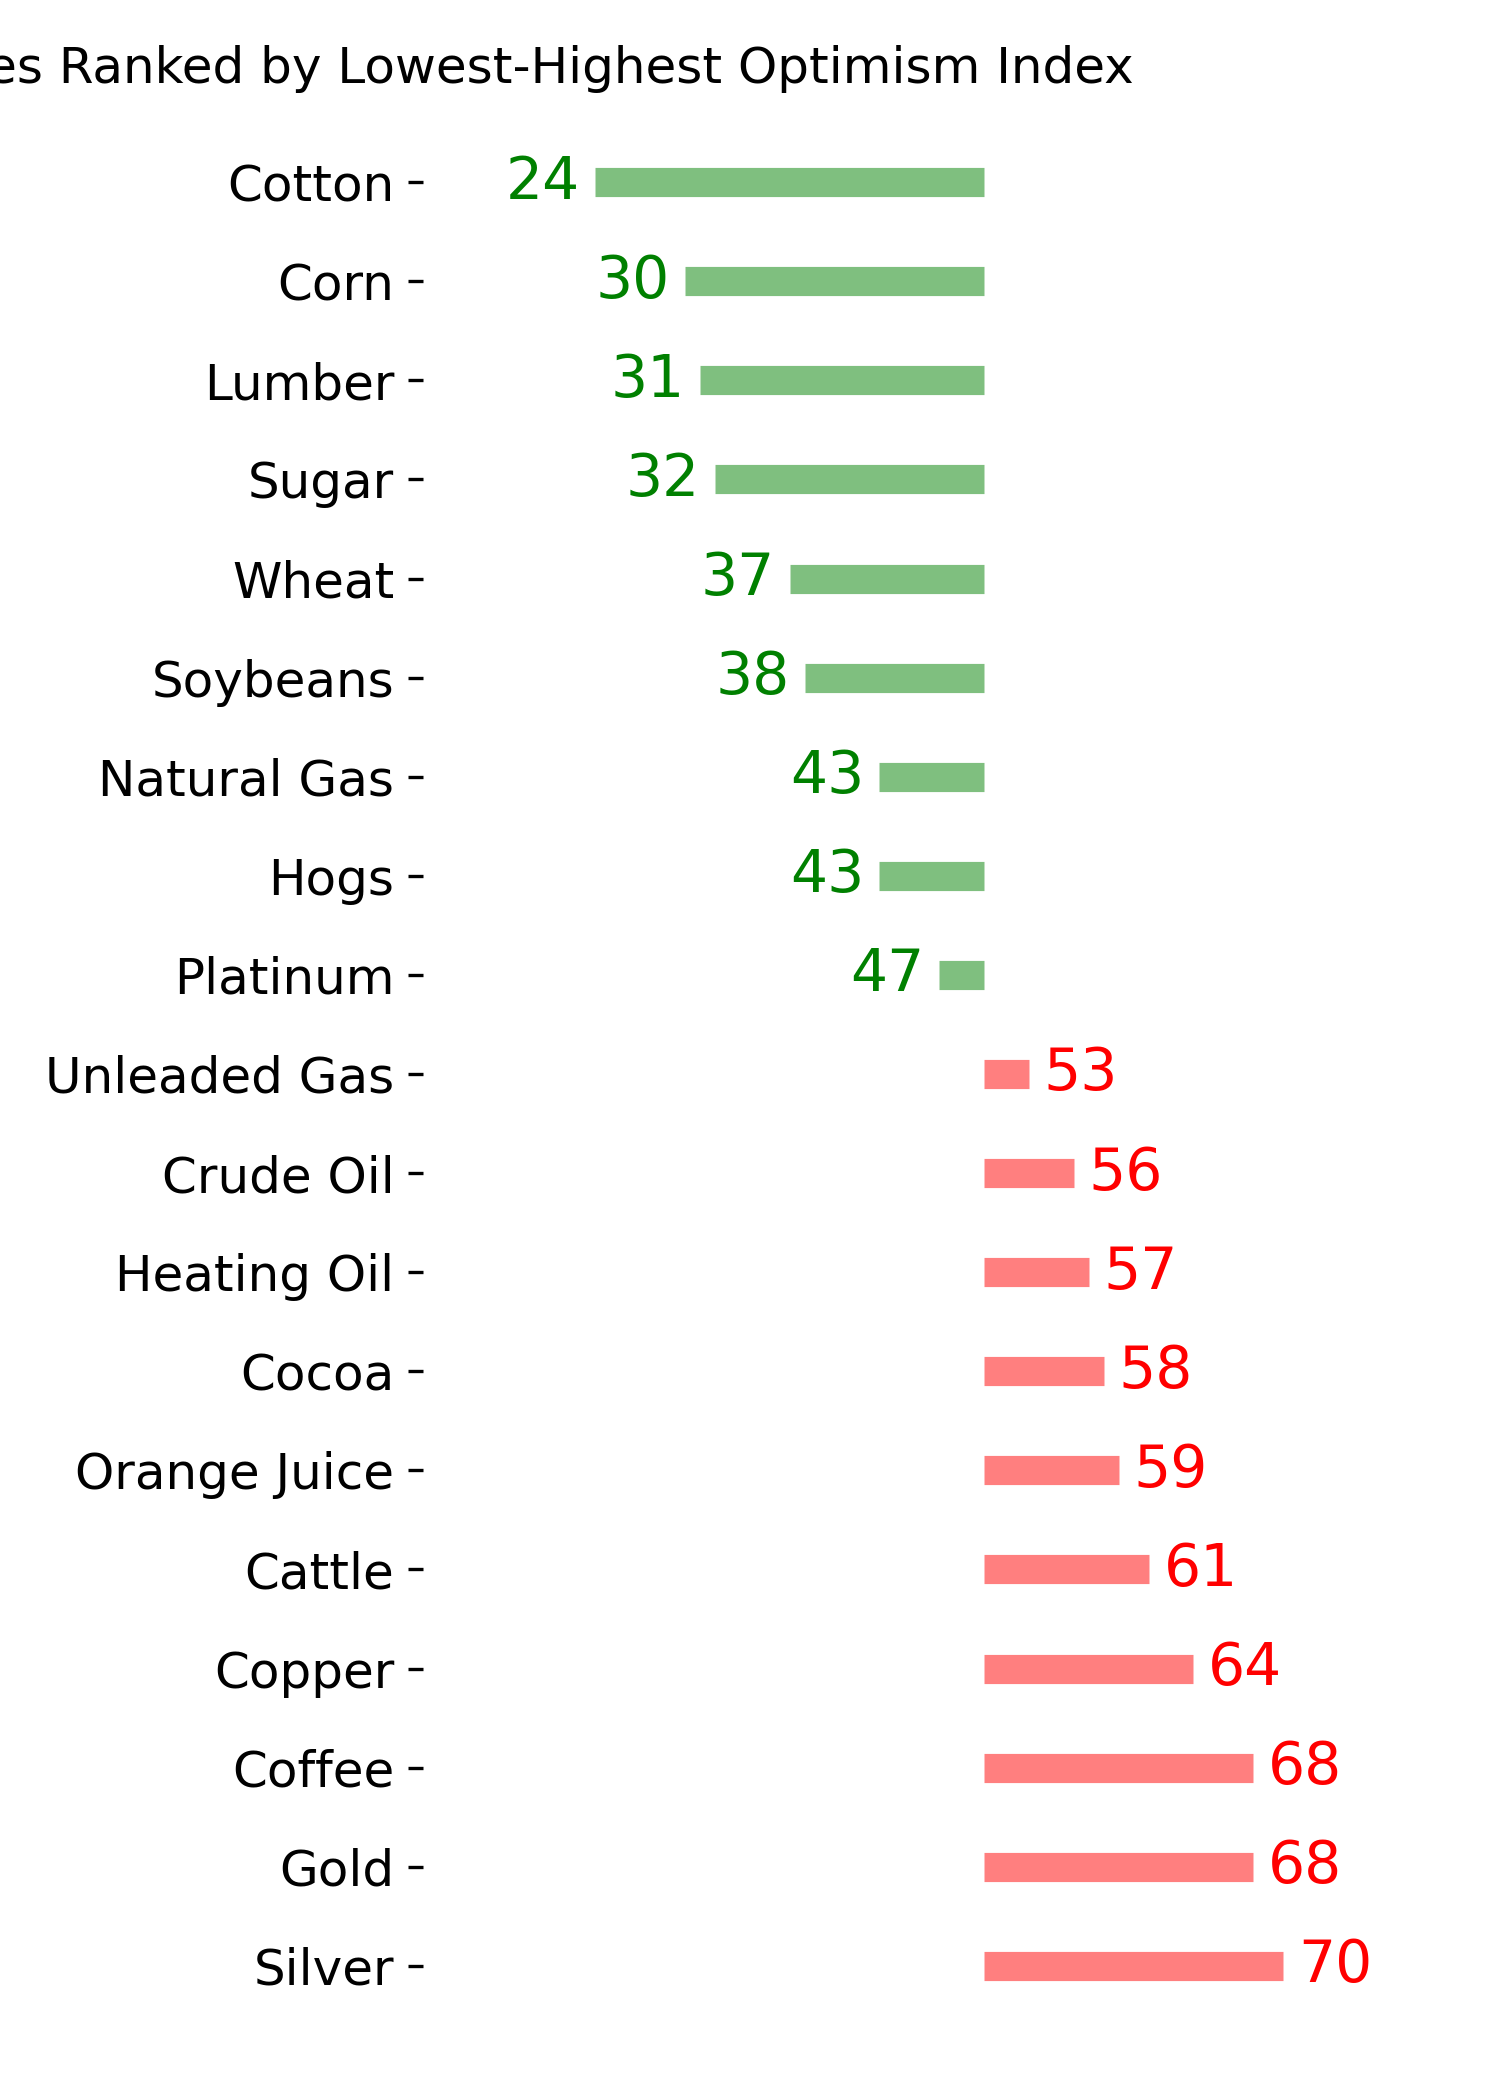
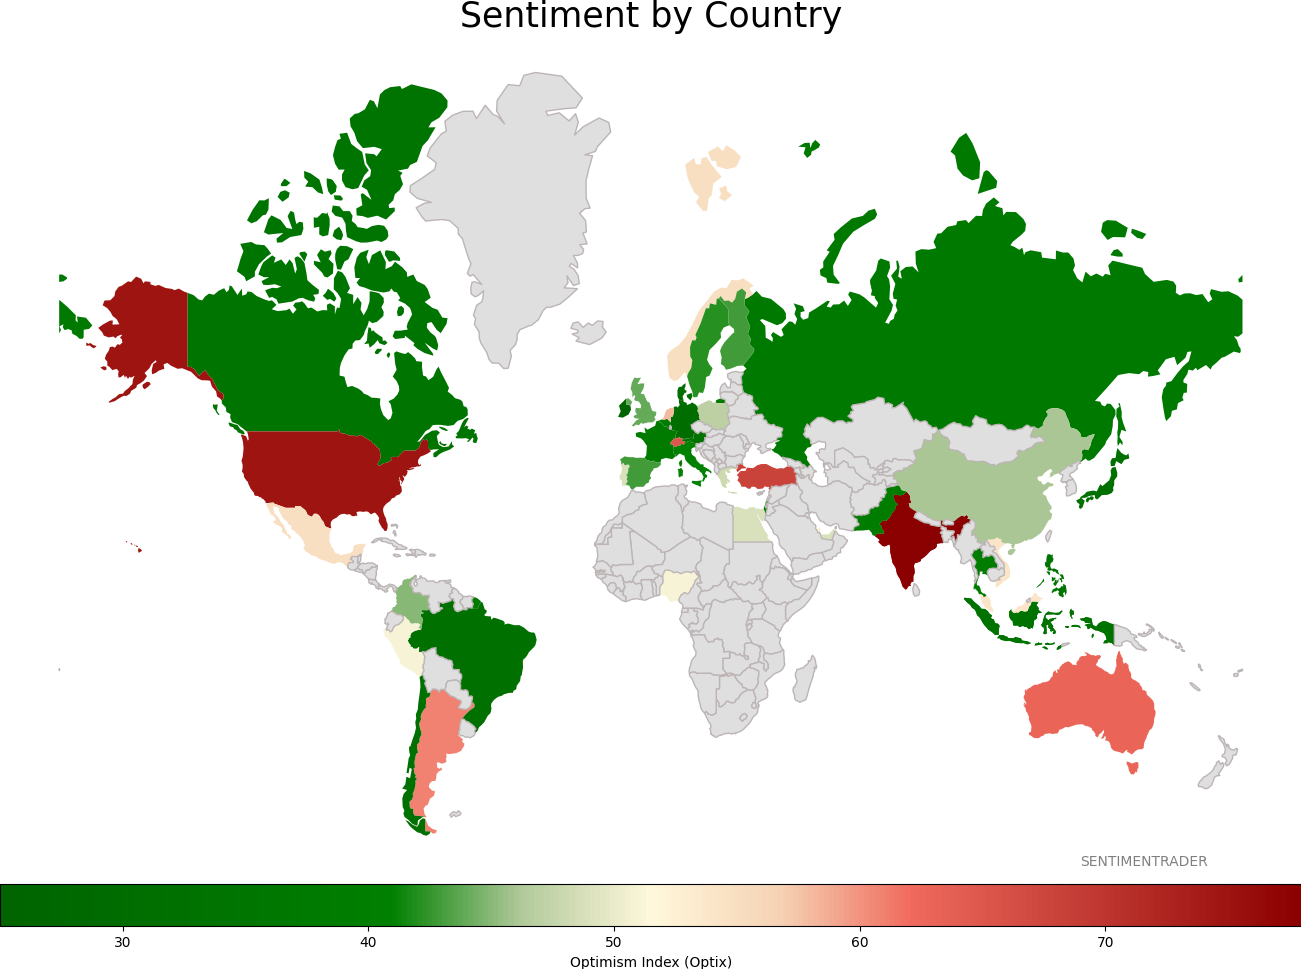
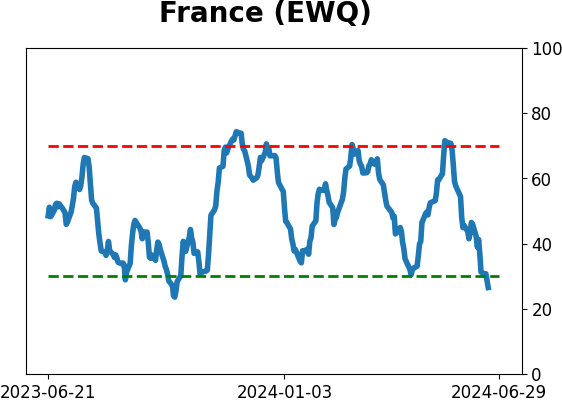
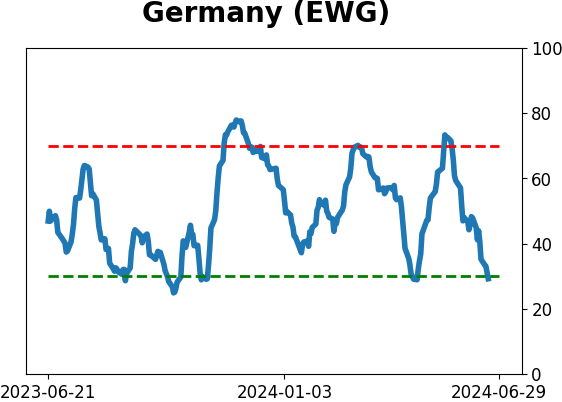
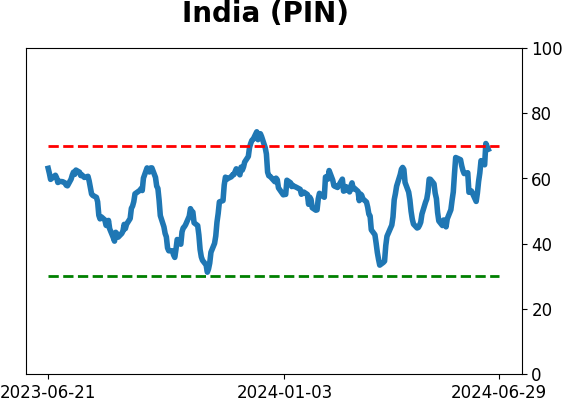
Sentiment Around The World
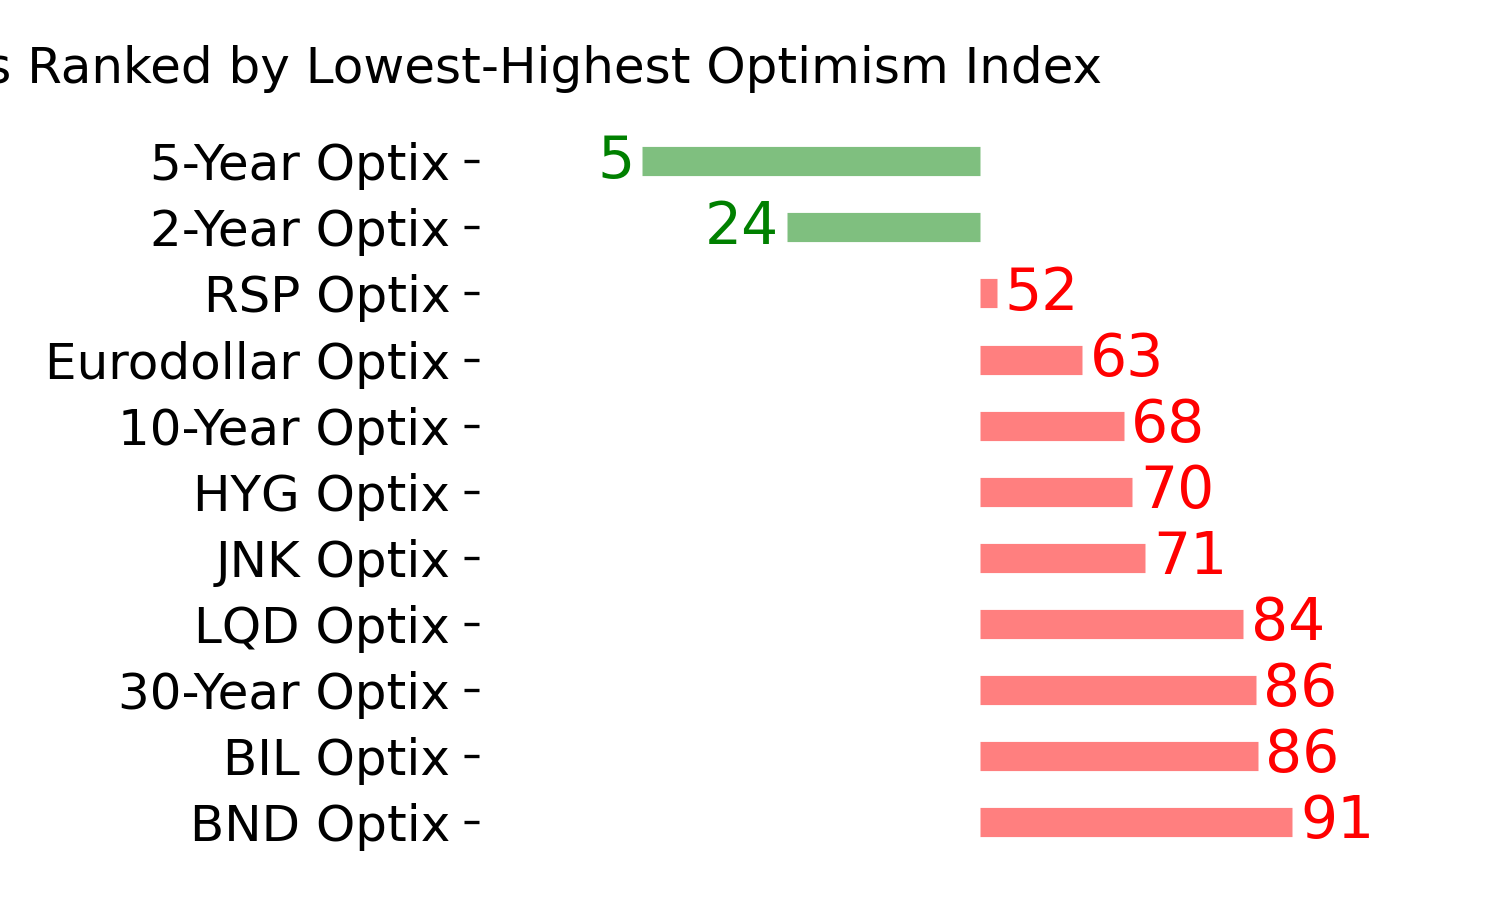
Optimism Index Thumbnails
|
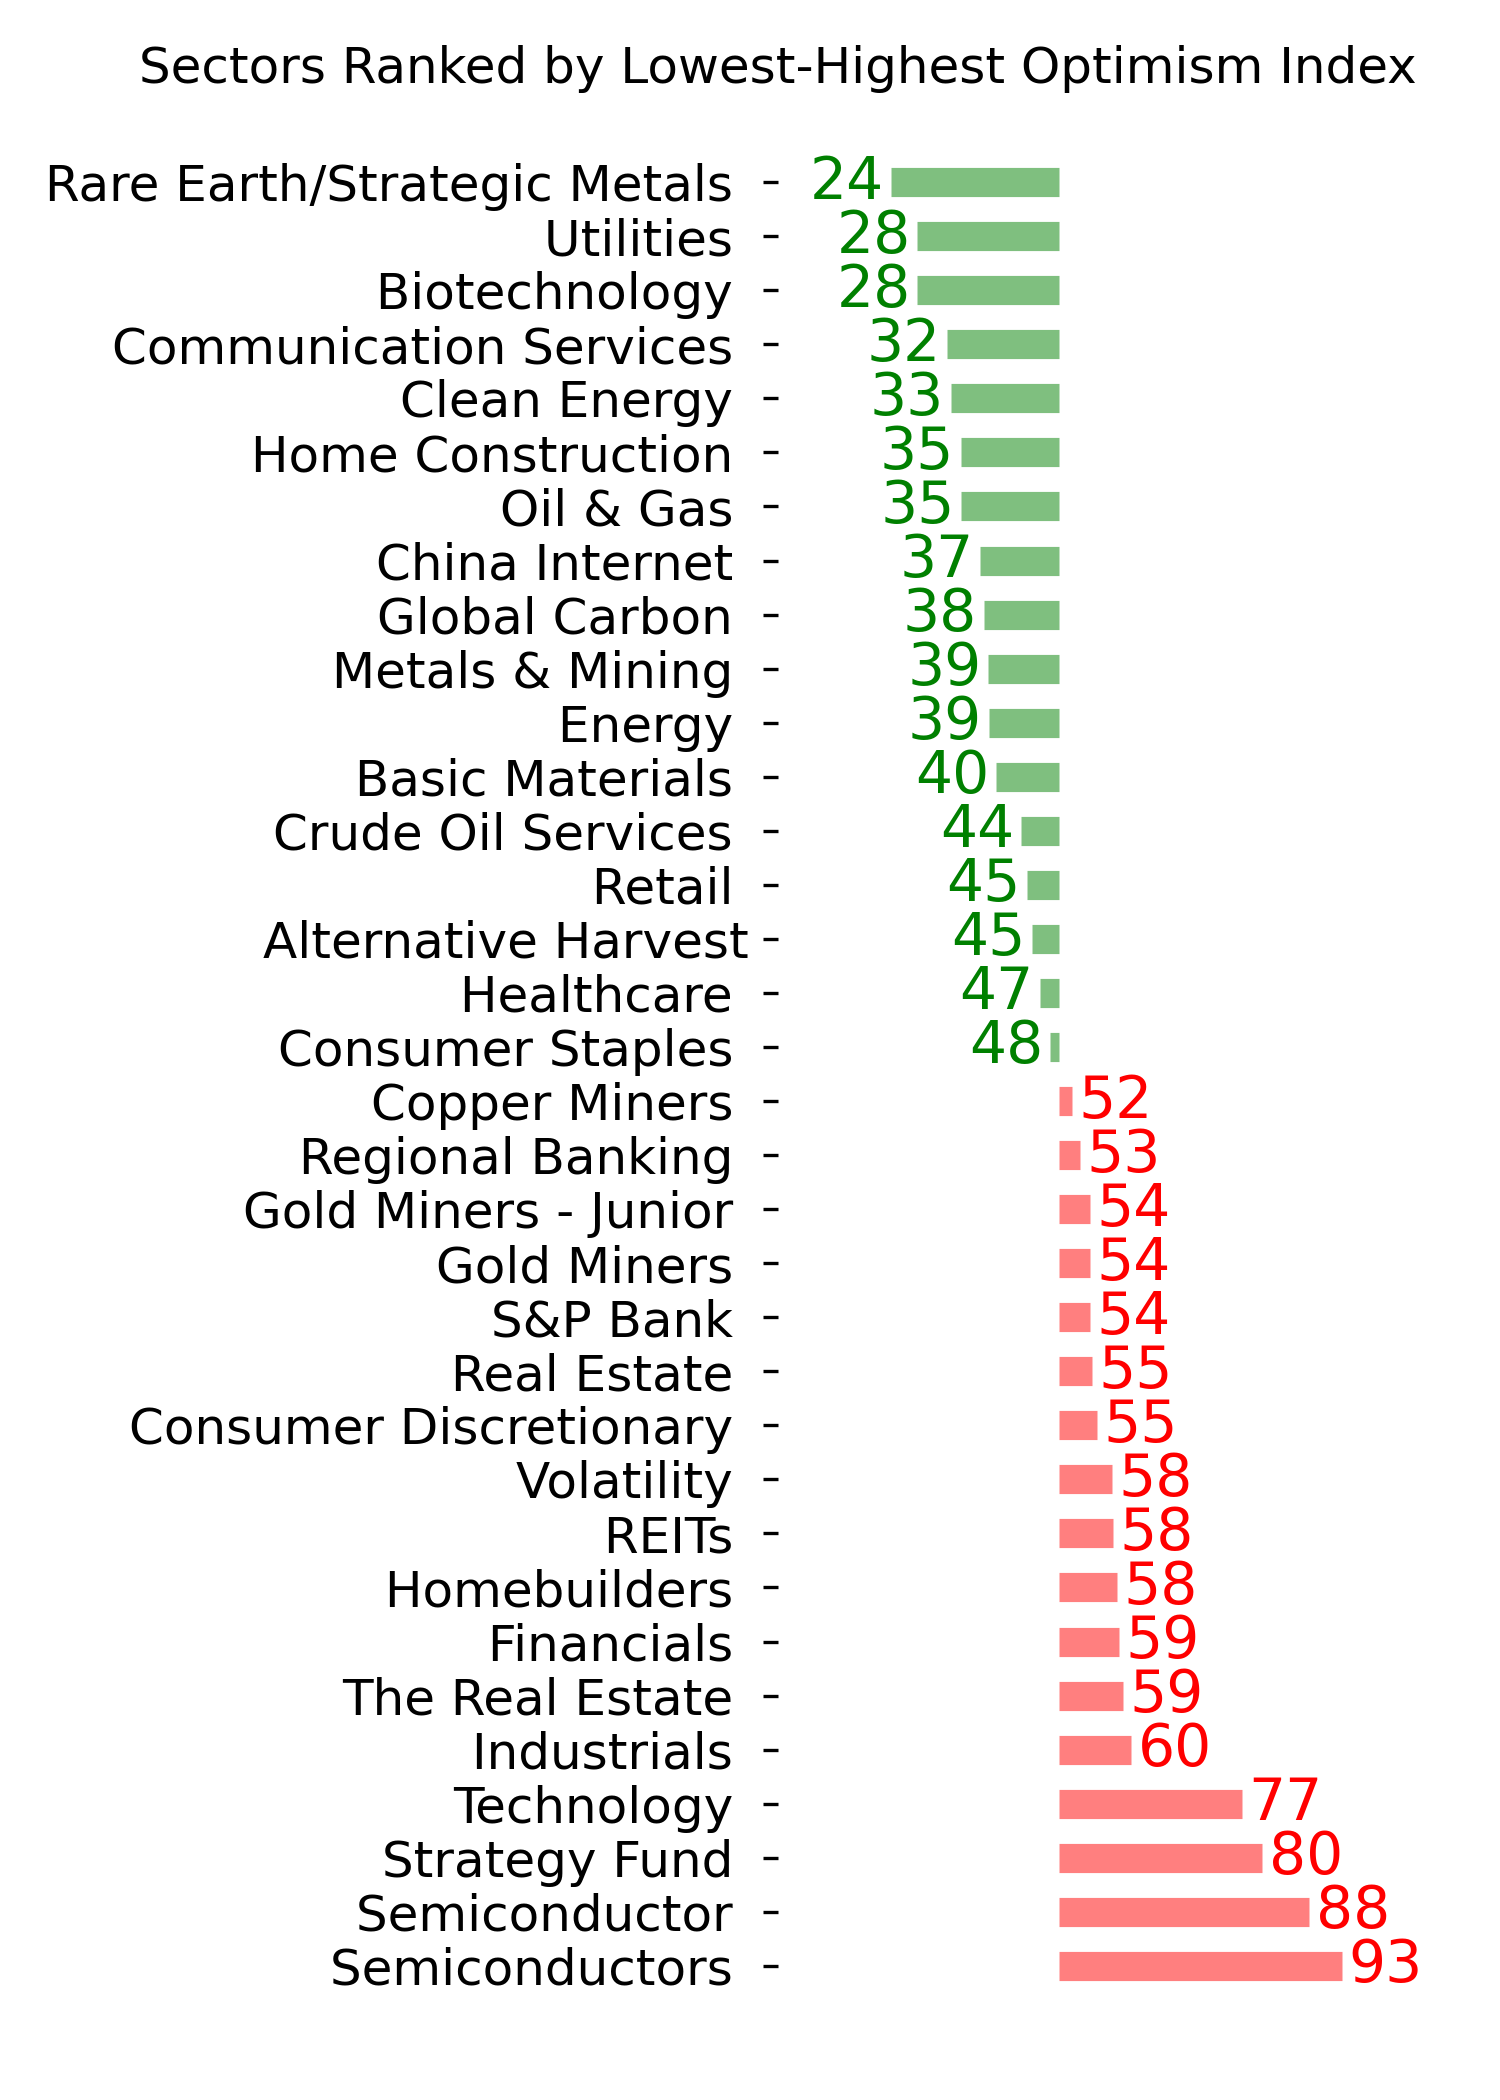
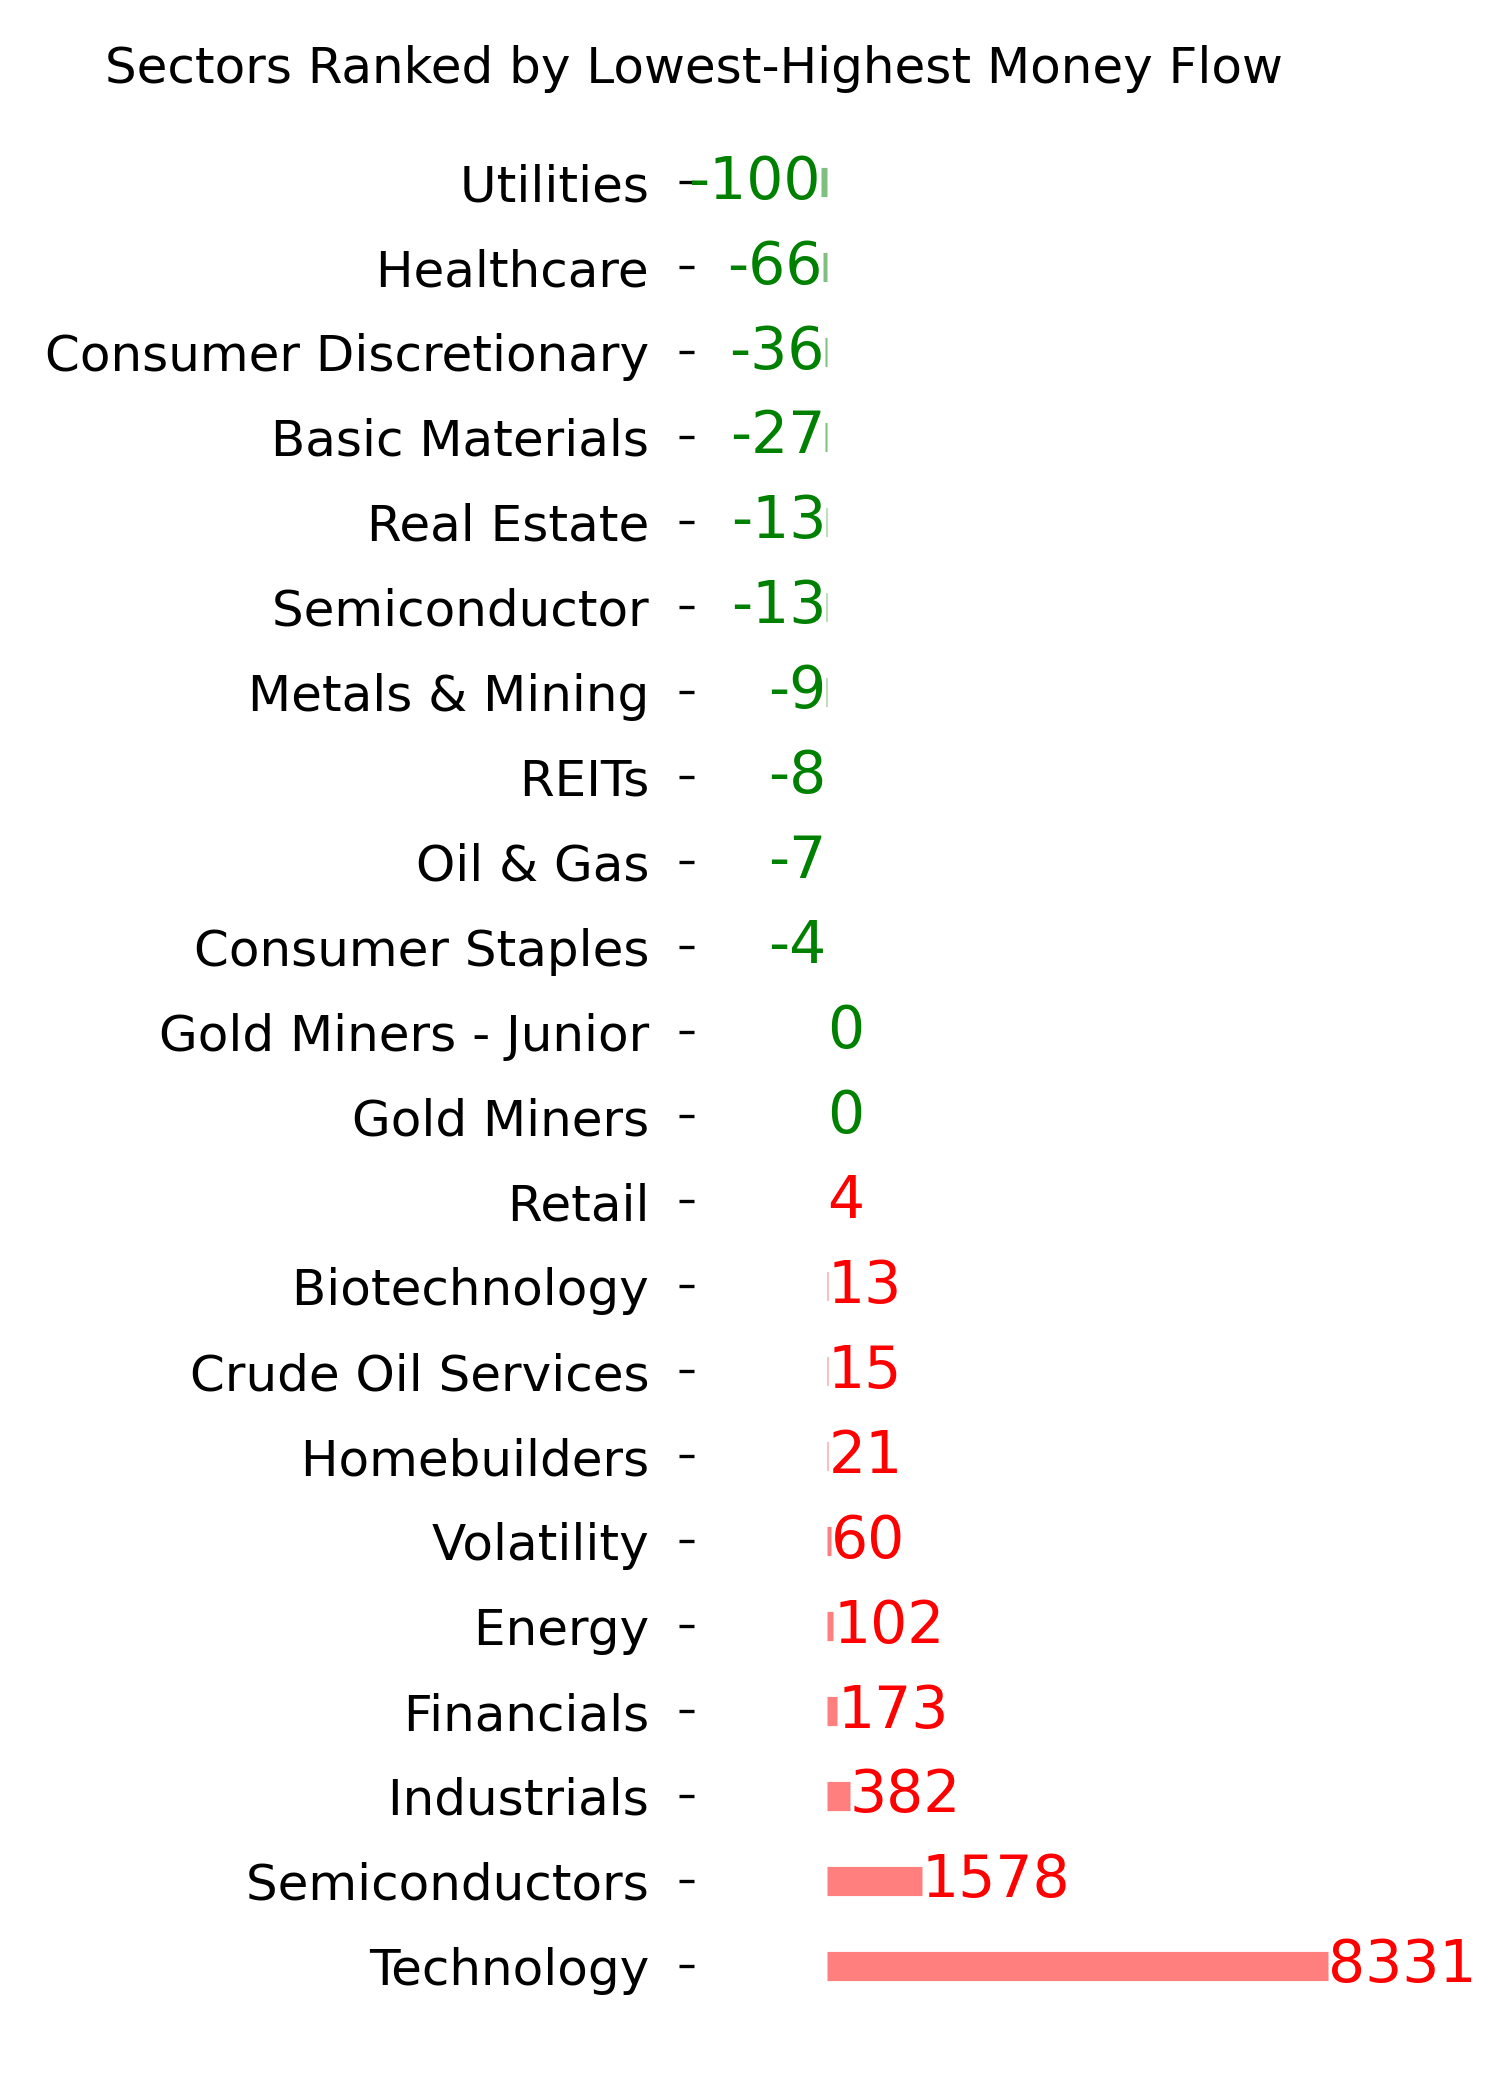
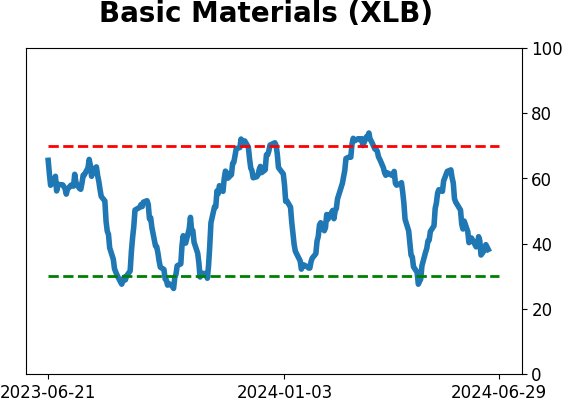
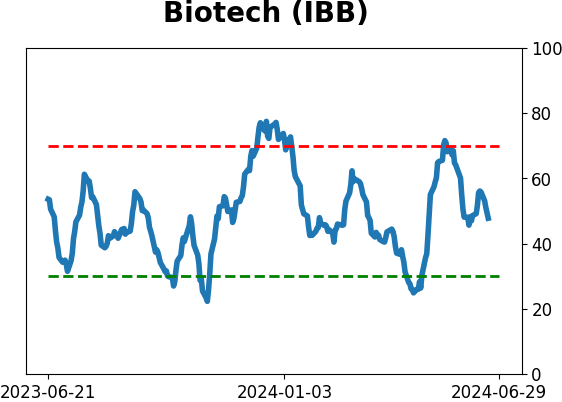
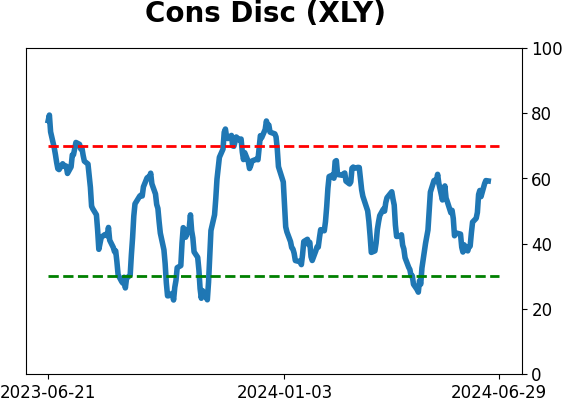
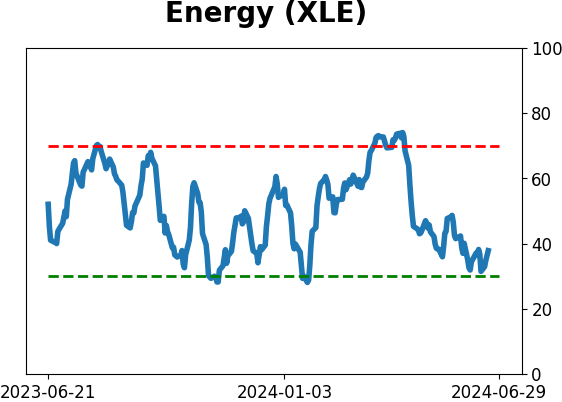
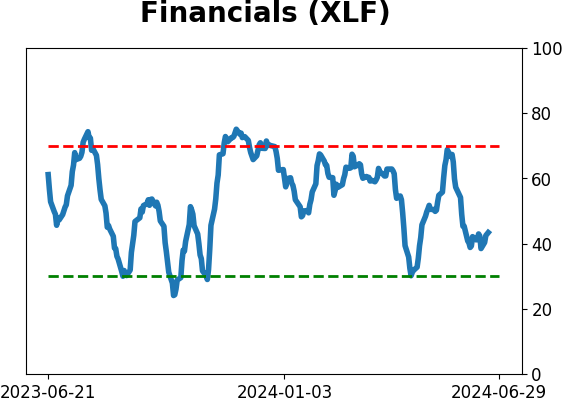
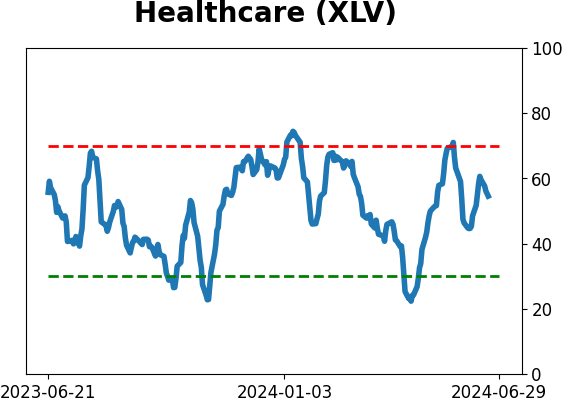
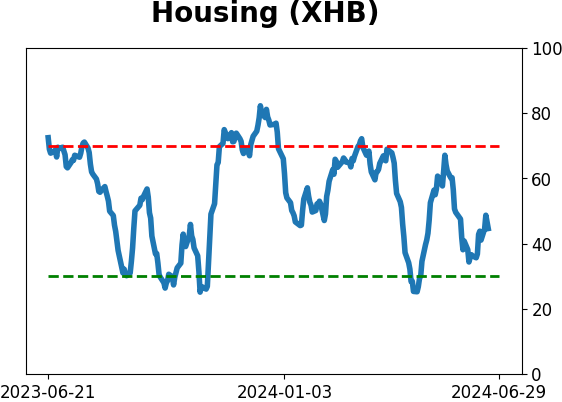
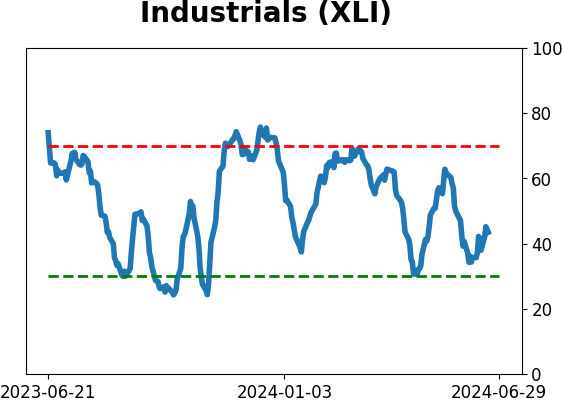
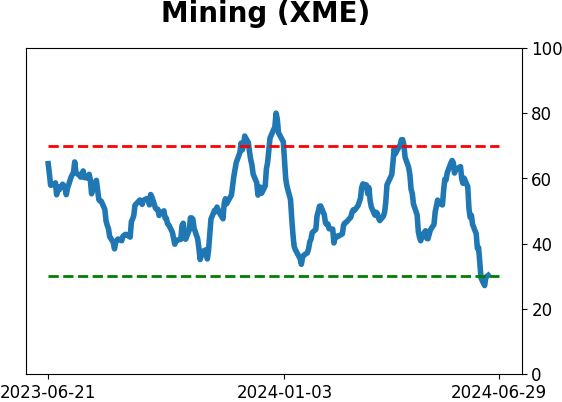
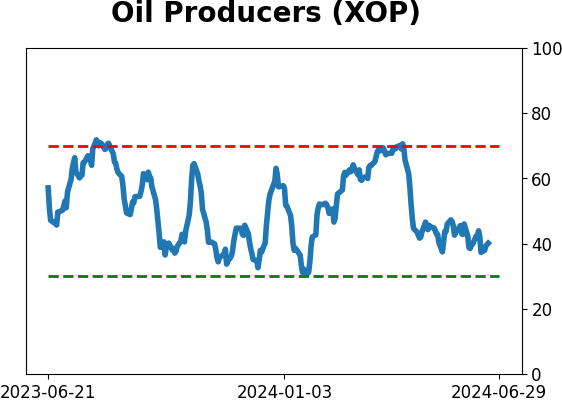
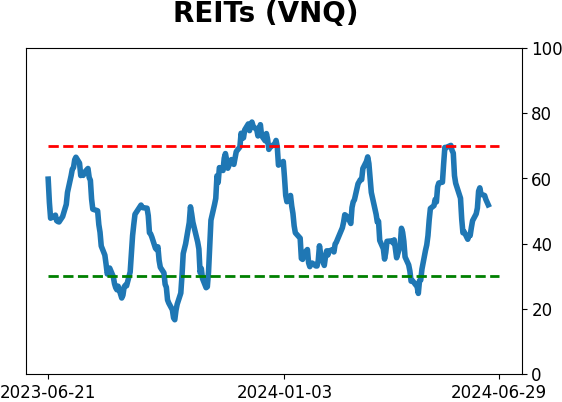
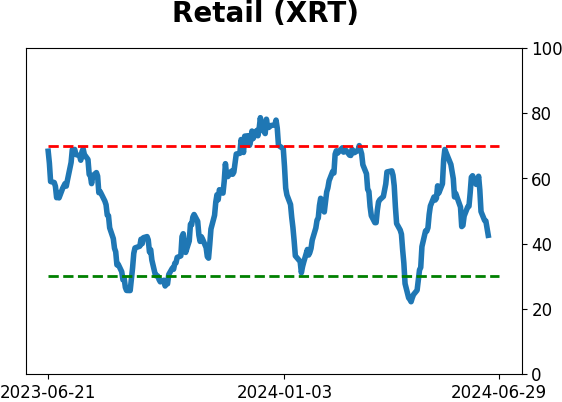
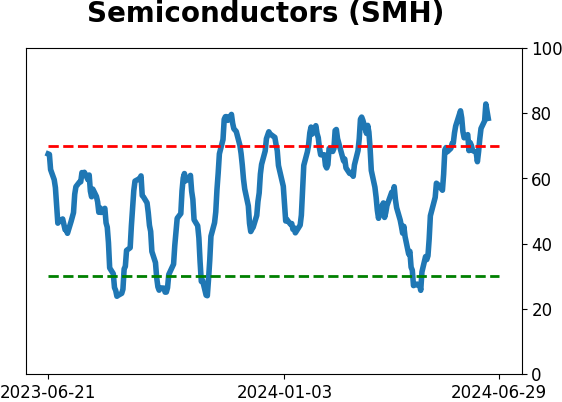
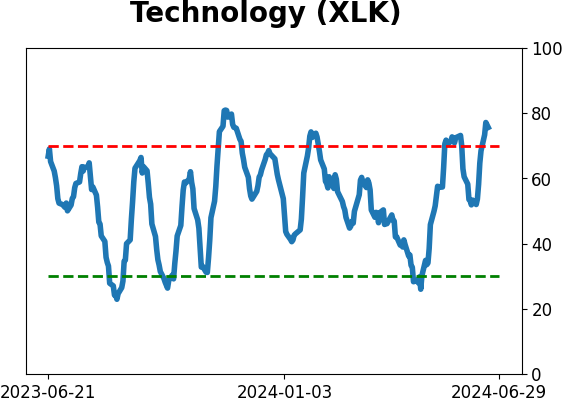
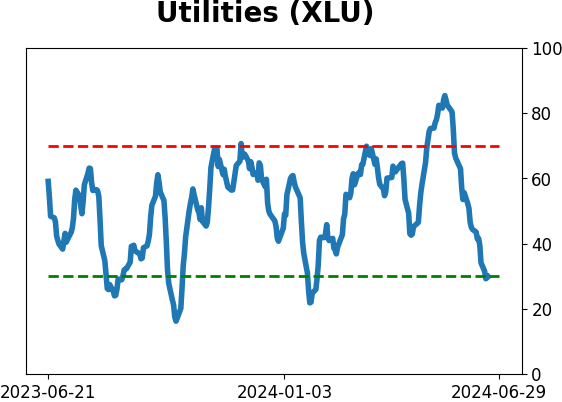
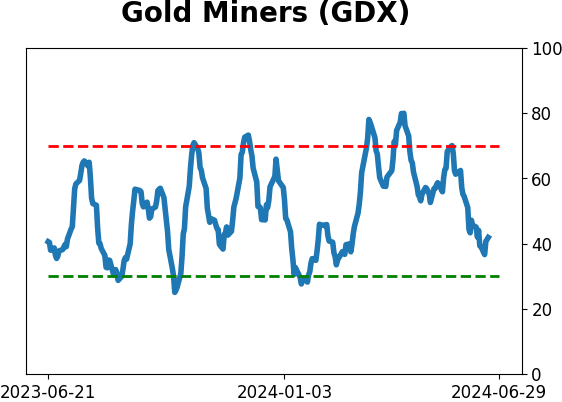
Sector ETF's - 10-Day Moving Average
|
|
|
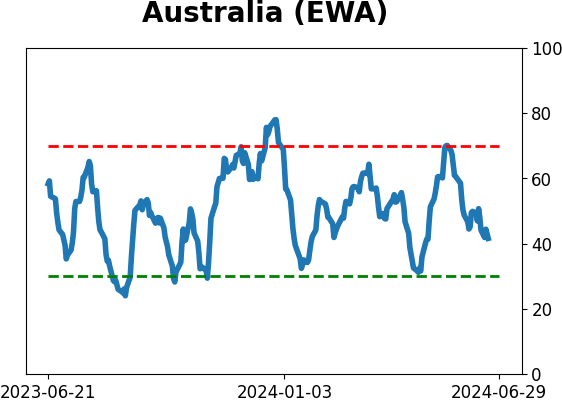
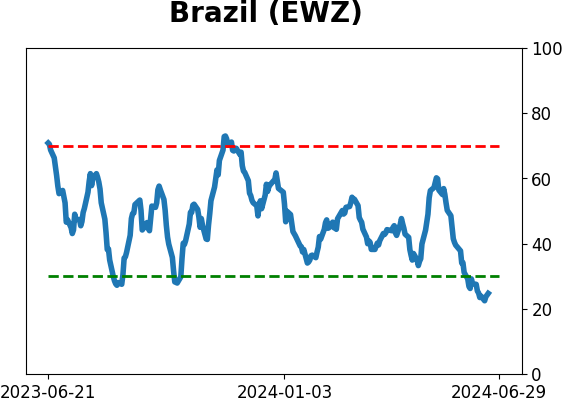
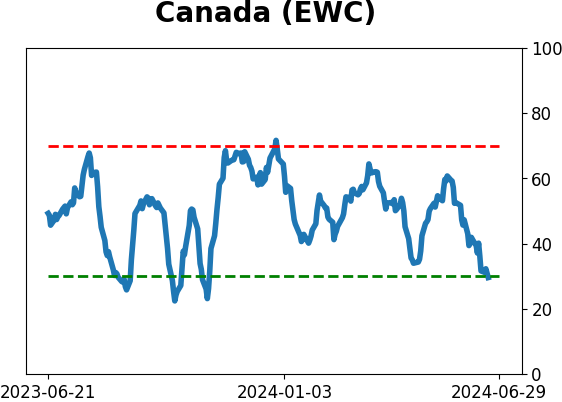
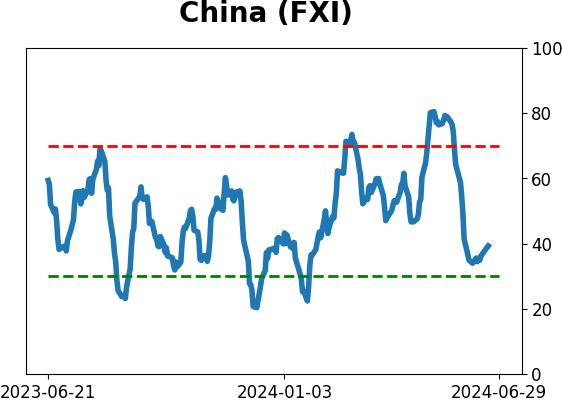
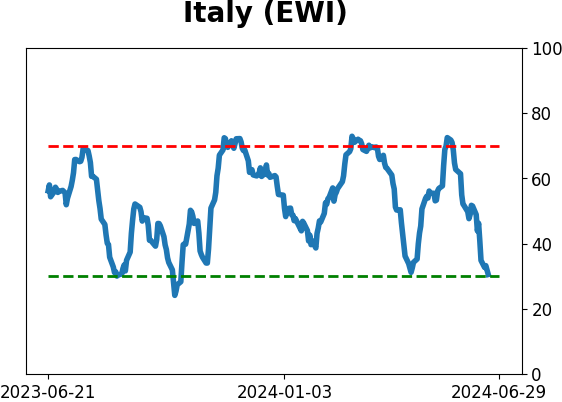
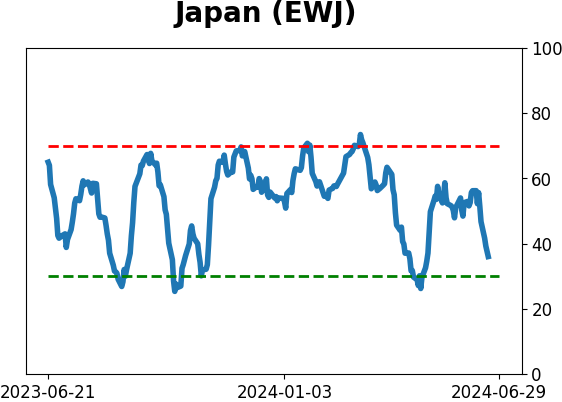
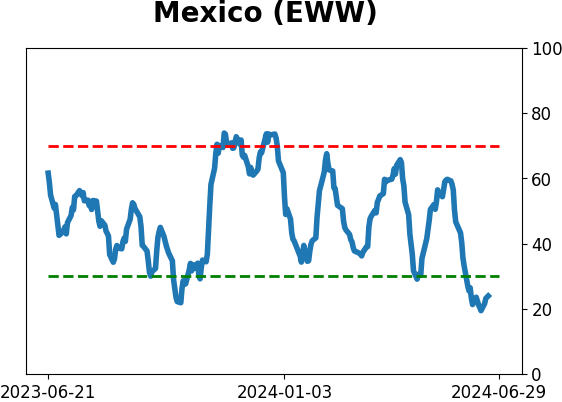
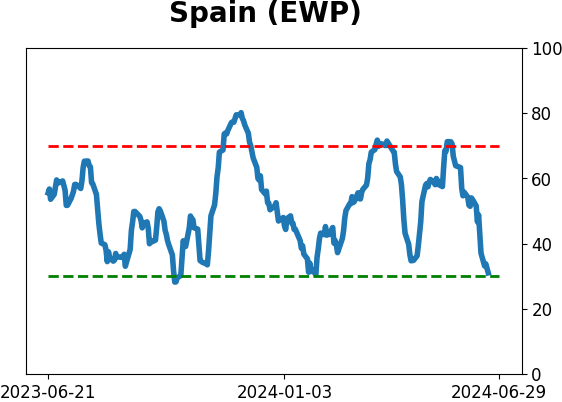
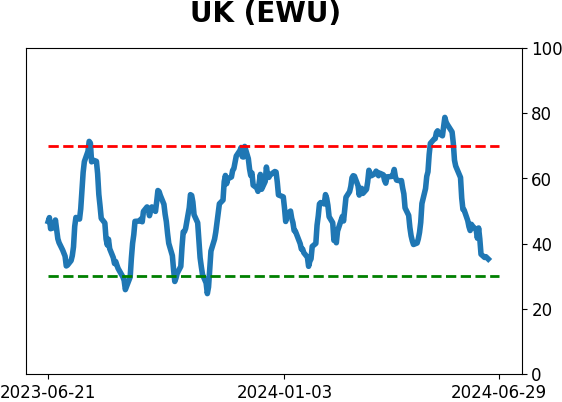
Country ETF's - 10-Day Moving Average
|
|
|
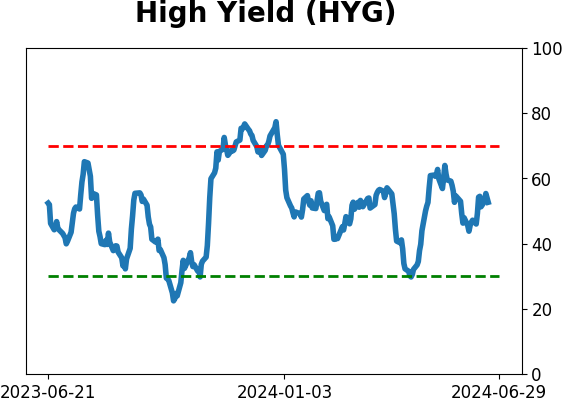
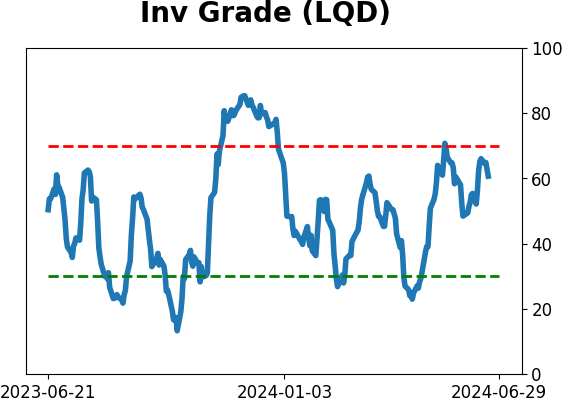
Bond ETF's - 10-Day Moving Average
|
|
|
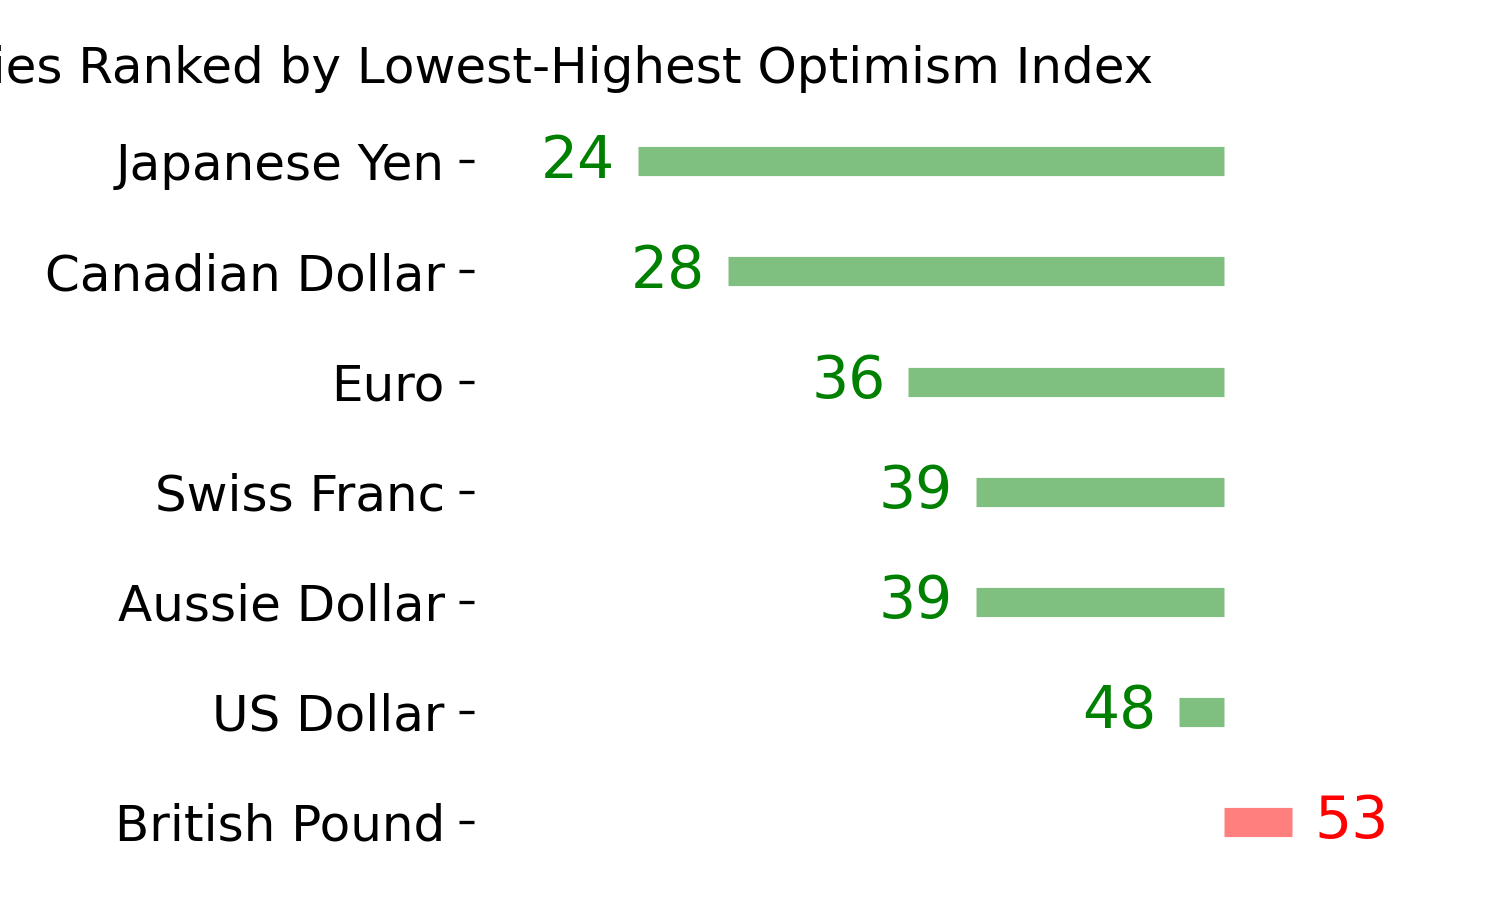
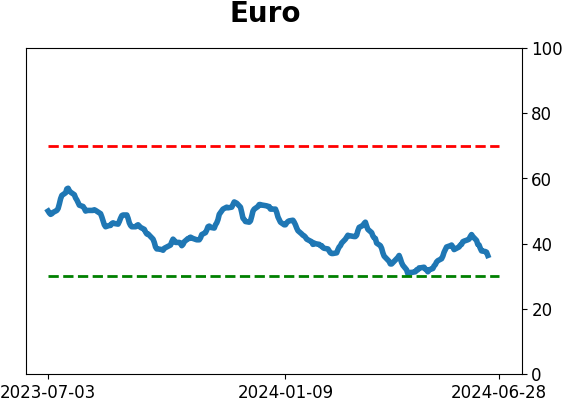
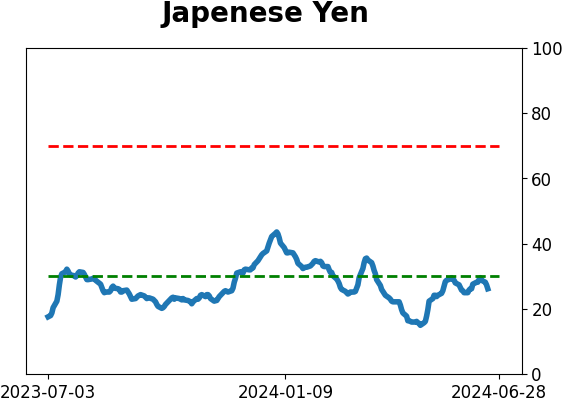
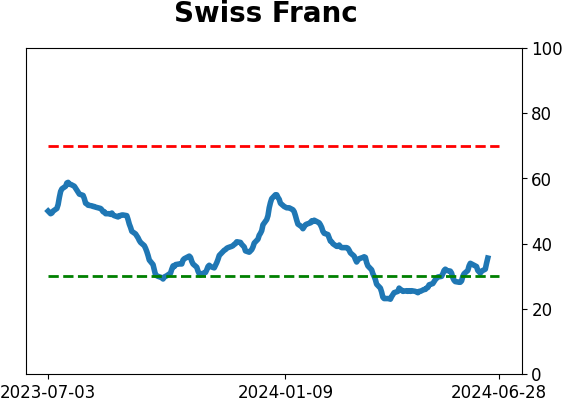
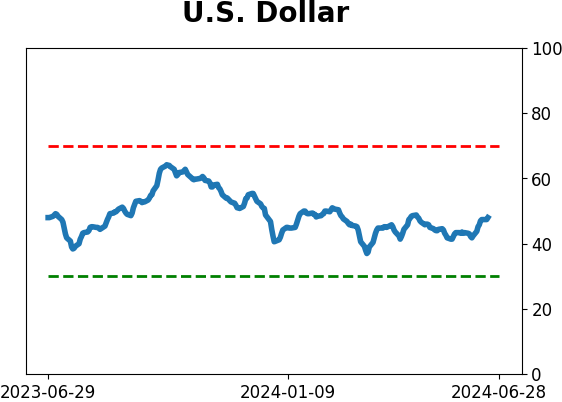
Currency ETF's - 5-Day Moving Average
|
|
|
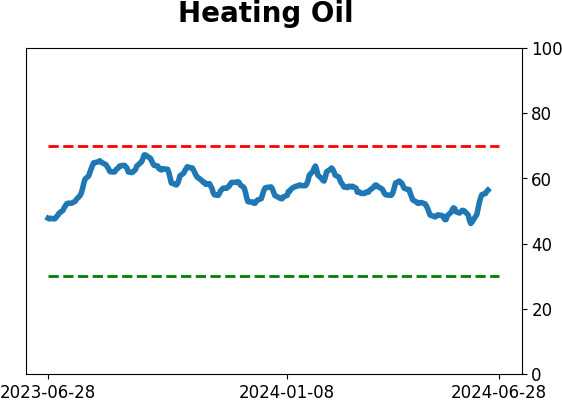
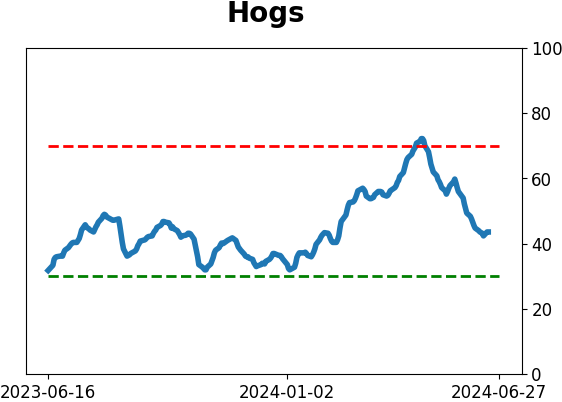
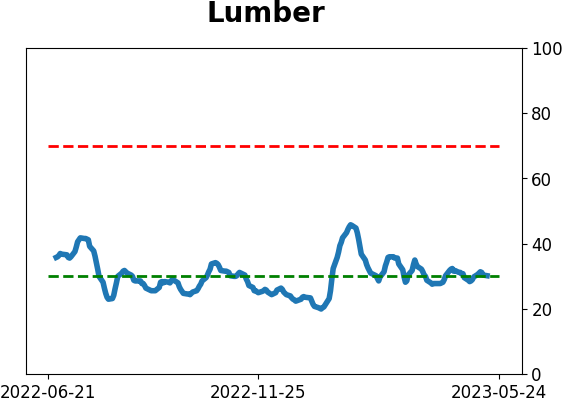
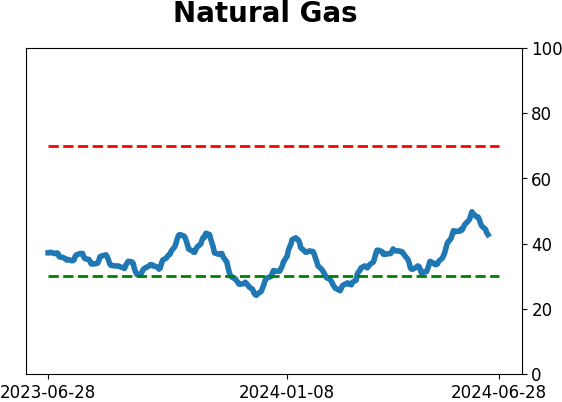
Commodity ETF's - 5-Day Moving Average
|
|