Headlines
|
|
A breakout in breadth:
One of the broadest measures of breadth, the Cumulative Advance/Decline Line for the S&P 500, has reached a new all-time high, leading the index itself. New highs in the line have tended to precede minimal drawdowns and selling pressure, and when the line leads the index, the index tends to follow.
|
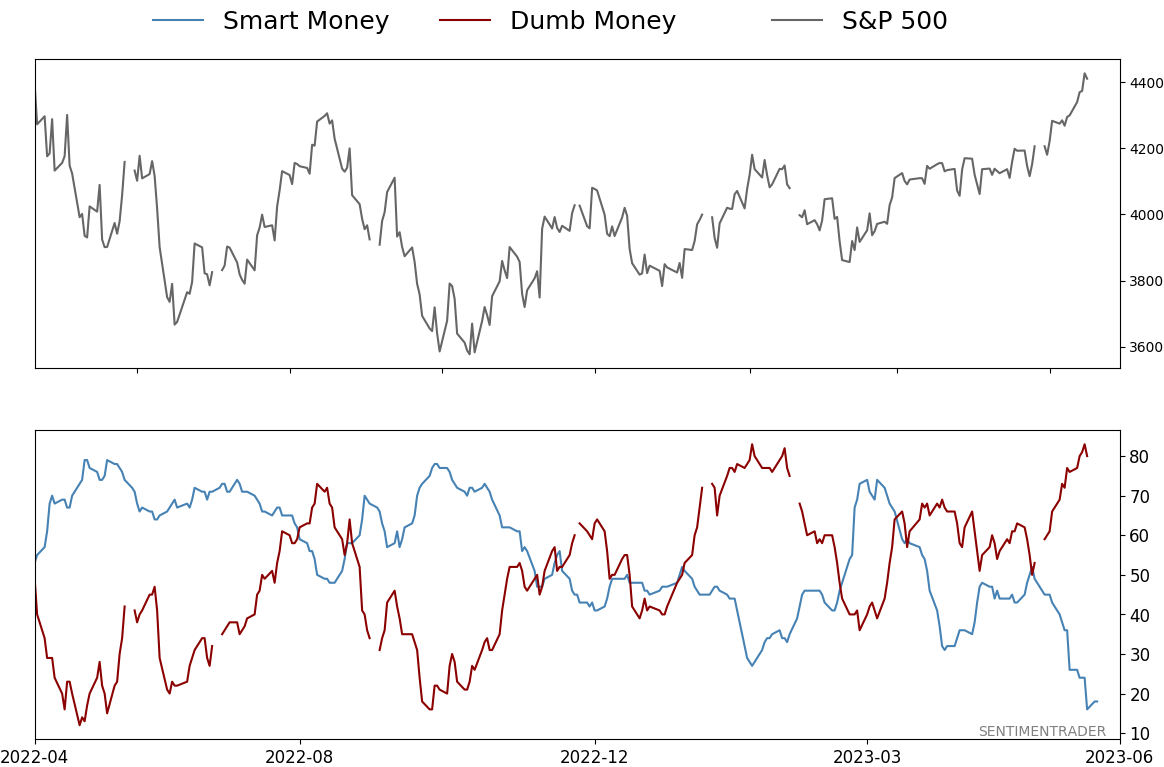
Smart / Dumb Money Confidence
|
Smart Money Confidence: 18%
Dumb Money Confidence: 80%
|
|
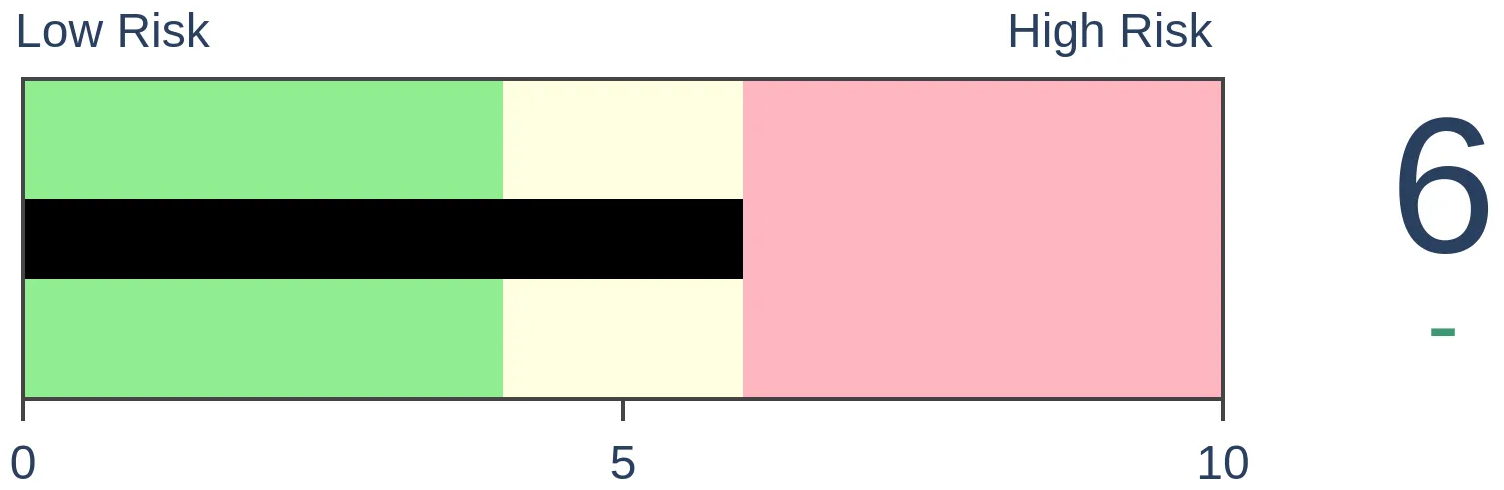
Risk Levels
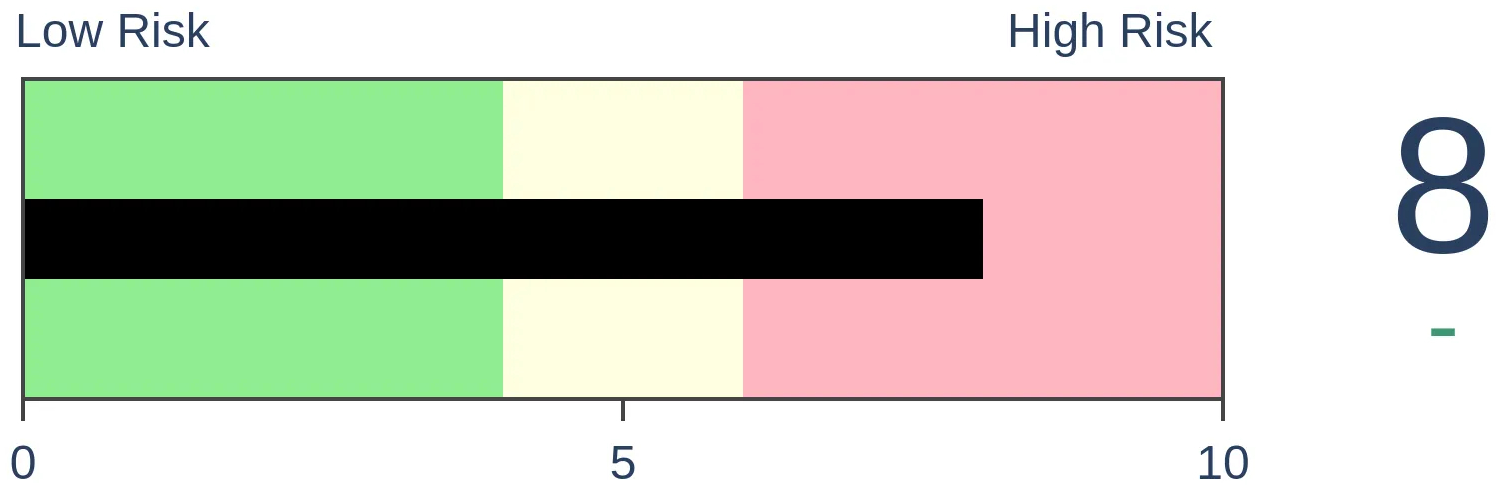
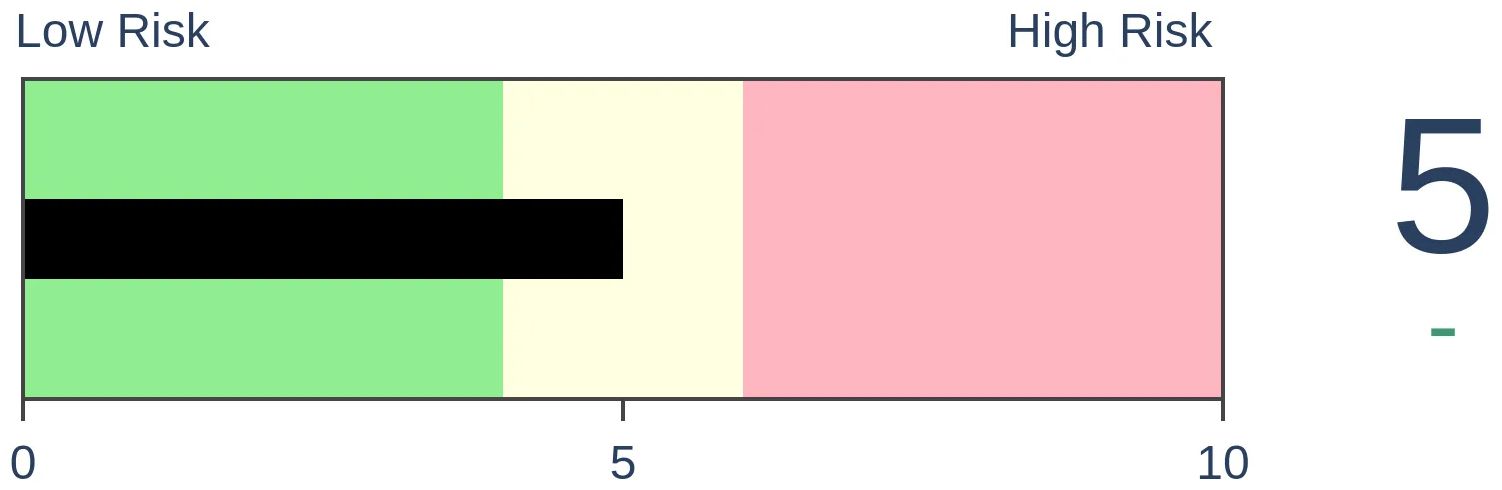
Stocks Short-Term
|
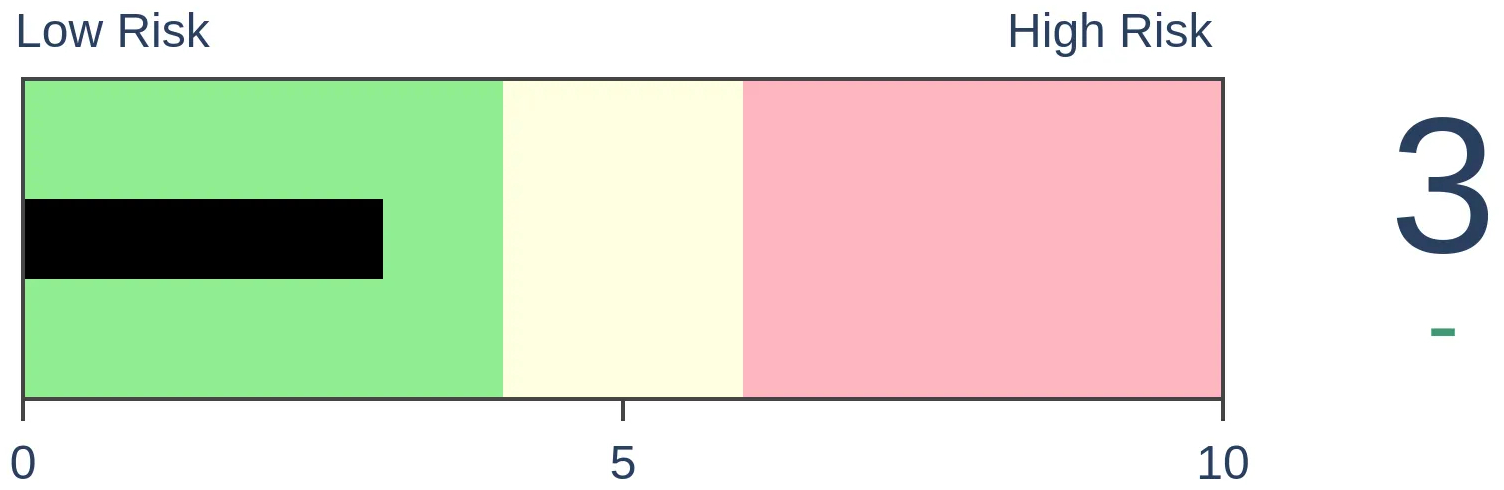
Stocks Medium-Term
|
|
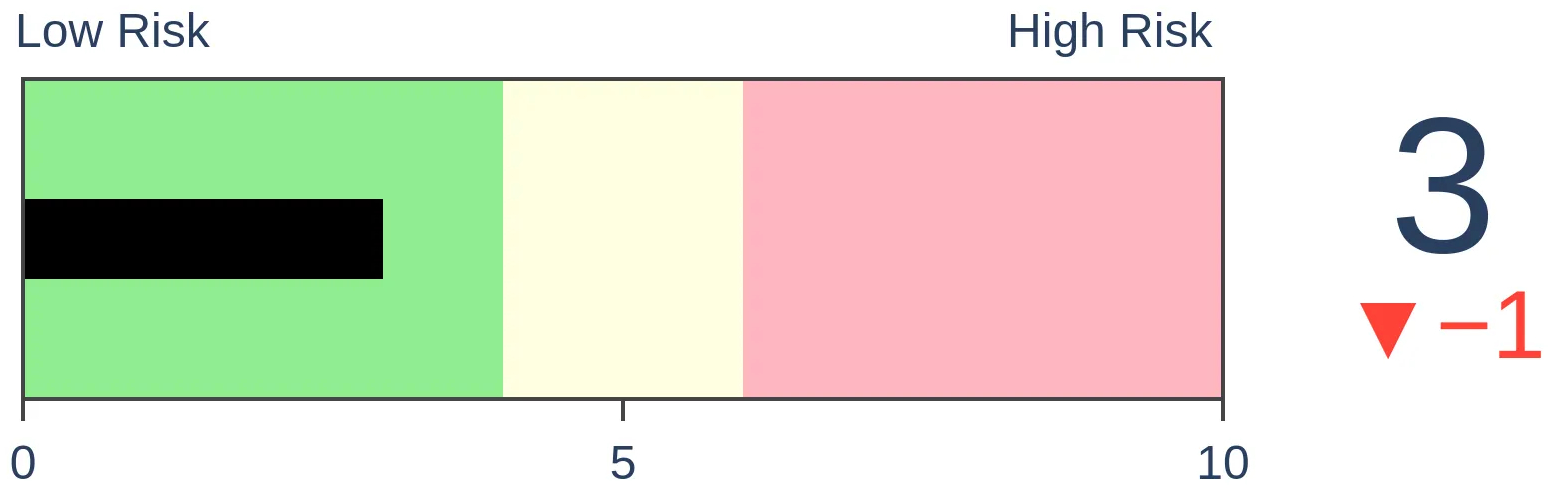
Bonds
|
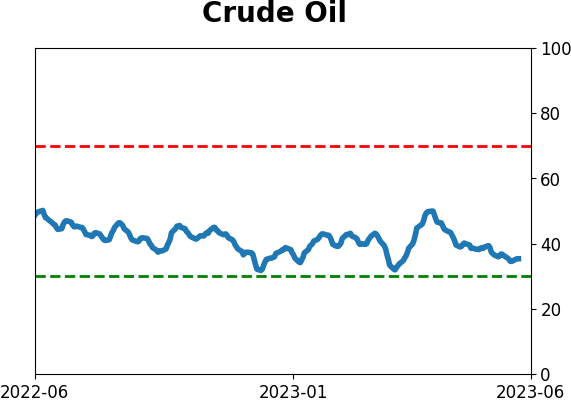
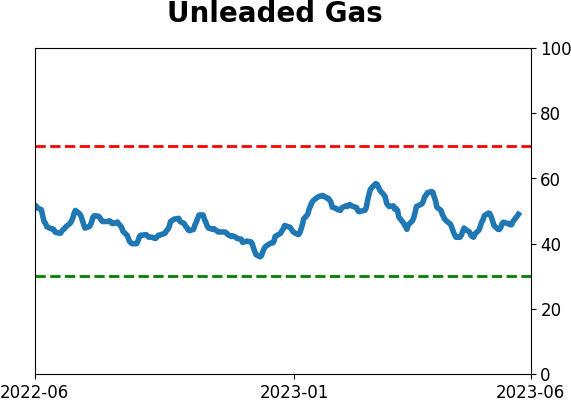
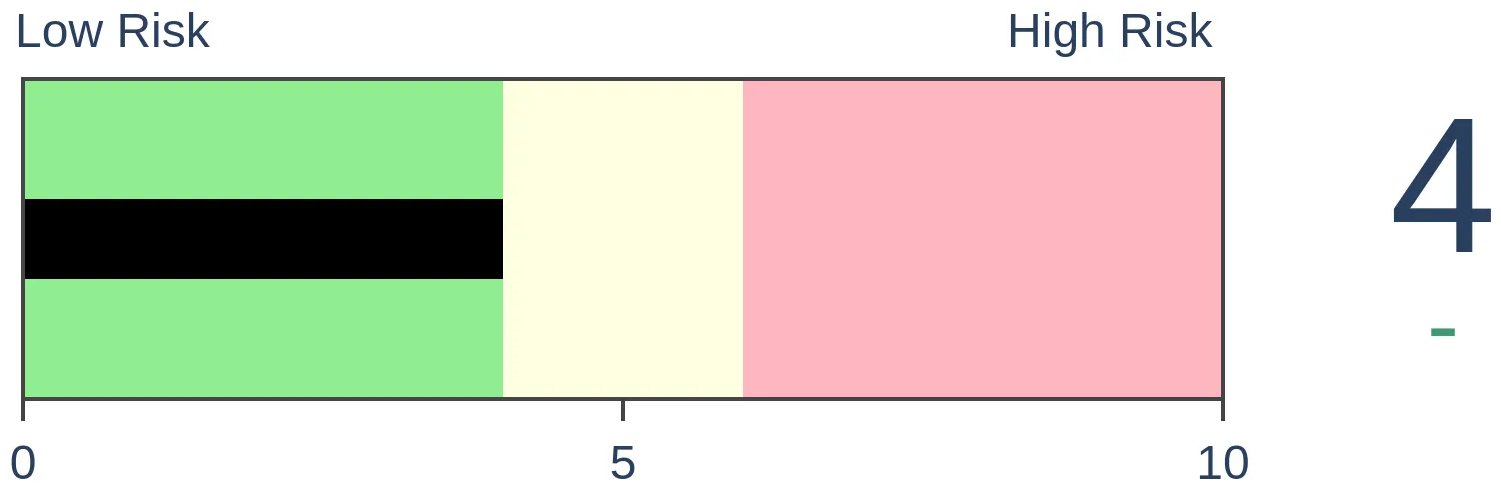
Crude Oil
|
|
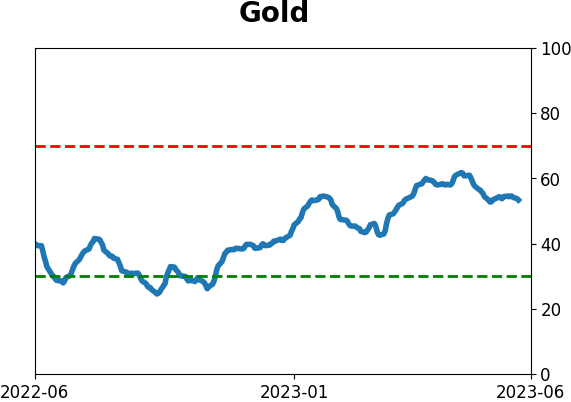
Gold
|
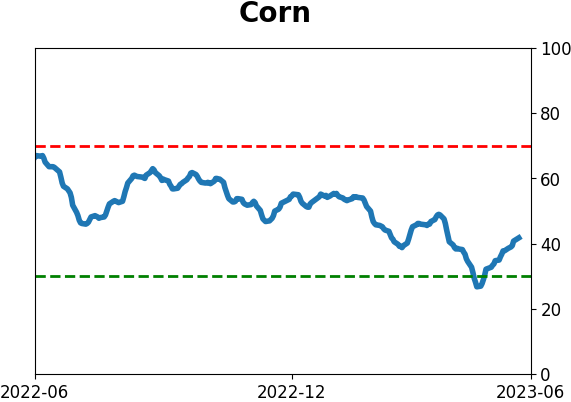
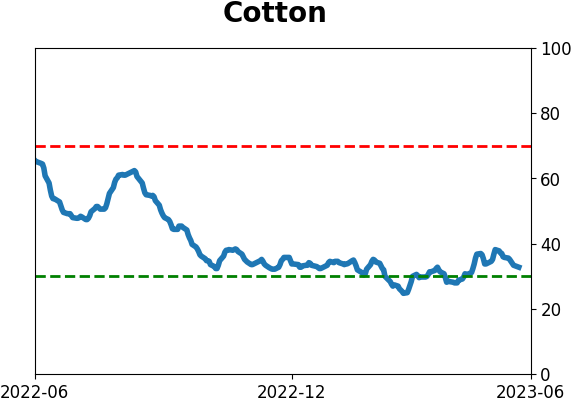
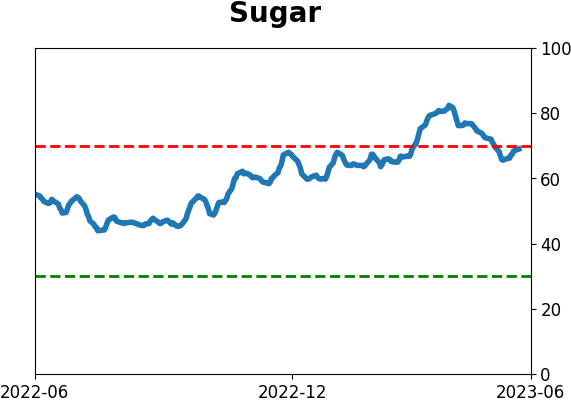
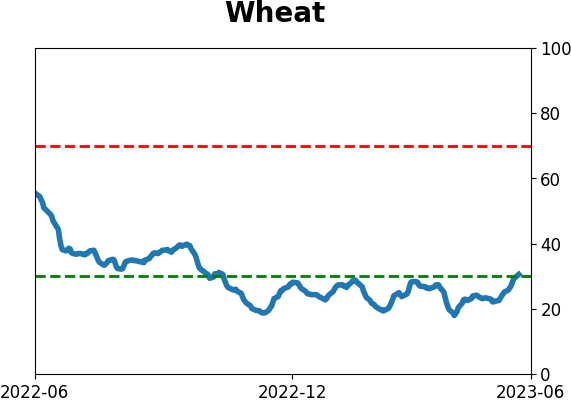
Agriculture
|
|
Research
By Jason Goepfert
BOTTOM LINE
One of the broadest measures of breadth, the Cumulative Advance/Decline Line for the S&P 500, has reached a new all-time high, leading the index itself. New highs in the line have tended to precede minimal drawdowns and selling pressure, and when the line leads the index, the index tends to follow.
FORECAST / TIMEFRAME
None
|
Key points:
- The S&P 500's Cumulative Advance/Decline Line has reached a fresh all-time high
- New highs in the A/D Line have a strong record of preceding minimal drawdowns in the index
- When the line leads the index to new highs, the index tends to follow
The S&P's broadest breadth measure has reached an all-time high
Since last October, we've spent a lot of time outlining the various breadth thrusts in sectors, industries, and across broad indexes. The lasting push has finally been enough to trigger a new all-time high in the S&P 500's Cumulative Advance/Decline Line.
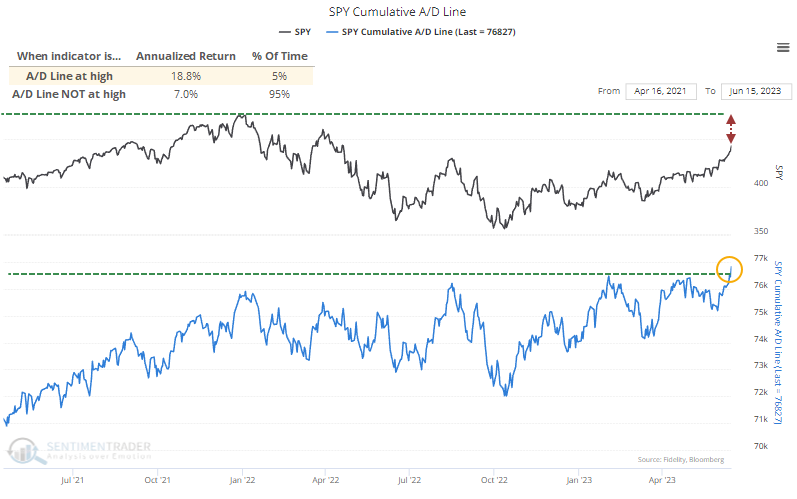
We can see from the chart that when the A/D Line scores a new high, the S&P's annualized return since 1928 has been +18.8%. That's well above those days when the line is not at a new high.
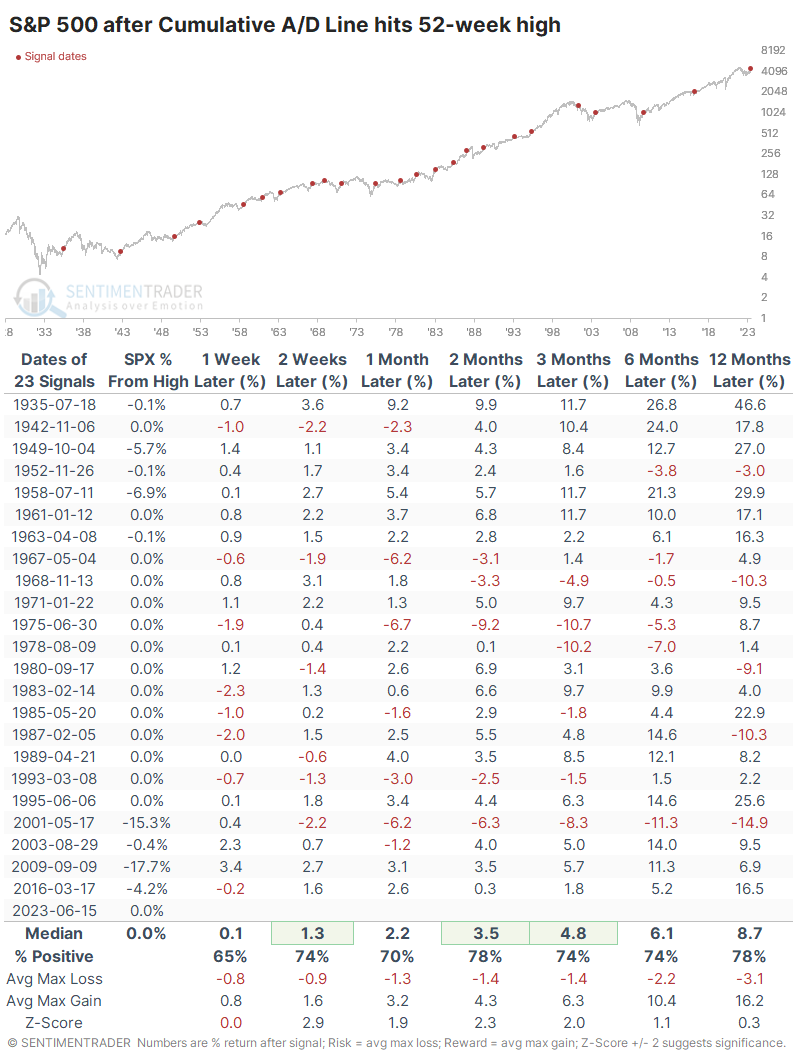
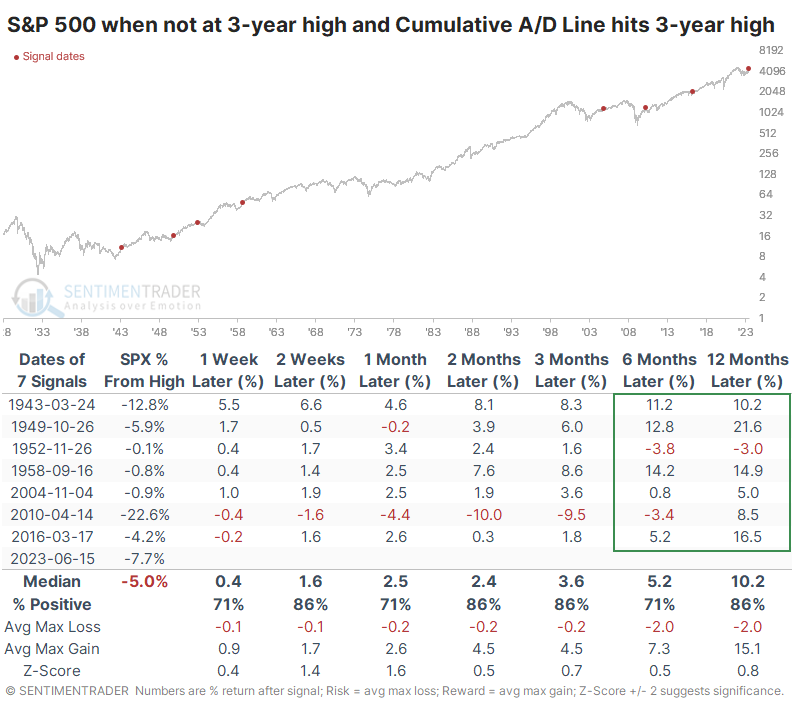
The chart below shows the S&P 500's returns after the A/D Line reaches a new high for the first time in at least 200 sessions. As we've seen before, the most notable aspect of these breakouts tends to be low drawdowns in the future. Out of 23 signals, only 3 witnessed a decline of more than -10% at any point within the next six months.
Not only did the A/D Line reach a fresh 52-week high, but it's also a multi-year high. That necessarily means a smaller sample size, but the S&P's consistency improved over the medium- to long-term after these rarer occurrences. The only signal that suffered a more than -10% drawdown within the next six months was in 2010, which quickly reversed as the S&P soared to new highs.
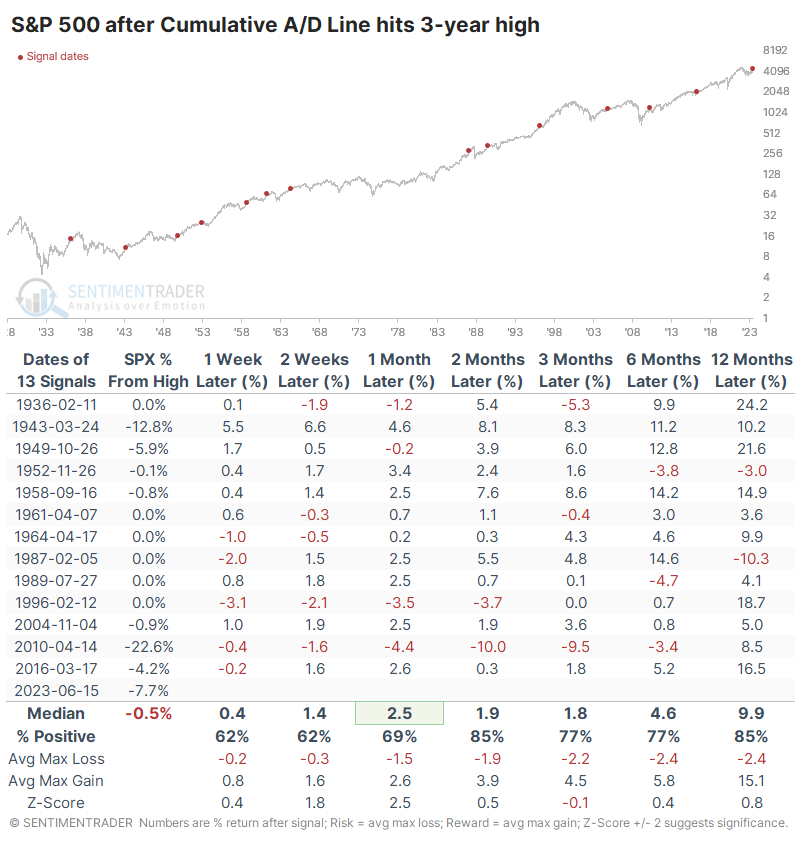
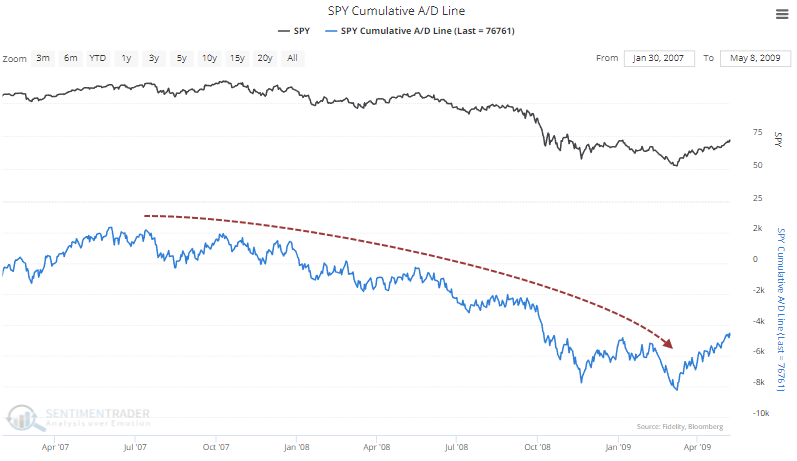
Investors are always worried about the last bear market, and for what that's worth, the A/D Line never reached a 3-year high at any point during the most fearsome protracted bear markets. In 2008, it was a steady drop lower throughout the entire thing.
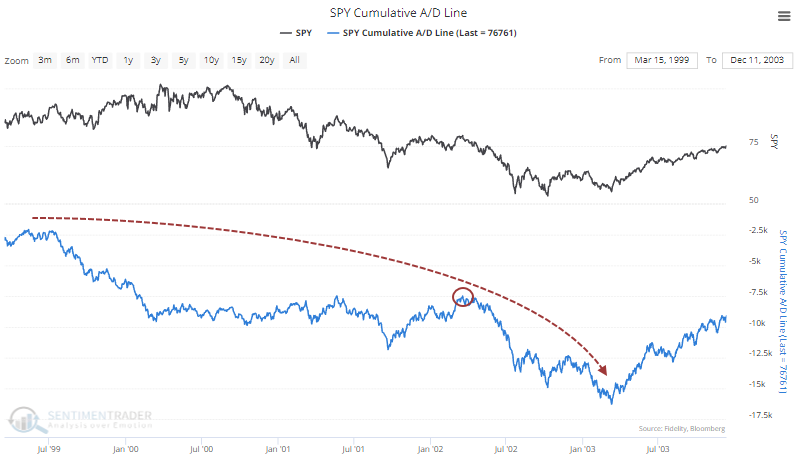
In 2001-02, it was similar, though there was a day - literally a single session - when the A/D Line made a 2-year high (but not a 3-year high) in March 2002.
Even more rare is that the A/D Line has scored a multi-year high while the S&P itself is still well below its own high. If we filter the table above to only include those signals when the line was leading the index, forward returns were quite good, with the most significant exception again being in 2010.
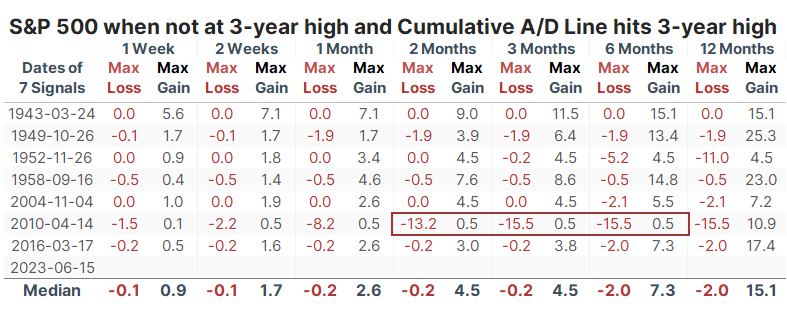
The table of maximum gains and losses over each time frame shows how limited any losses tended to be. Again, only 2010 sticks out.
What the research tells us...
The biggest factor for a bullish outlook over the past eight months has been the notable eagerness of buyers to gobble up a broad array of stocks and even high-yield bonds at times. The thrusts have had an impressive historical track record, and several types have been triggered since October. The persistent nature of the buying interest has been enough to push one of the broadest measures of breadth to an all-time high. While any indicator can fail, this one has a strong track record of preceding minimal drawdowns for stocks over at least the next six months.
Indicators at Extremes
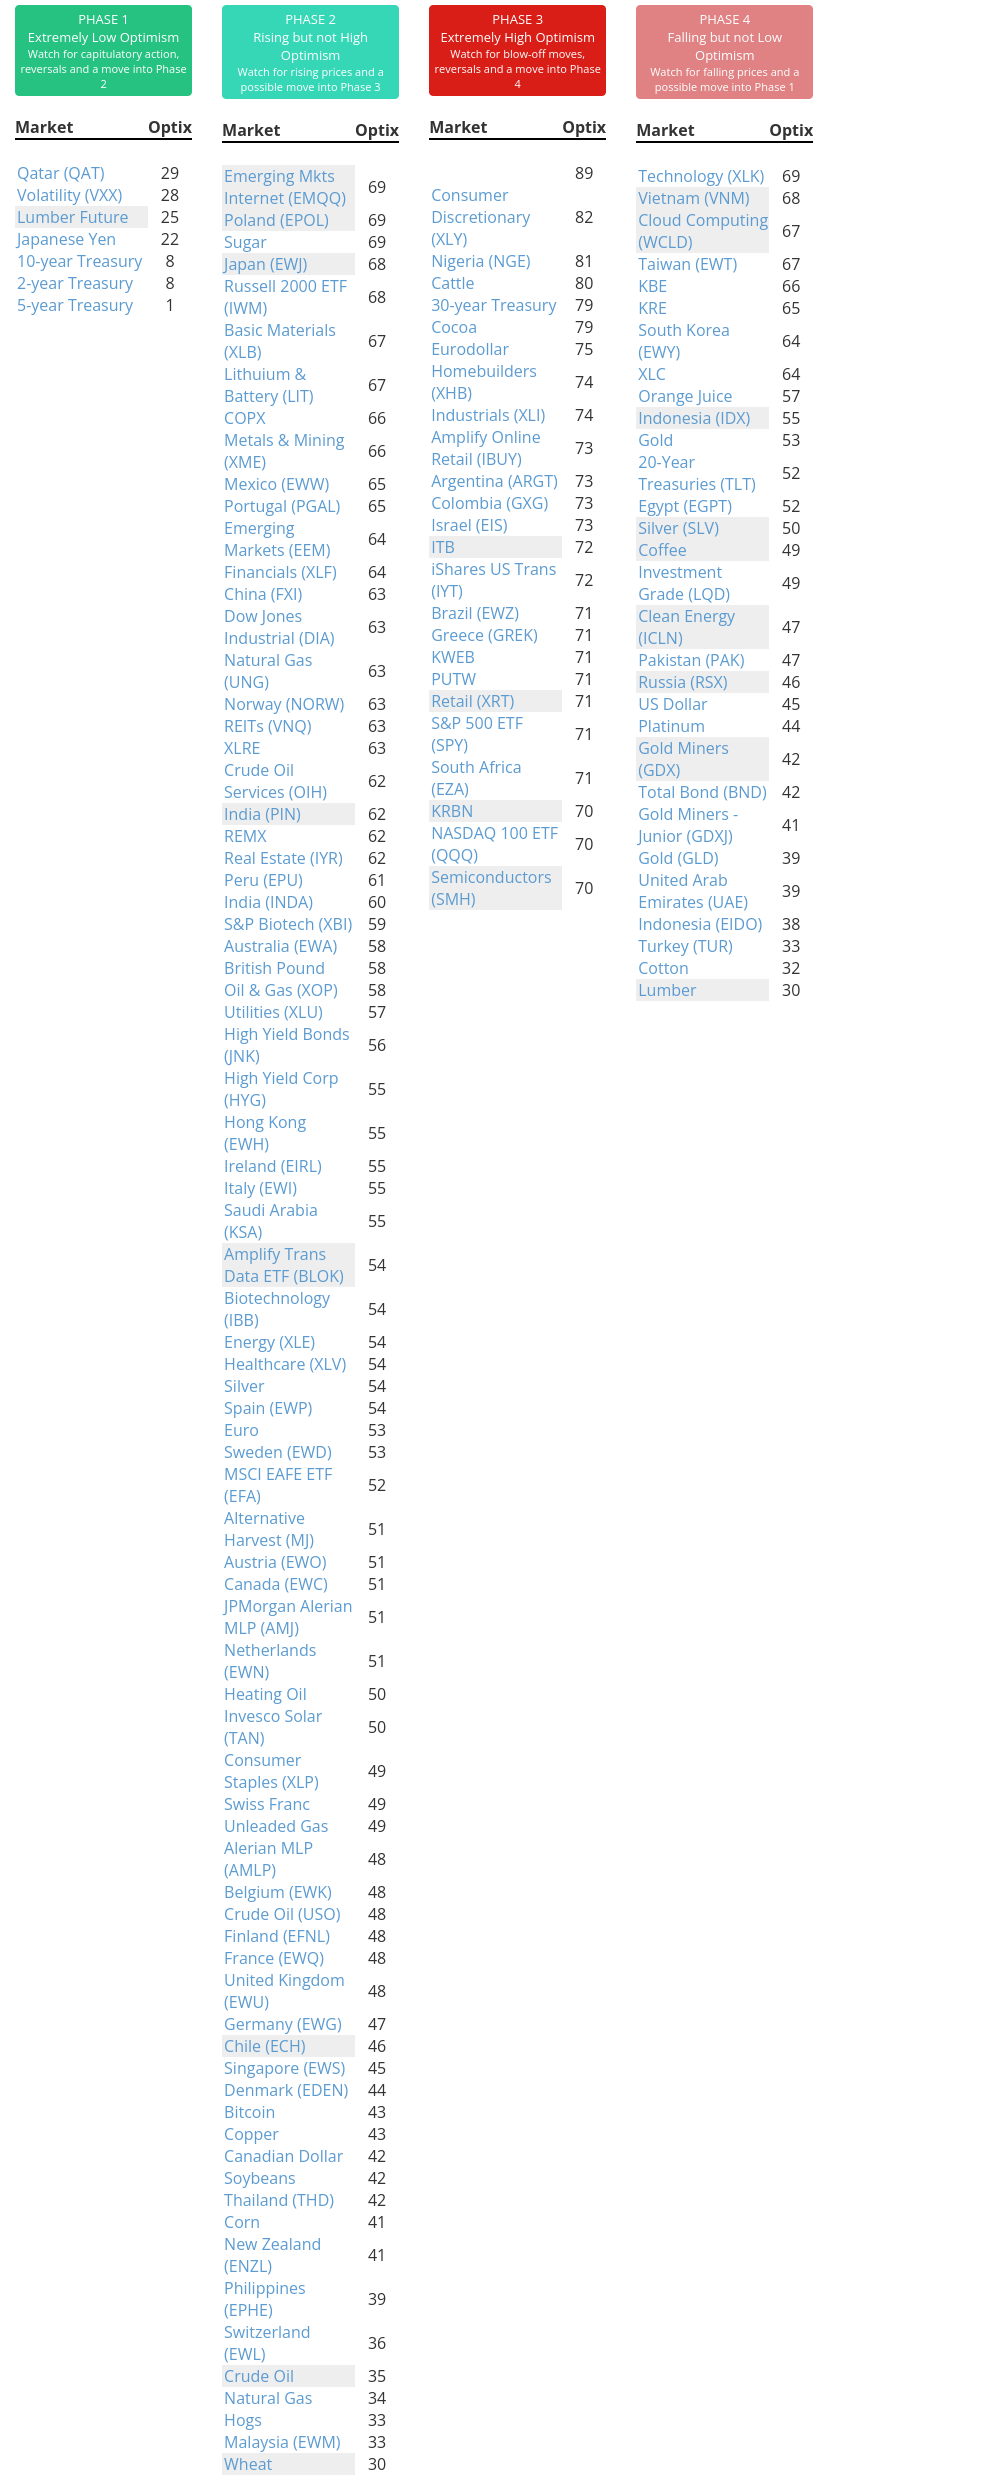
Phase Table
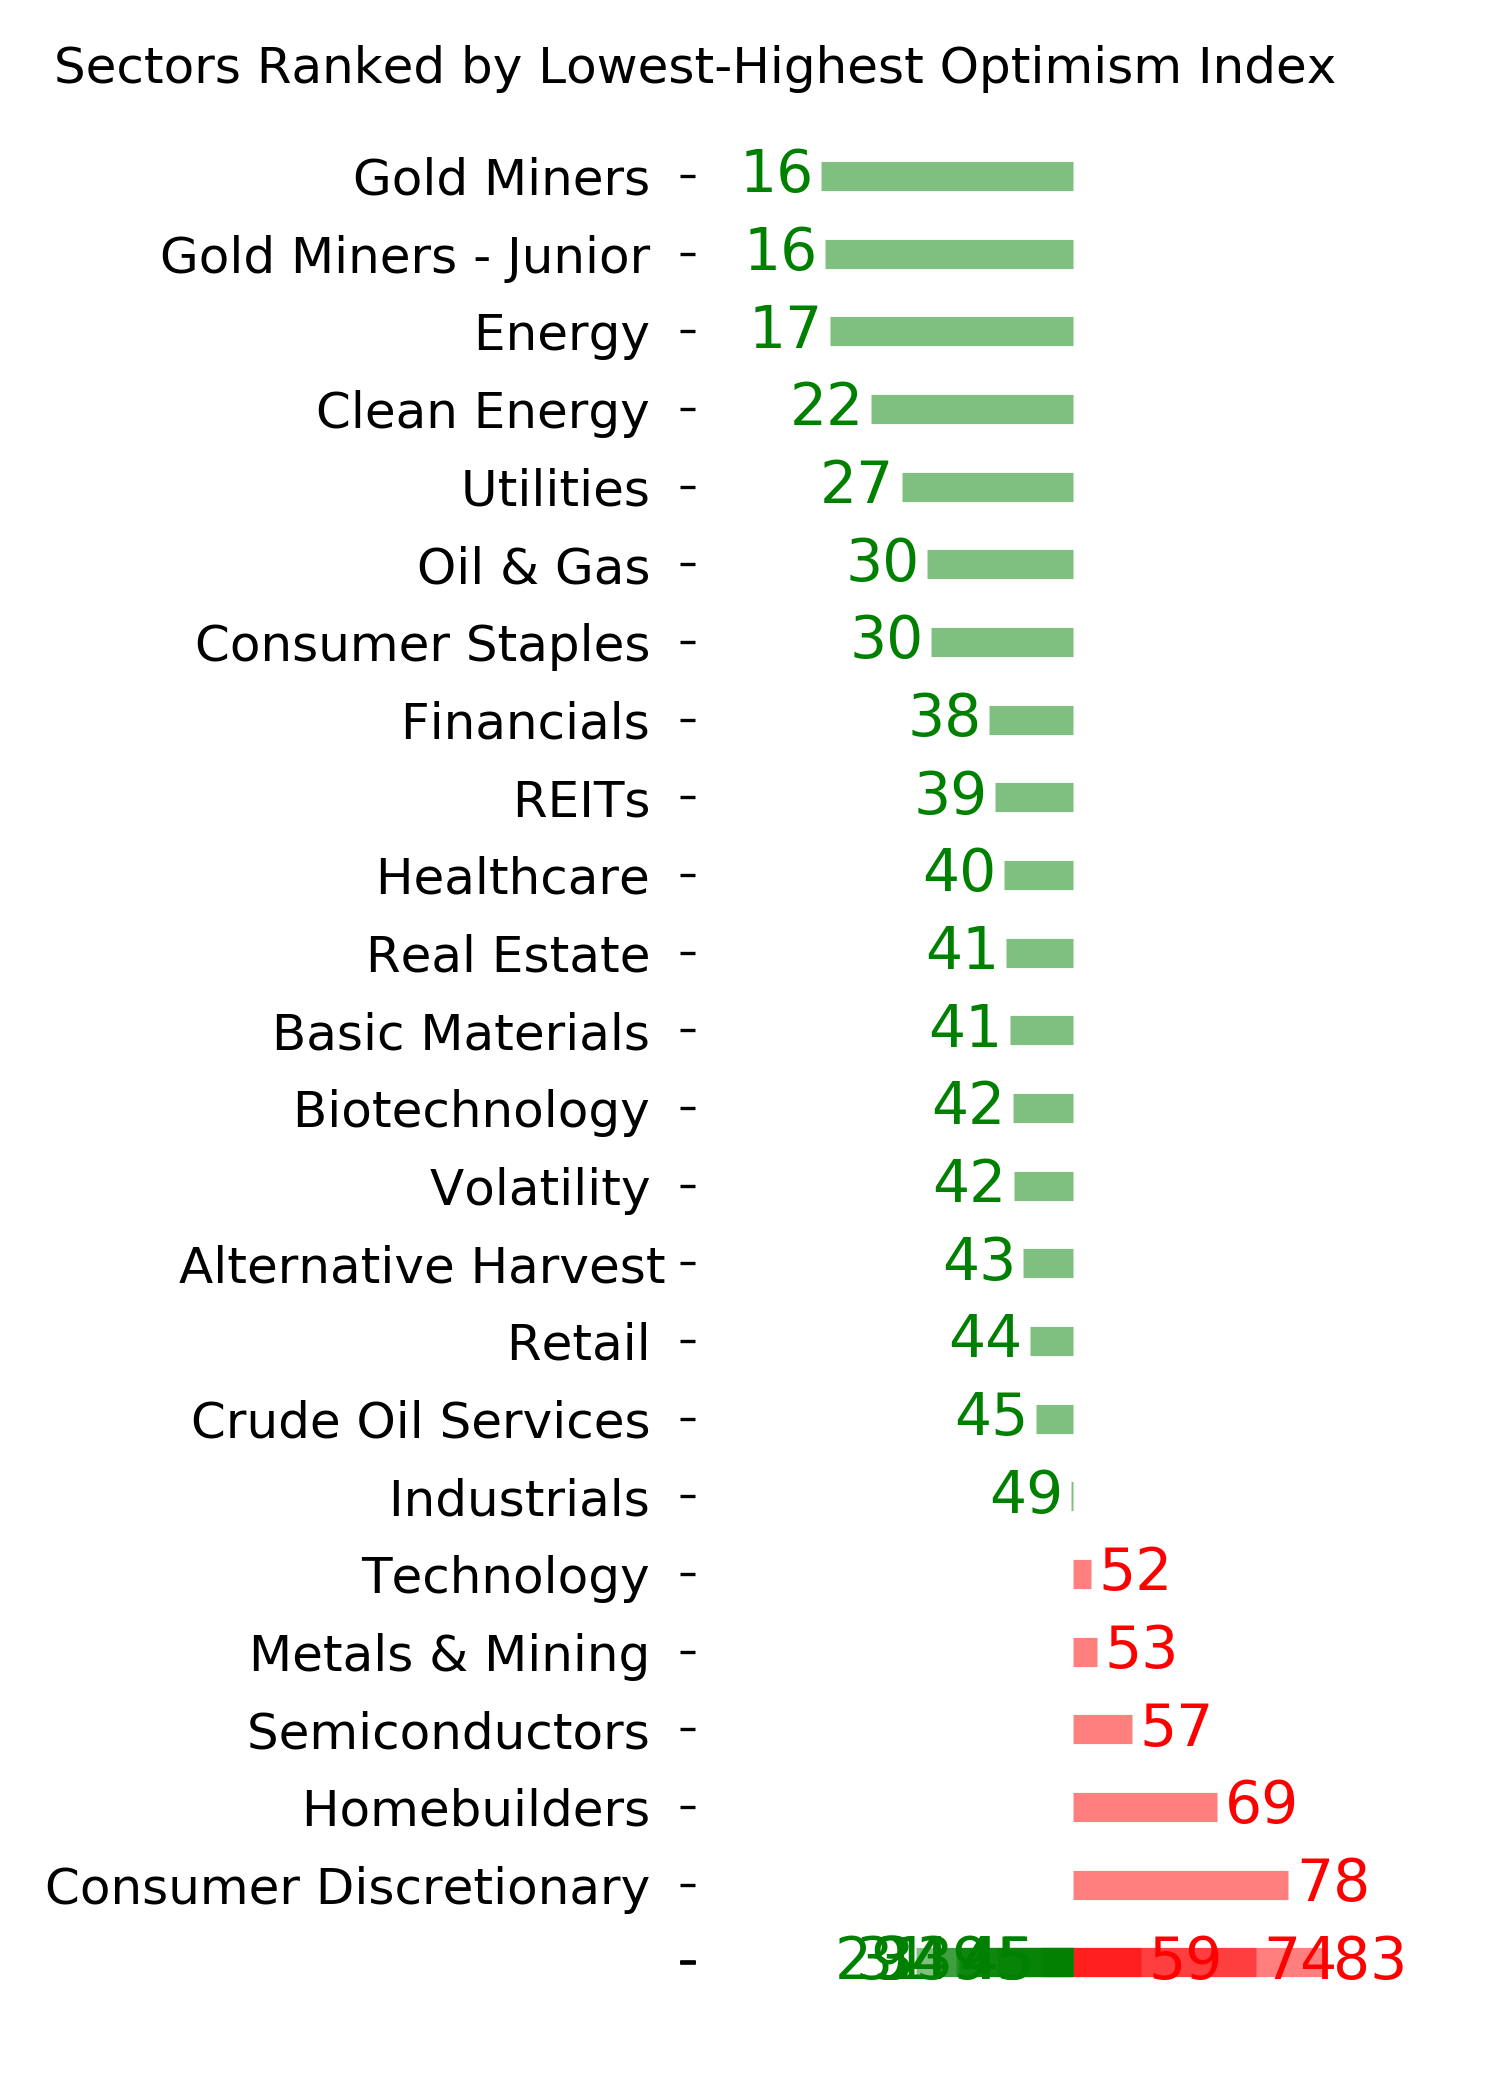
Ranks
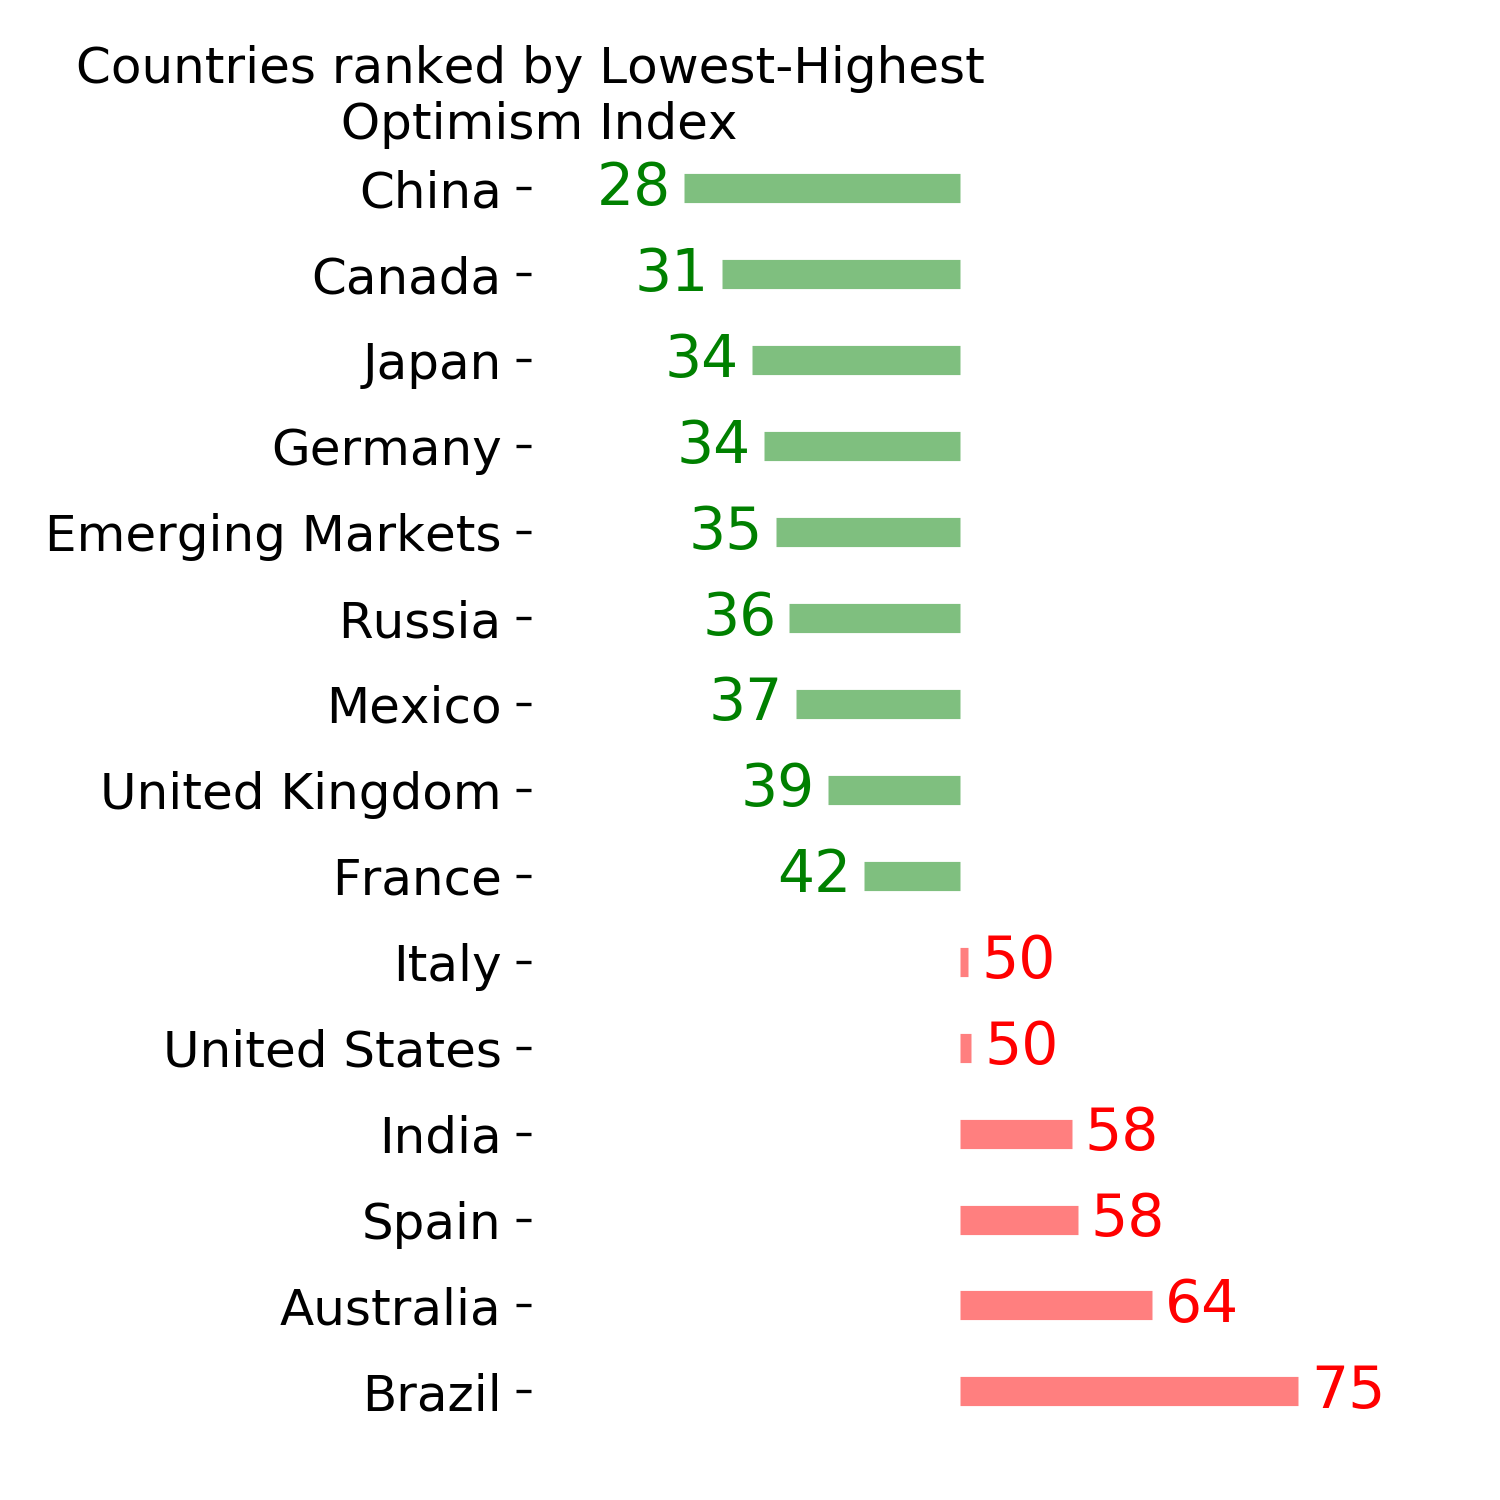
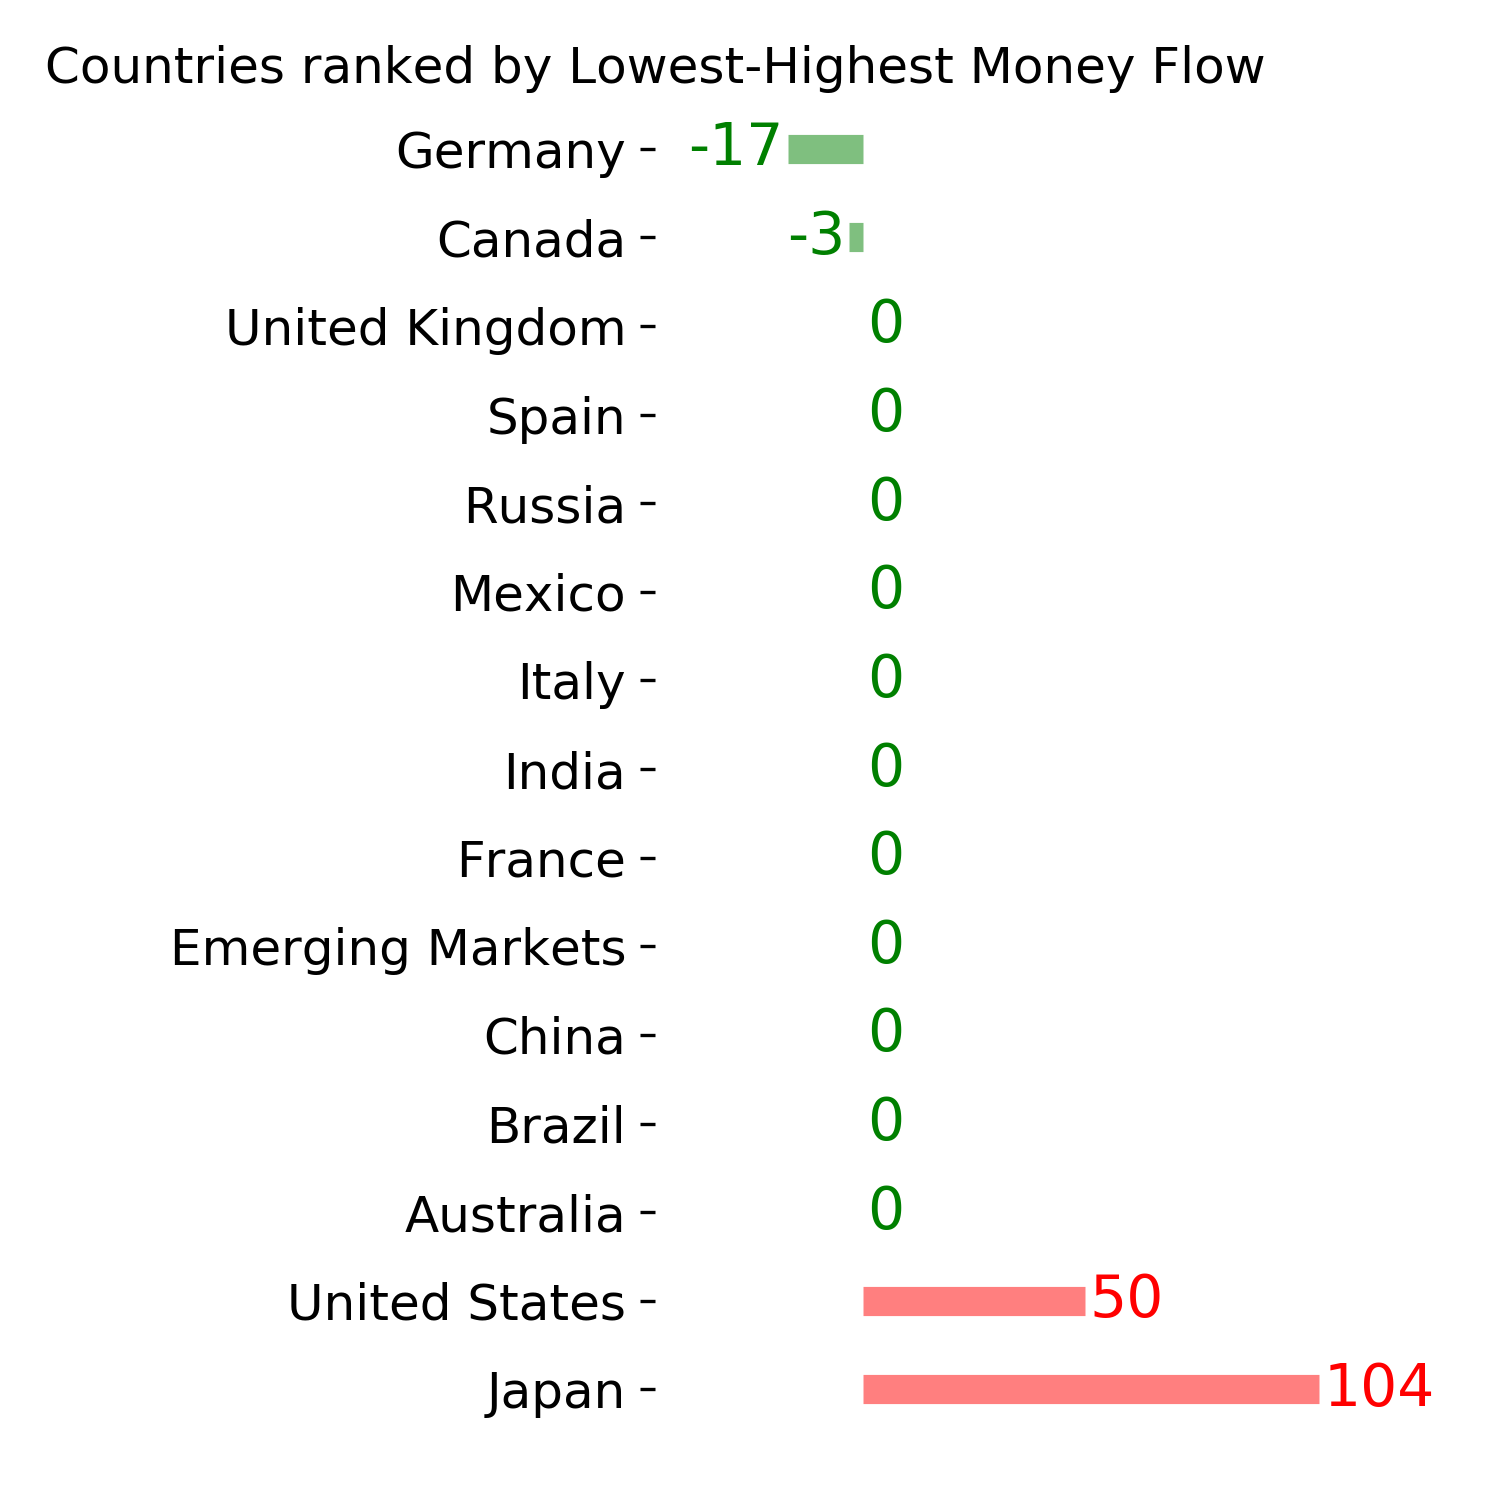
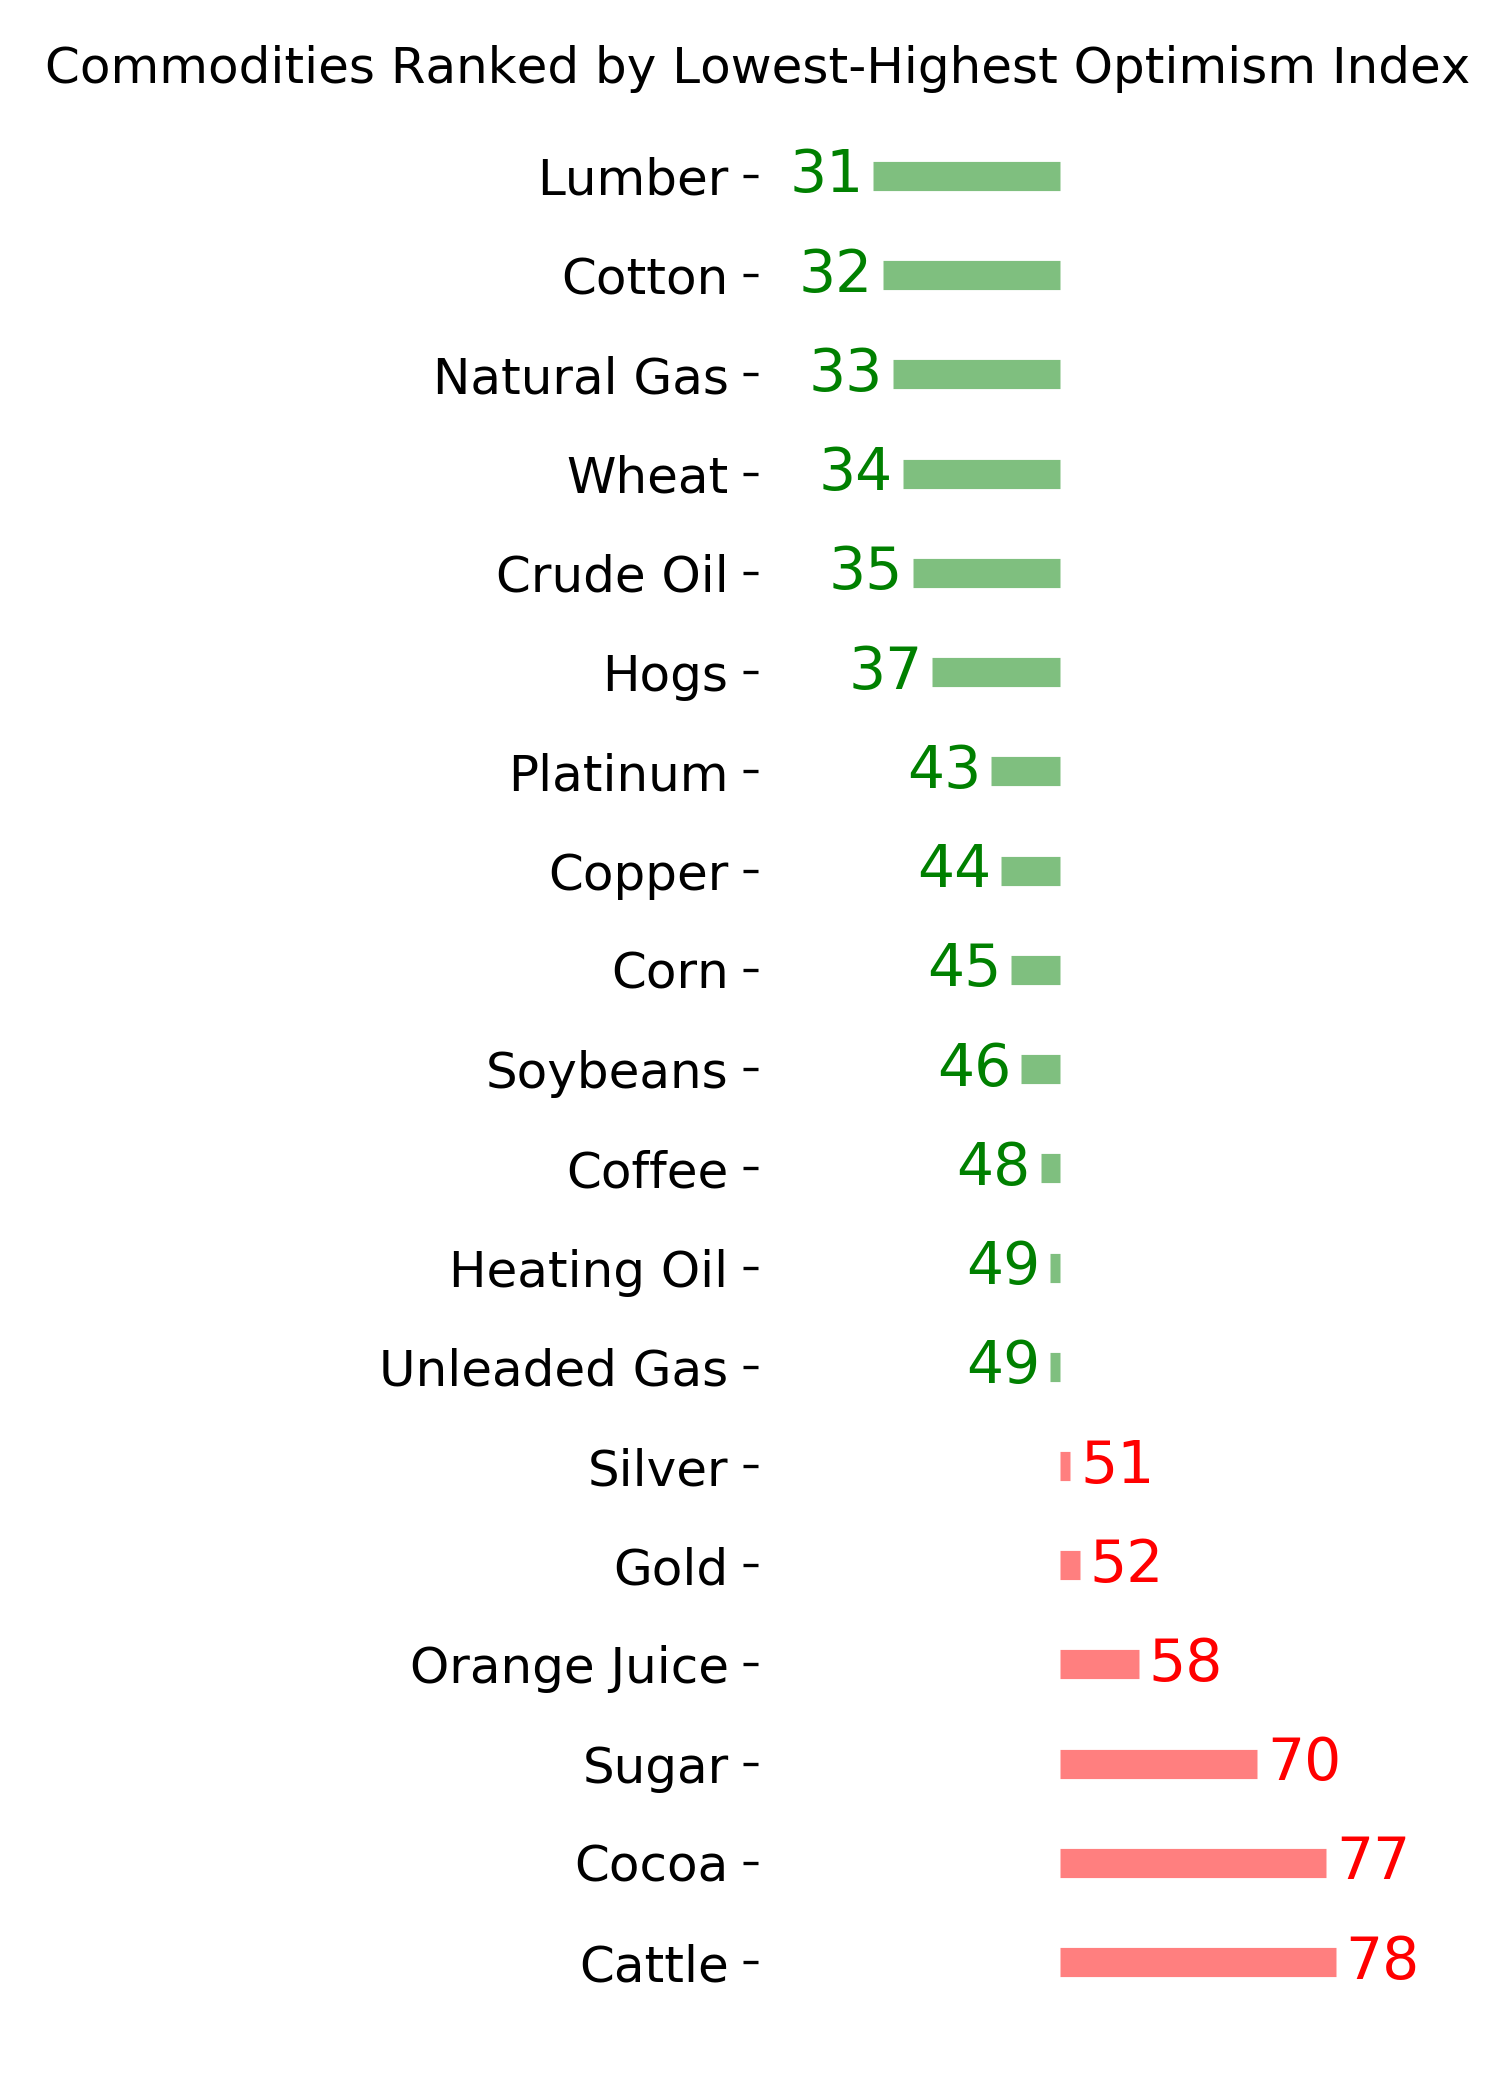
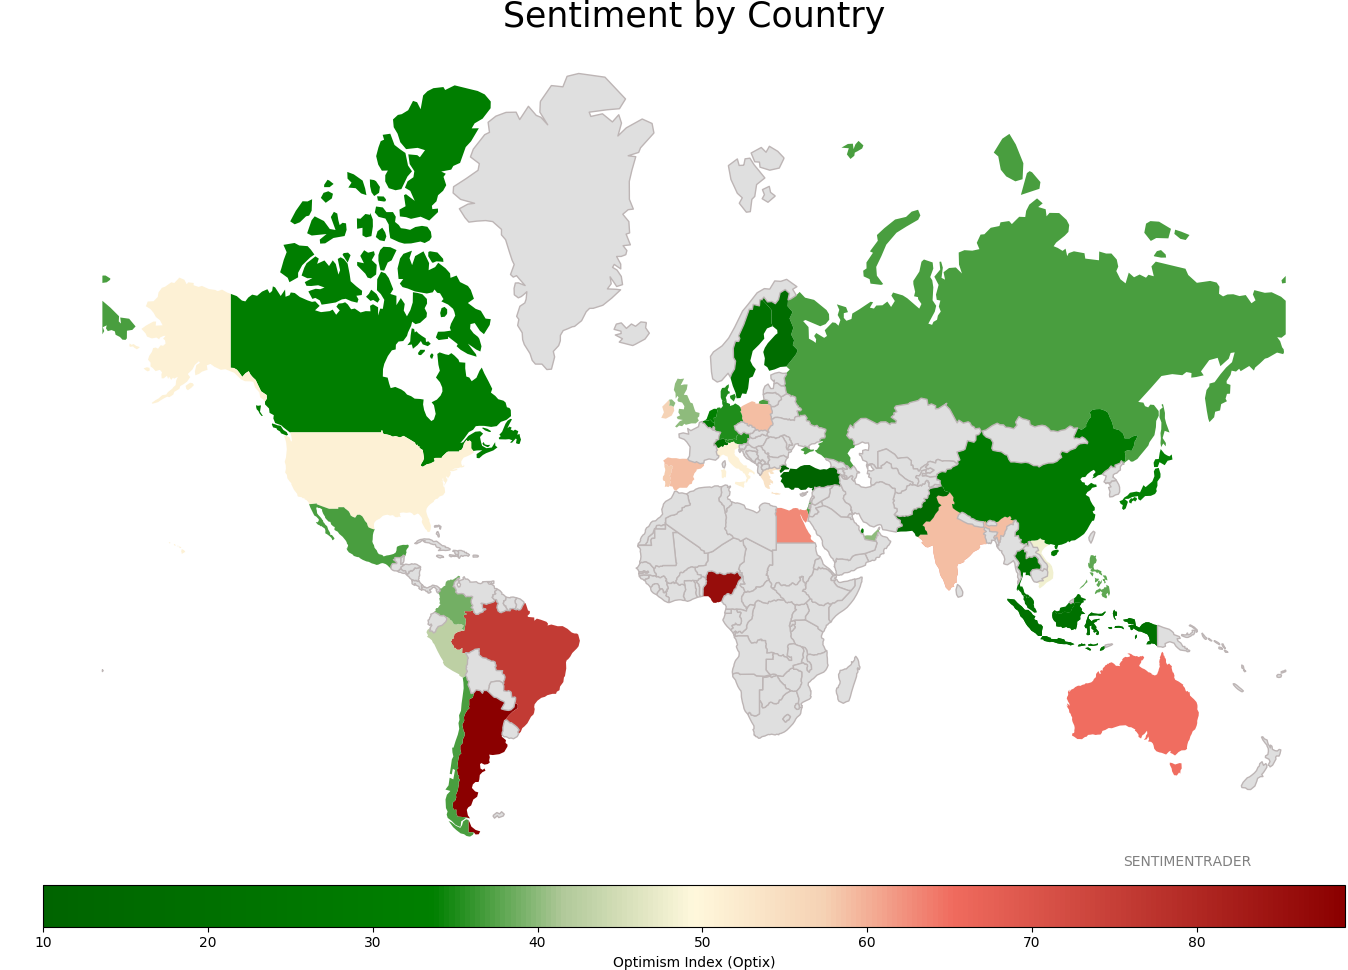
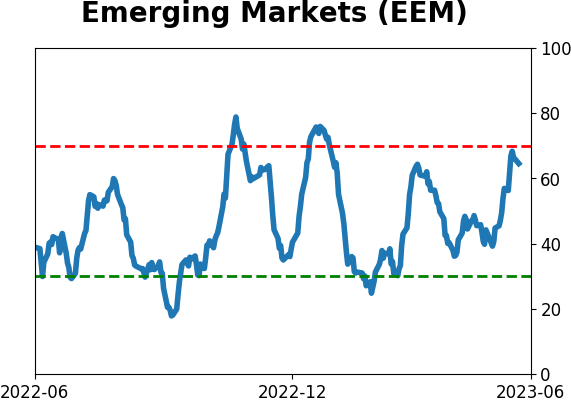
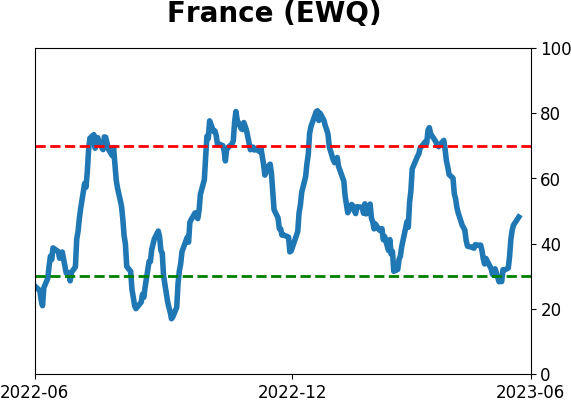
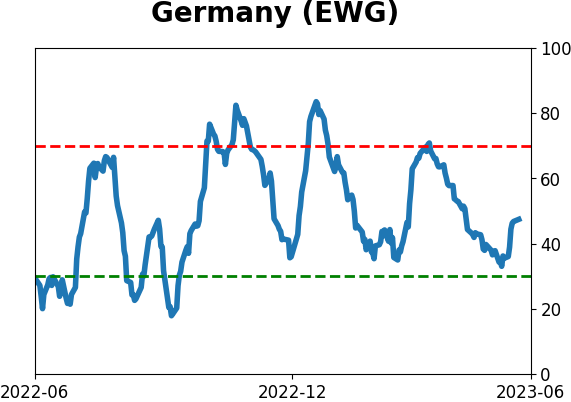
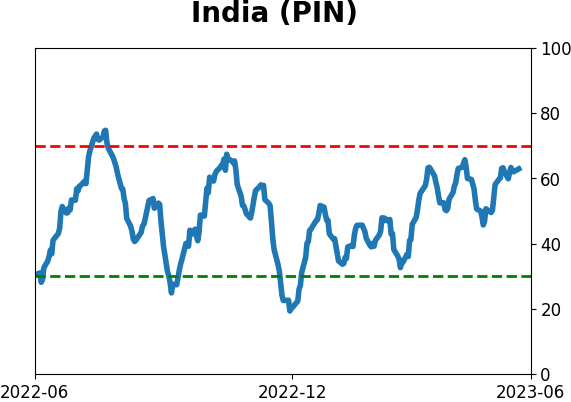
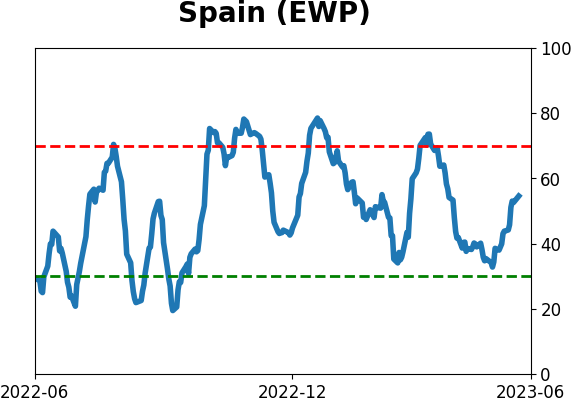
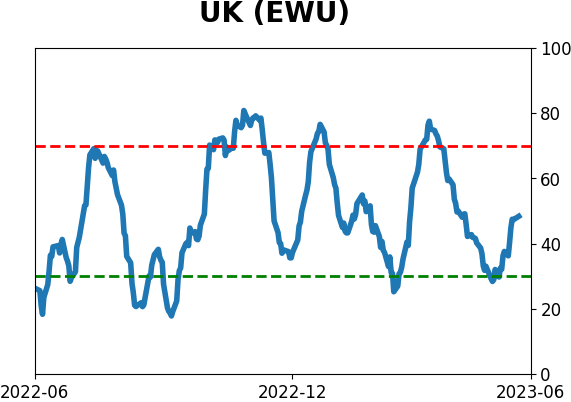
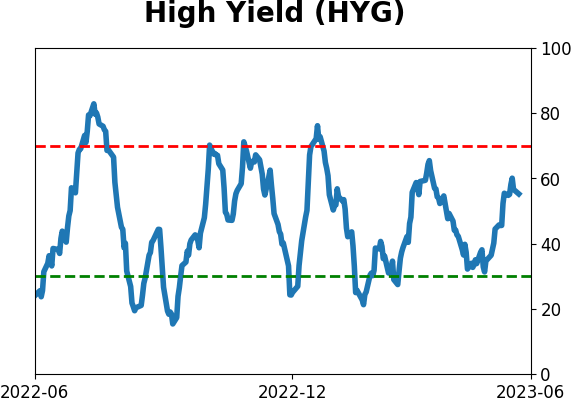
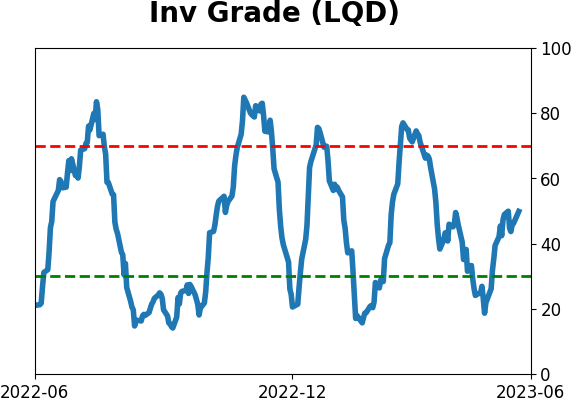
Sentiment Around The World
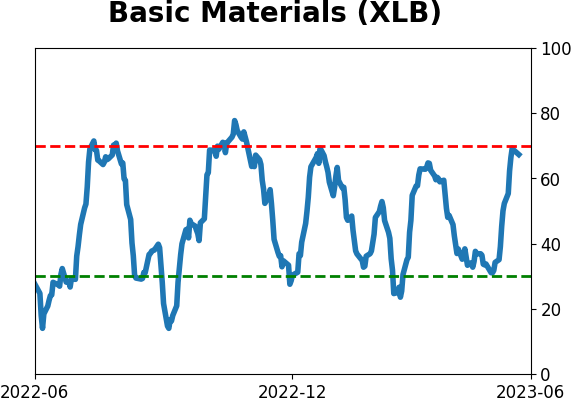
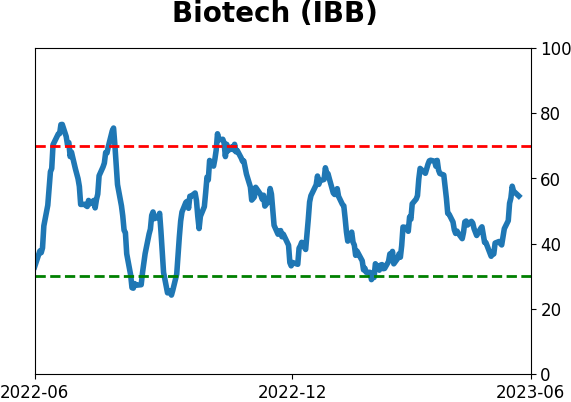
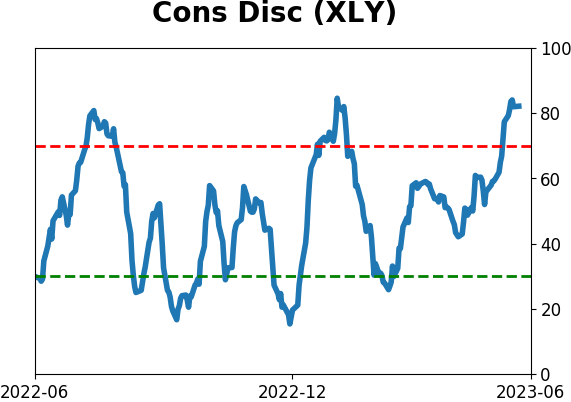
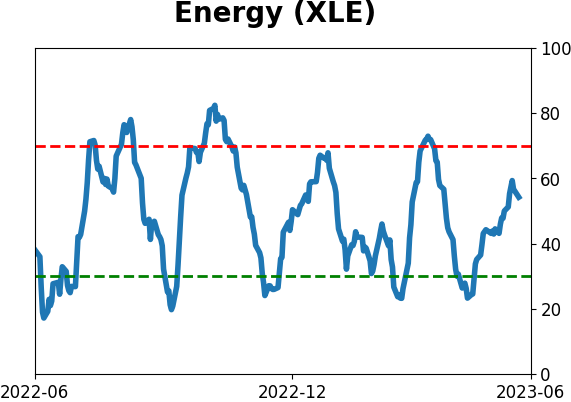
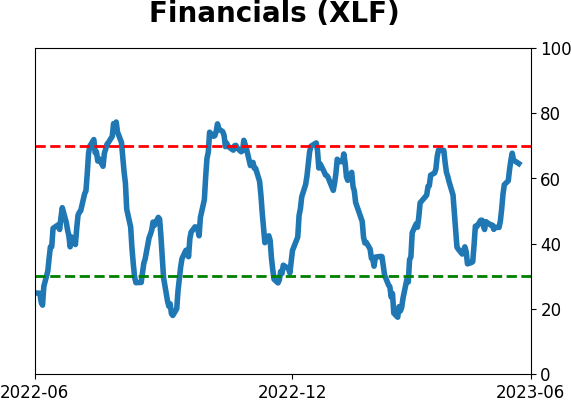
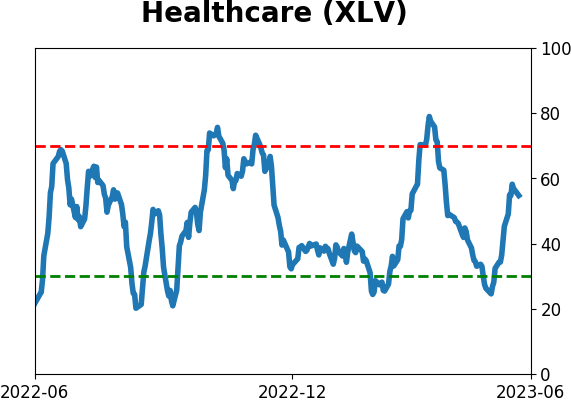
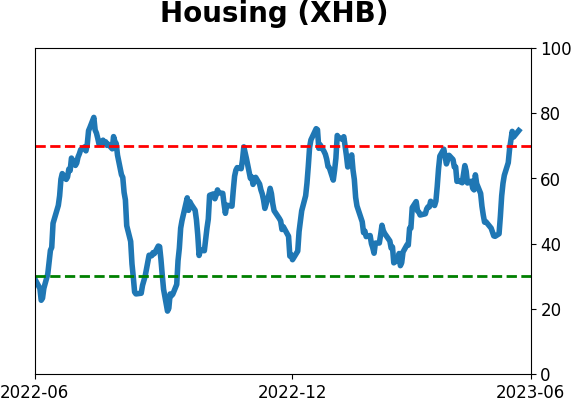
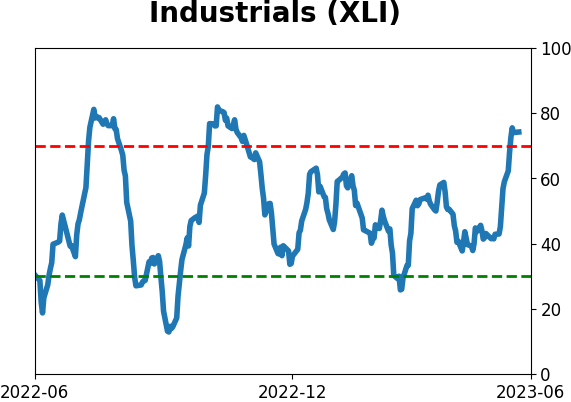
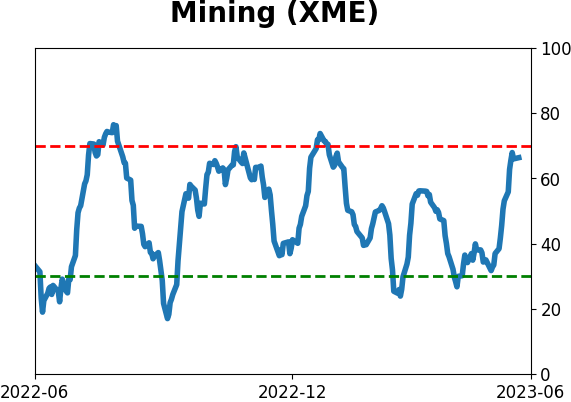
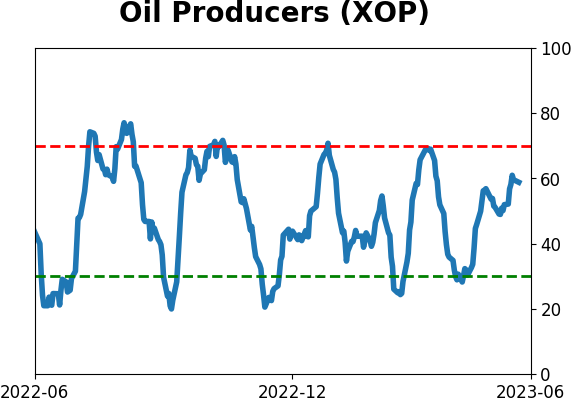
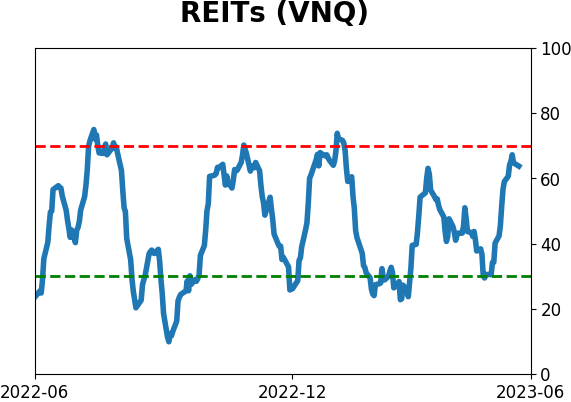
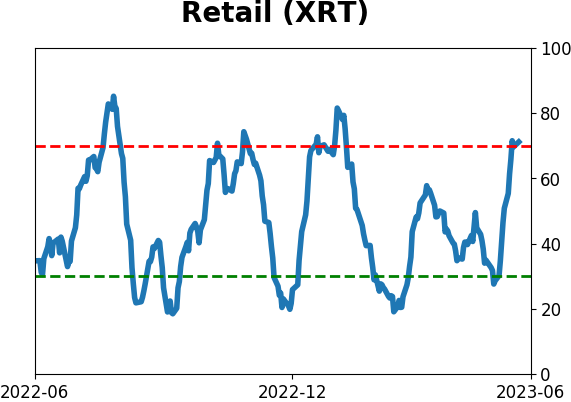
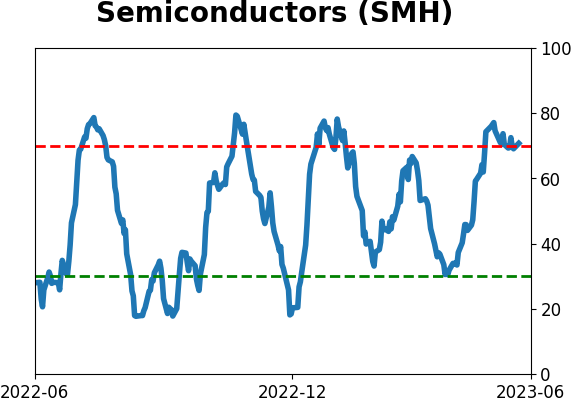
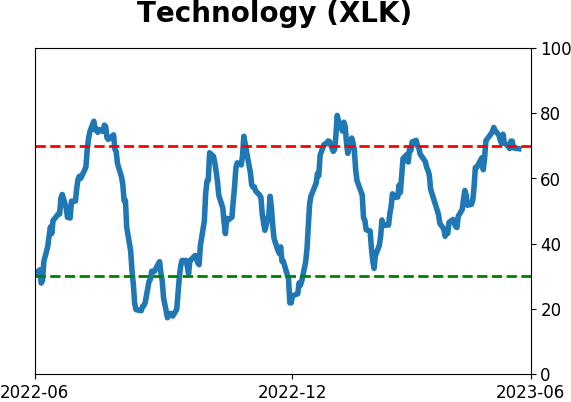
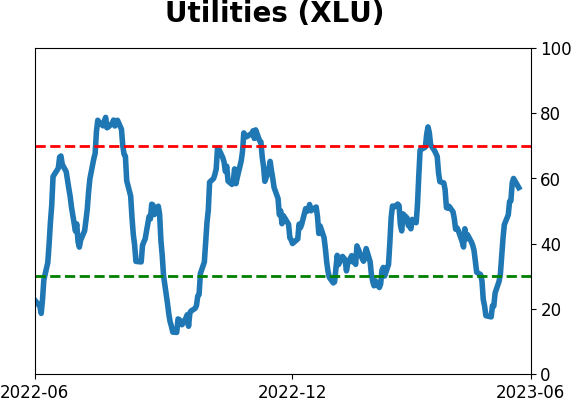
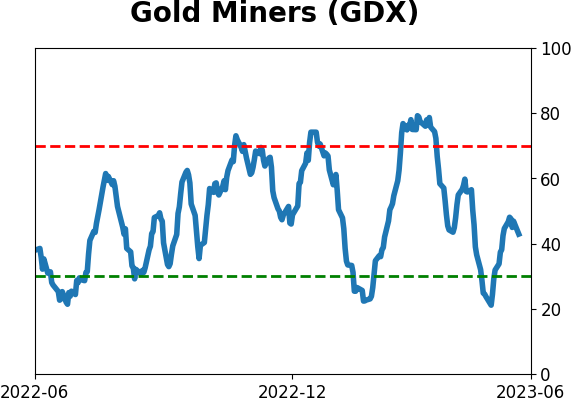
Optimism Index Thumbnails
|
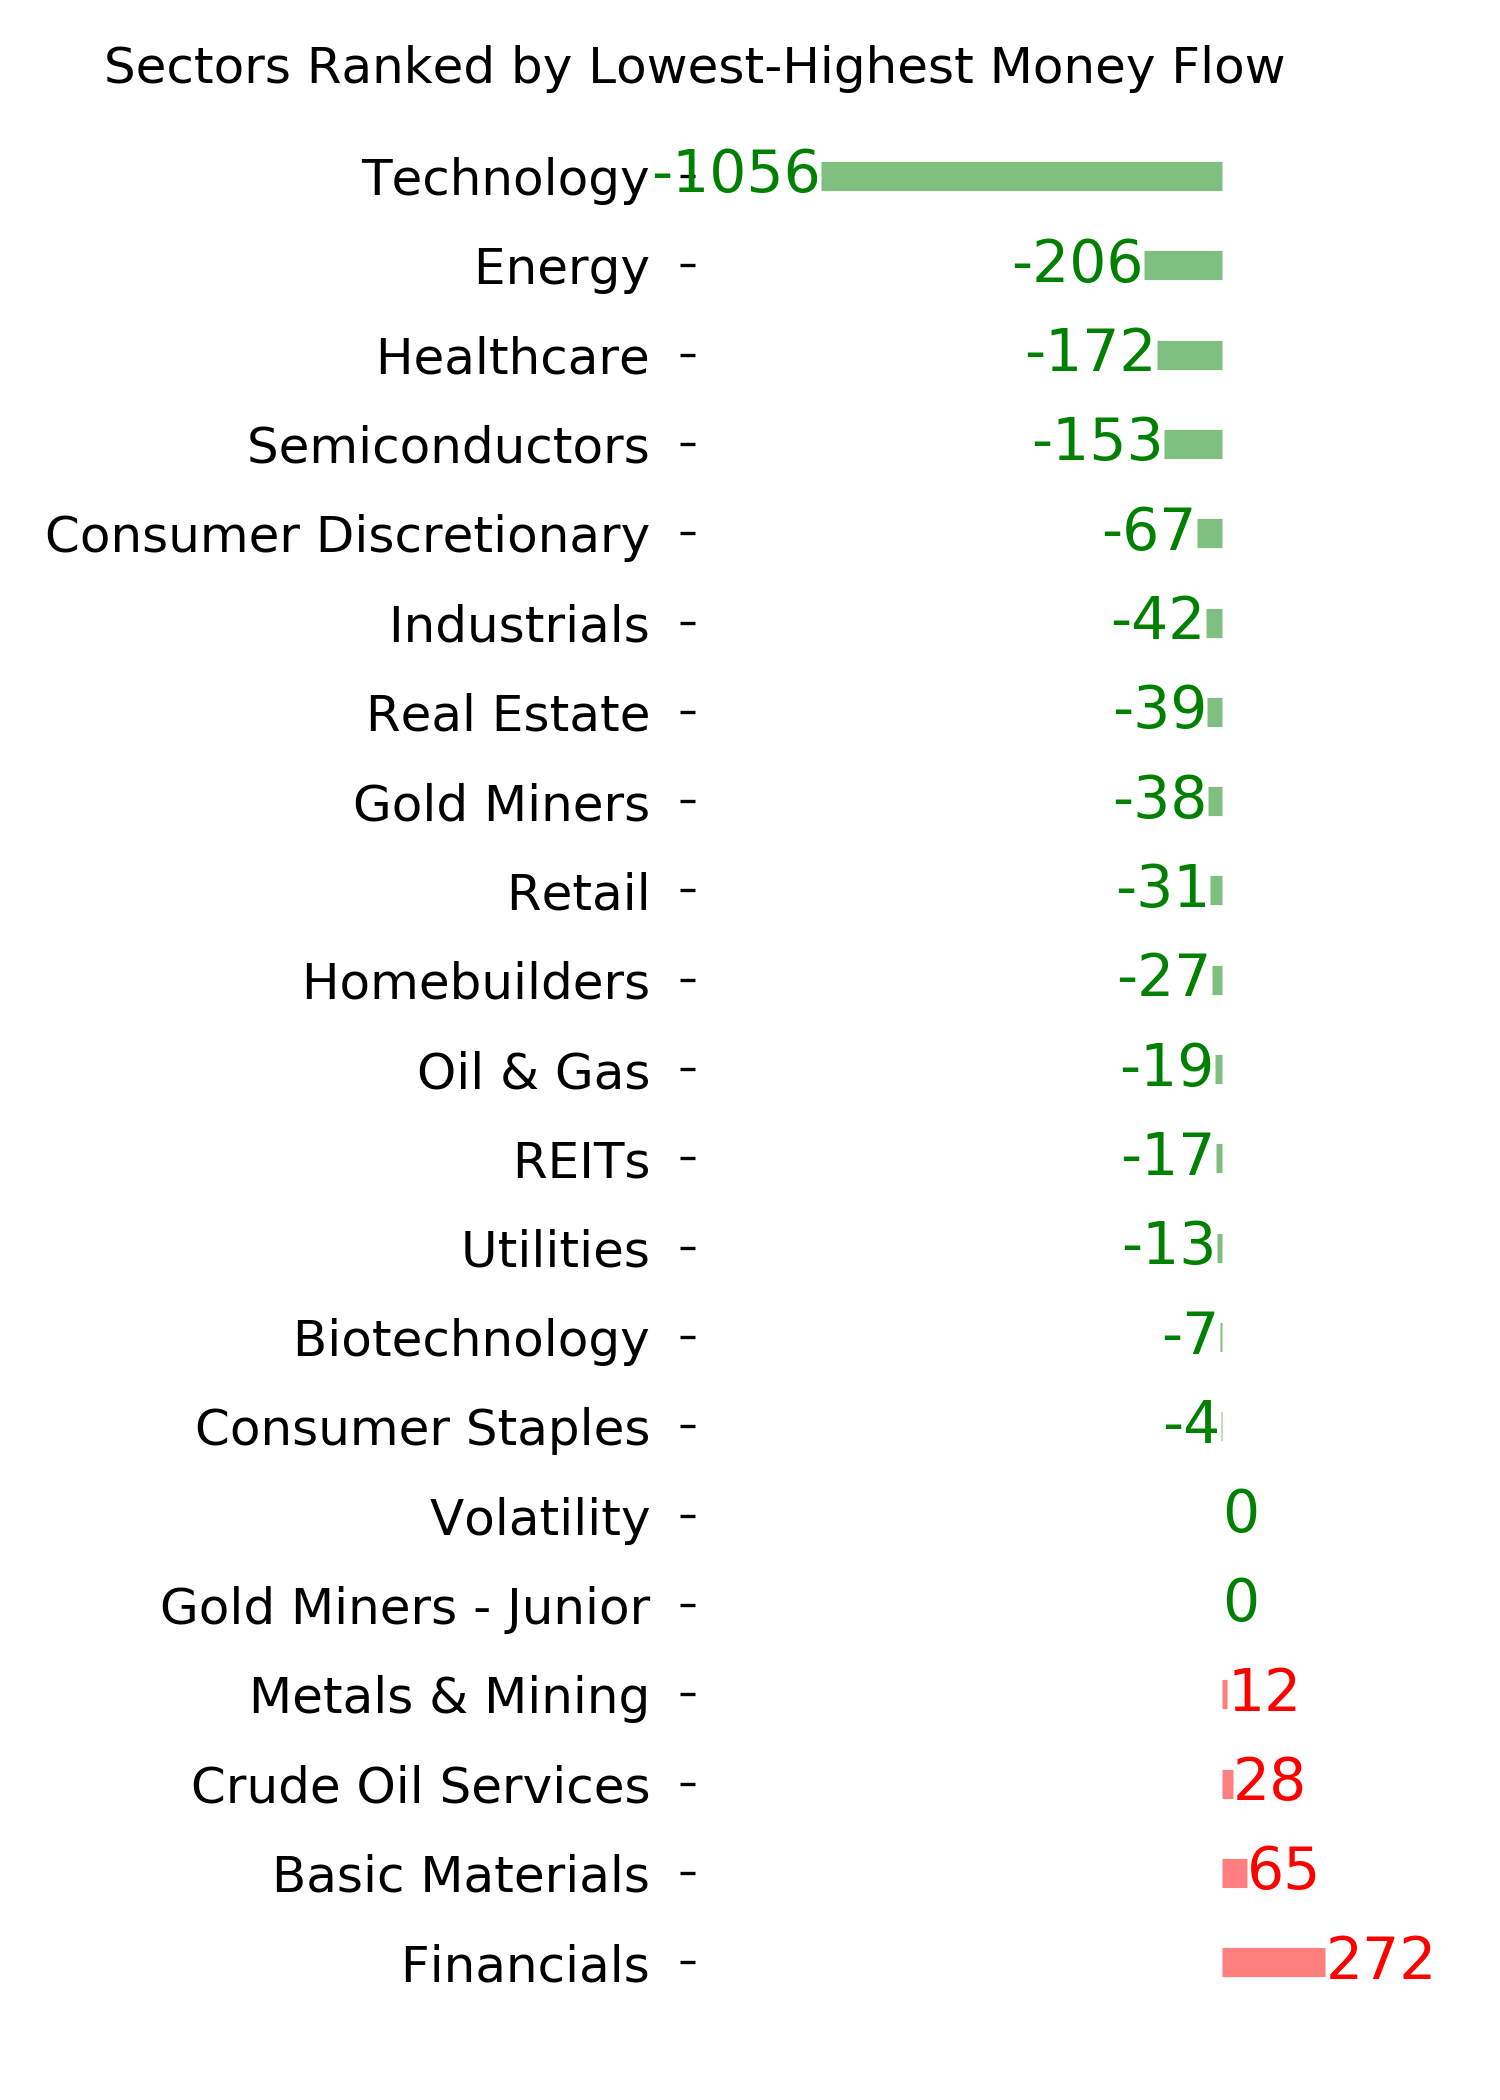
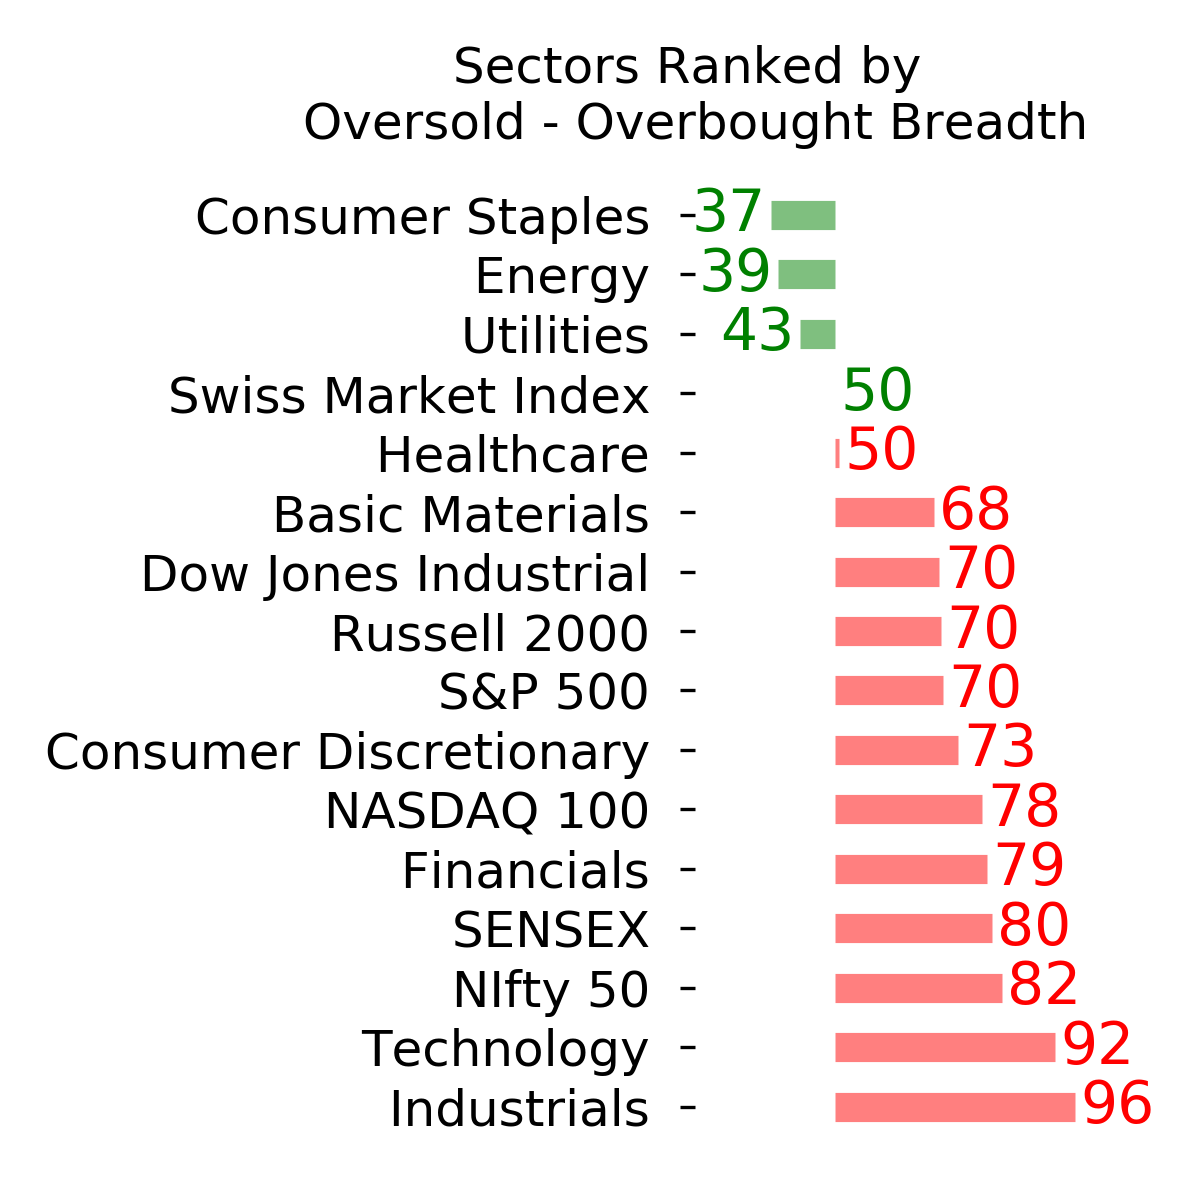
Sector ETF's - 10-Day Moving Average
|
|
|
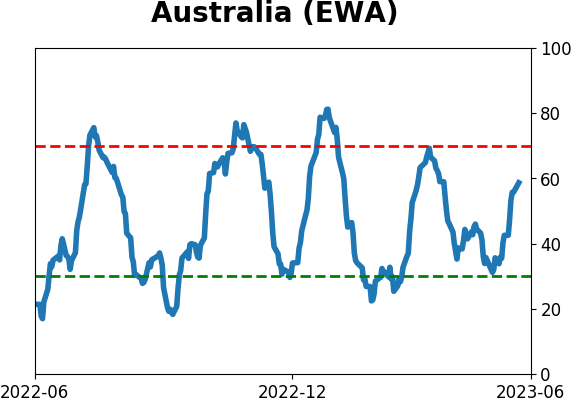
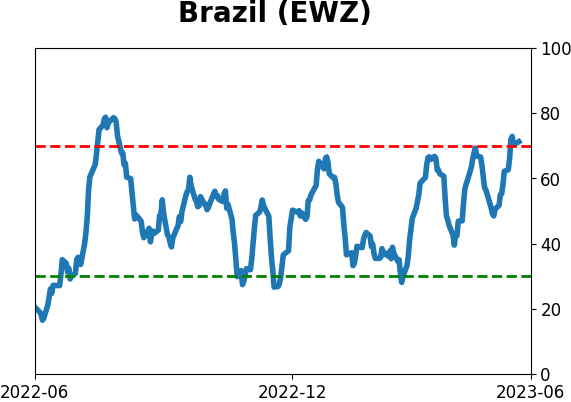
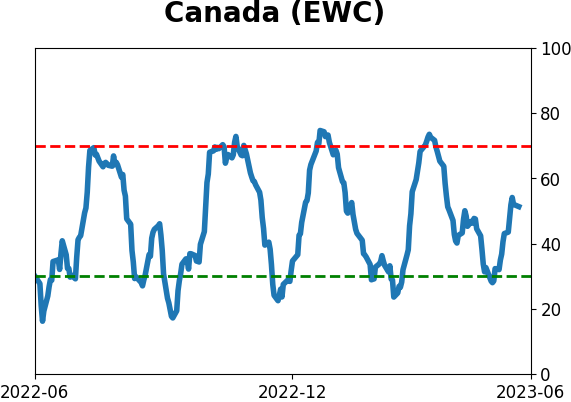
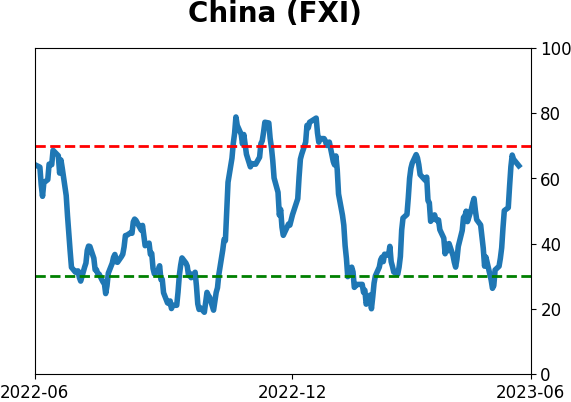
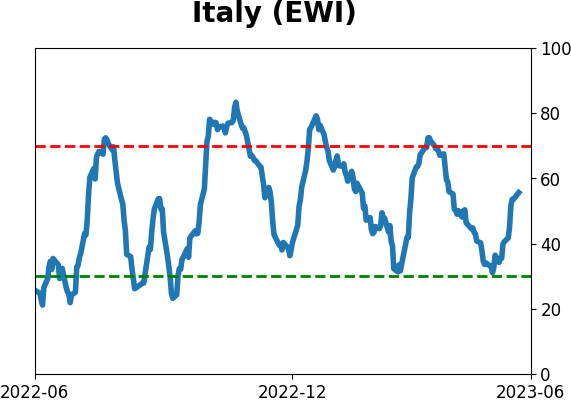
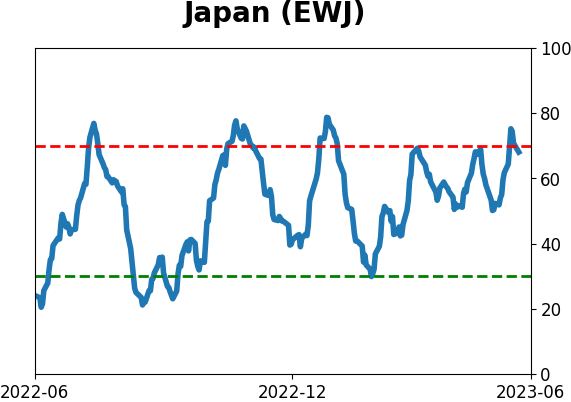
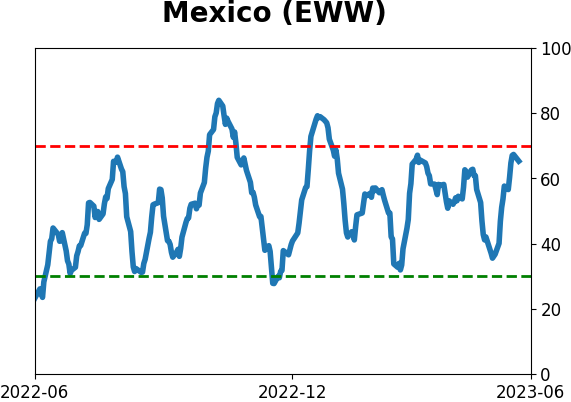
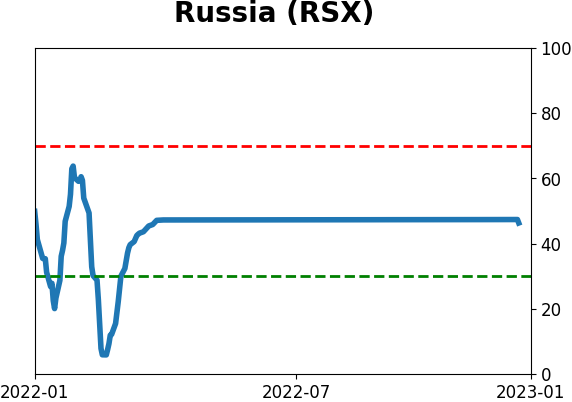
Country ETF's - 10-Day Moving Average
|
|
|
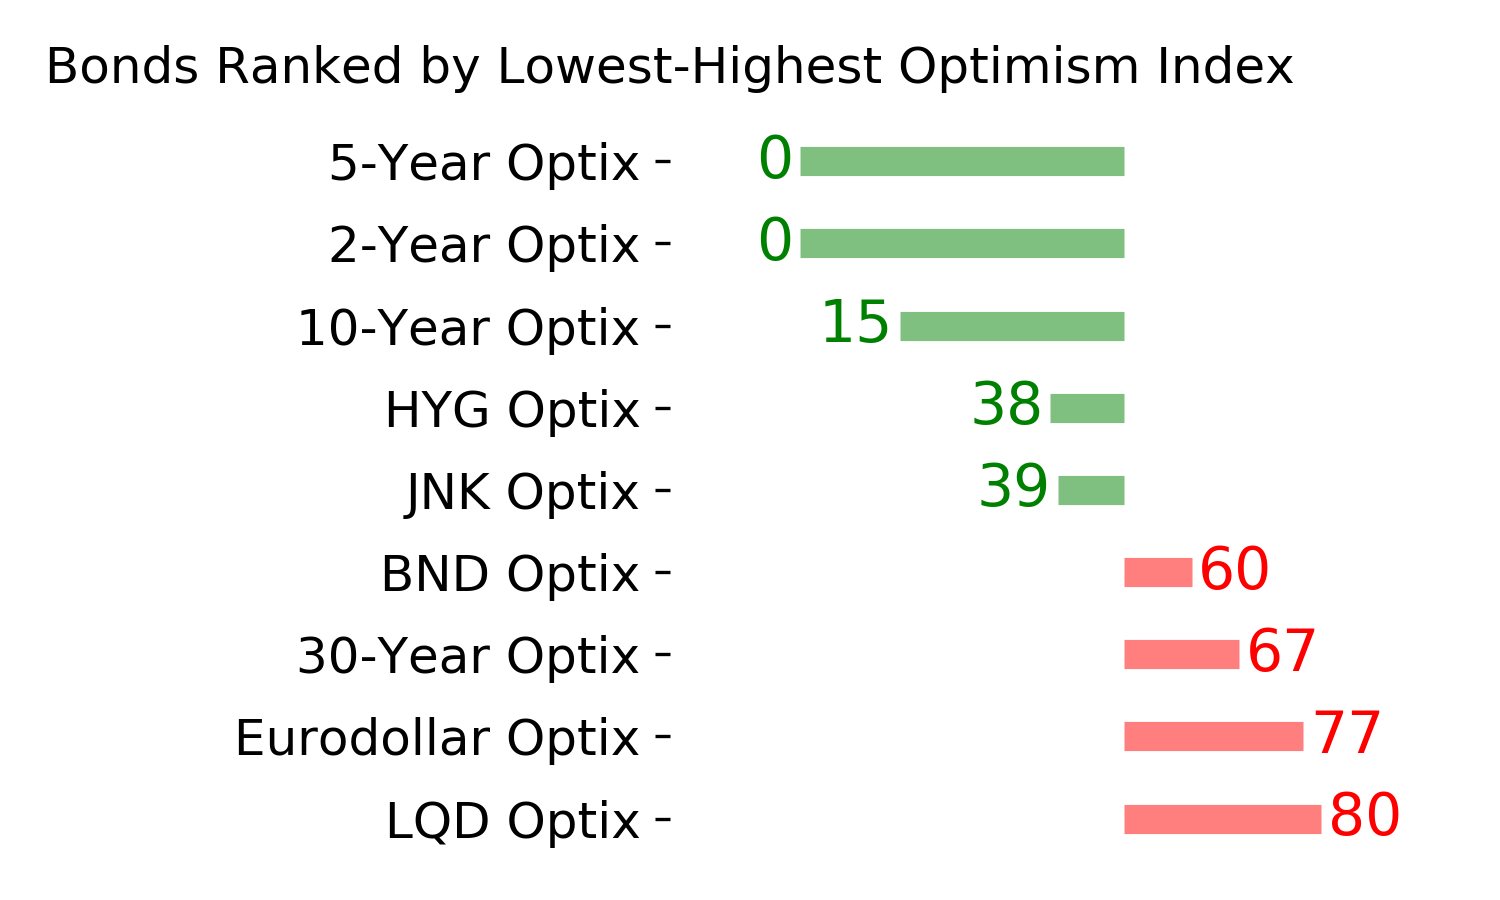
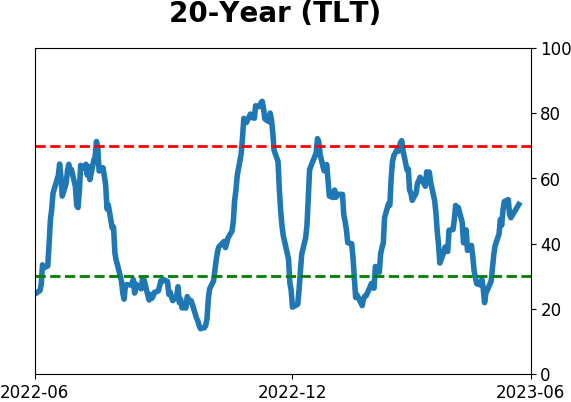
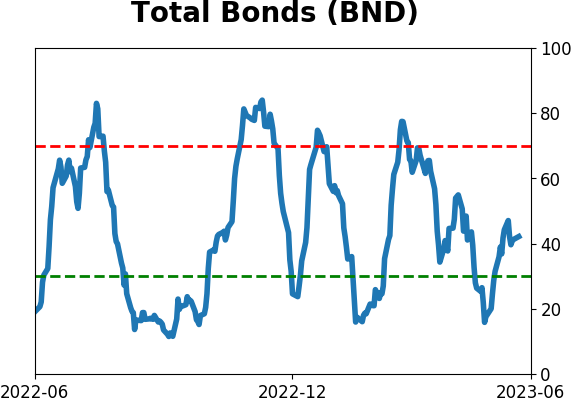
Bond ETF's - 10-Day Moving Average
|
|
|
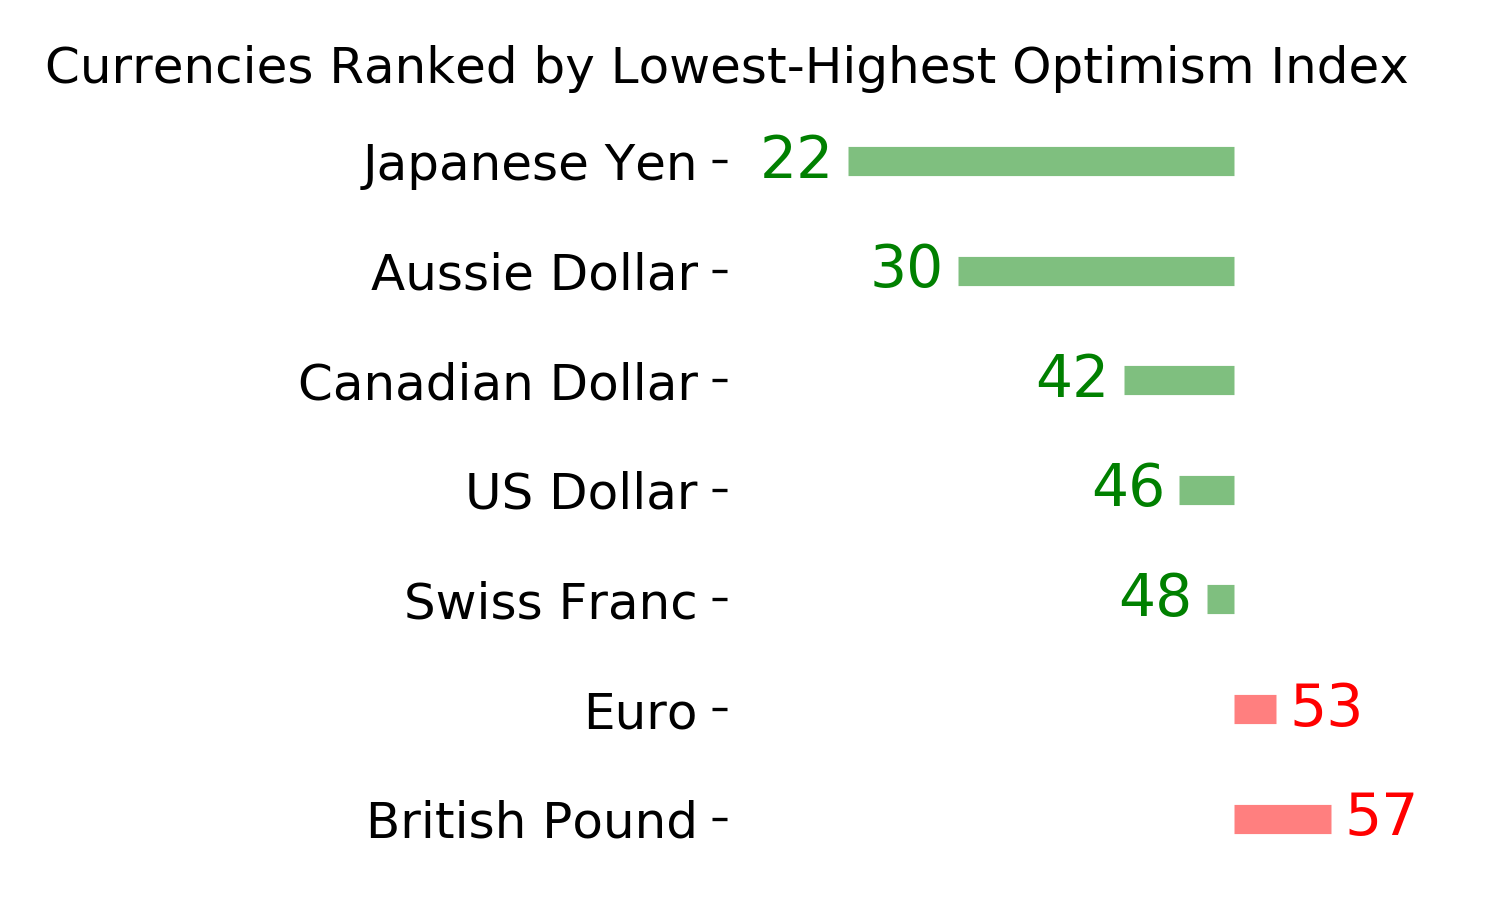
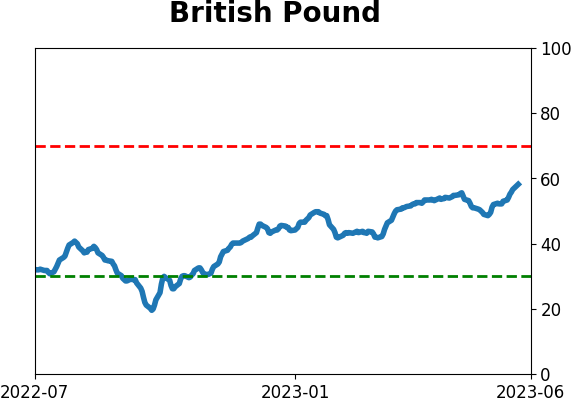
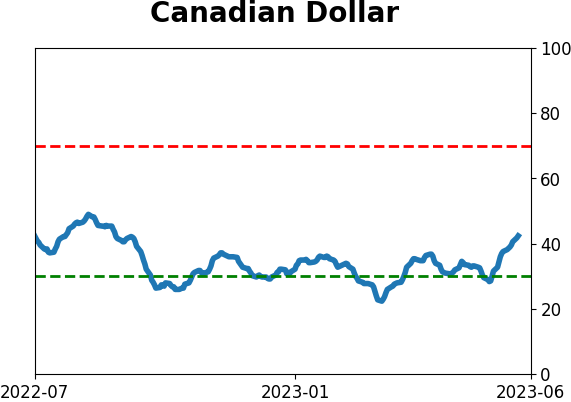
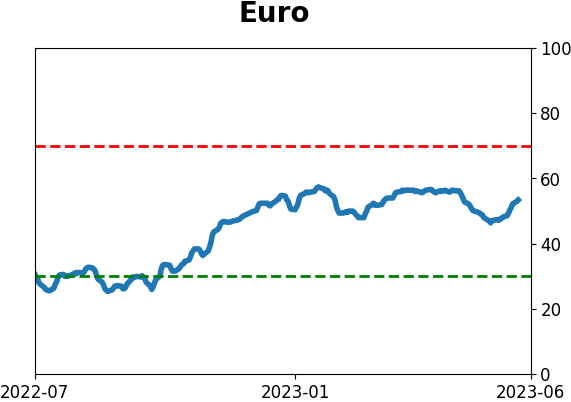
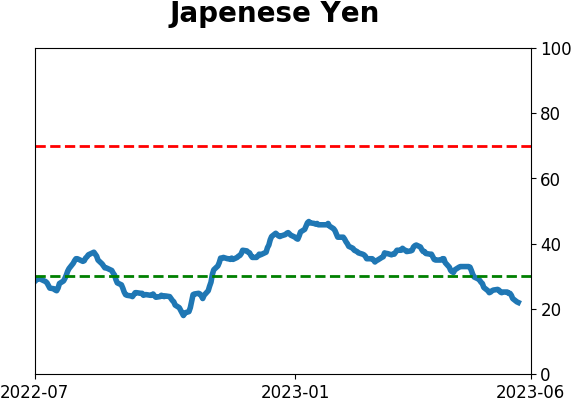
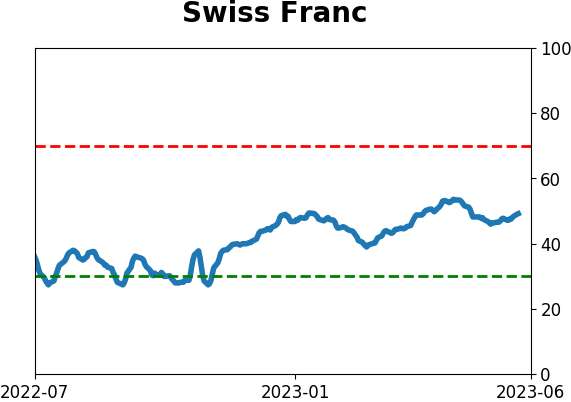
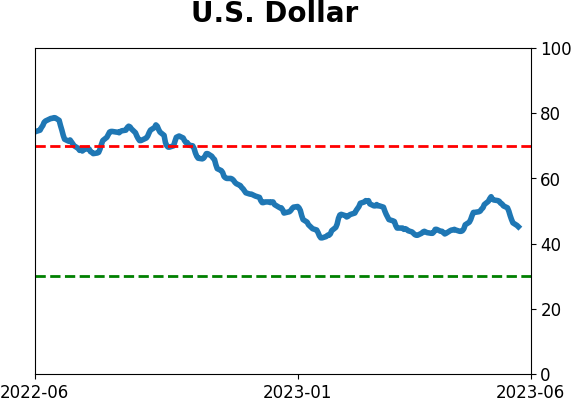
Currency ETF's - 5-Day Moving Average
|
|
|
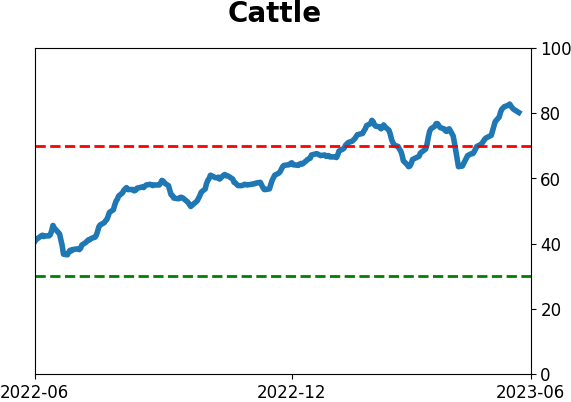
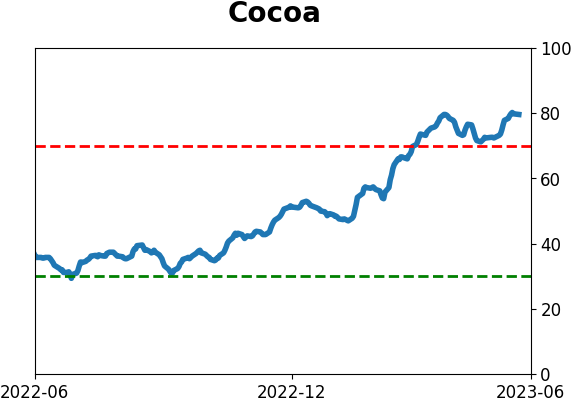
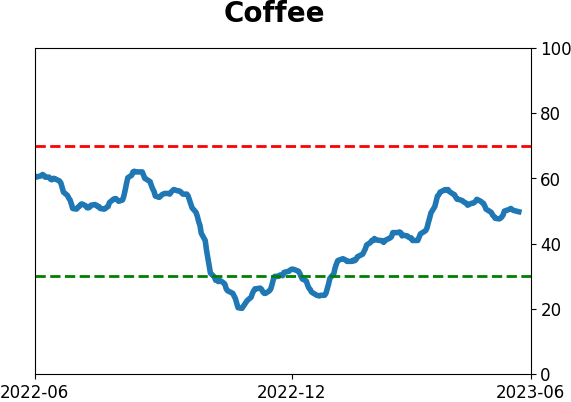
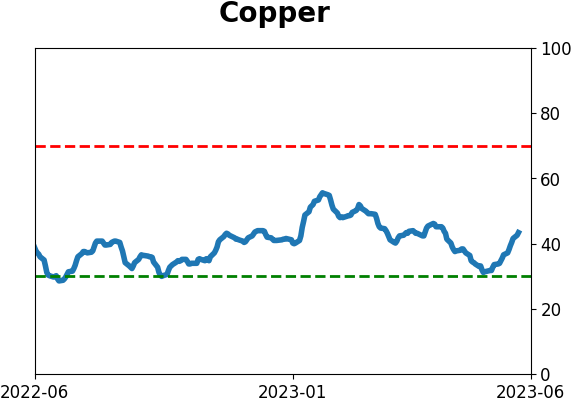
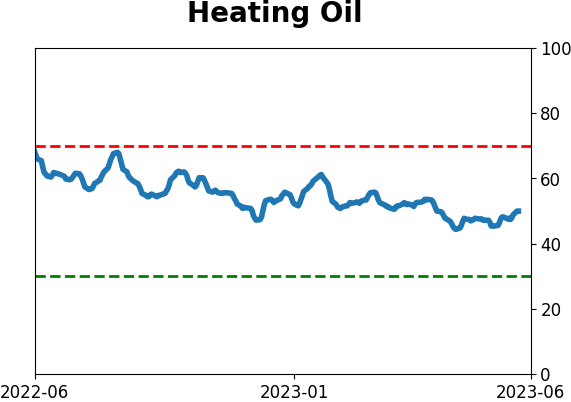
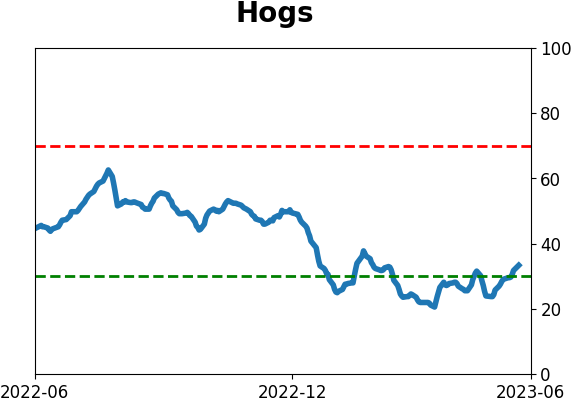
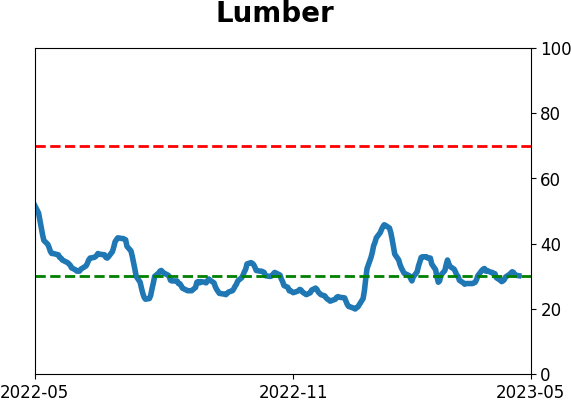
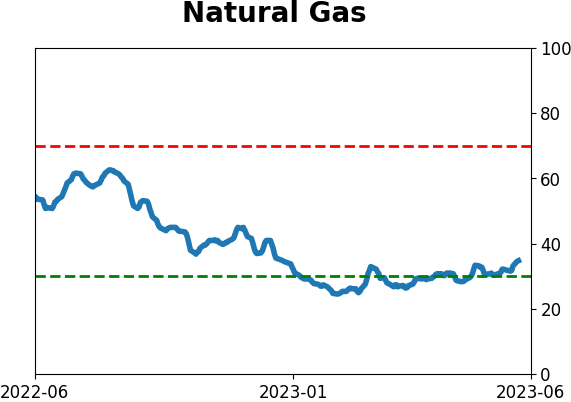
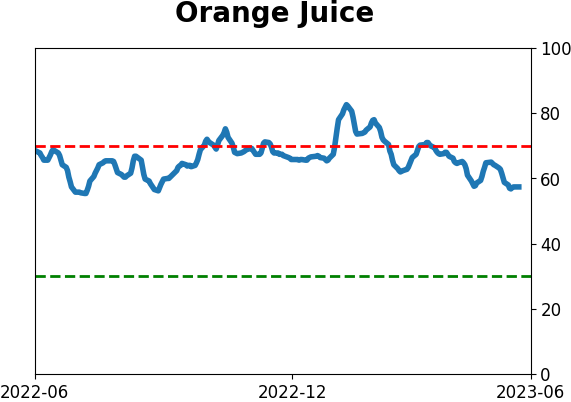
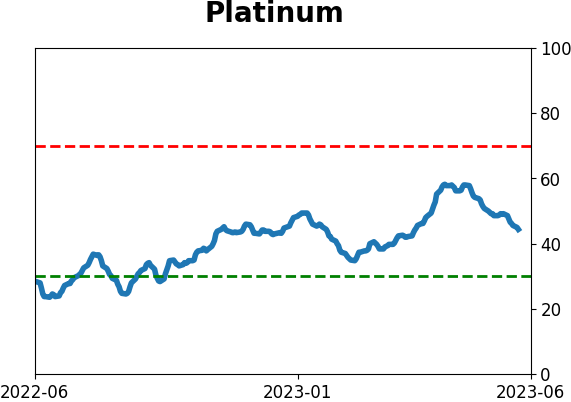
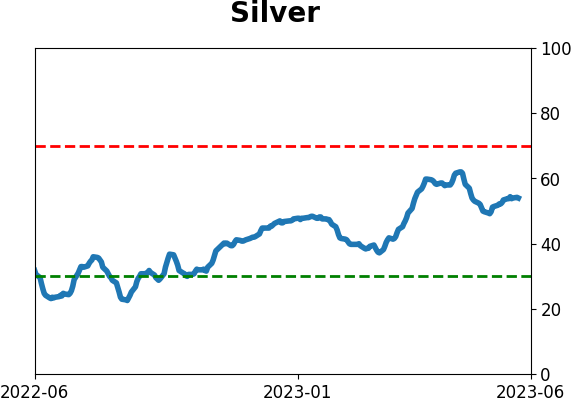
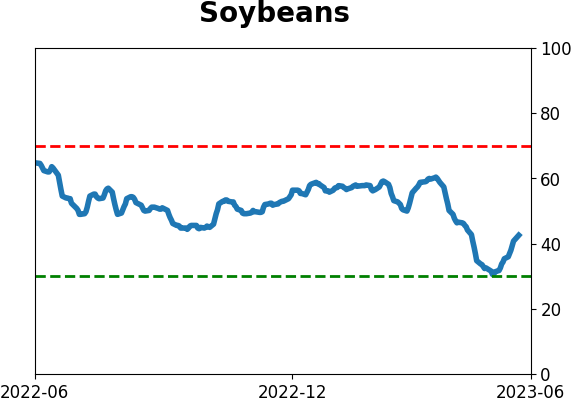
Commodity ETF's - 5-Day Moving Average
|
|