Headlines
|
|
Reaching the unprecedented stage of calm records:
It's been nearly a year and a half since the S&P 500 suffered a 2% daily loss. While it has gone much longer without a big loss, by the time it gets to this point, returns have been muted. The index recorded more than 50 new highs during this stretch, a level of performance matched only twice since 1928.
|
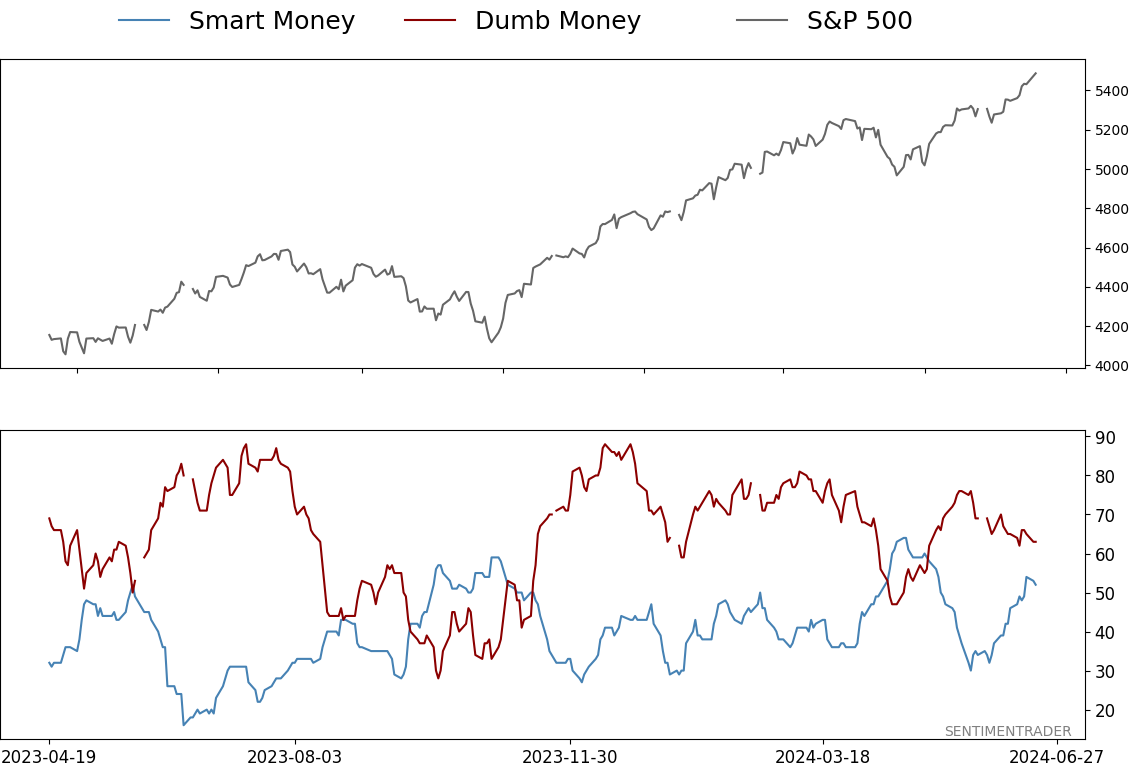
Smart / Dumb Money Confidence
|
Smart Money Confidence: 52%
Dumb Money Confidence: 63%
|
|
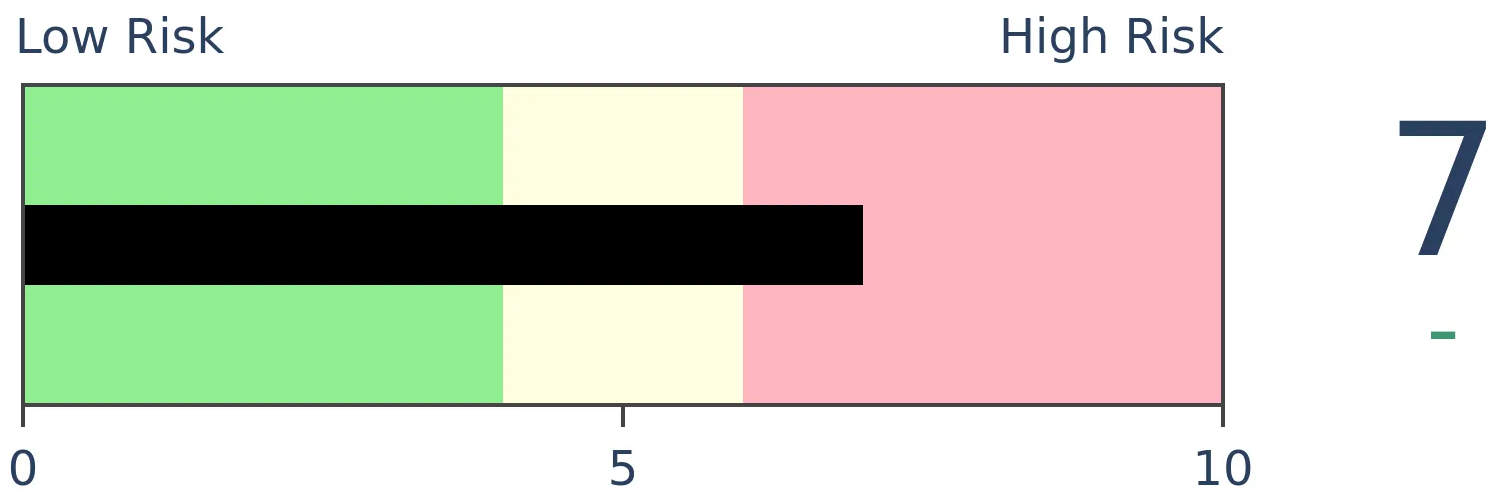
Risk Levels
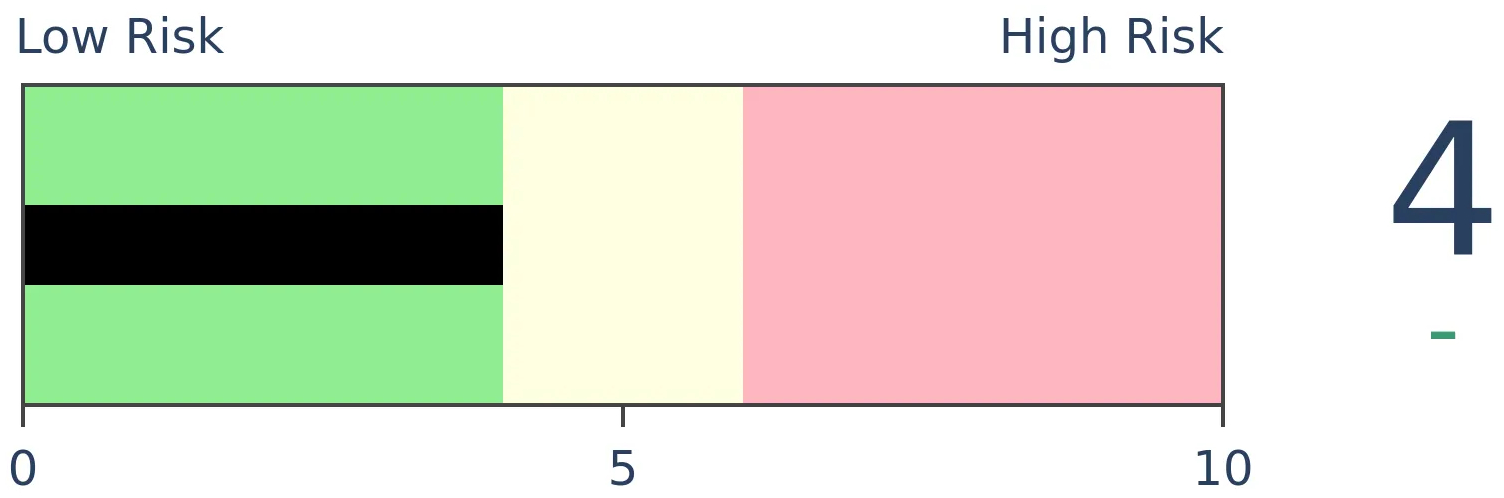
Stocks Short-Term
|
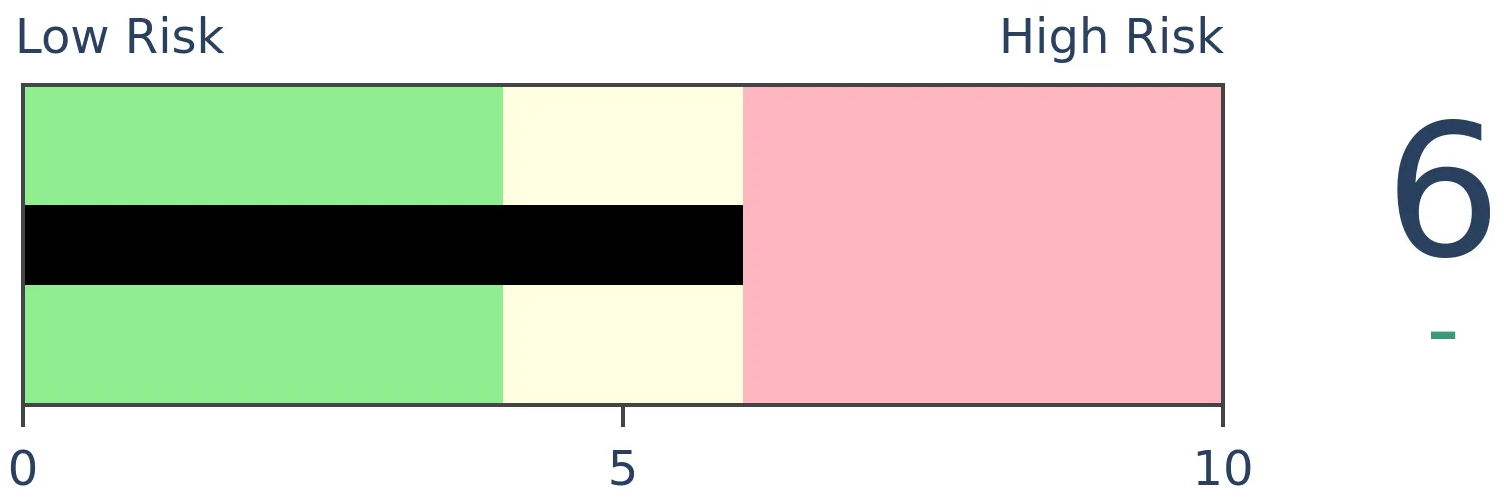
Stocks Medium-Term

|
|
Bonds

|
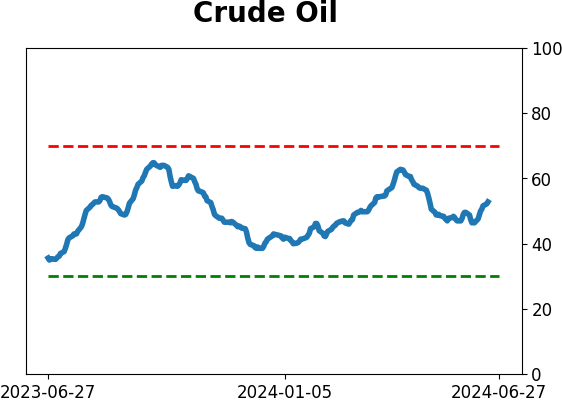
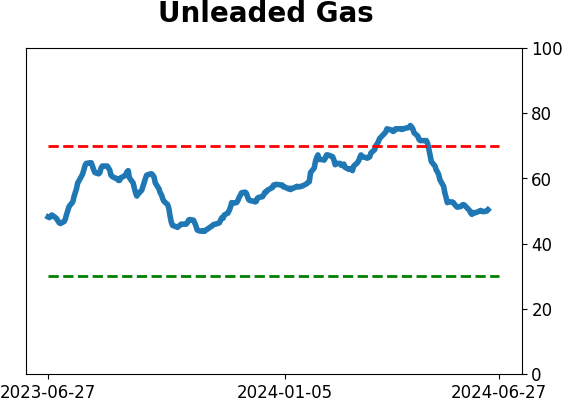
Crude Oil
|
|
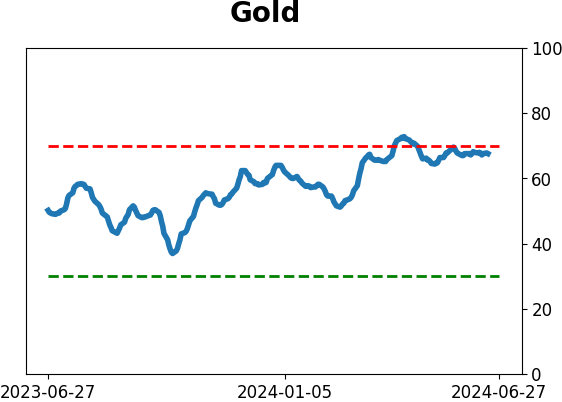
Gold
|
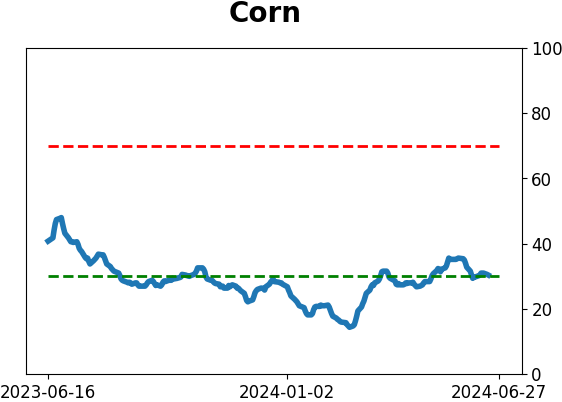
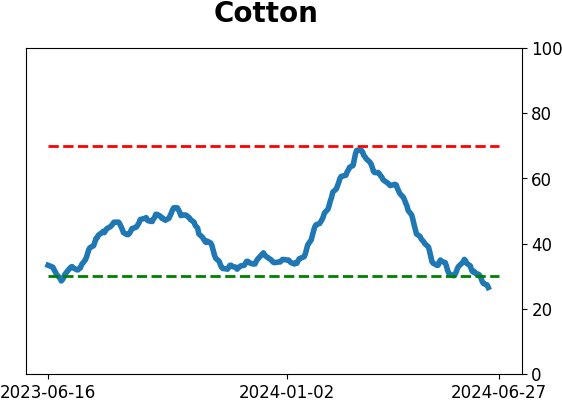
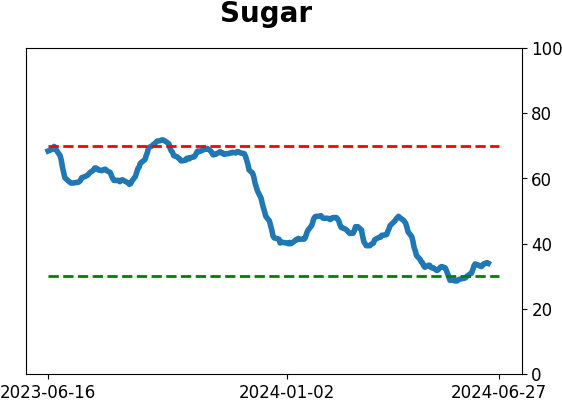
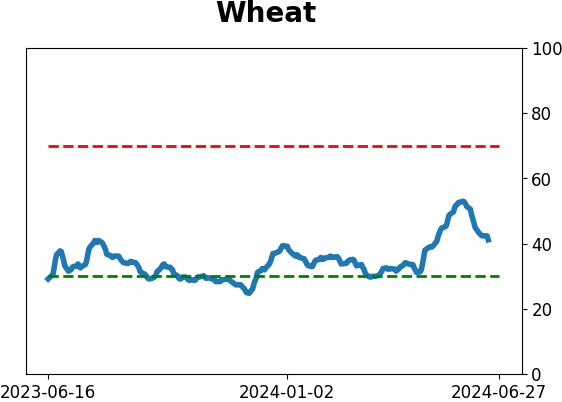
Agriculture
|
|
Research
By Jason Goepfert
BOTTOM LINE
It's been nearly a year and a half since the S&P 500 suffered a 2% daily loss. While it has gone much longer without a big loss, by the time it gets to this point, returns have been muted. The index recorded more than 50 new highs during this stretch, a level of performance matched only twice since 1928.
FORECAST / TIMEFRAME
None
|
Key points:
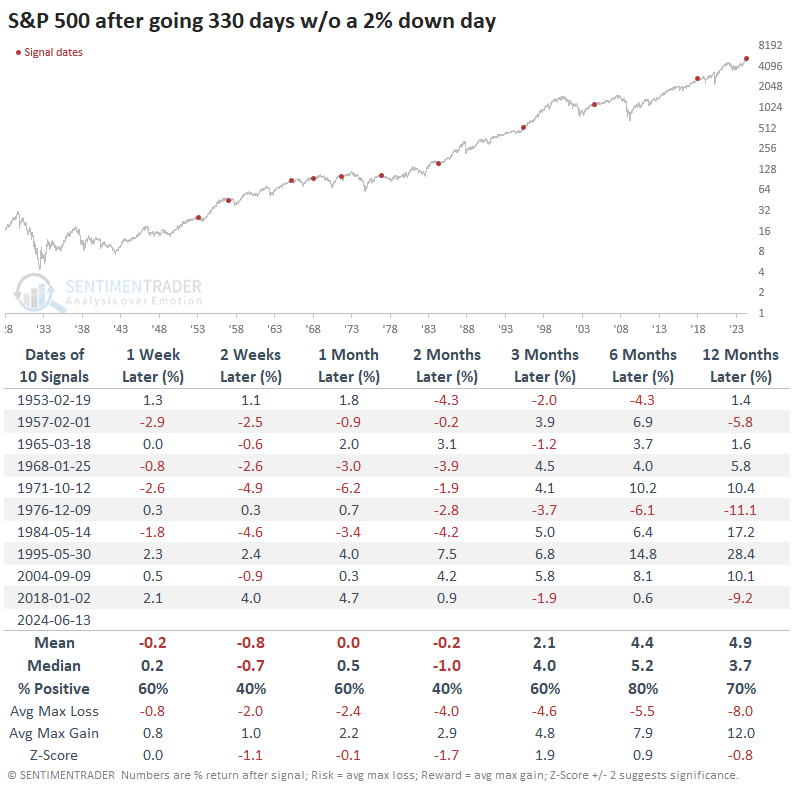
- The S&P 500 has gone more than 330 days without a 2% loss
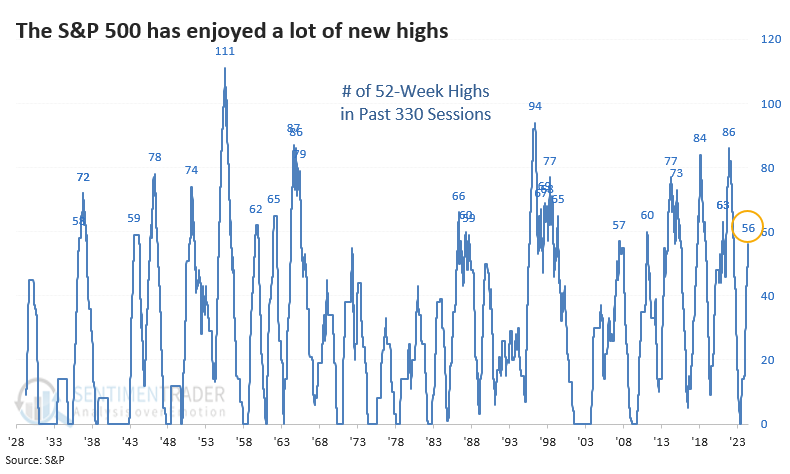
- During that streak, it recorded more than 55 new highs
- Only two periods in its history have matched this type of performance
Big streak with no big losses
It's no secret by now that turmoil is rising under the surface of the major U.S. equity indices. It's especially prominent within the Nasdaq 100, but even components of the S&P 500 aren't keeping up with the index.
The biggest factor in favor of riding those indexes is pure momentum. They keep rising because they keep rising; it's as simple as that. Most investors are trend-followers, these are the most benchmarked indexes in the world, and that's that. It works until it doesn't.
When we get to this stage, Wall Street is only too happy to supply the market with all kinds of products to capitalize on investors' regrets for the recent past. Many of those products are based on the low volatility we've seen, which is inarguable on the index level. The S&P 500 has gone nearly a year and a half since it's even suffered a 2% daily decline.
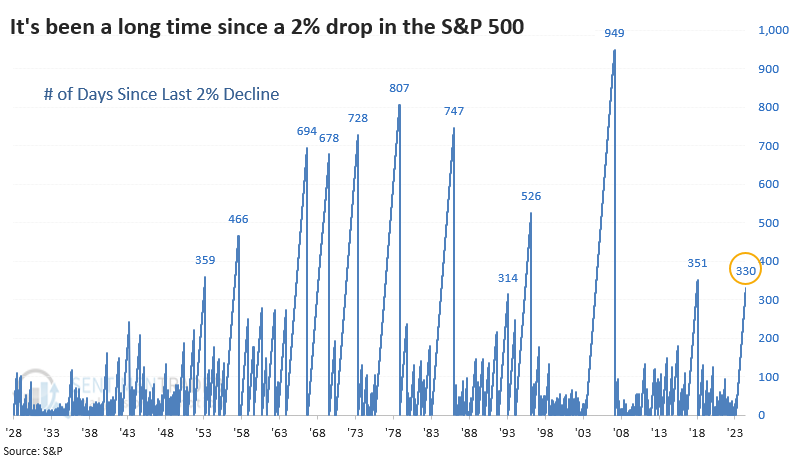
The chart shows that streaks without a big dip have gone on much, much longer-nearly three times as long in the mid-2000s. Still, by the time the streak reached this many days, the index started to sputter a bit. All but two of the streaks saw the S&P 500 trade lower either two or three months later. The exceptions were the remarkable creeper trend of 1995 and again in 2004, which became the longest streak in history.
Sprinkled with new highs
Not only has volatility been subdued during the streak, but the S&P has managed to record 56 new highs as of last week (more now). During any 330-day stretch, this is an impressive number, but again, it has been exceeded in the past.
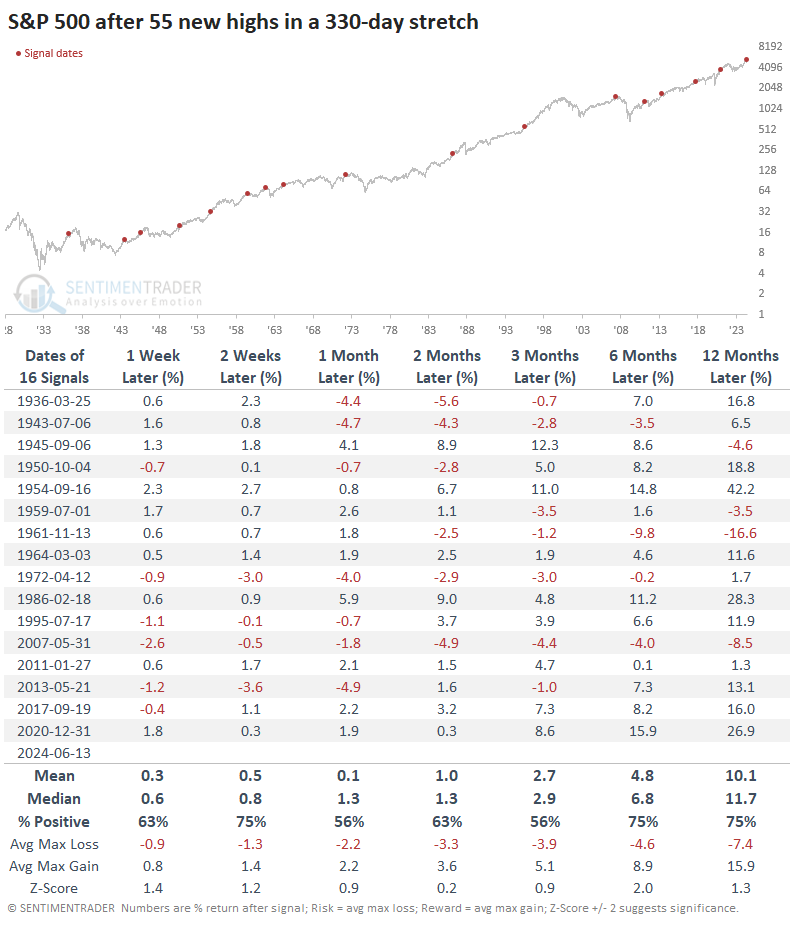
Whenever the S&P has recorded at least 55 new highs in any 330-day stretch, its returns were decent. The win rate and risk/reward ratio were nothing special, but its median returns tended to be above average.
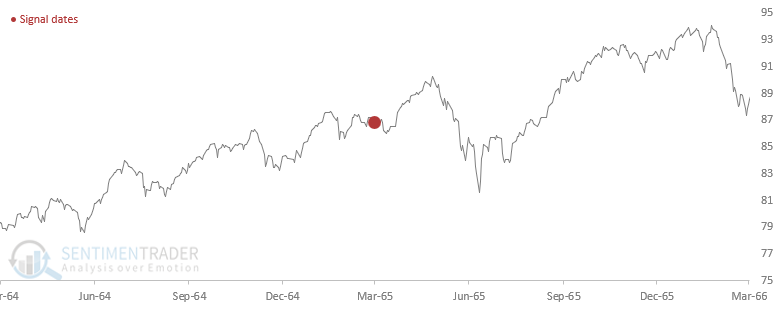
Now, let's combine both factors. There were a grand total of two instances when the S&P went 330 days without a 2% daily decline and recorded at least 50 new highs during that stretch.
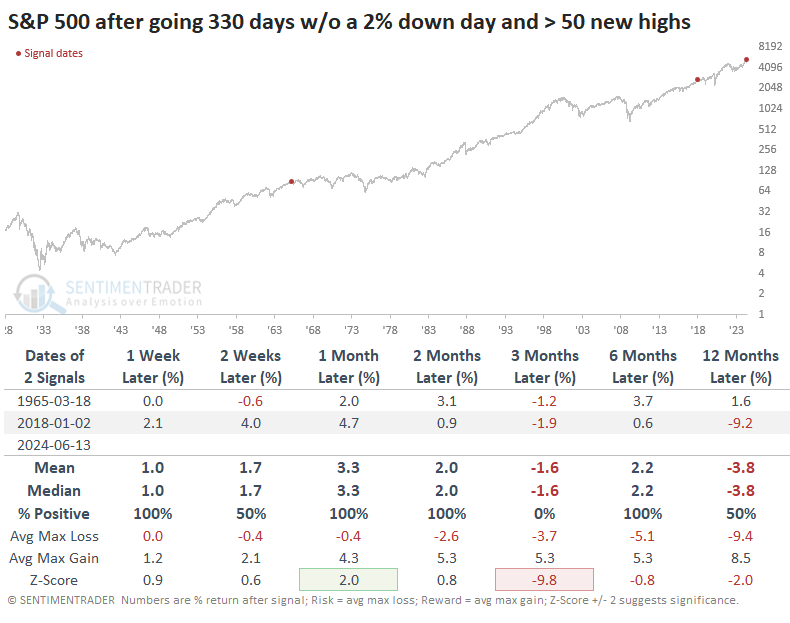
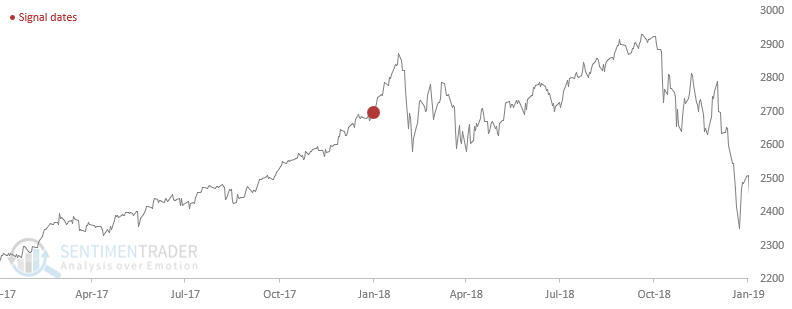
Both signals preceded more gains over the next month or so and then fell into digestive periods. Neither one saw the S&P gain more than +9% at any point within the following year. In 1965, the S&P chopped around for a few weeks and then rallied hard for a few weeks into a more substantial peak.
In 2018, the index just skipped right into the melt-up portion of the rally before a similar peak.
What the research tells us...
Technically, the best thing that stocks have going for them is momentum. When it reaches the level it's at, it becomes a powerful force that can continue for weeks or more. There is significant deterioration under the surface of this momentum, so it's on a shaky foundation and is more likely to fail than if there were more supports. By the time it gets to this stage, we're usually at the "weeks, not months" part of the cycle. It doesn't say much about prospects for longer-term investors, but those with a more medium time frame should be on guard. When gains get this easy, it's usually about to become much less so.
Indicators at Extremes
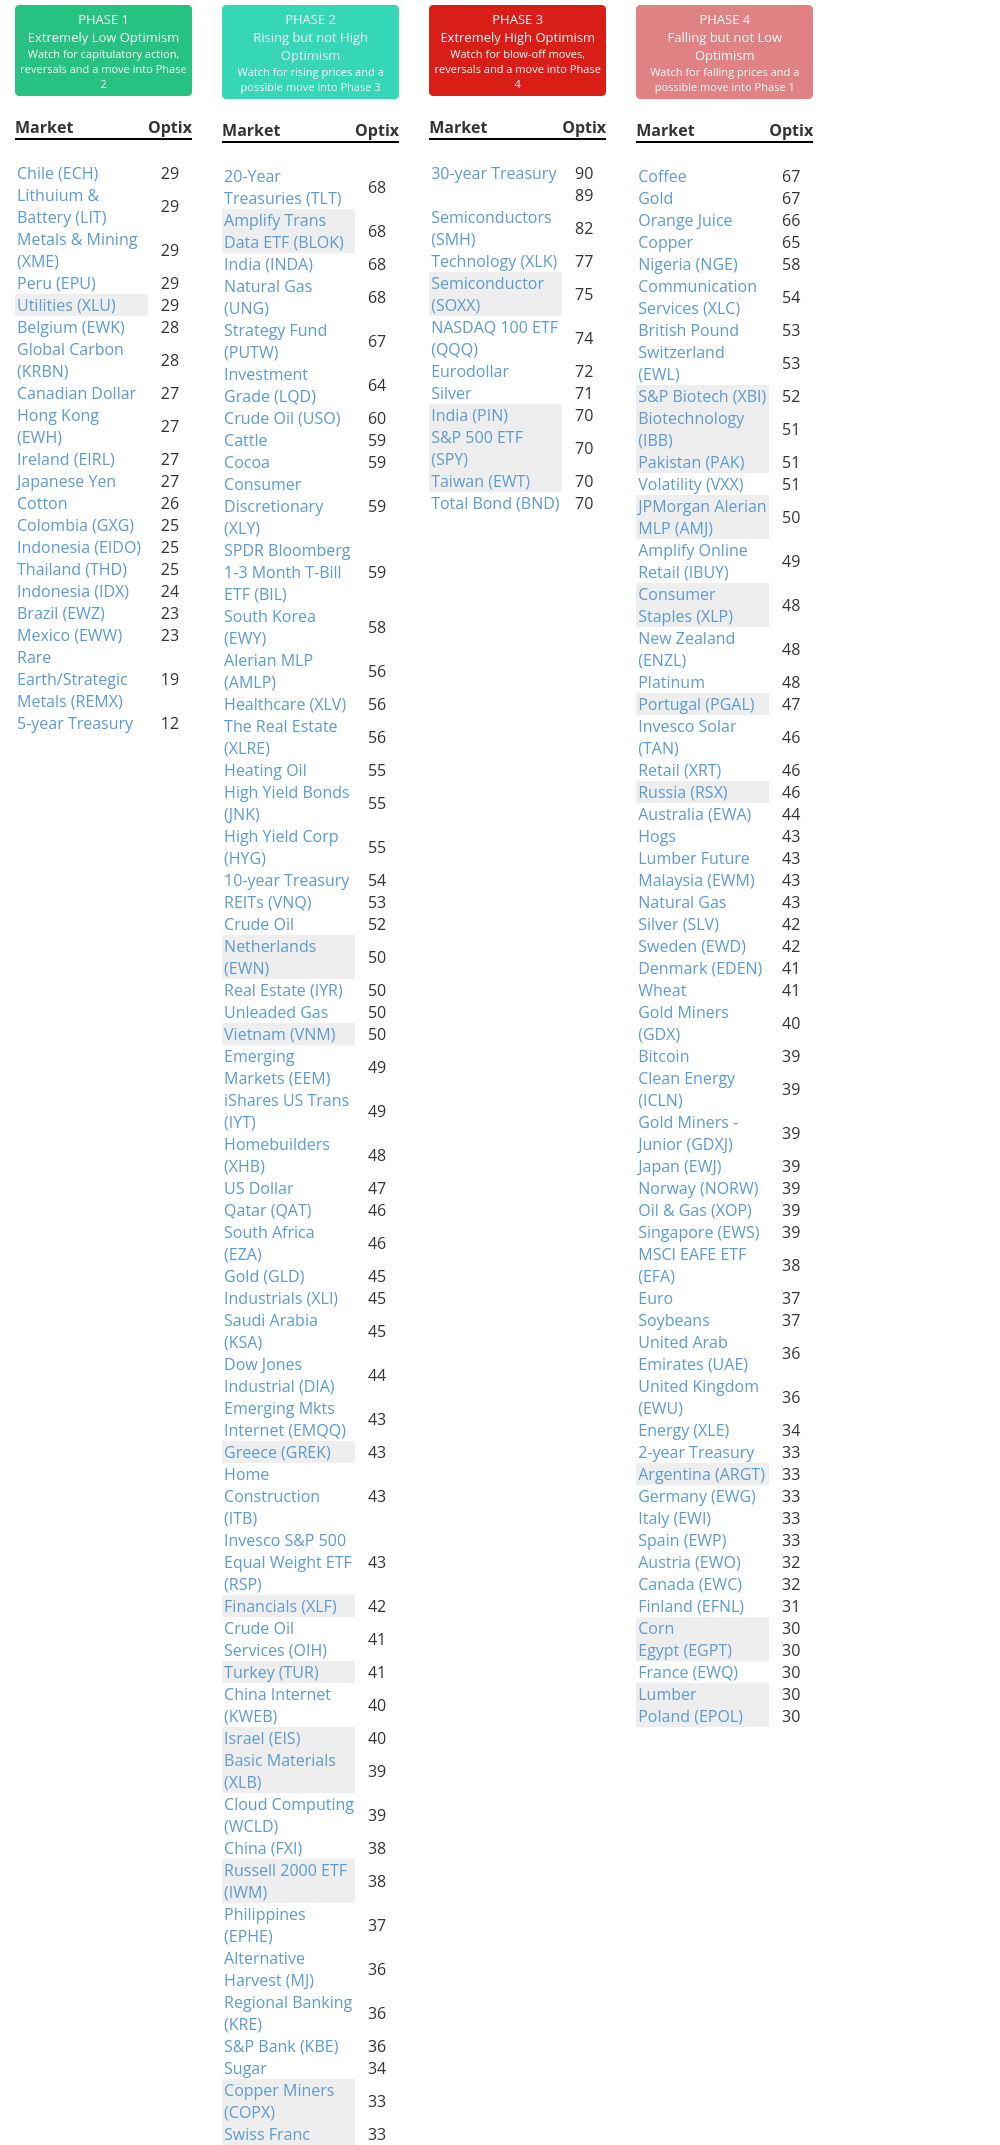
Phase Table
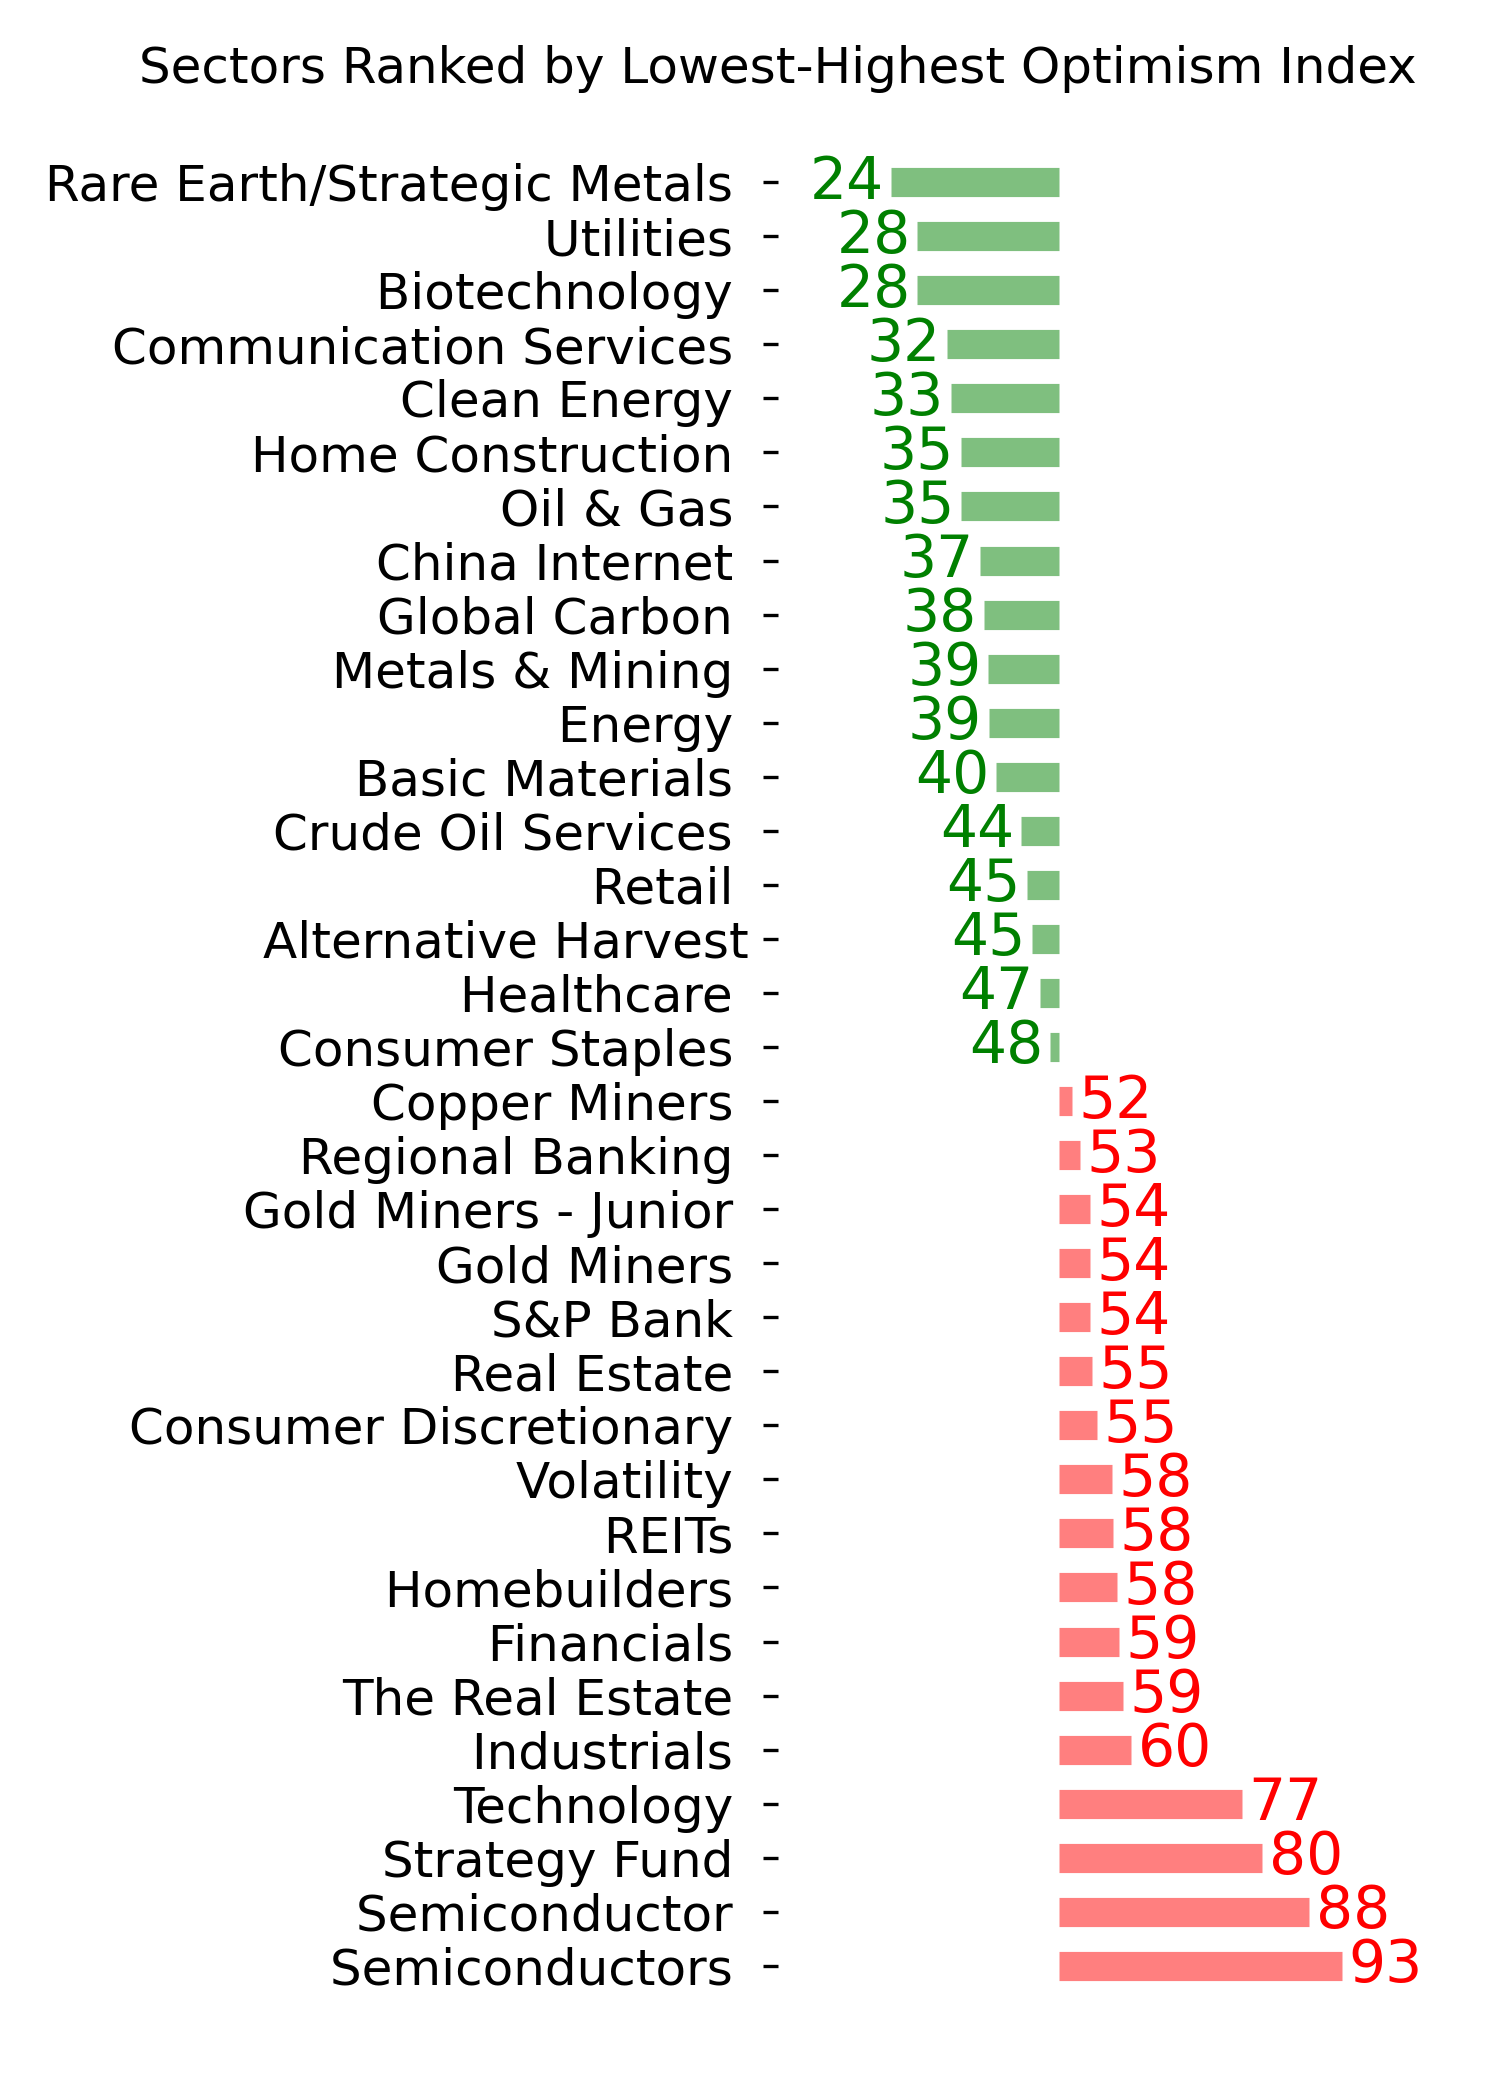
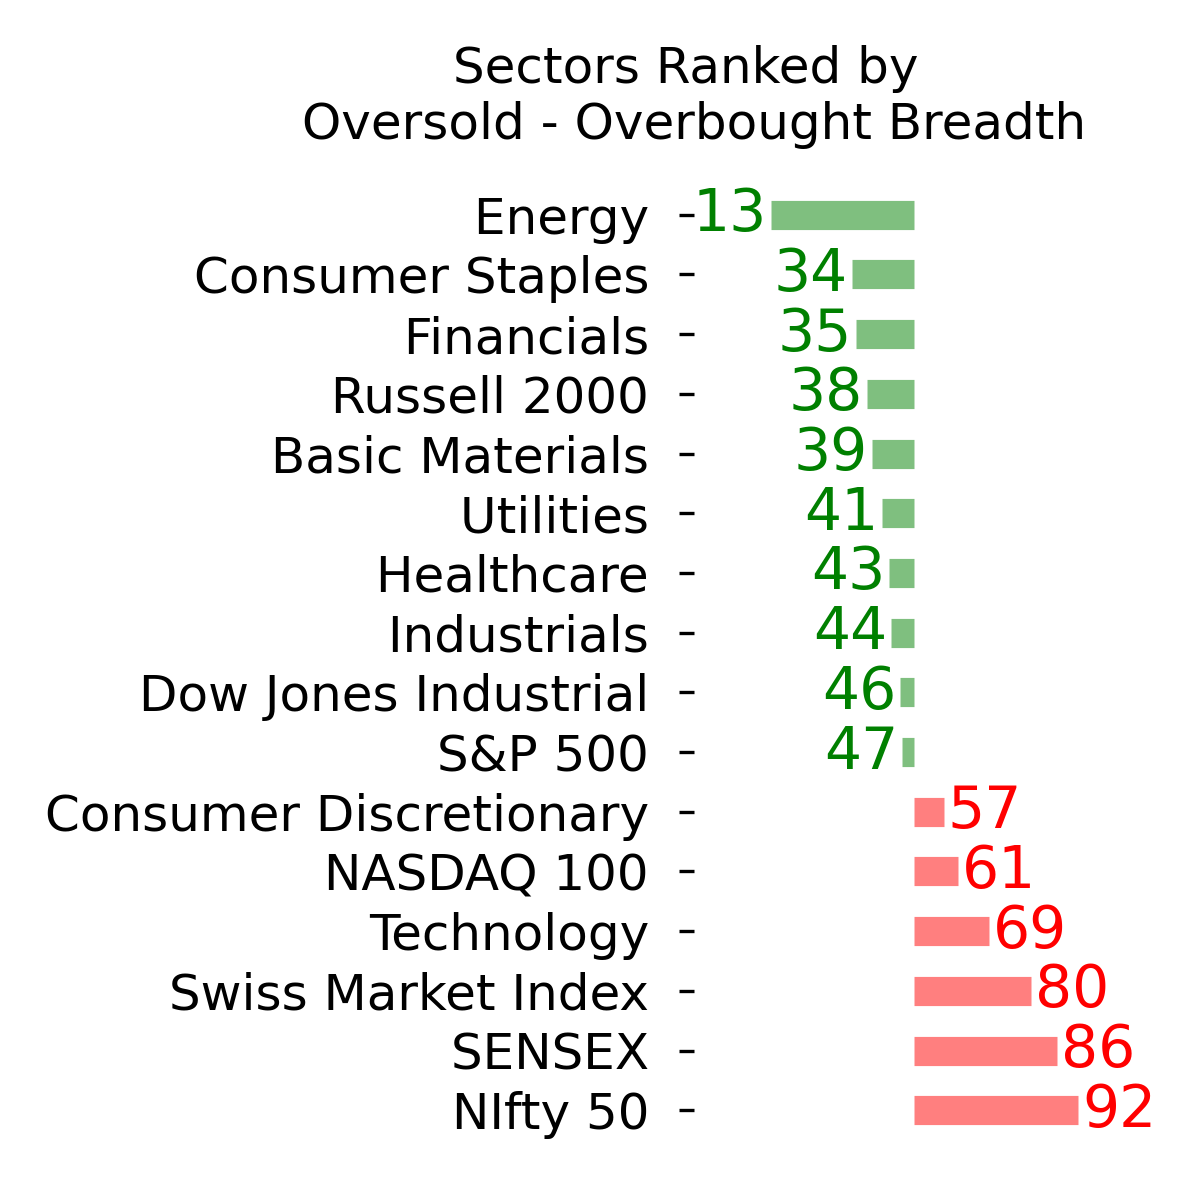
Ranks
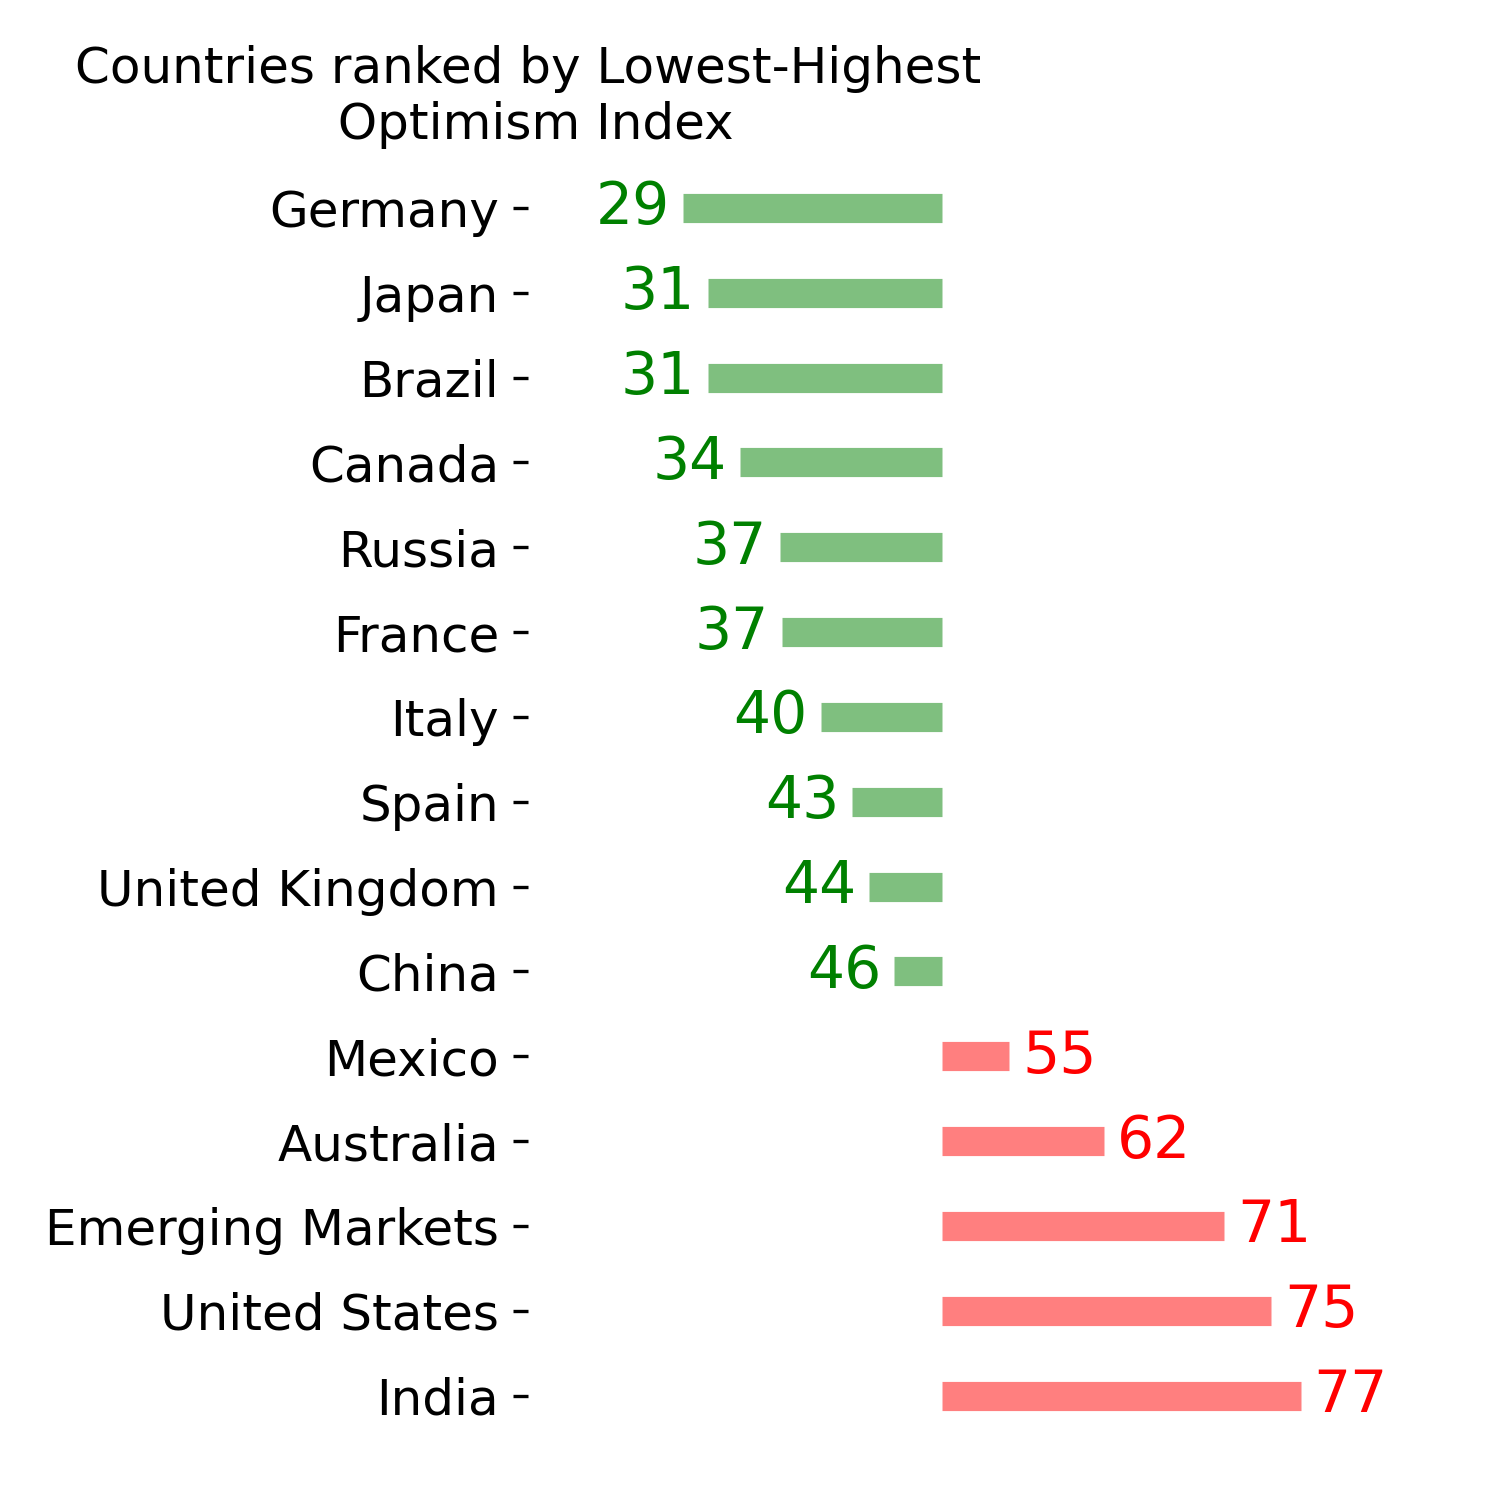
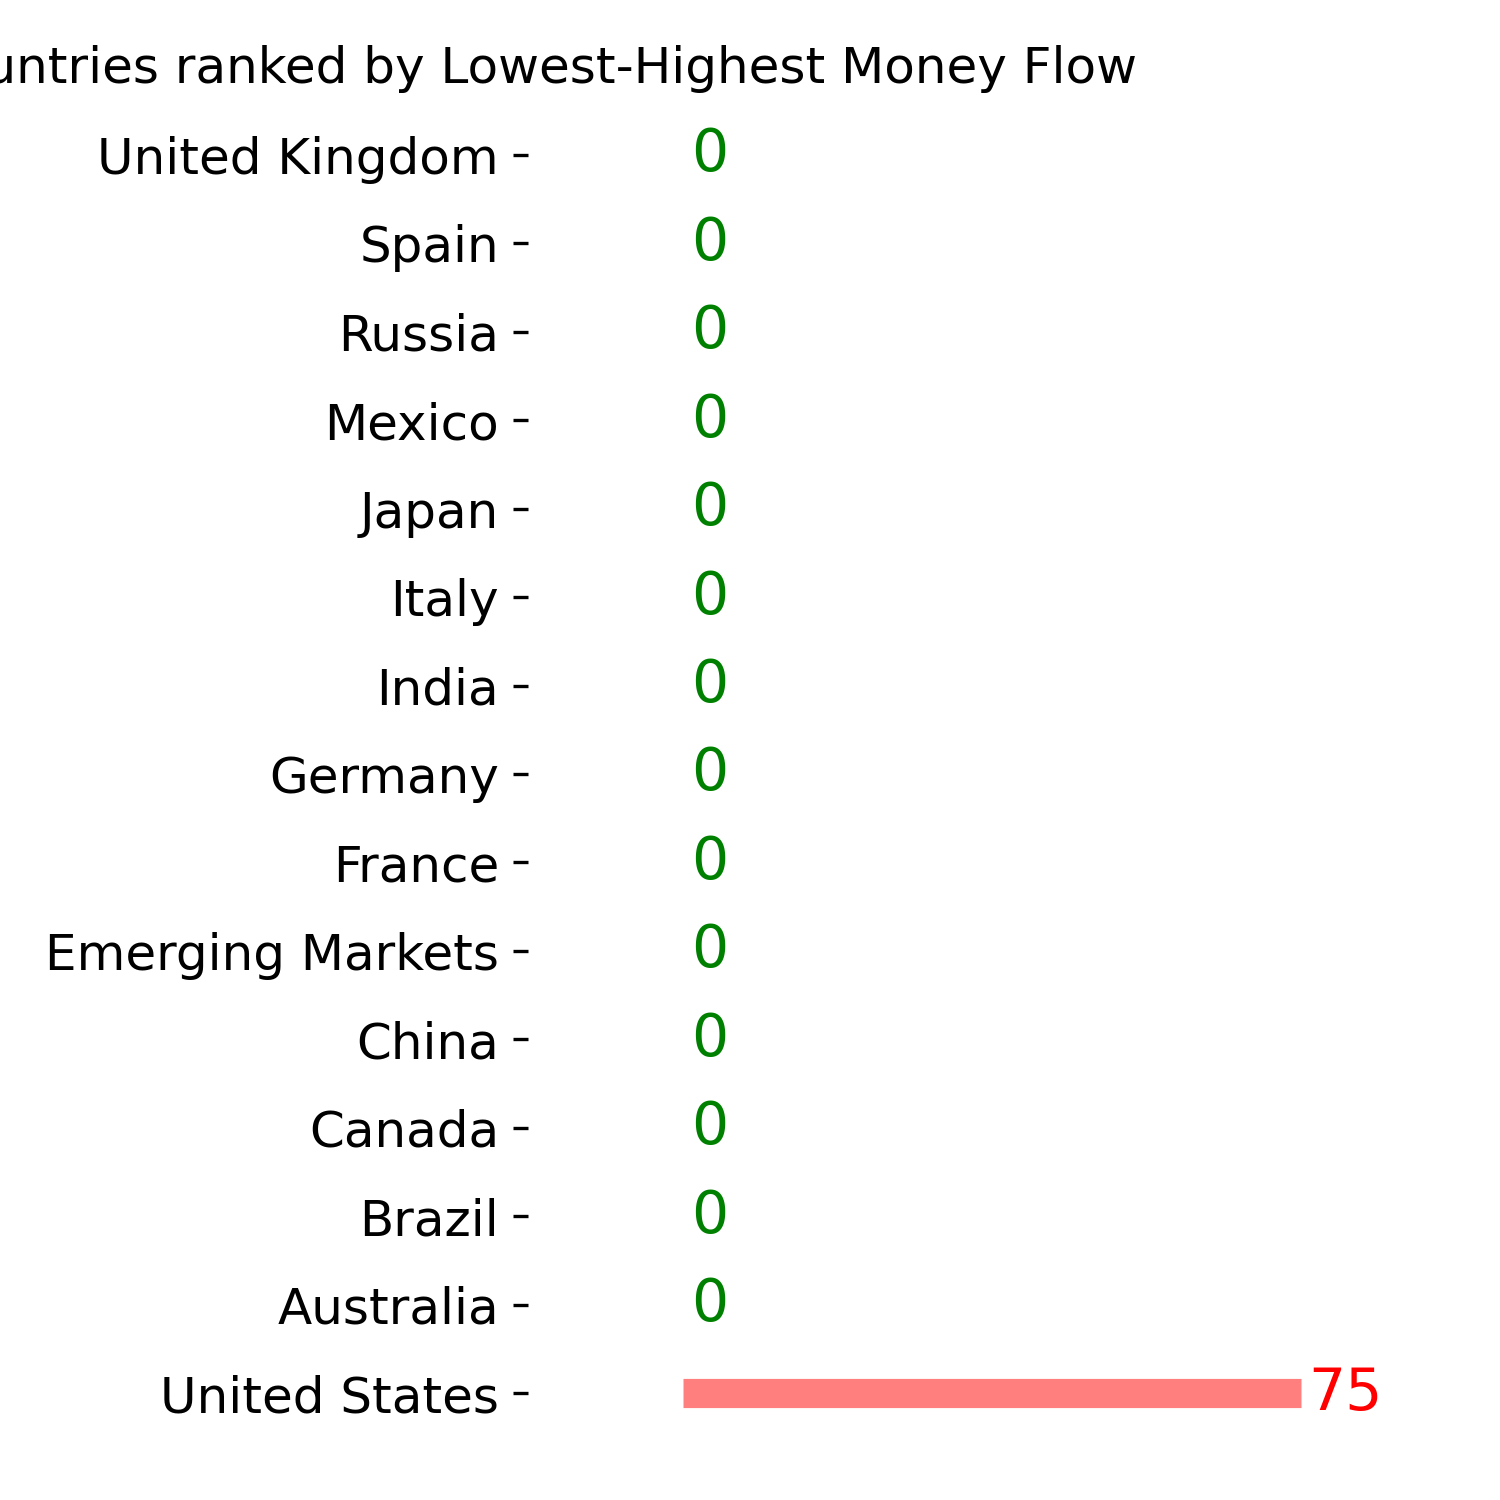
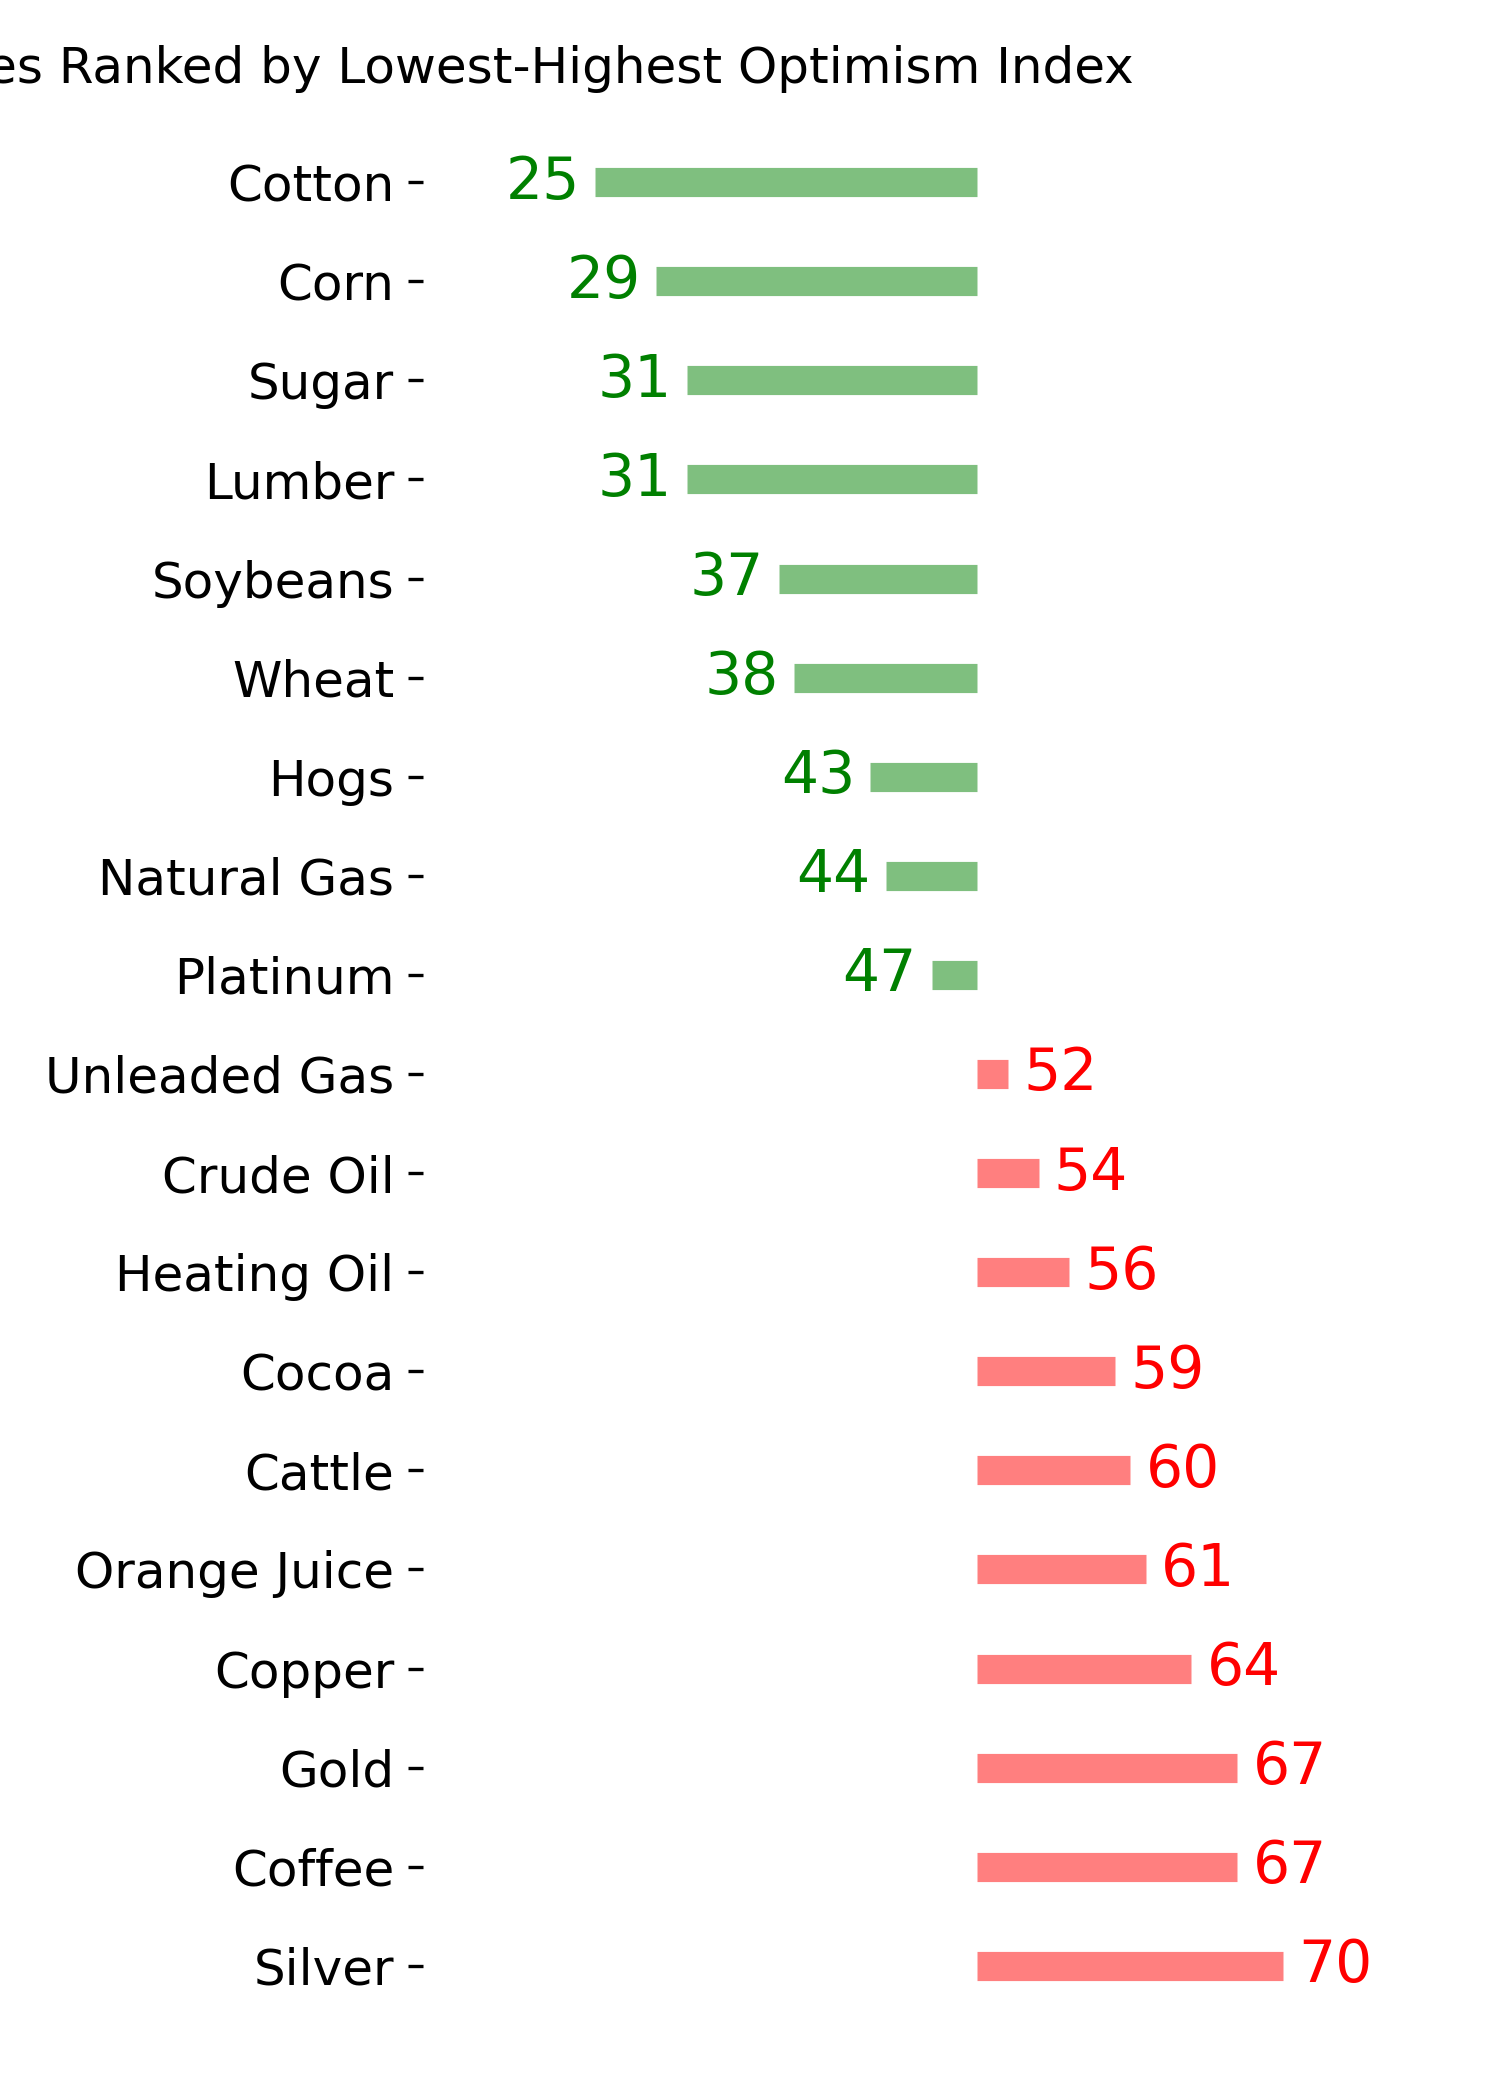
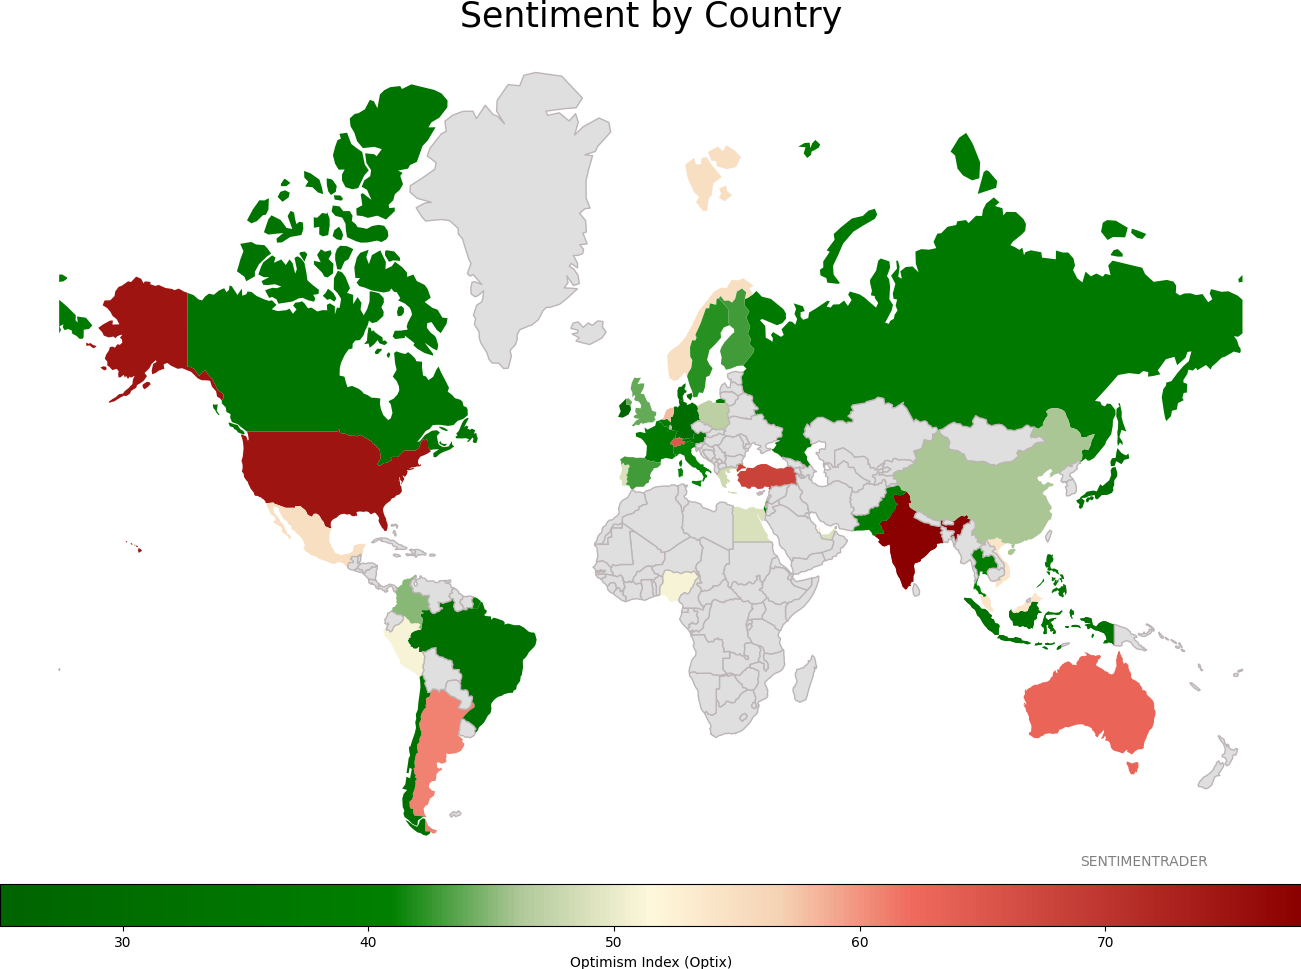
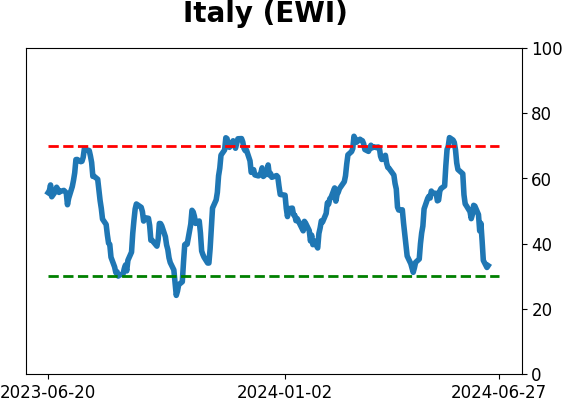
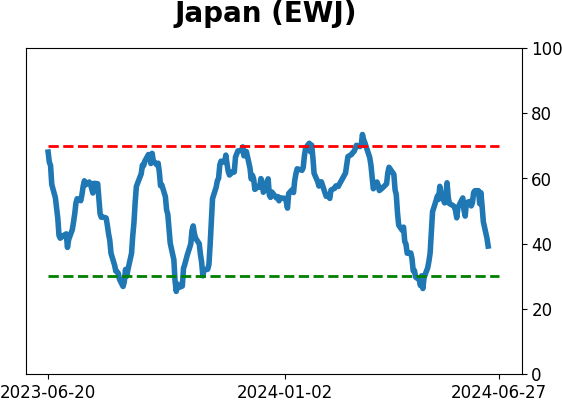
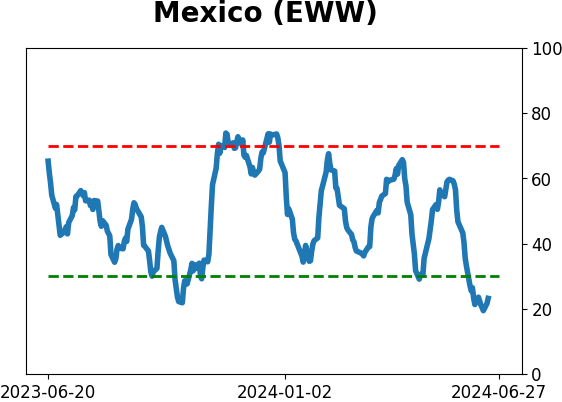
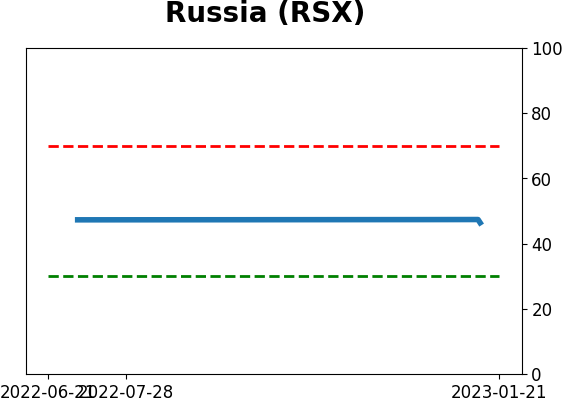
Sentiment Around The World
Optimism Index Thumbnails
|
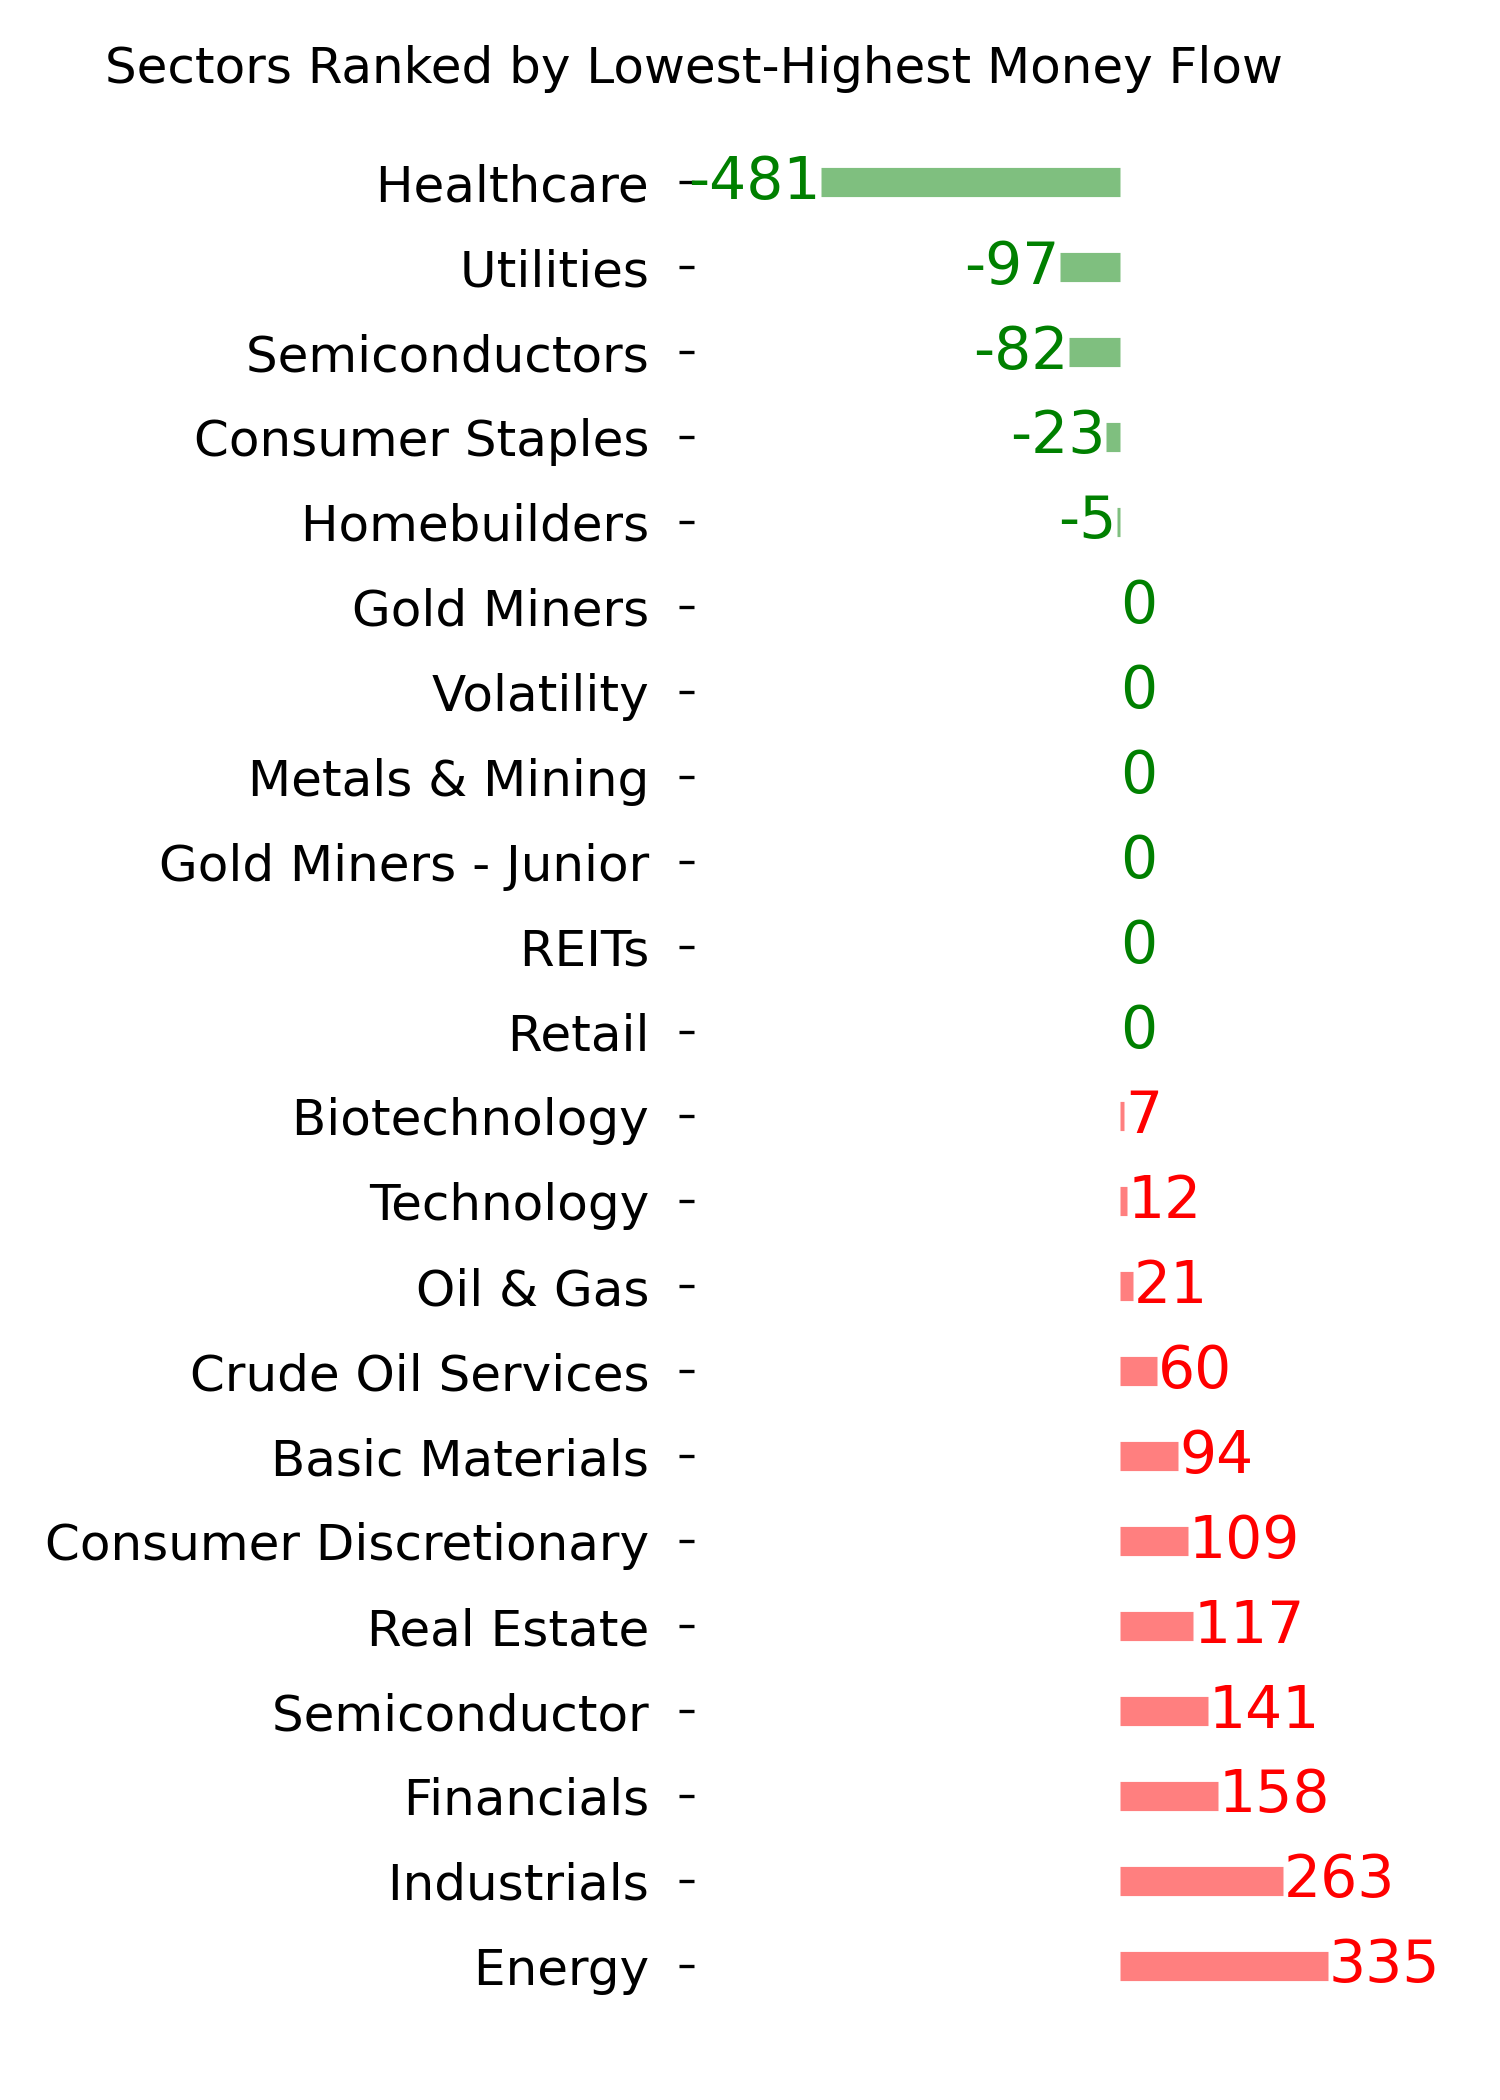
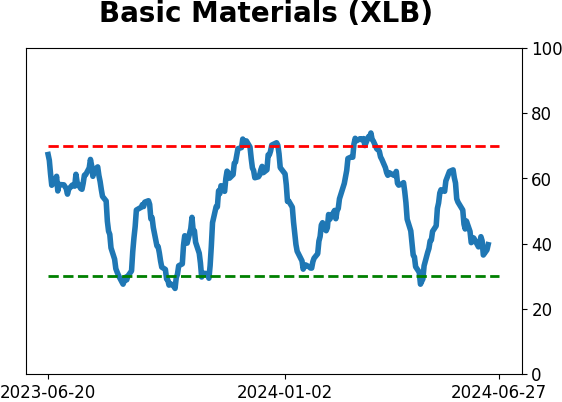
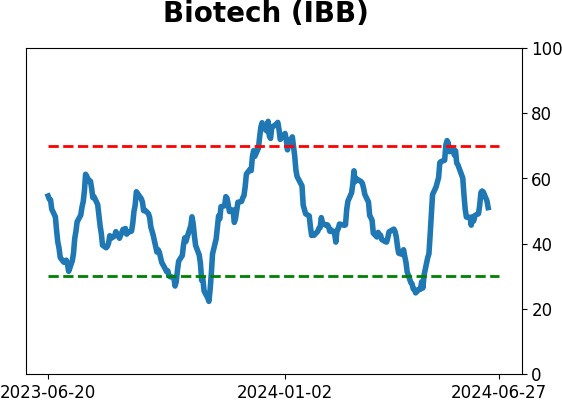
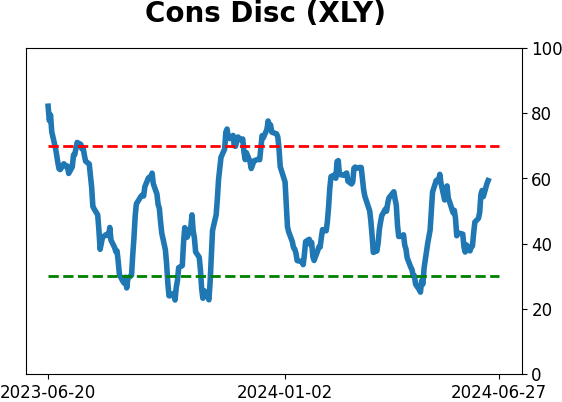
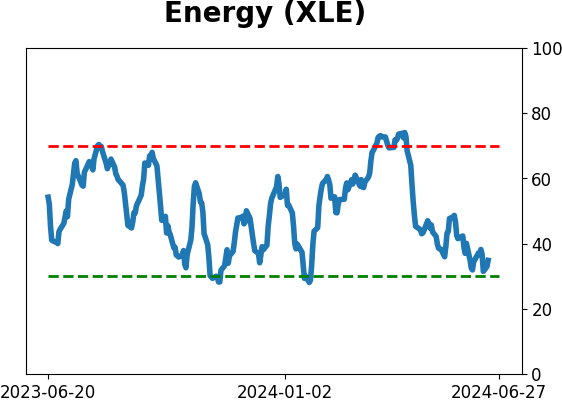
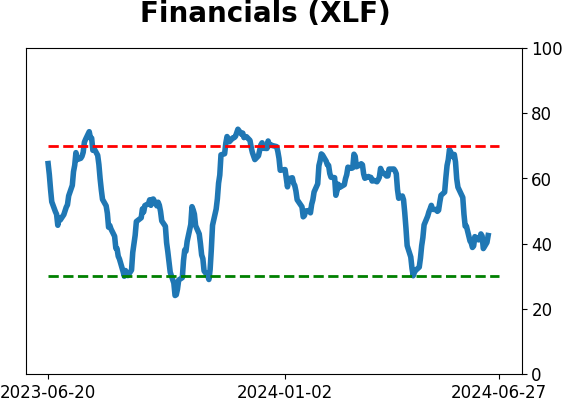
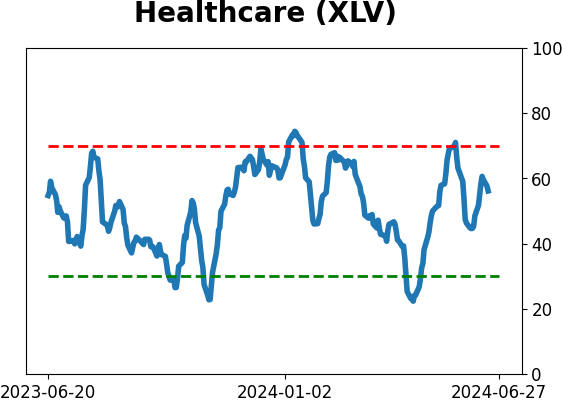
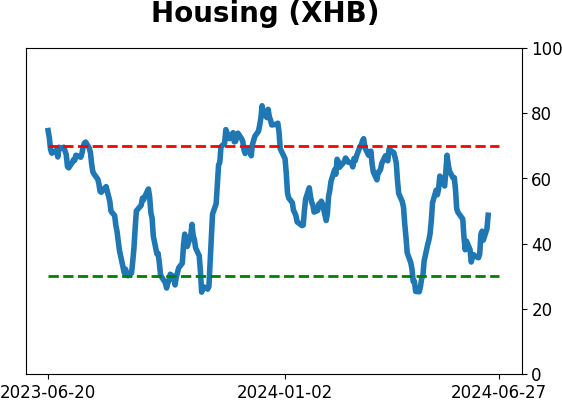
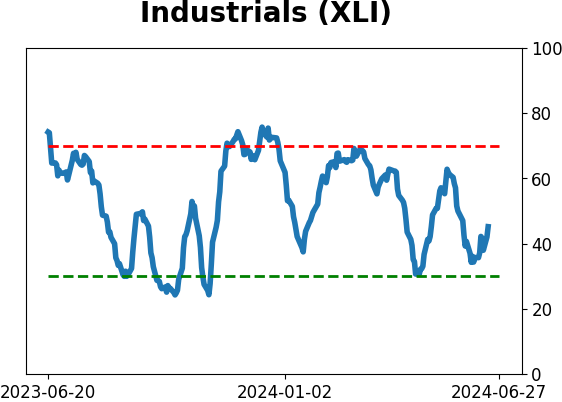
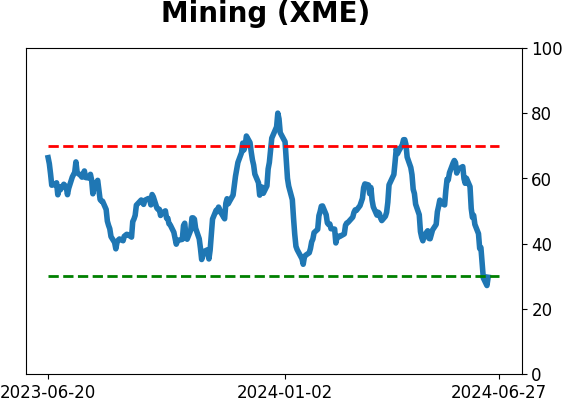
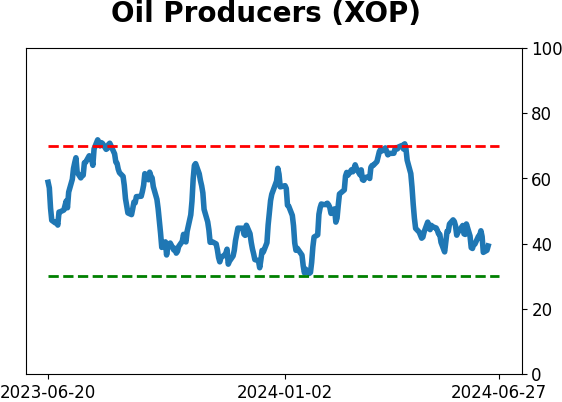
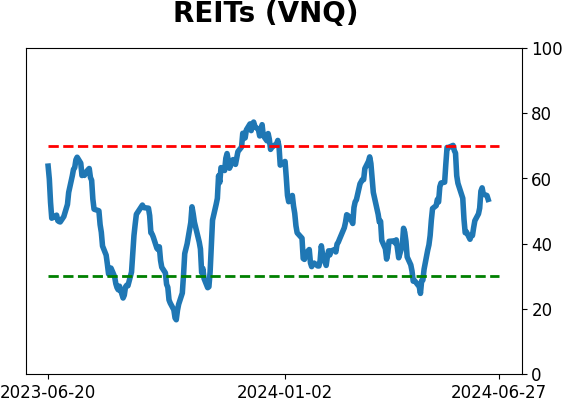
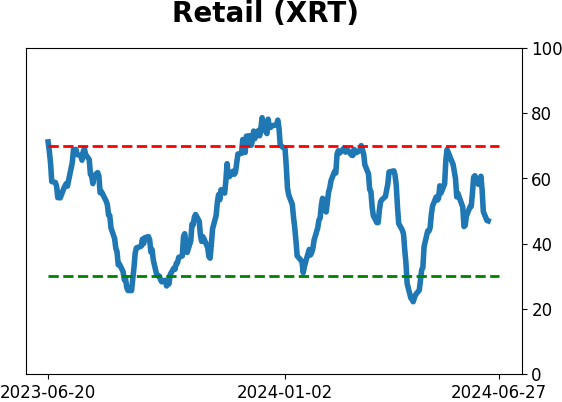
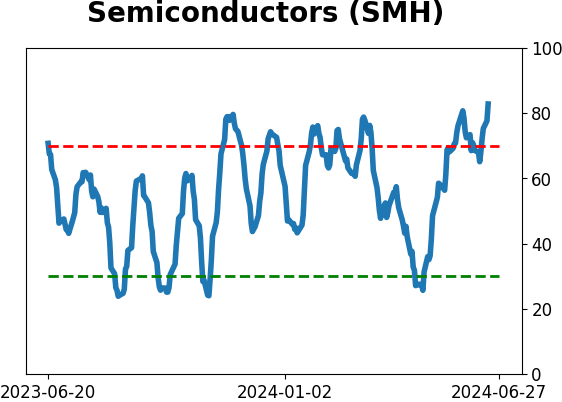
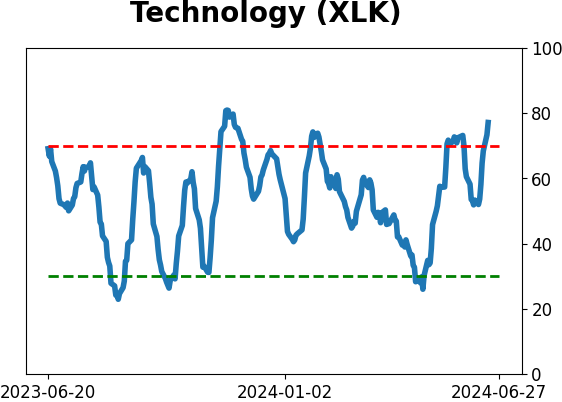
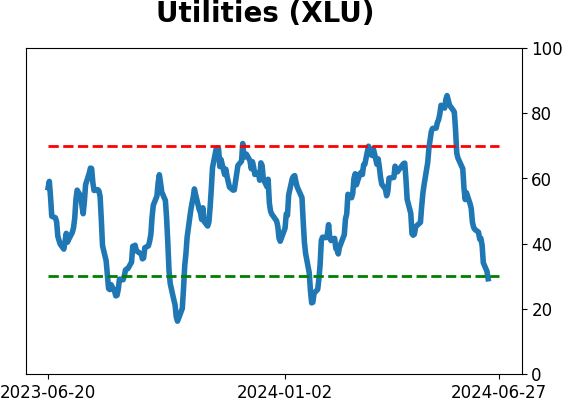
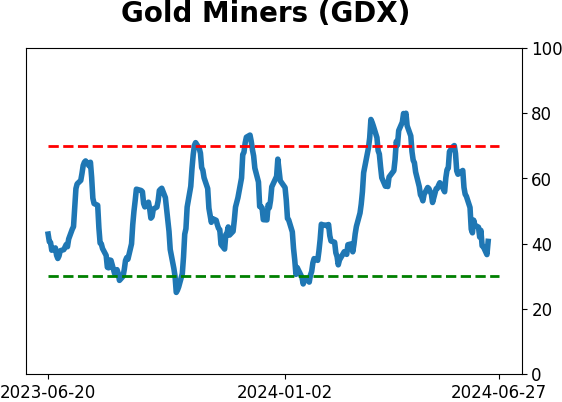
Sector ETF's - 10-Day Moving Average
|
|
|
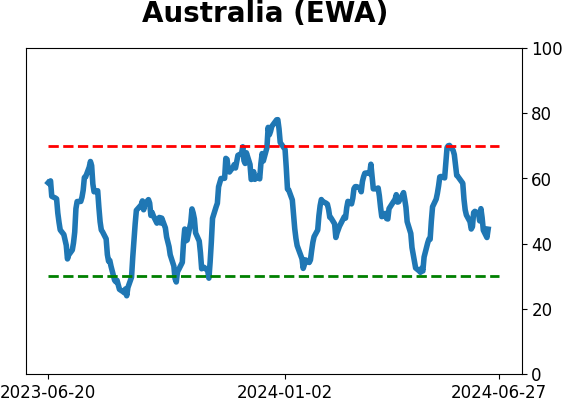
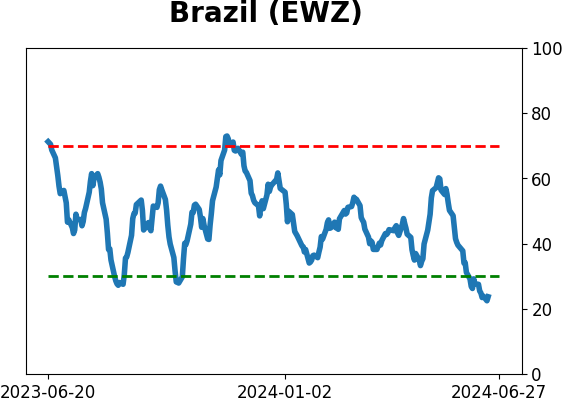
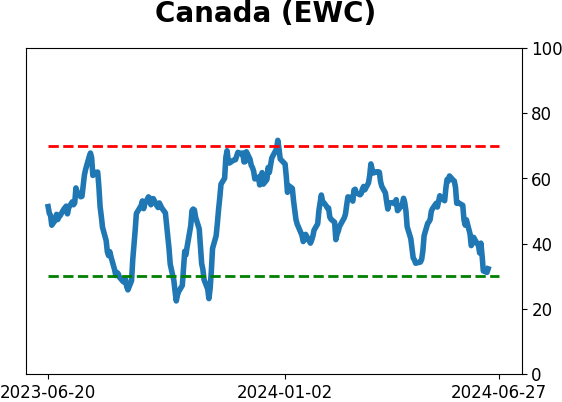
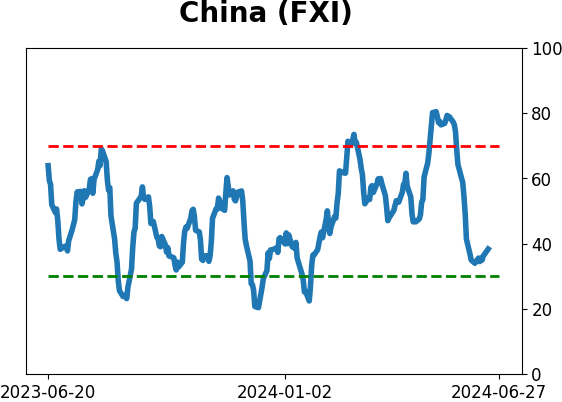
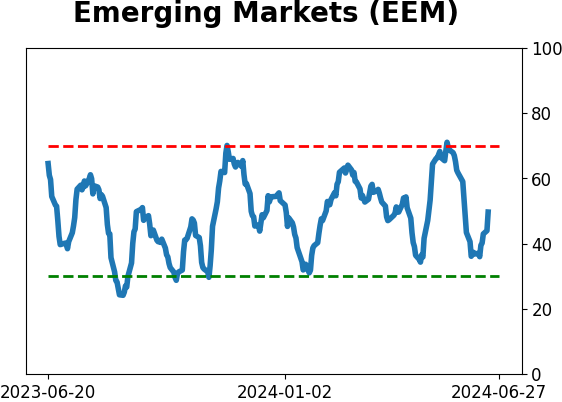
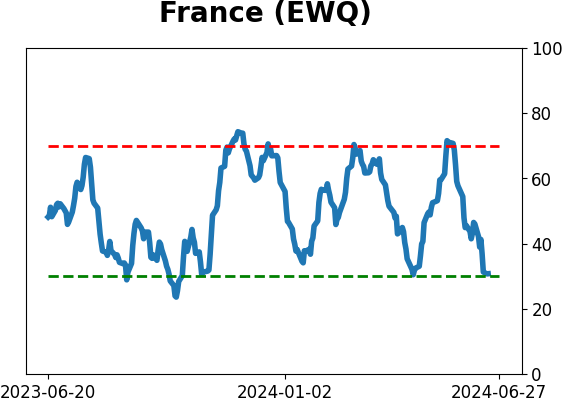
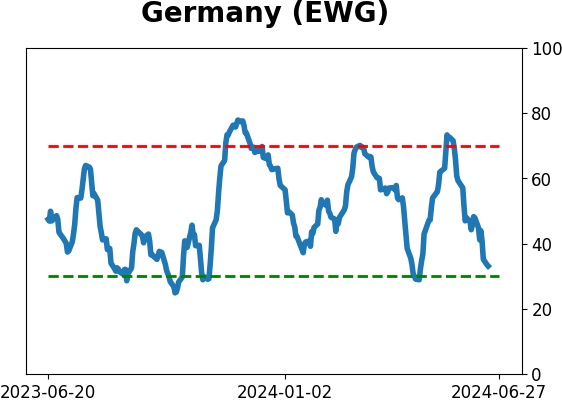
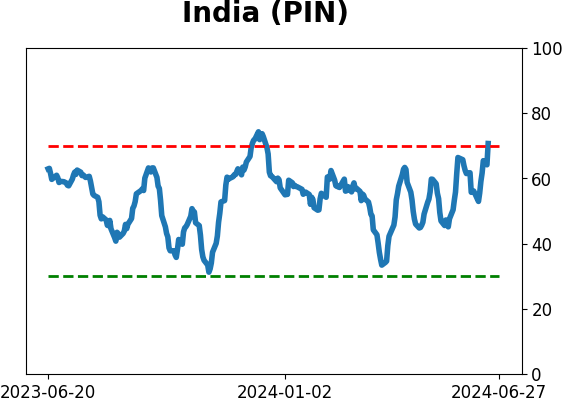
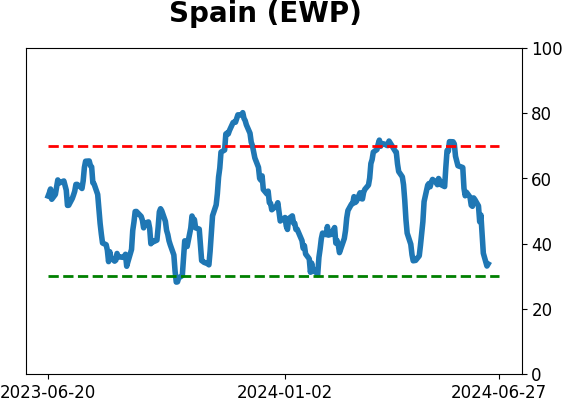
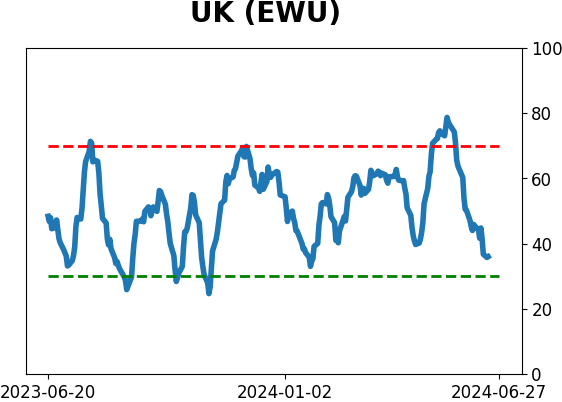
Country ETF's - 10-Day Moving Average
|
|
|
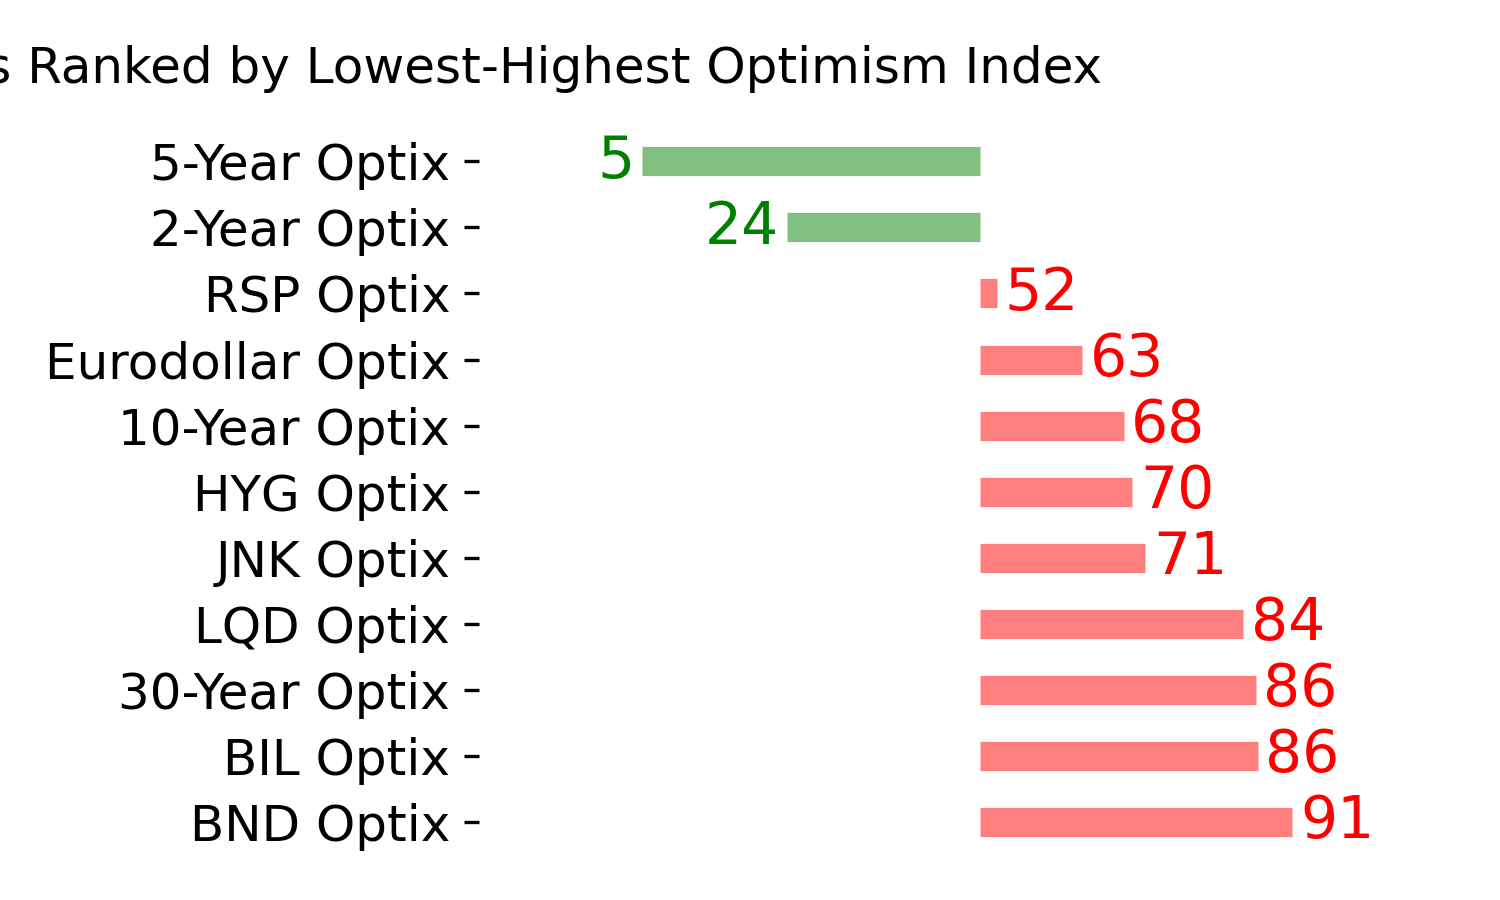
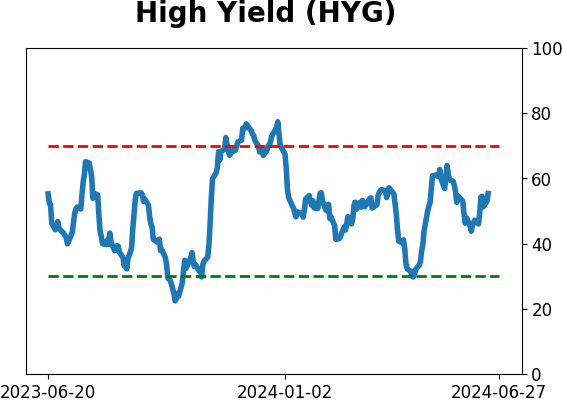
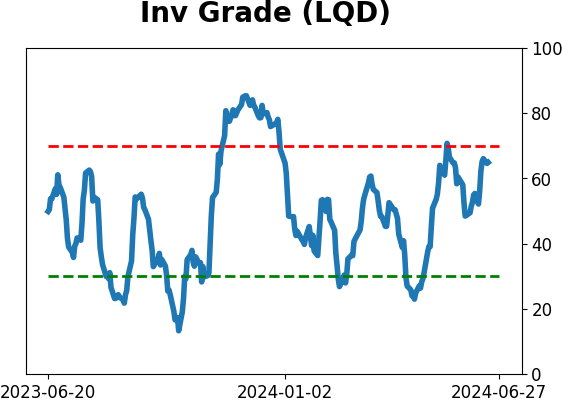
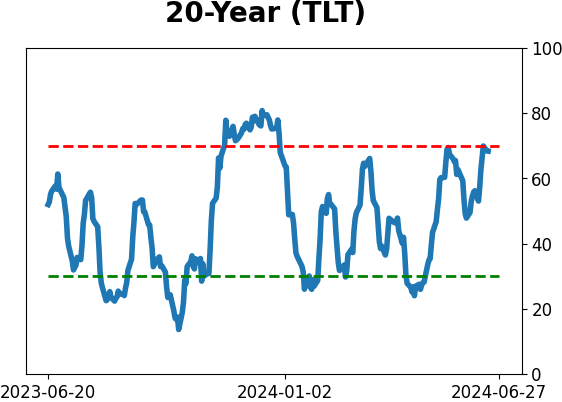
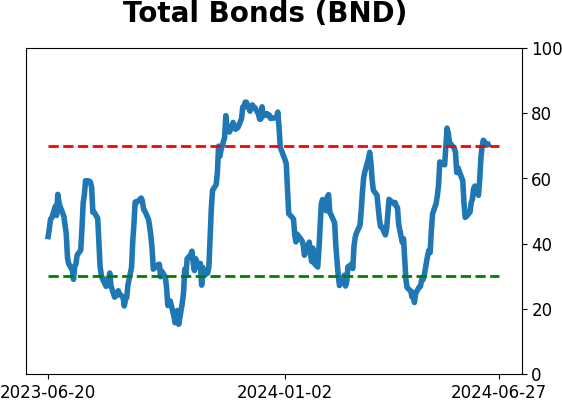
Bond ETF's - 10-Day Moving Average
|
|
|
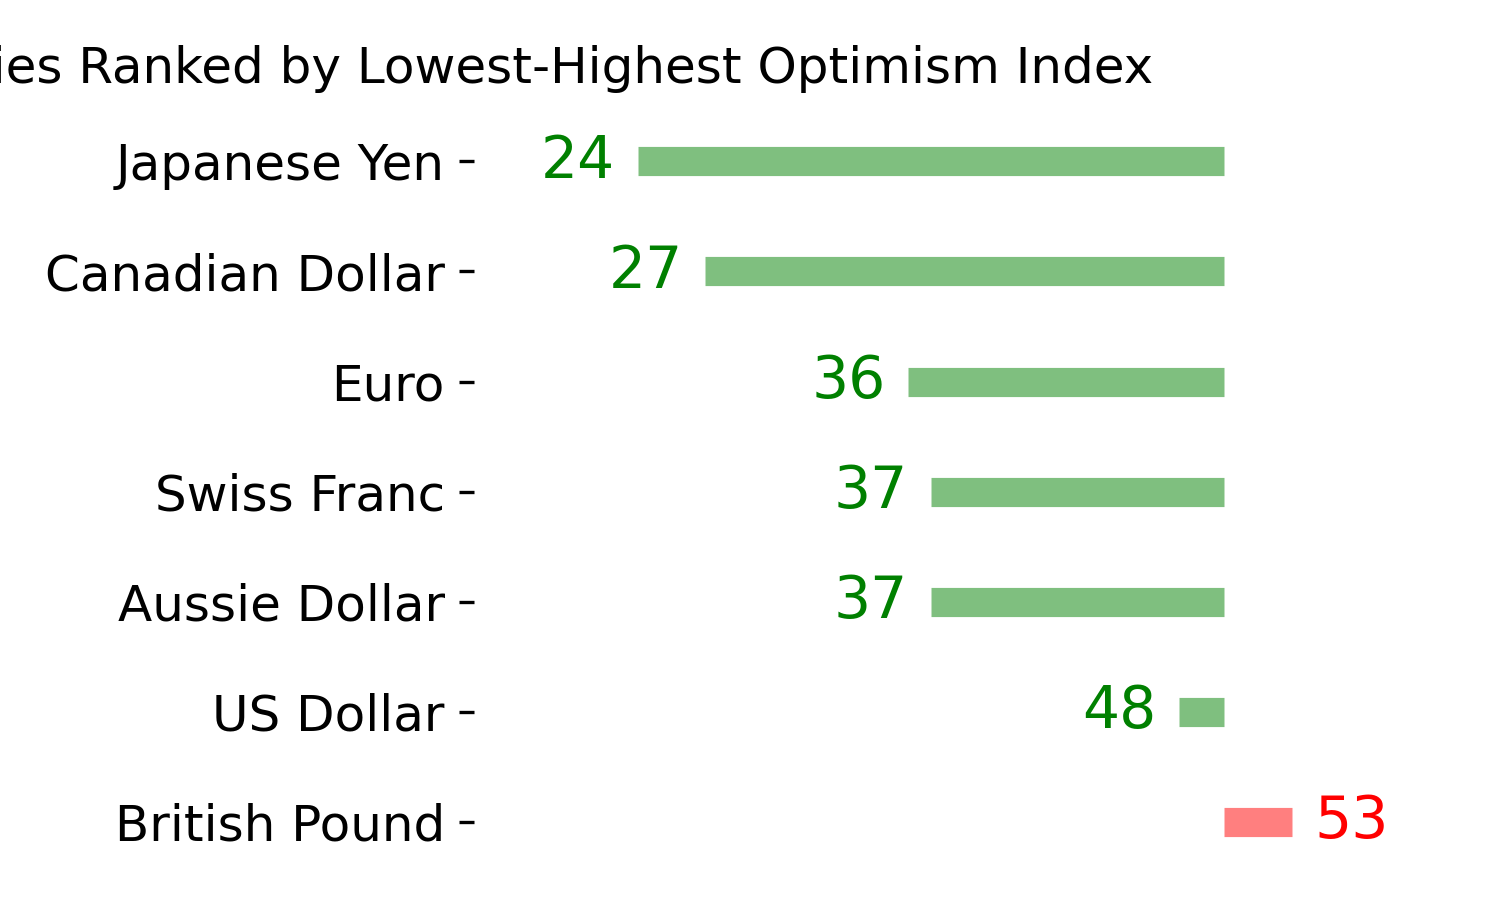
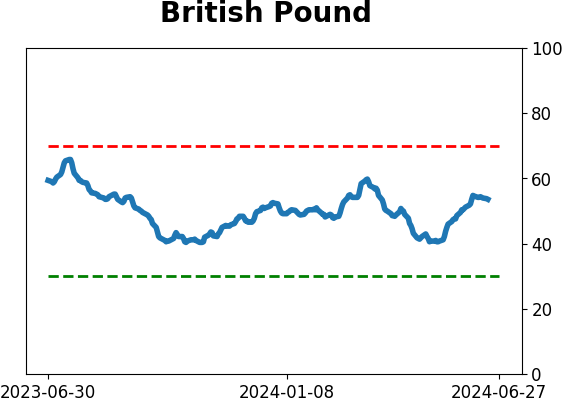
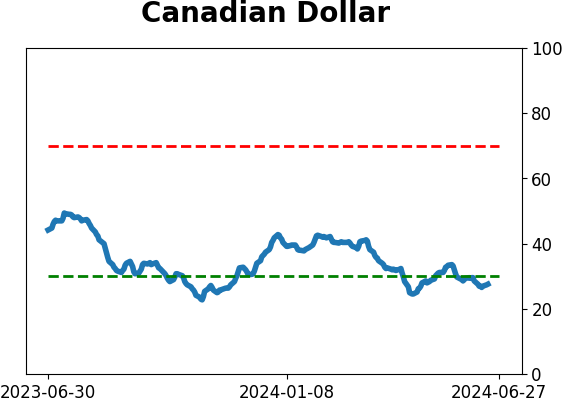
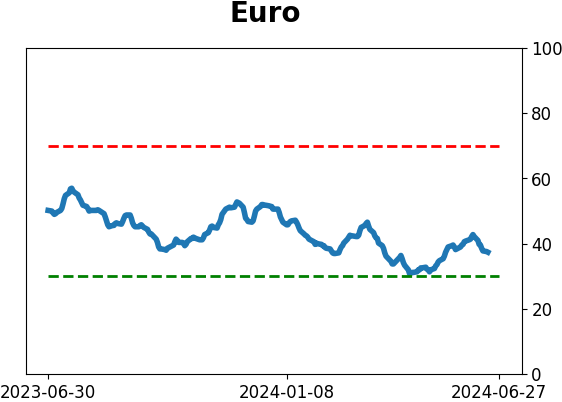
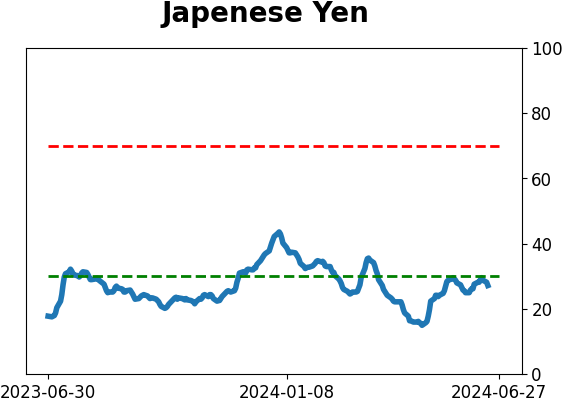
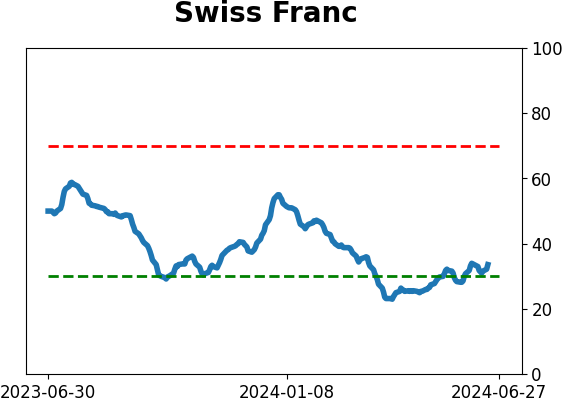
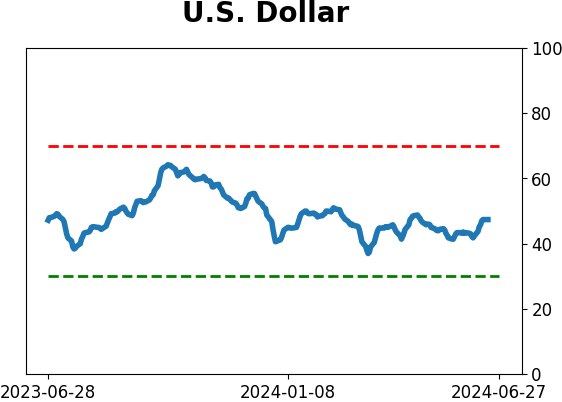
Currency ETF's - 5-Day Moving Average
|
|
|
Commodity ETF's - 5-Day Moving Average
|
|