Headlines
|
|
A record tech divergence at record highs:
The Nasdaq 100 keeps rising to record highs, but few stocks are coming along. More and more of its member stocks are hitting new lows across time frames, and fewer stocks are holding above their moving averages. The divergences are the widest in the index's history. Similar behavior preceded weakness with great consistency.
|
Smart / Dumb Money Confidence
|
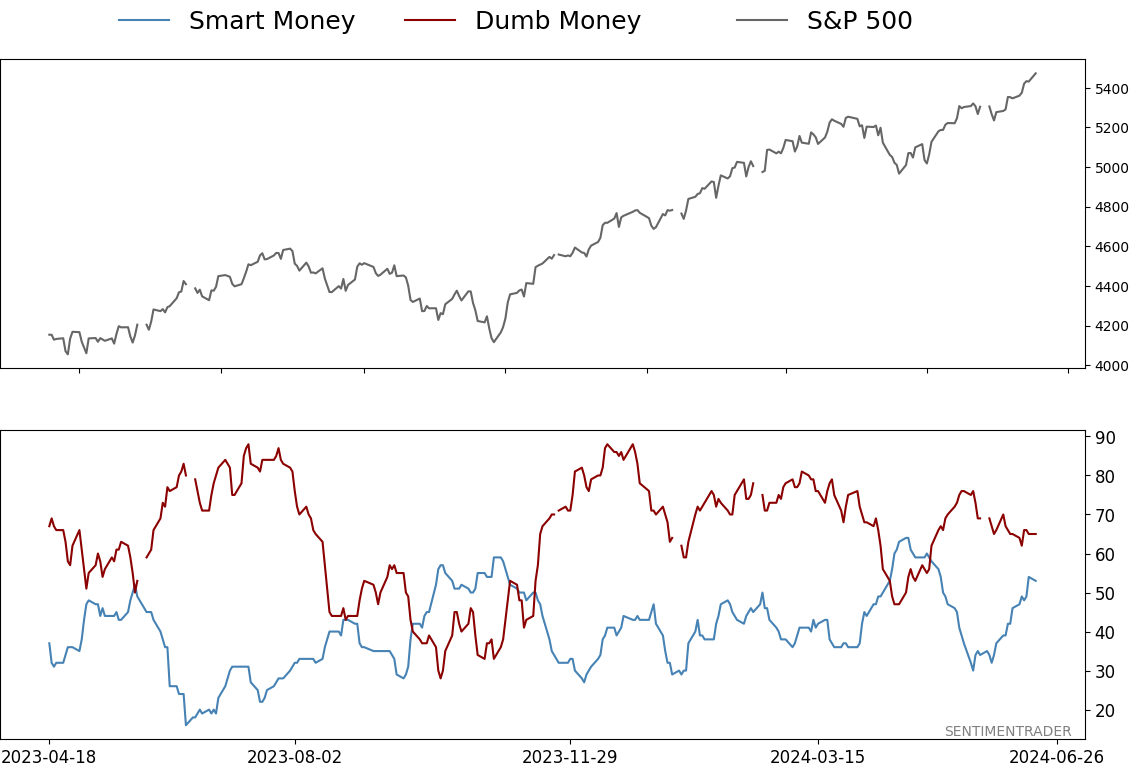
Smart Money Confidence: 53%
Dumb Money Confidence: 65%
|
|
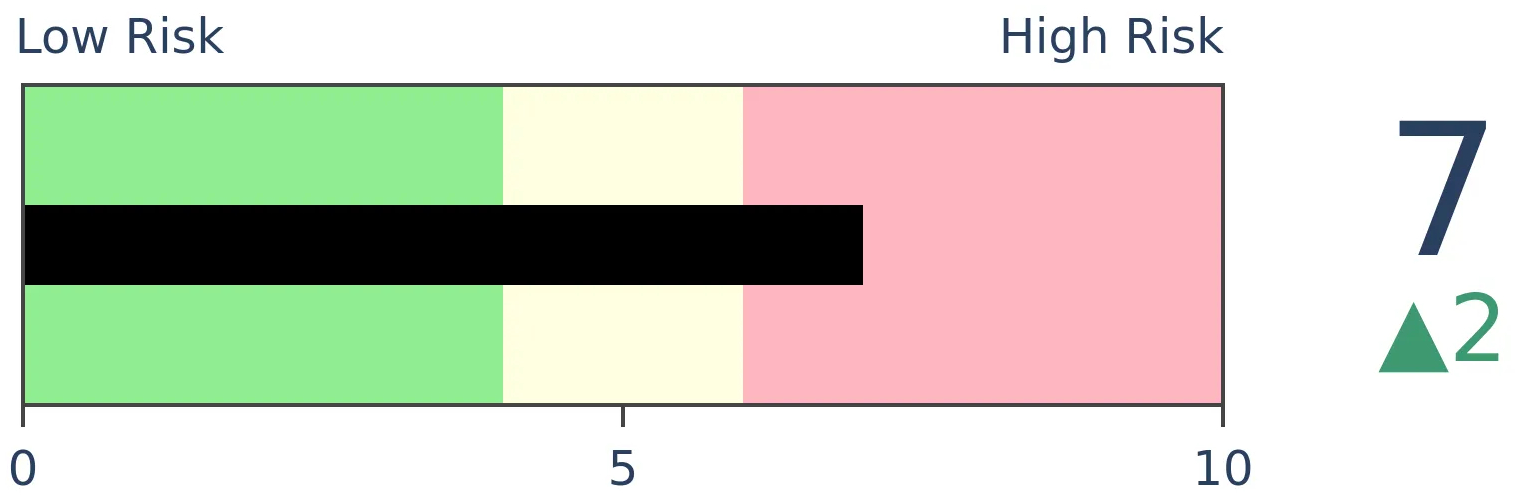
Risk Levels
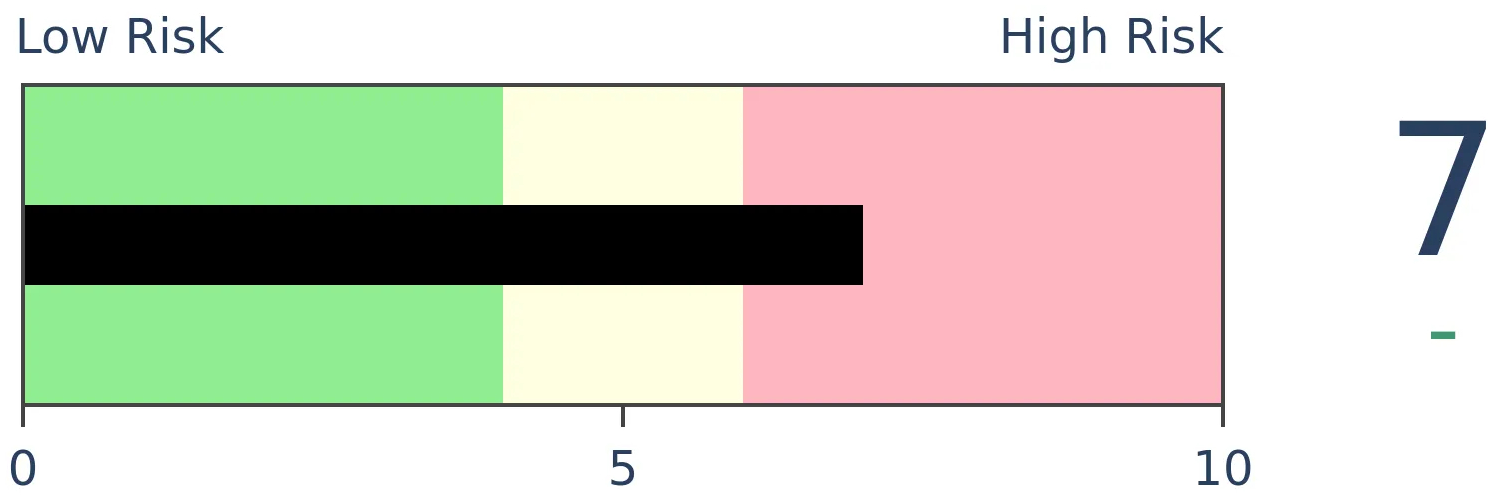
Stocks Short-Term
|
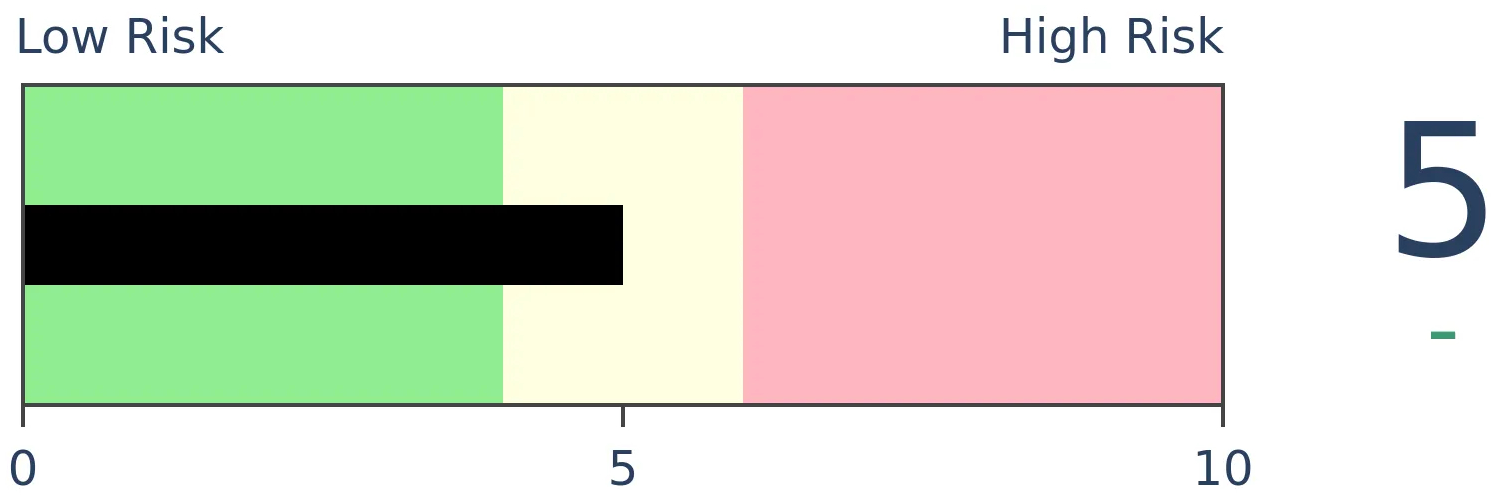
Stocks Medium-Term
|
|
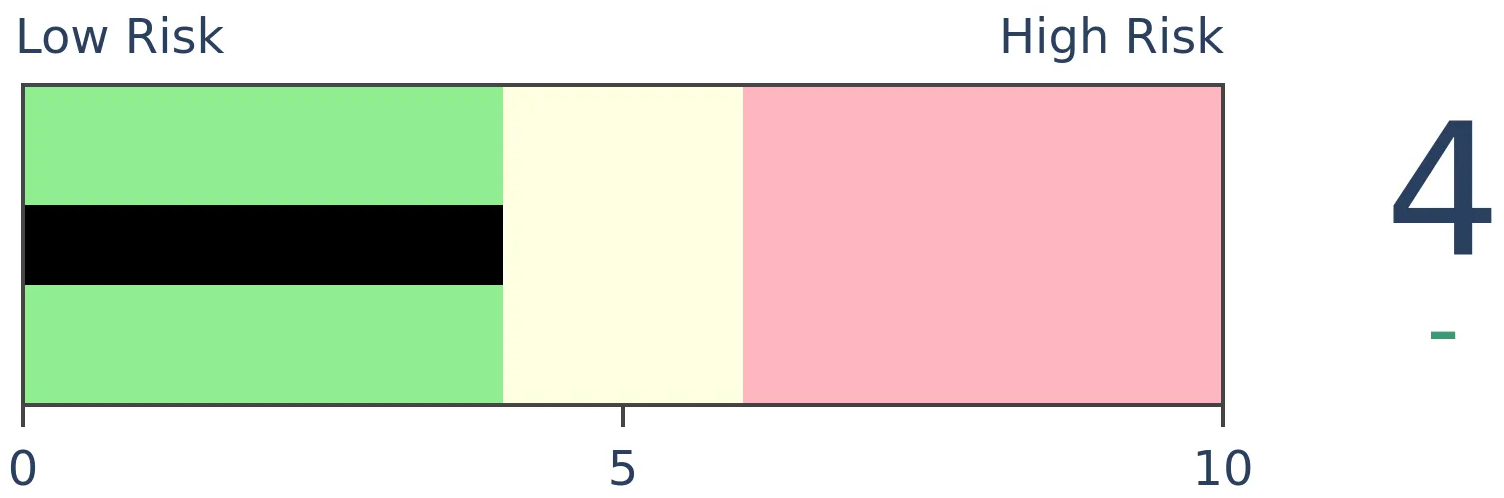
Bonds
|
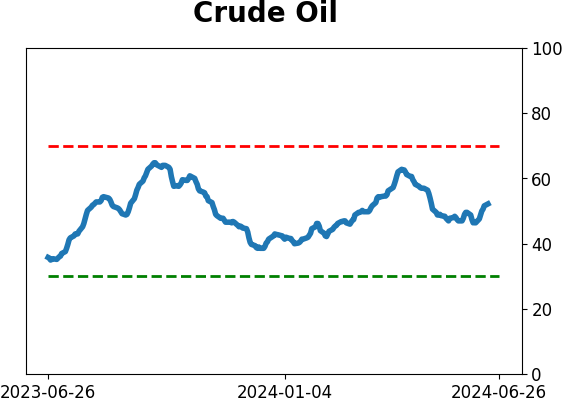
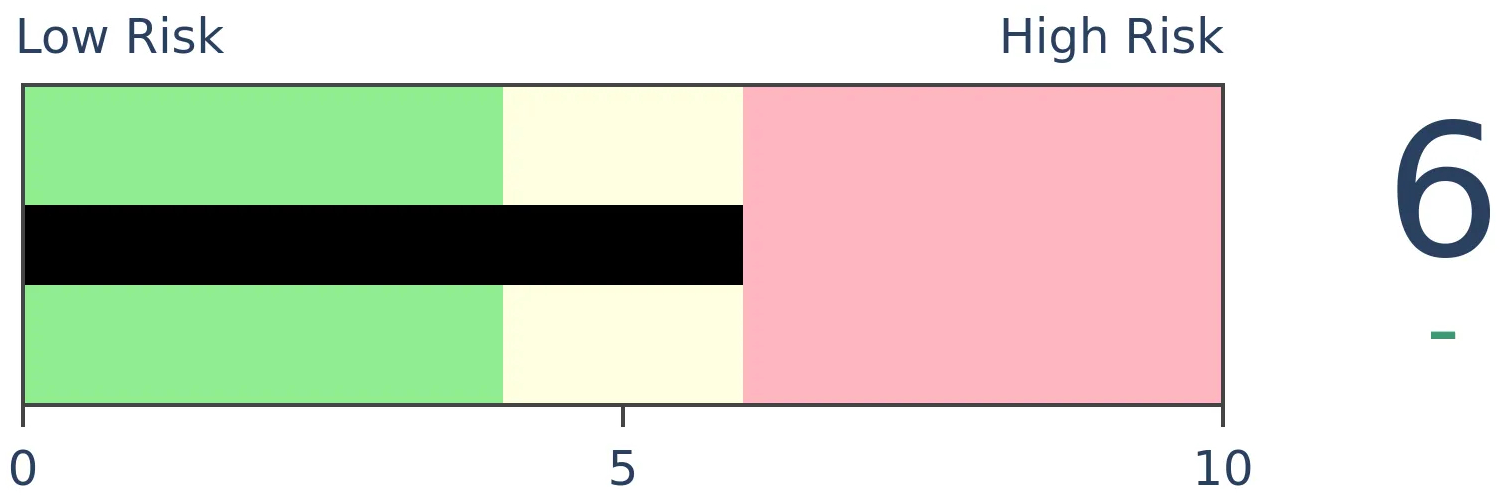
Crude Oil
|
|
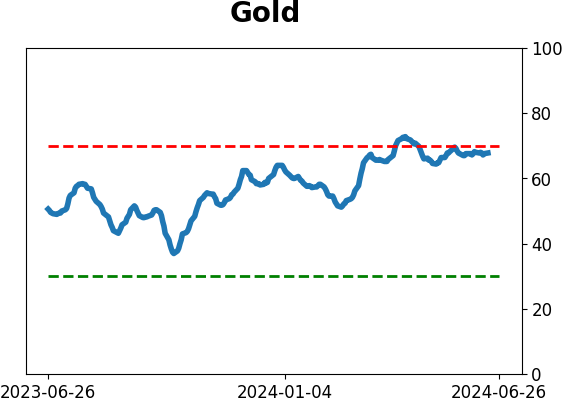
Gold
|
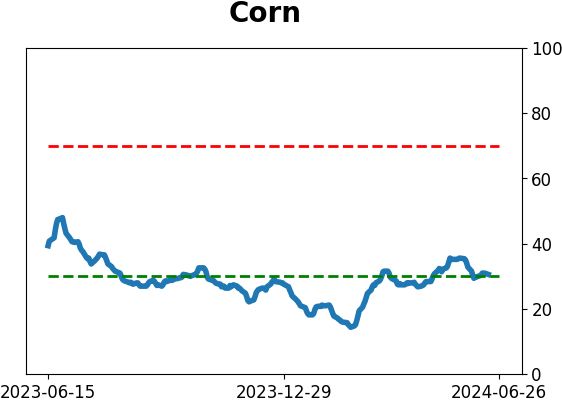
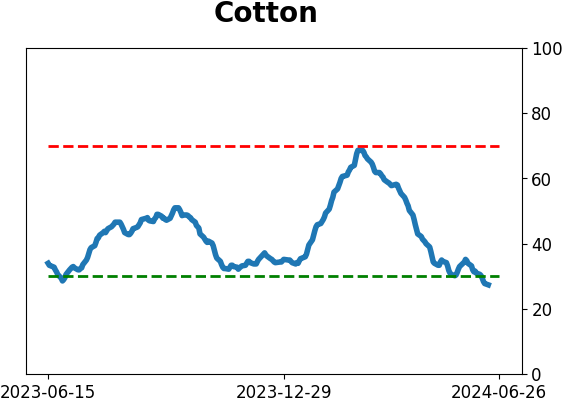
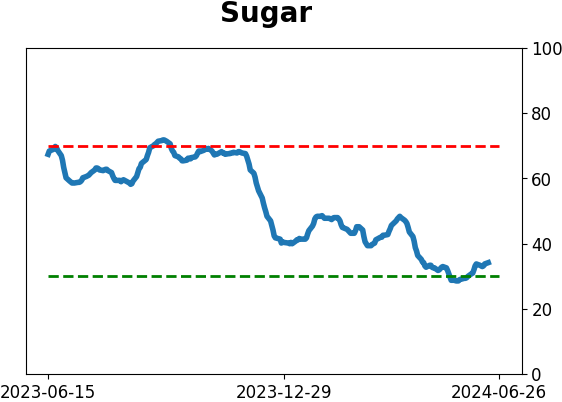
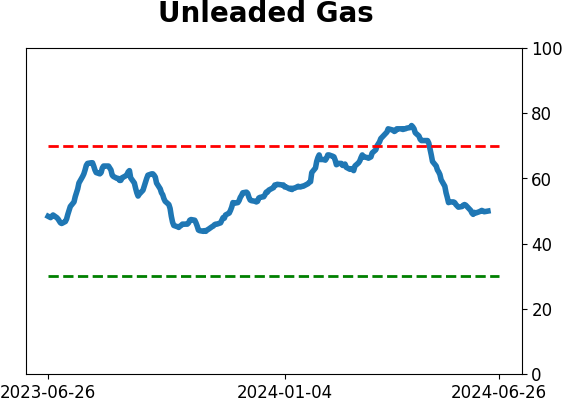
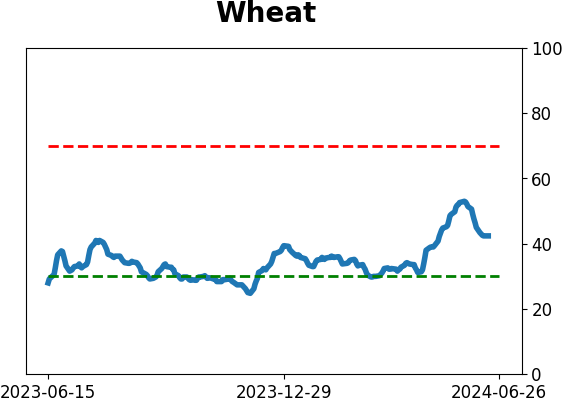
Agriculture

|
|
Research
By Jason Goepfert
BOTTOM LINE
The Nasdaq 100 keeps rising to record highs, but few stocks are coming along. More and more of its member stocks are hitting new lows across time frames, and fewer stocks are holding above their moving averages. The divergences are the widest in the index's history. Similar behavior preceded weakness with great consistency.
FORECAST / TIMEFRAME
QQQ -- Down, Medium-Term
|
Key points:
- As the Nasdaq 100 rises to record highs, fewer stocks are in uptrends, and more are hitting fresh lows
- This is evident across time frames to a level that has never been seen
- Under similar circumstances, the Nasdaq 100 rarely, if ever, escaped weakness over the medium-term
More and more new lows
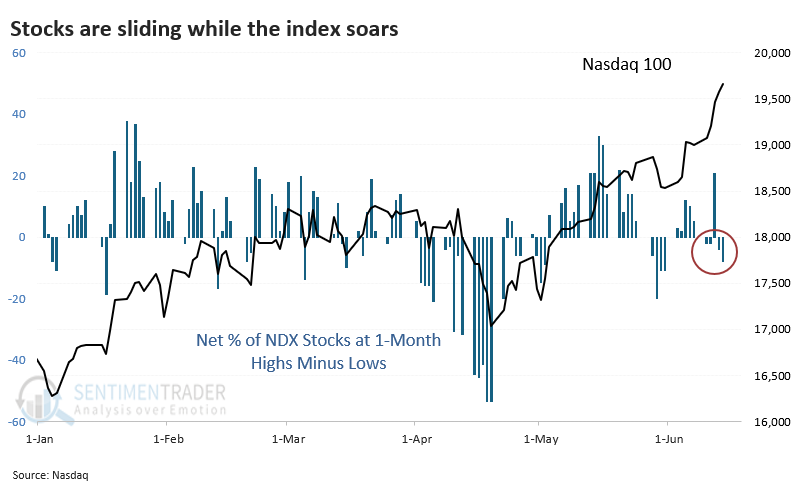
The big-tech-dominated Nasdaq 100 (NDX) continues to notch record high after record high. However, many of its stocks are not only lagging, but they're falling to monthly, quarterly, or even yearly lows.
This is not normal. In fact, it's never happened before to this degree.
Take, for example, the percentage of stocks in the Nasdaq 100 that are hitting 1-month highs minus those hitting 1-month lows. It's a negative number, meaning more stocks are falling to monthly lows than rising to monthly highs.
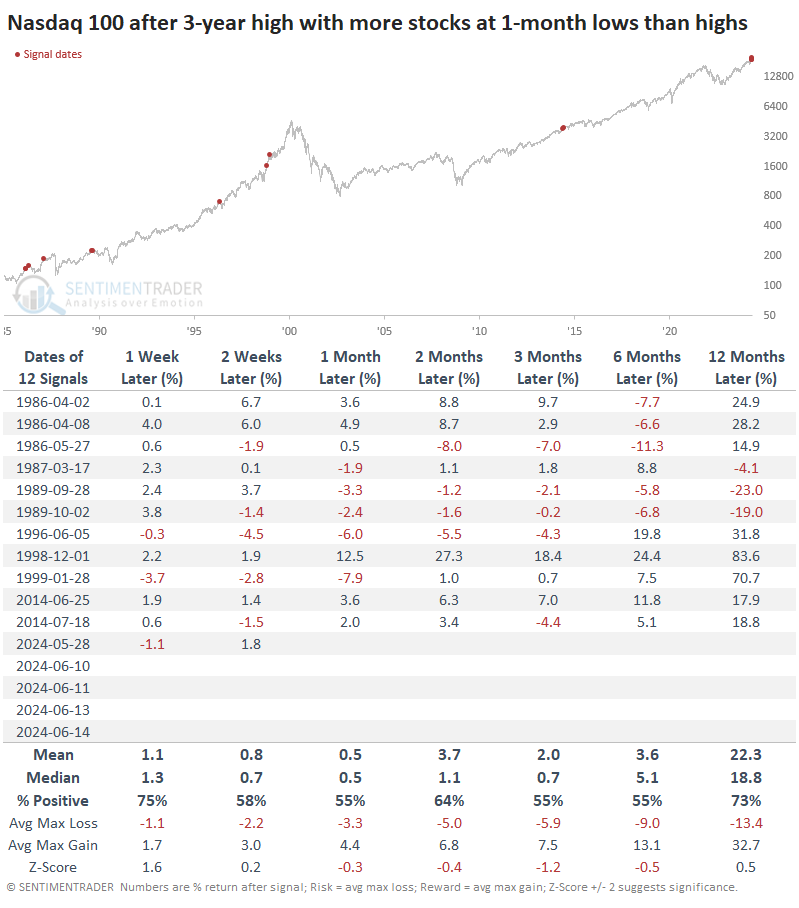
The table below shows that this is an unusual situation, but it actually wasn't that bad for future returns - for a while. The index bucked off this negative breadth for a long time as tech stocks soared into the internet bubble peak in the late 1990s, and it didn't have too much of an impact in 2014. Outside of that, the upside tended to be significantly more capped.
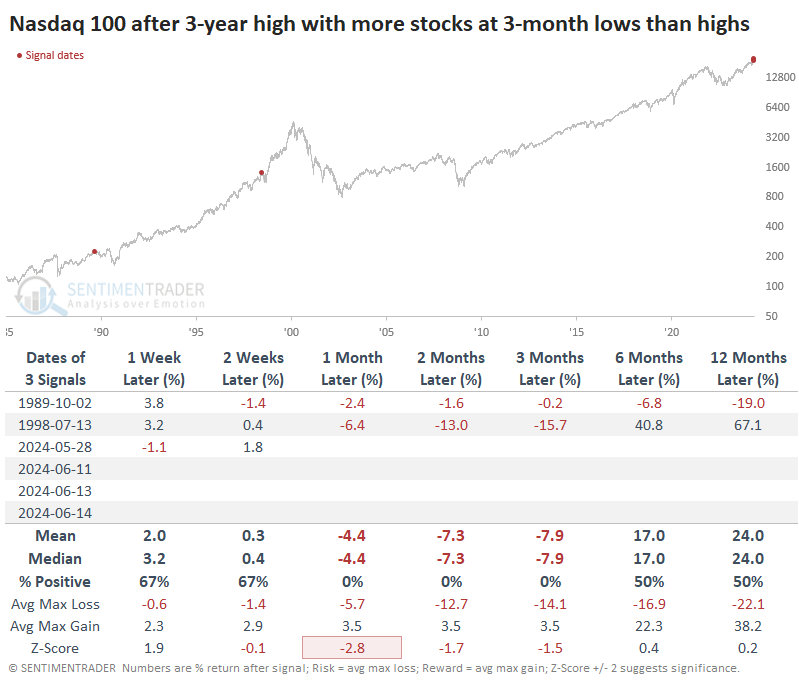
But the issue is not just stocks at monthly highs and lows. Because of the short lookback period, it's a relatively noisy data series.
A similar divergence is even evident at the 3-month level. There have only been two other distinct times when the NDX closed at a 3-year high, but more stocks fell to 3-month lows than rose to 3-month highs. Both preceded nearly immediate pullbacks. The current environment has witnessed four such days in the past few weeks.
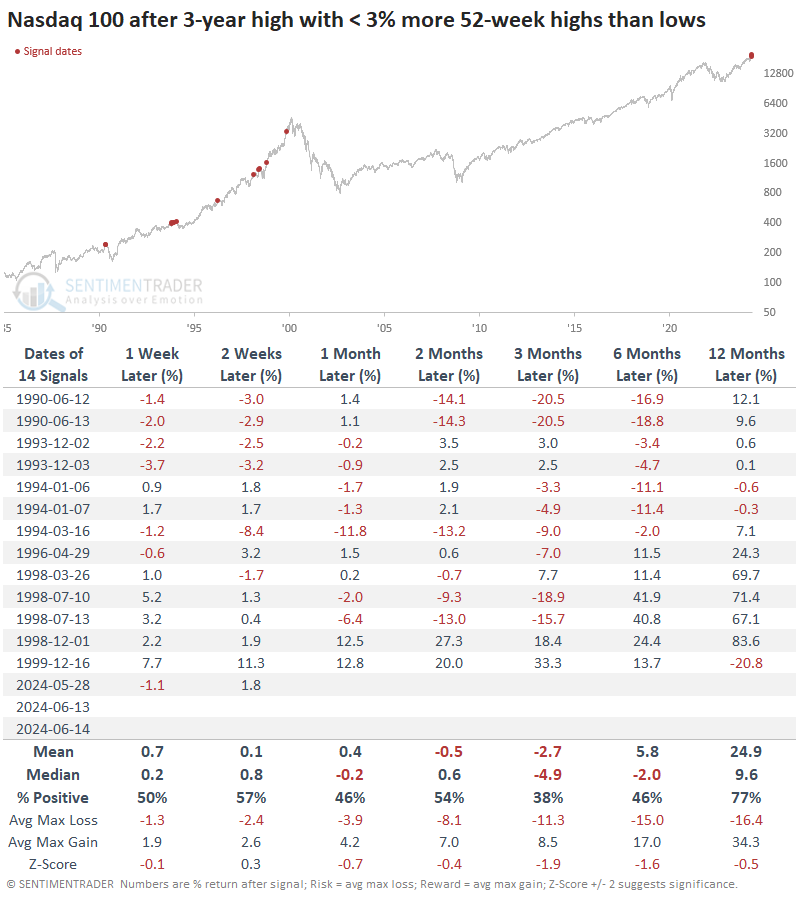
Even on a longer time frame, the trends are not healthy. As of Friday, there were fewer than 3% more stocks at 52-week highs than lows. This exceptionally weak reading was last seen about 25 years ago.
Fewer and fewer uptrends
We can also see weak breadth trends by observing the percentage of Nasdaq 100 stocks trading above their 10-day, 50-day, and 200-day moving averages. Across the board, the current numbers are flaccid.
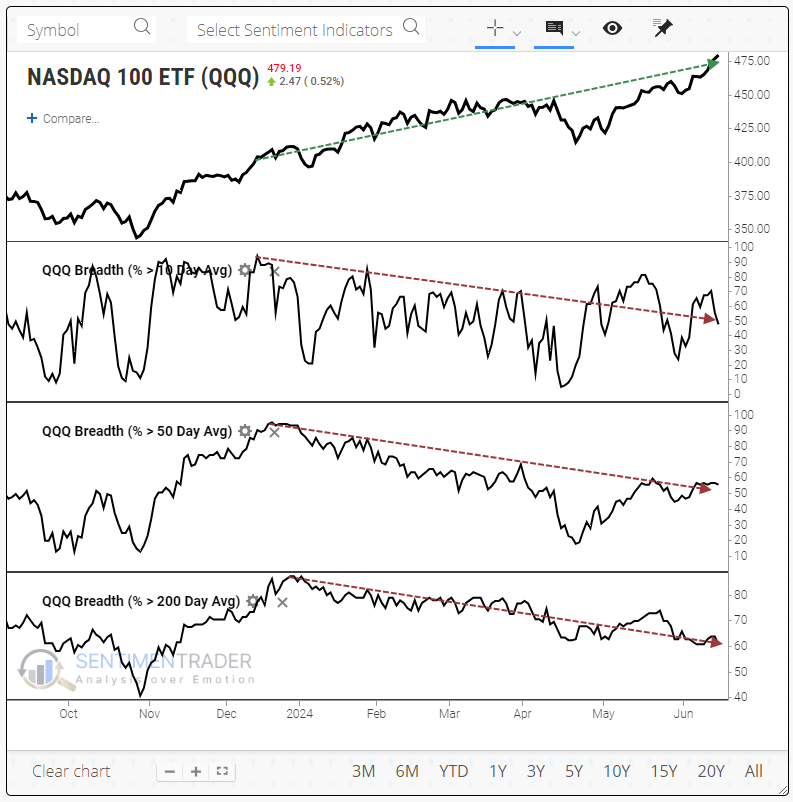
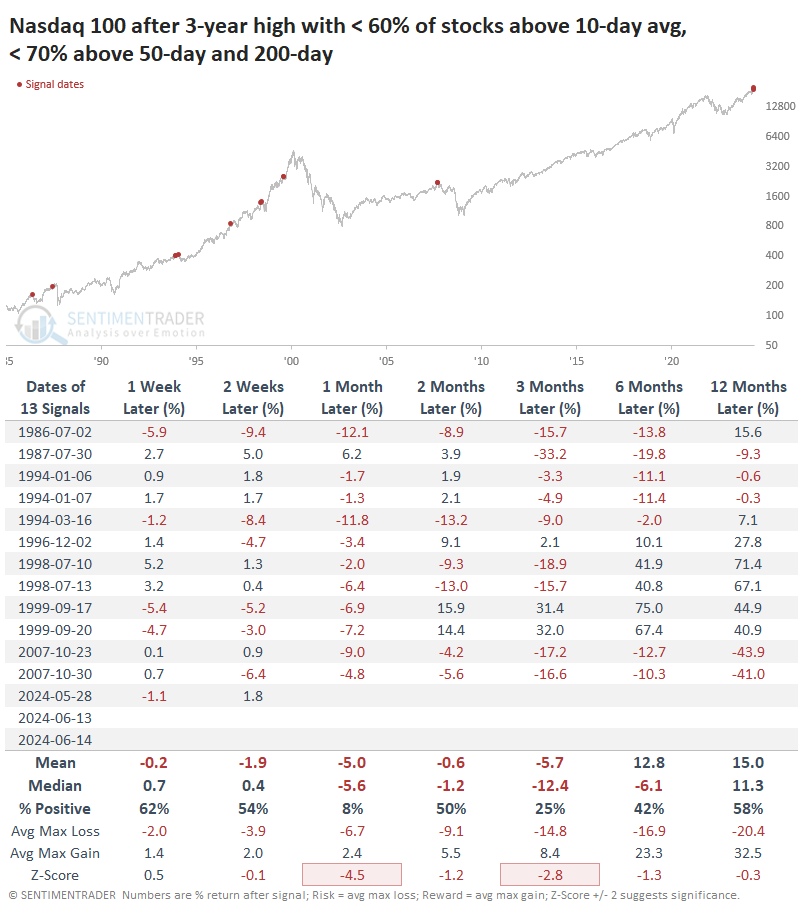
The only time in the past 20 years when so few members were above their moving averages was at the peak in October 2007. Every one of the prior dates witnessed weakness in the Nasdaq 100 between one and three months later.
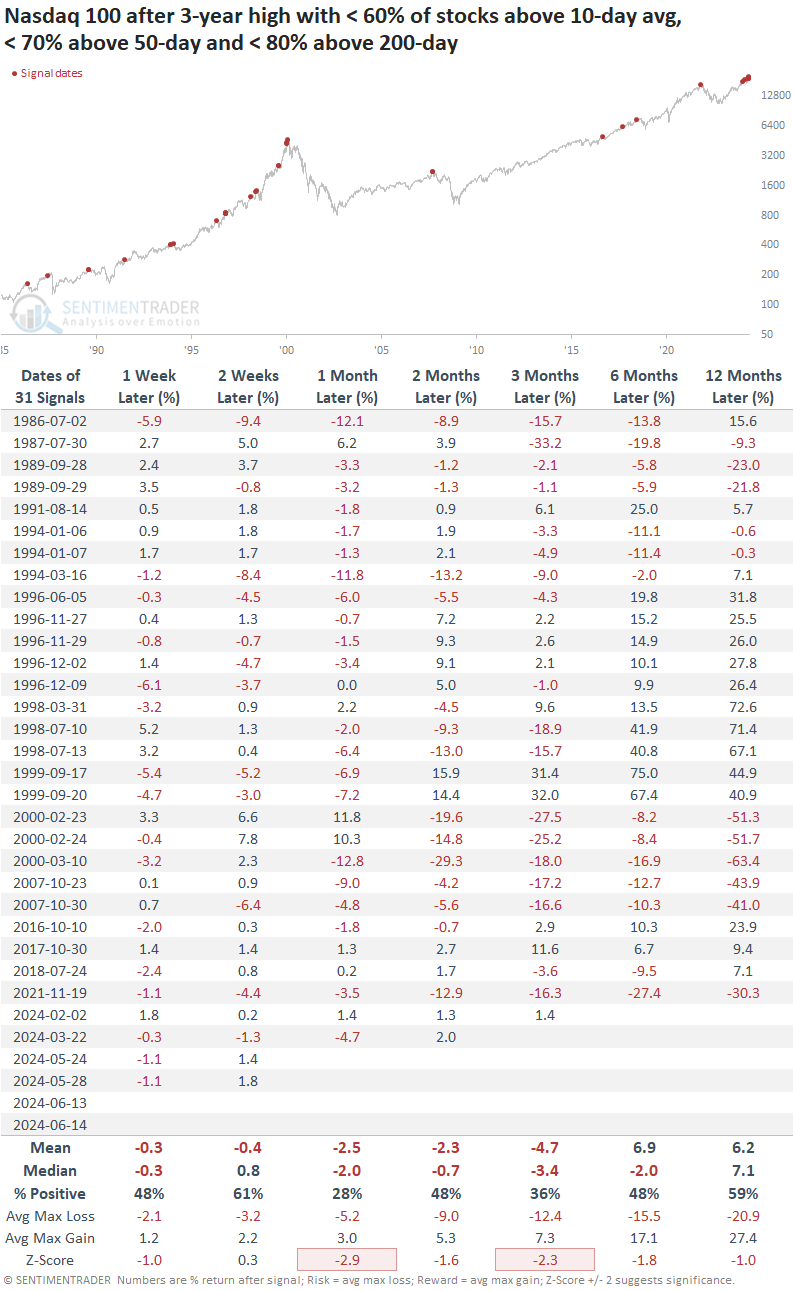
Even if we relax the parameters a bit and allow for more stocks trading above their 200-day moving average than we're seeing now, the sample size rises dramatically, but the results are still pretty horrid.
A caveat
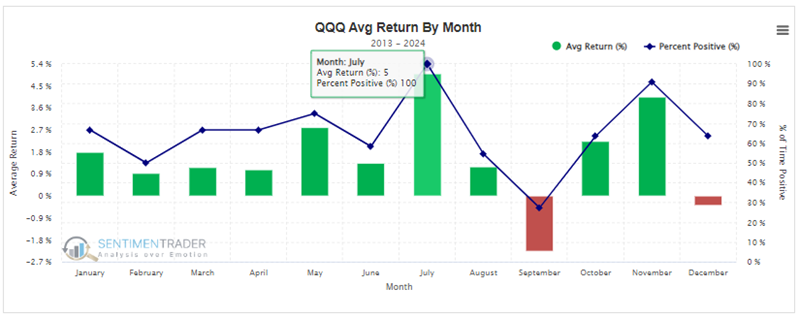
Momentum is an extremely powerful factor at times, especially when it comes to big tech stocks. Even outside of the late 1990s, they have periods where momentum can carry far beyond potential exhaustion points. Another factor arguing against an immediate peak is seasonality. While that's a tertiary consideration for stocks even at its most compelling, it's hard to ignore the fact that recent Julys have been very good to the Nasdaq 100.
The revamped Seasonality tool allows a user to specify an index, ETF, or stock and a lookback period. Over the past decade, QQQ has had a 100% win rate in July, while August and September have been much less friendly. This lines up well with the conclusions above.
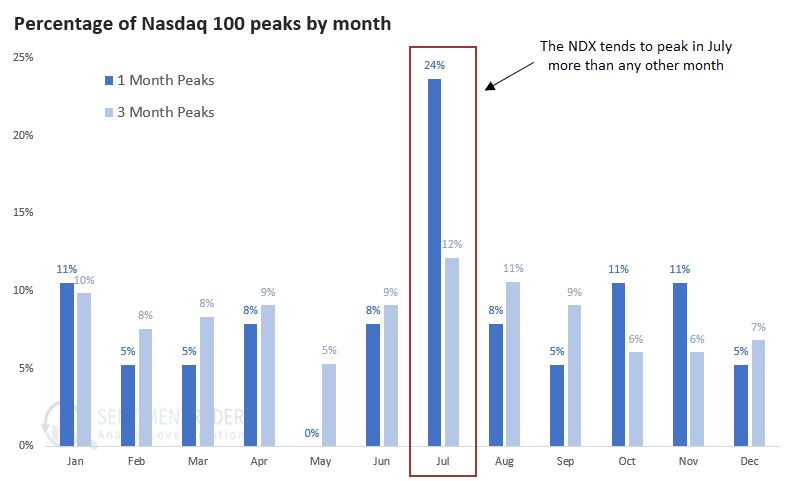
We can also see this tendency in the distribution of peaks by month. Since the inception of the Nasdaq 100 in the mid-1980s, it has shown a strong tendency to form short- to medium-term peaks in July more than any other month. A whopping 24% of 1-month peaks occurred in July, twice as many as any other month.
What the research tells us...
Anyone reading our research over the past couple of years should clearly understand that we're not doom-and-gloomers. Stocks rise most of the time, and those probabilities increase significantly when underlying conditions are healthy, as they've been for most of the past year and a half.
Things have changed in recent weeks, with more and more issues arising, particularly on the Nasdaq. There are a heck of a lot of weak issues on that exchange, and even within the curated Nasdaq 100 index. This is a stark change from what we'd been seeing. While there is a possibility that the average stock will catch up to the index, that is not how things usually pan out. Almost never, in fact. Risk is high in that index.
Indicators at Extremes
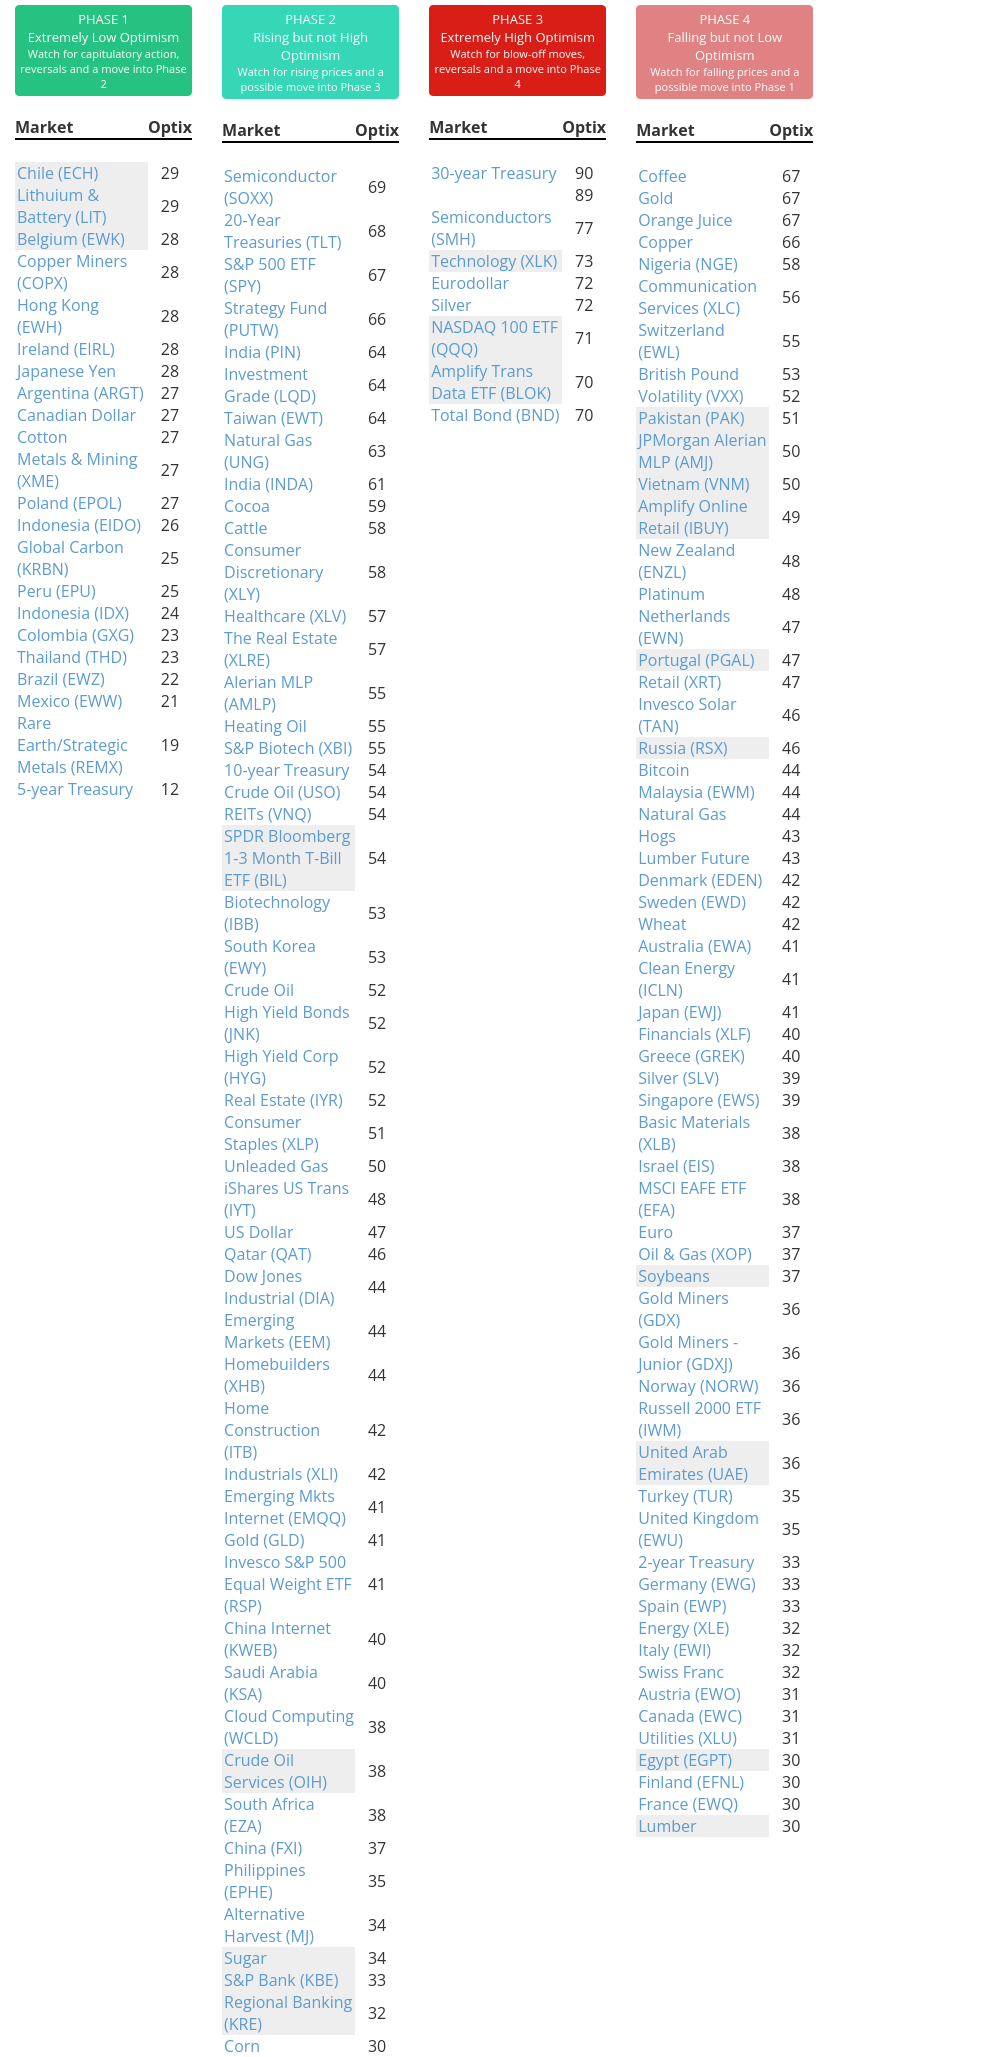
Phase Table
Ranks
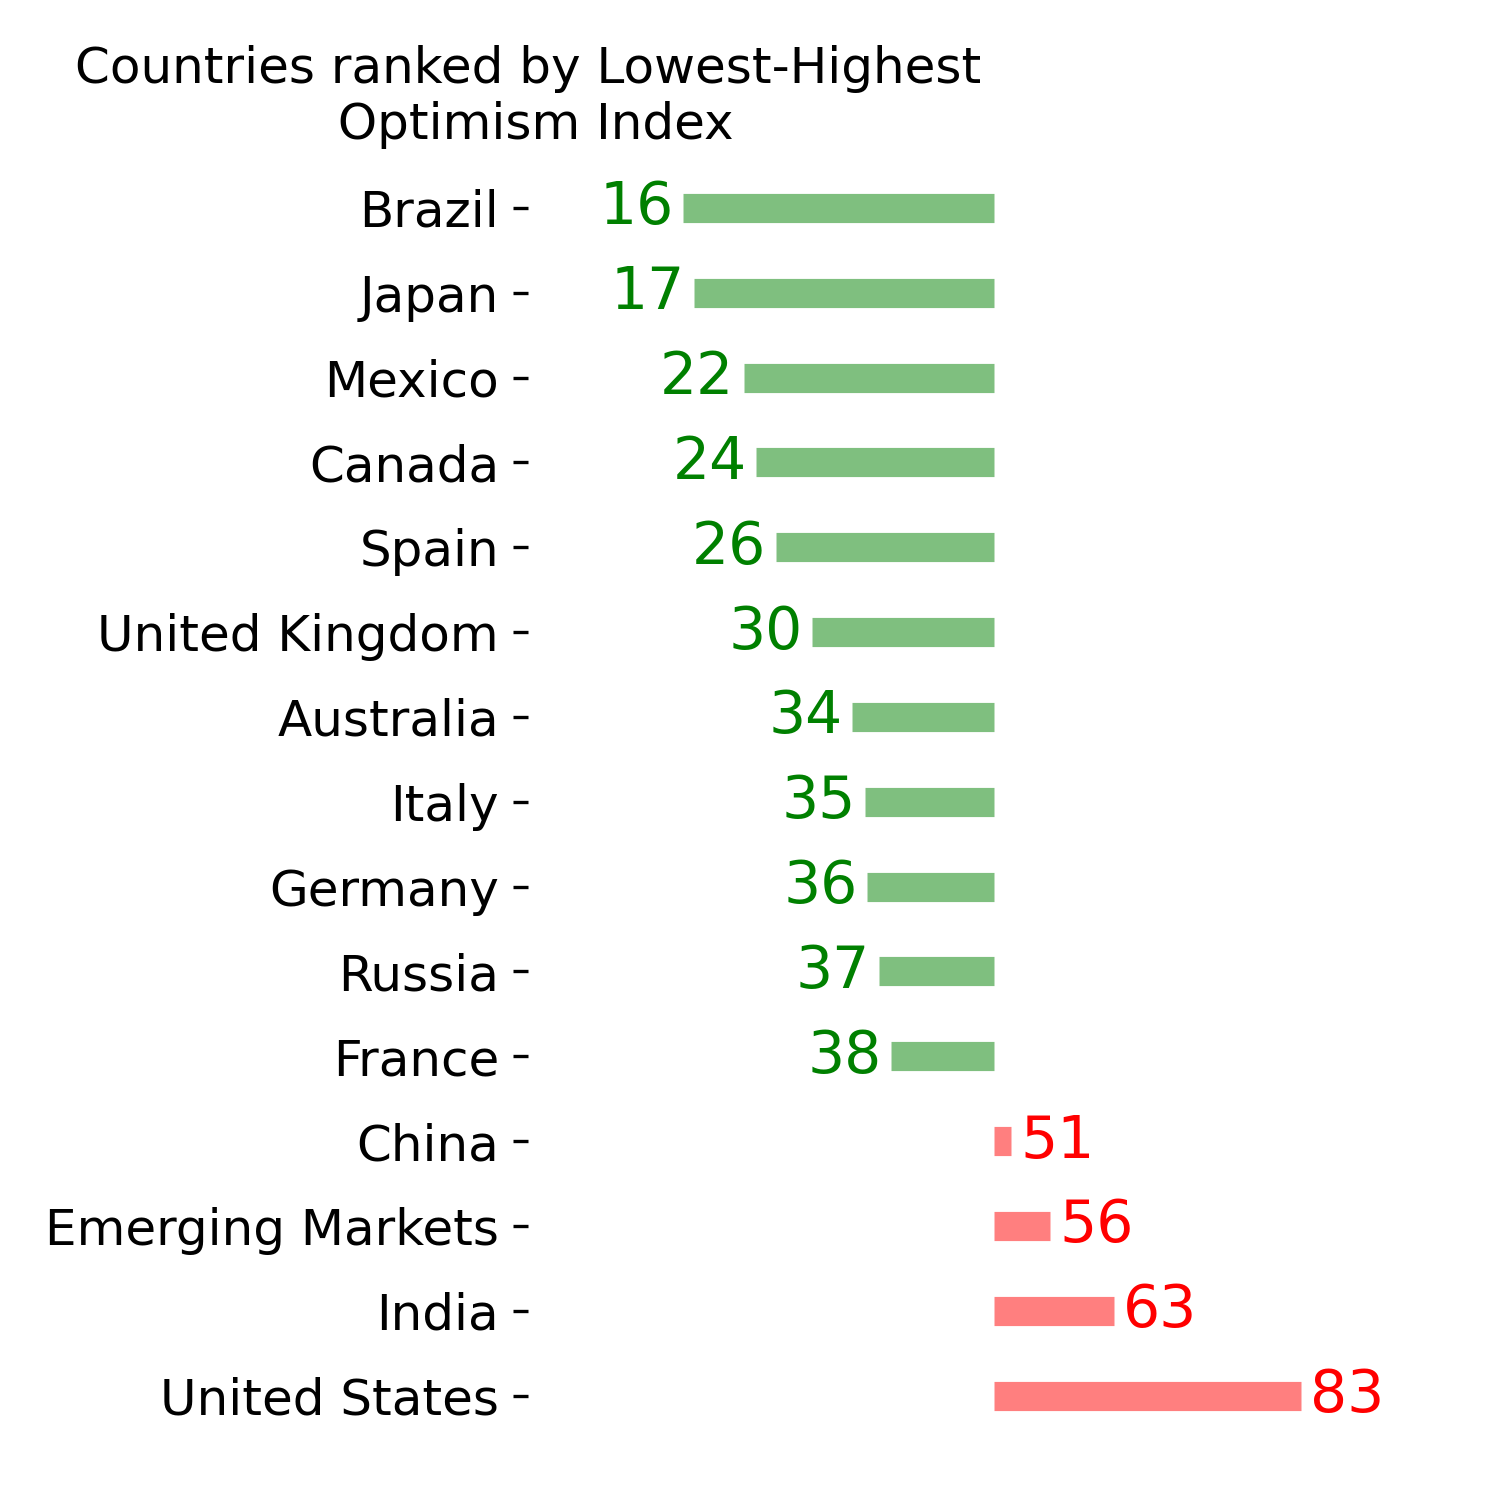
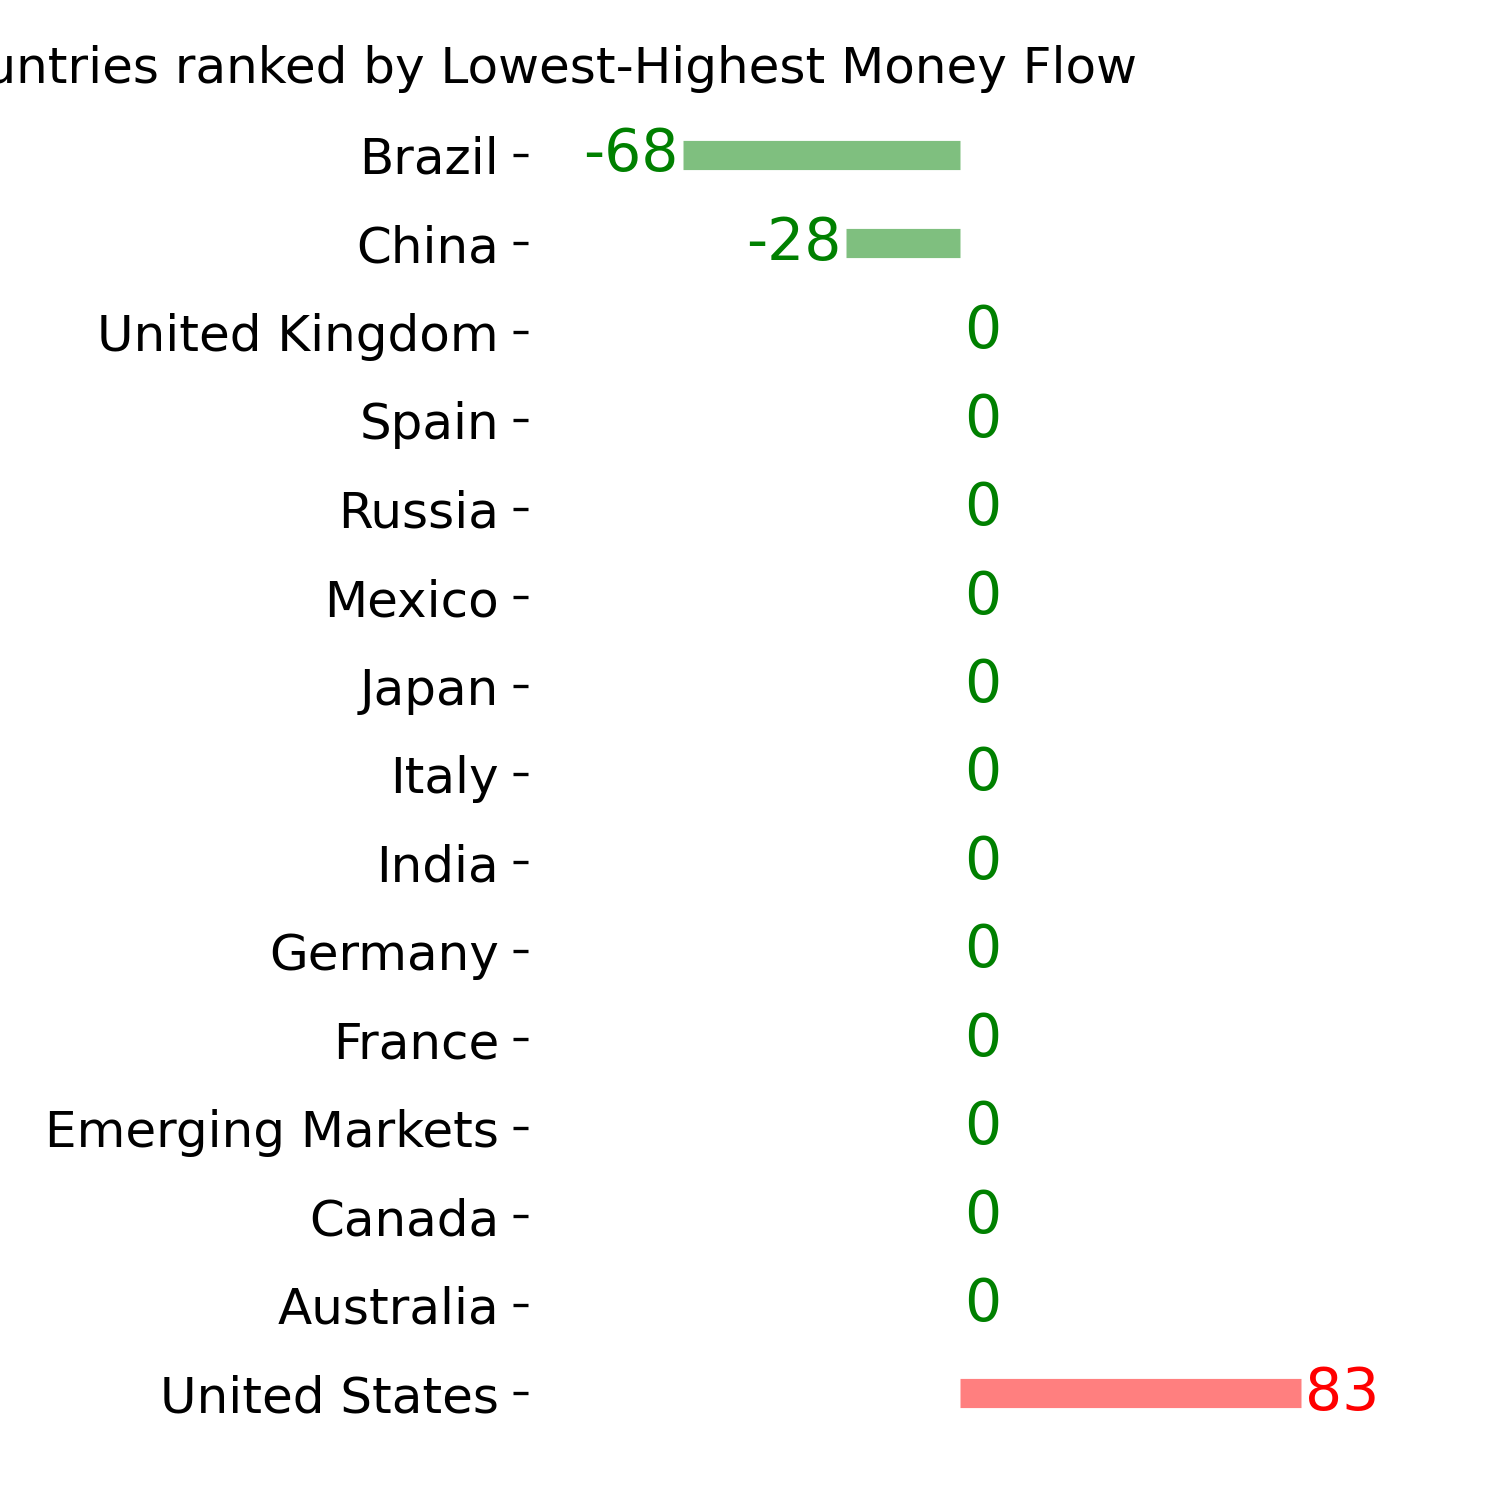
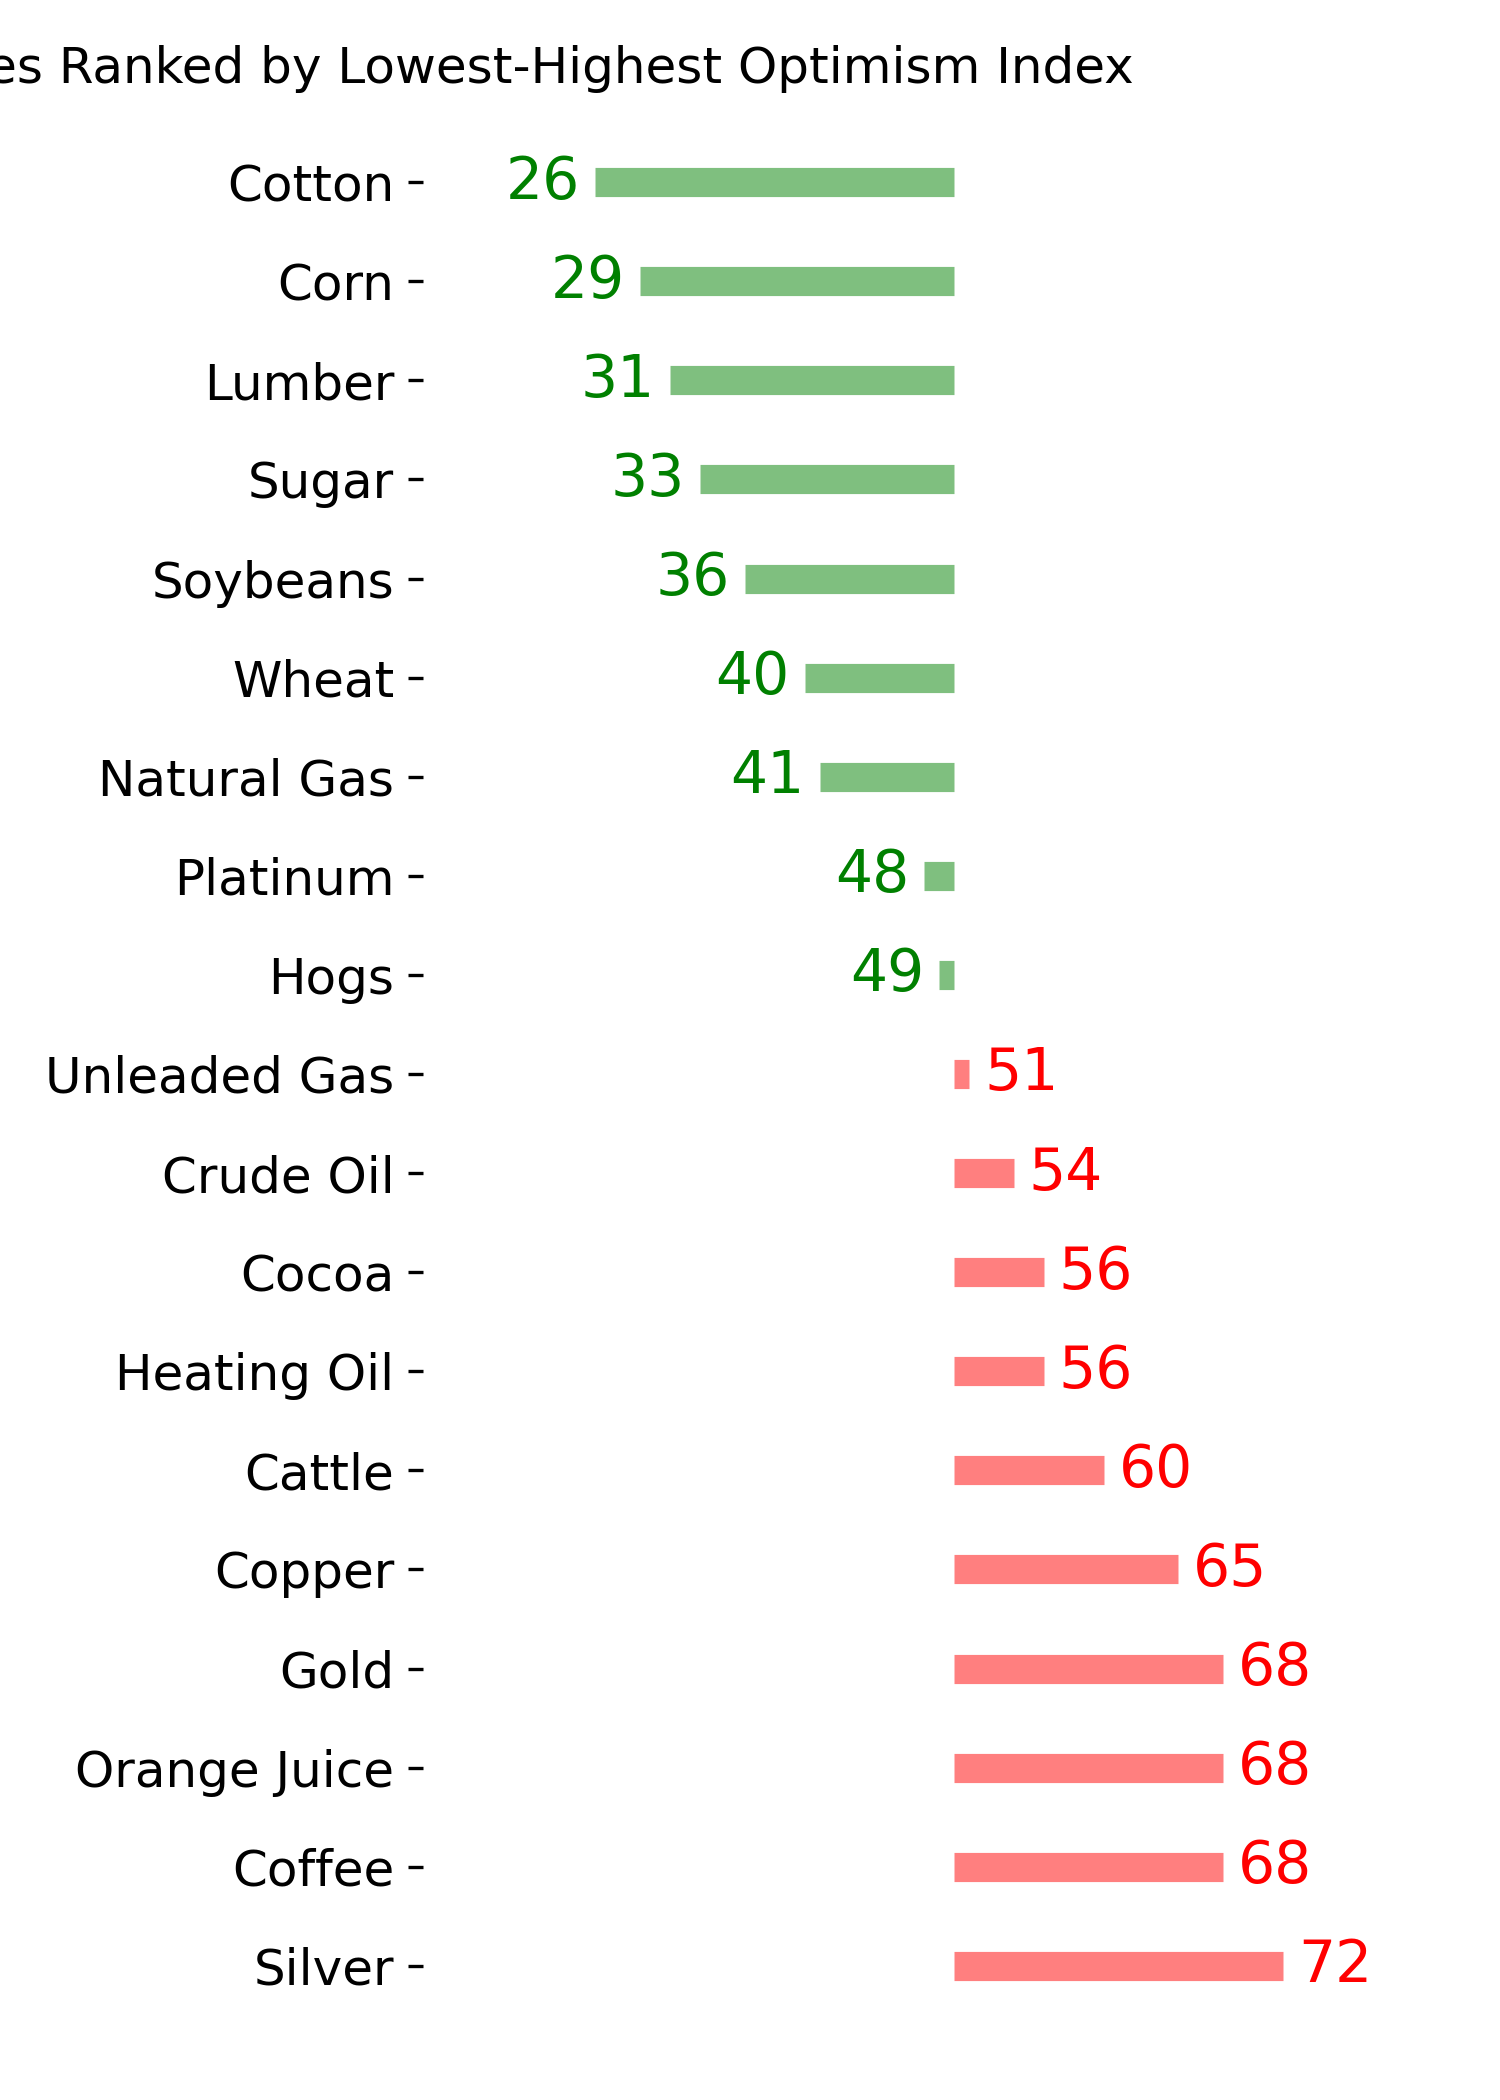
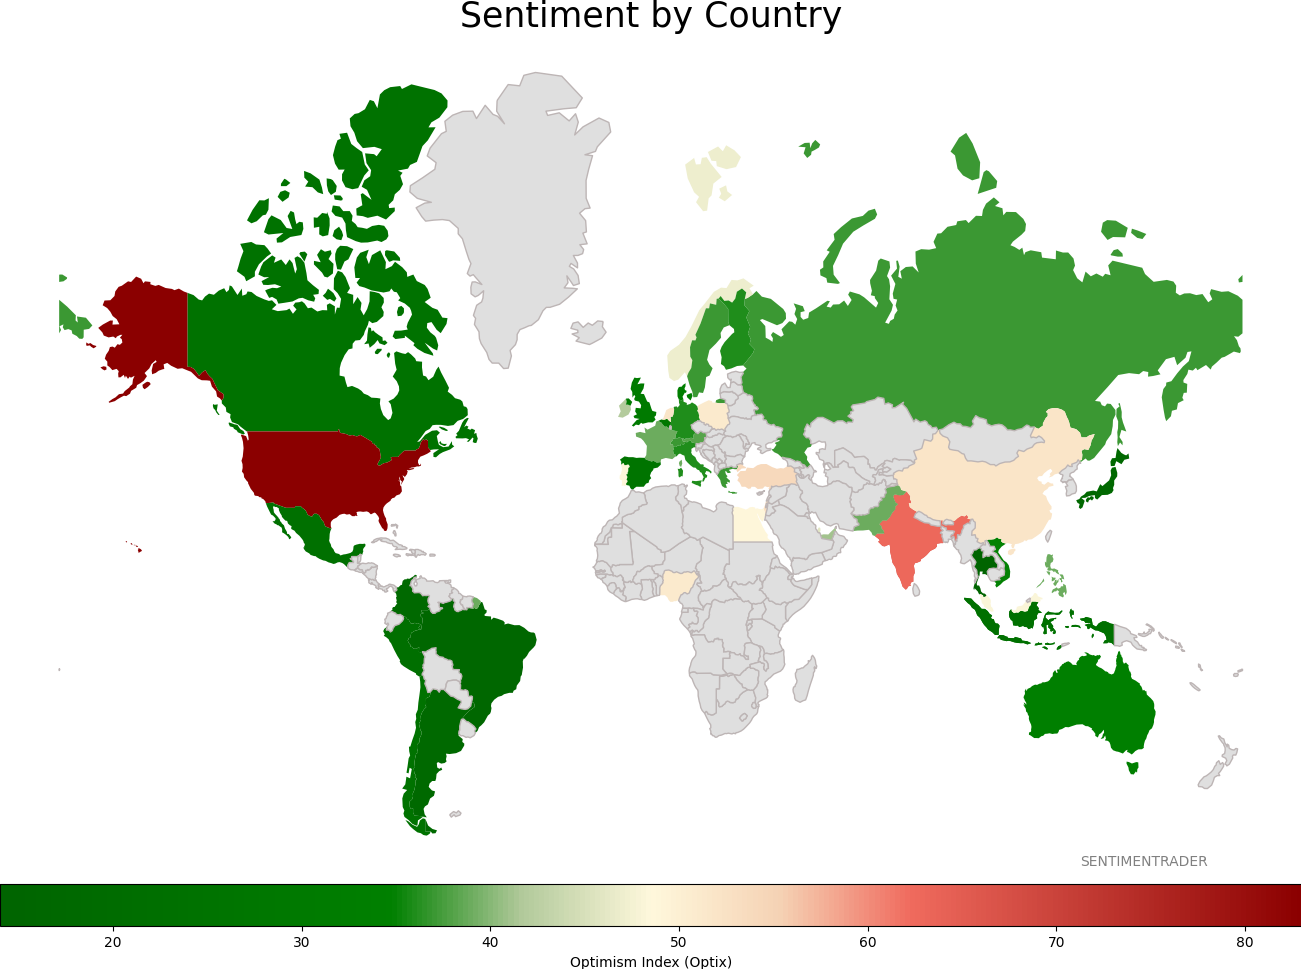
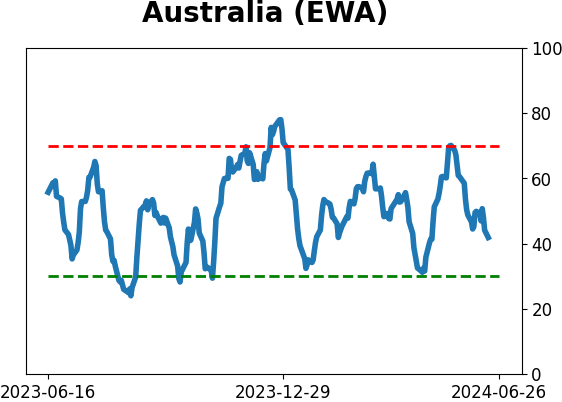
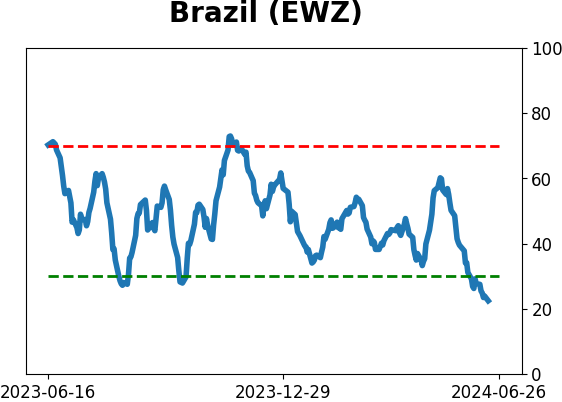
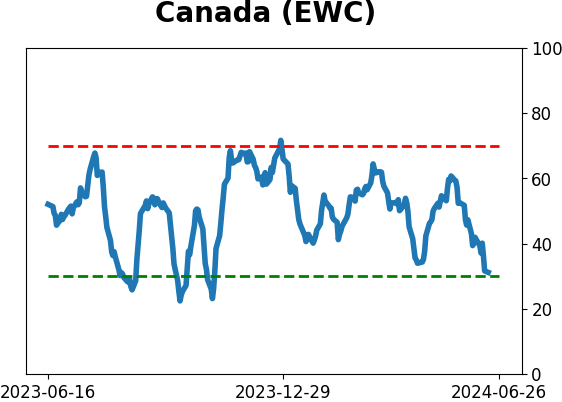
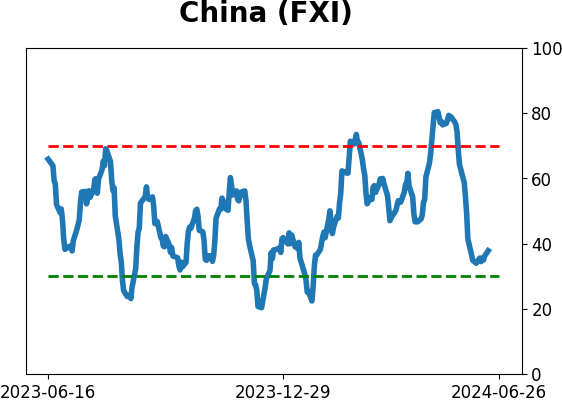
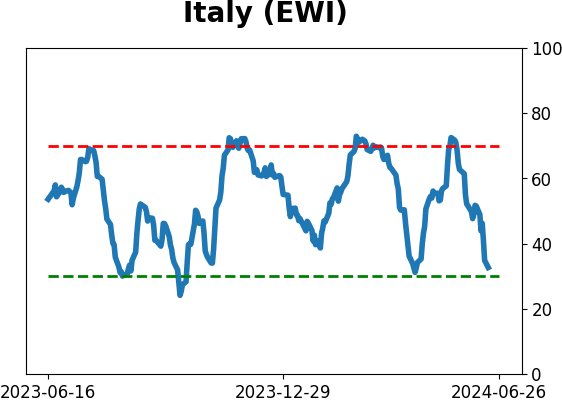
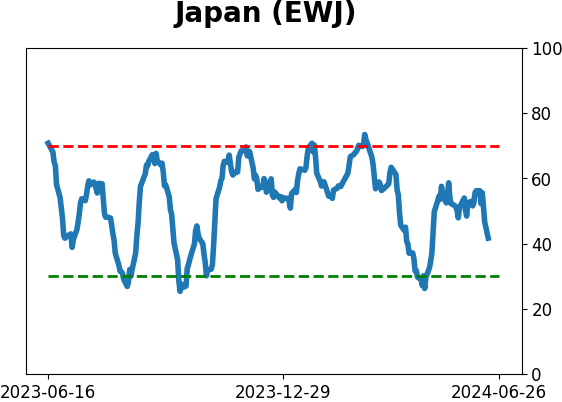
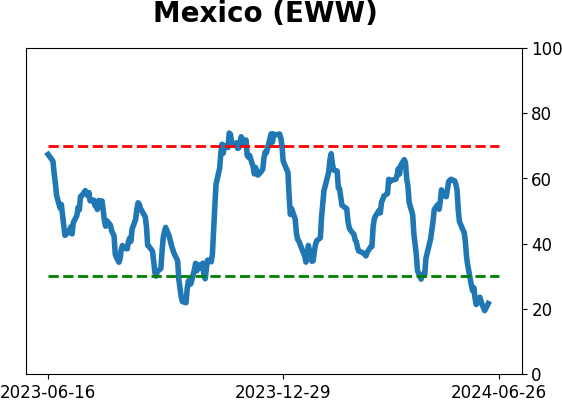
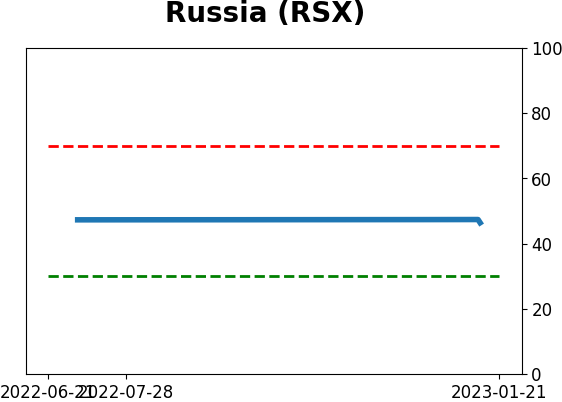
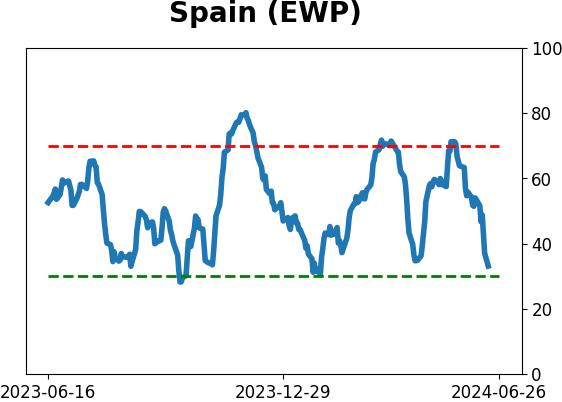
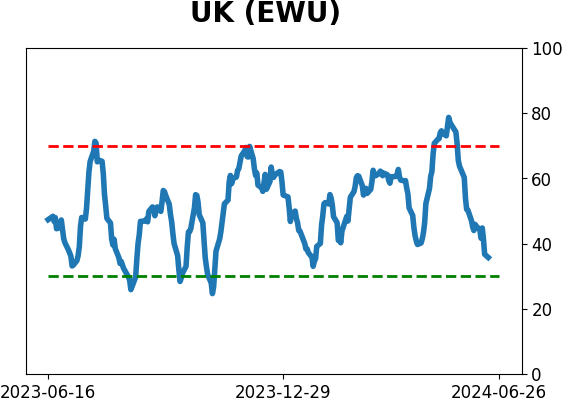
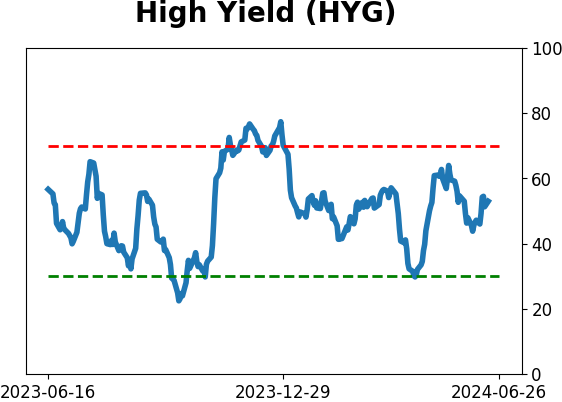
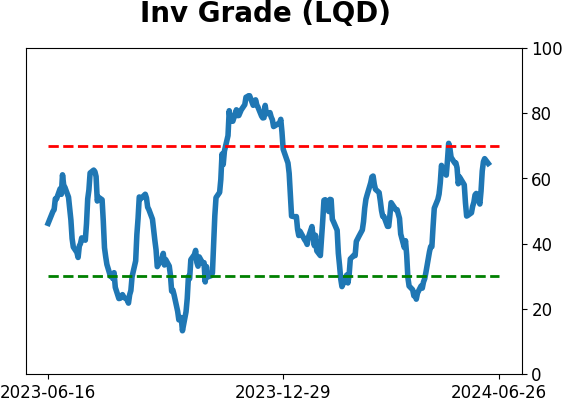
Sentiment Around The World
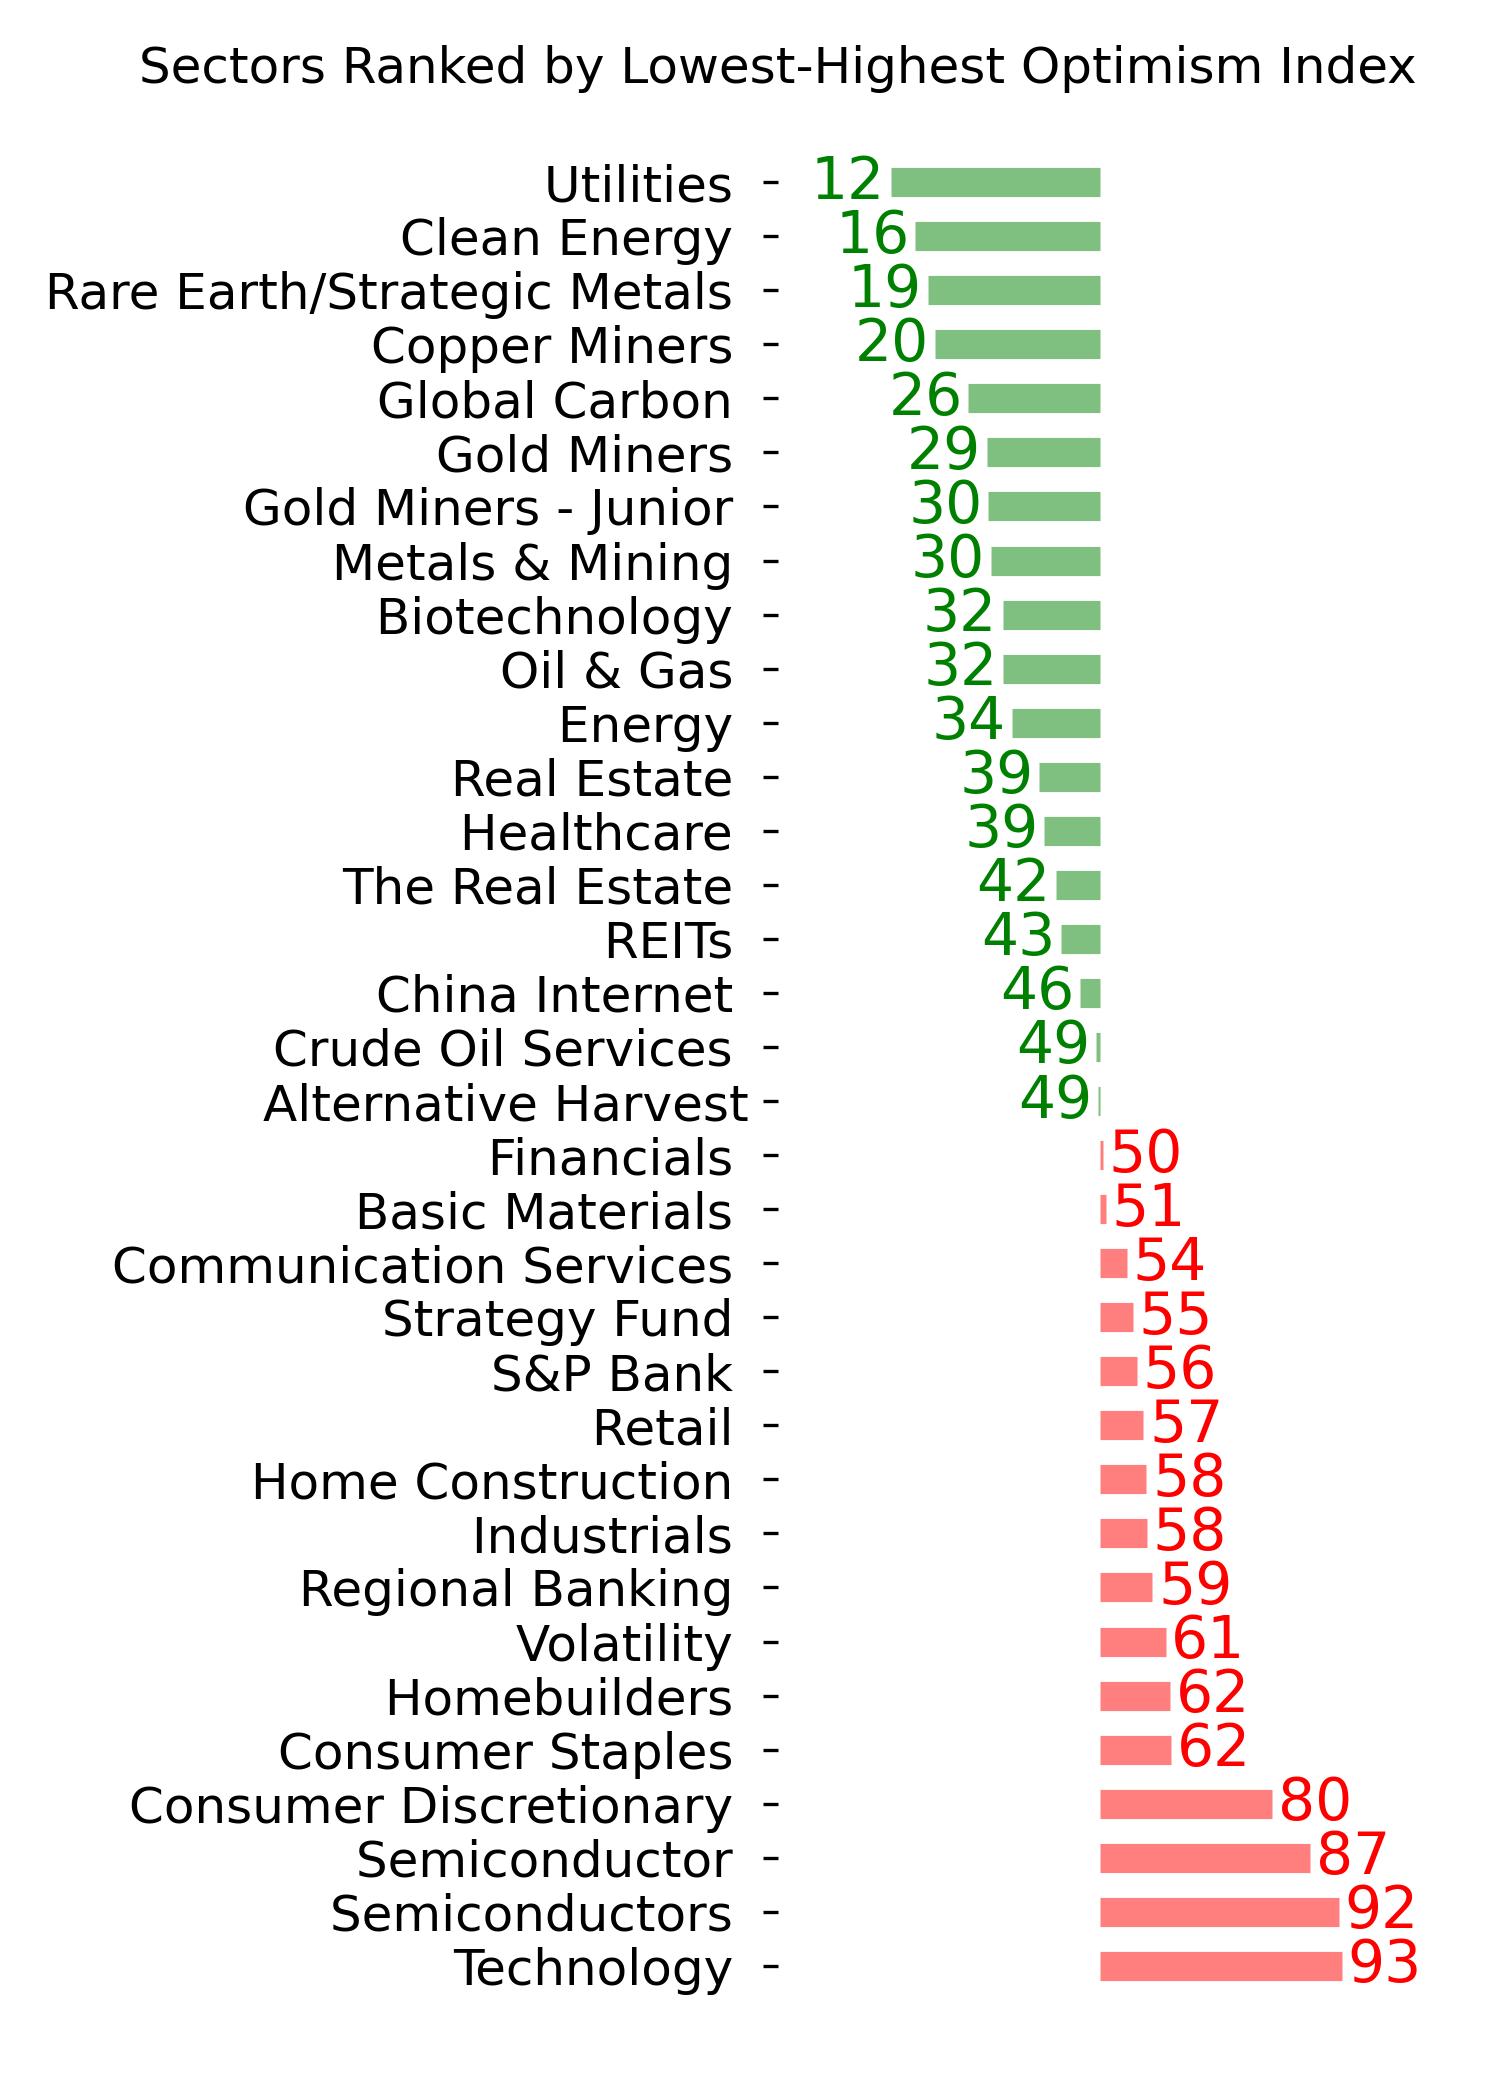
Optimism Index Thumbnails
|
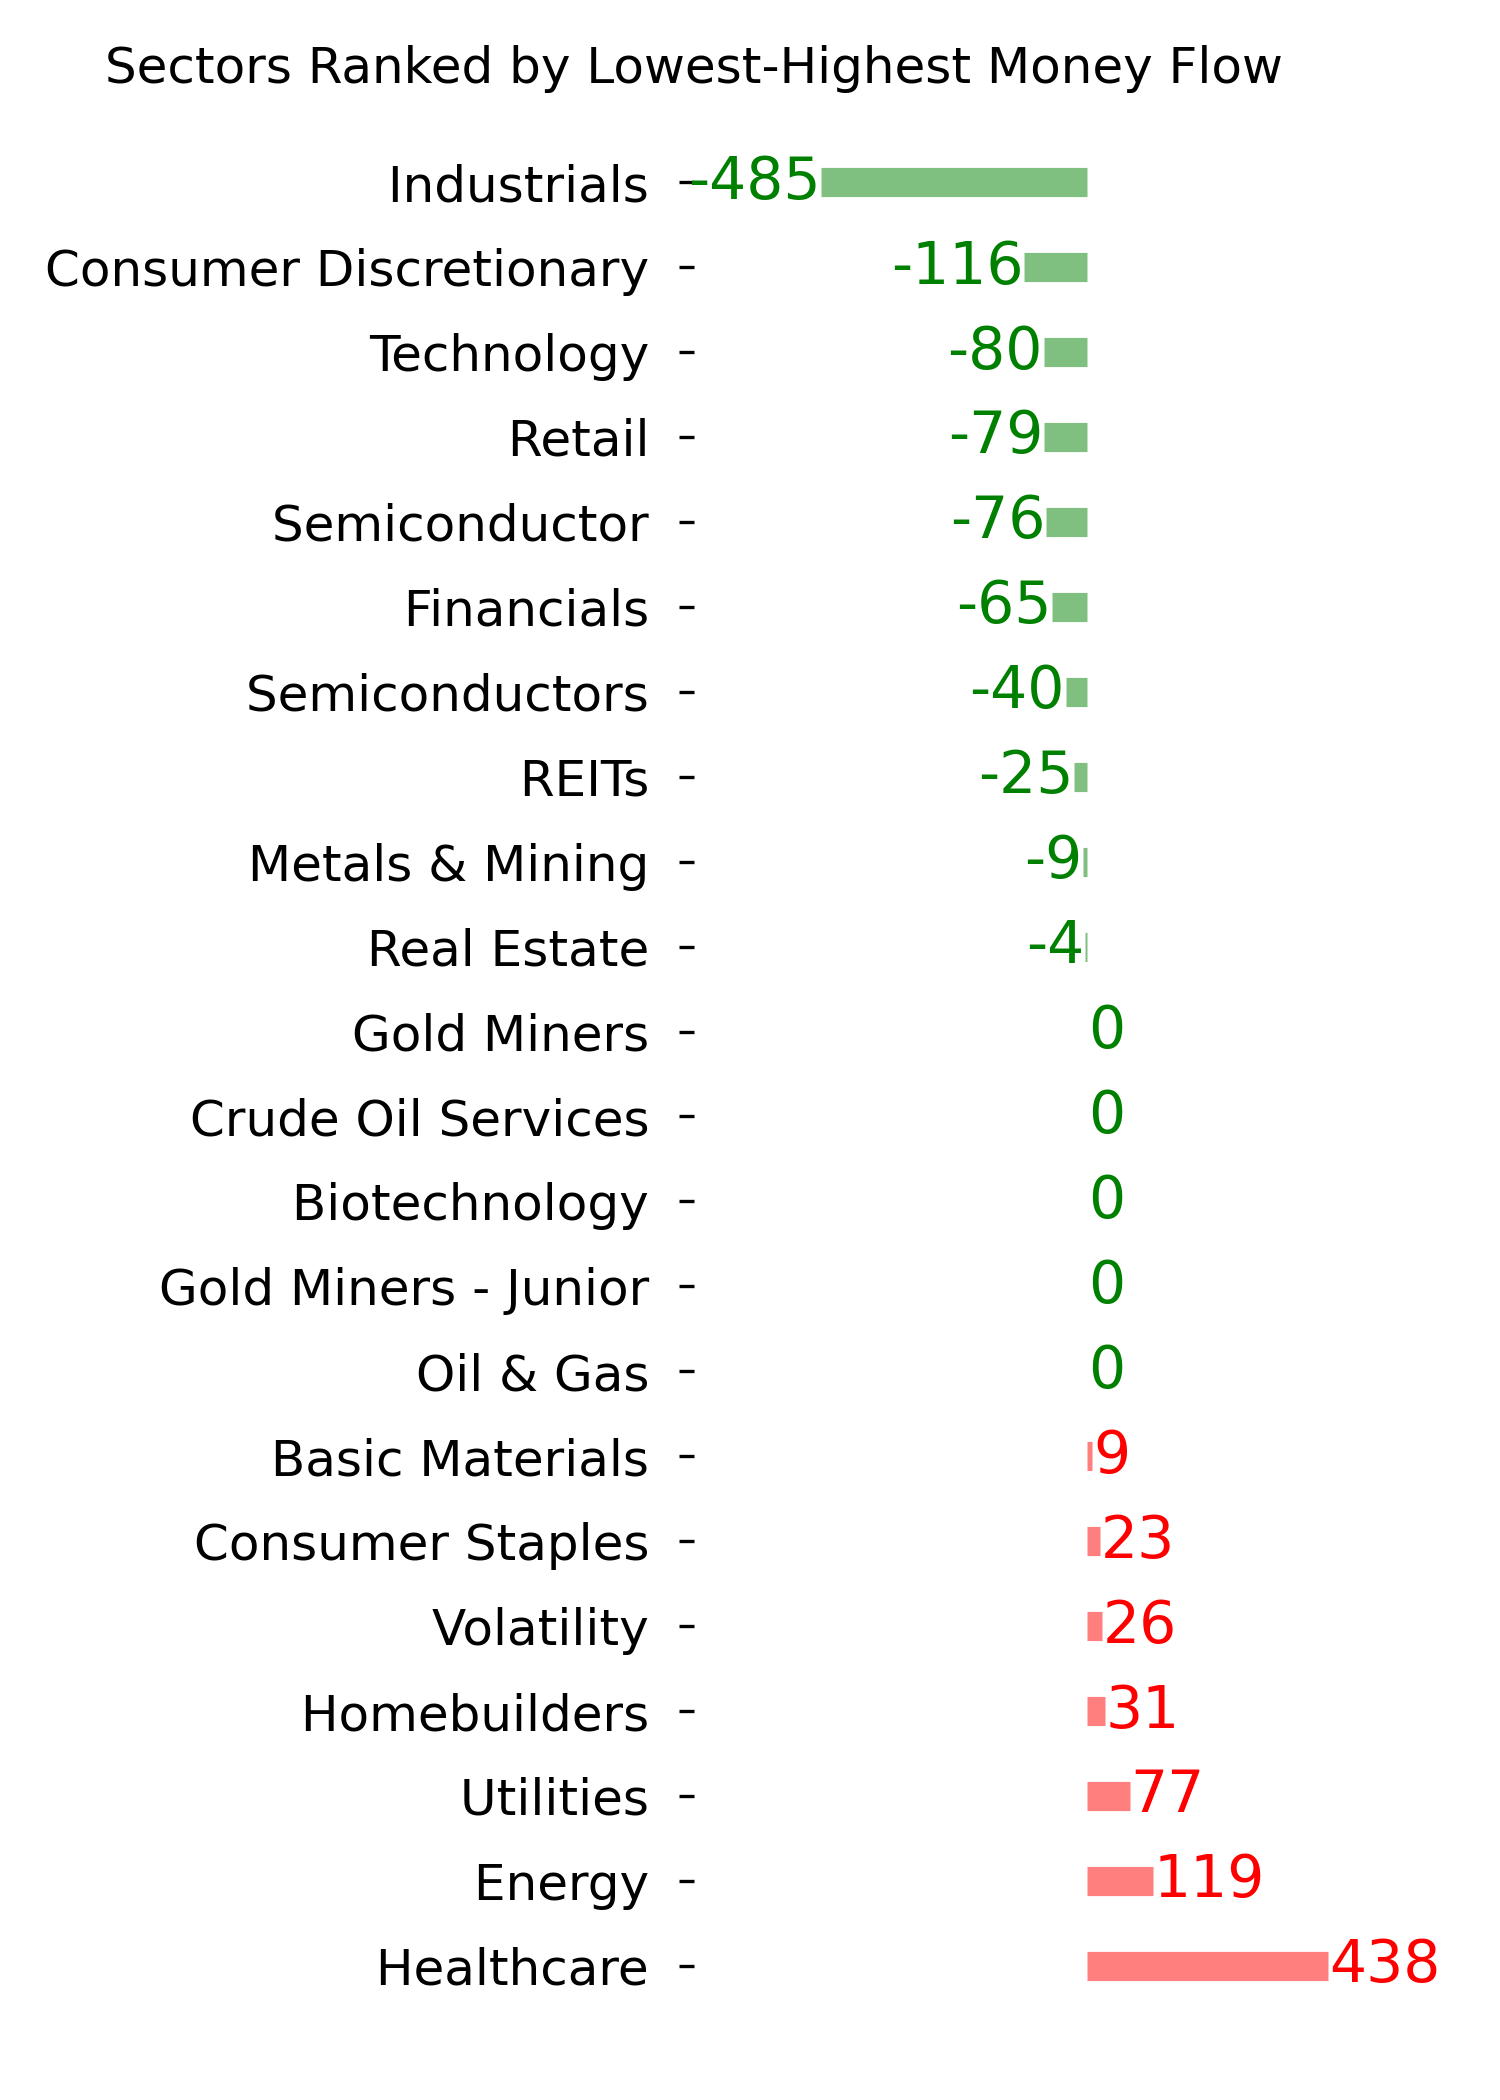
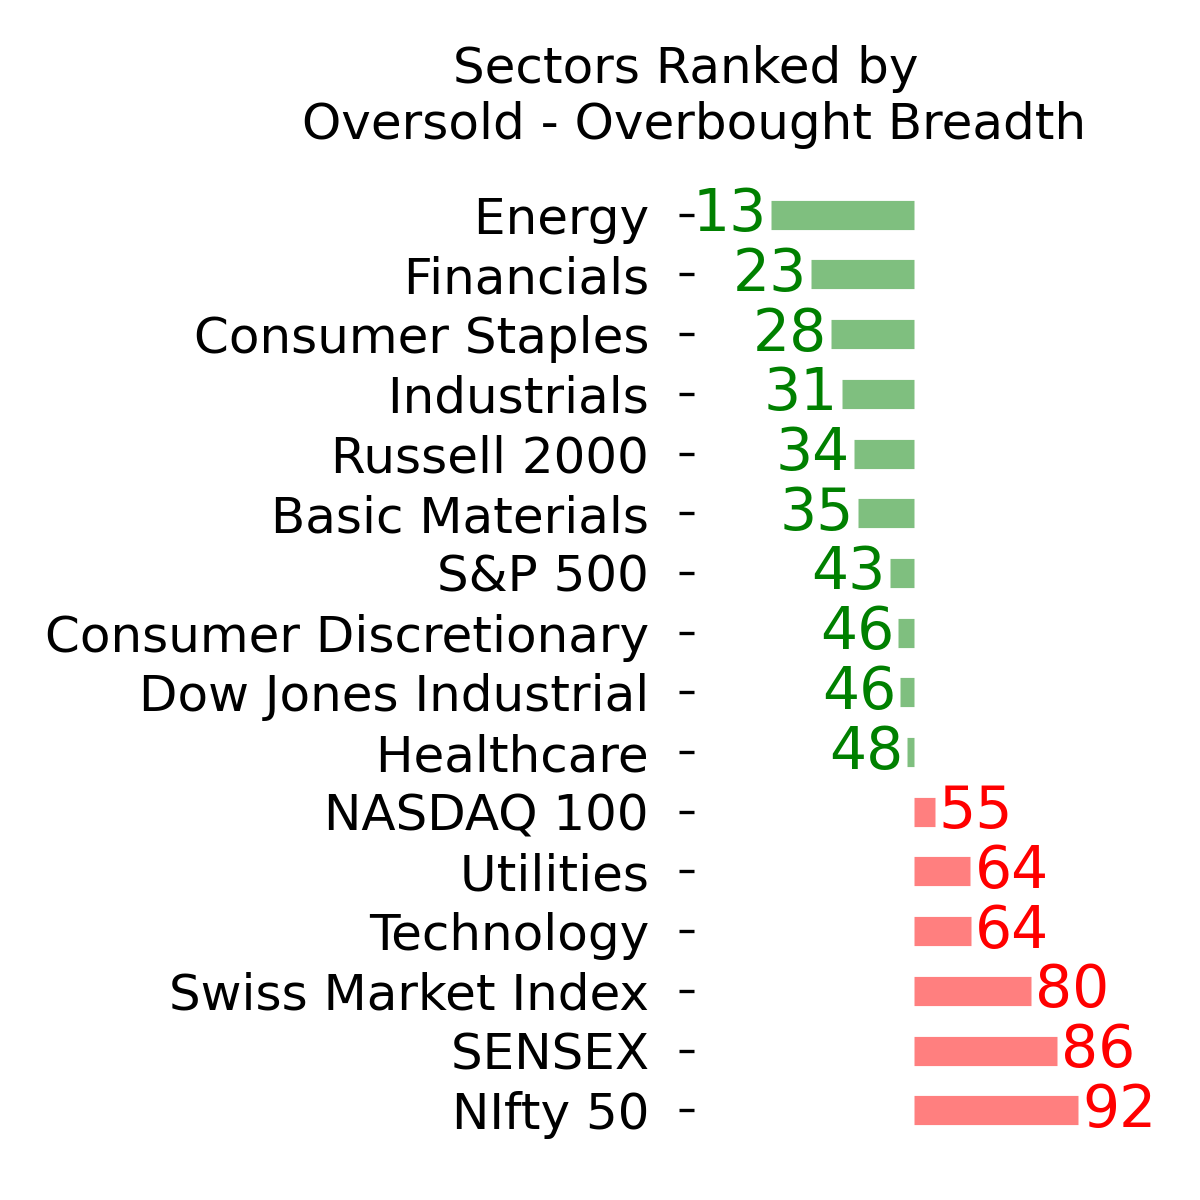
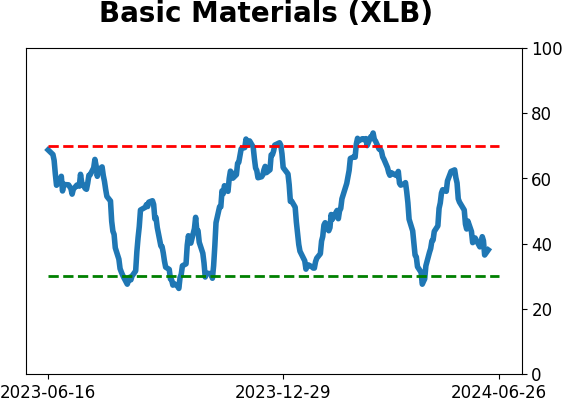
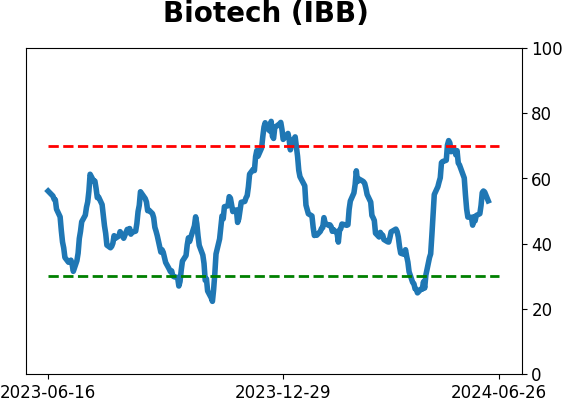
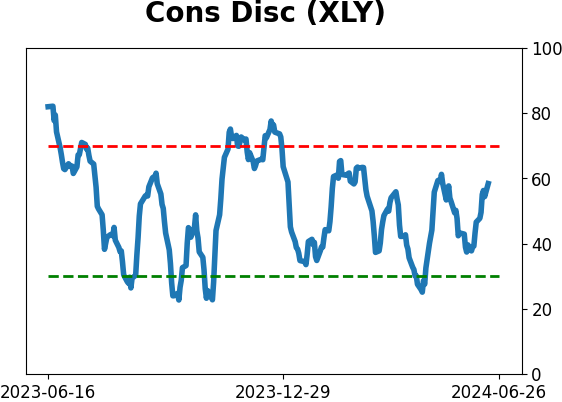
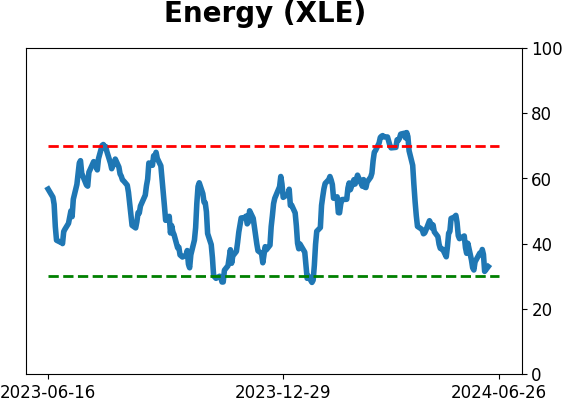
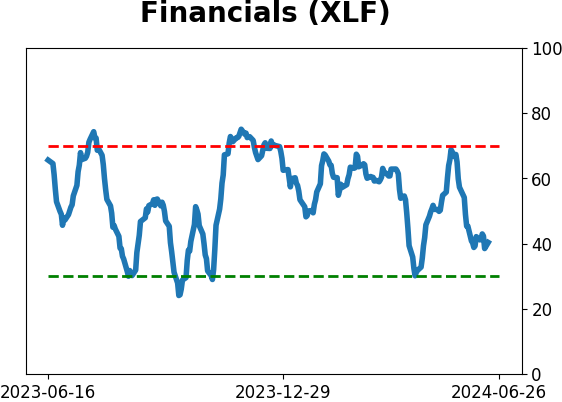
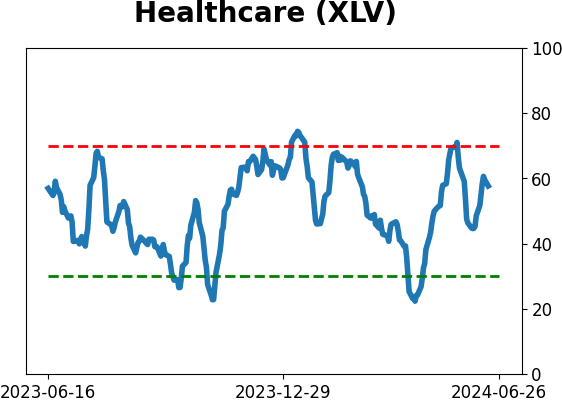
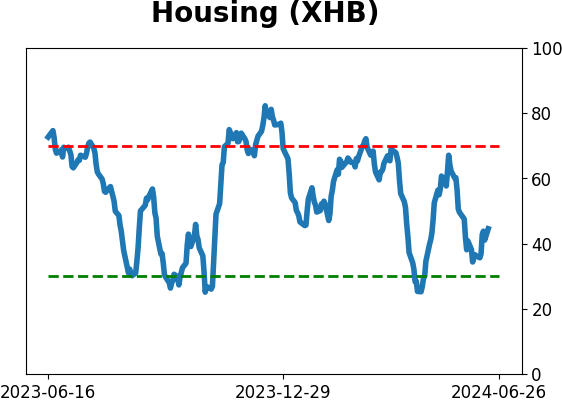
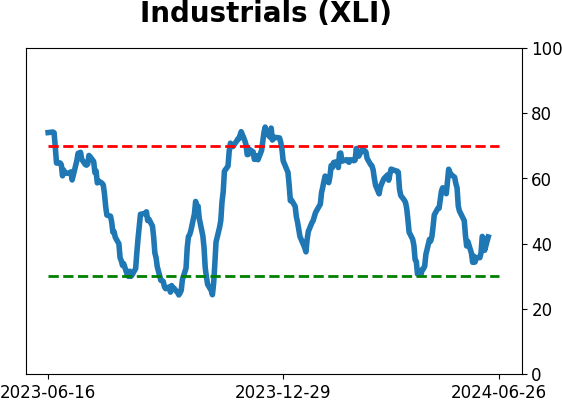
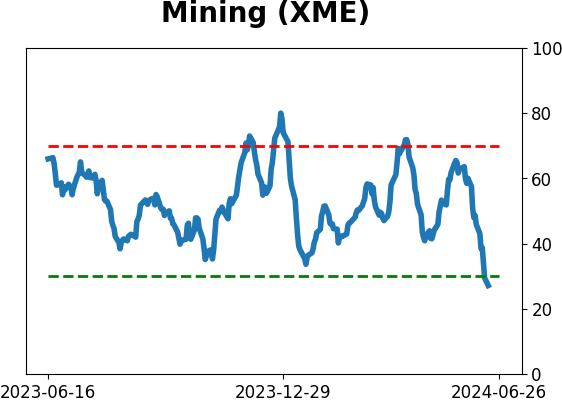
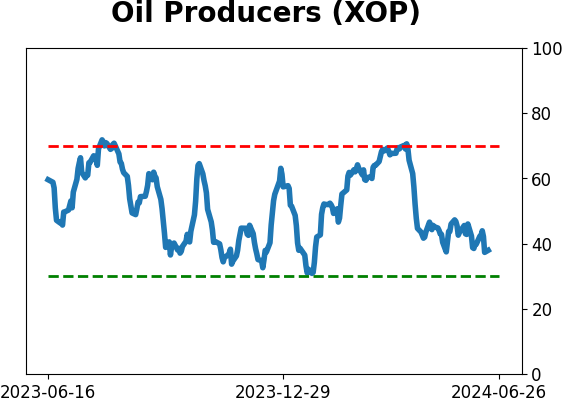
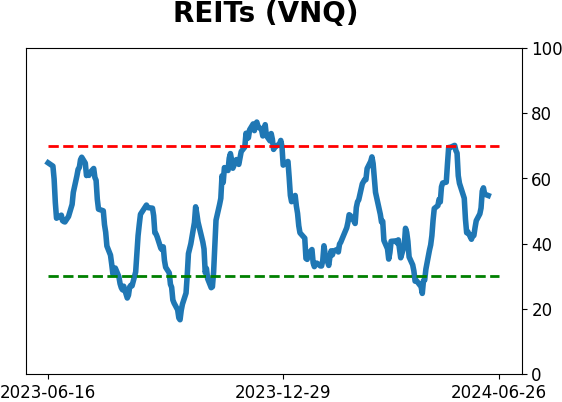
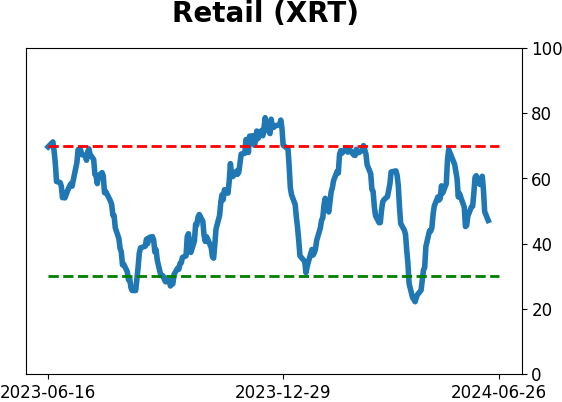
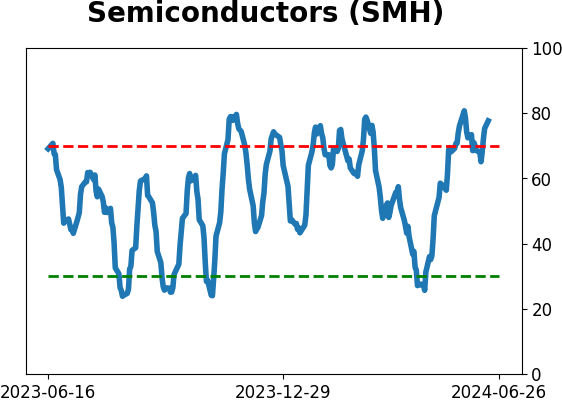
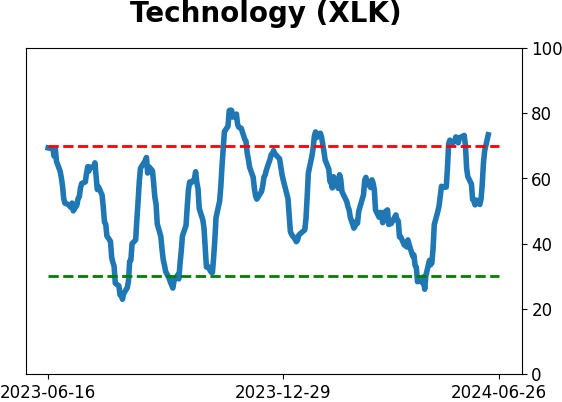
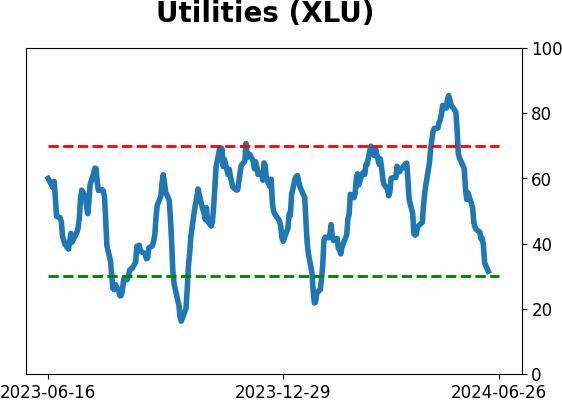
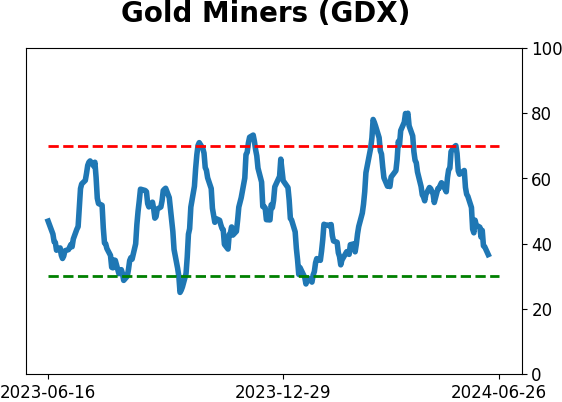
Sector ETF's - 10-Day Moving Average
|
|
|
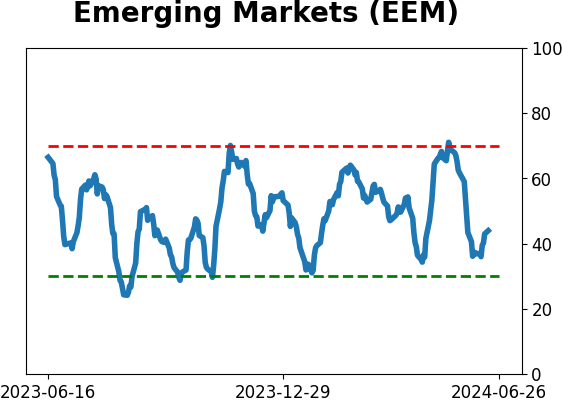
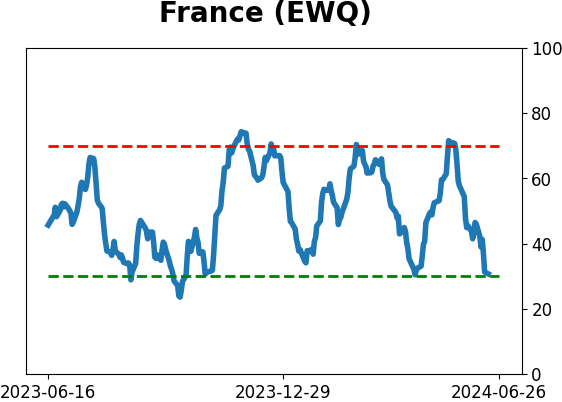
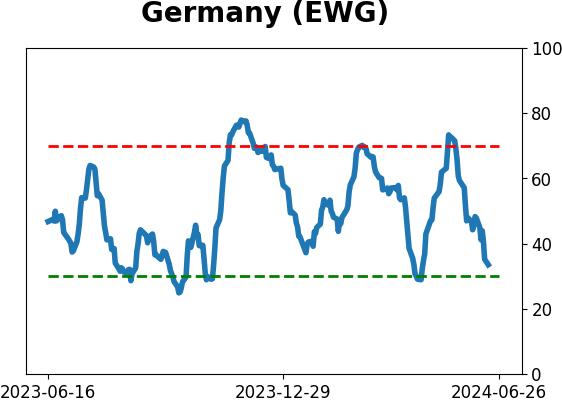
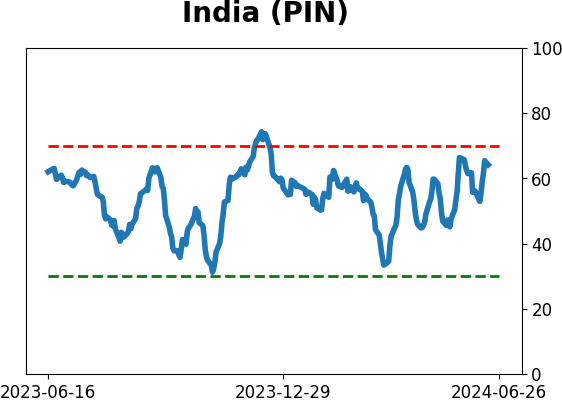
Country ETF's - 10-Day Moving Average
|
|
|
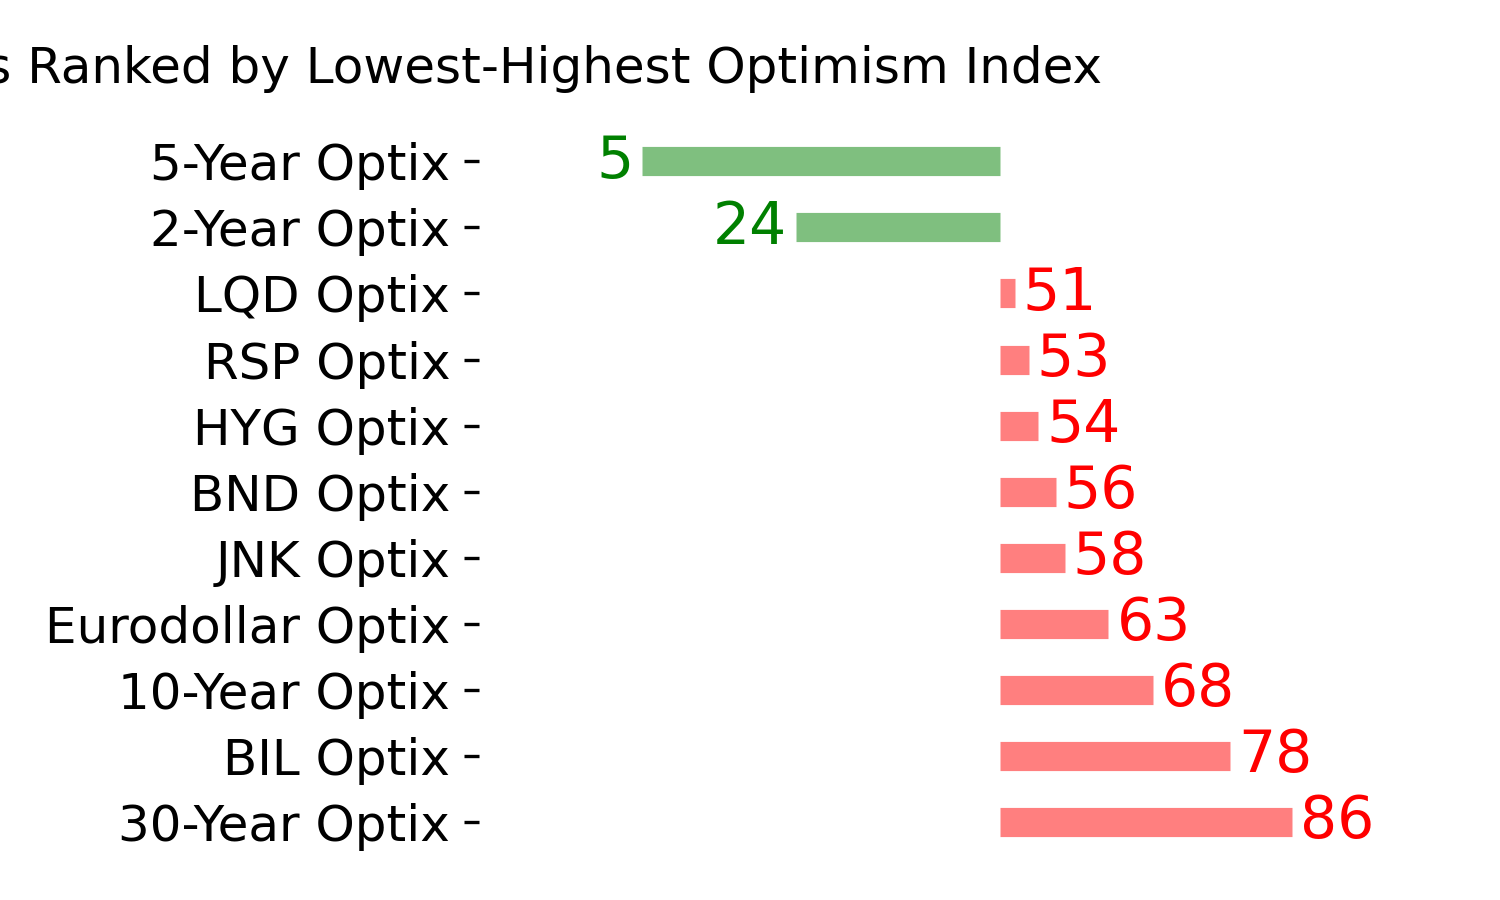
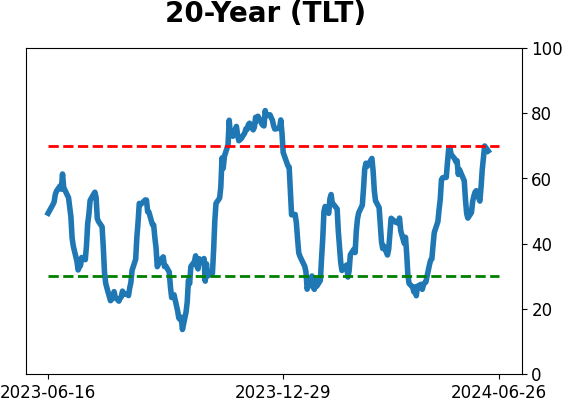
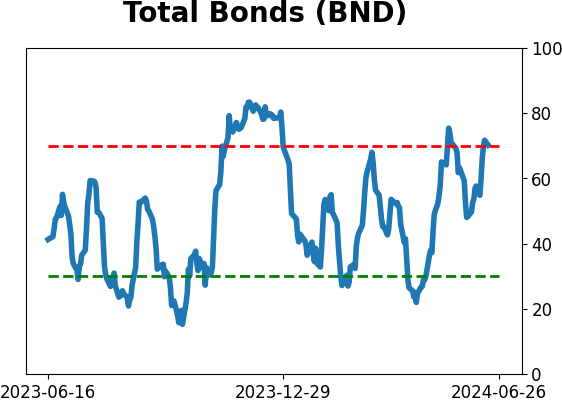
Bond ETF's - 10-Day Moving Average
|
|
|
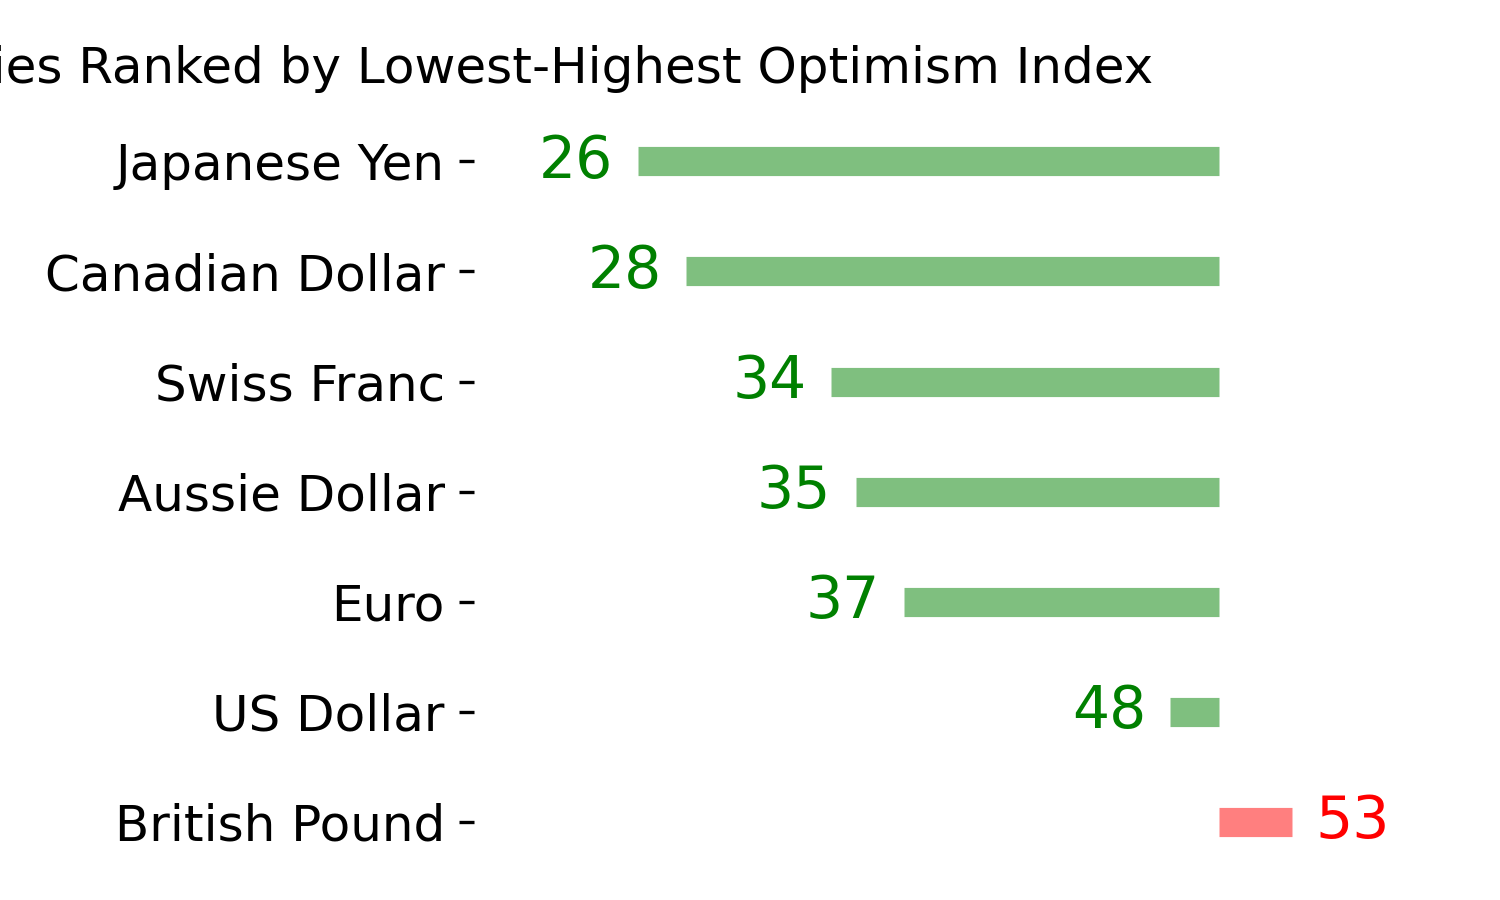
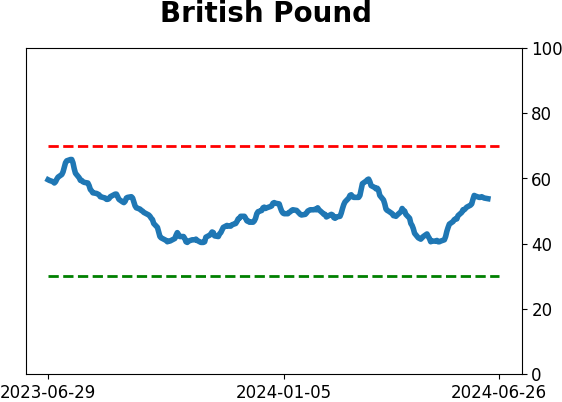
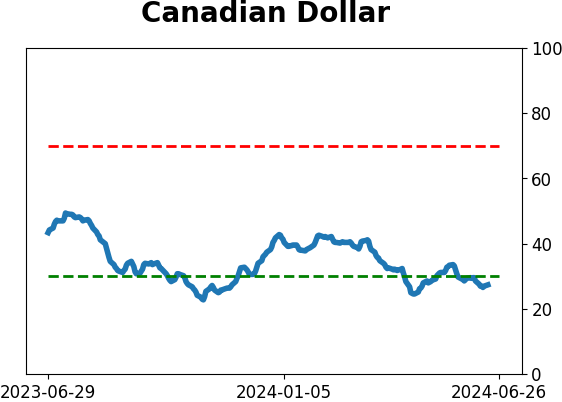
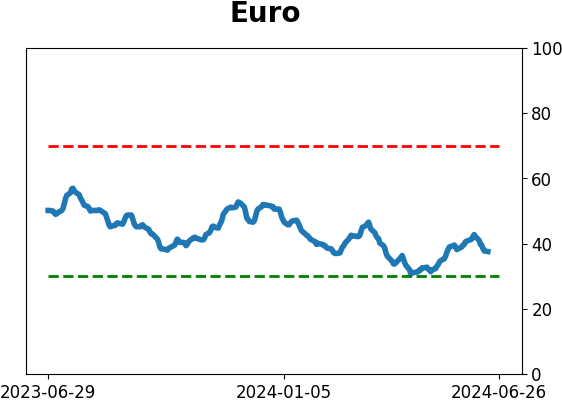
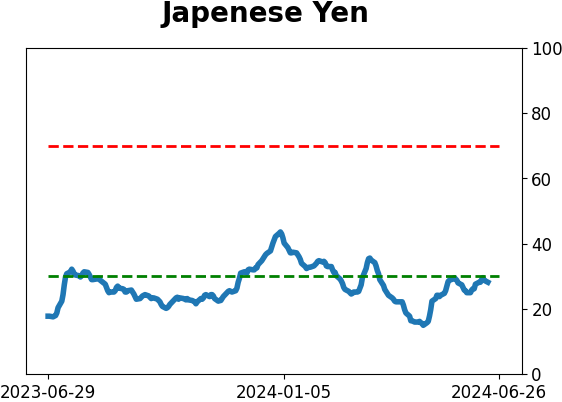
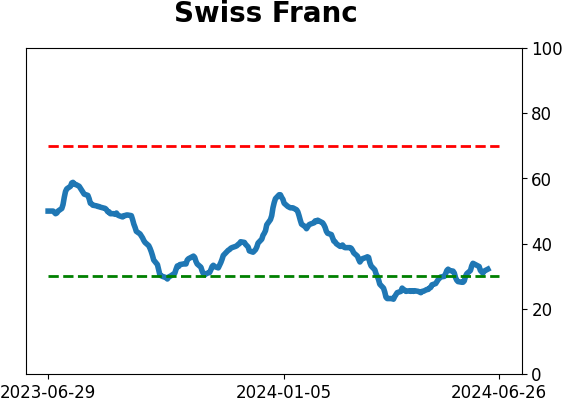
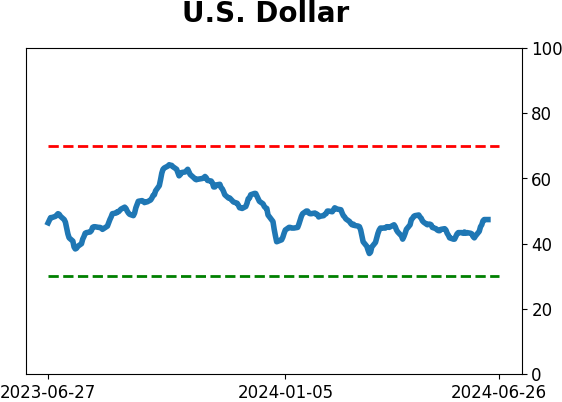
Currency ETF's - 5-Day Moving Average
|
|
|
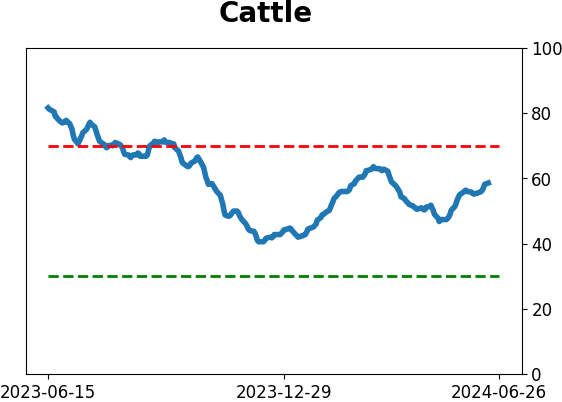
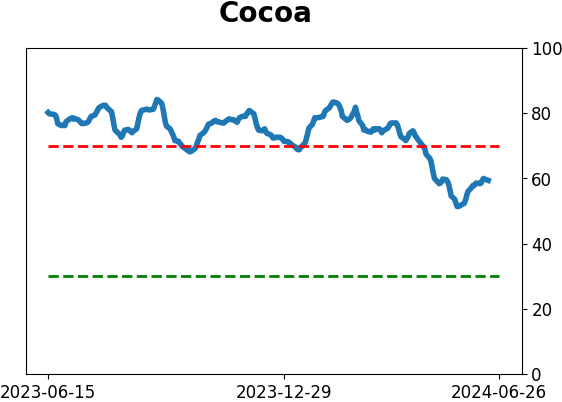
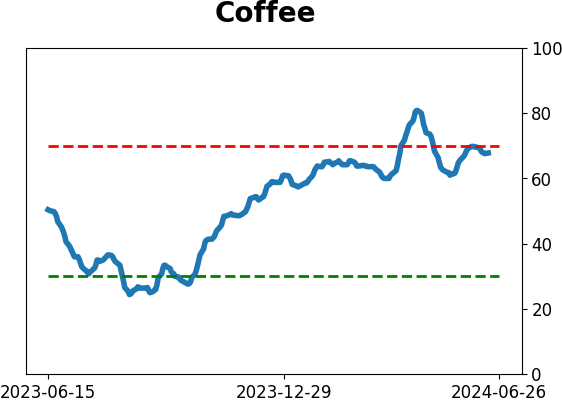
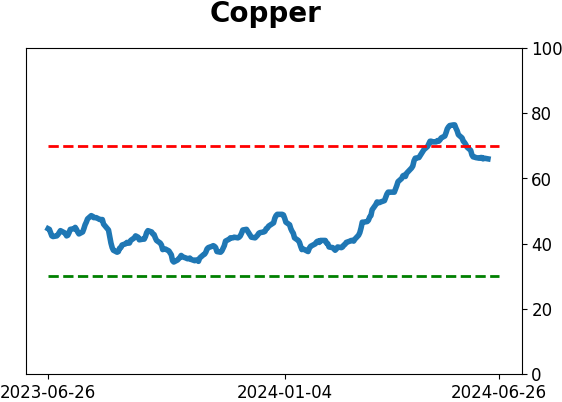
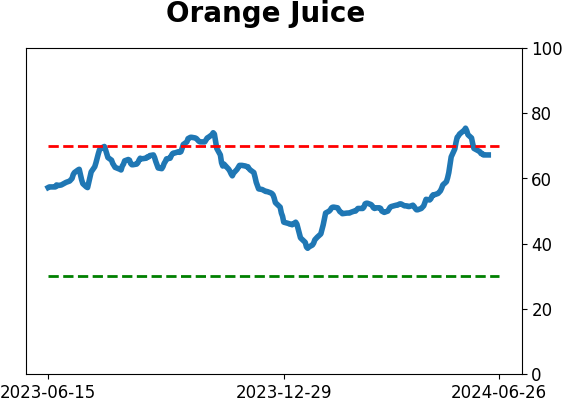
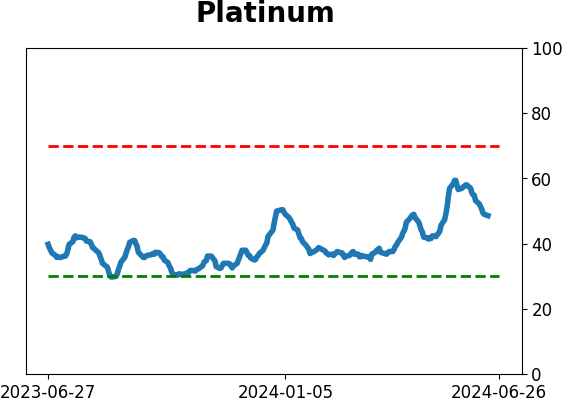
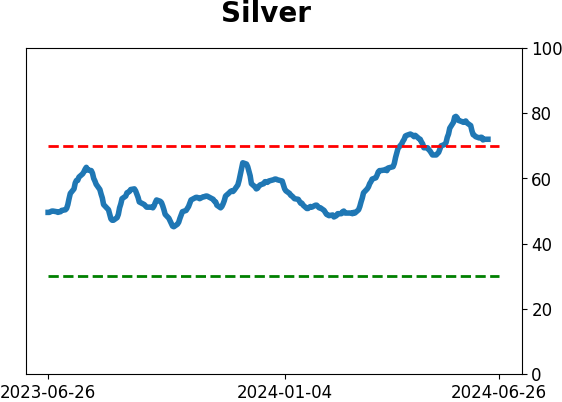
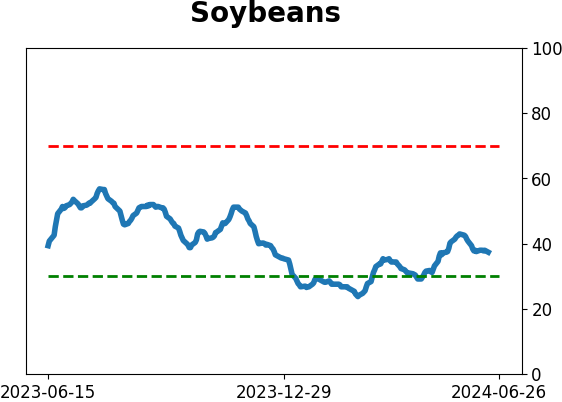
Commodity ETF's - 5-Day Moving Average
|
|