Headlines
|
|
Panic triggers another large opening gap:
The futures market is indicating another large negative opening gap. This would be the 2nd such emotional opening within a week, which has only happened during the climaxes of bear market declines. In 2008, though, this persisted as the financial system was on the verge of collapse.
|
Smart / Dumb Money Confidence
|
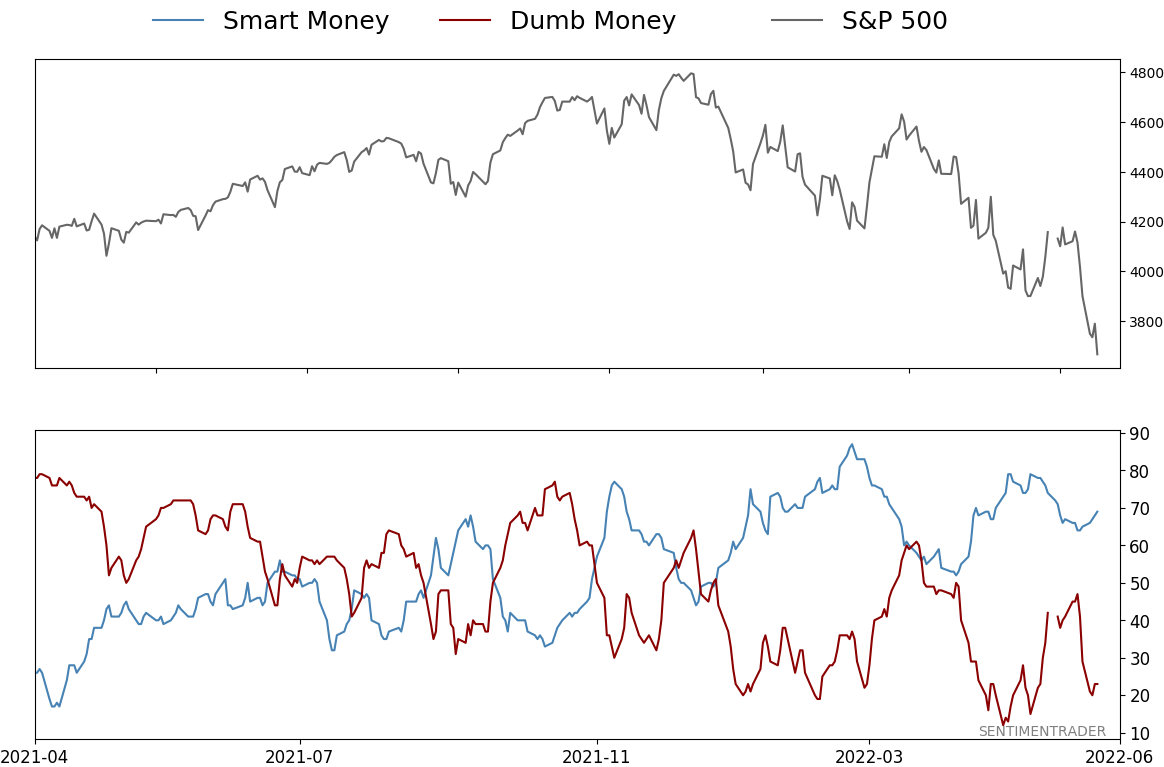
Smart Money Confidence: 69%
Dumb Money Confidence: 23%
|
|
Risk Levels
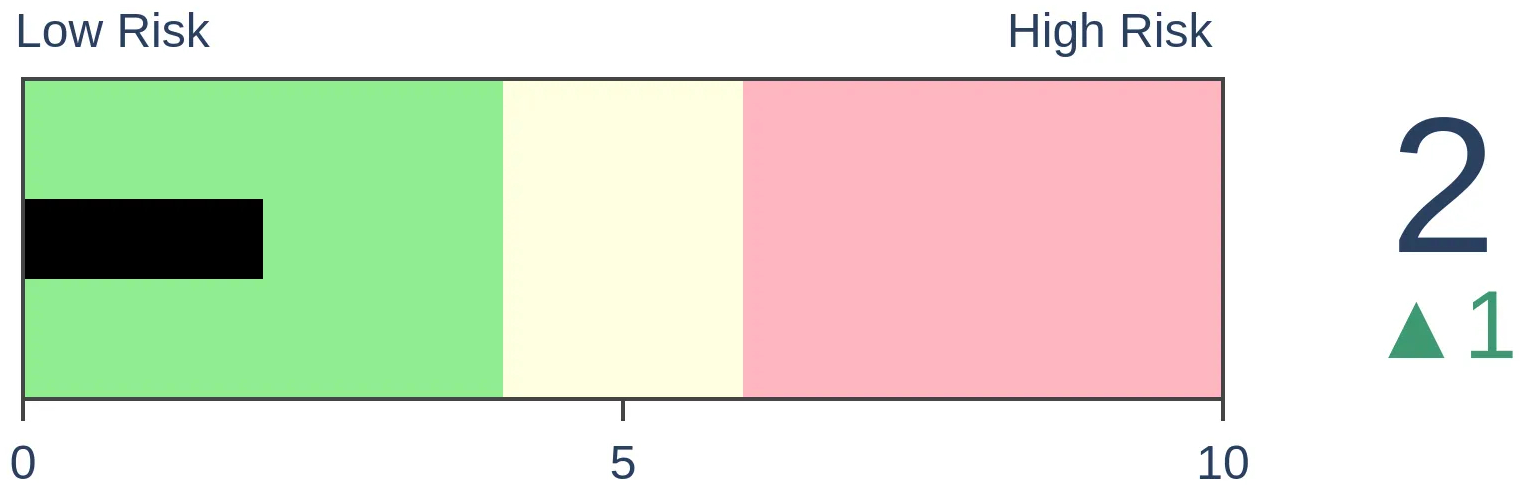
Stocks Short-Term
|
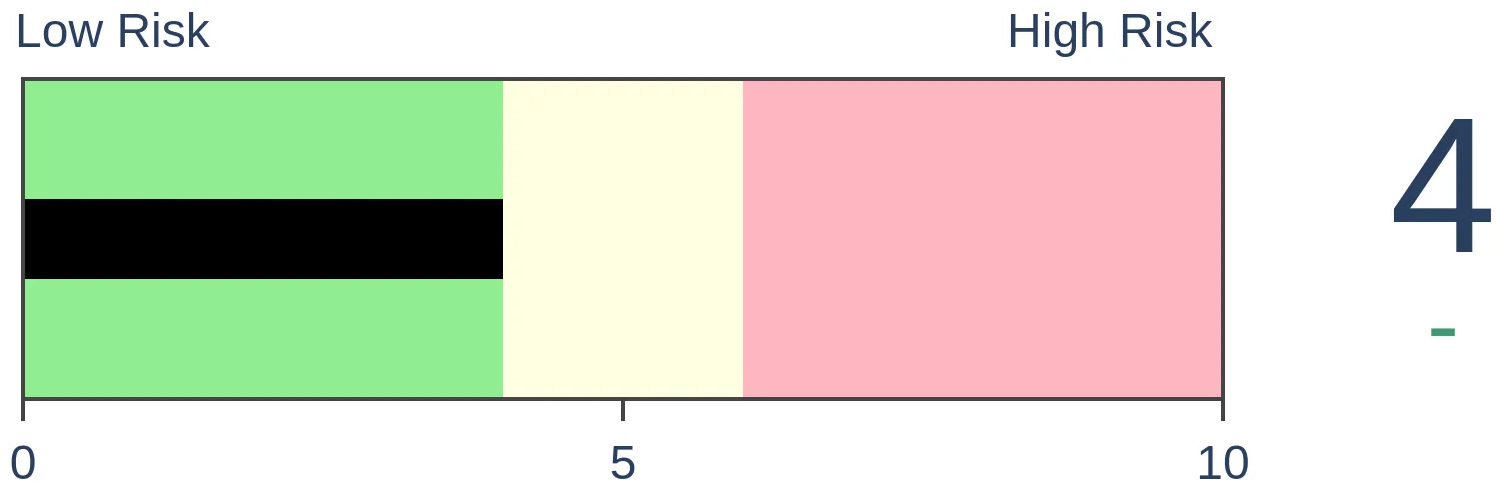
Stocks Medium-Term
|
|
Bonds
|
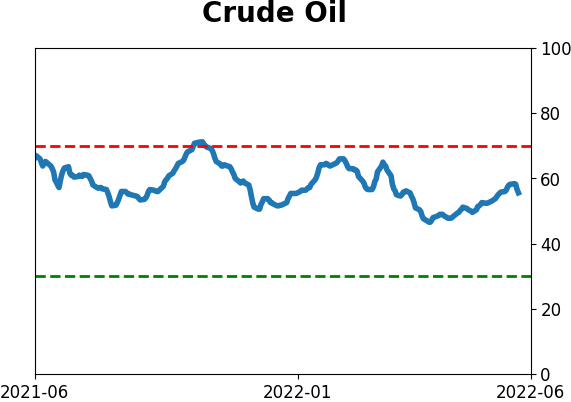
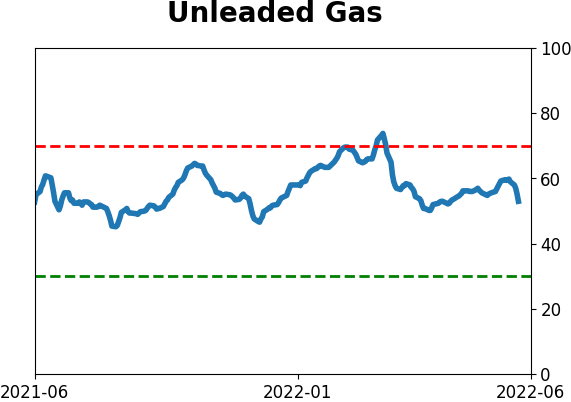
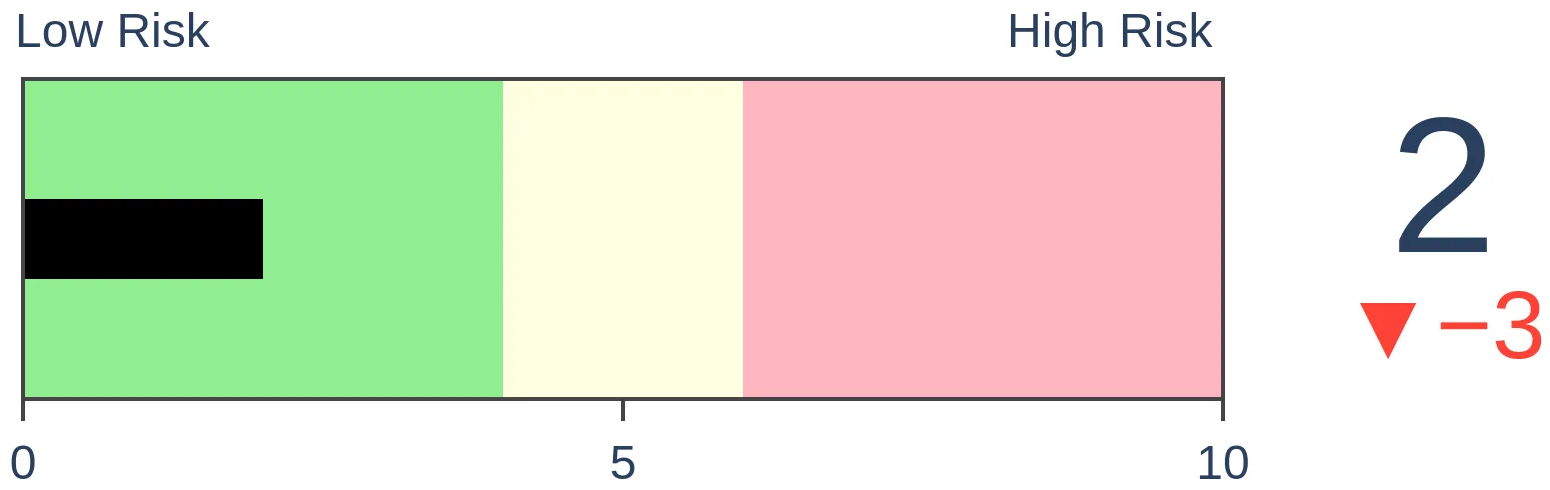
Crude Oil

|
|
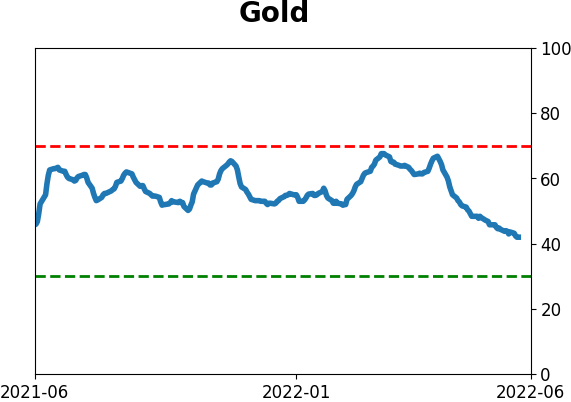
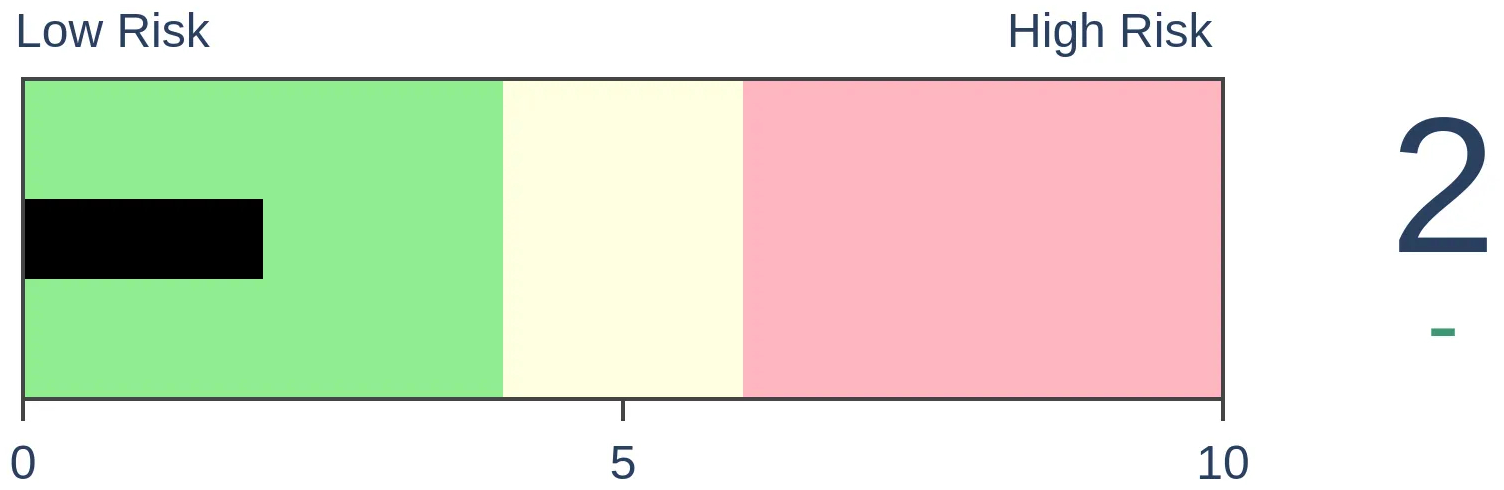
Gold

|
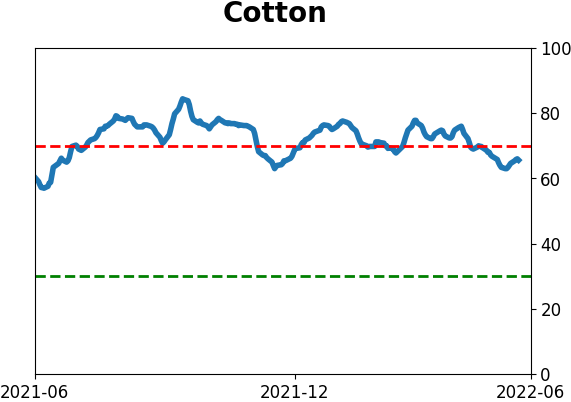
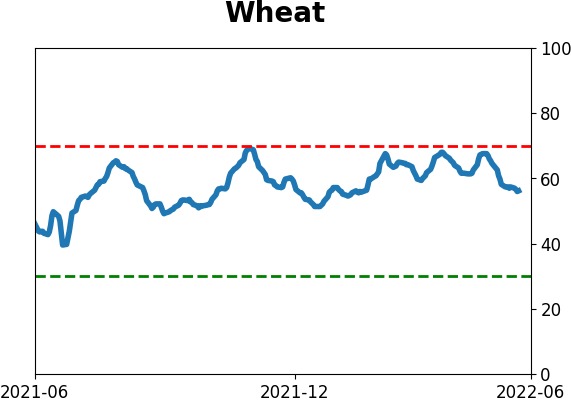
Agriculture
|
|
Research
By Jason Goepfert
BOTTOM LINE
The futures market is indicating another large negative opening gap. This would be the 2nd such emotional opening within a week, which has only happened during the climaxes of bear market declines. In 2008, though, this persisted as the financial system was on the verge of collapse.
FORECAST / TIMEFRAME
None
|
Key points:
- S&P 500 futures are on track to open more than 2% below Wednesday's close
- This would be the 2nd such emotional opening within a week
- This has only happened during climactic declines, though it persisted during the financial crisis
Emotional selling pressure
This is going to be a relatively quick post before the open. Once again, traders are re-pricing assets based on pre-market considerations, which is generally an emotional decision.
It is quite rare to see equity markets suffer more than a 2% decline overnight. Institutional investors try to avoid these times because of lower liquidity, especially in an already-illiquid market. But when people panic, they panic together.
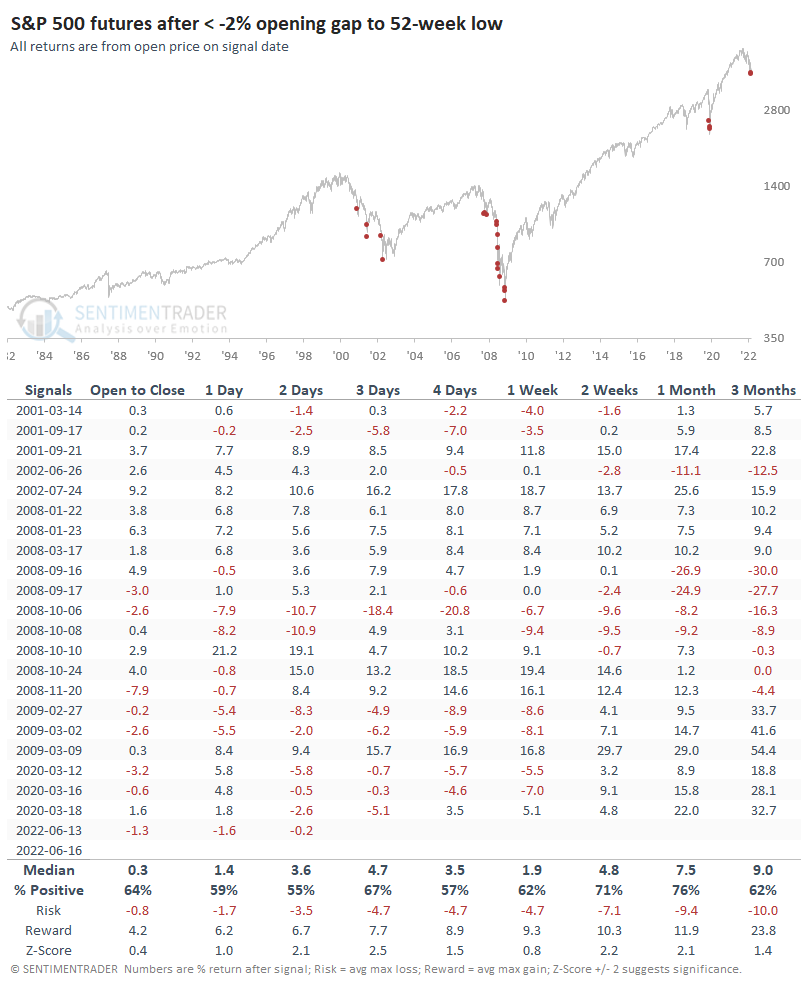
Currently, the S&P 500 futures are indicated to open more than 2% below Wednesday's close. With such volatile conditions, this could change quickly, so we'll have to see how it pans out.
Since the inception of the futures market in 1982, such large negative gaps to a one-year low have only occurred during bear markets.
Here's the kicker - it's the 2nd time in a week that traders faced this kind of carnage. When we look at clusters, the market environments stand out.
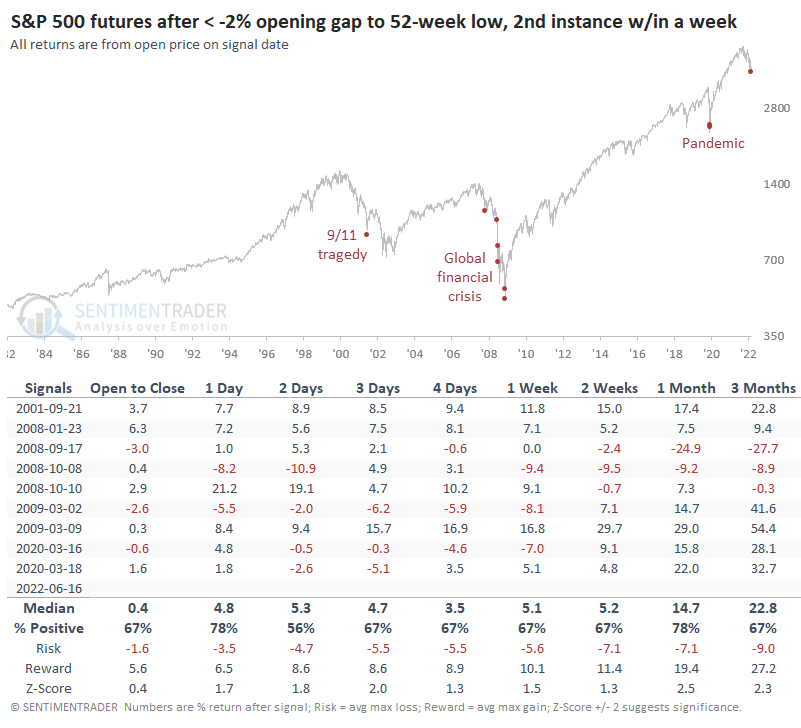
Similar bouts of get-me-out-now behavior have only occurred after 9/11, which marked a multi-month bottom. And it happened near the end of the pandemic panic. But it was also triggered relatively early during the financial crisis. The first instance preceded a nice rally; the subsequent ones did not until the end.
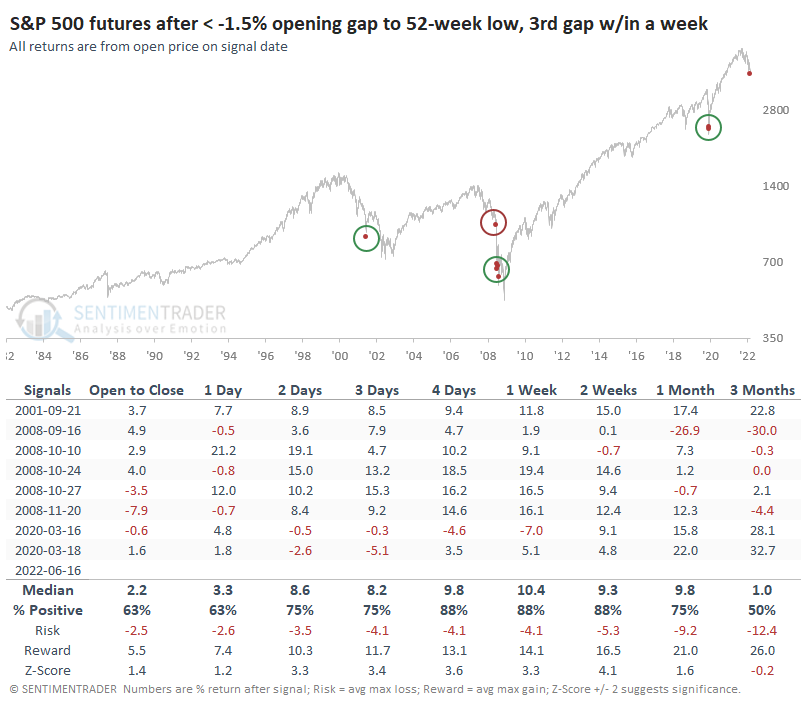
If we relax the gap to -1.5%, this would be the third within a week. When triggering at a 52-week low, the same instances pop up, though these were more focused near the end of the financial crisis. Either one or two weeks later, all of the signals showed a positive return.
What the research tells us...
Based on this behavior and what we've already discussed this week, it's obvious that we're mired in a bear market, and it's obvious that we're seeing panic-like behavior on a scale rarely seen during the past 40-60 years.
The key is whether it's too late for existing investors to sell. In almost every case we've looked at, the answer is yes. The glaring exception, and it's really the only one at this point, is 2008. For selling existing long positions to make sense now, over a multi-month time frame, we have to believe there is a systemic risk to the financial system and we're only in the early innings of it.
Indicators at Extremes
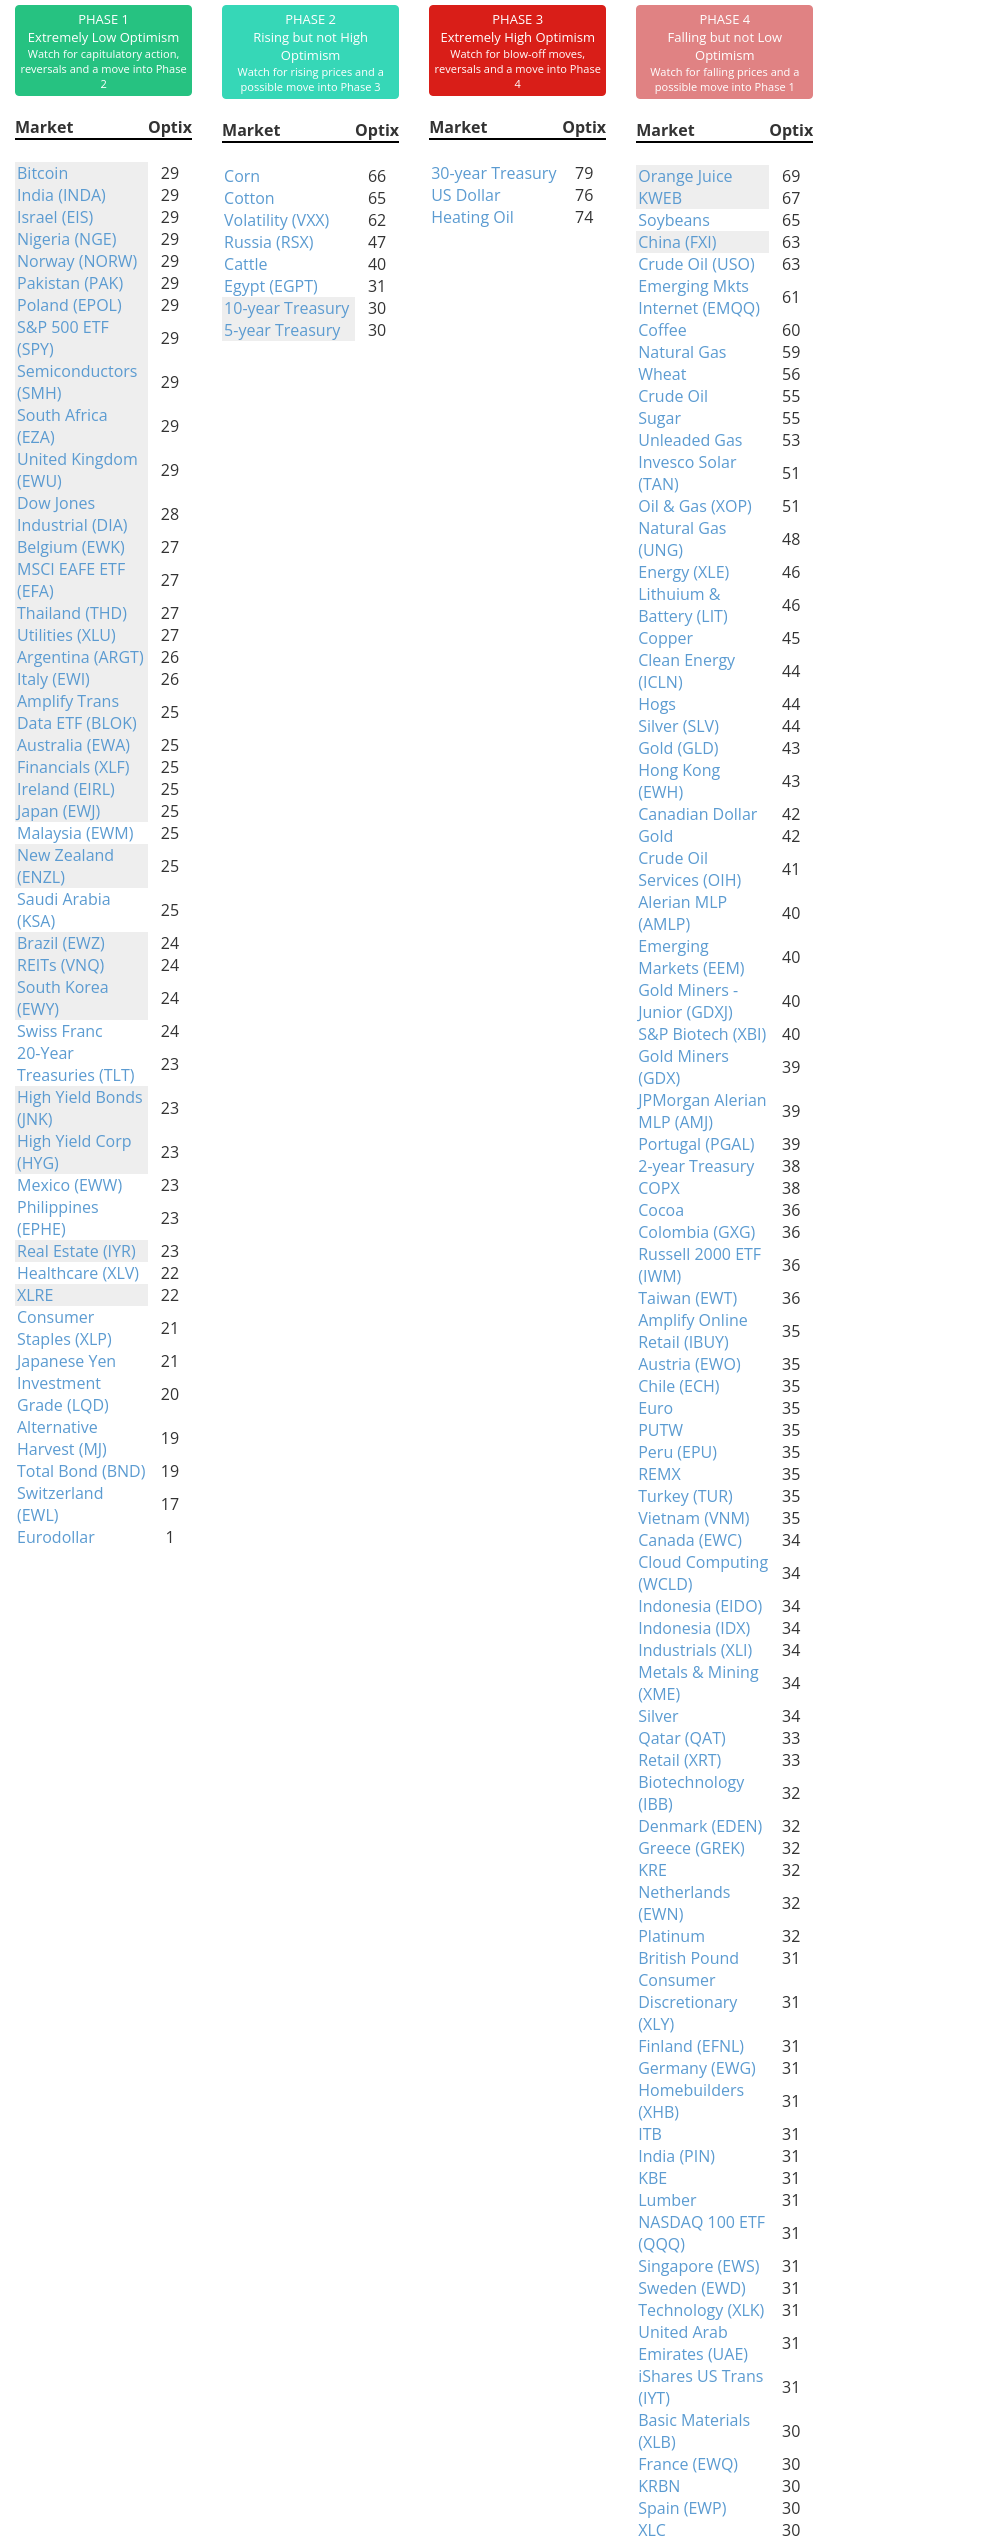
Phase Table
Ranks
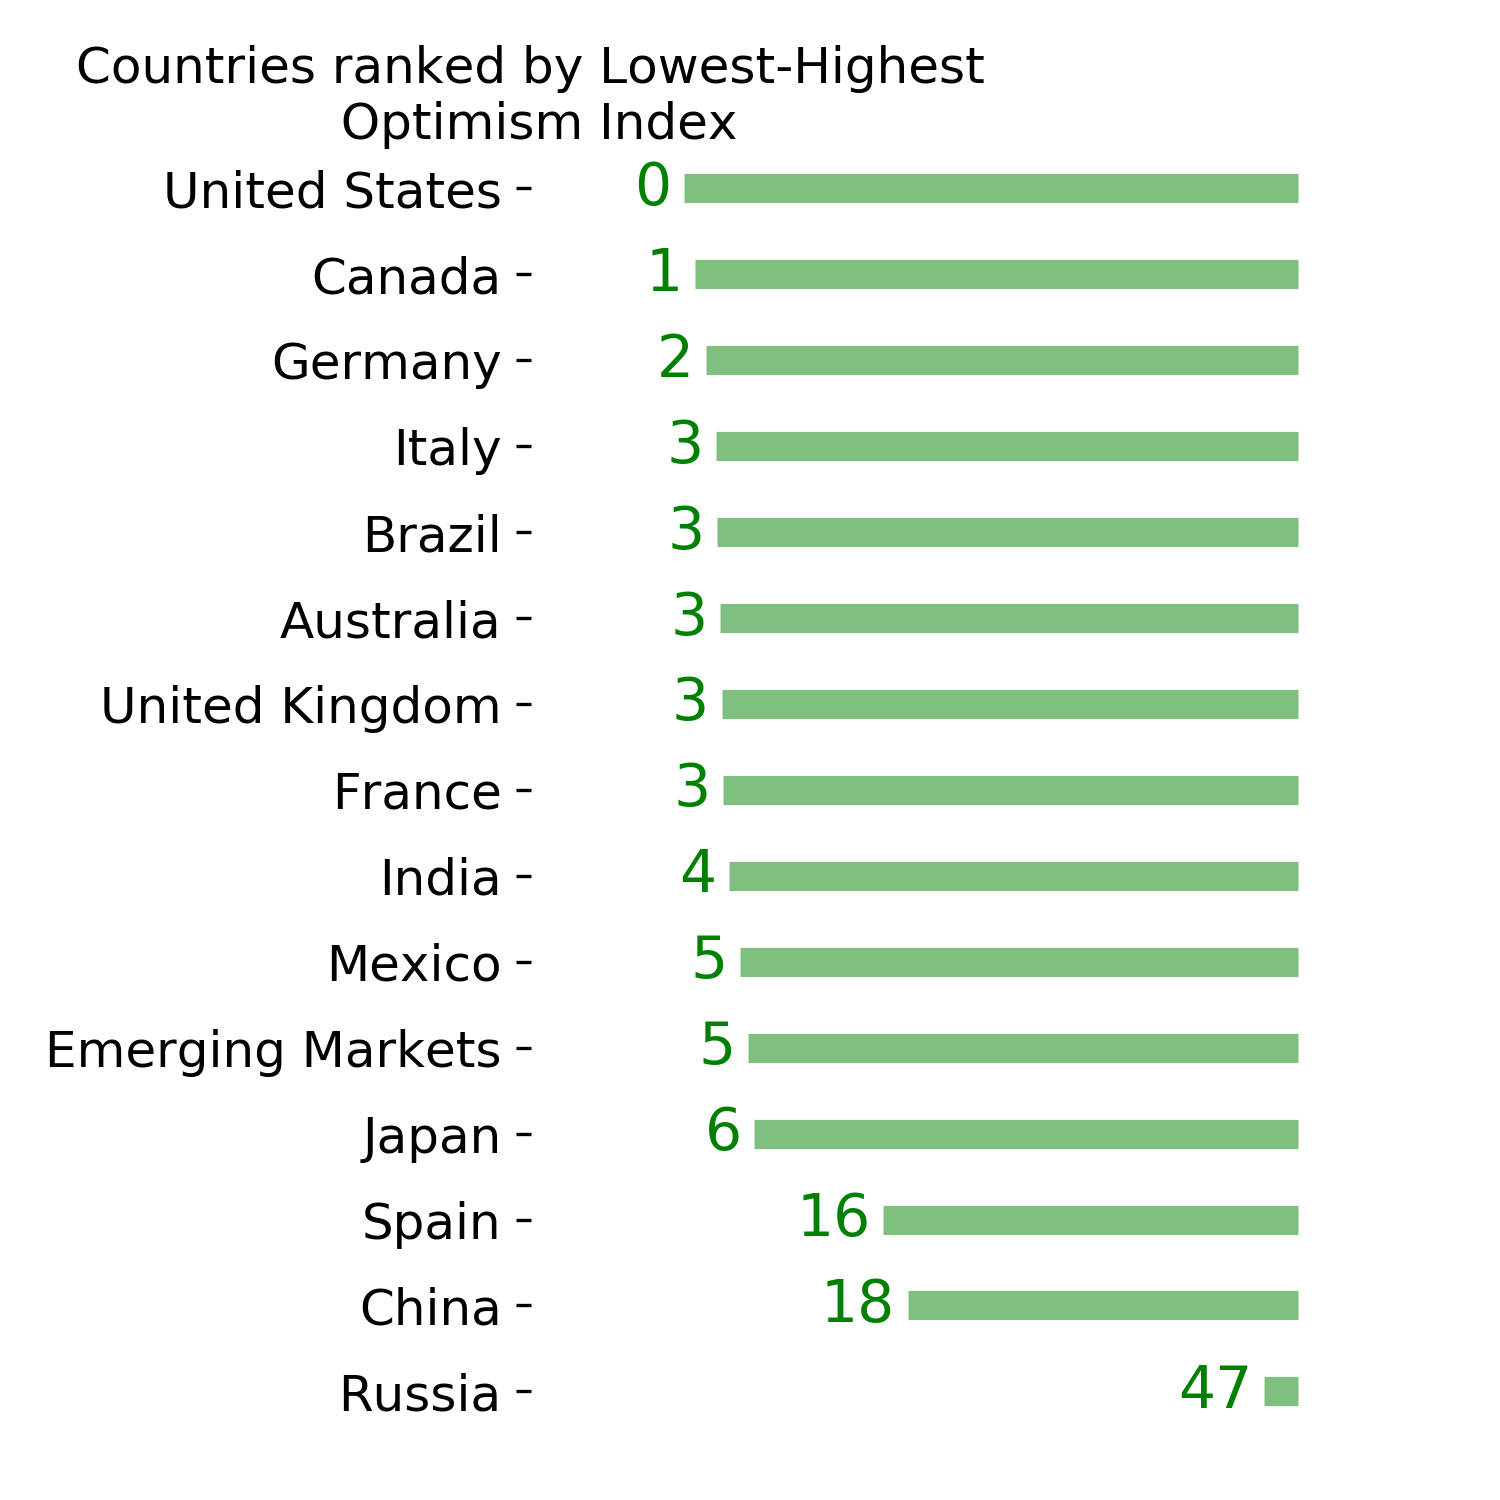
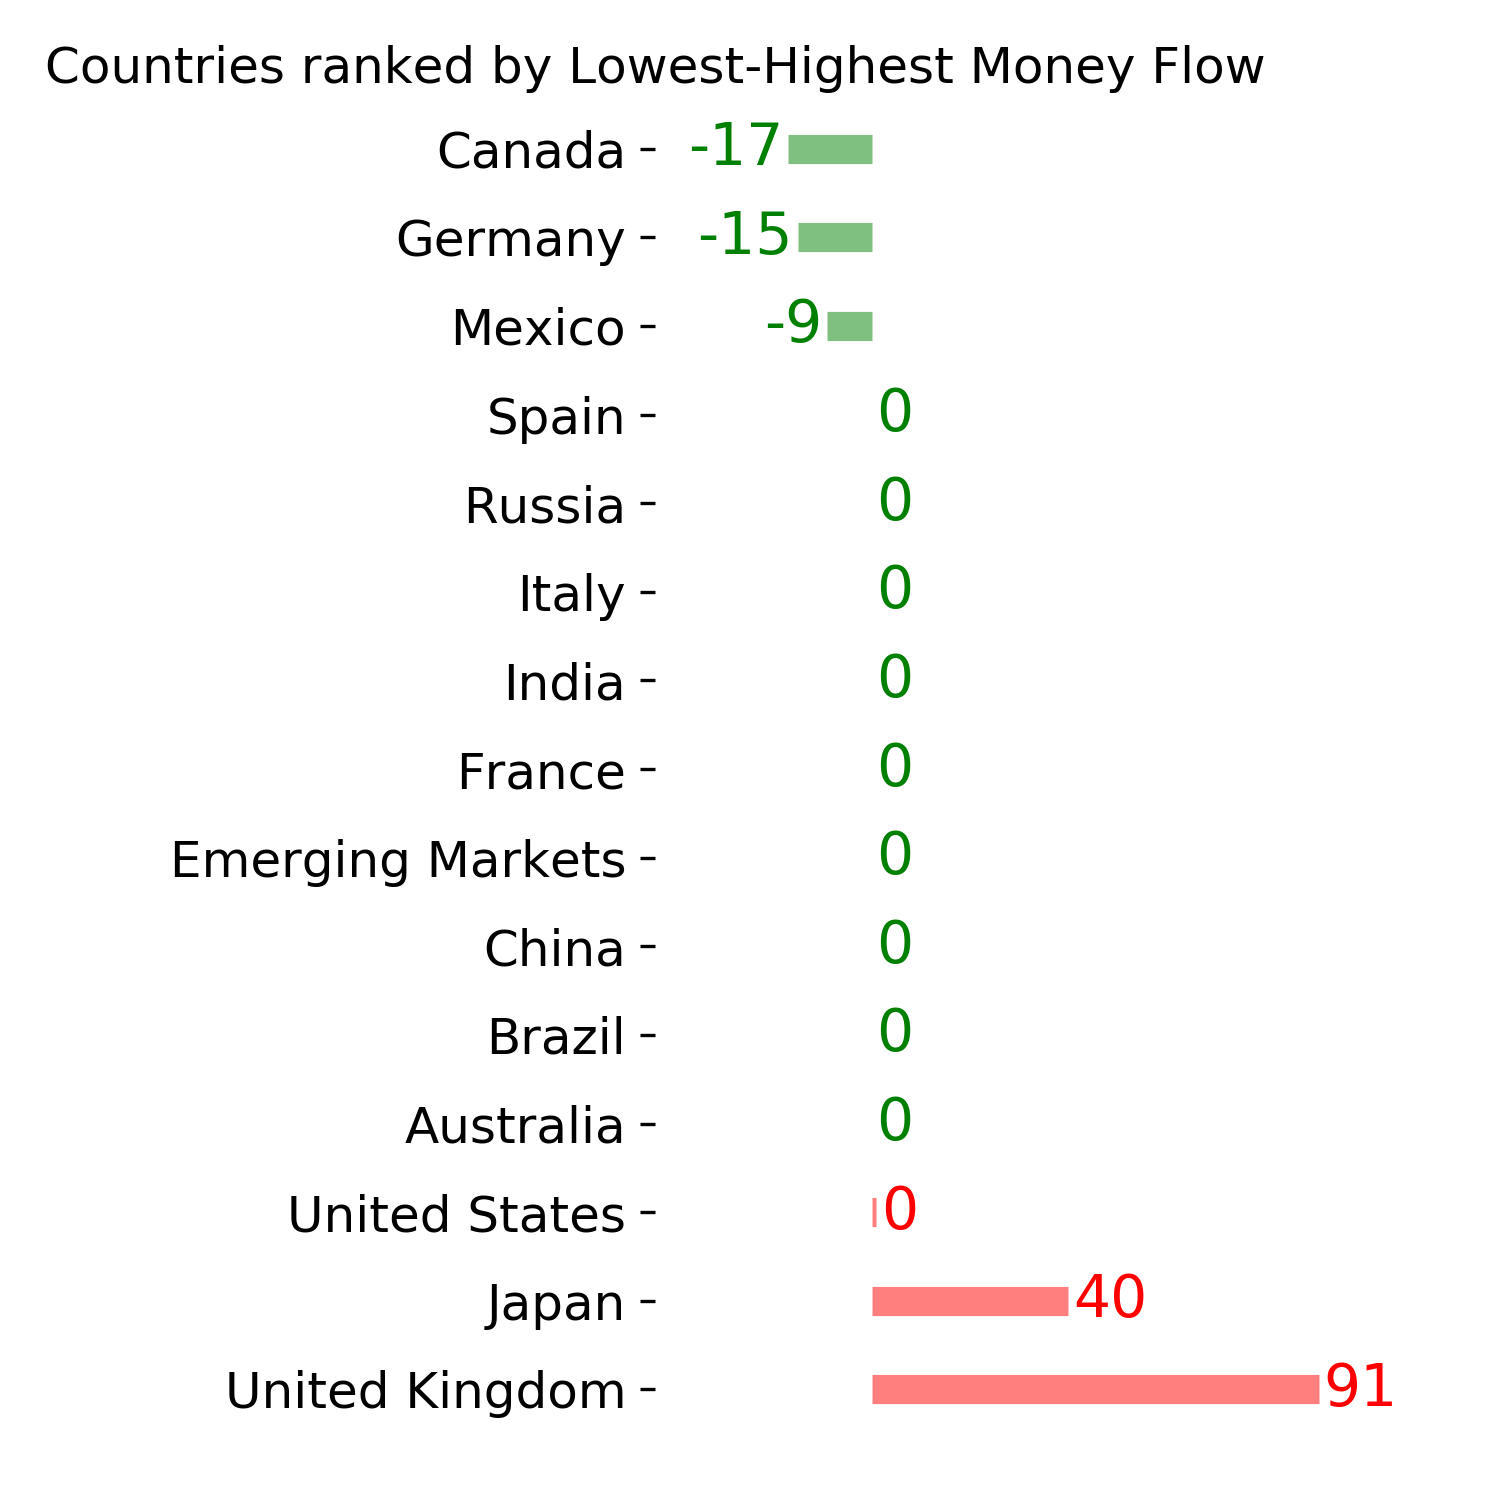
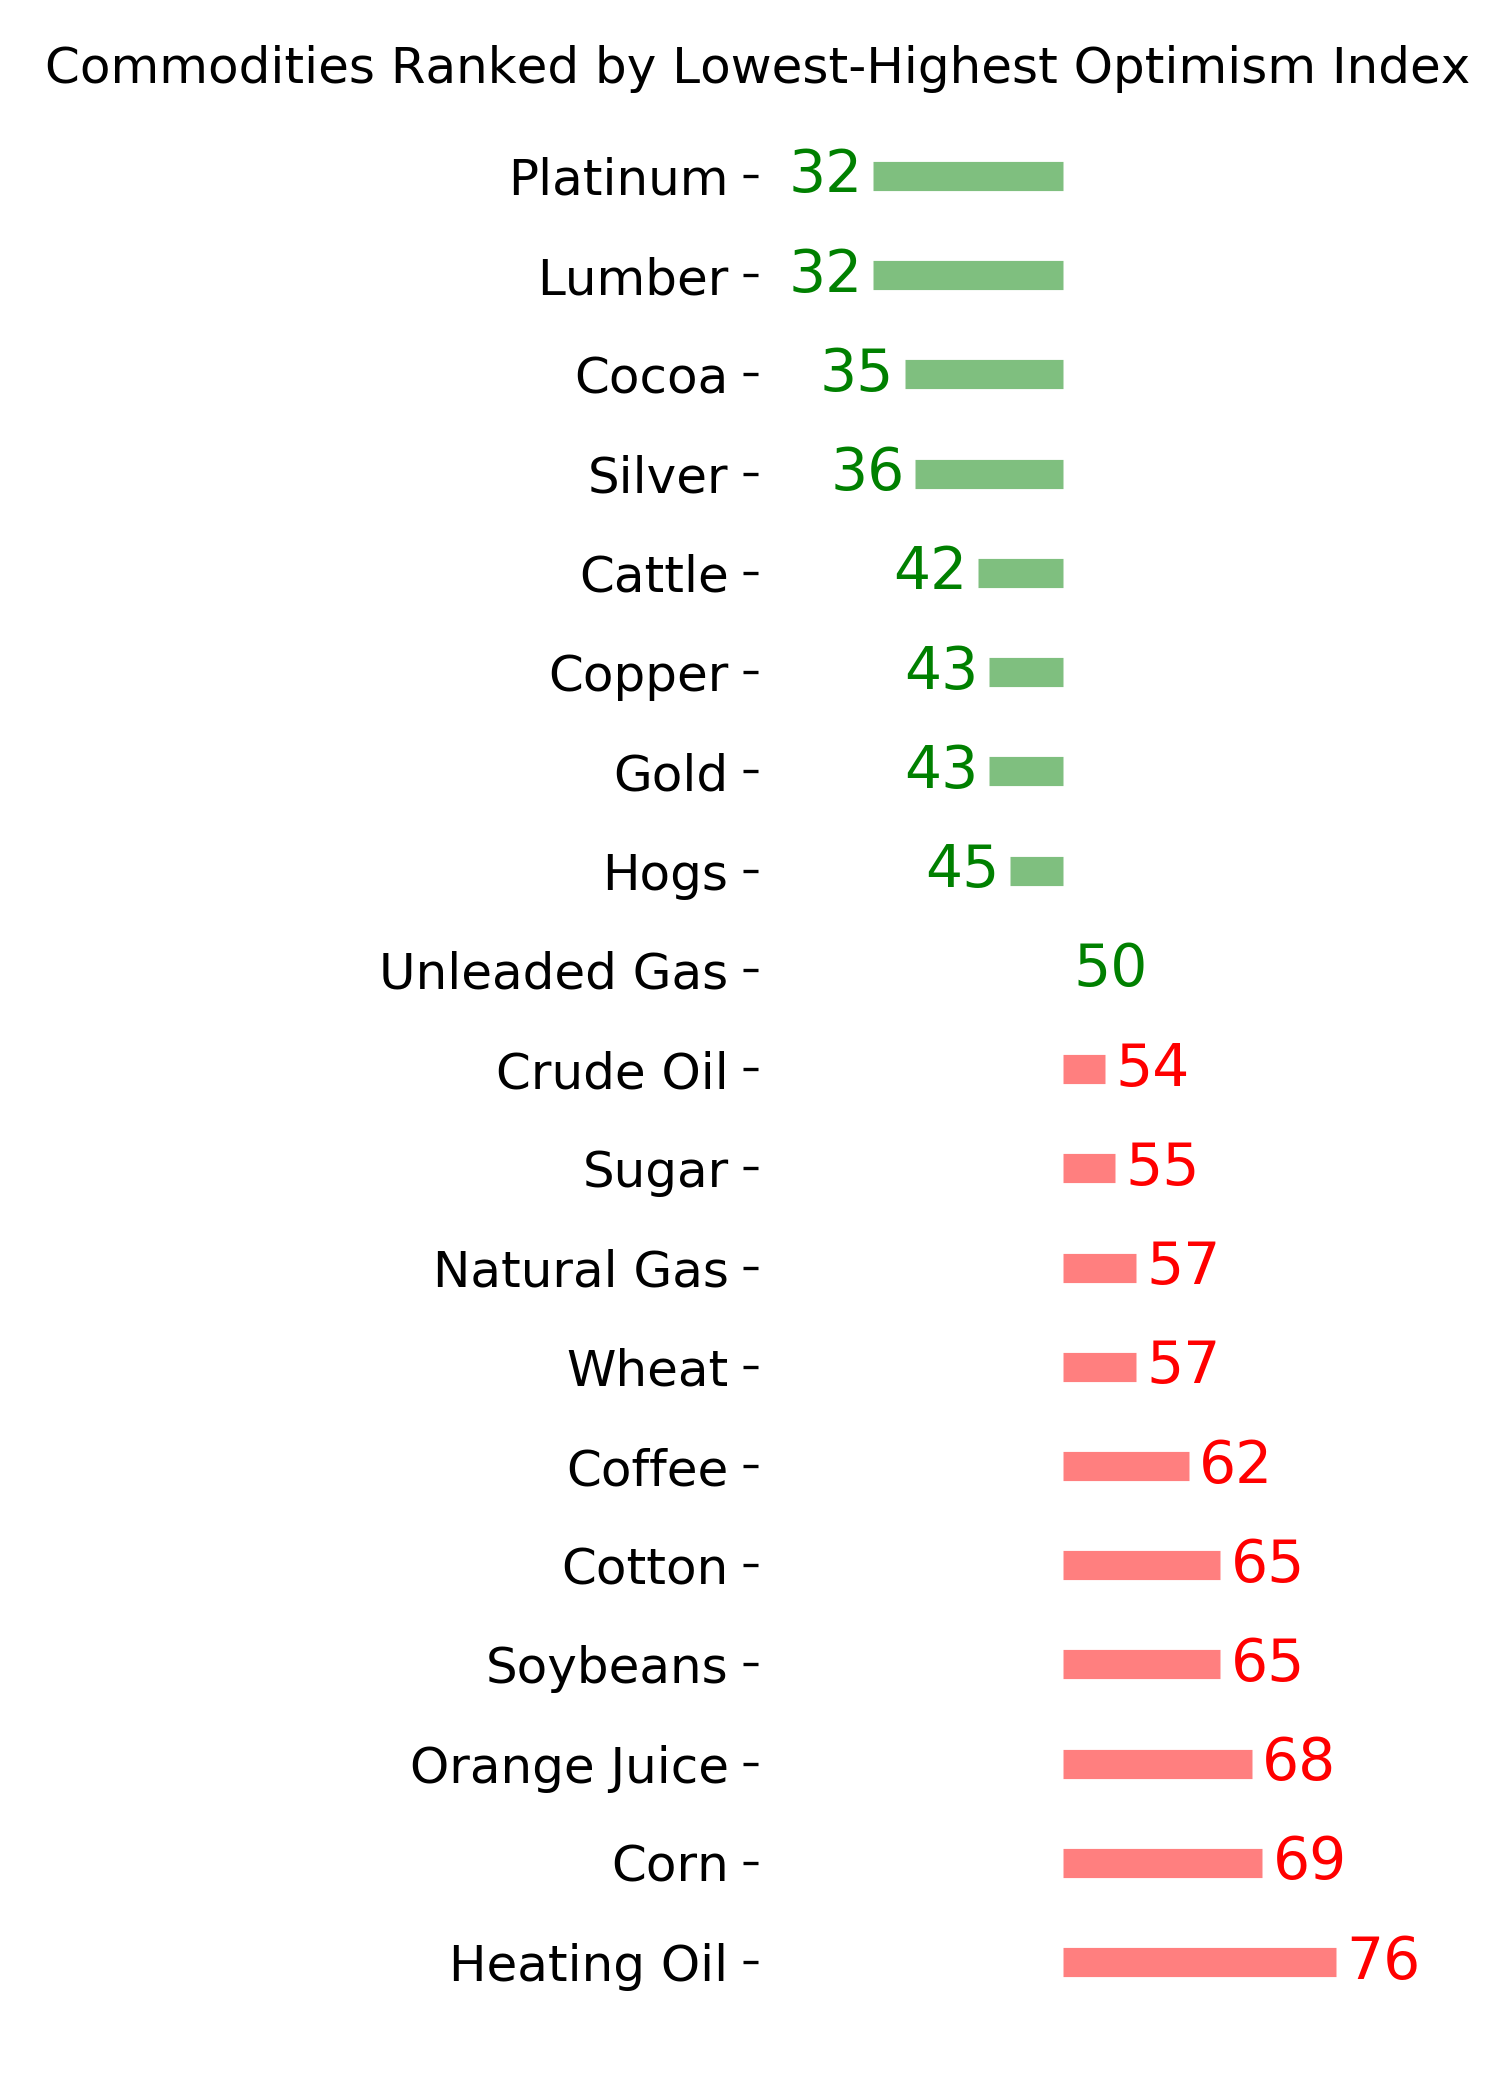
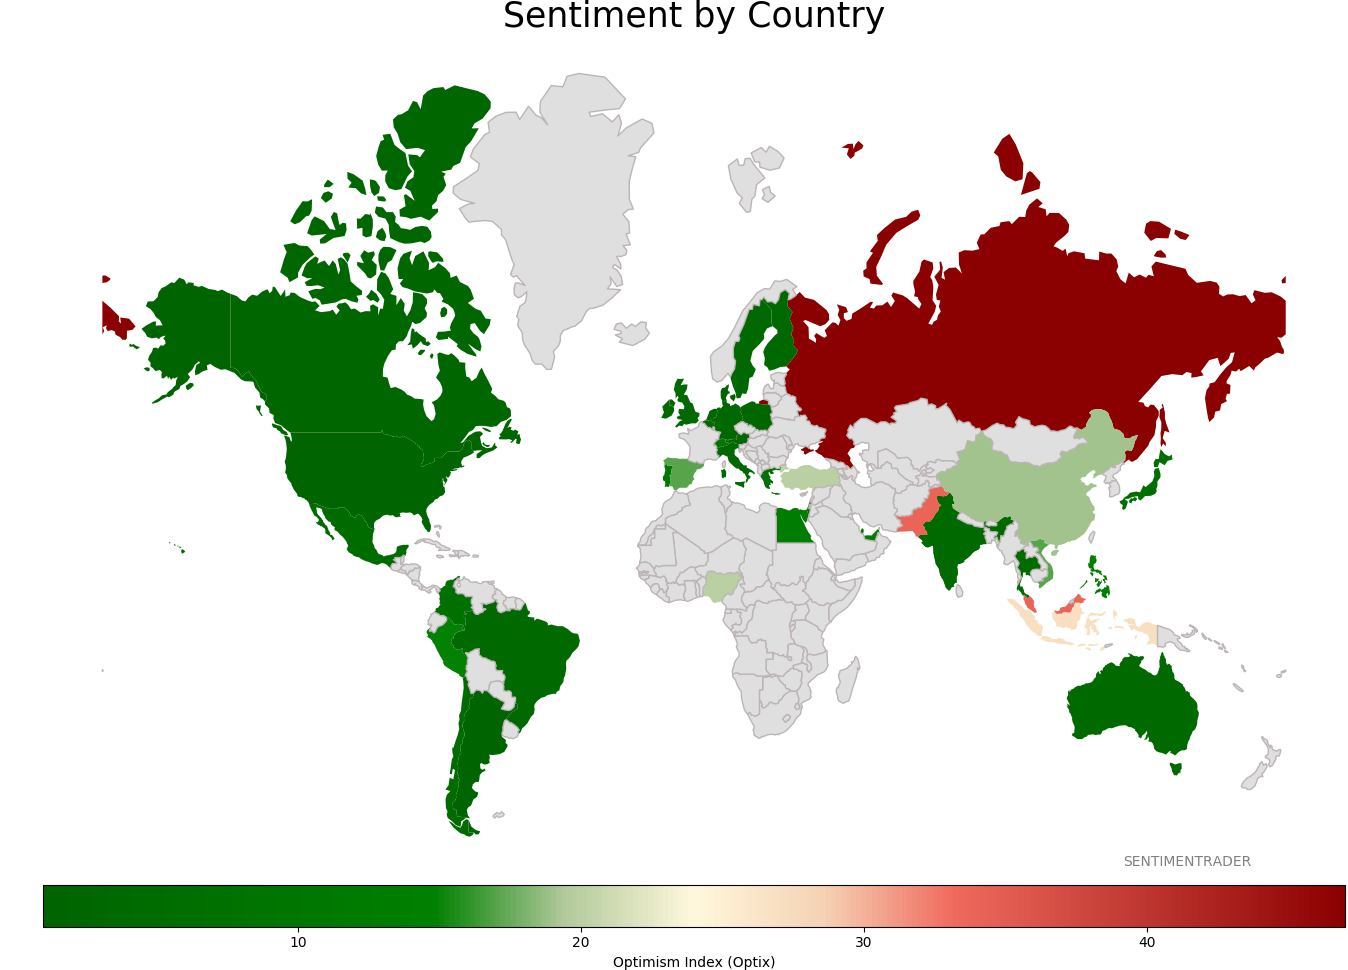
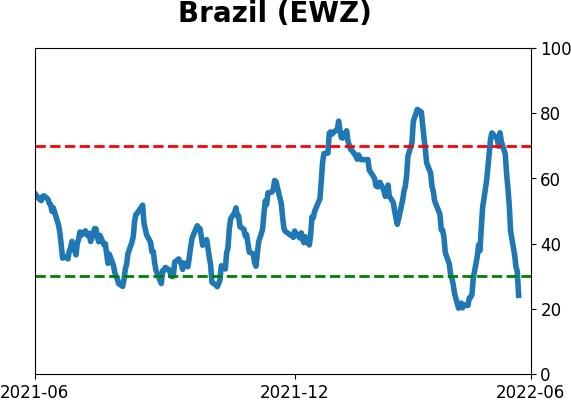
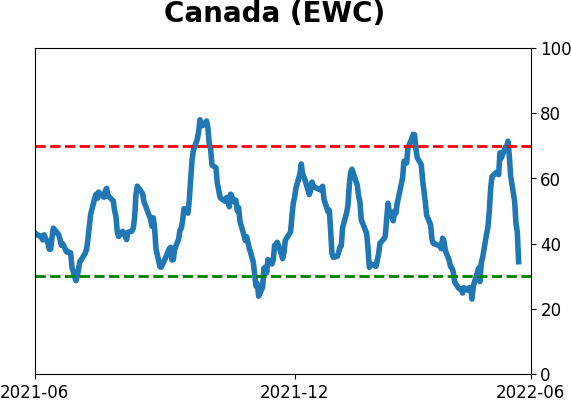
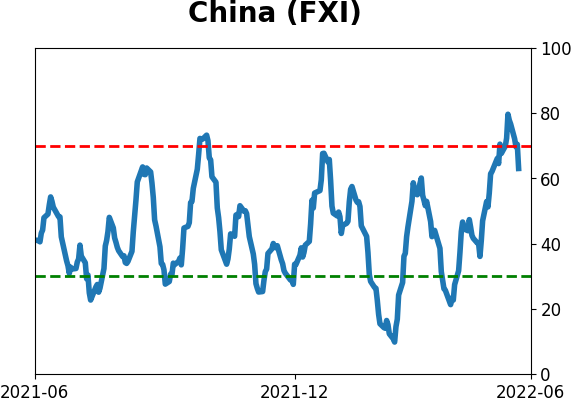
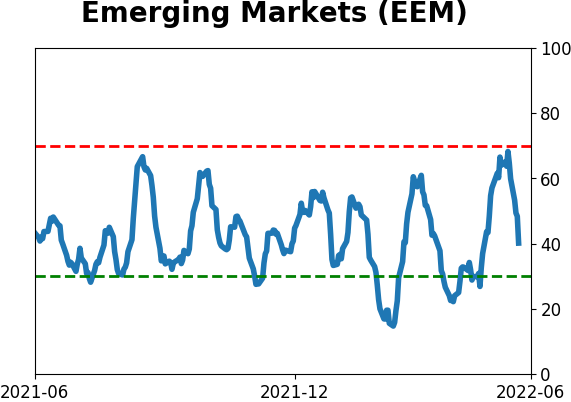
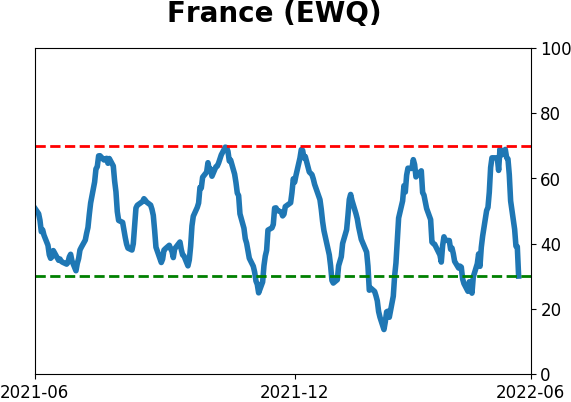
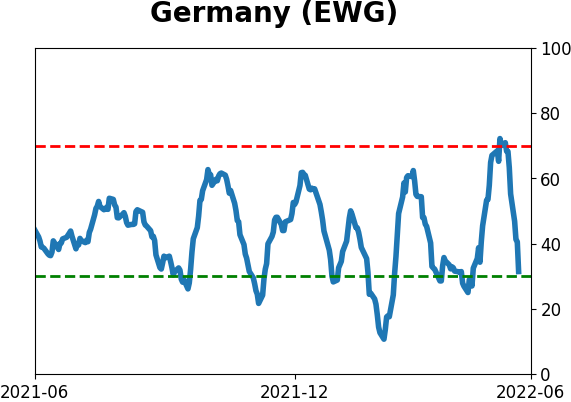
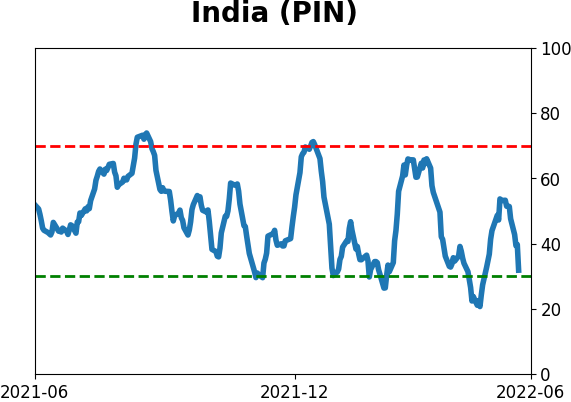
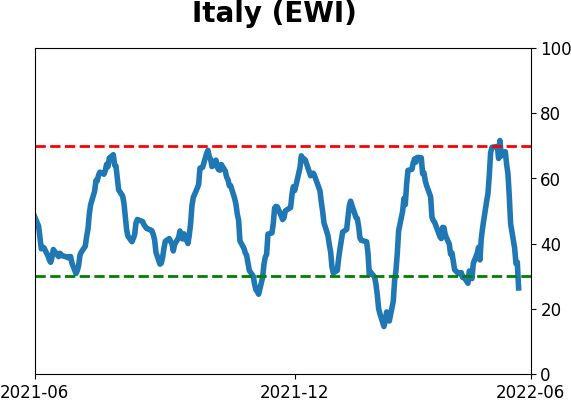
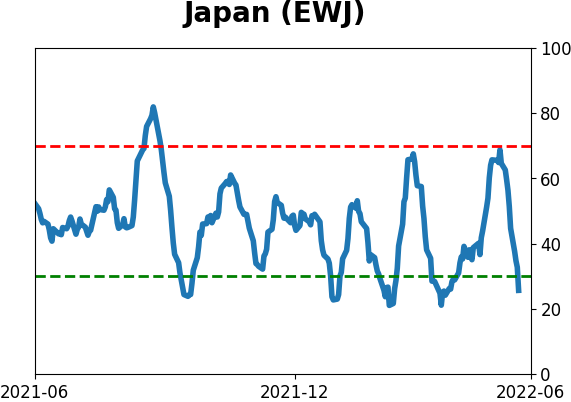
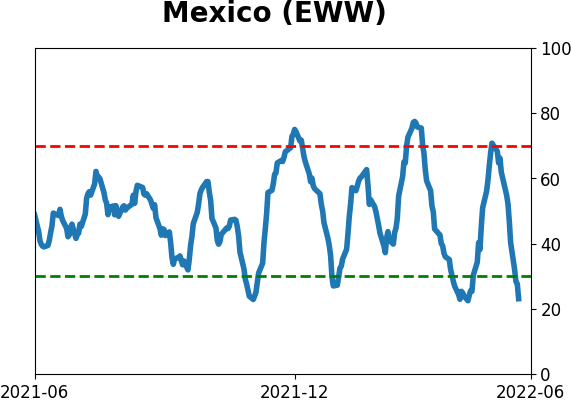
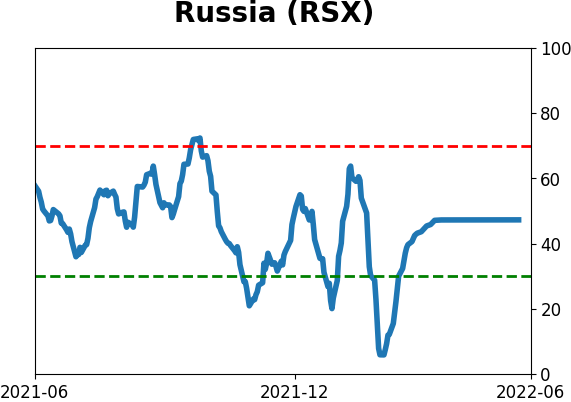
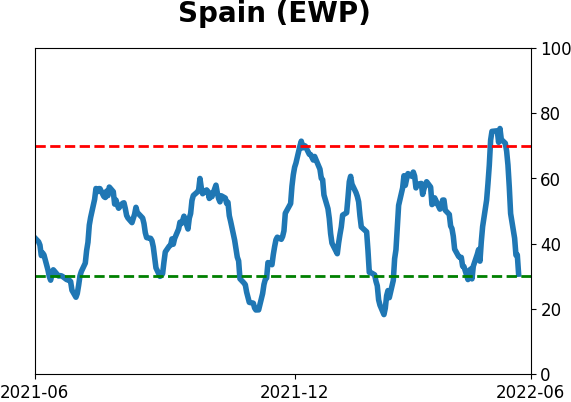
Sentiment Around The World
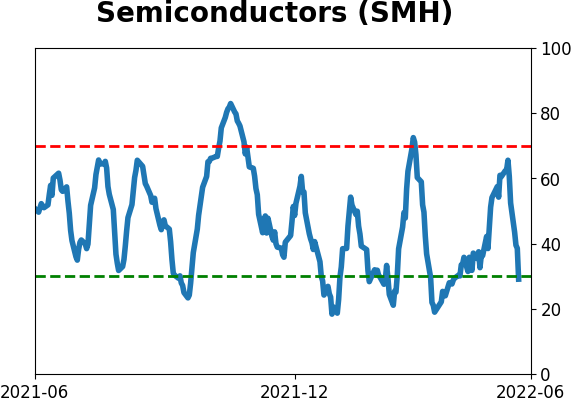
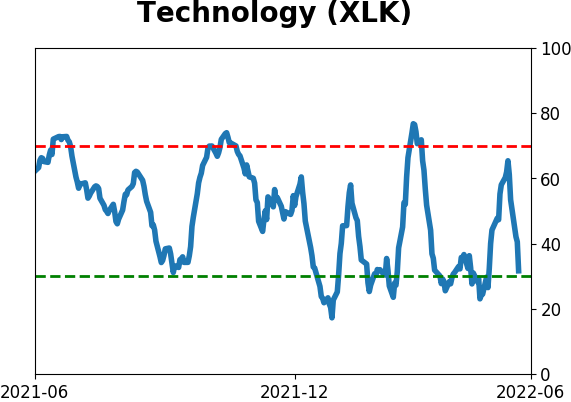
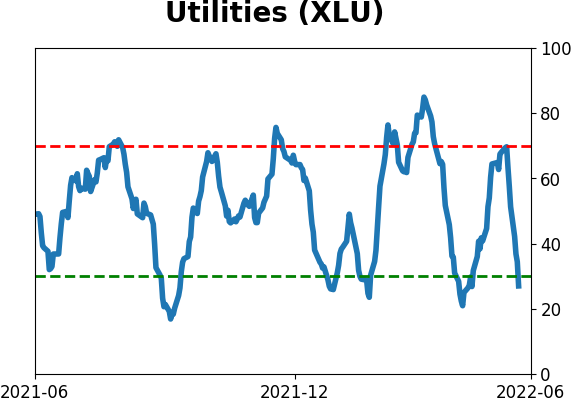
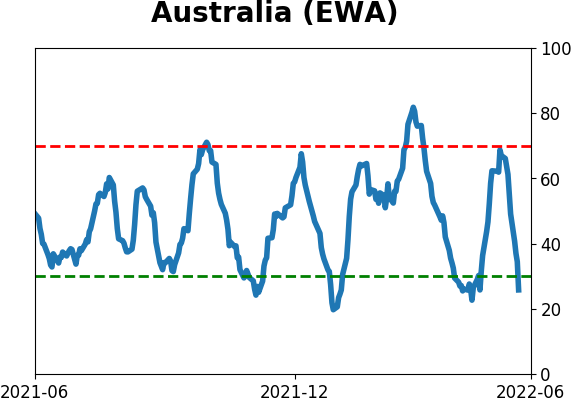
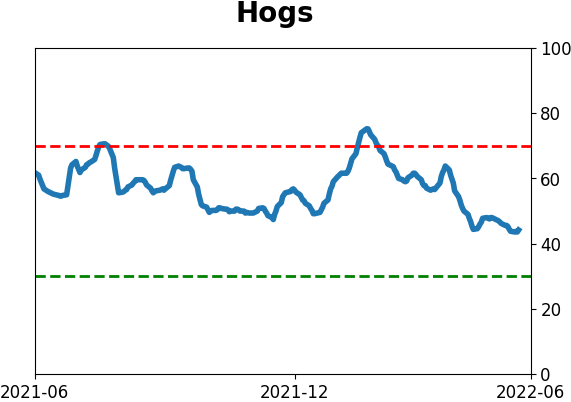
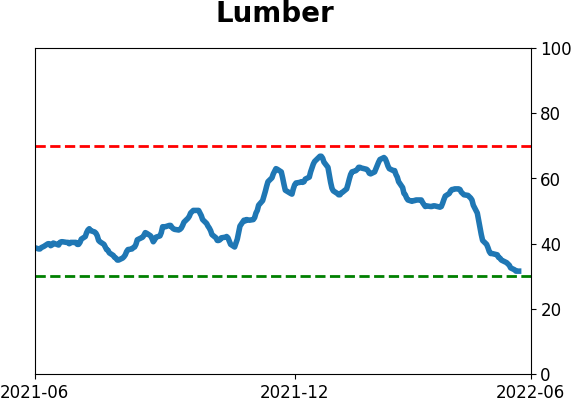
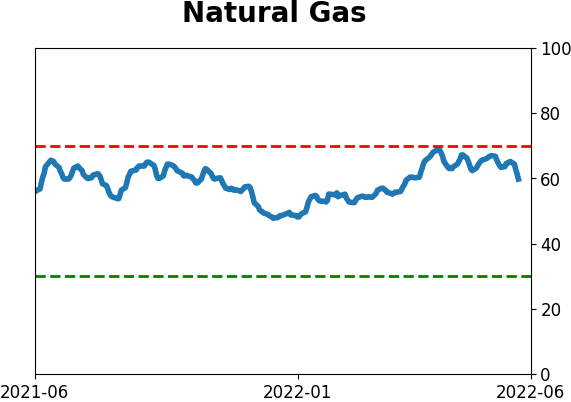
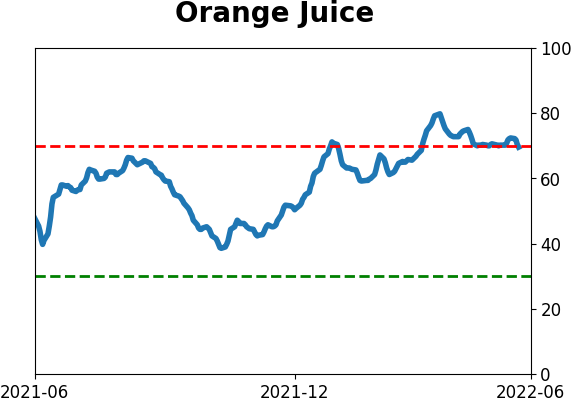
Optimism Index Thumbnails
|
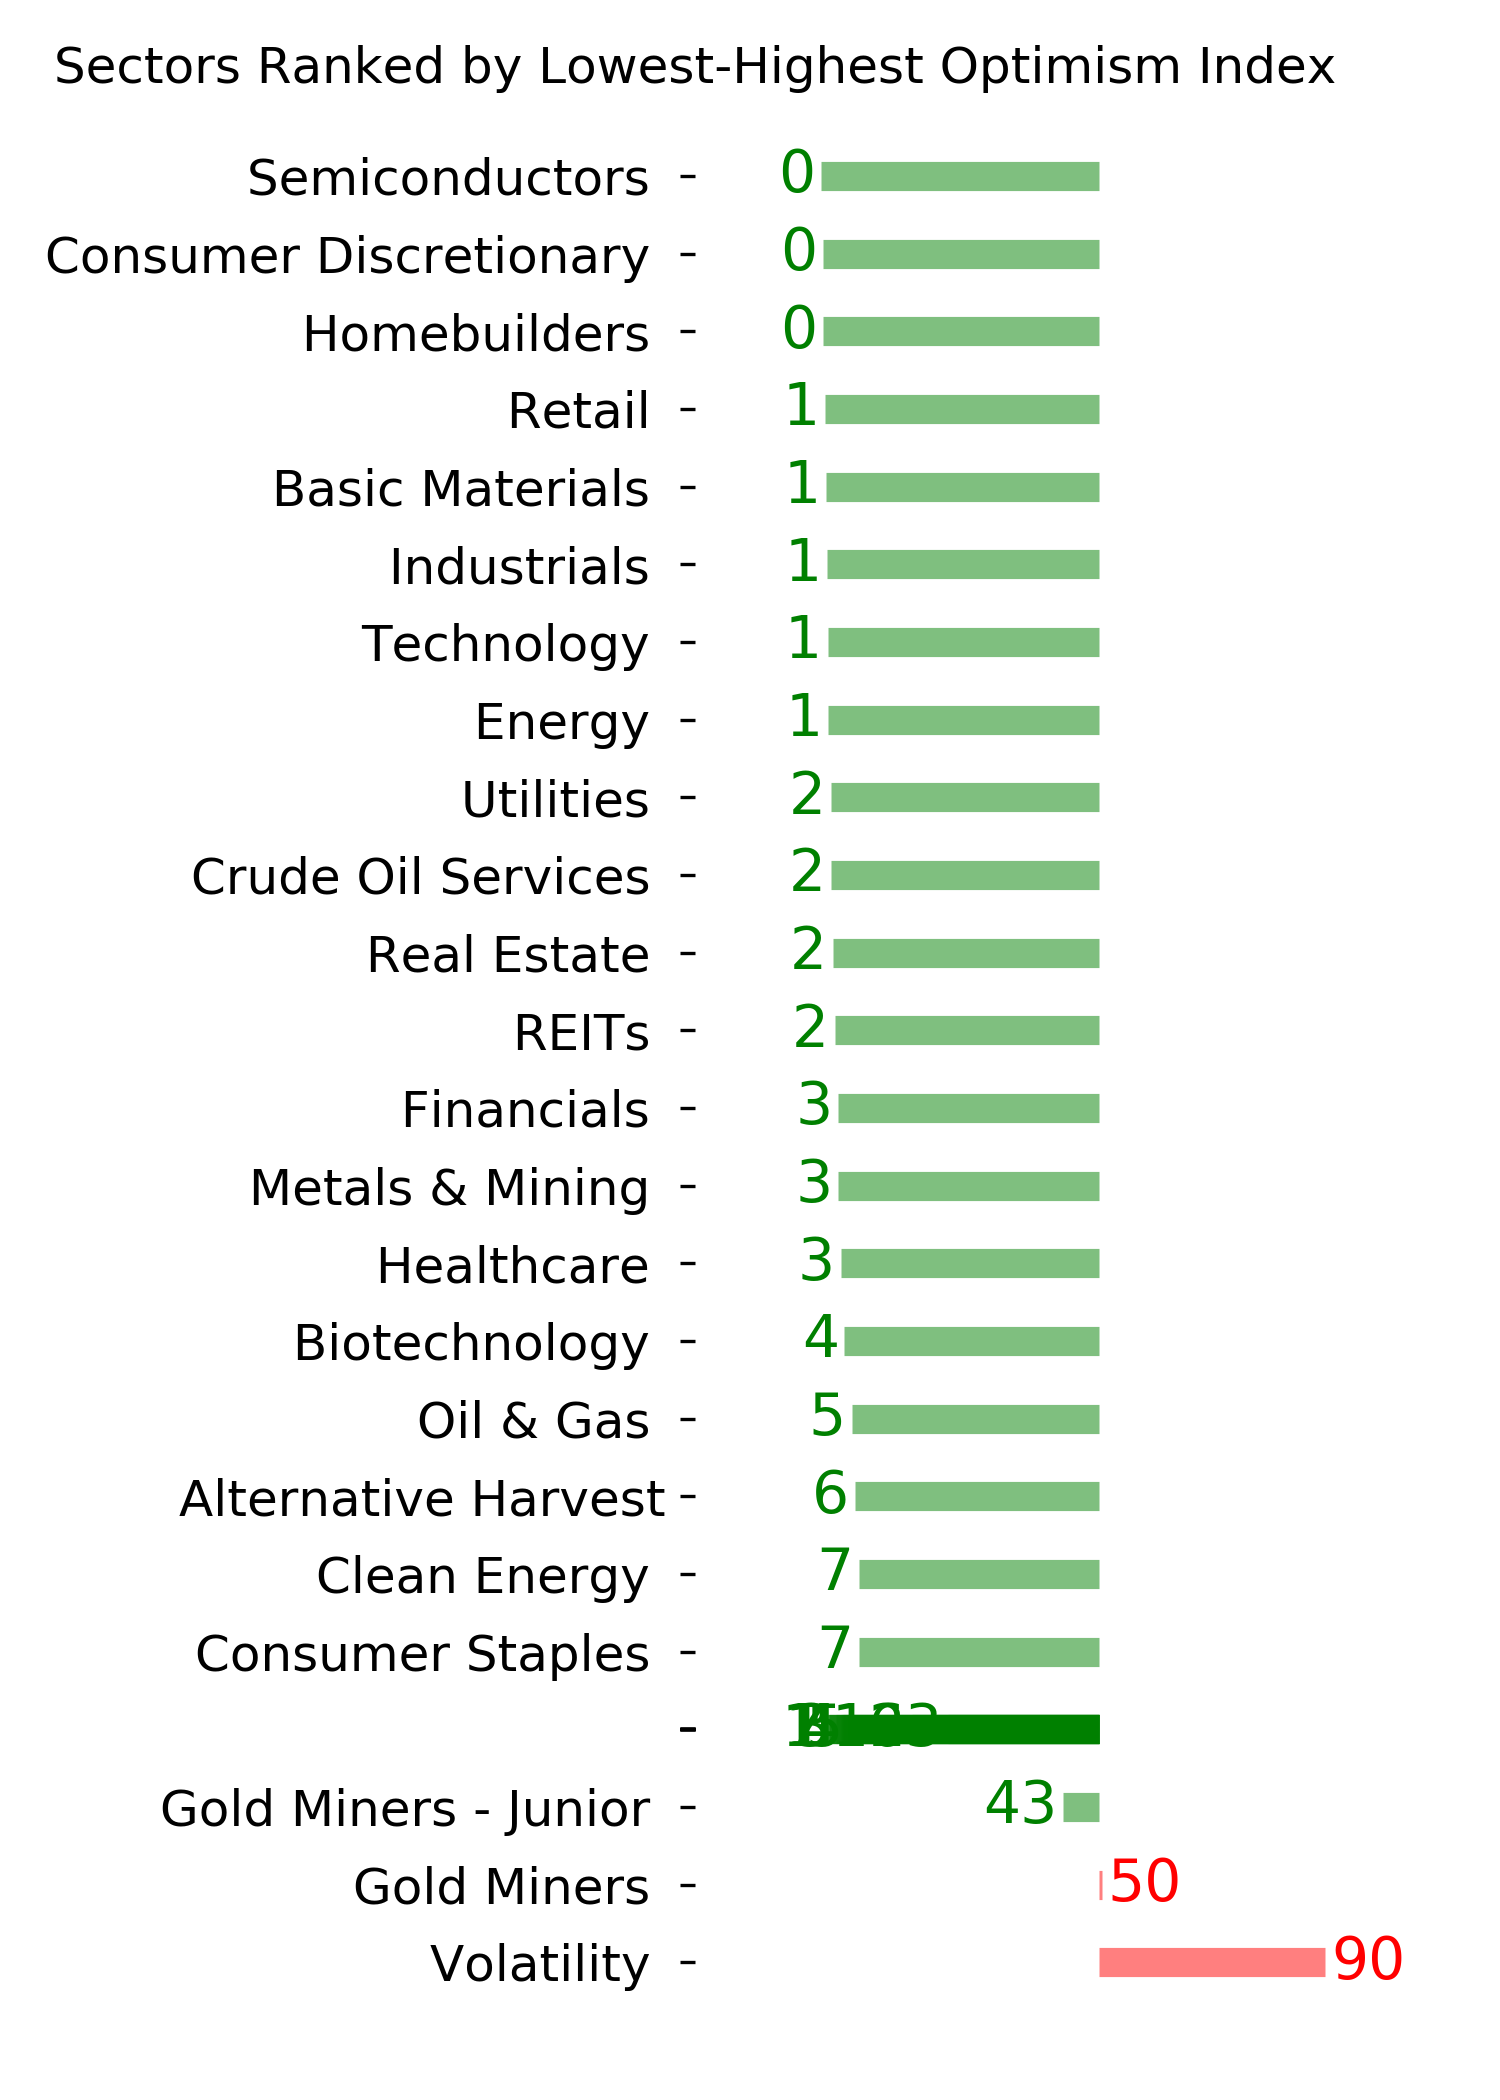
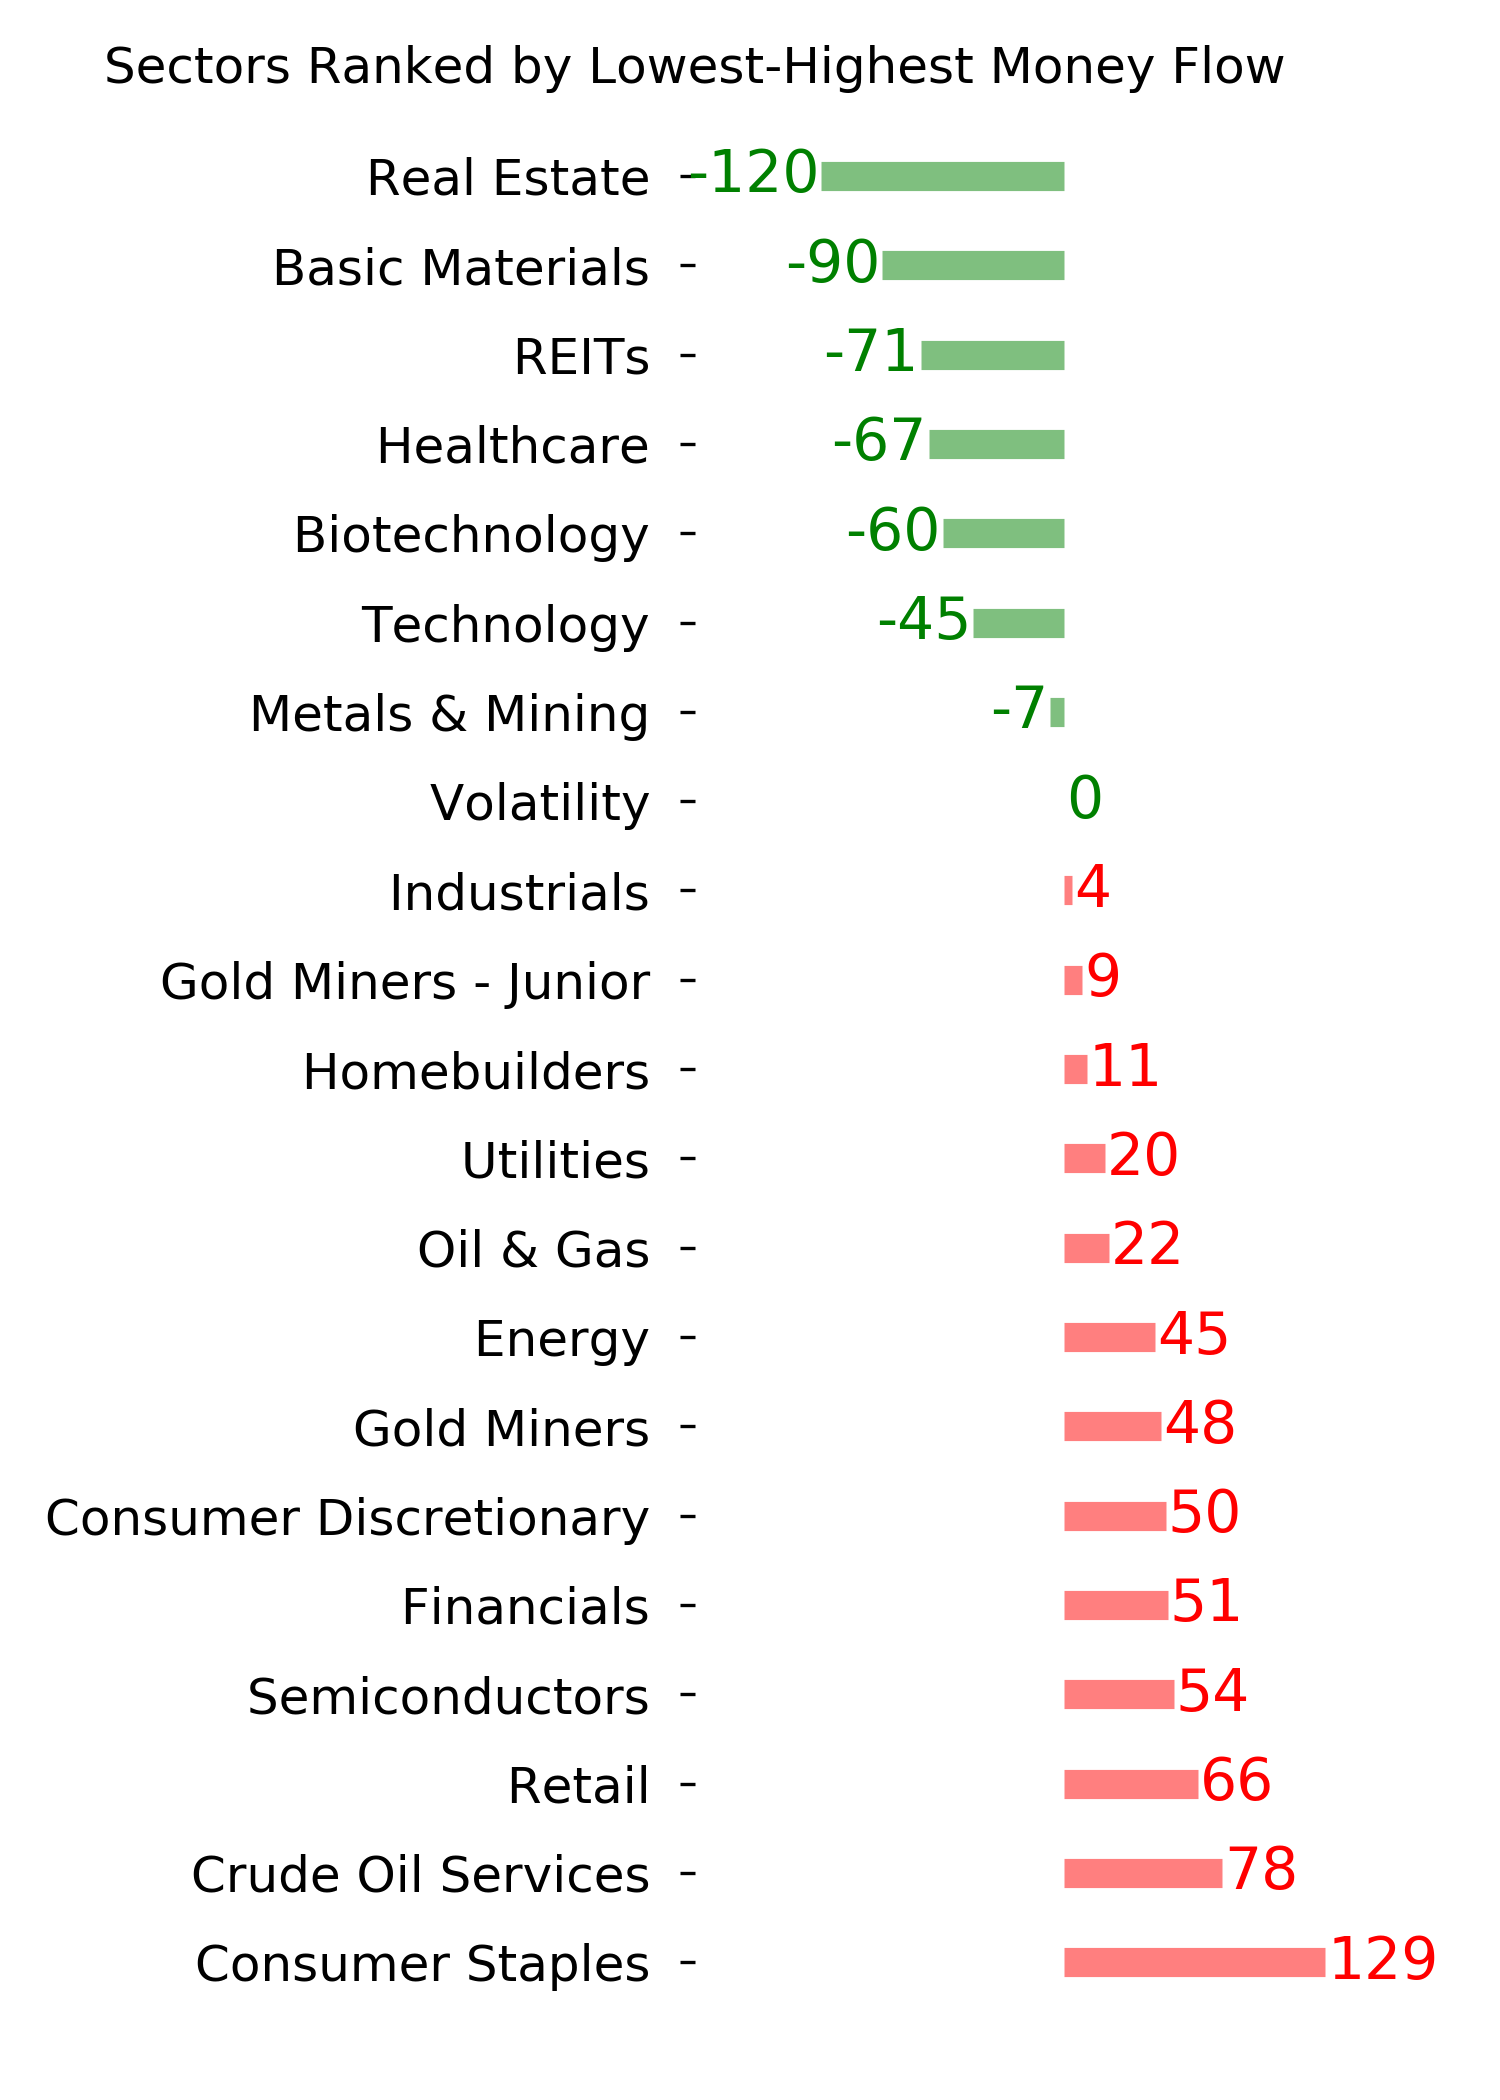
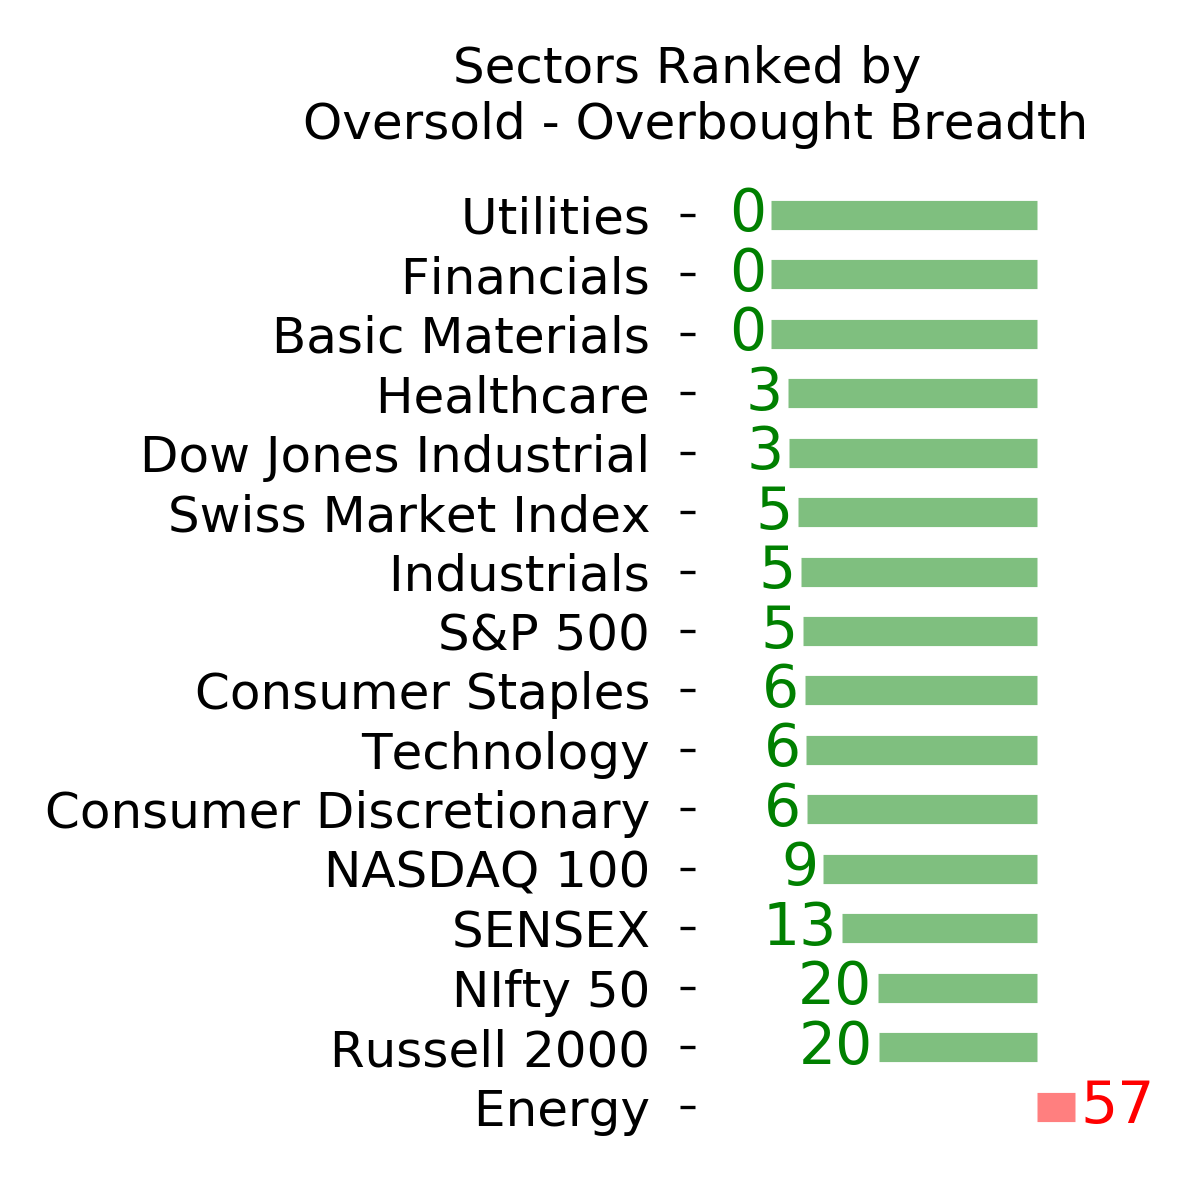
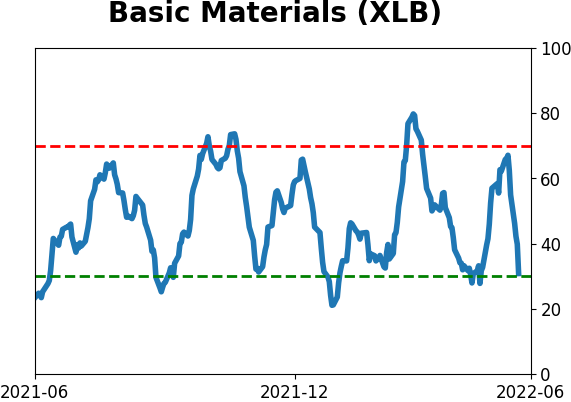
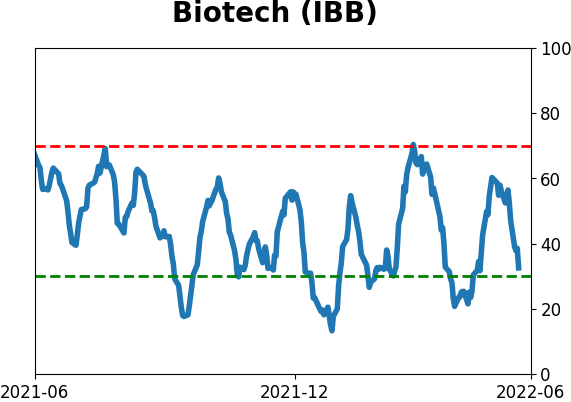
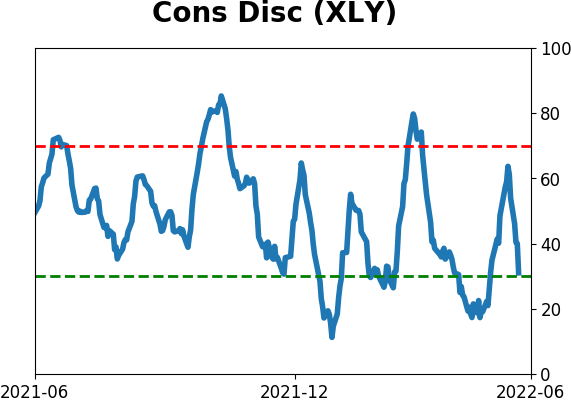
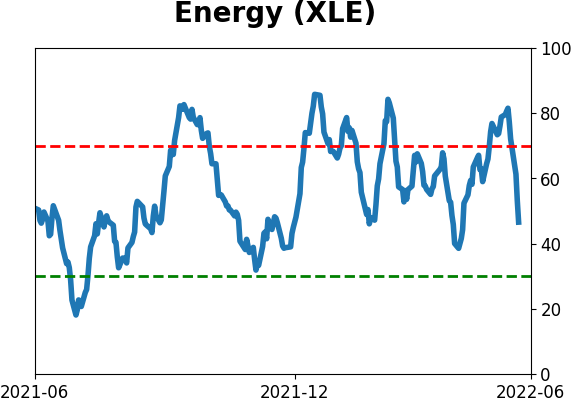
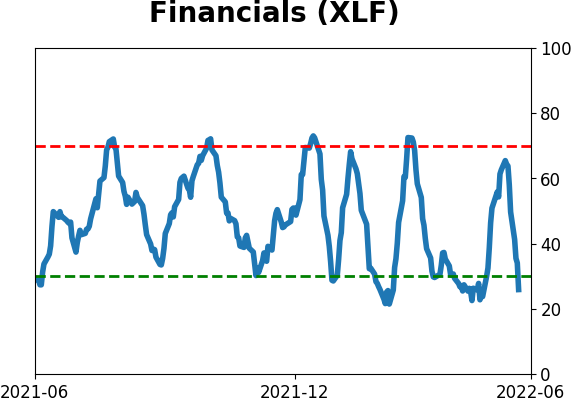
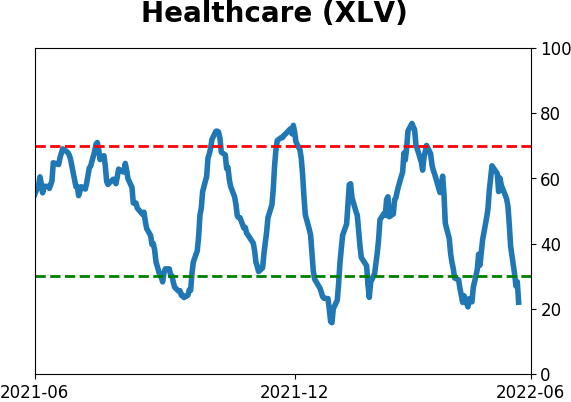
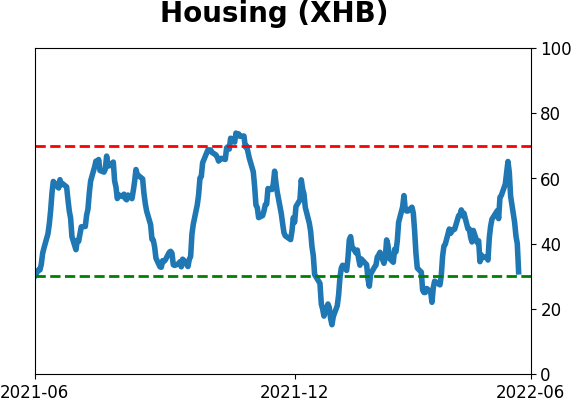
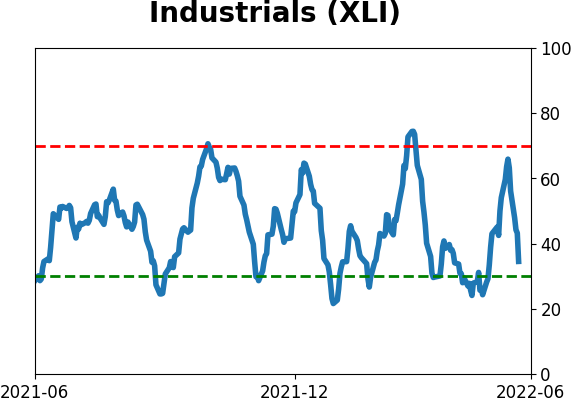
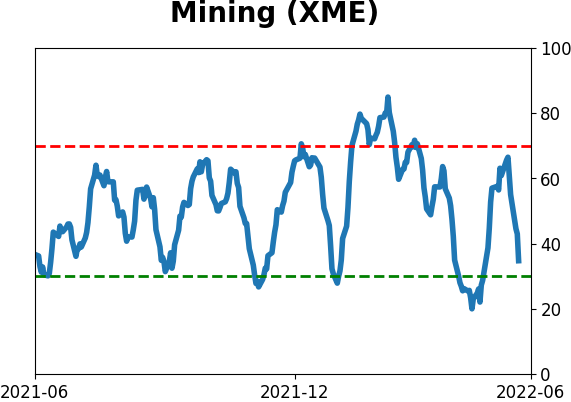
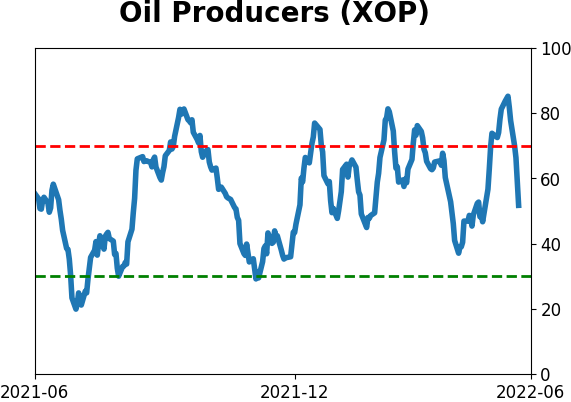
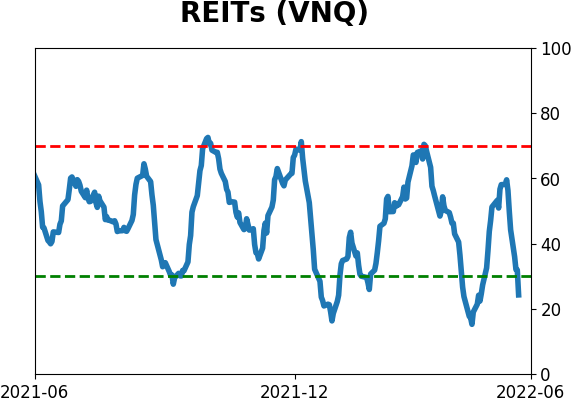
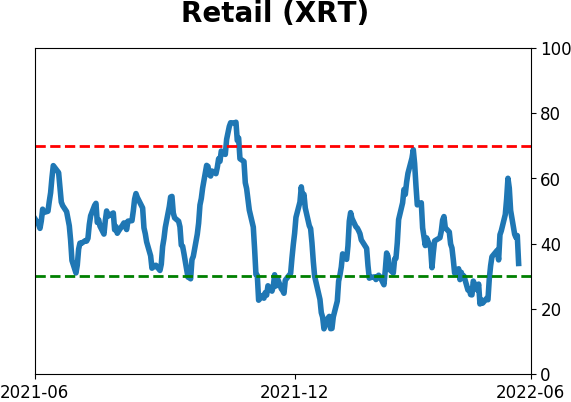
Sector ETF's - 10-Day Moving Average
|
|
|
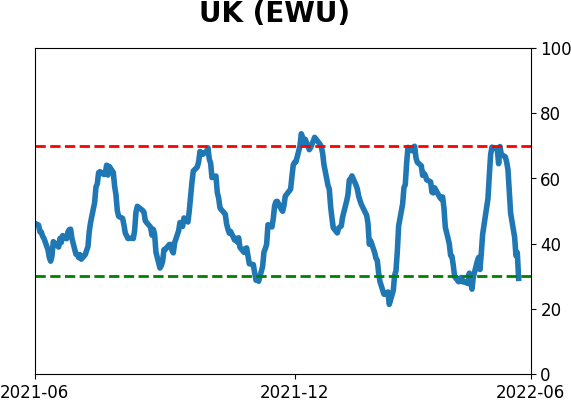
Country ETF's - 10-Day Moving Average
|
|
|
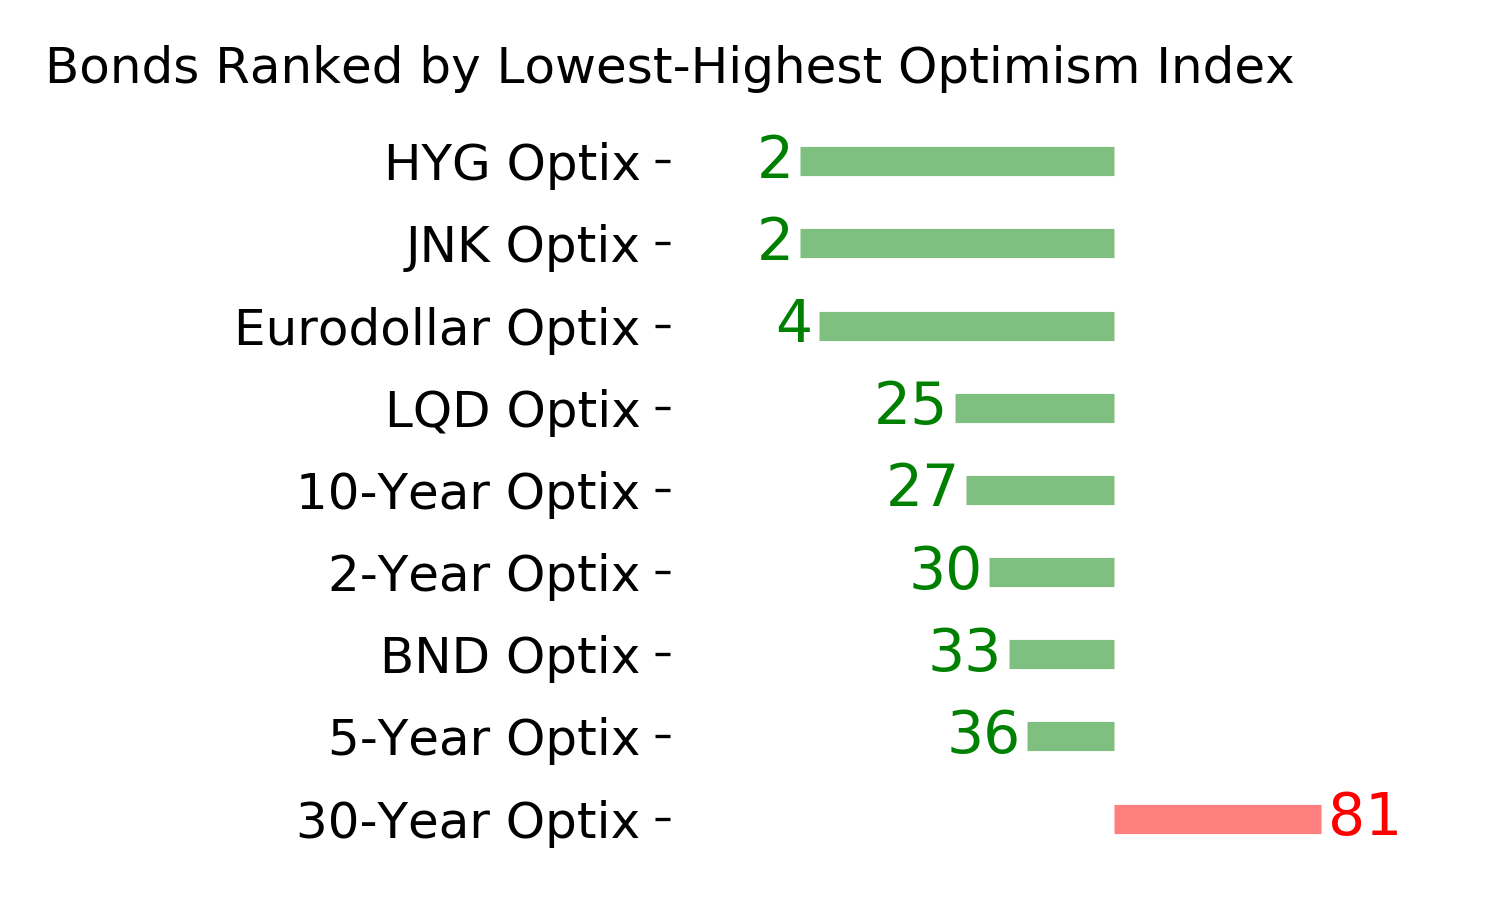
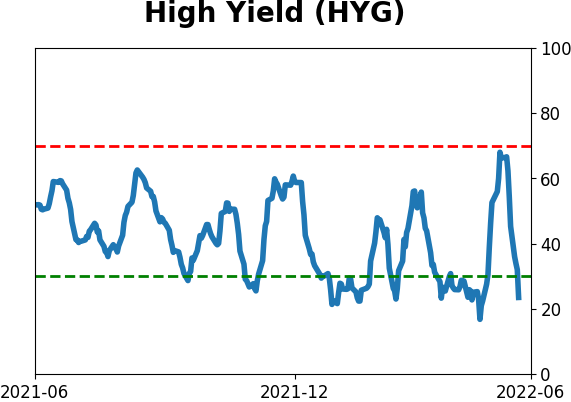
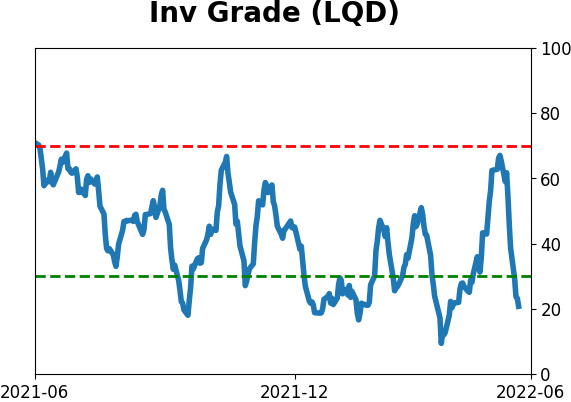
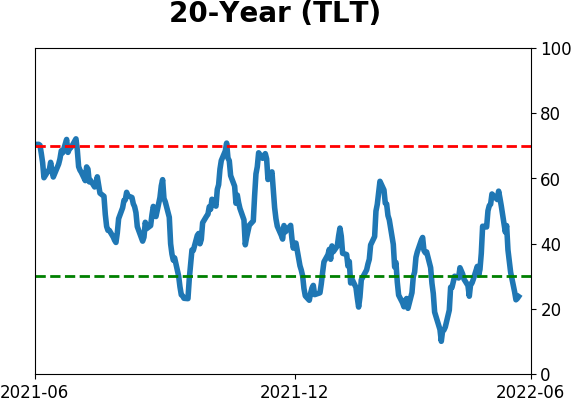
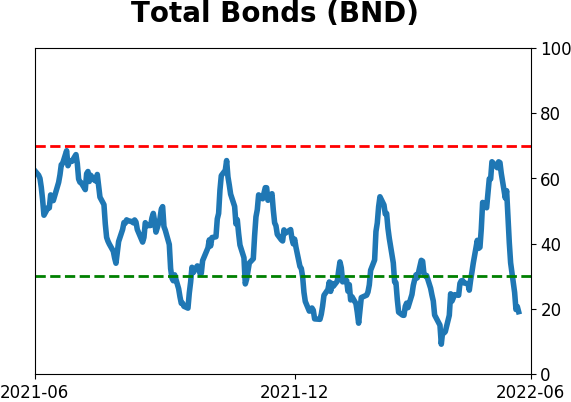
Bond ETF's - 10-Day Moving Average
|
|
|
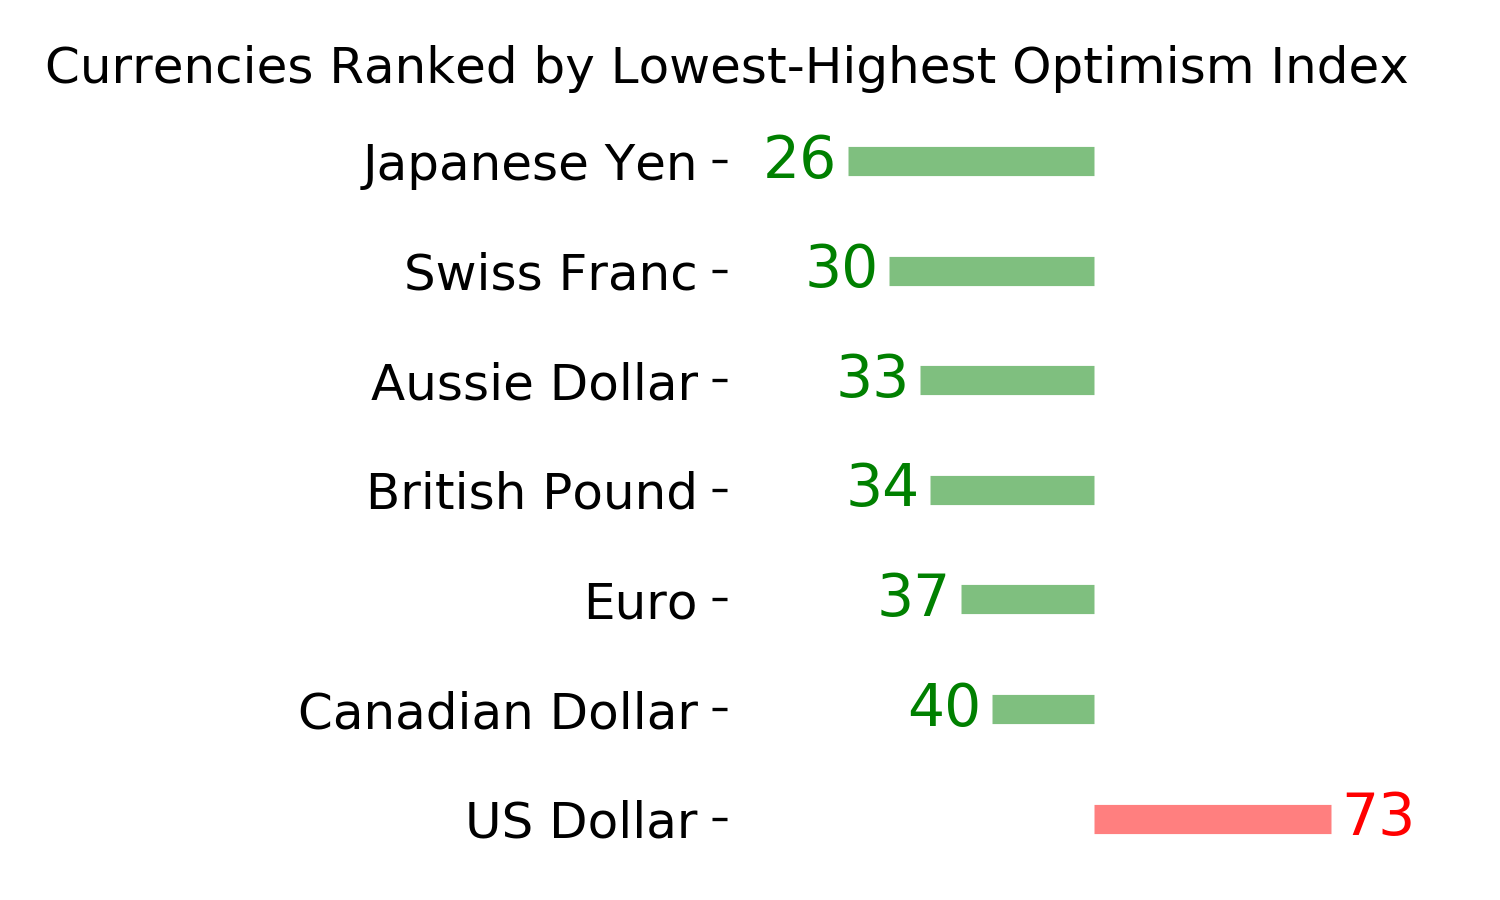
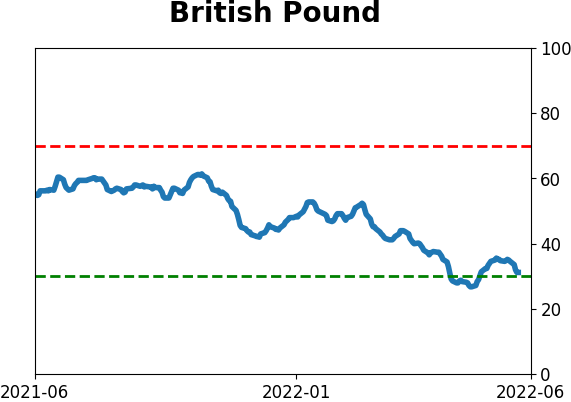
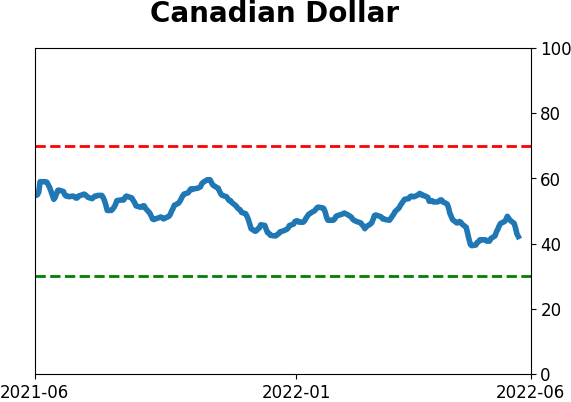
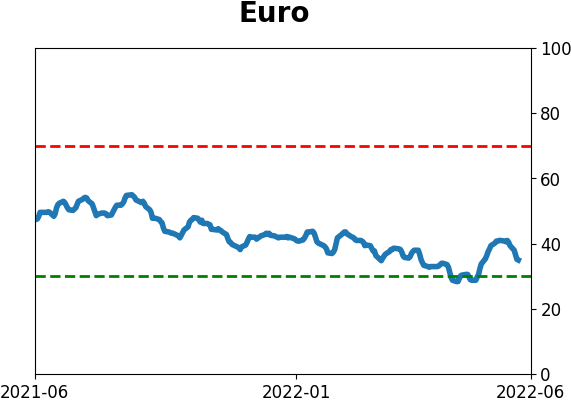
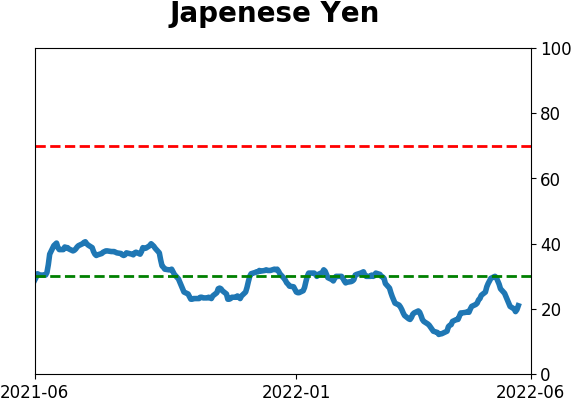
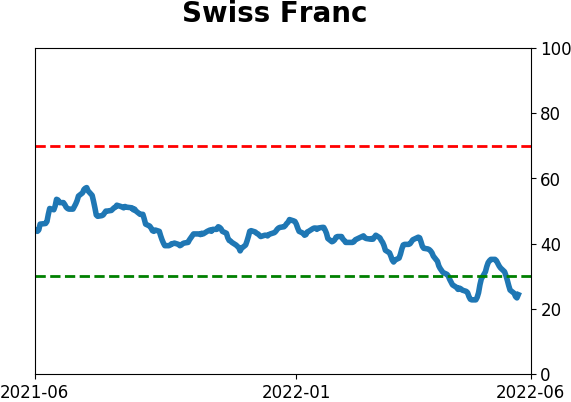
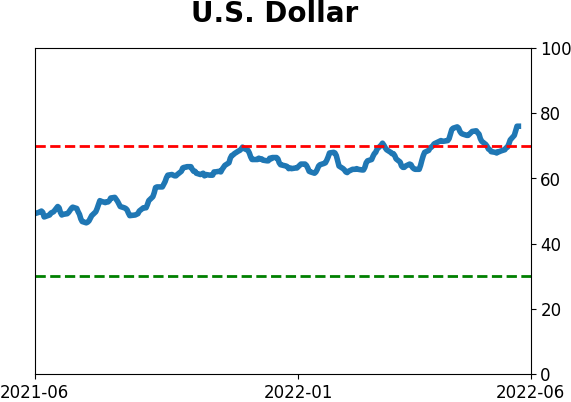
Currency ETF's - 5-Day Moving Average
|
|
|
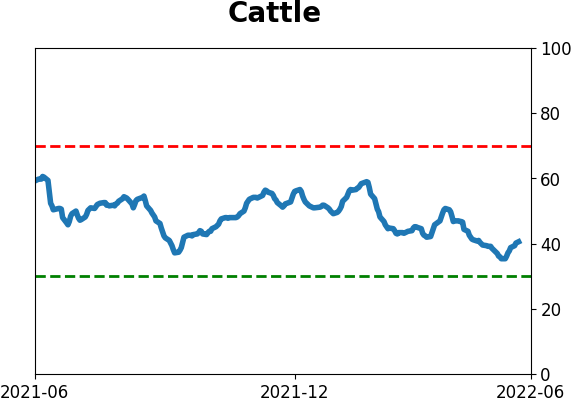
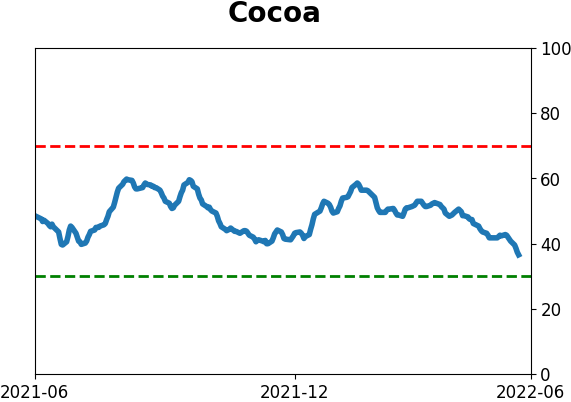
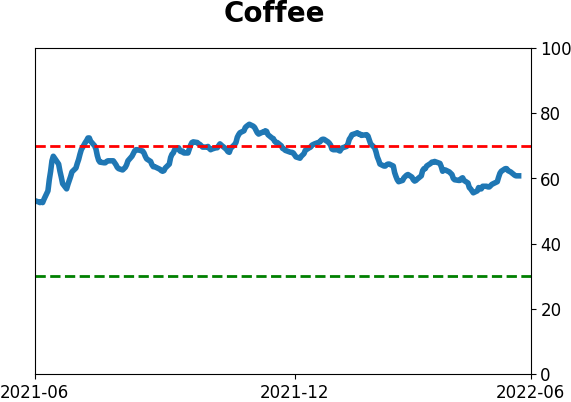
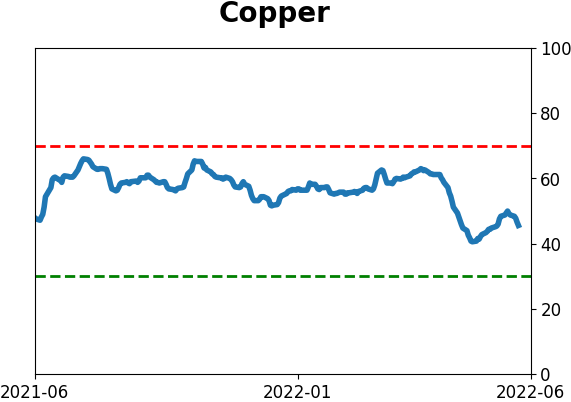
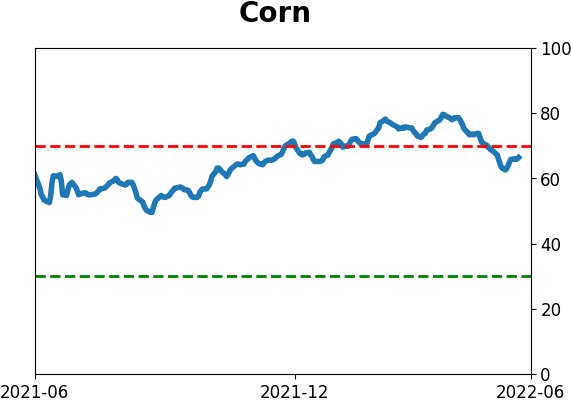
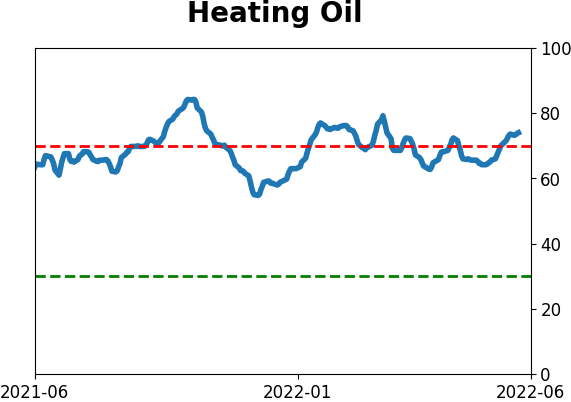
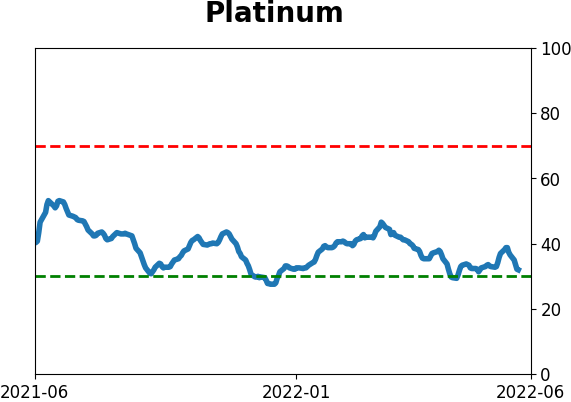
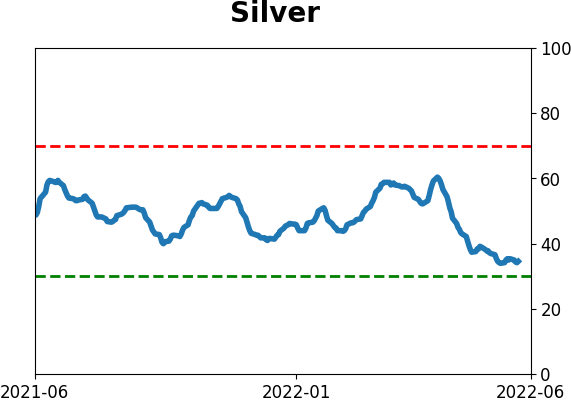
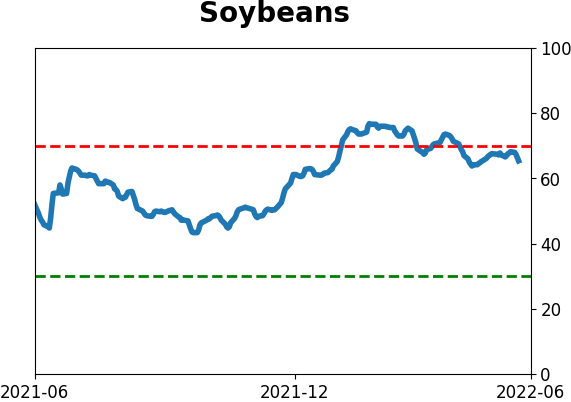
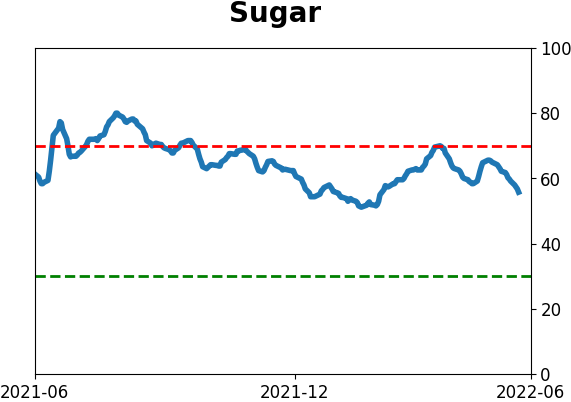
Commodity ETF's - 5-Day Moving Average
|
|