Headlines
|
|
One of the worst 3-day selloffs in history:
On Monday, stocks suffered overwhelming selling pressure, one of the worst in history. But it's even more remarkable when looking at the past 3 sessions, which compete for the worst stretch ever. Such overwhelming selling has a strong tendency to be exhaustive.
|
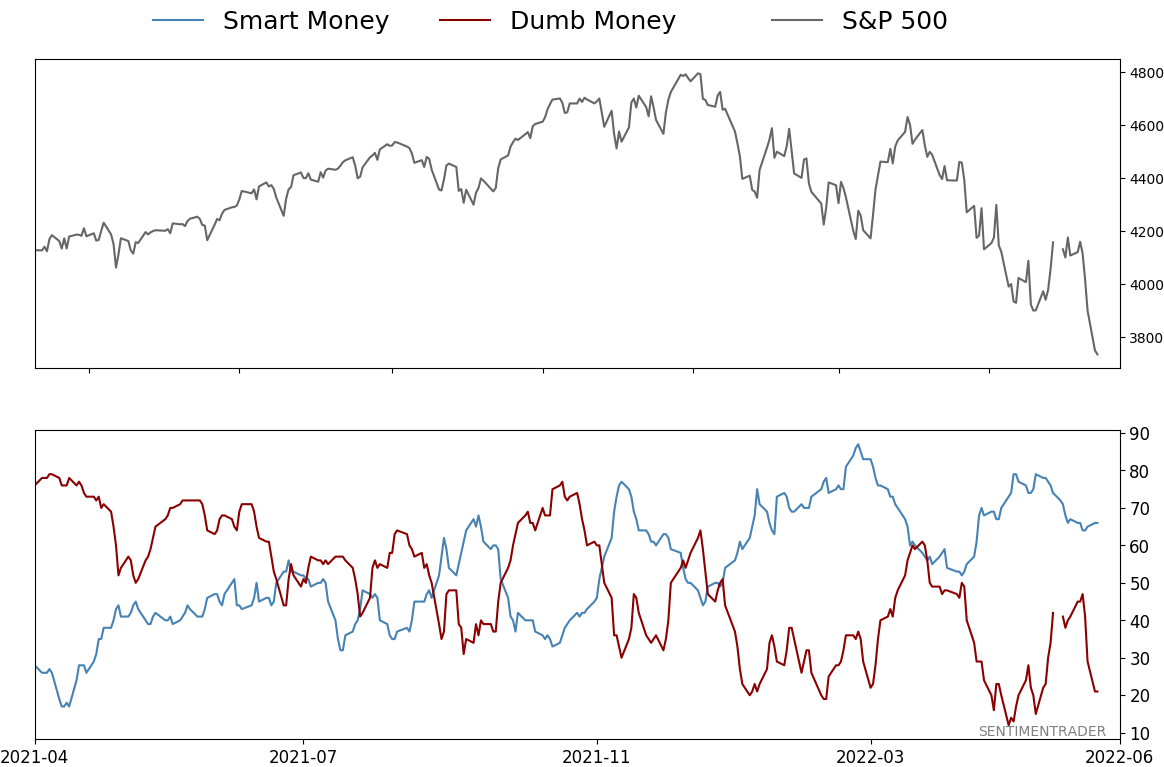
Smart / Dumb Money Confidence
|
Smart Money Confidence: 66%
Dumb Money Confidence: 21%
|
|
Risk Levels
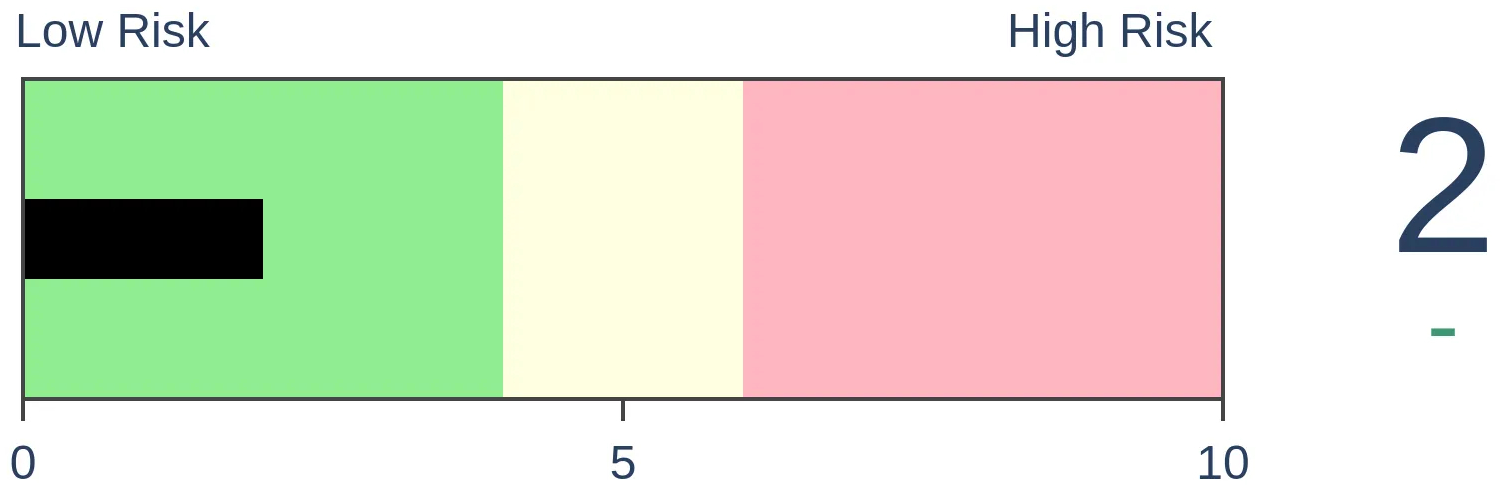
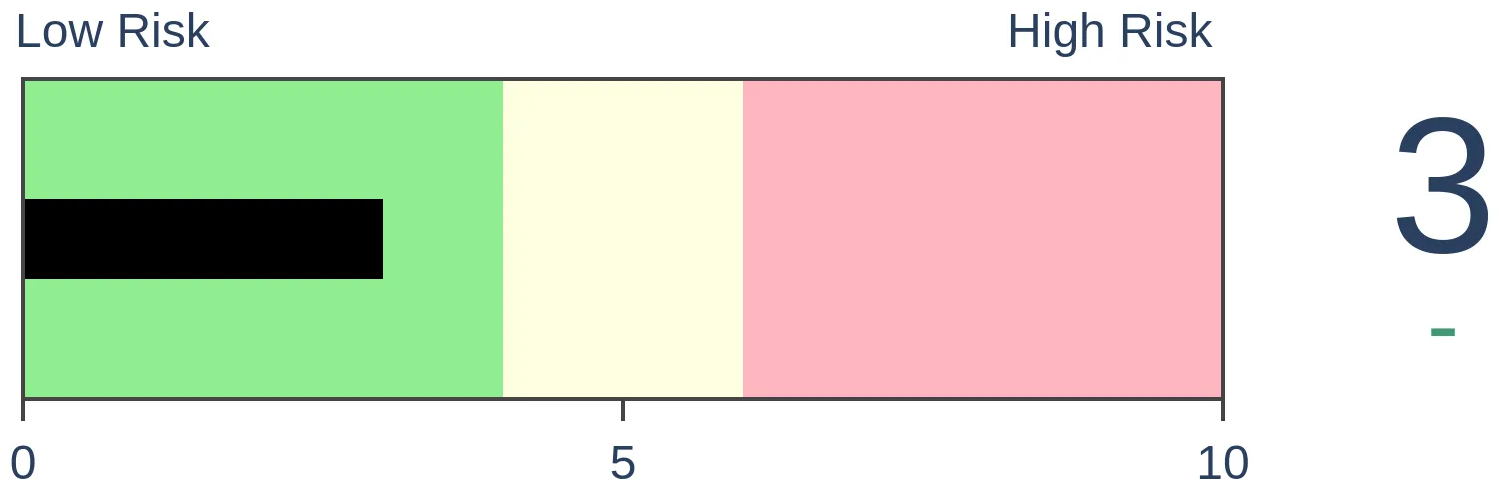
Stocks Short-Term
|
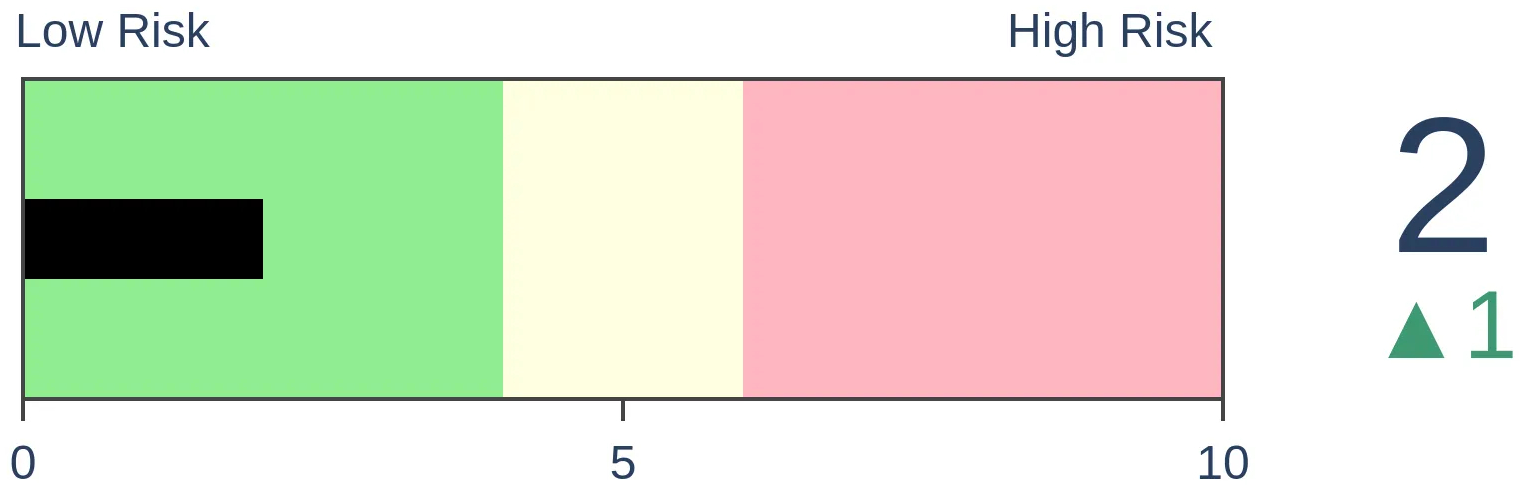
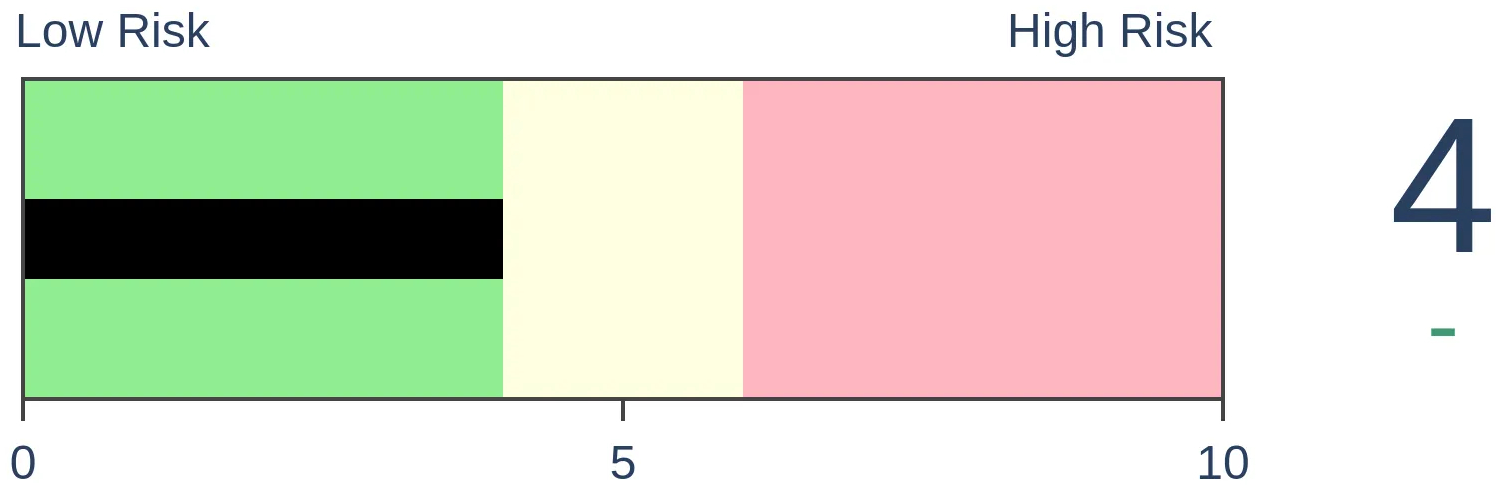
Stocks Medium-Term

|
|
Bonds
|
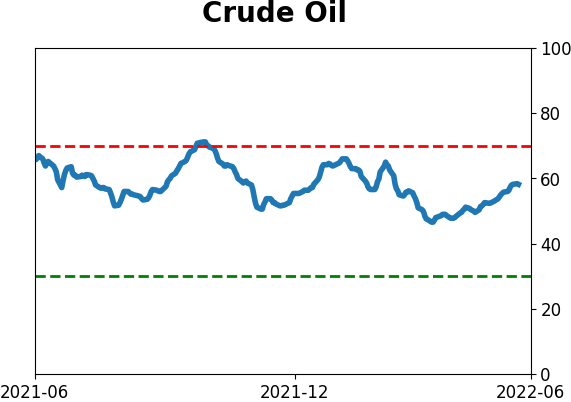
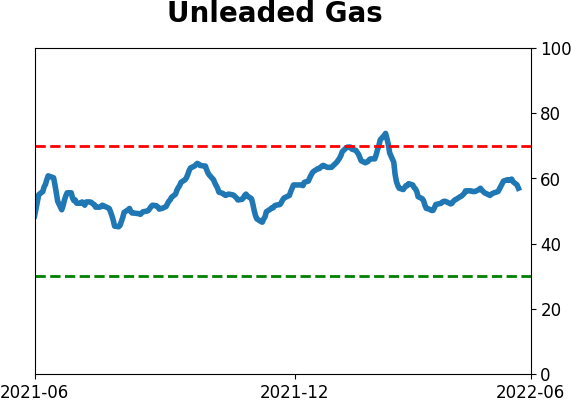
Crude Oil

|
|
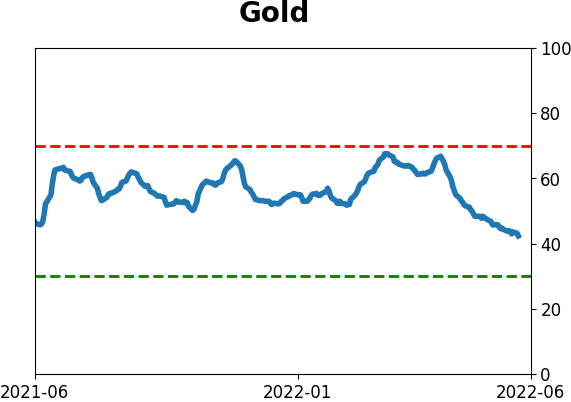
Gold
|
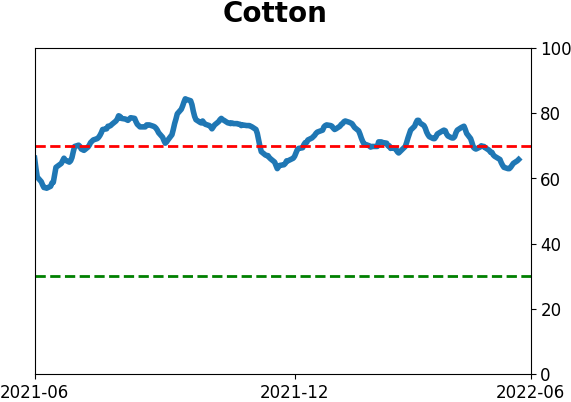
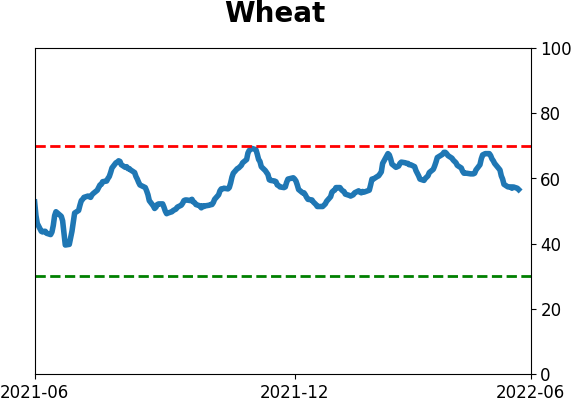
Agriculture
|
|
Research
By Jason Goepfert
BOTTOM LINE
On Monday, stocks suffered overwhelming selling pressure, one of the worst in history. But it's even more remarkable when looking at the past 3 sessions, which compete for the worst stretch ever. Such overwhelming selling has a strong tendency to be exhaustive.
FORECAST / TIMEFRAME
None
|
Key points:
- The selling pressure on Monday was historically severe
- Over the past three days, stocks have suffered one of the most overwhelming bouts of selling in 90 years
- Similar selling pressure tended to lead to rebounds, then tests of the panic low
A nearly unmatched waterfall decline
We saw on Monday that, entering the week, stocks were facing a historic amount of selling pressure. It only got worse.
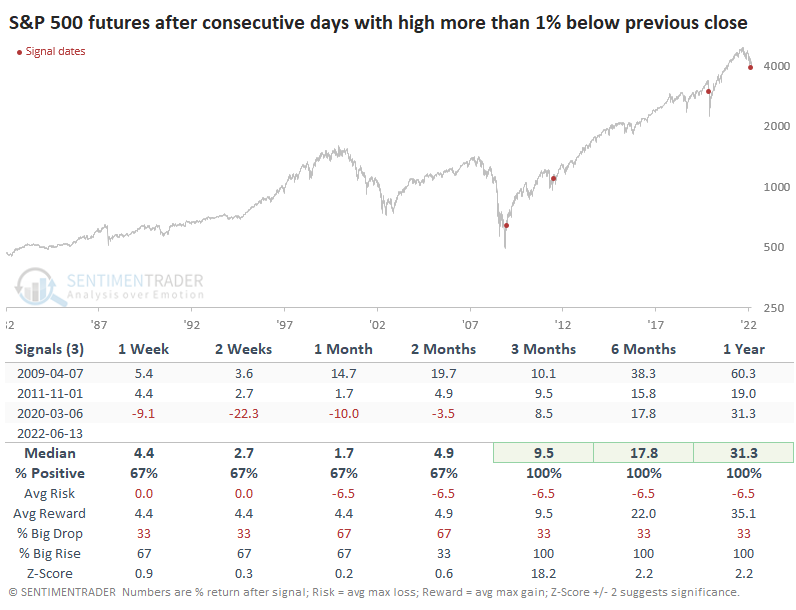
With the overnight selling pressure, the S&P 500 futures were down big at the open and never got closer than 1.5% from its previous close. That happened on Friday, too.
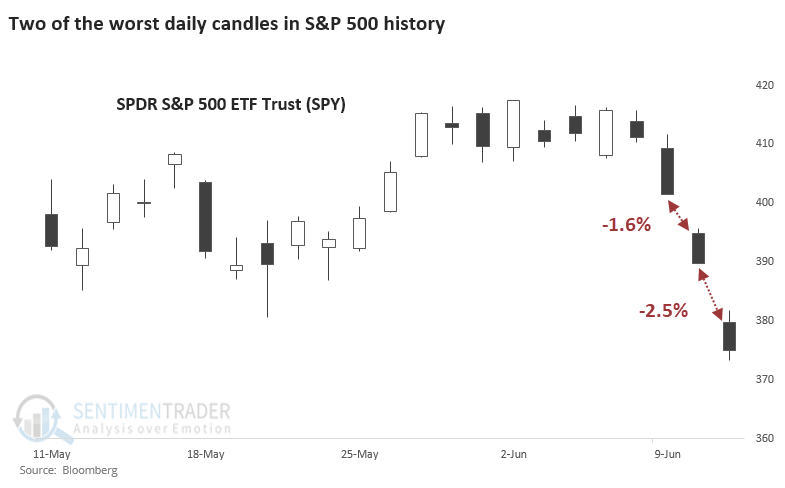
Remarkably, this has only happened three other times since the inception of the S&P 500 futures contract in 1982.
Into the bear
The decline pushed the S&P 500 below the widely-watched 20% drawdown level, a media event that nobody can ignore. Those of us who have been around for a while immediately gravitate to 2002 and 2008 because they were so traumatic, but there have been many other 20% drawdowns. Most recovered quickly.
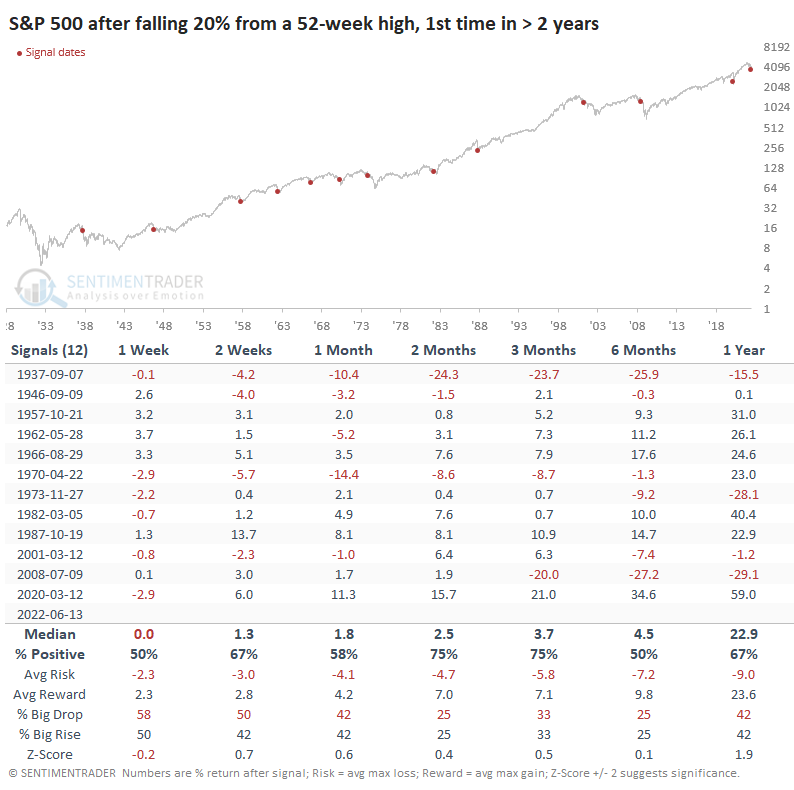
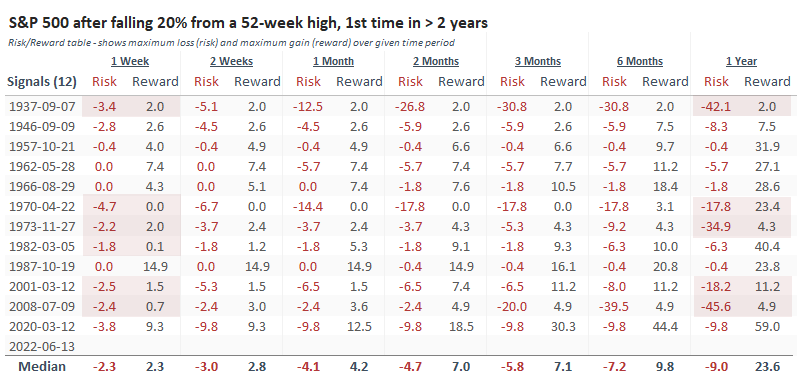
When we look at the Risk/Reward Table, there was a pretty clear pattern. When the S&P fell into a bear market, and buyers showed no interest, it led to the worst long-term returns.
The red highlights in the table show the dates with the worst risk/reward skew over the next week and the next year. There is a lot of overlap between the two, with the only exception being 1982.
A day with overwhelming selling force
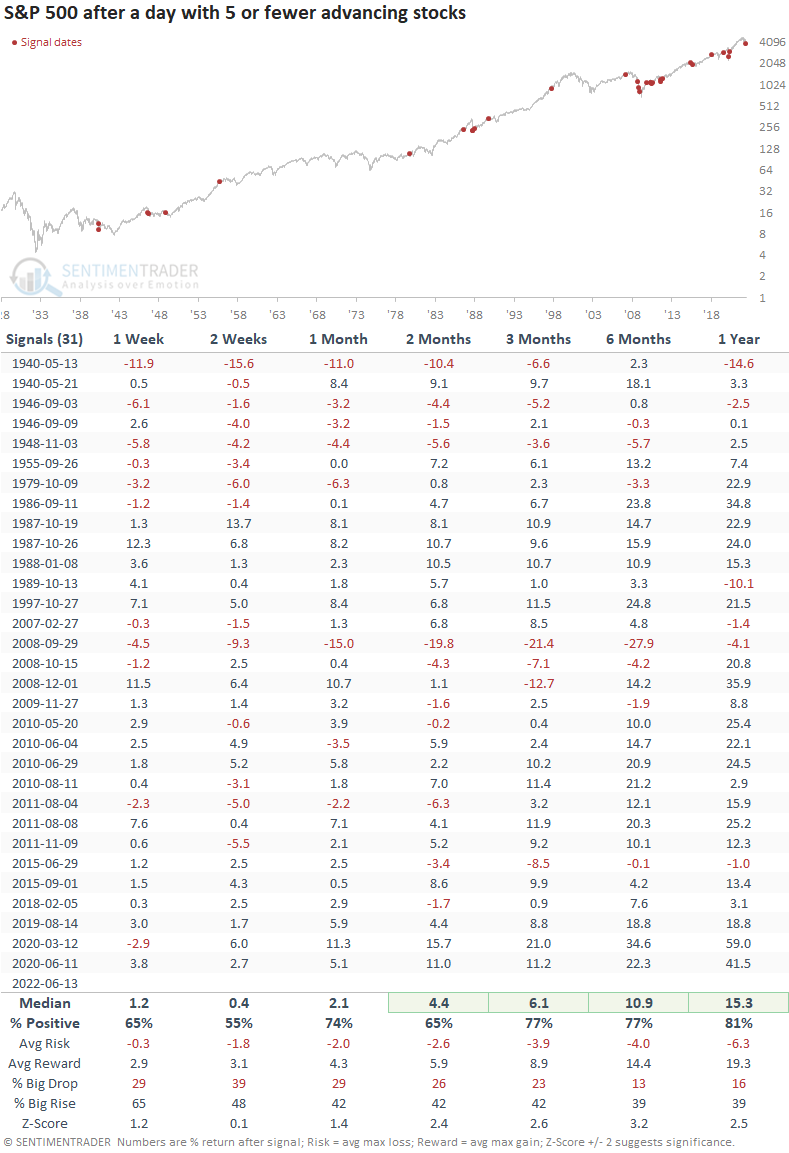
For the 32nd time since 1928, fewer than five stocks in the S&P 500 managed to advance.
Other times when investors sold pretty much everything in the index simultaneously, the S&P tended to rebound, with well above average returns. There were a couple of times, May 1940 and September 2008, when it preceded a further waterfall decline. The others did not.
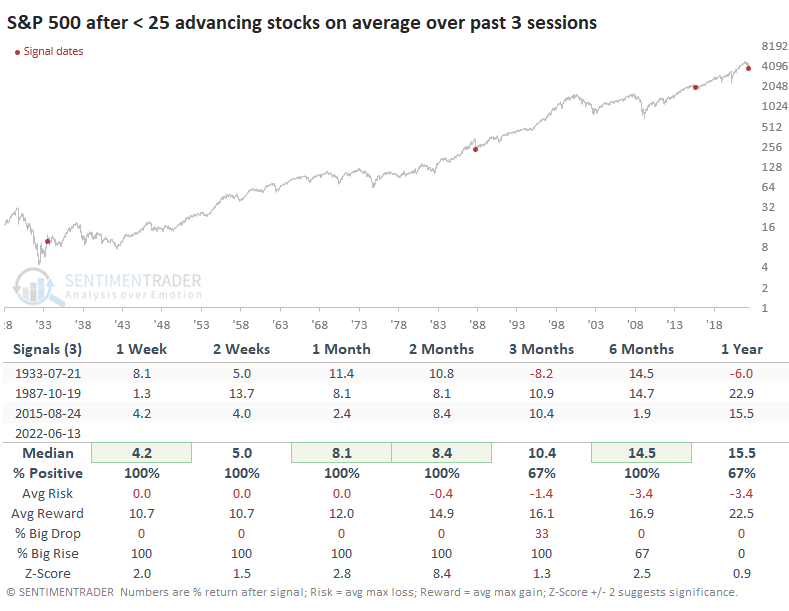
But even more notably, advancers have been suppressed for the past few sessions. This is only the 4th time in history when an average of fewer than 25 stocks rose over three days.
The selling pressure wasn't just in the large-cap stocks in the S&P; it was widespread and vicious.
More than 98% of volume flowed into declining stocks. The Backtest Engine shows that only 16 other days since 1962 saw such overwhelming selling pressure, after which the S&P 500 rose 14 times.
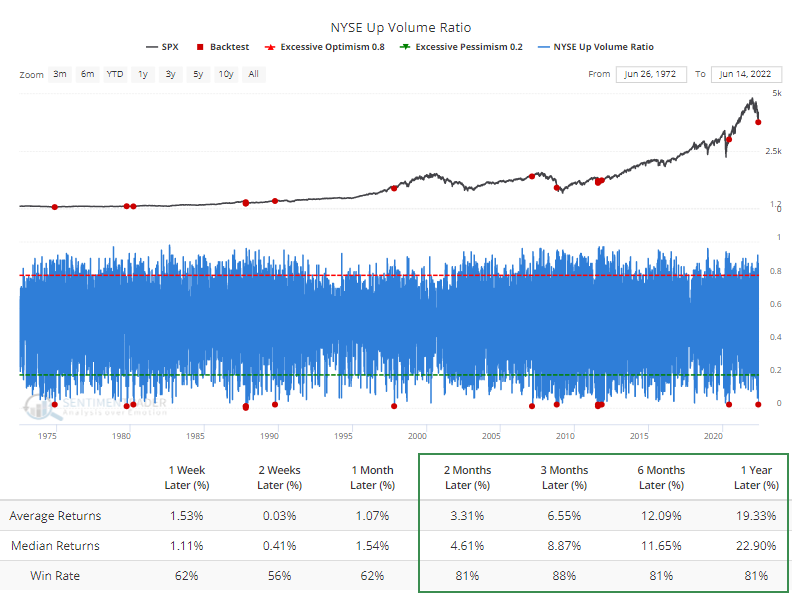
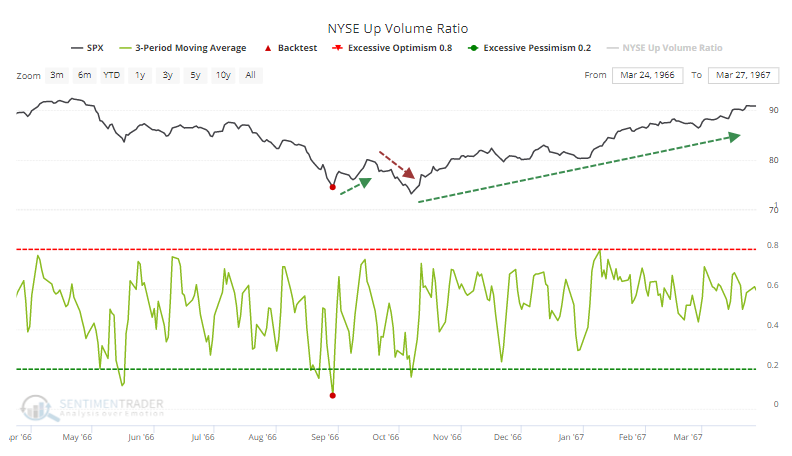
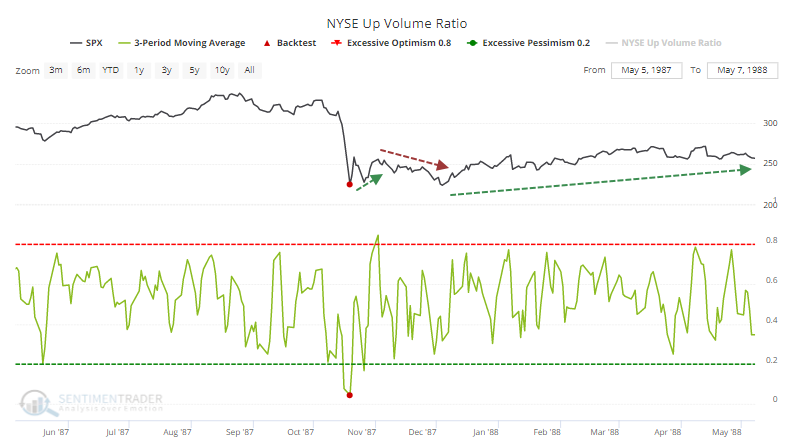
Even more remarkably, the 3-day average of Up Volume dropped below 7% for only the 2nd time in 60 years per the Backtest Engine.
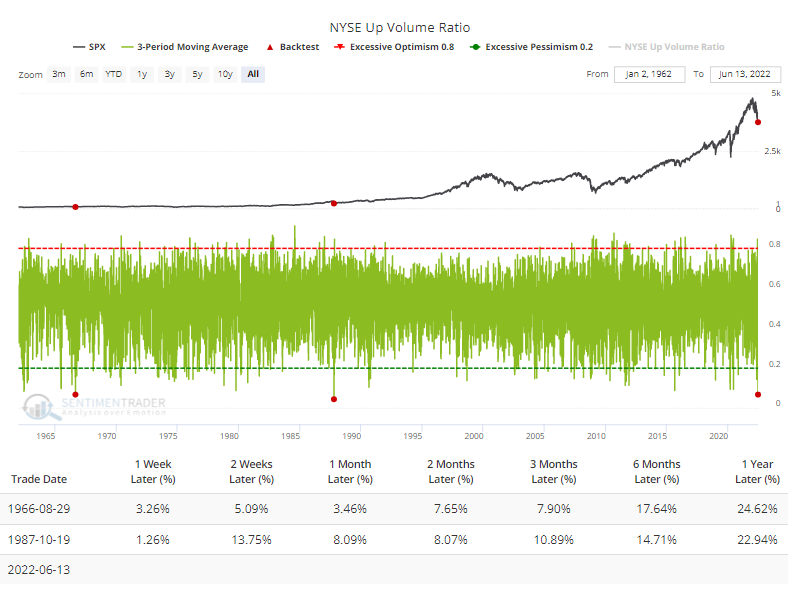
For what it's worth, the S&P rebounded immediately, tested the low, then put in a sustained bottom.
What the research tells us...
When bullish setups fail, that usually tells you all you need to know about the market - it's weak, and sentiment is risk-off. That's been the case for months and is showing no signs of changing. For investors looking to add exposure, there is always a trade-off between risk and reward and being early versus late. In conditions like this, it is typically better to be the latter because there is a non-negligible probability that we are entering the waterfall stage of a decline. Of course, given the price action of the last three sessions, we could have already seen the waterfall. Waiting for stabilization is usually the better course for medium- to long-term investors. For existing holders, evidence is more mixed, but based on the selling over the past few sessions, it would have almost always been a mistake to panic along with all the others.
Indicators at Extremes
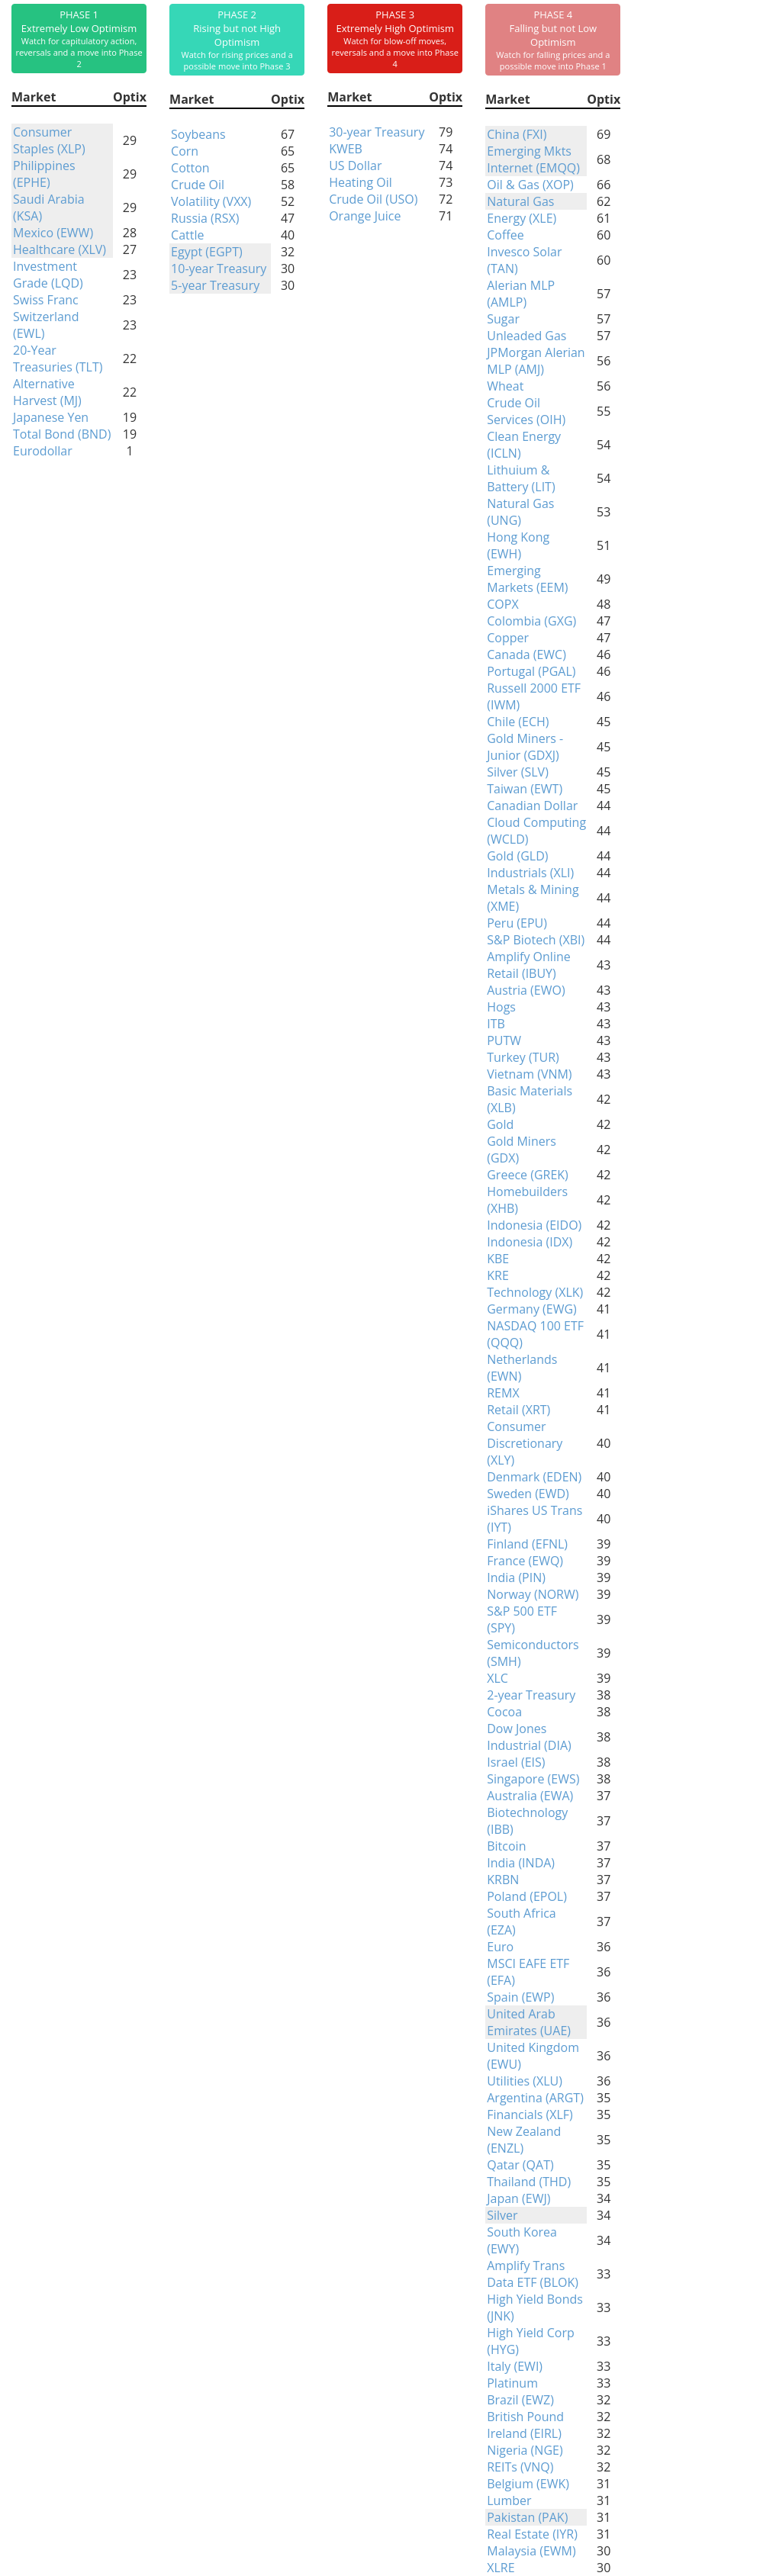
Phase Table
Ranks
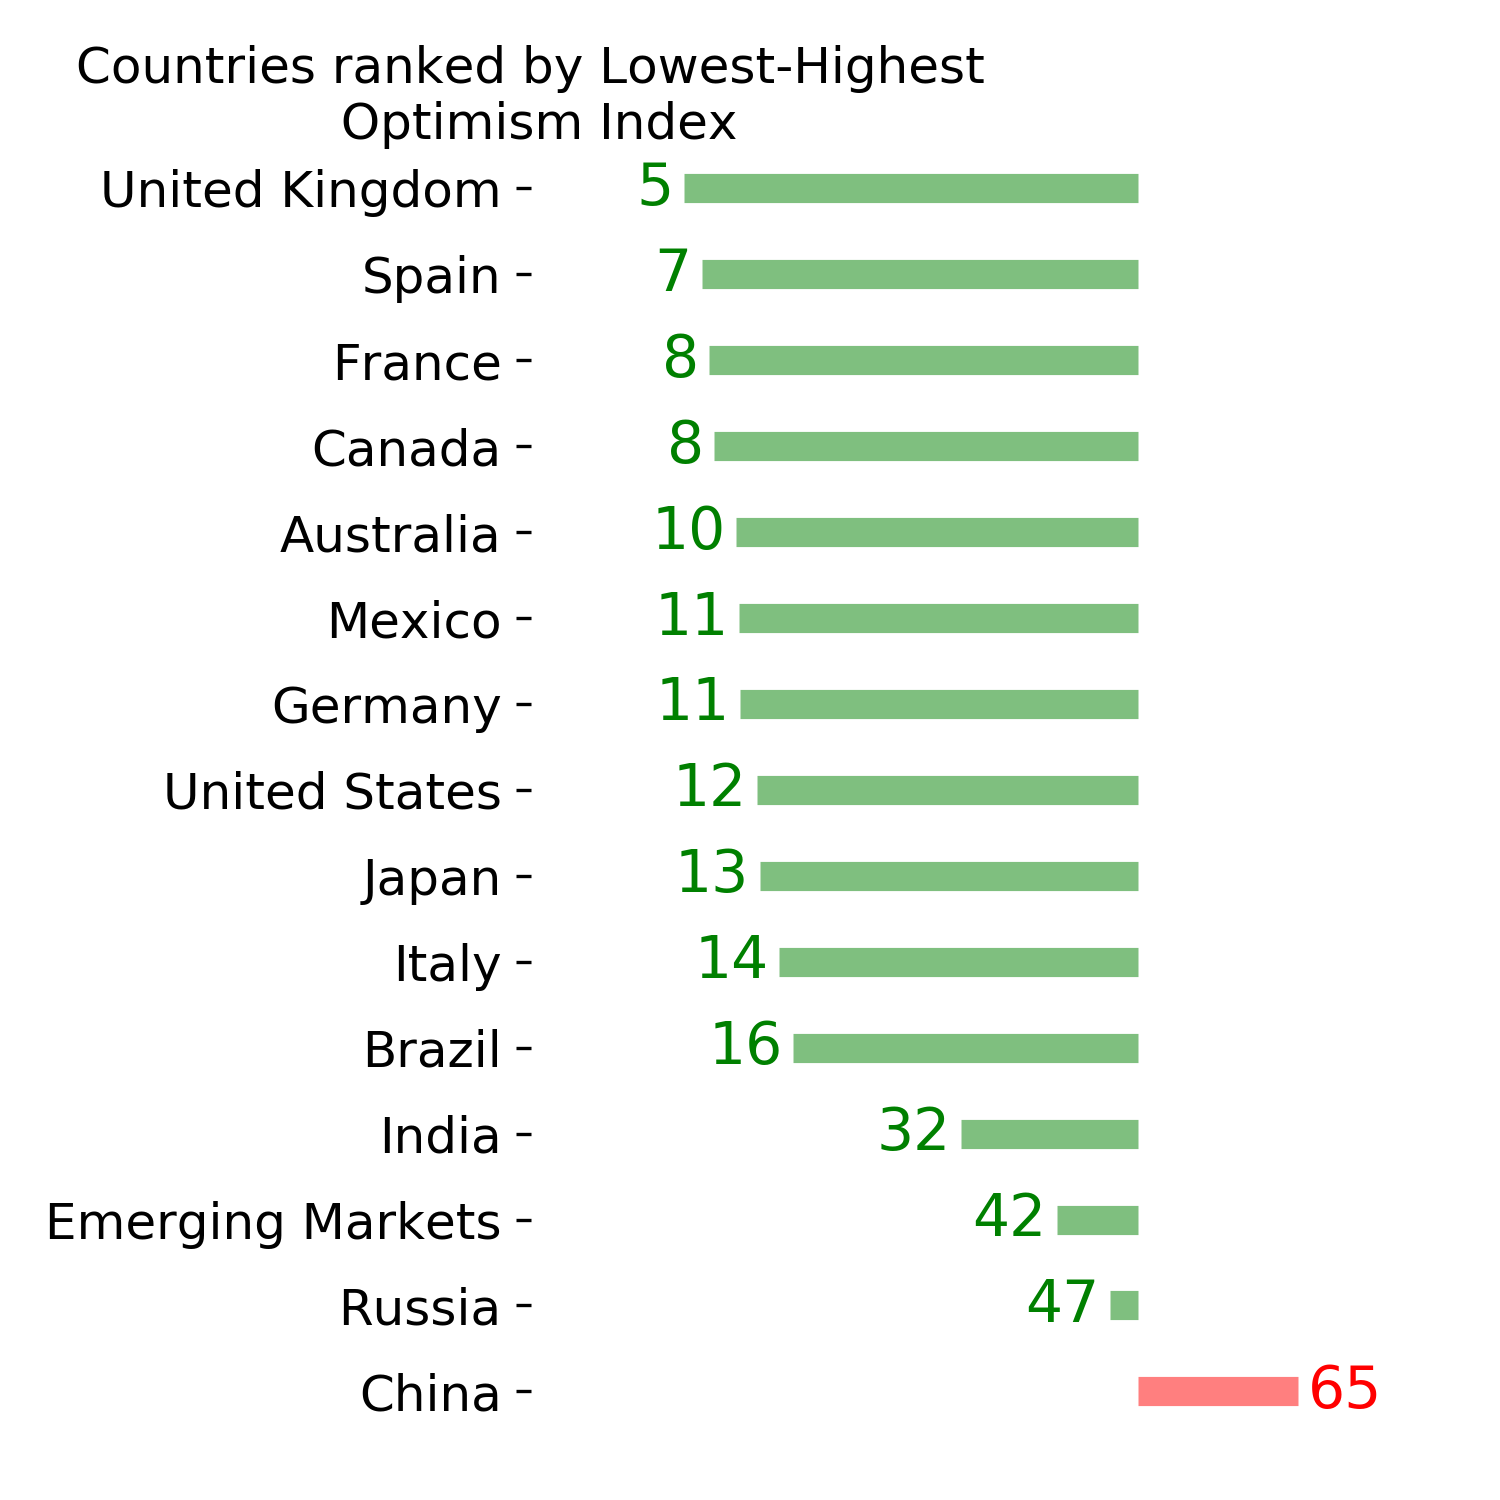
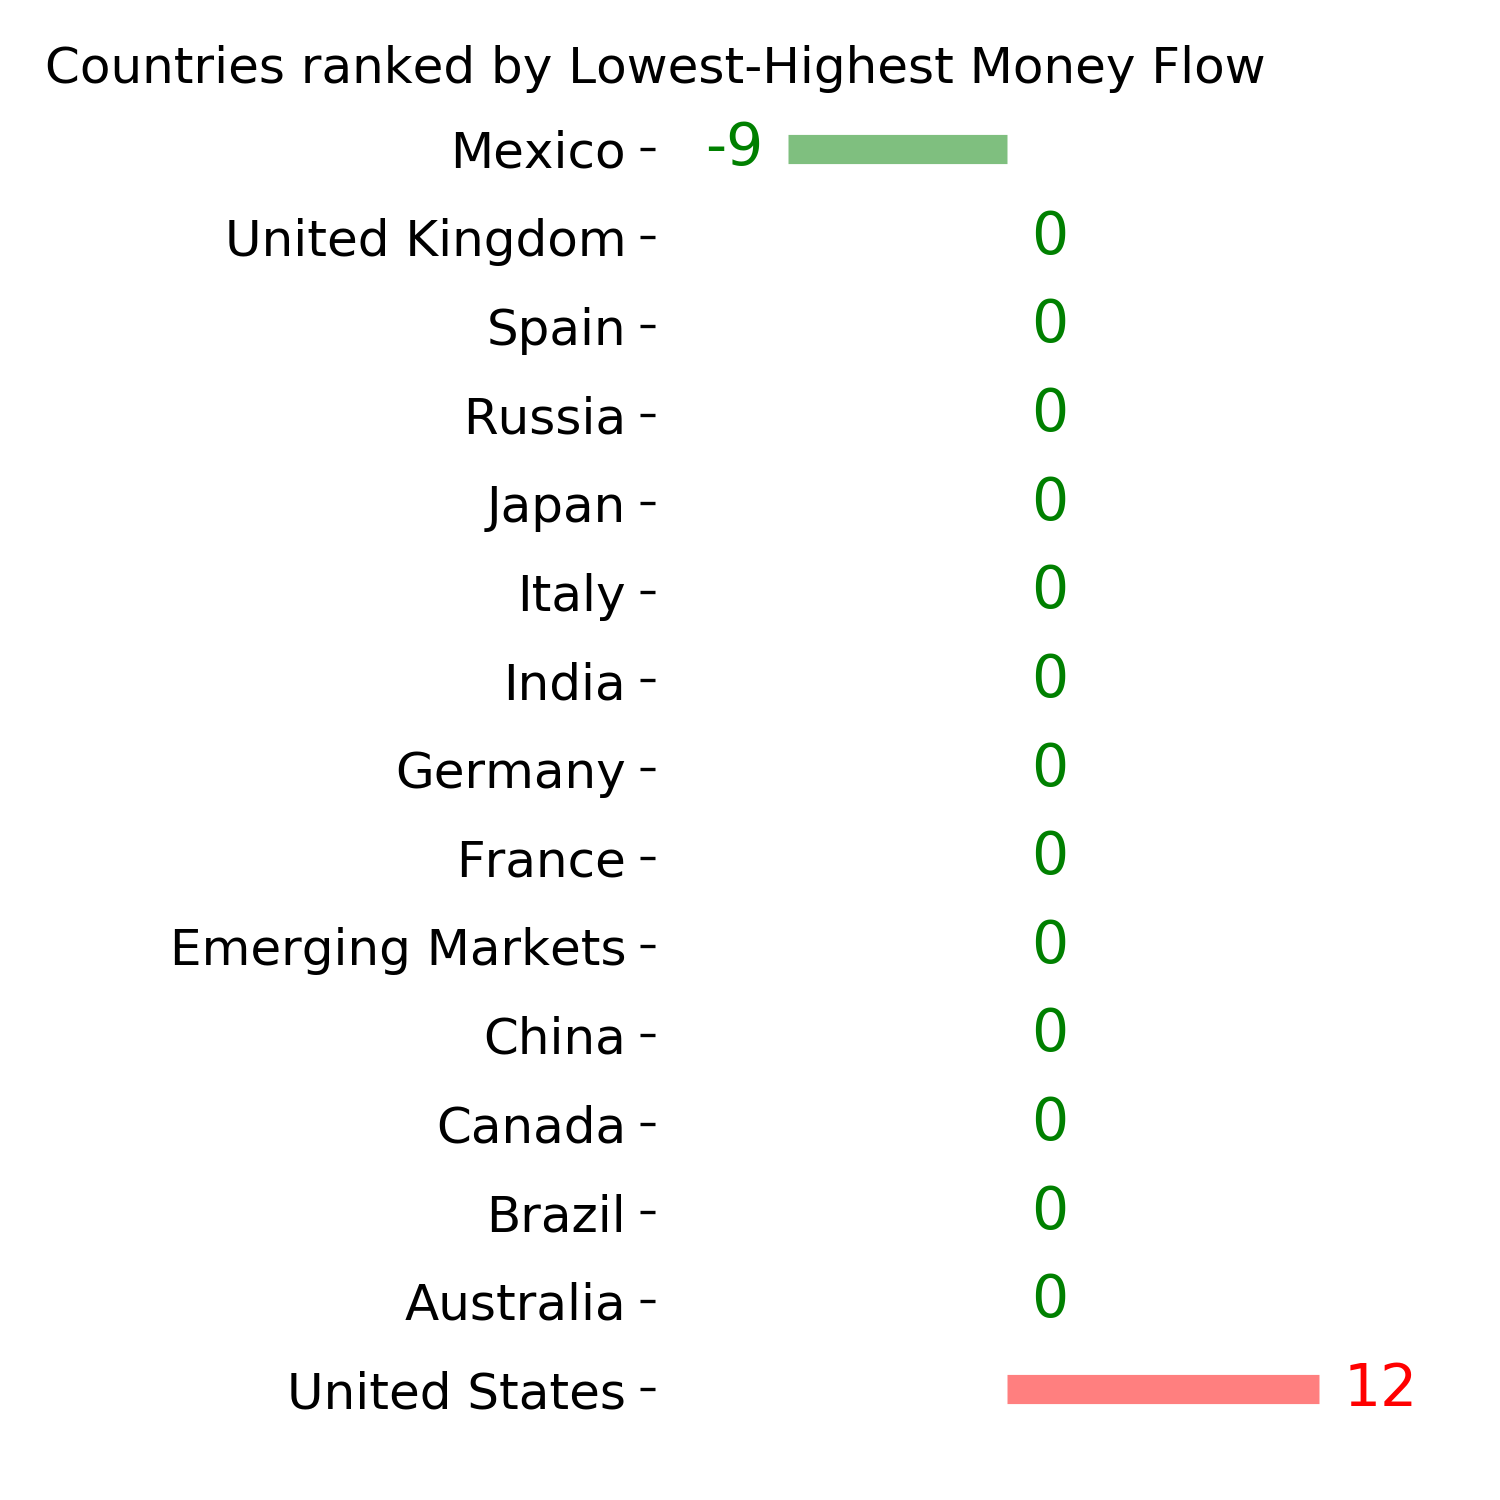
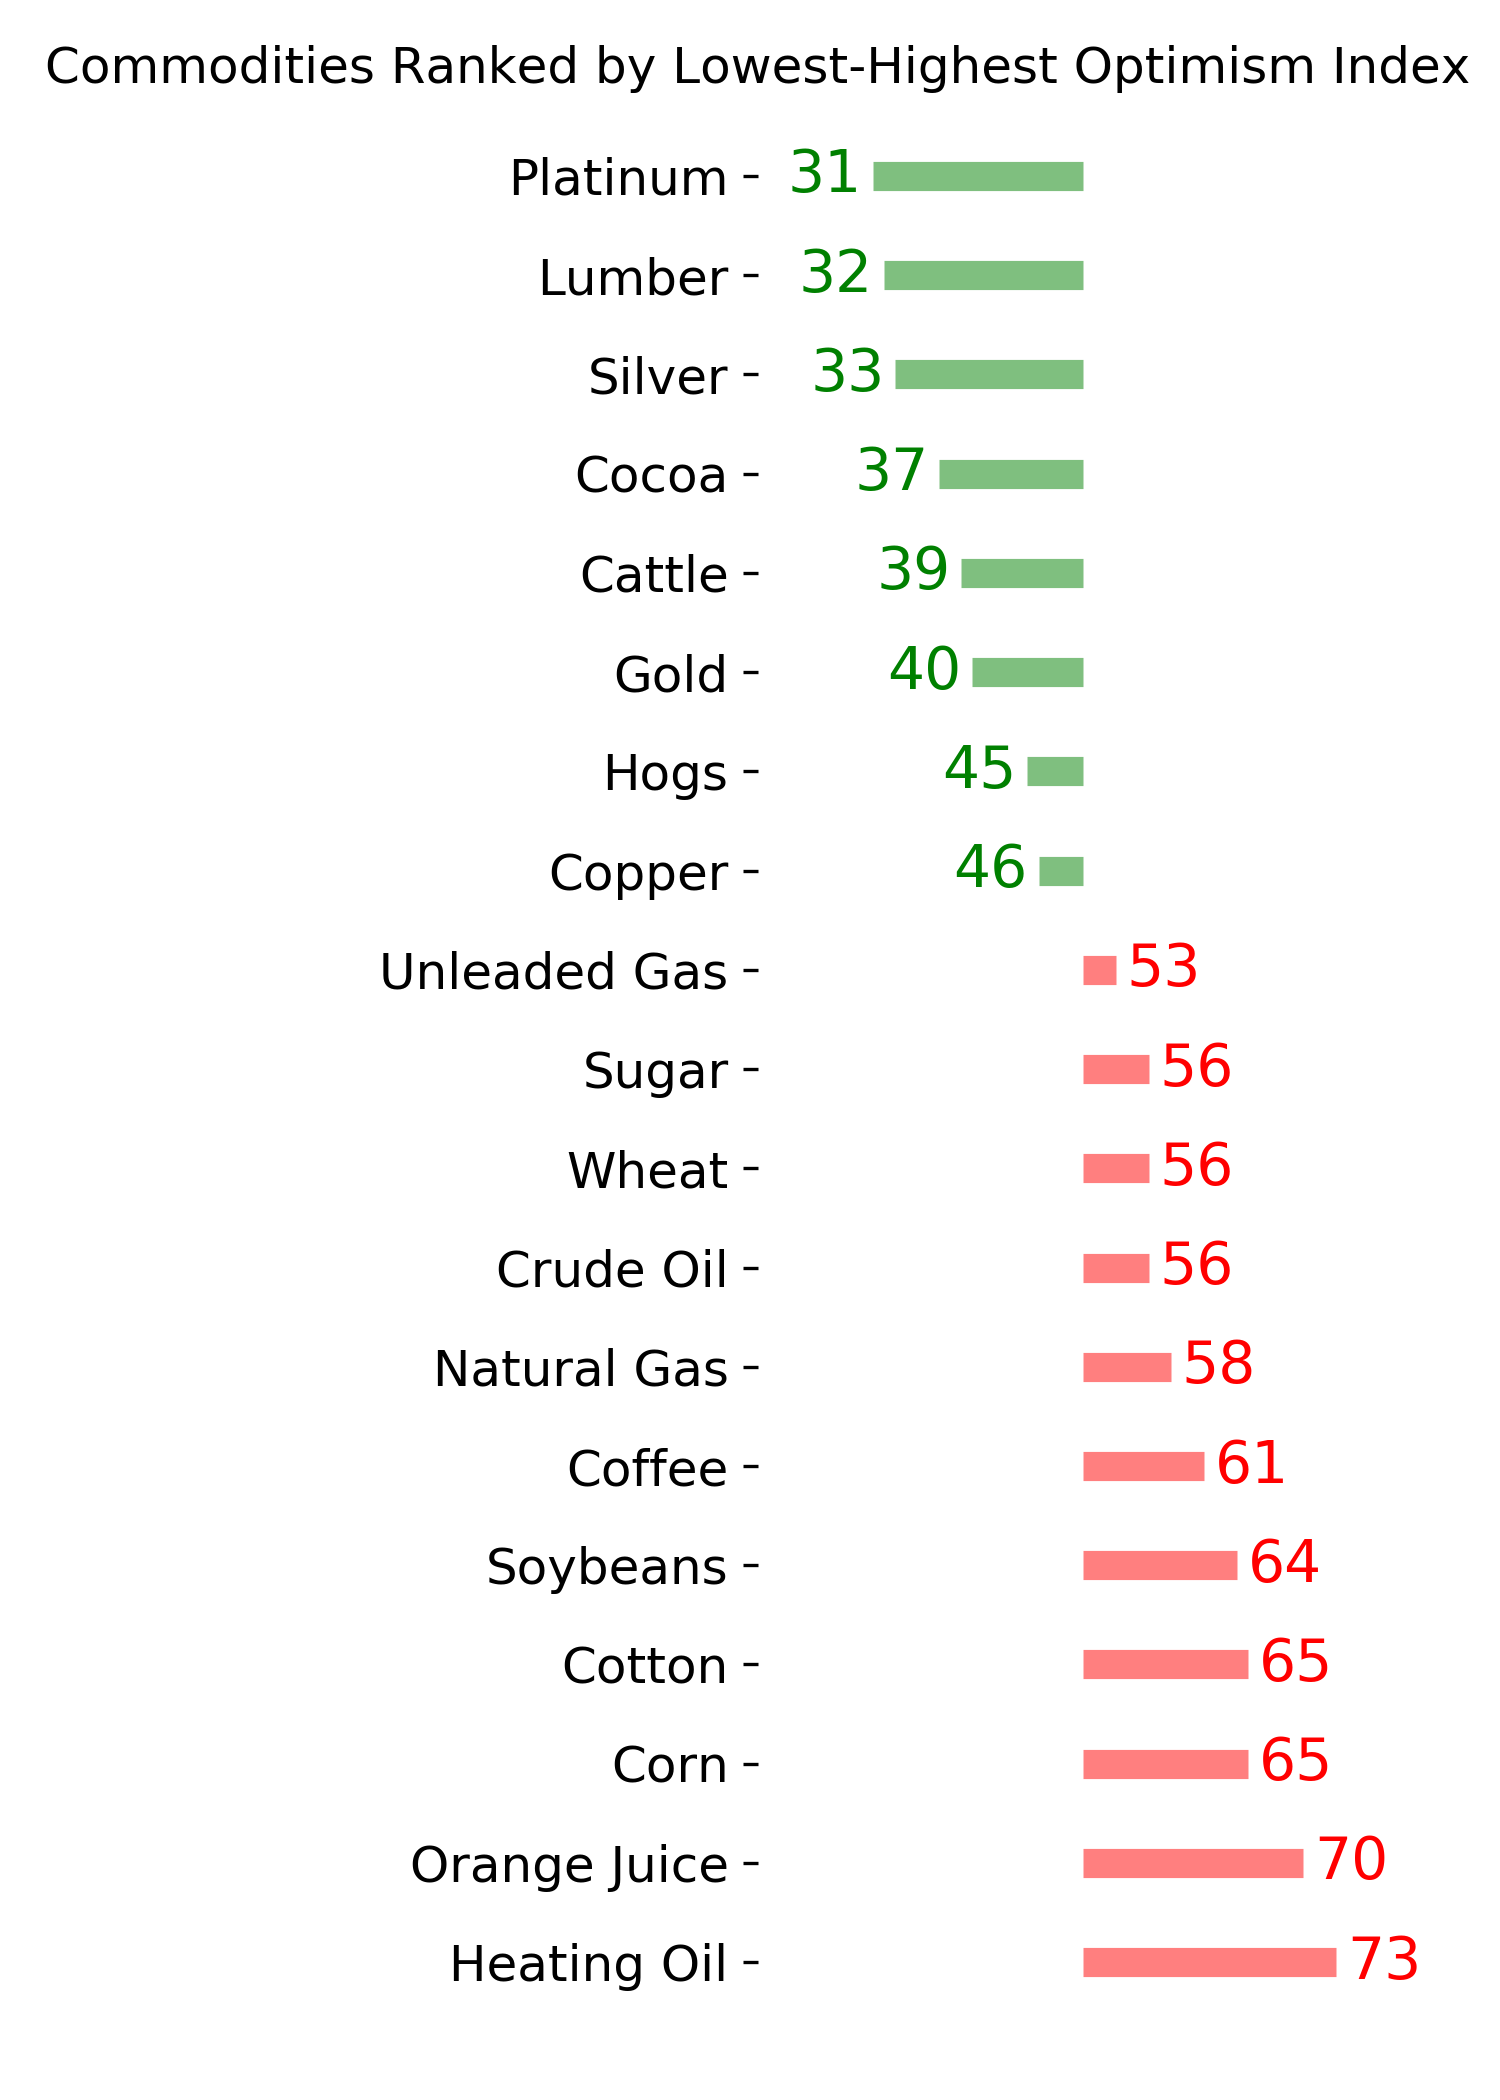
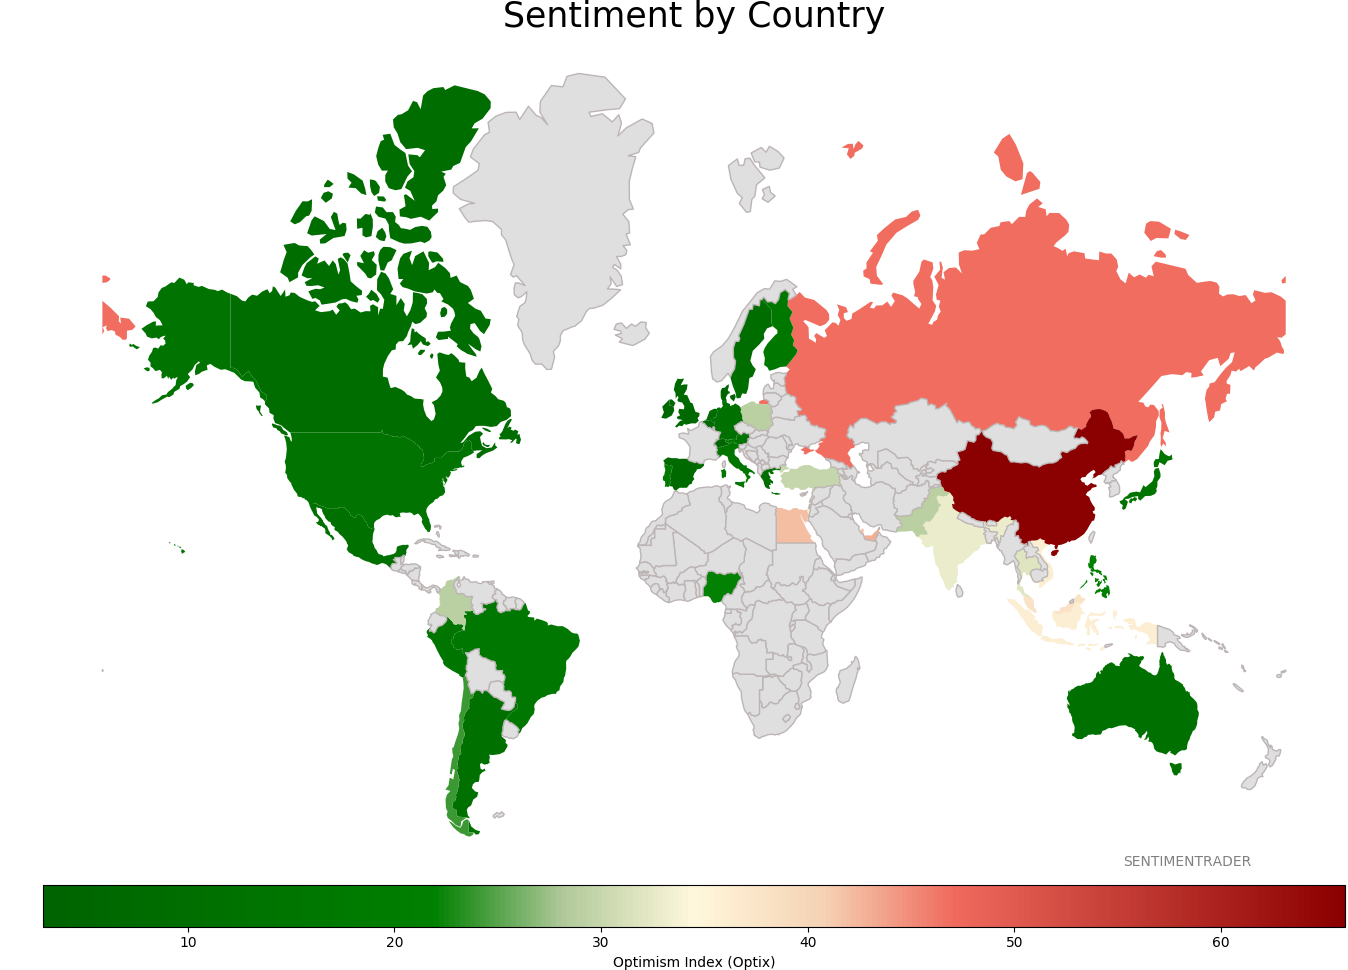
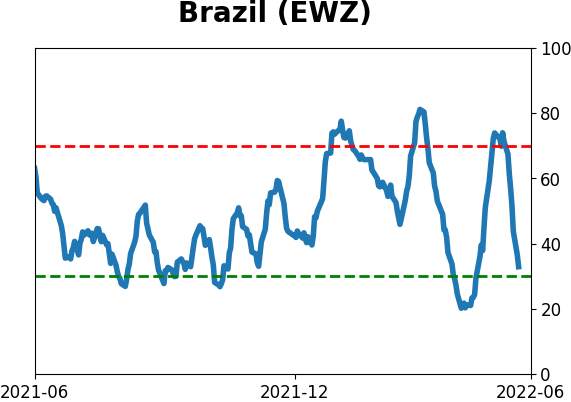
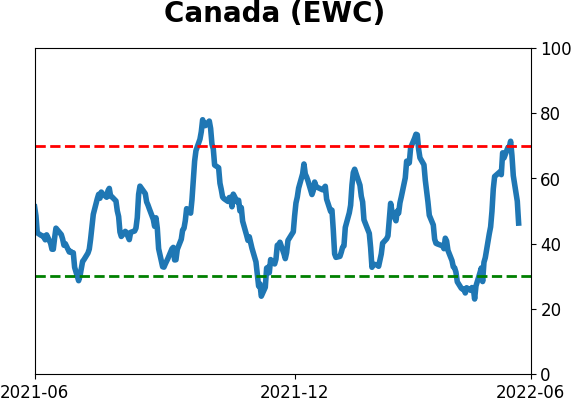
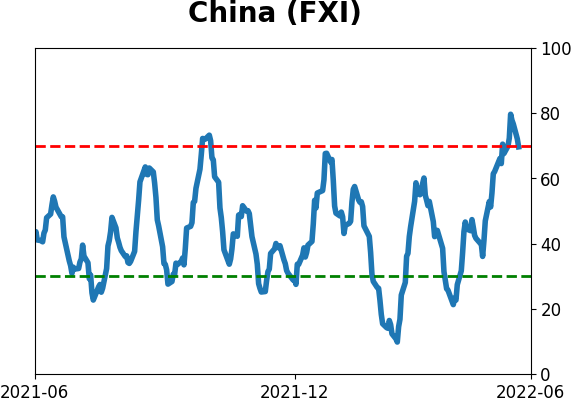
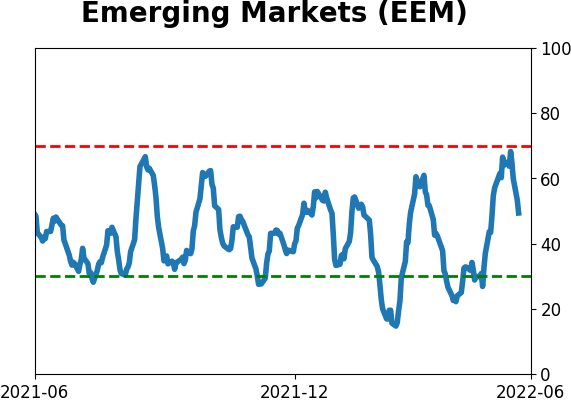
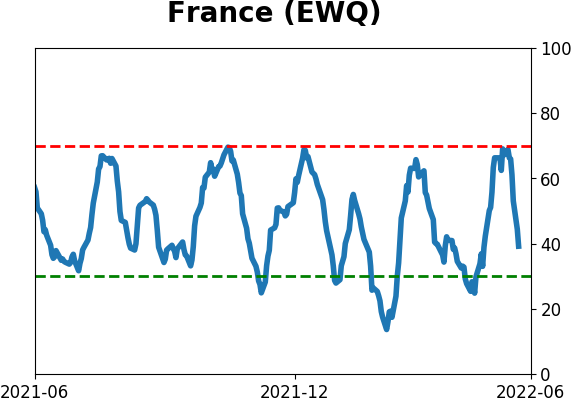
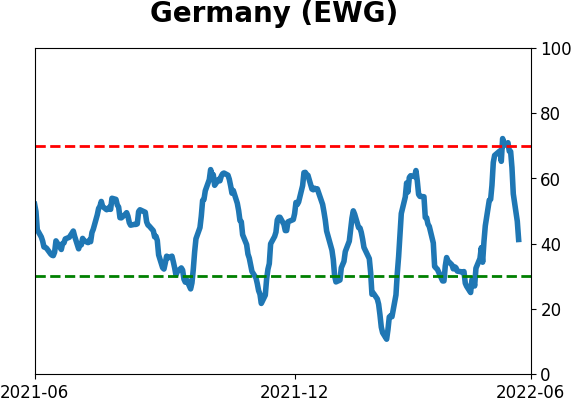
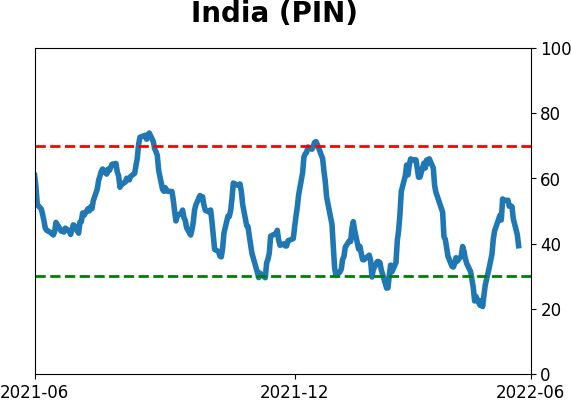
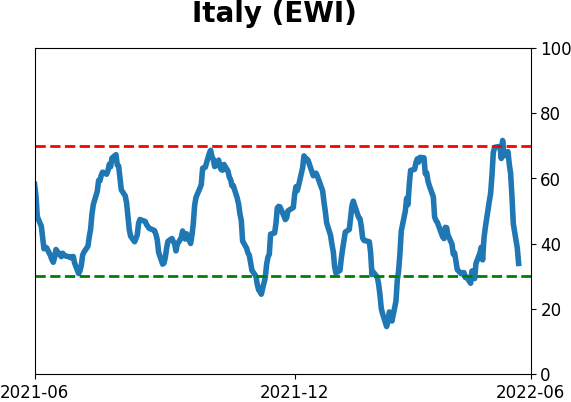
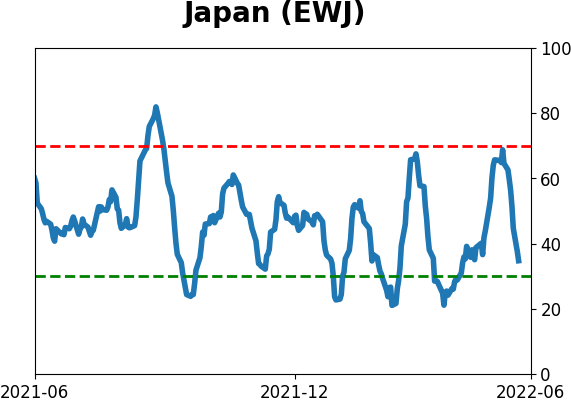
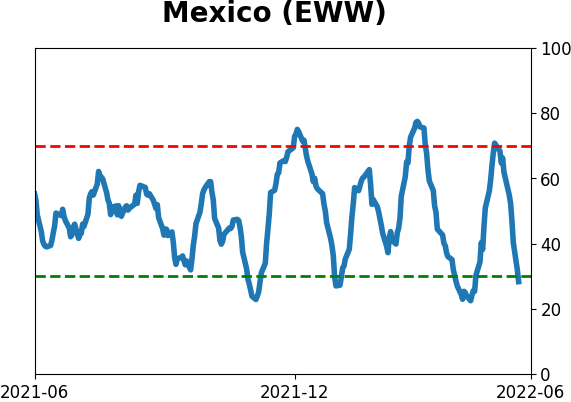
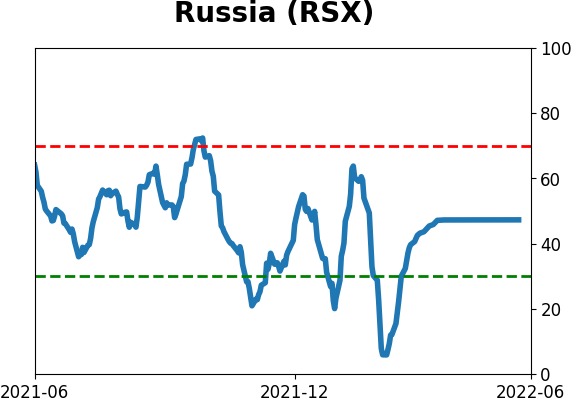
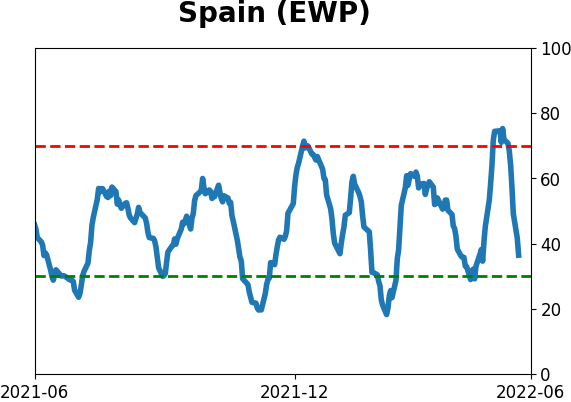
Sentiment Around The World
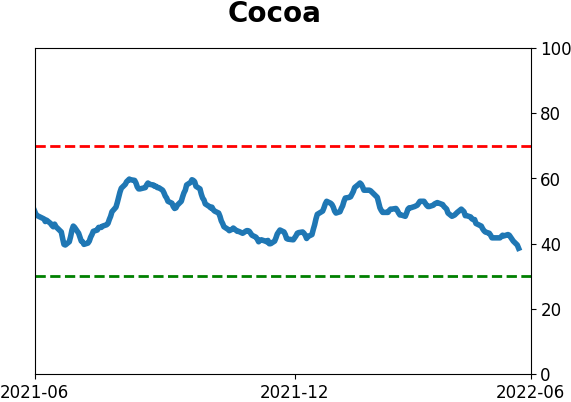
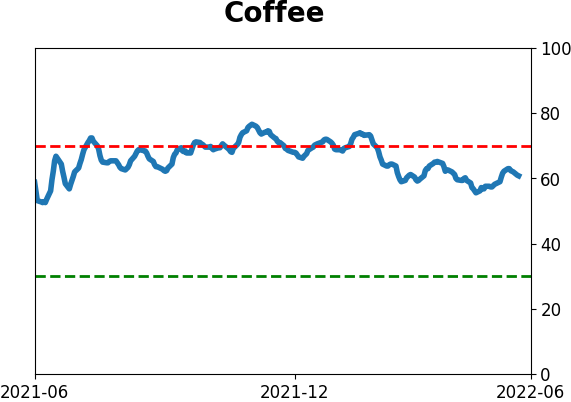
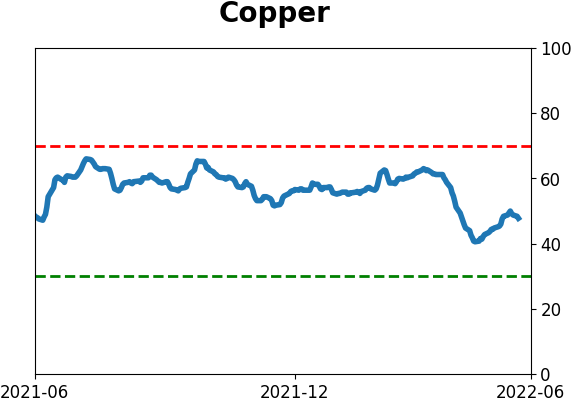
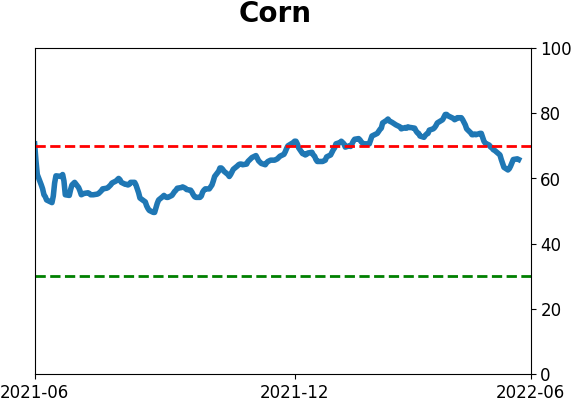
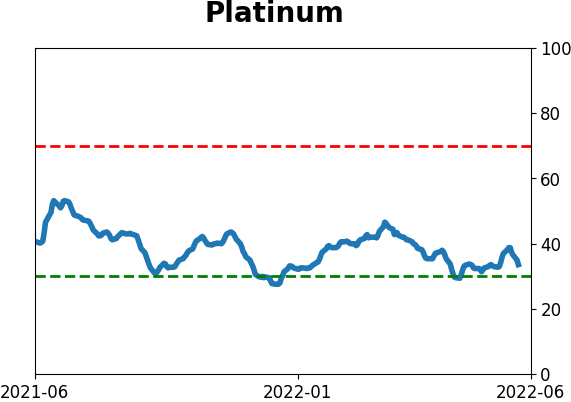
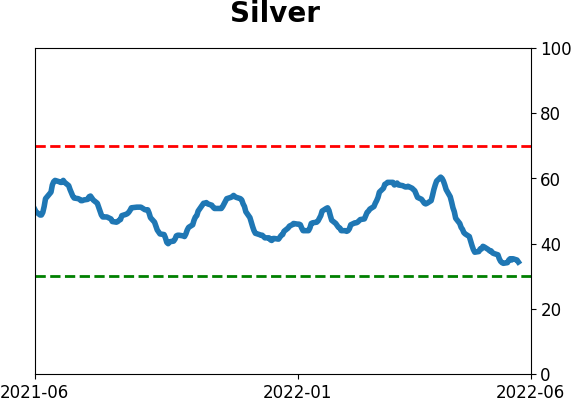
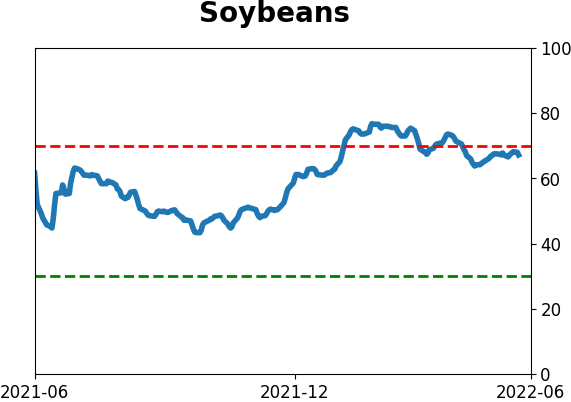
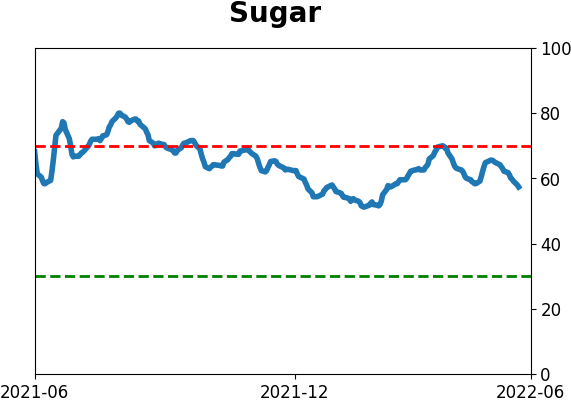
Optimism Index Thumbnails
|
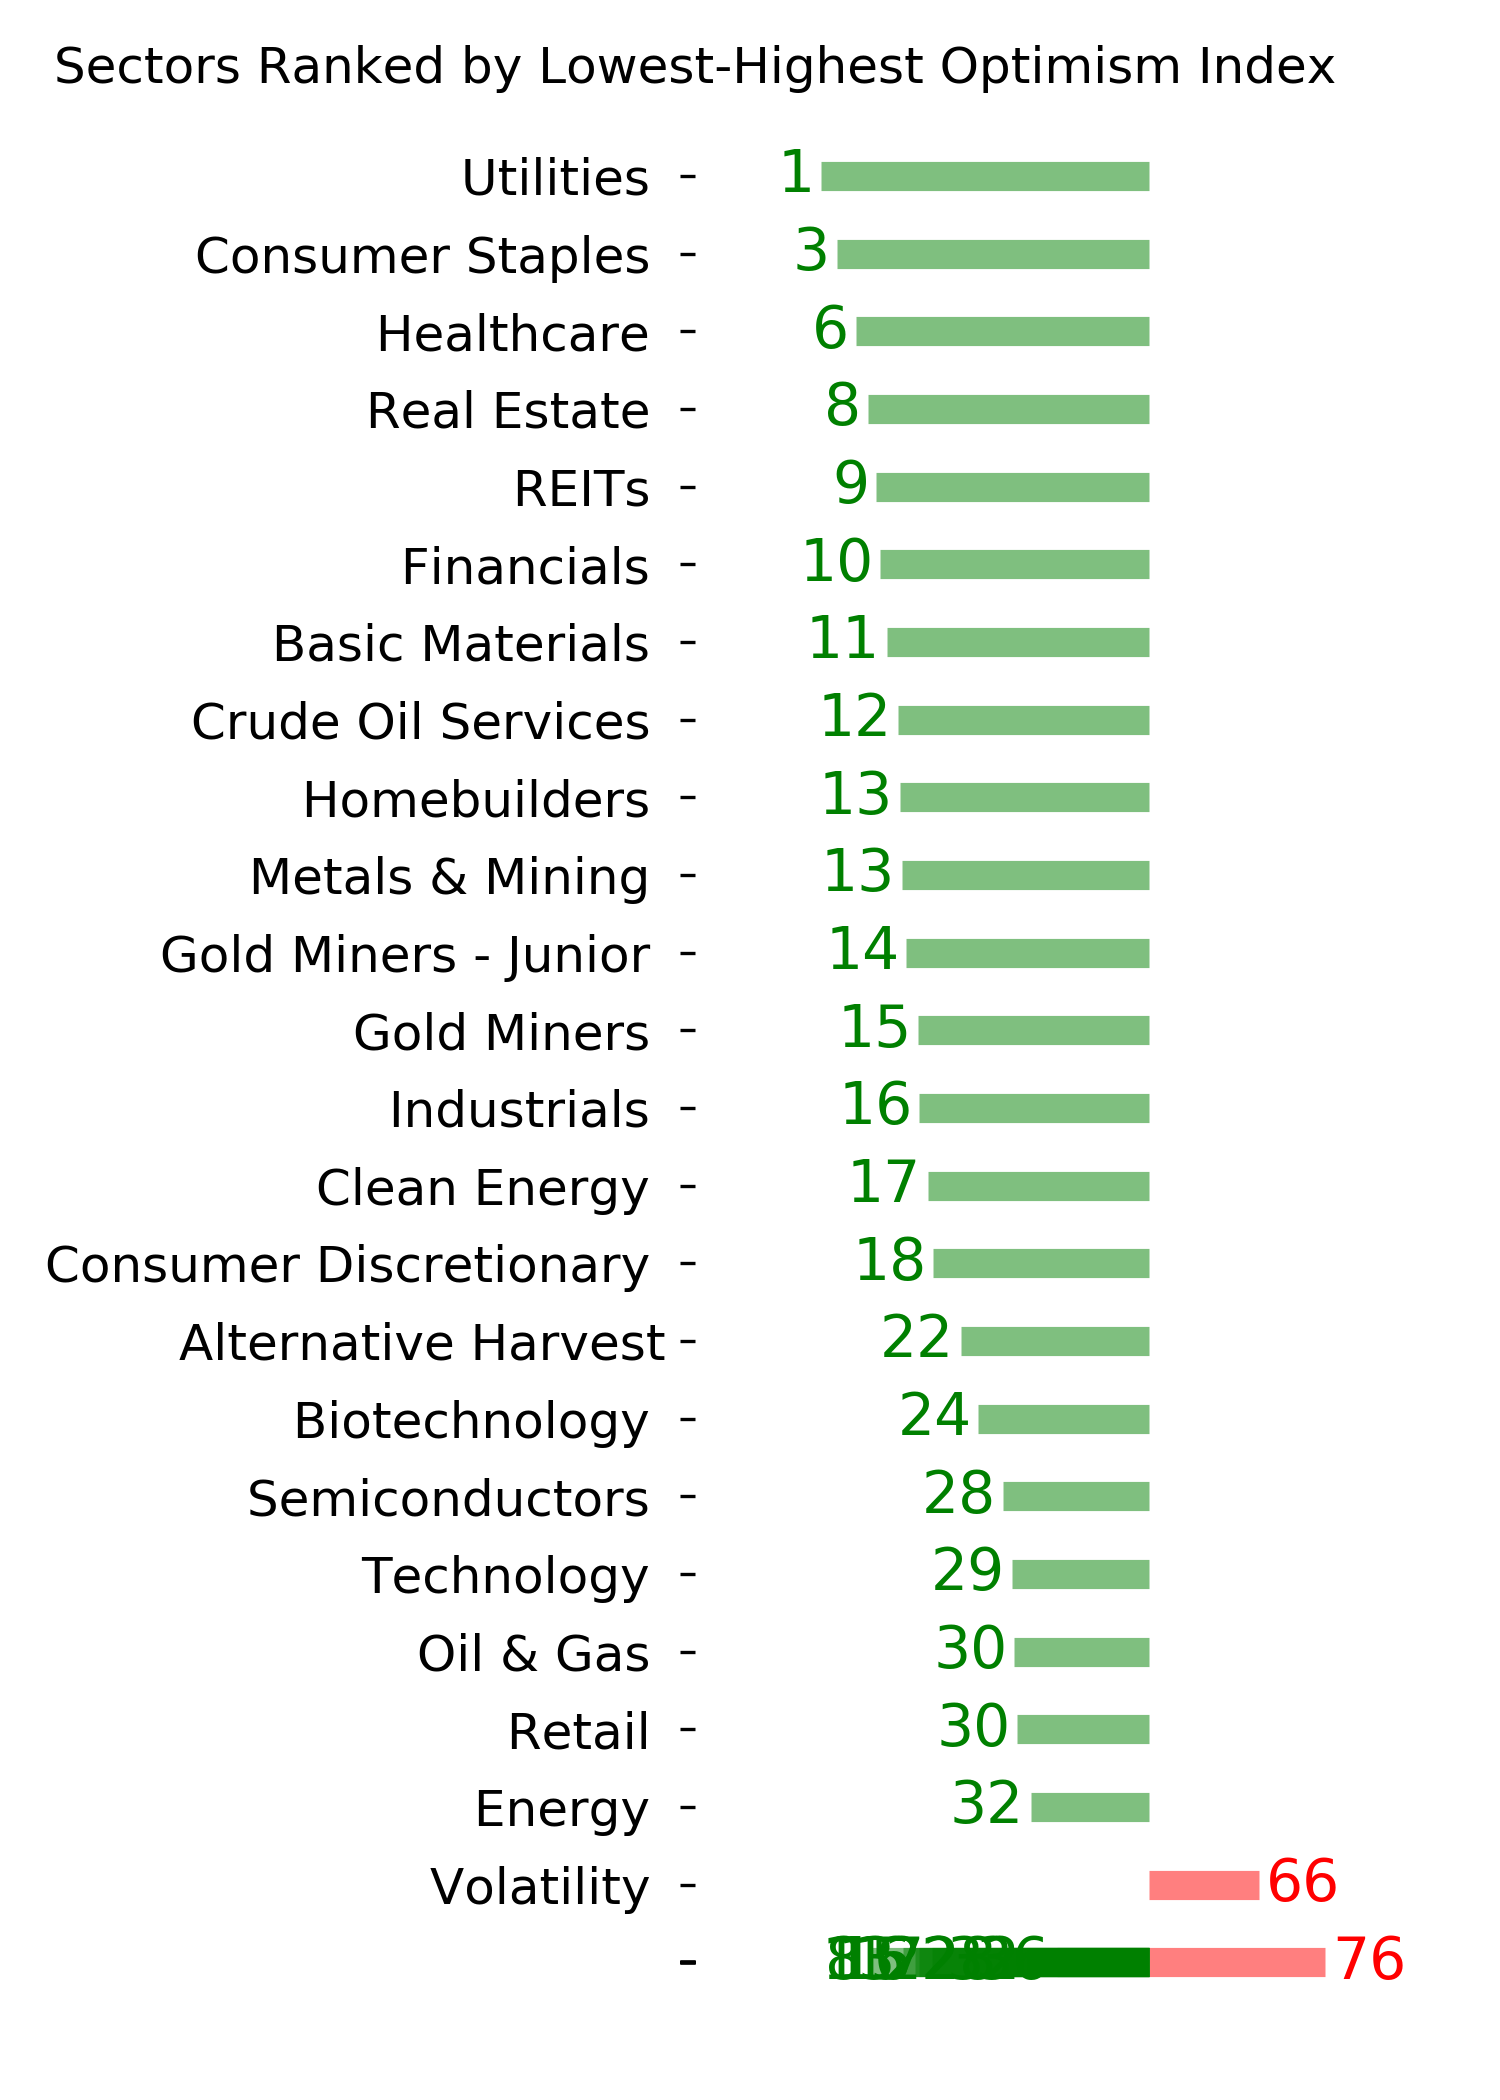
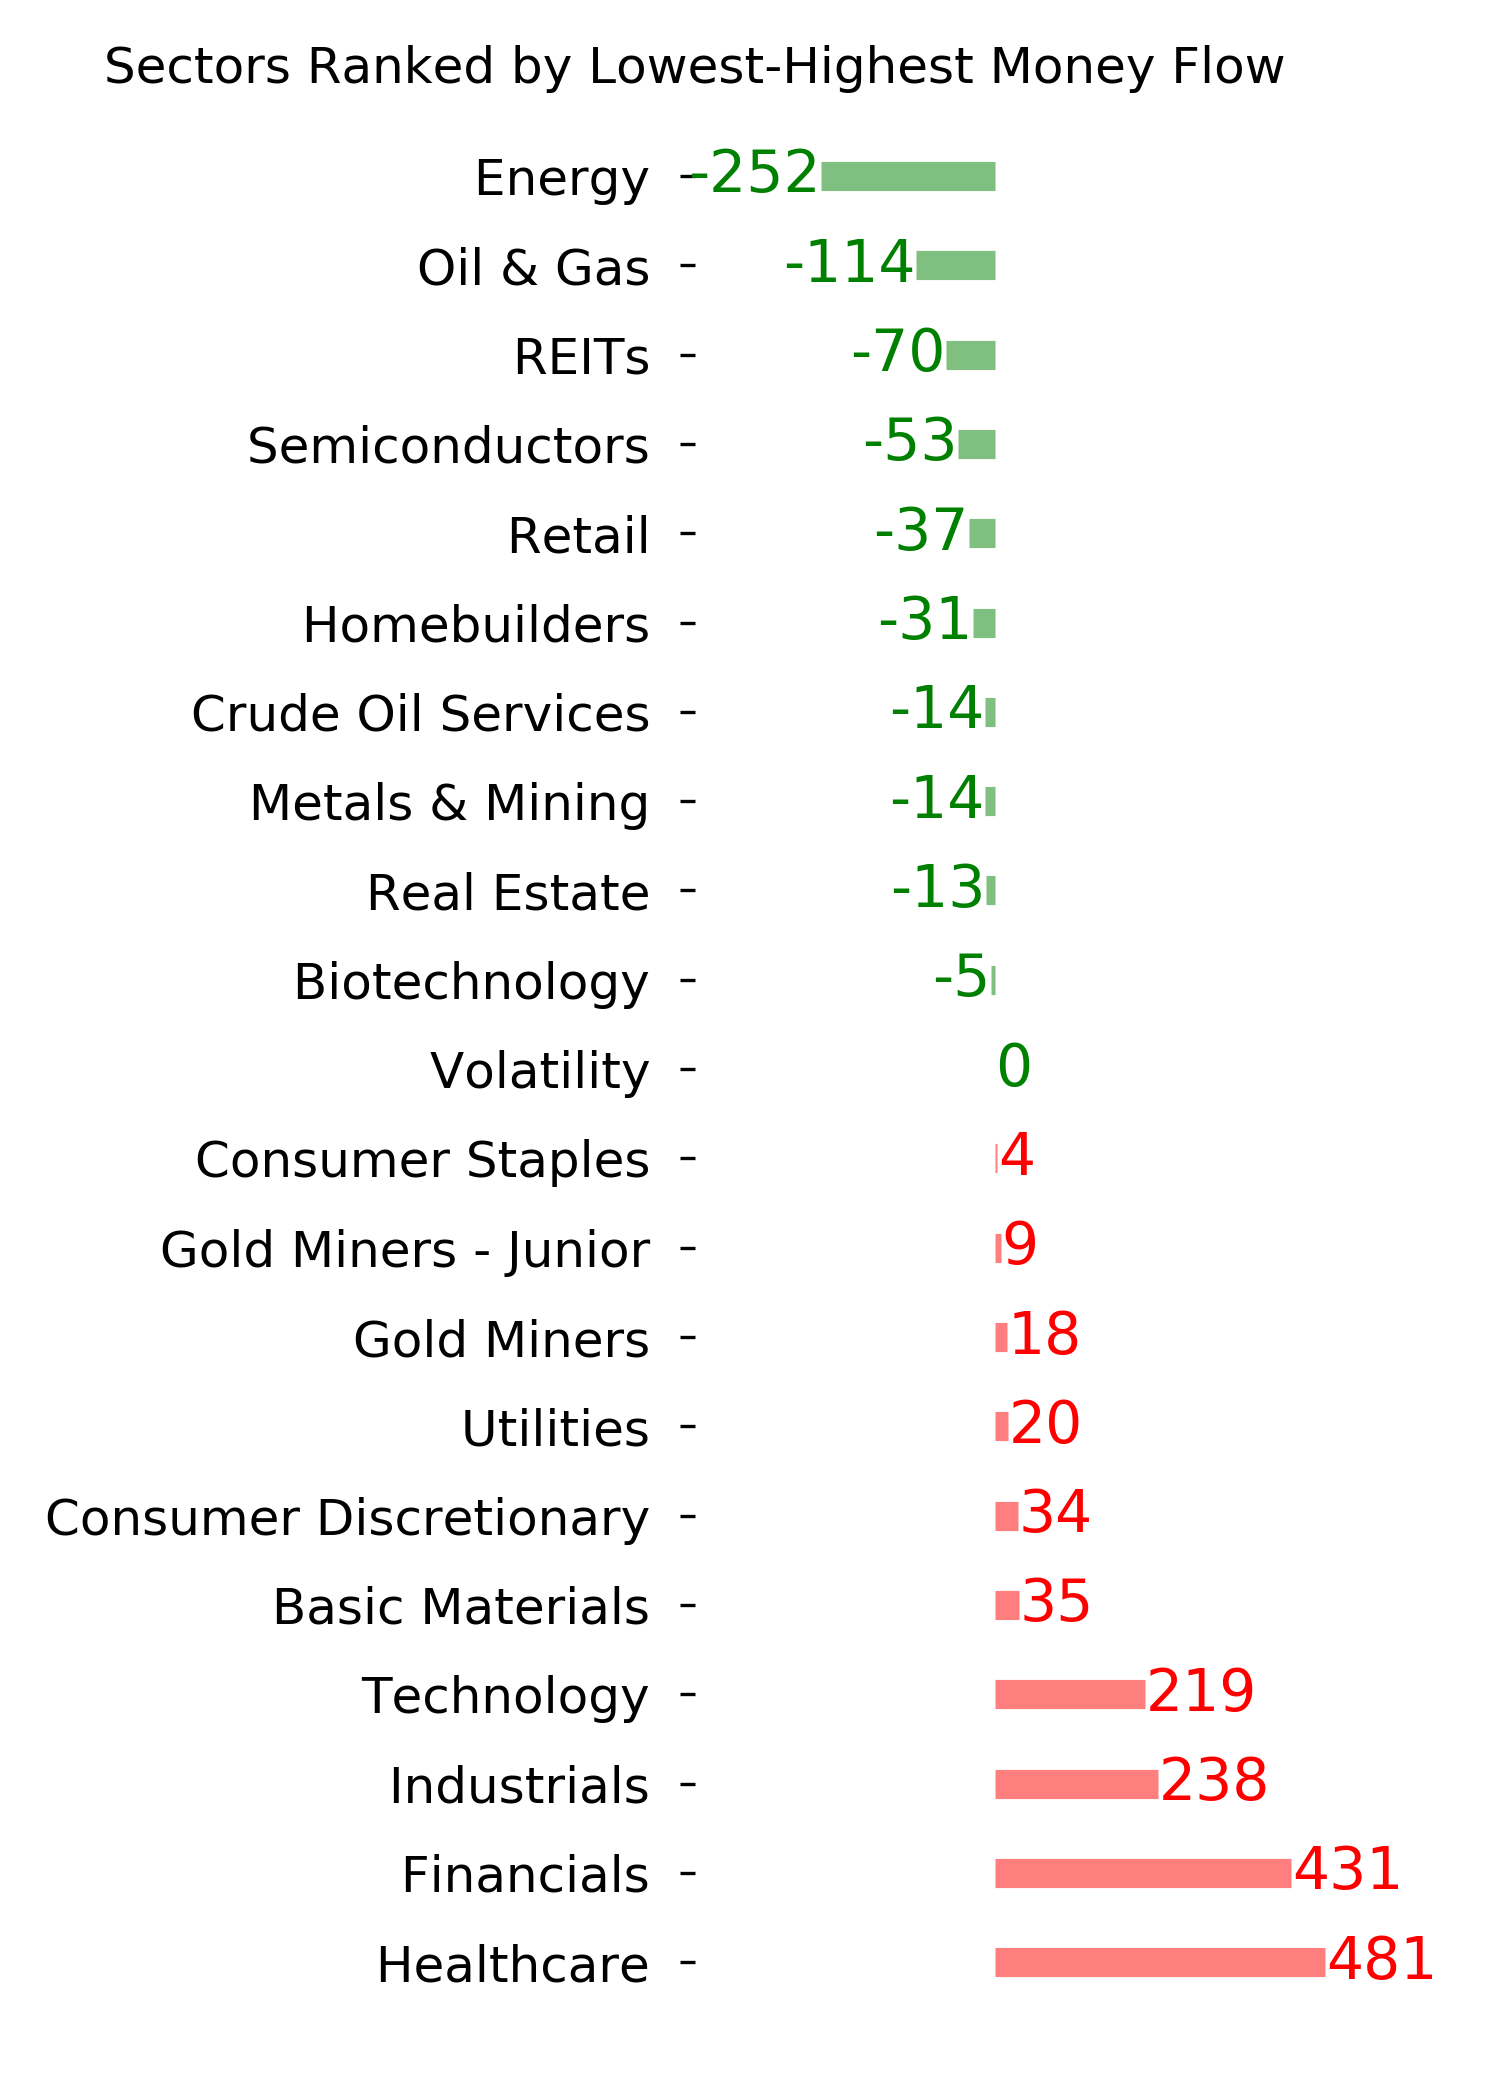
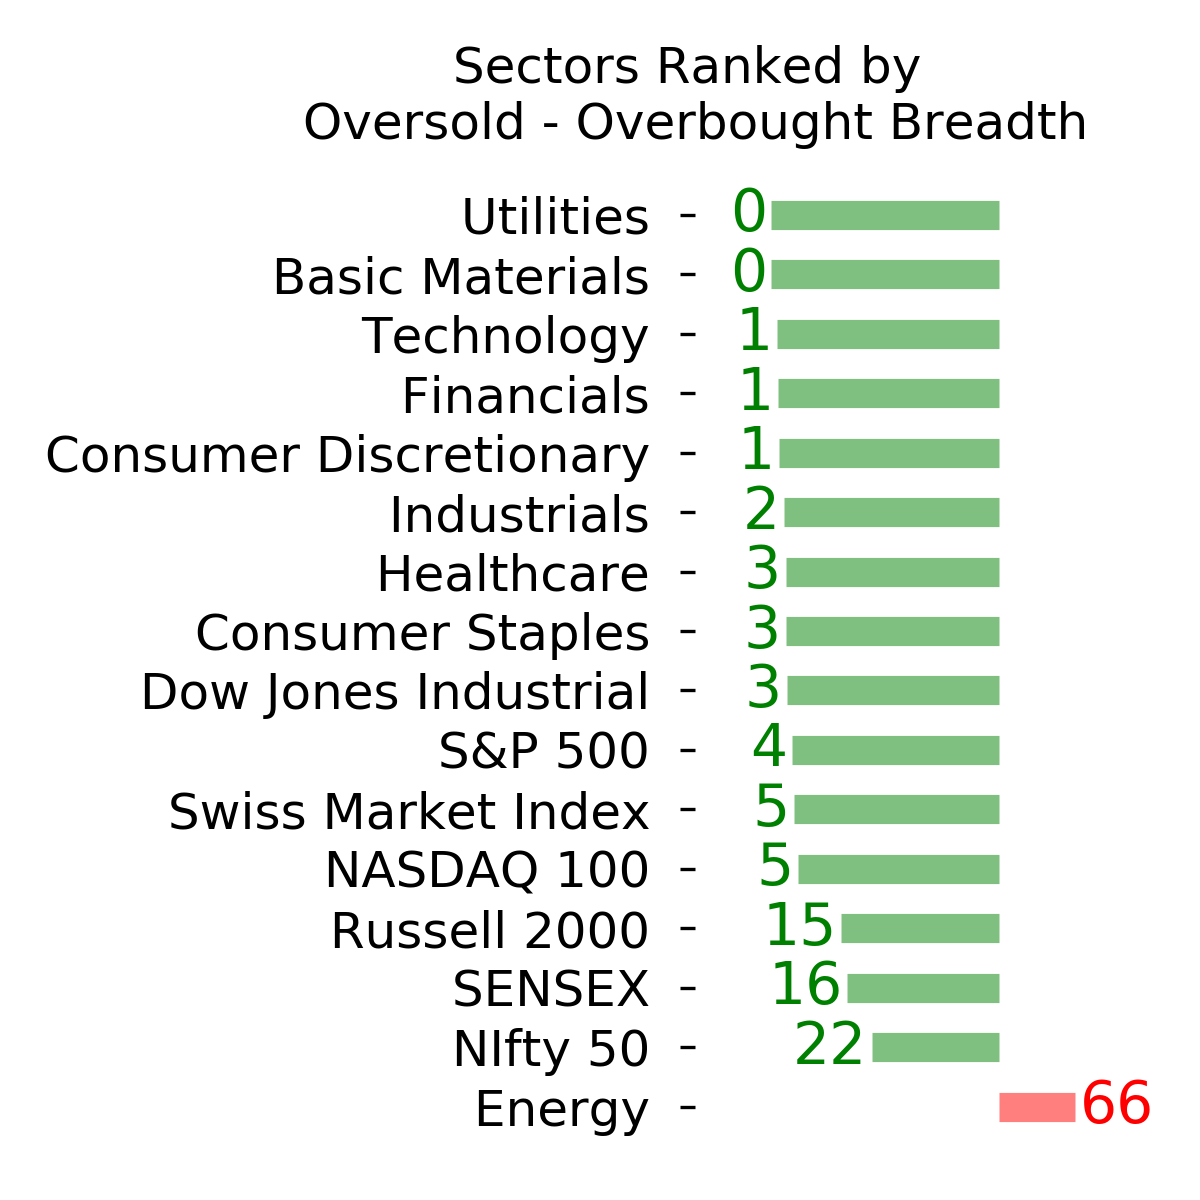
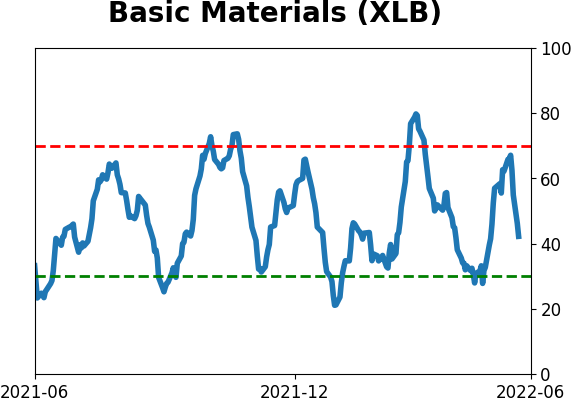
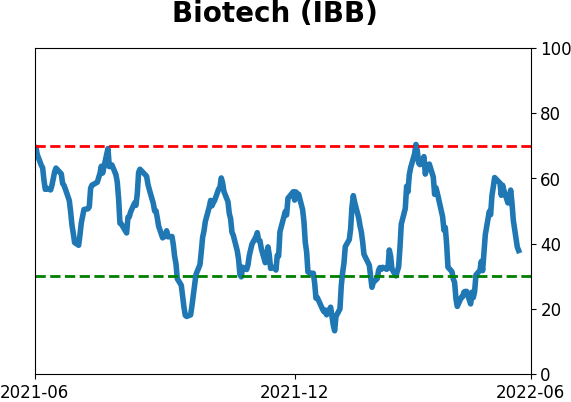
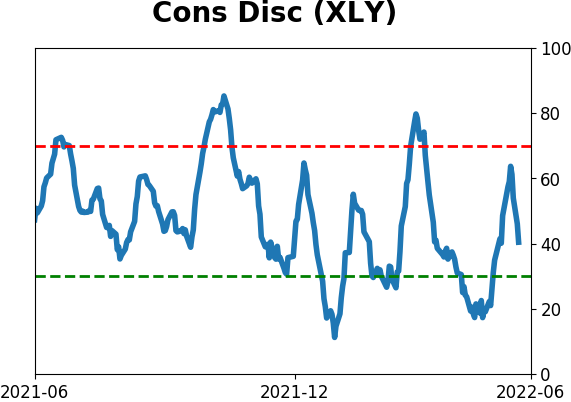
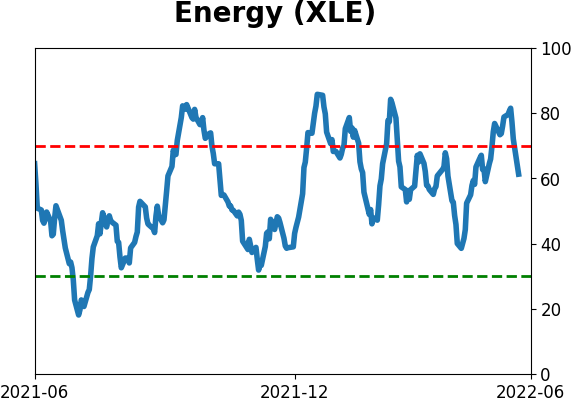
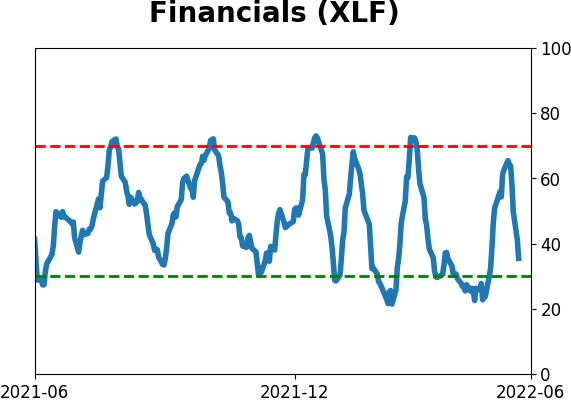
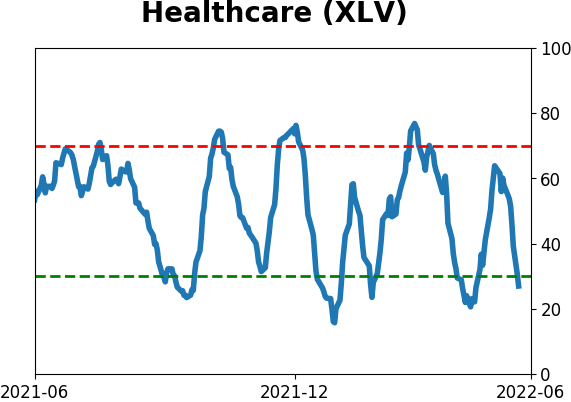
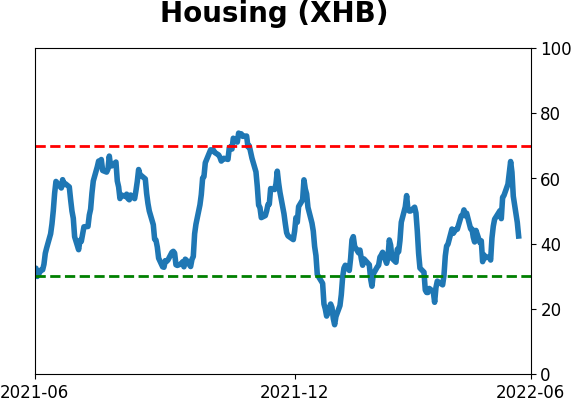
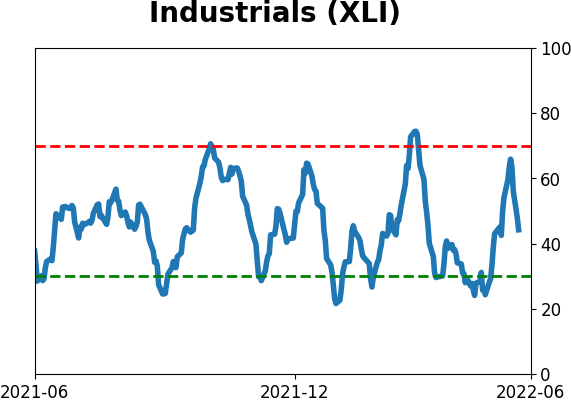
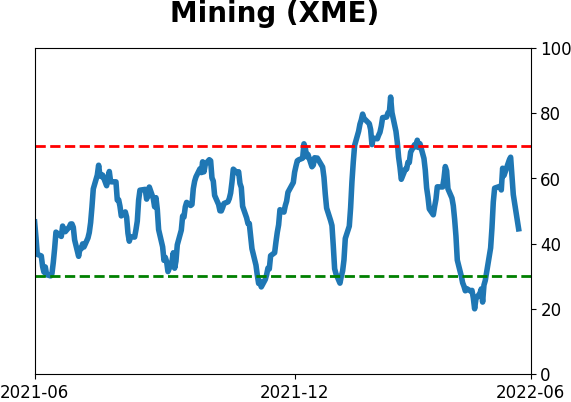
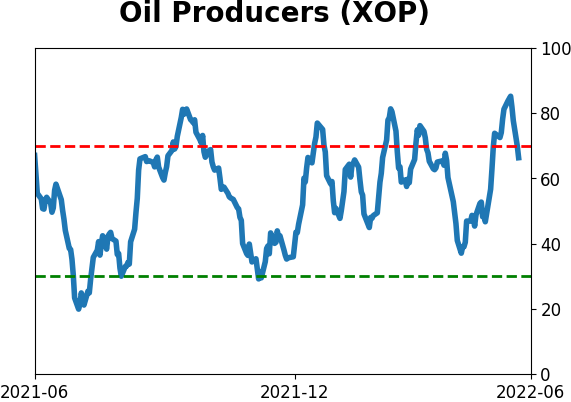
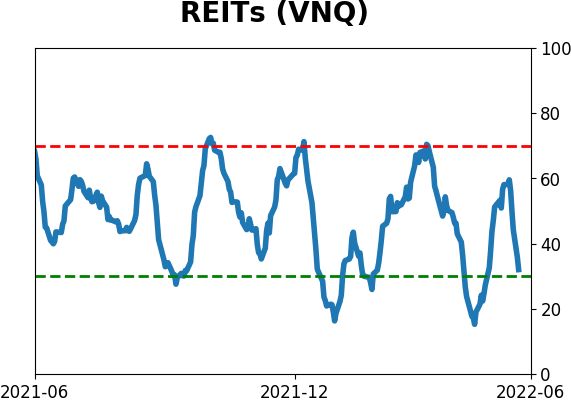
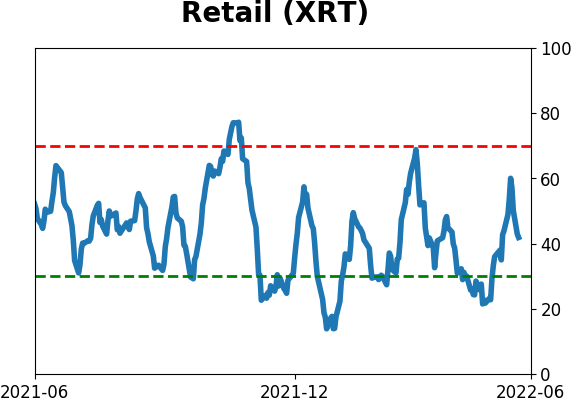
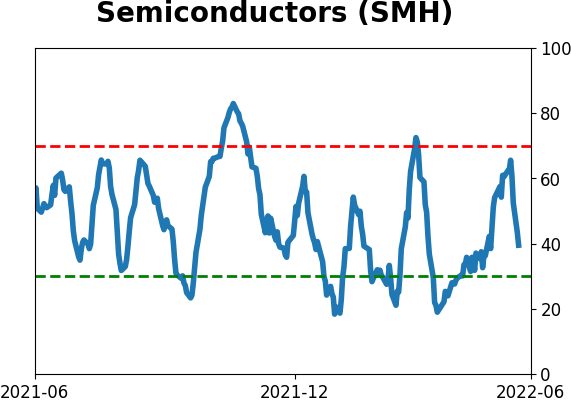
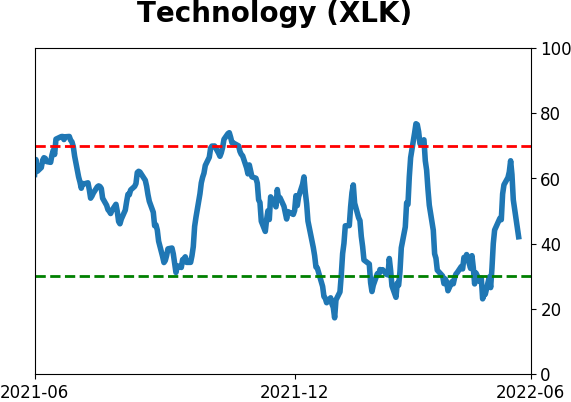
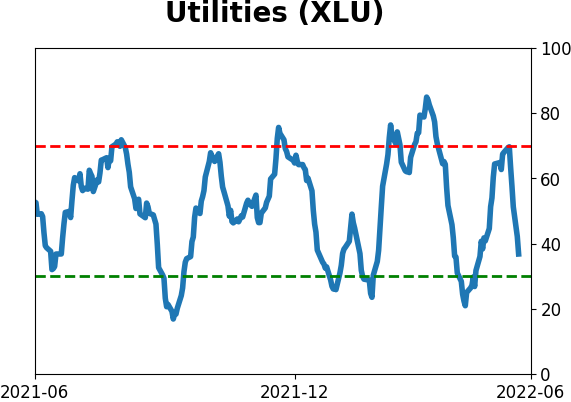
Sector ETF's - 10-Day Moving Average
|
|
|
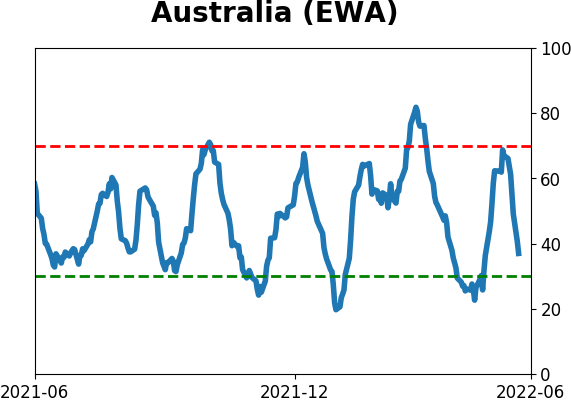
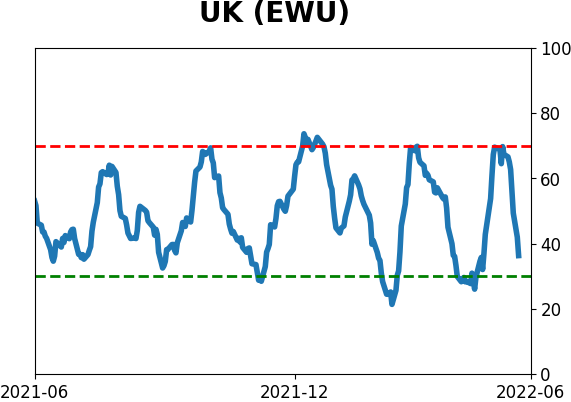
Country ETF's - 10-Day Moving Average
|
|
|
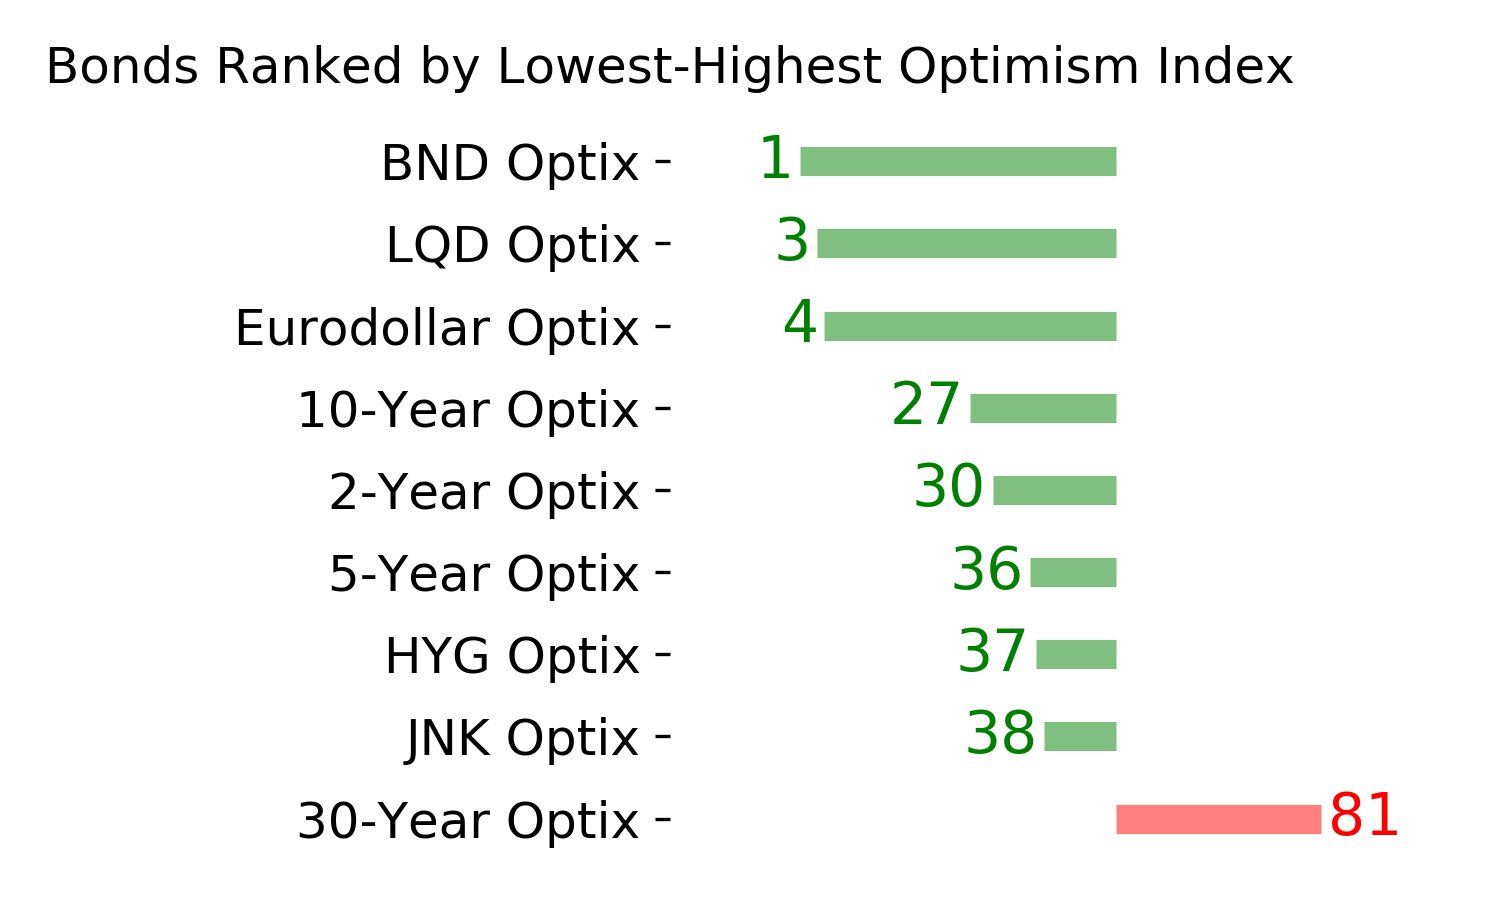
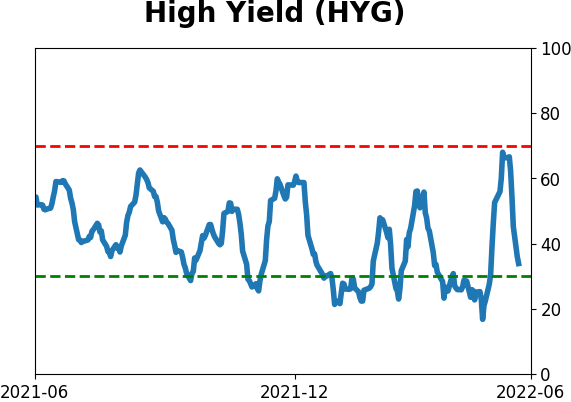
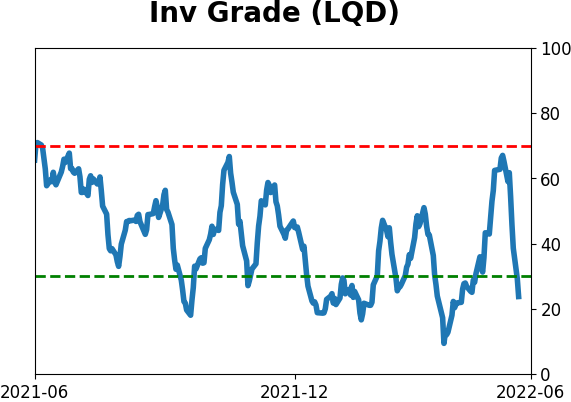
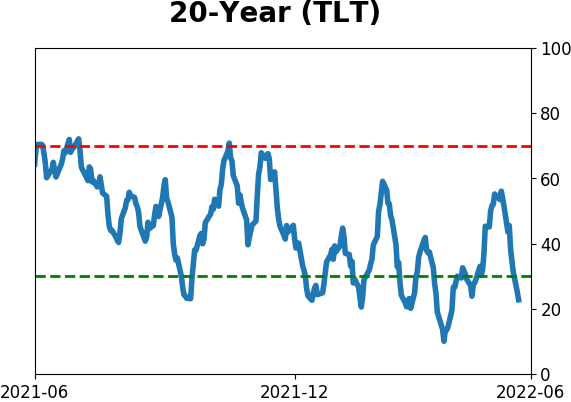
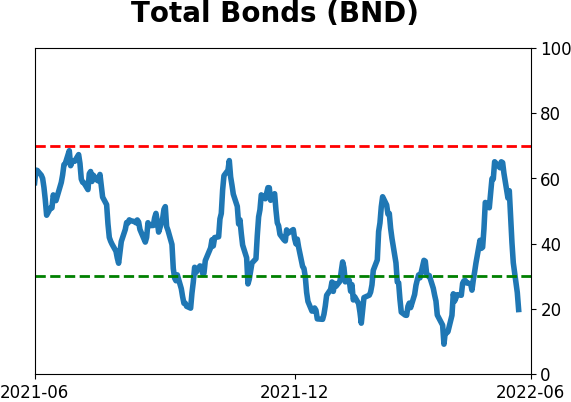
Bond ETF's - 10-Day Moving Average
|
|
|
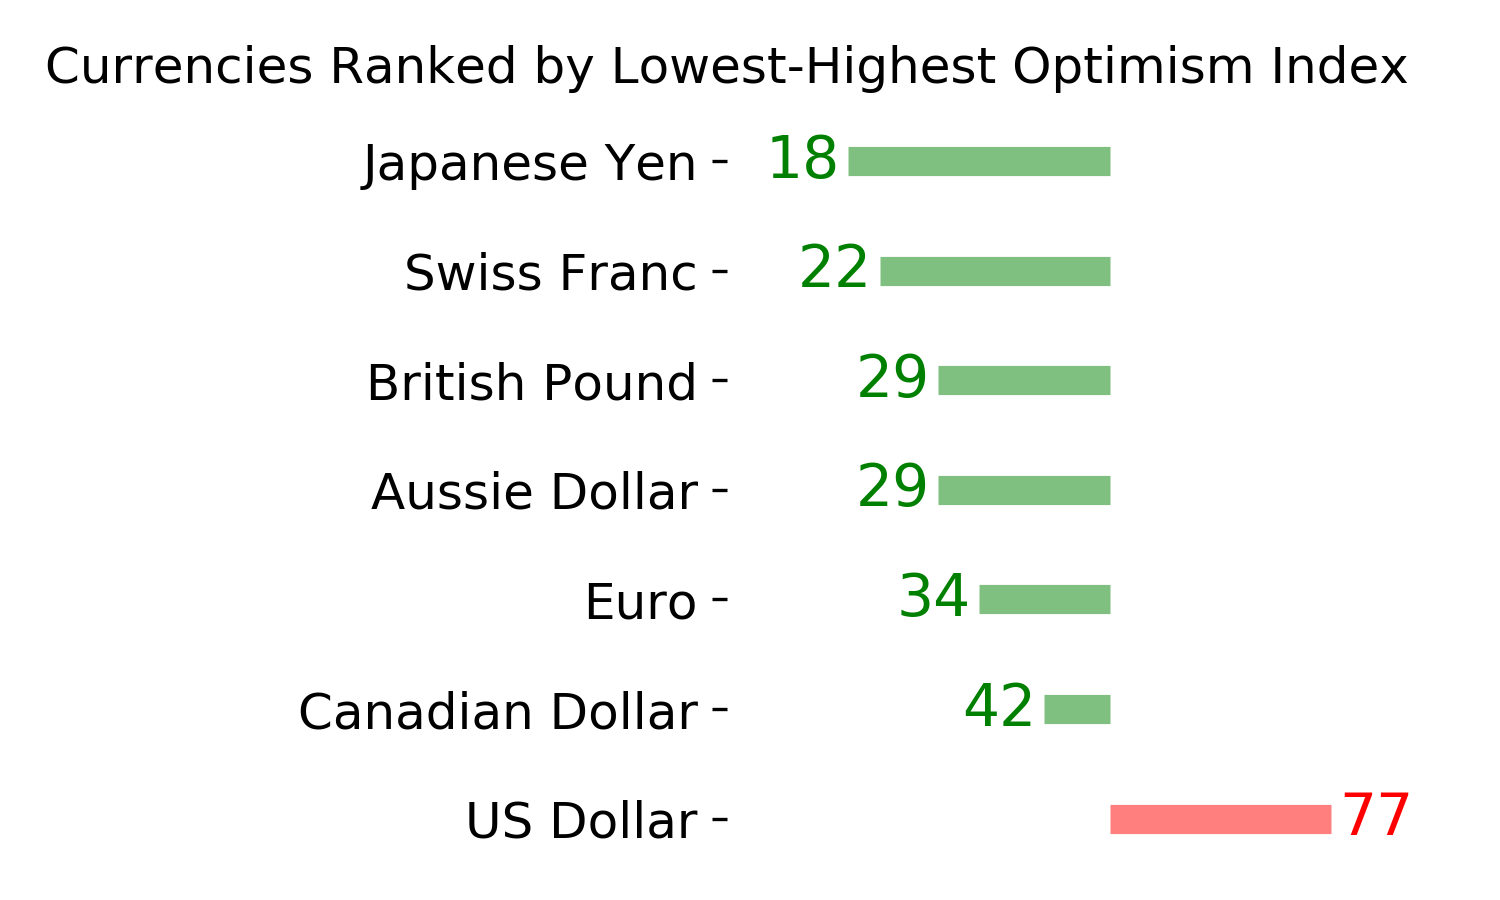
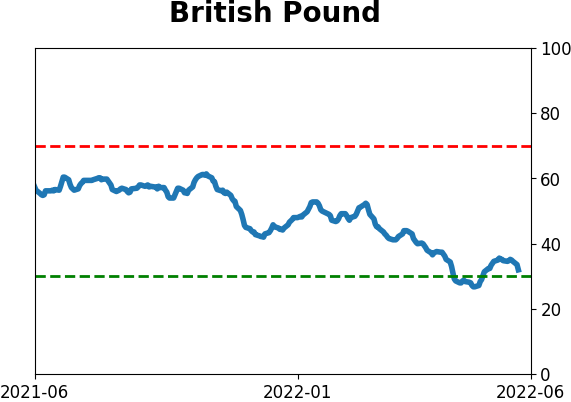
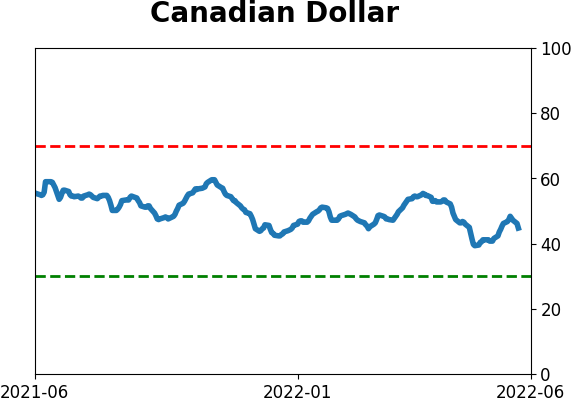
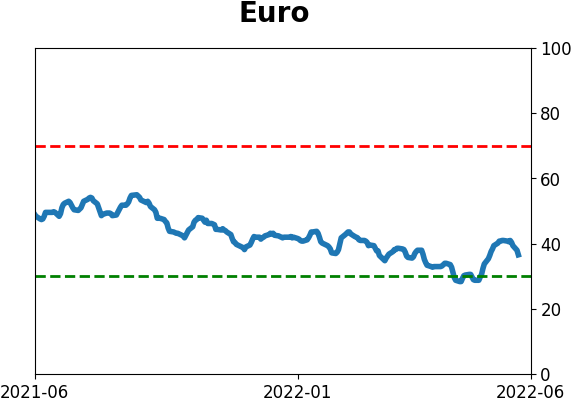
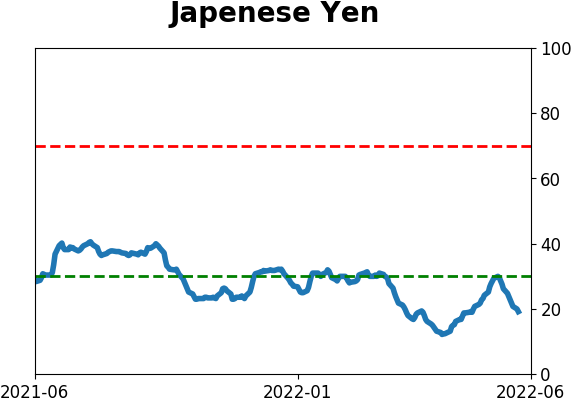
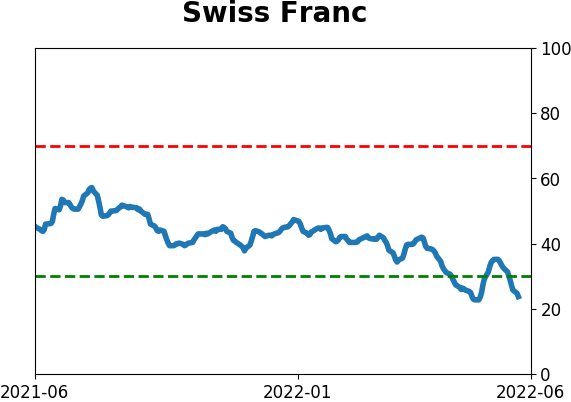
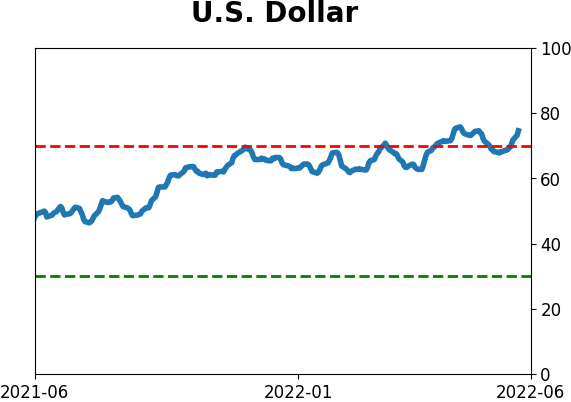
Currency ETF's - 5-Day Moving Average
|
|
|
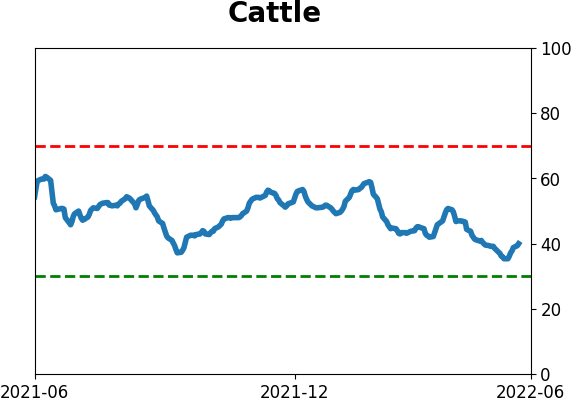
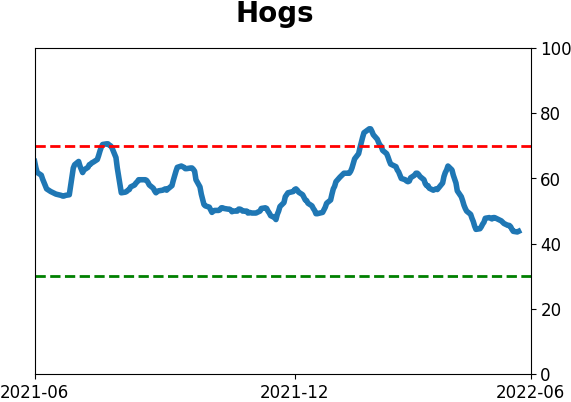
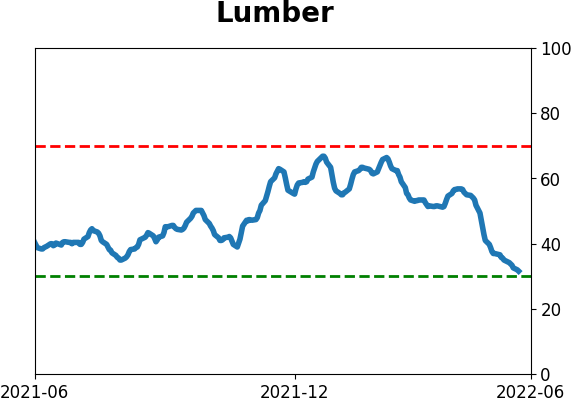
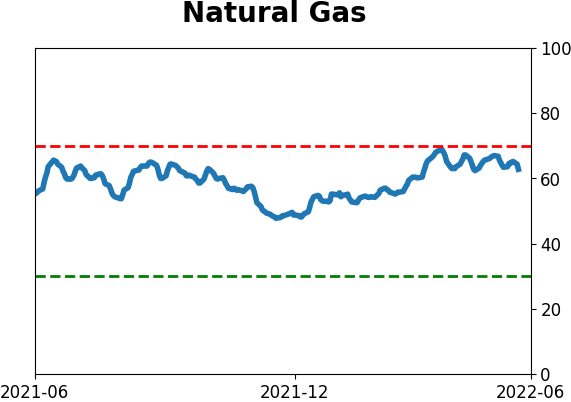
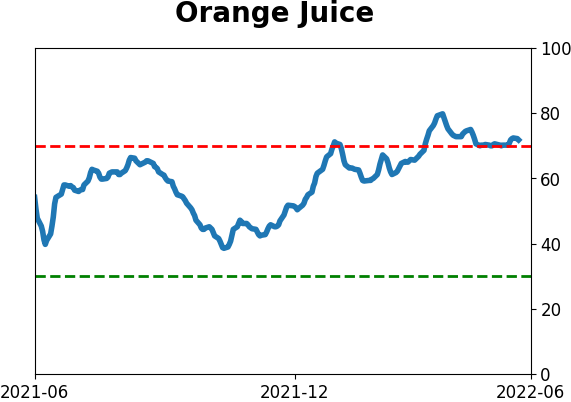
Commodity ETF's - 5-Day Moving Average
|
|