Headlines
|
|
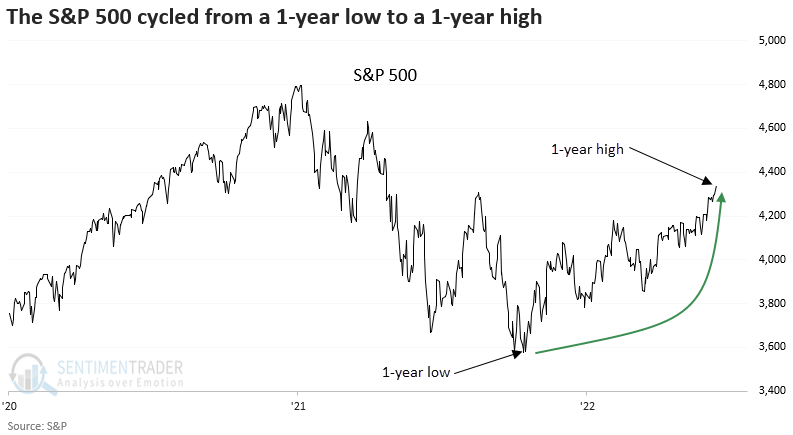
The S&P 500 cycled from a 1-year low to a 1-year high:
The S&P 500 cycled from a 1-year low to a 1-year high. After similar breakouts, the S&P 500 was higher 88% of the time over the next year. Even when the breakout occurs with a low level of 1-year highs from index members, the outlook for the S&P 500 is excellent.
|
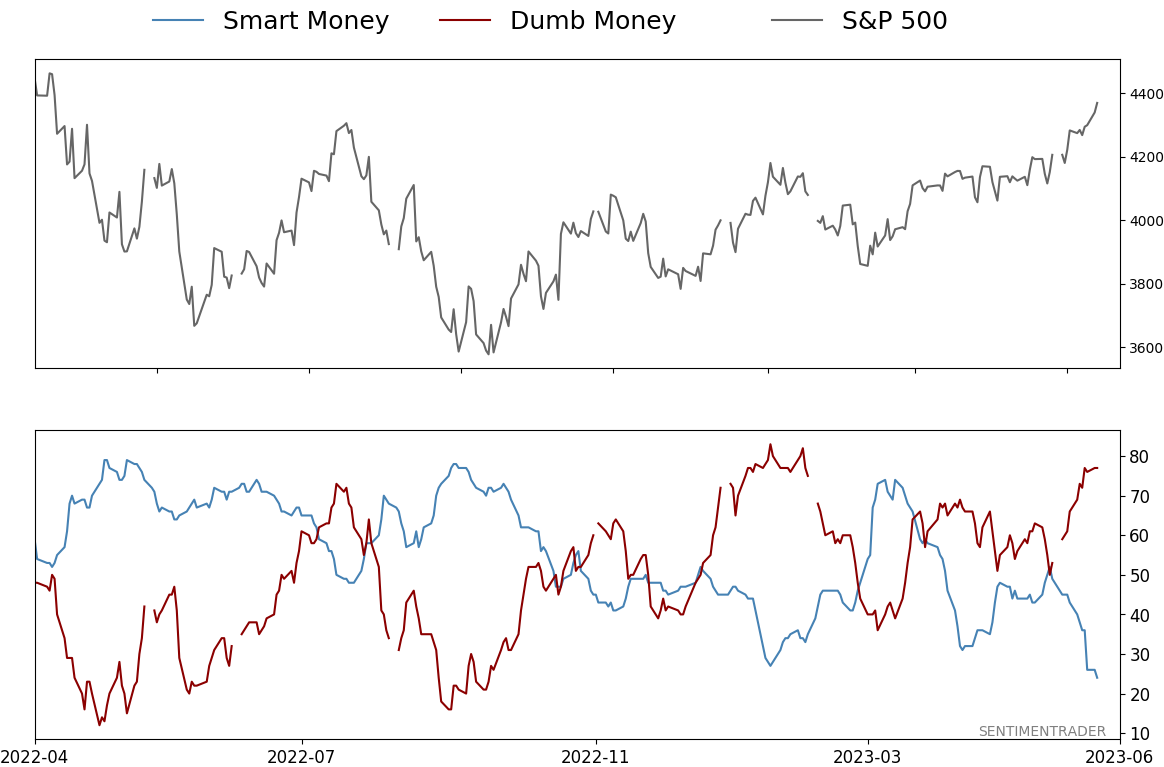
Smart / Dumb Money Confidence
|
Smart Money Confidence: 24%
Dumb Money Confidence: 77%
|
|
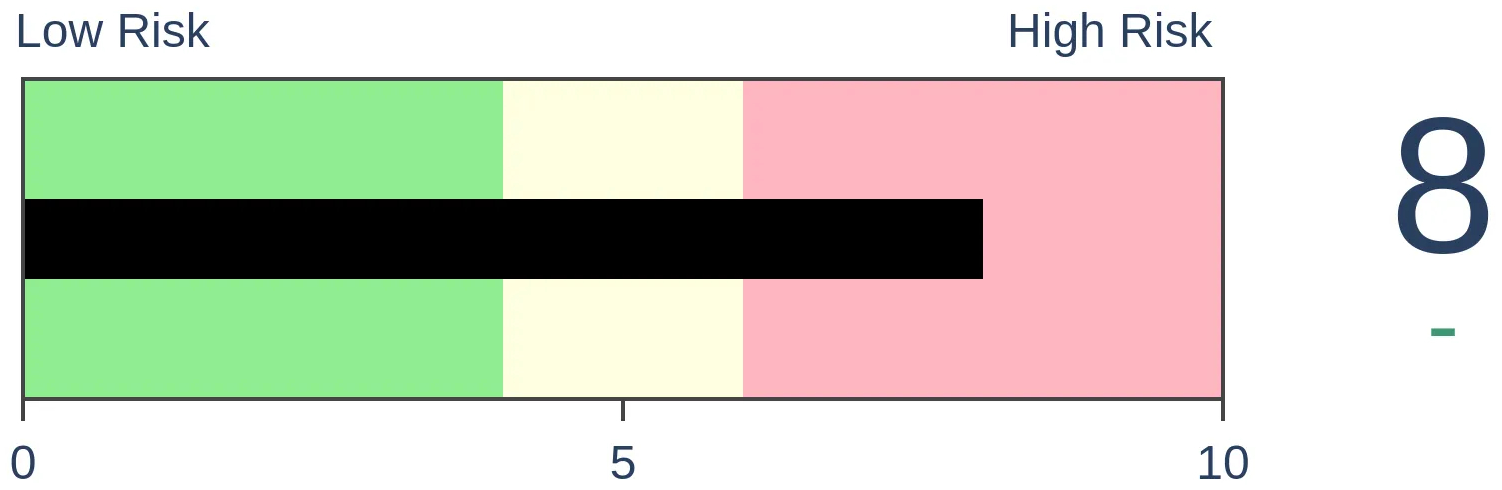
Risk Levels
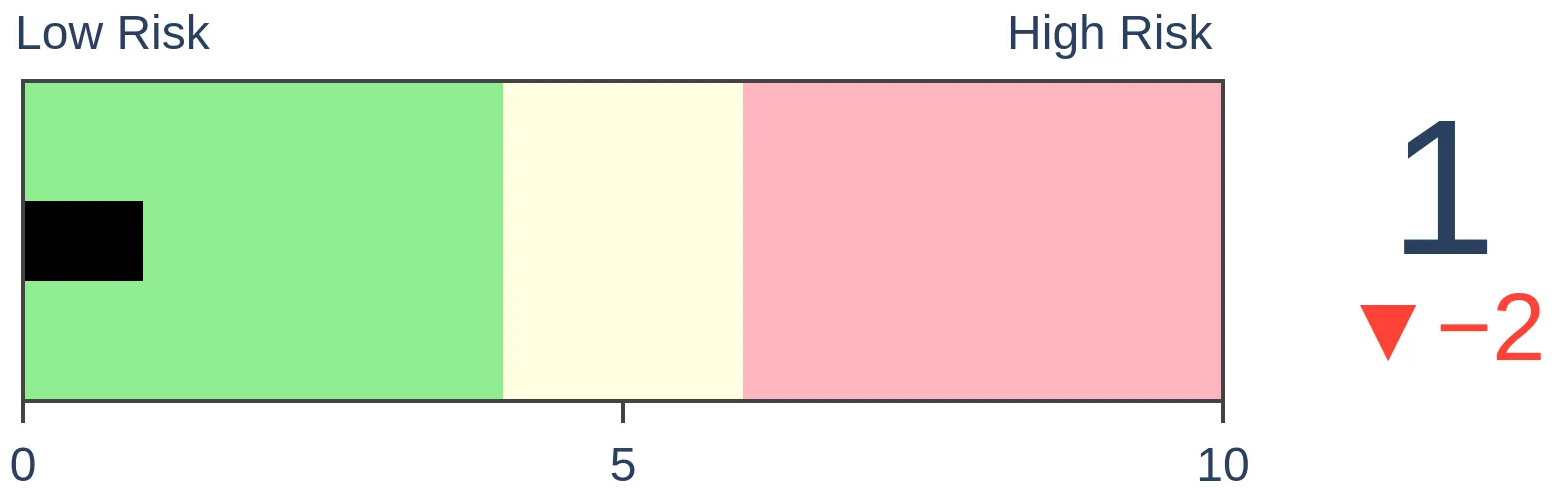
Stocks Short-Term
|
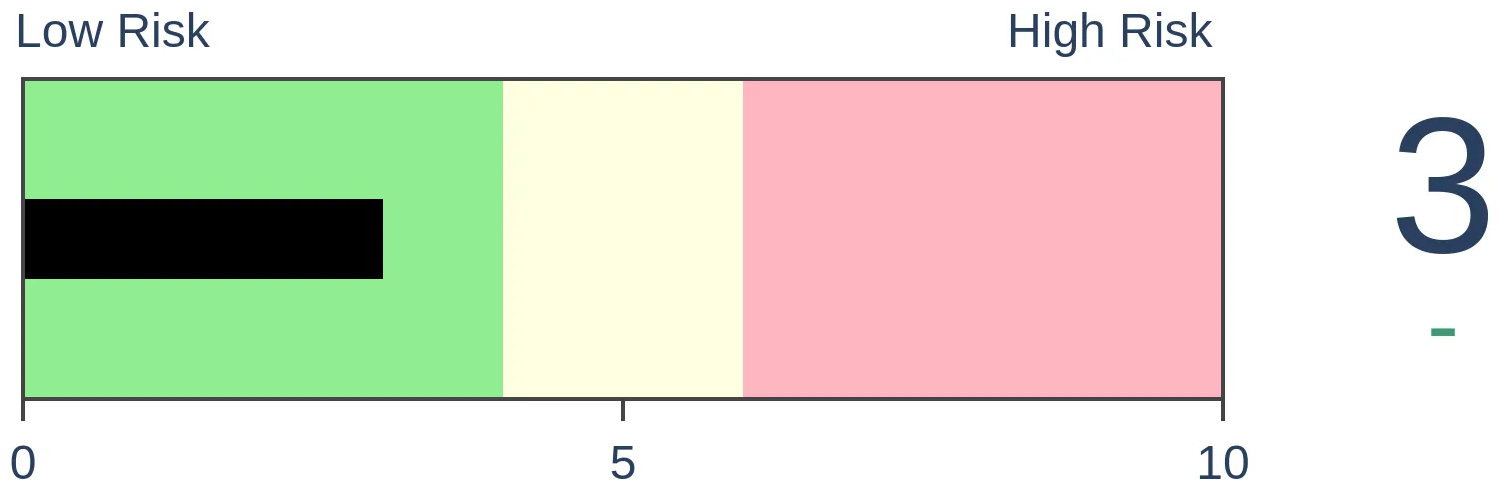
Stocks Medium-Term

|
|
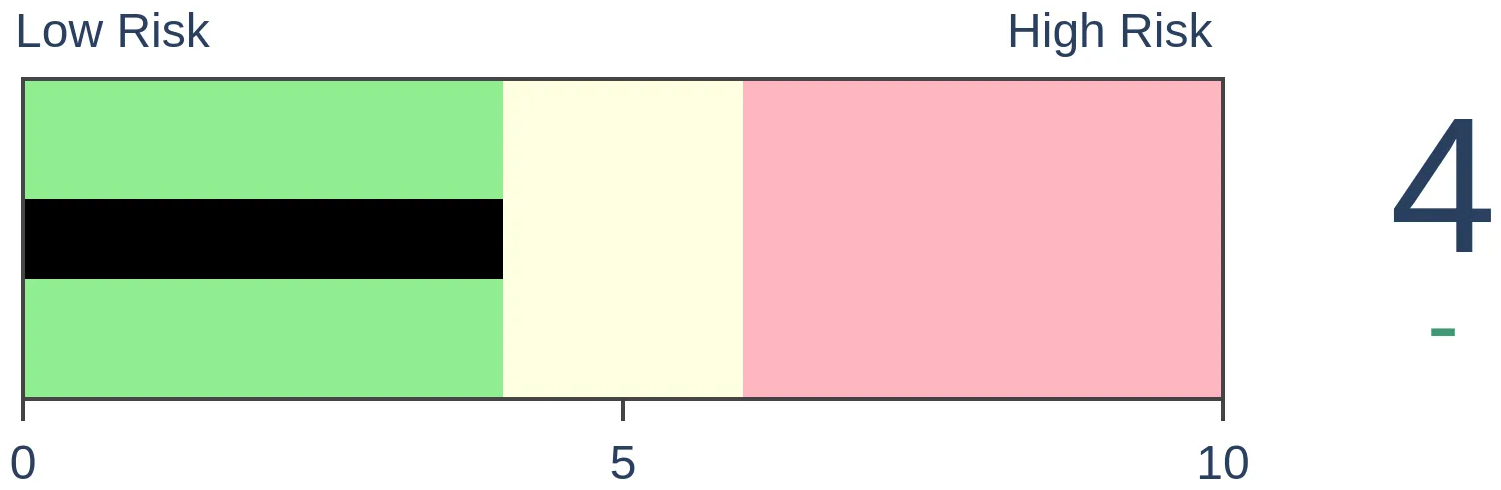
Bonds
|
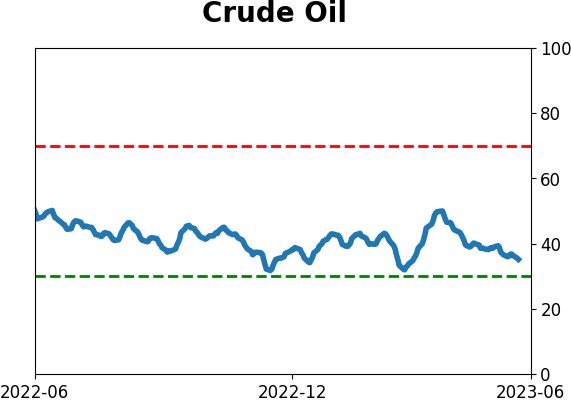
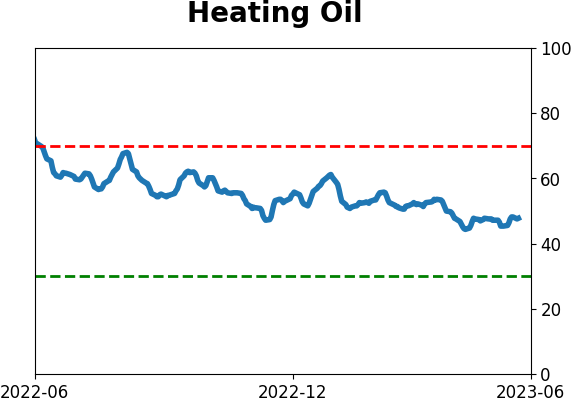
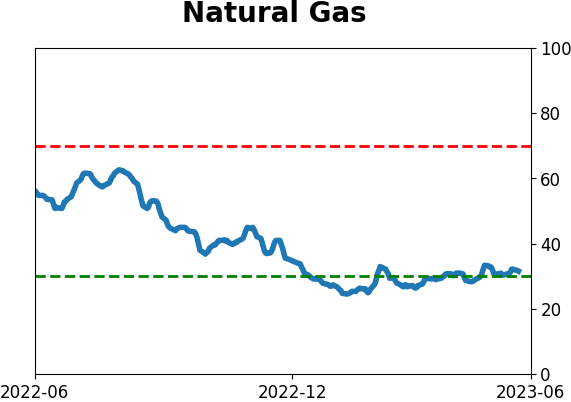
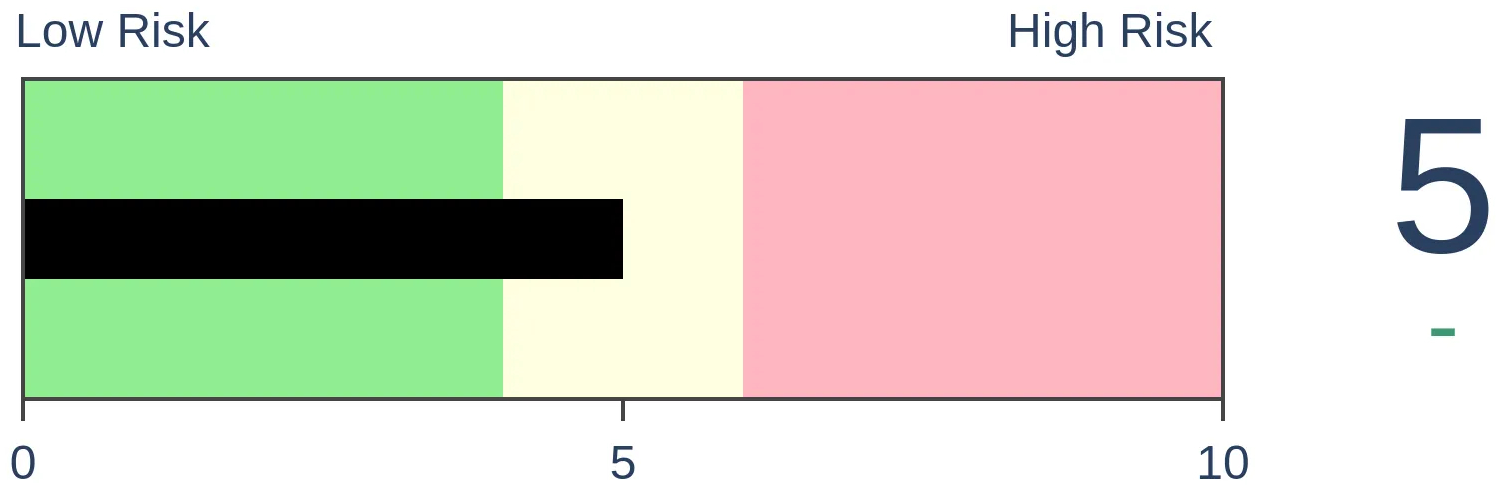
Crude Oil
|
|
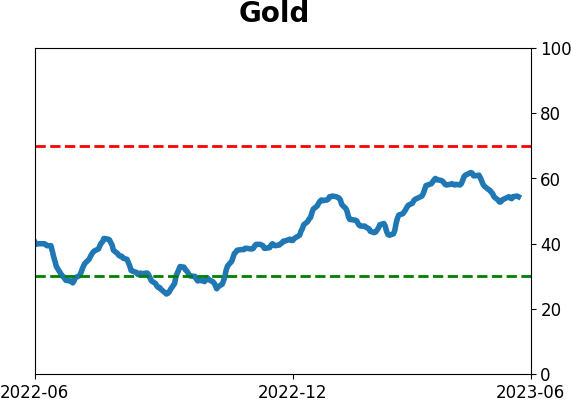
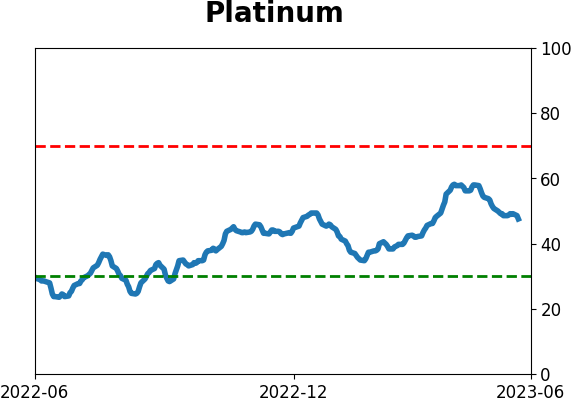
Gold
|
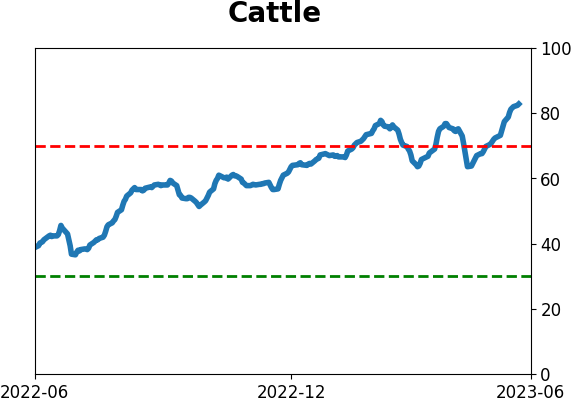
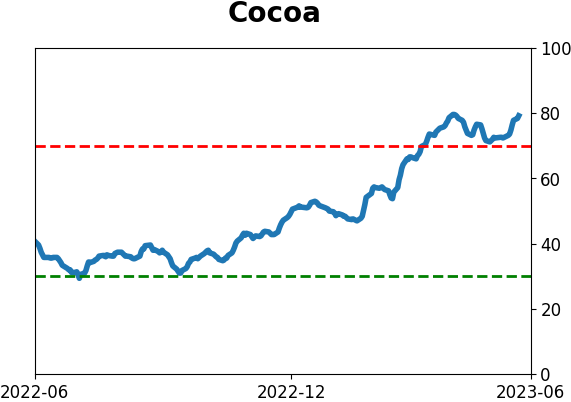
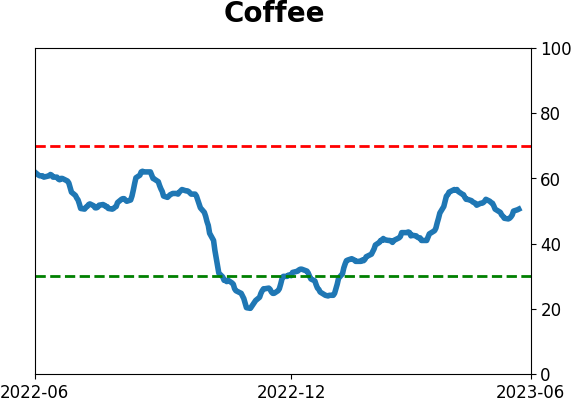
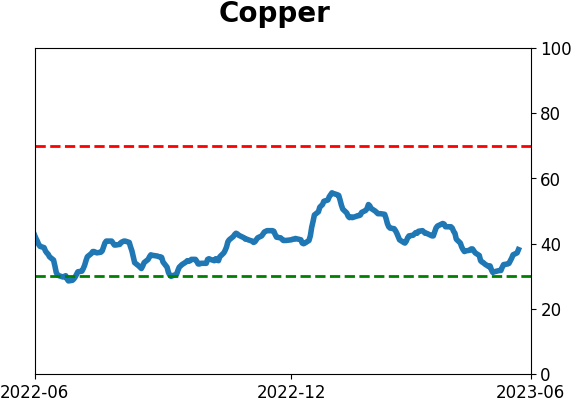
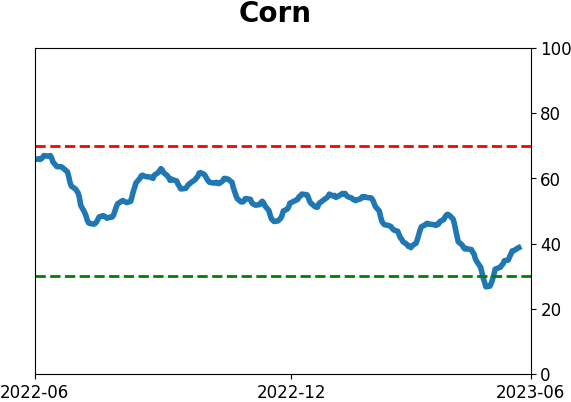
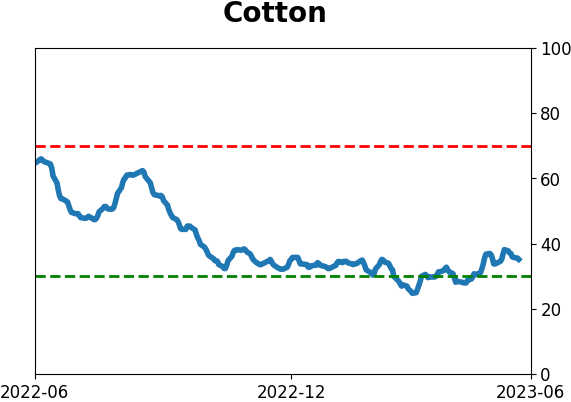
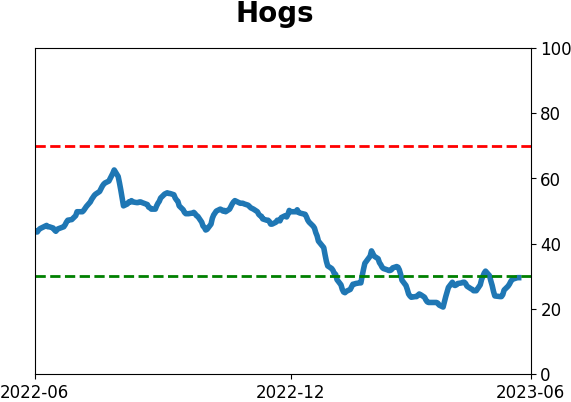
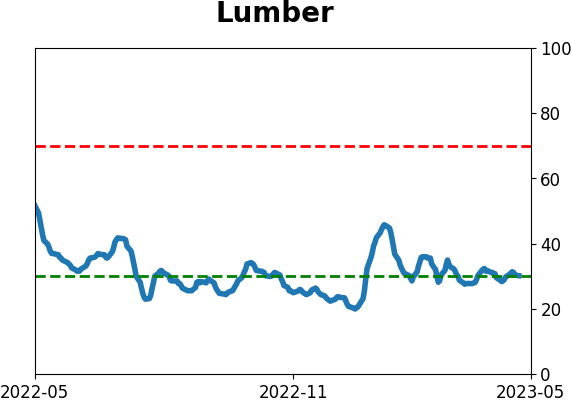
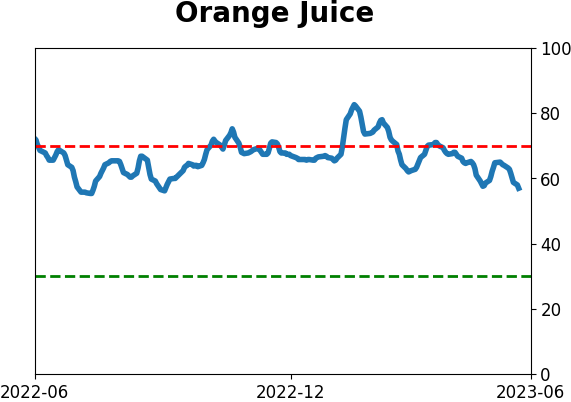
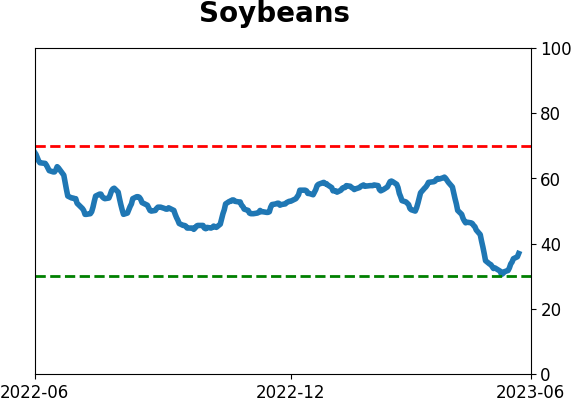
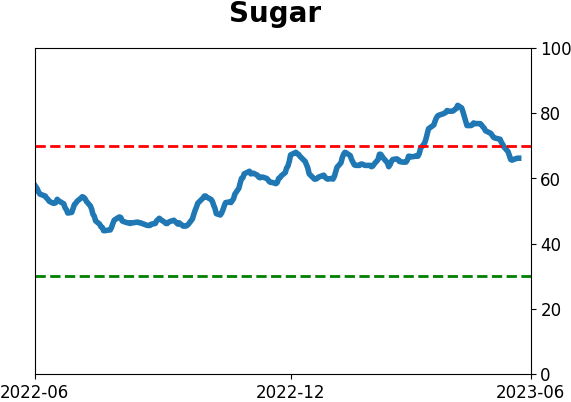
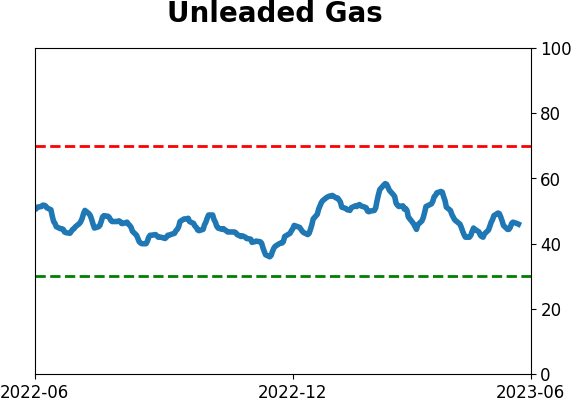
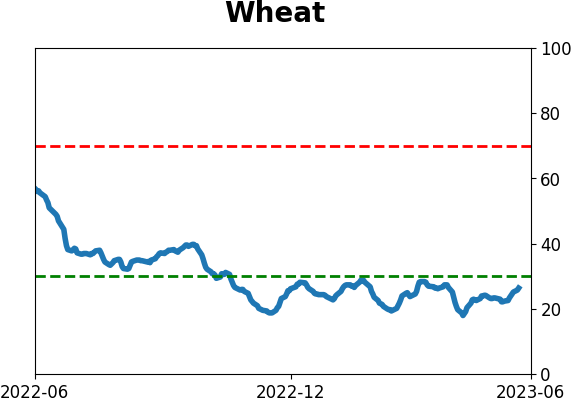
Agriculture
|
|
Research
By Dean Christians
BOTTOM LINE
The S&P 500 cycled from a 1-year low to a 1-year high. After similar breakouts, the S&P 500 was higher 88% of the time over the next year. Even when the breakout occurs with a low level of 1-year highs from index members, the outlook for the S&P 500 is excellent.
FORECAST / TIMEFRAME
SPY -- Up, Long-Term
|
Key points:
- The S&P 500 cycled from a 1-year low to a 1-year high
- Similar breakouts preceded excellent returns over the next year
- The percentage of 1-year highs from S&P 500 members is low, but concern is unwarranted
The most benchmarked index in the world triggers a bullish price pattern
Over the last few months, I highlighted several bullish breakout signals for the S&P 500 and other indexes like the Nikkei 225. So far, the alerts are working as the indexes continue to push higher.
On Monday, the S&P 500 closed at a new 1-year high. The breakout represents the first instance after a 1-year low, which is a critical piece of context.
Price pattern reversals of this duration tend to mark a transition from a bear market to a bull market.
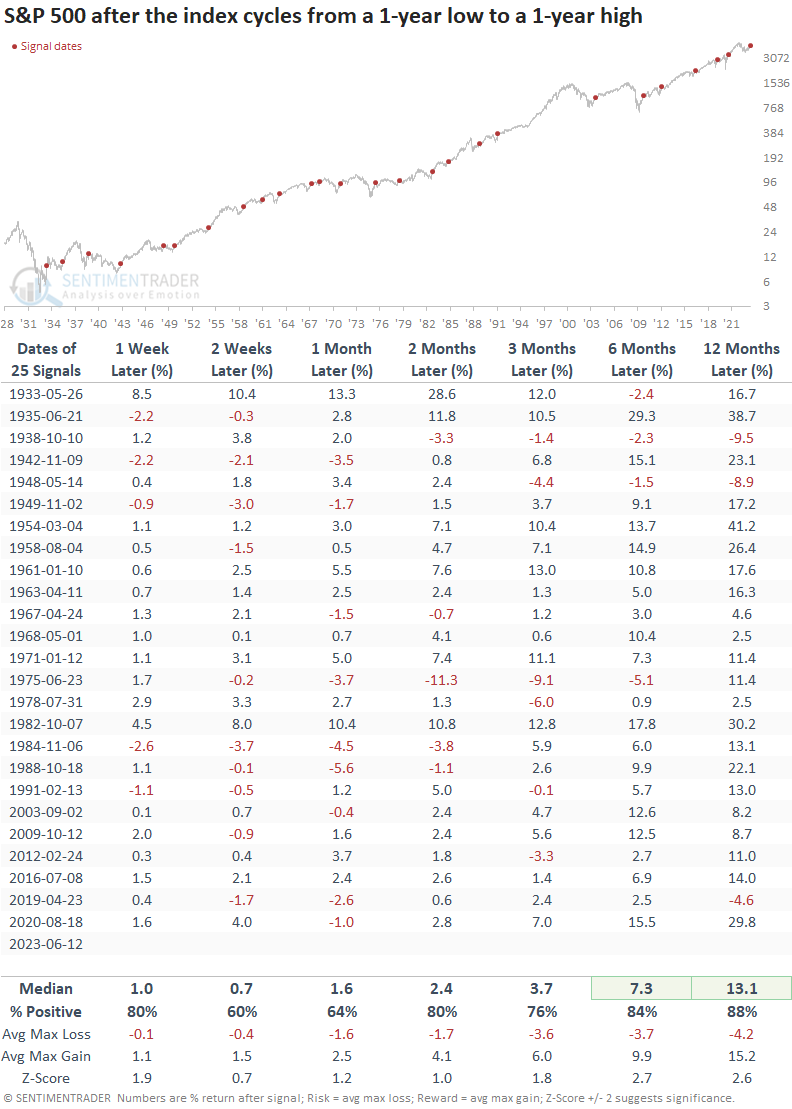
Similar breakouts preceded excellent results
When the most benchmarked index in the world cycles from a 1-year low to a 1-year high, S&P 500 returns, win rates, and z-scores are excellent across most time horizons. Since 1948, the large-cap index had only one loss over the next six and twelve-month periods.
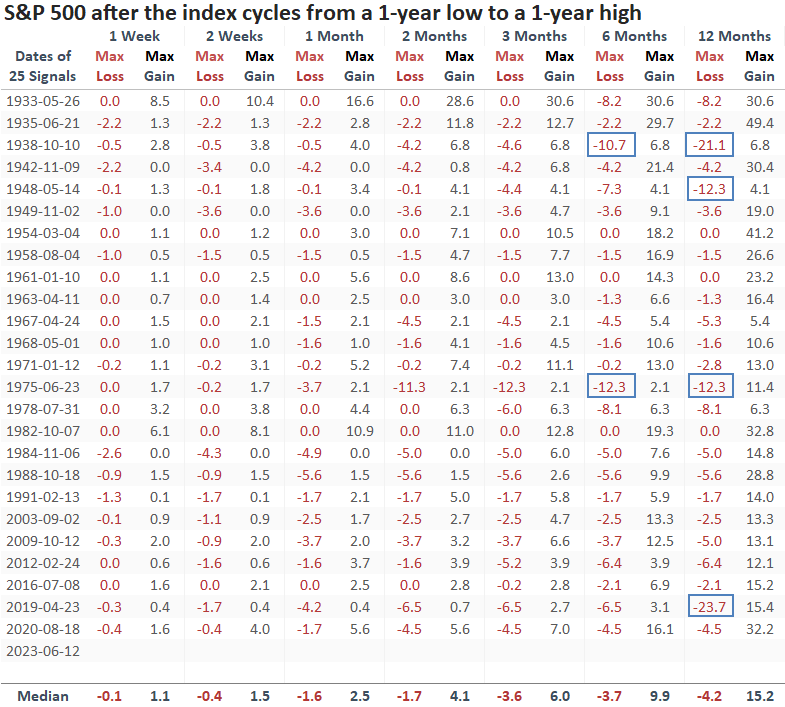
Significant max loss instances were remarkedly low over the next six and twelve months, with only two and four precedents exceeding -10%.
What about the low level of 1-year highs from stocks in the S&P 500?
The new 1-year high in the S&P 500 occurred with fewer than 5% of index members registering a 1-year high. Let's add that condition to the original study to see if a participation problem impacts the outlook for the S&P 500.
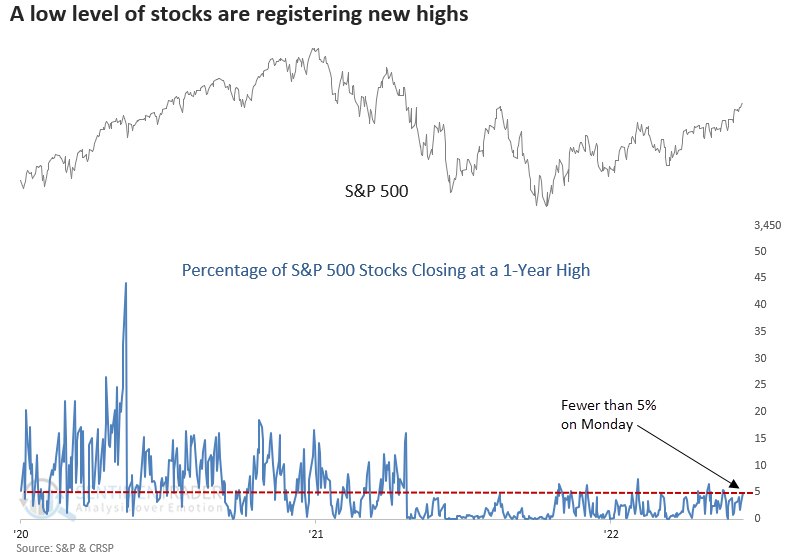
When I included a condition that required fewer than 5% of index members closing at a 1-year high when the S&P 500 cycled from a 1-year low to a 1-year high, the lack of participation from individual stocks had a limited impact on the outlook for the S&P 500.
Three and six months later, the S&P 500 was higher 83% of the time, and several time frames showed a significant z-score.
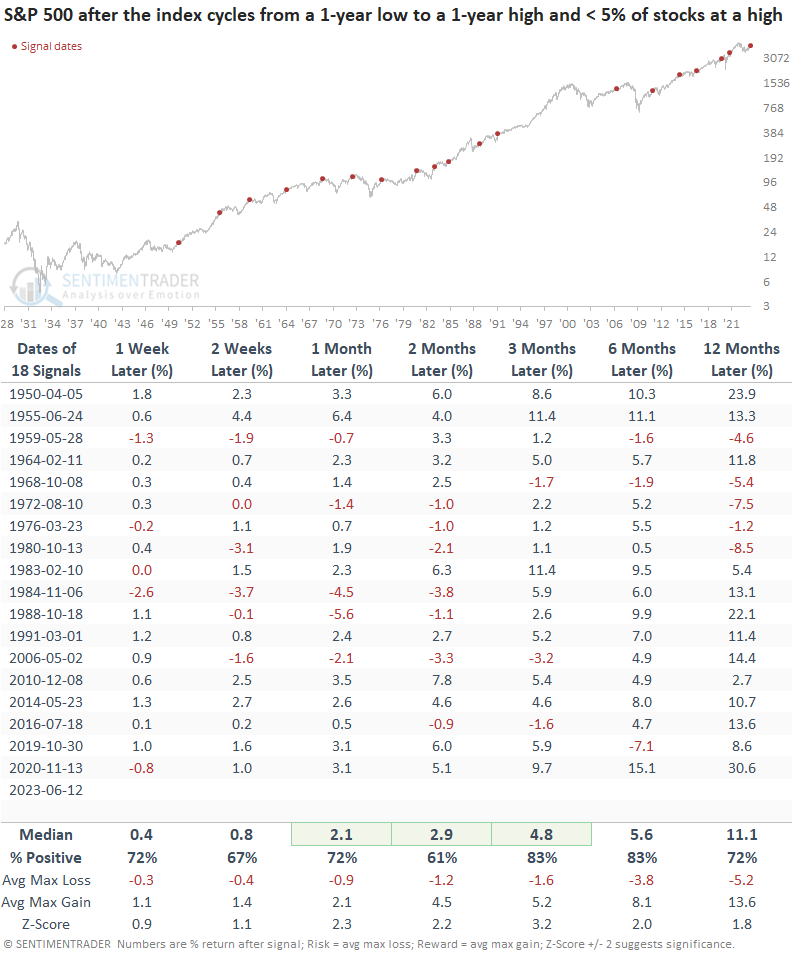
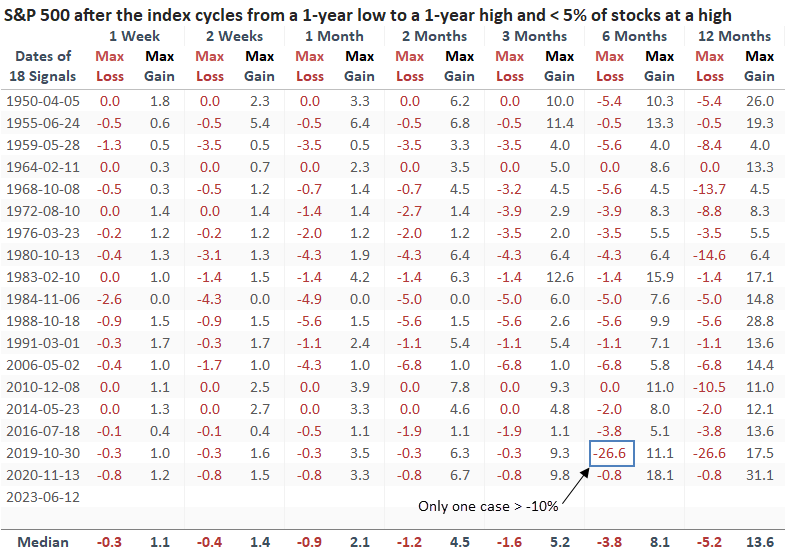
Over the next six months, the S&P 500 had only one max loss that exceeded -10%.
What the research tells us...
The most benchmarked index in the world is breaking out to a new 1-year high after registering a 1-year low in 2022. After similar breakouts, the S&P 500 rallied 88% of the time over the next year. While the percentage of 1-year highs from S&P 500 members is low, the lack of participation did not create a headwind for the index. Three and six months later, the large-cap stocks were higher 83% of the time.
Indicators at Extremes
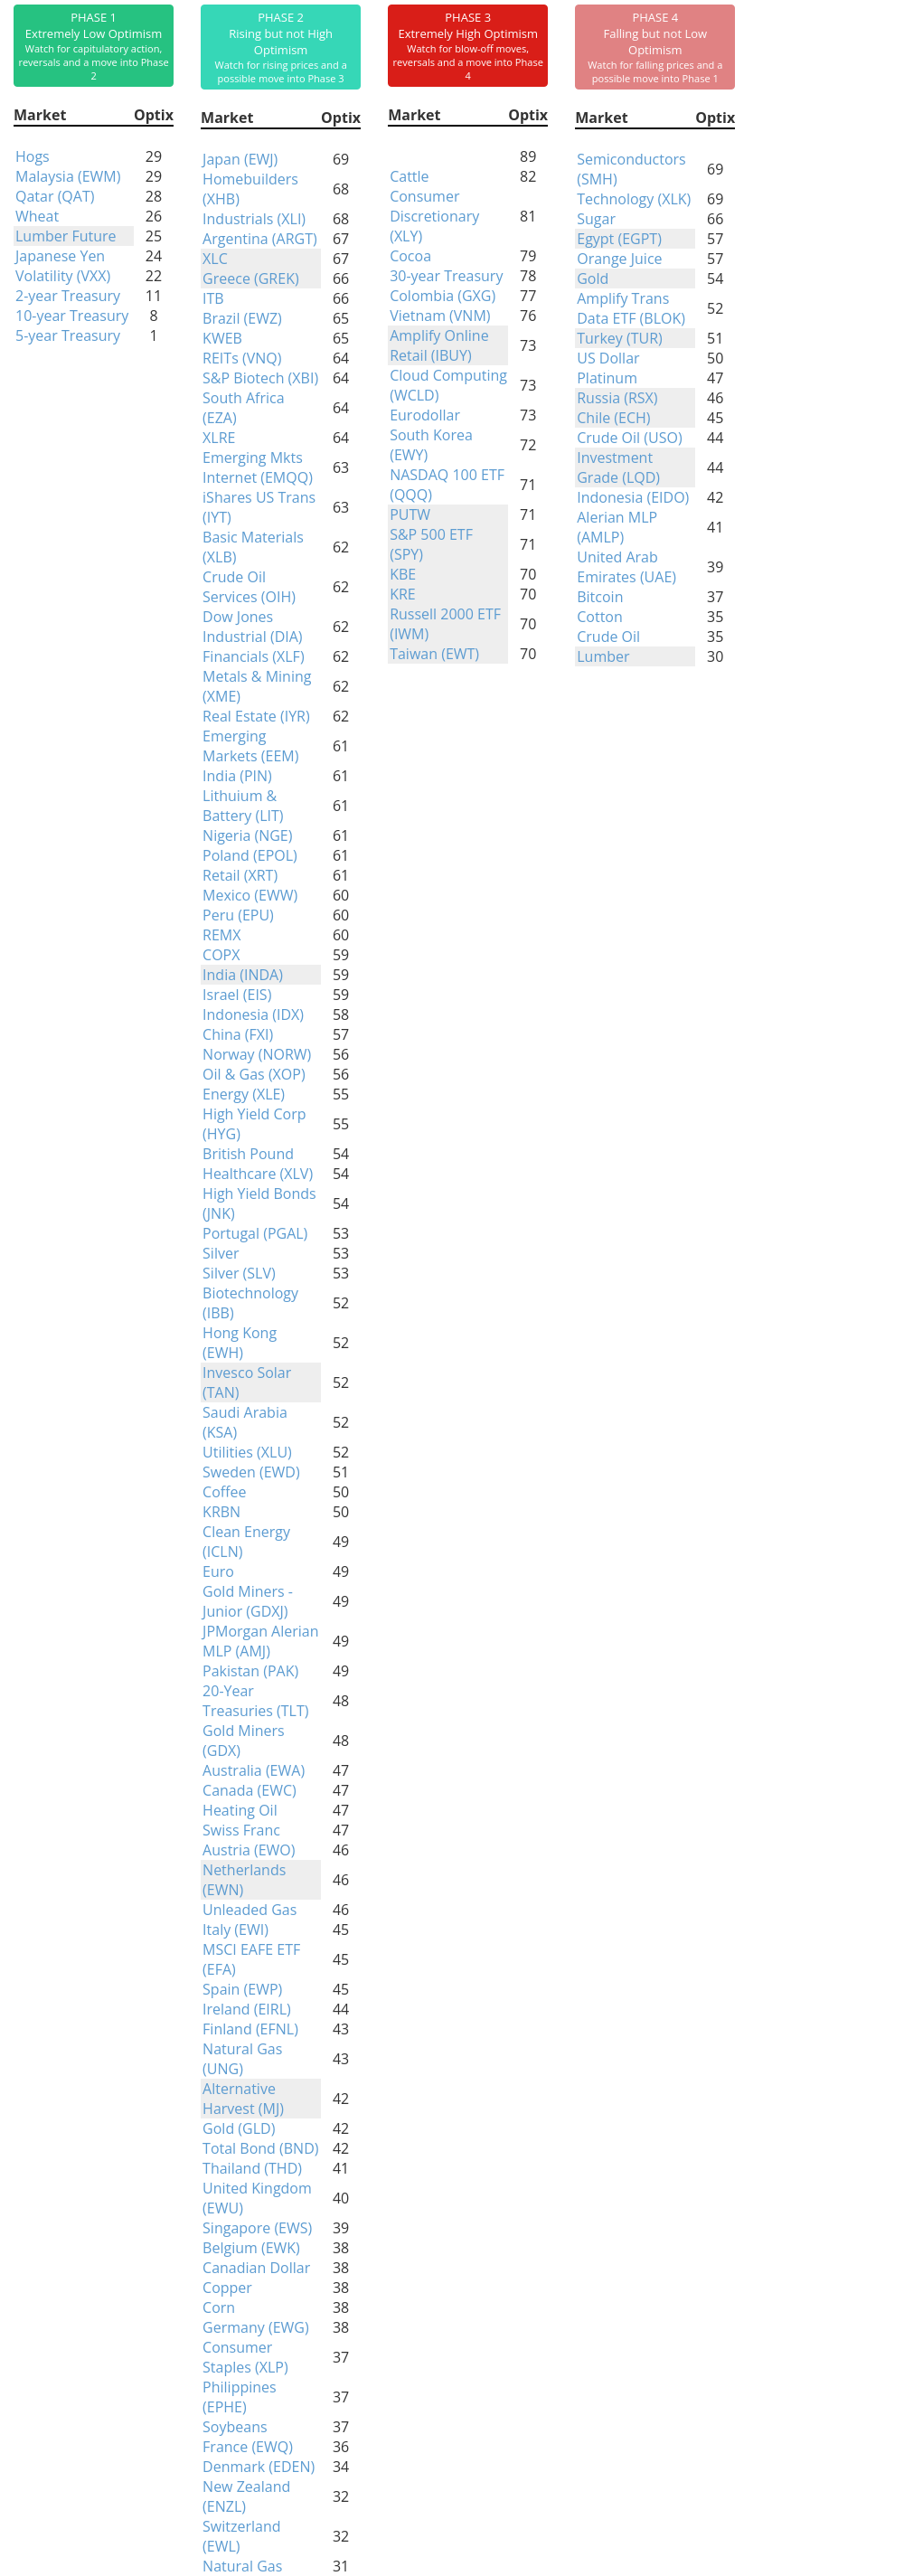
Phase Table
Ranks
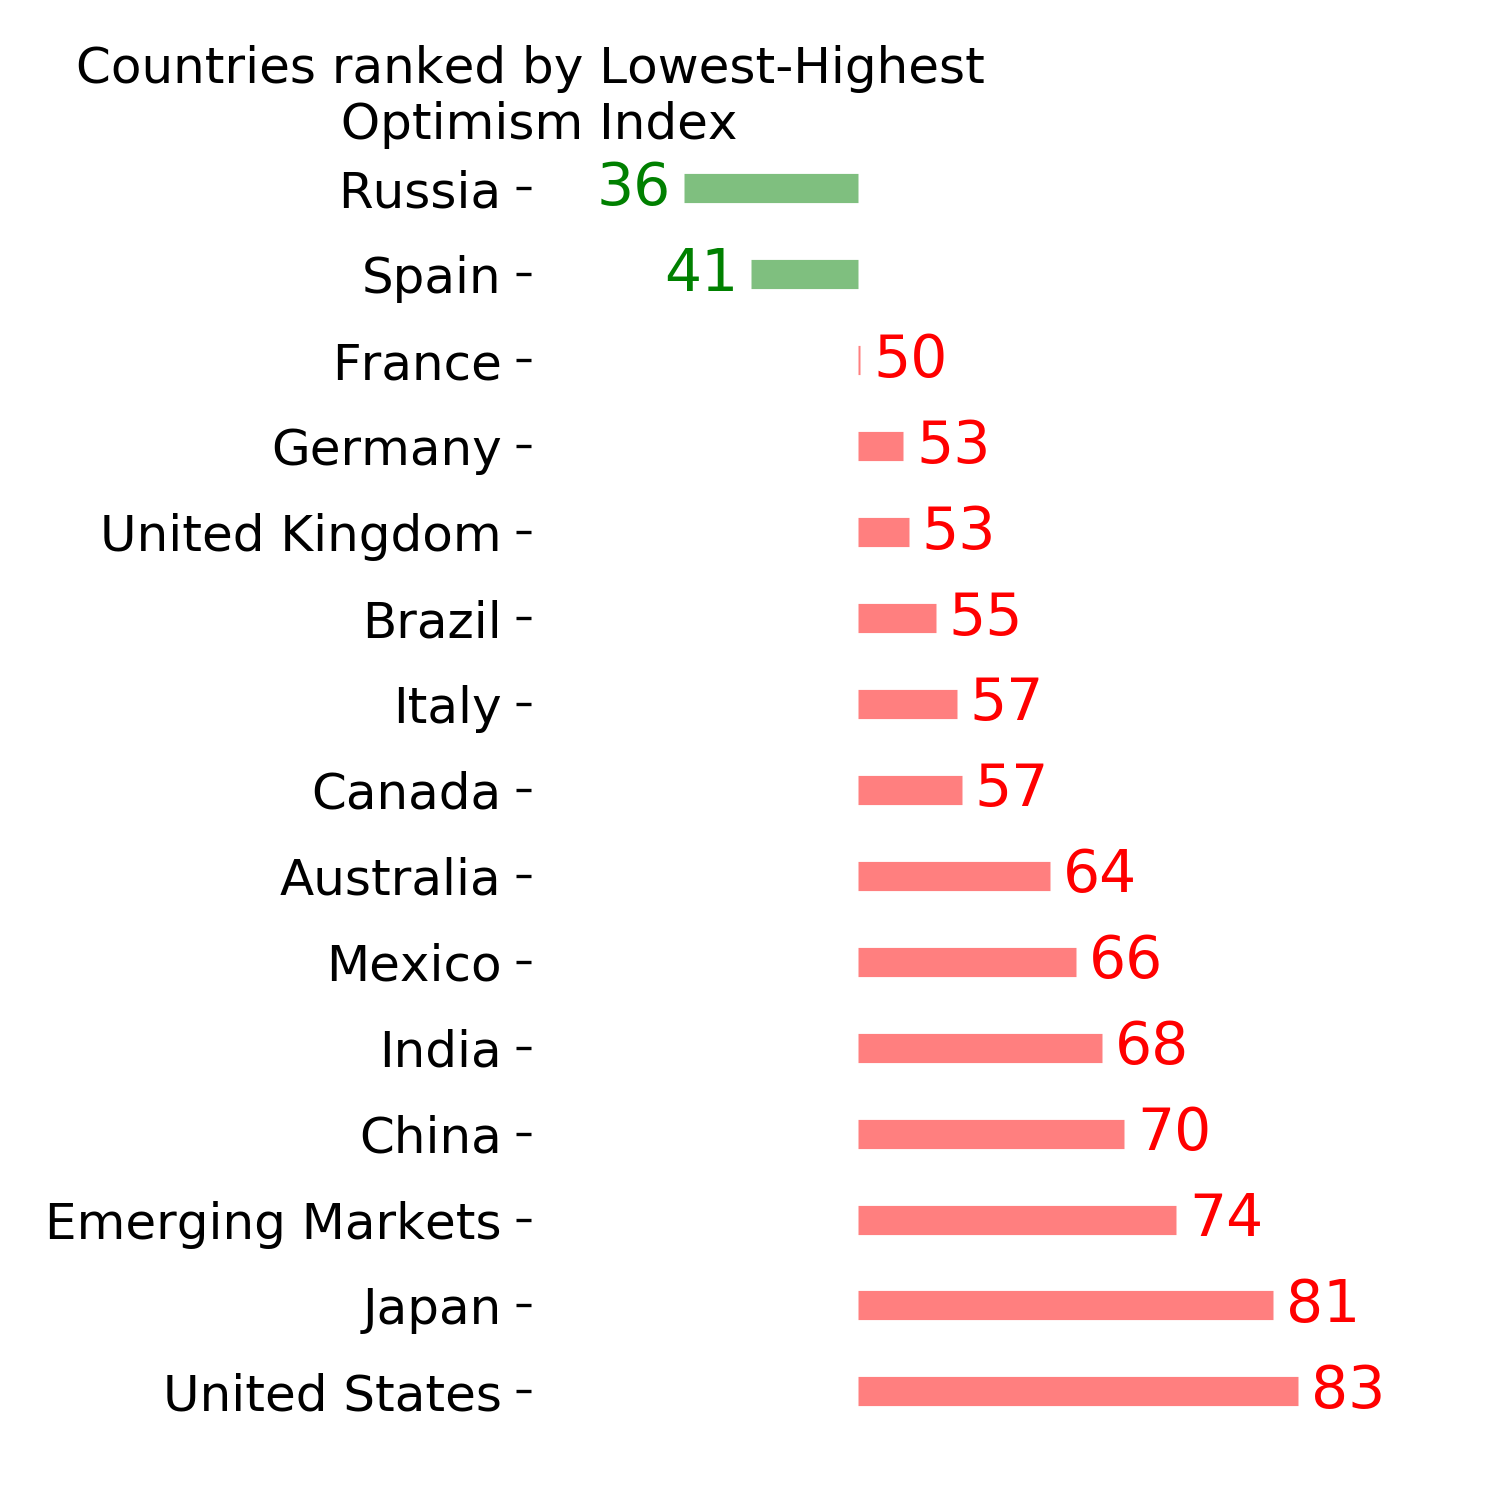
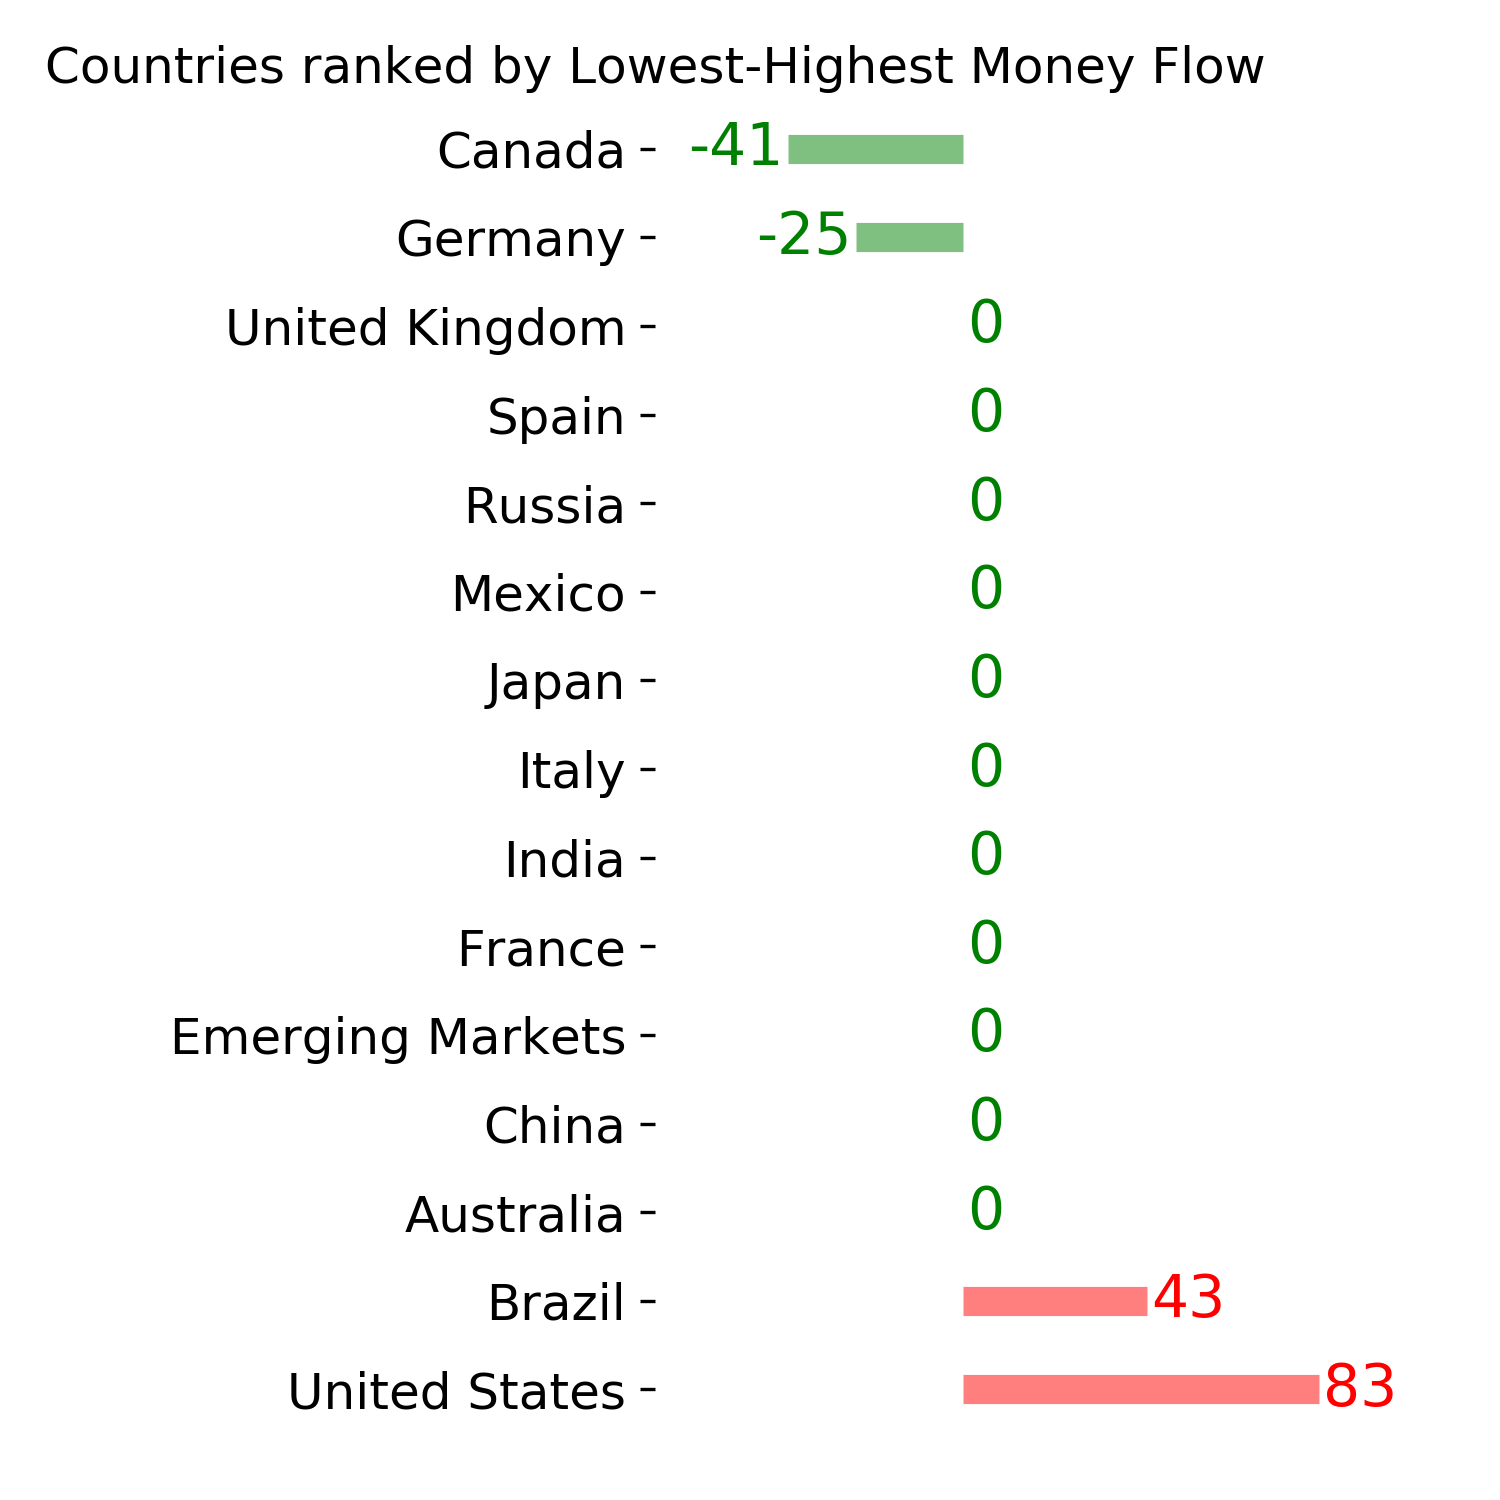
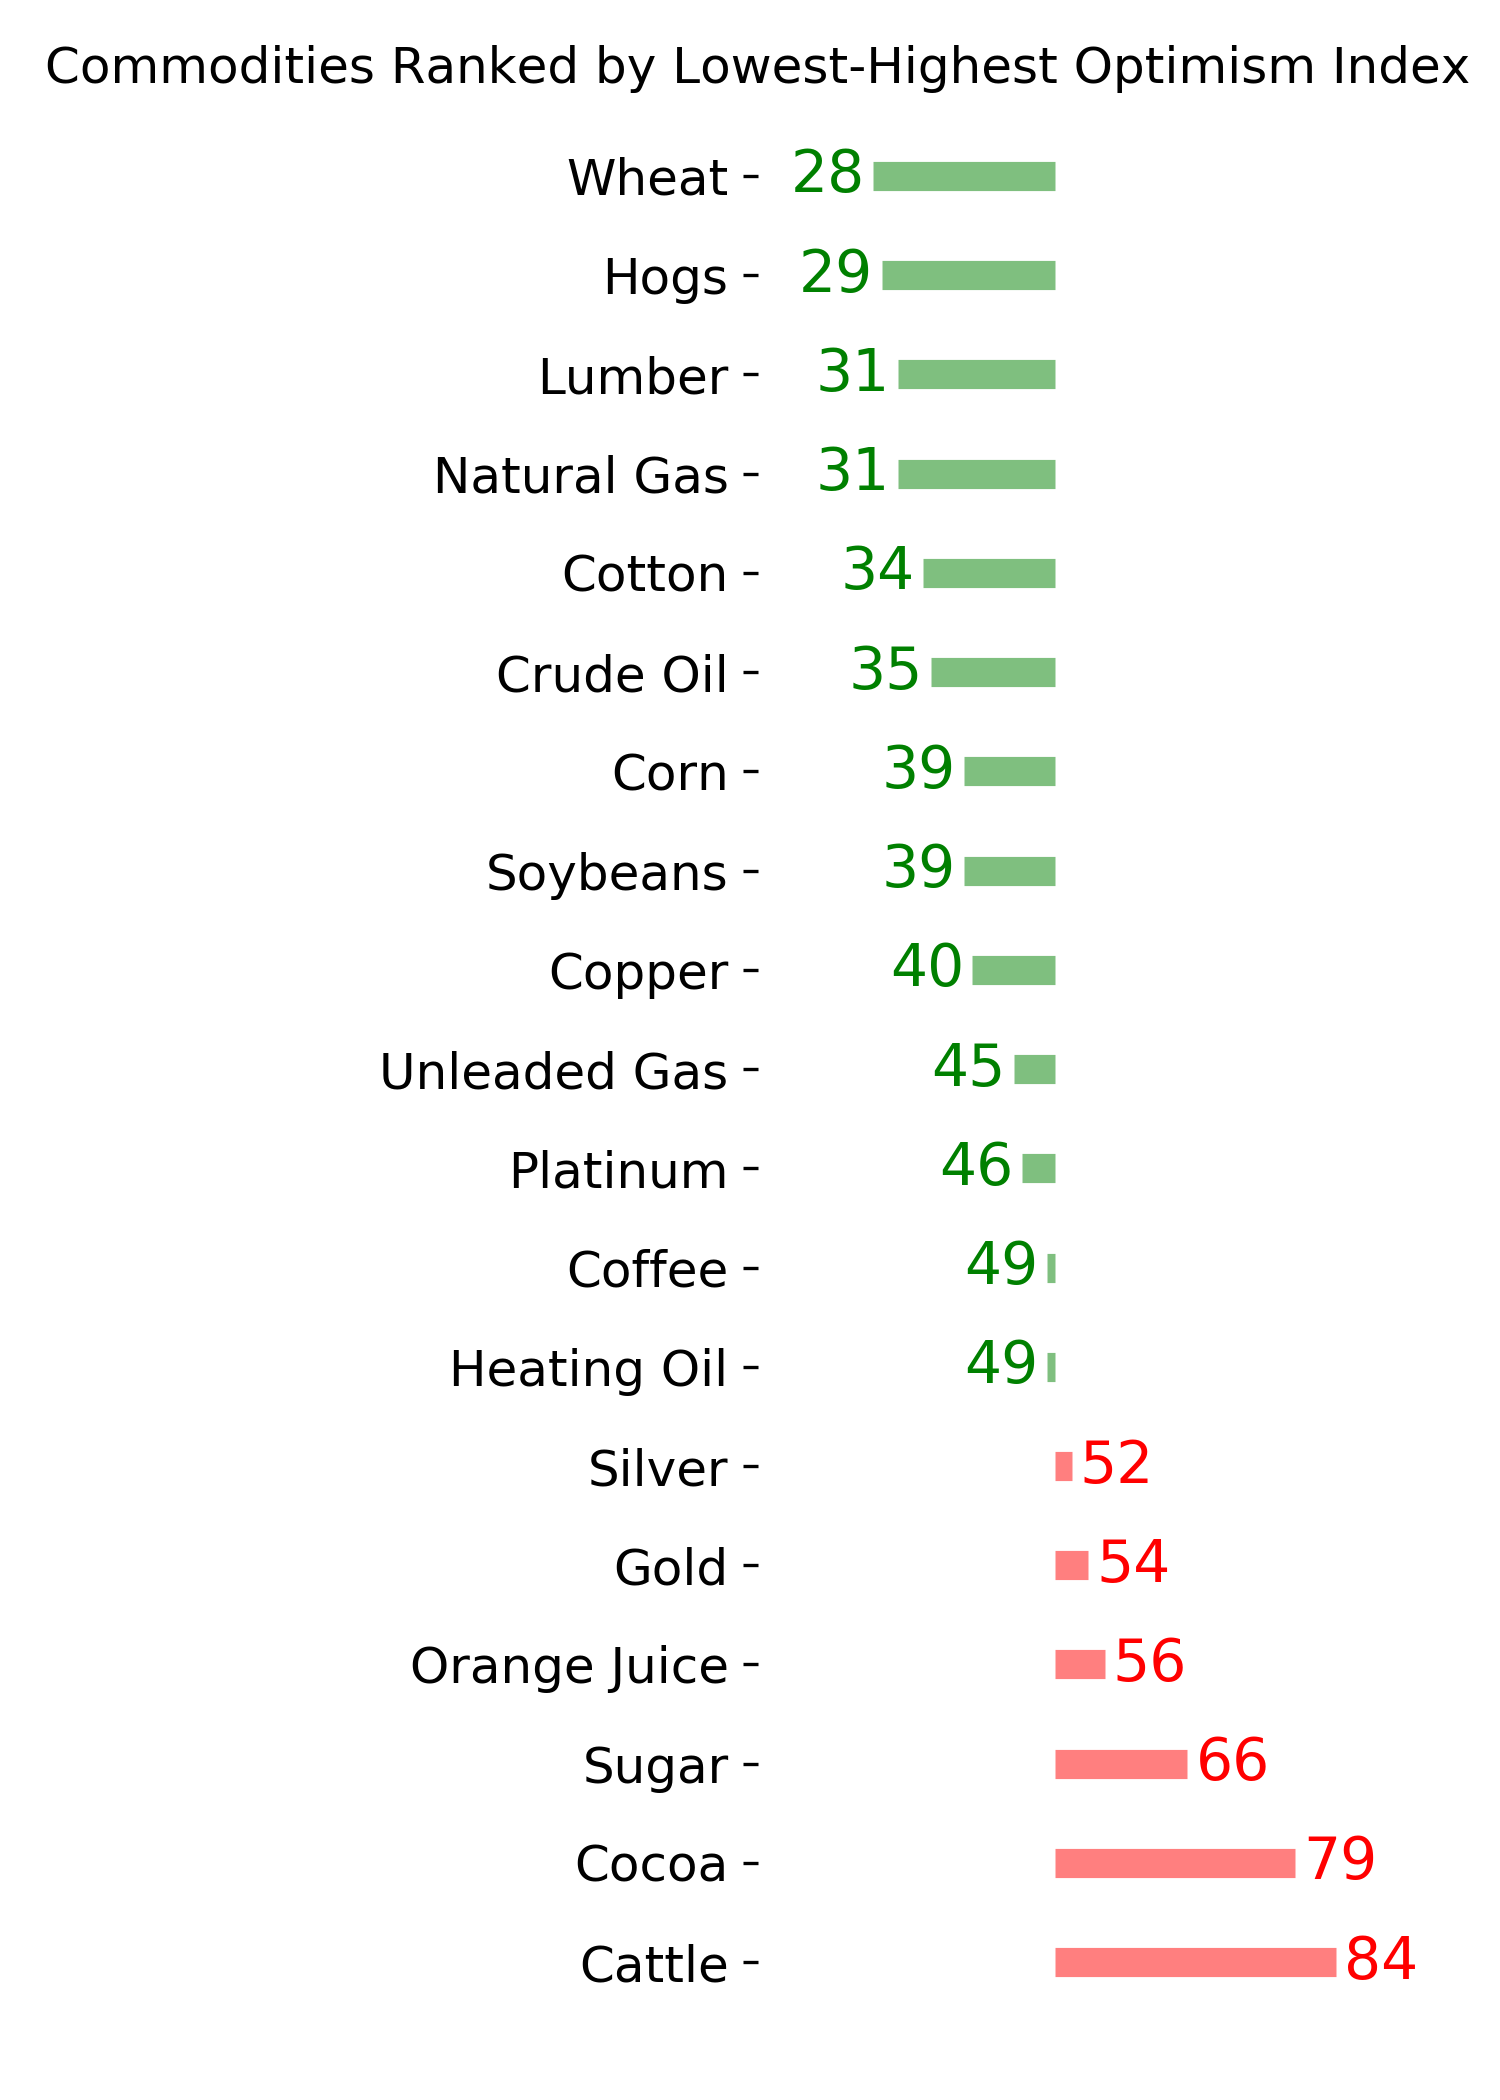
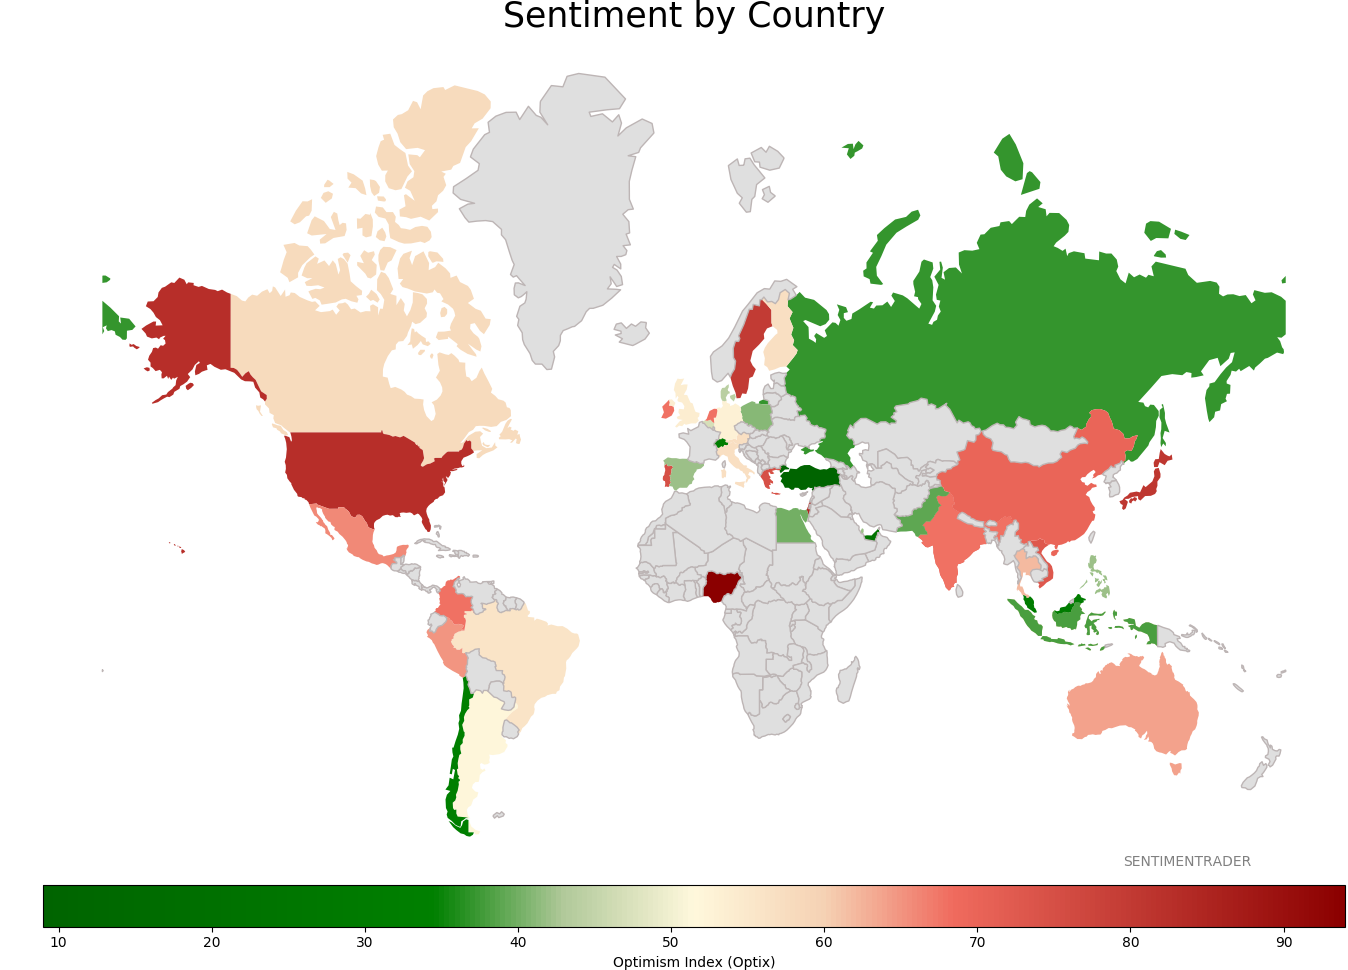
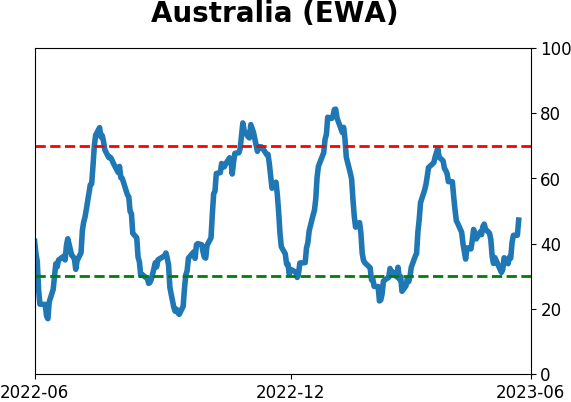
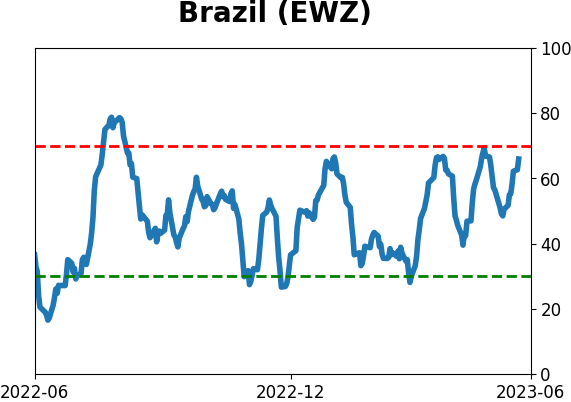
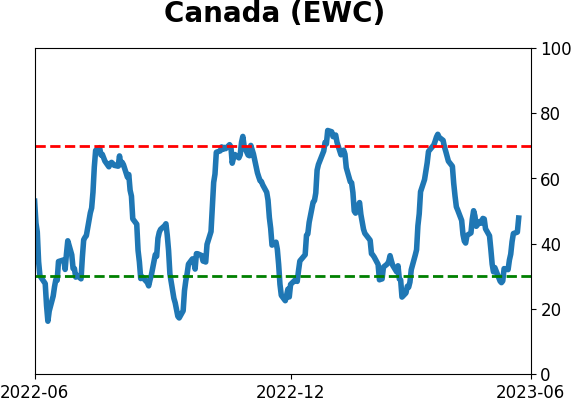
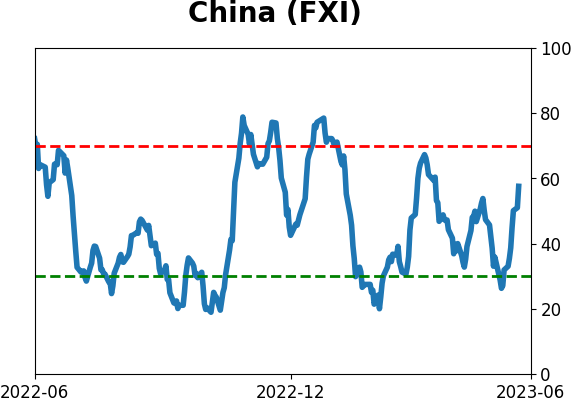
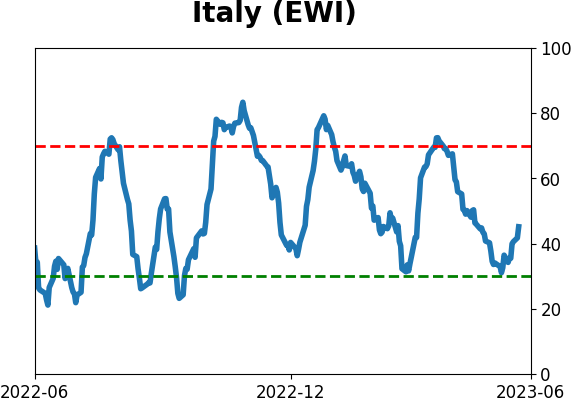
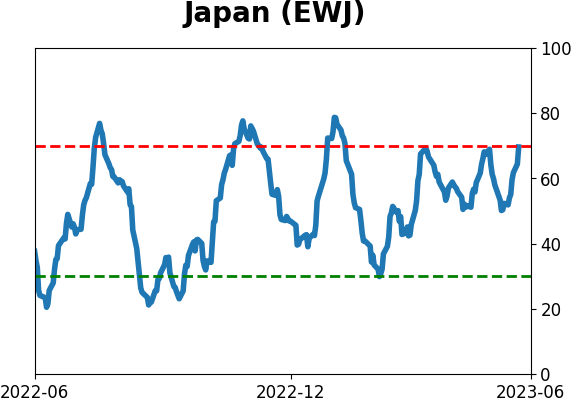
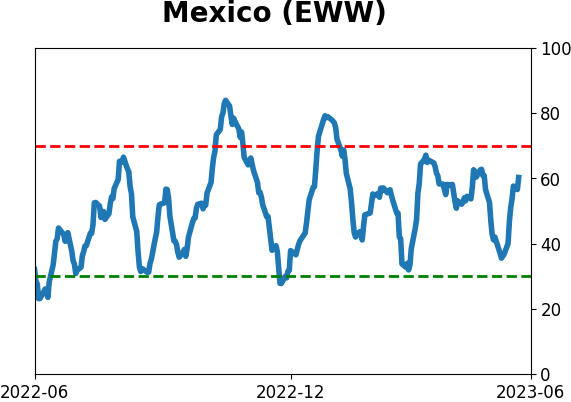
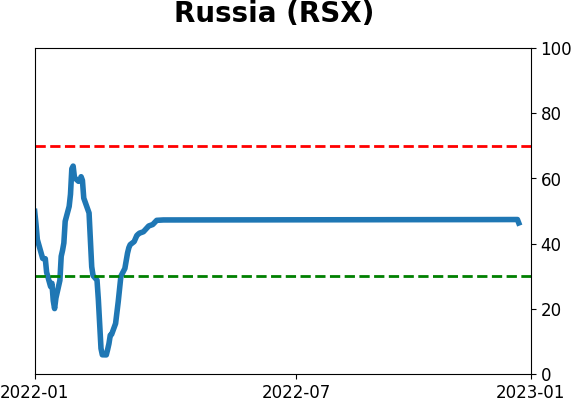
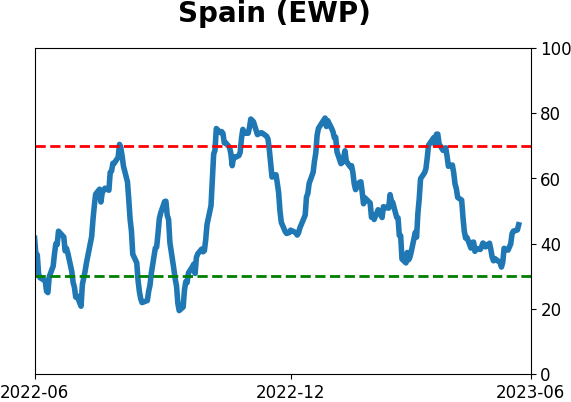
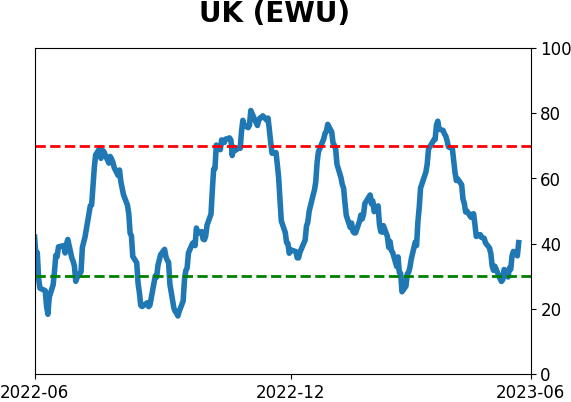
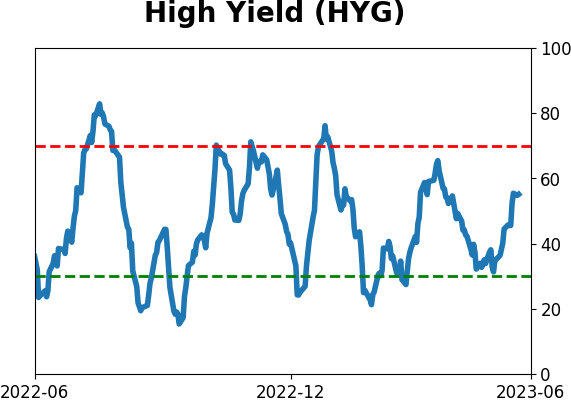
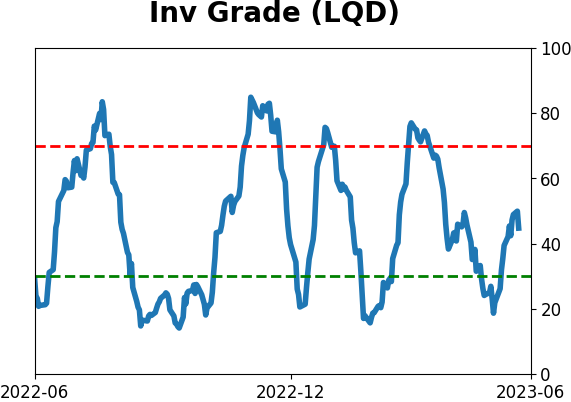
Sentiment Around The World
Optimism Index Thumbnails
|
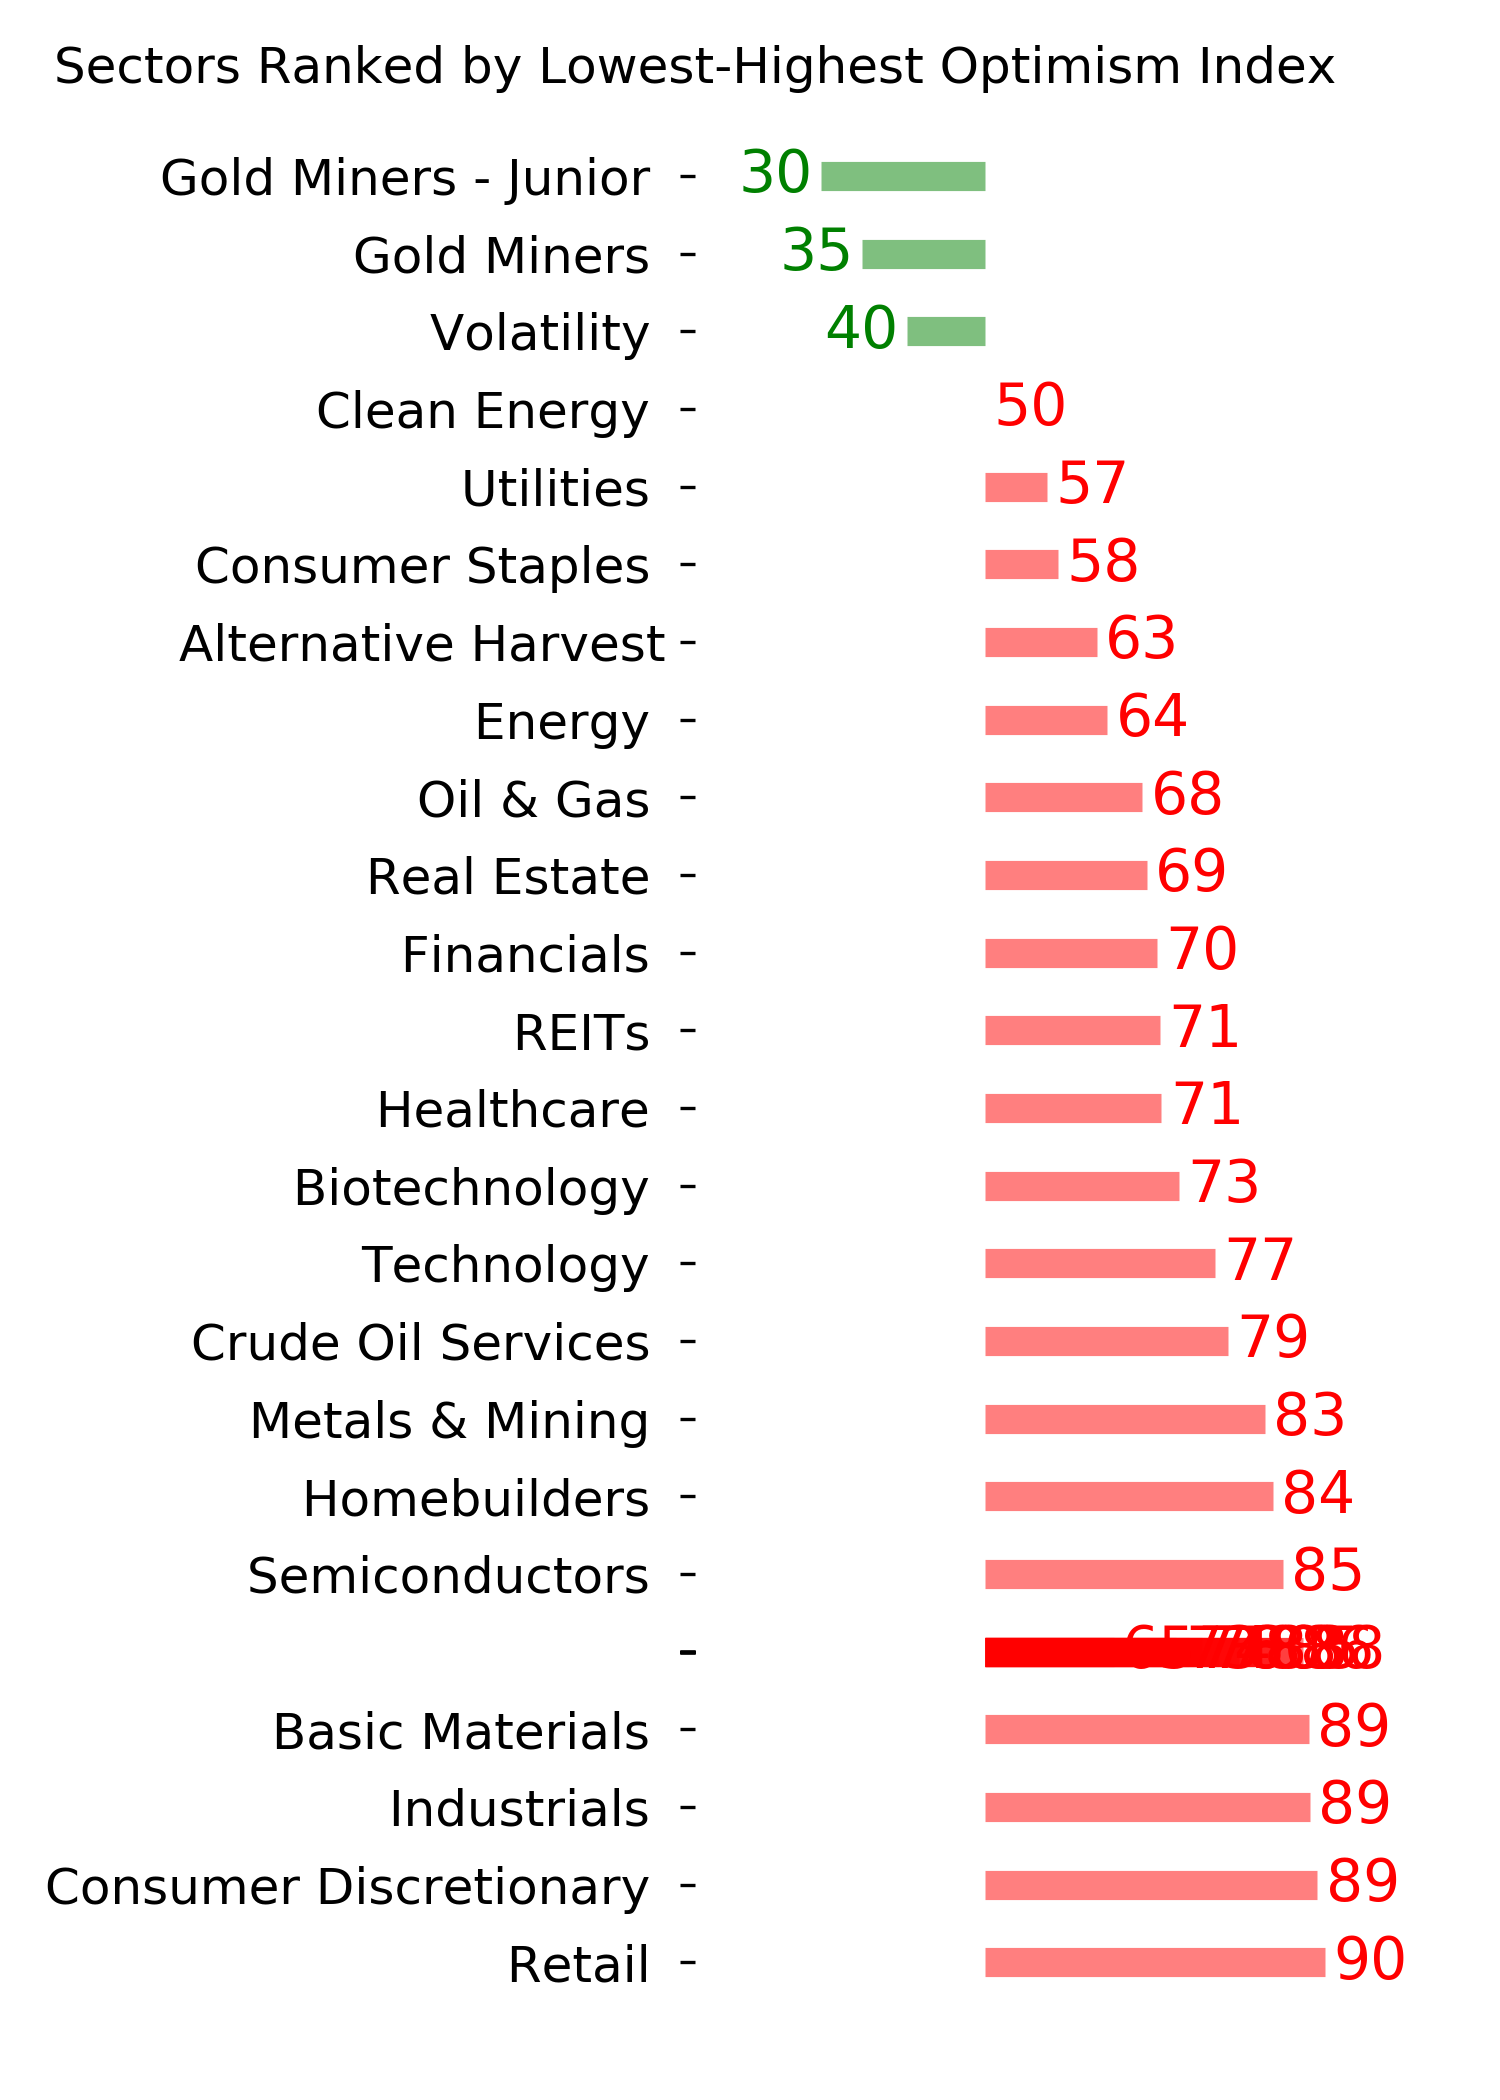
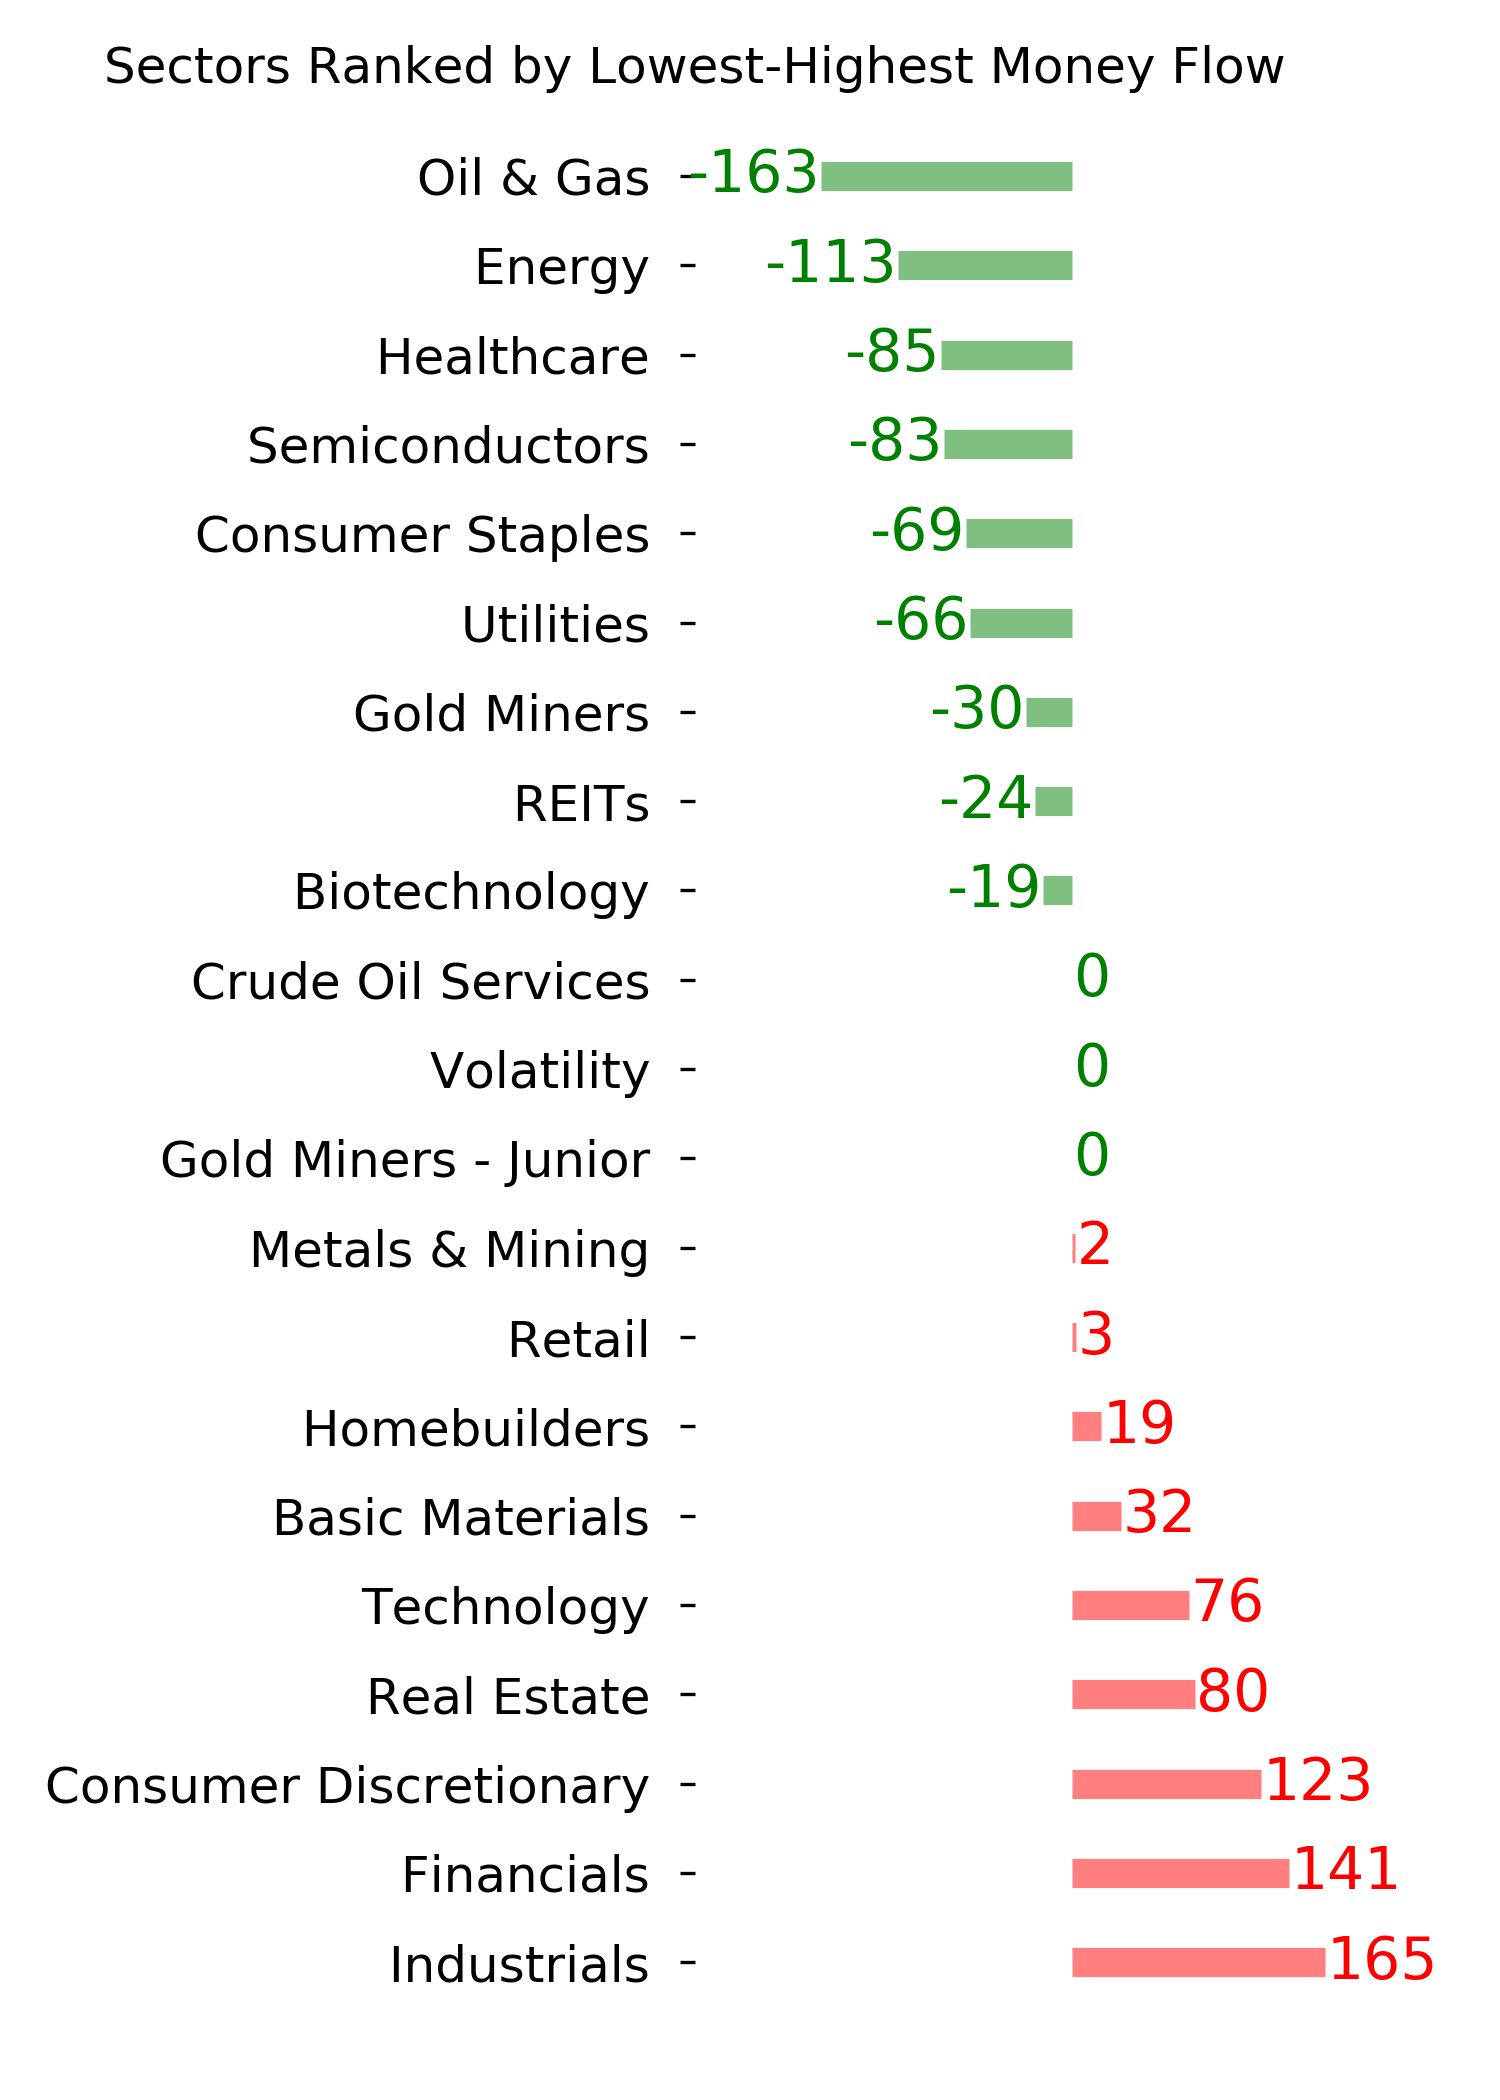
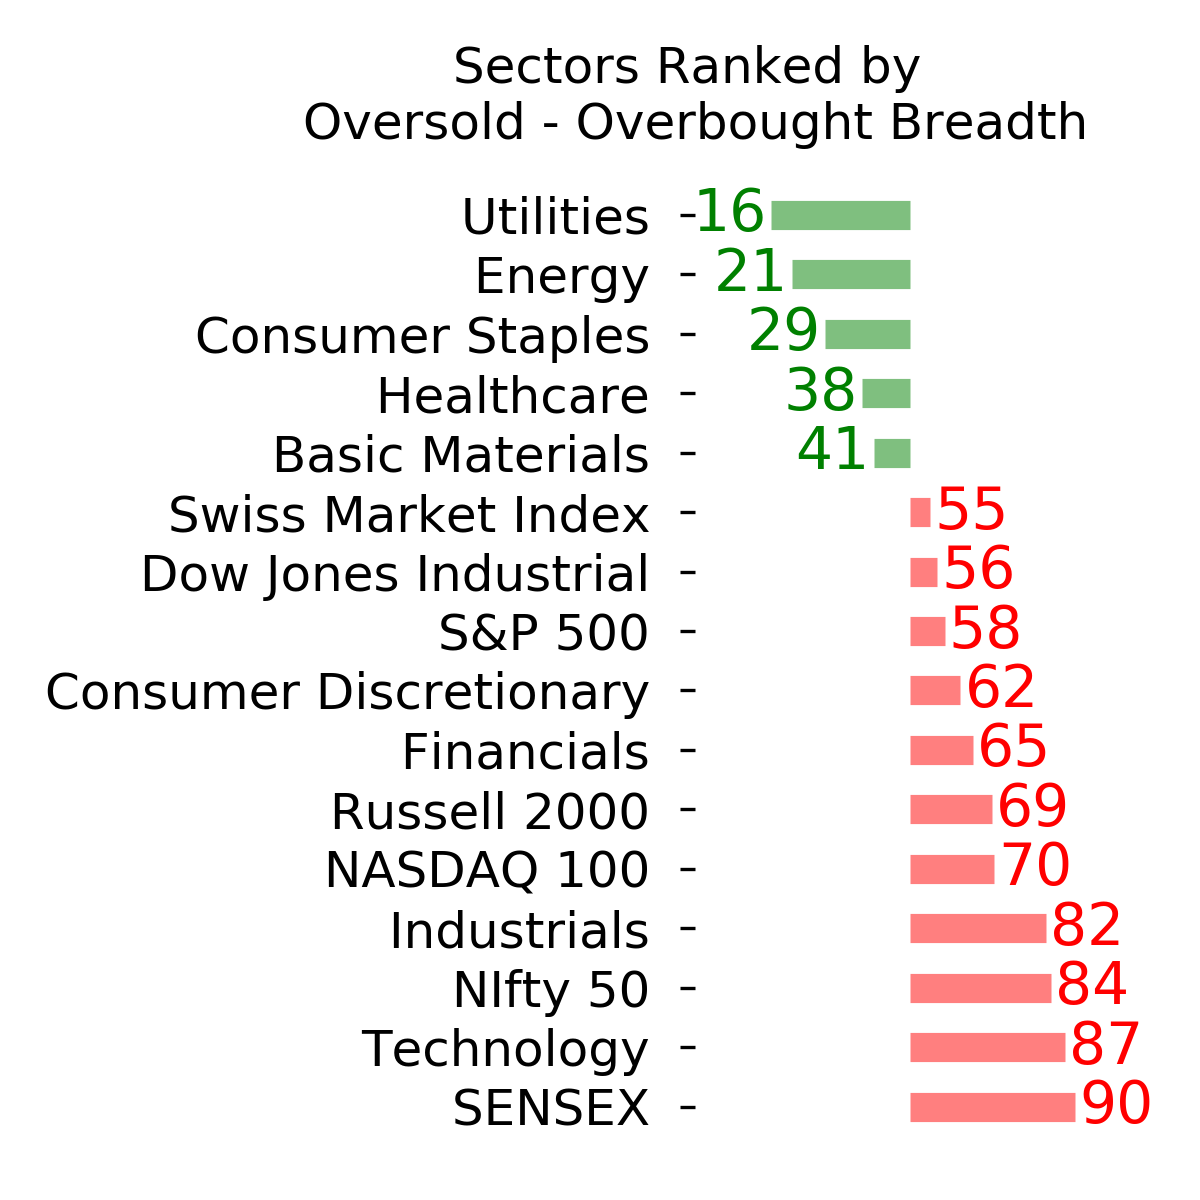
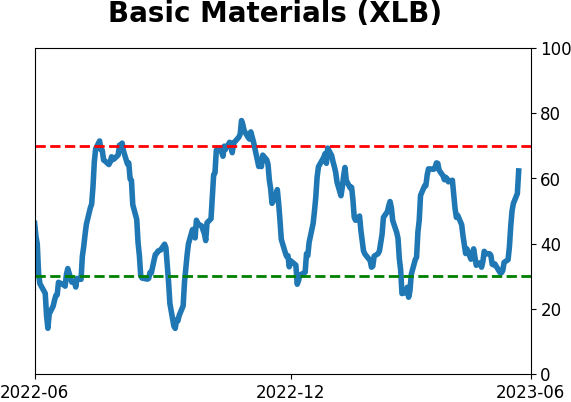
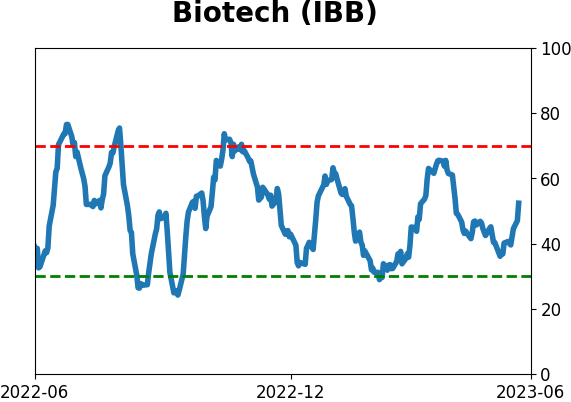
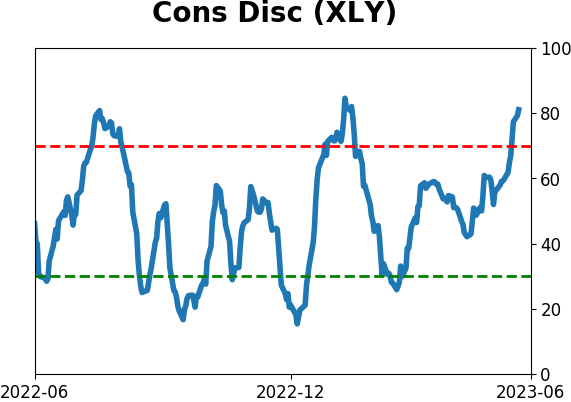
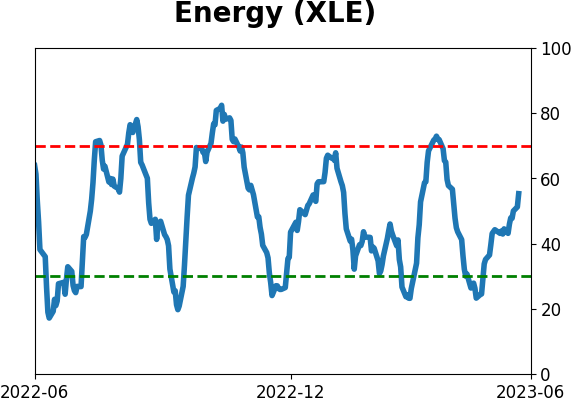
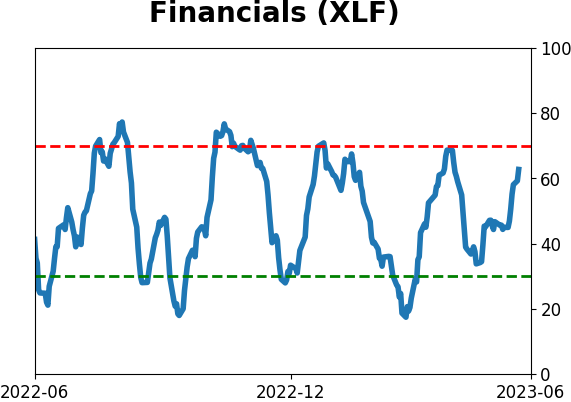
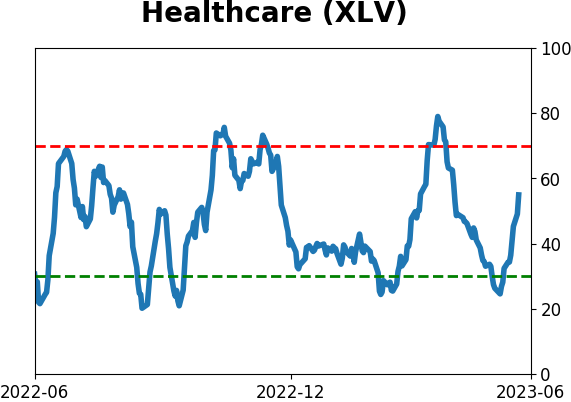
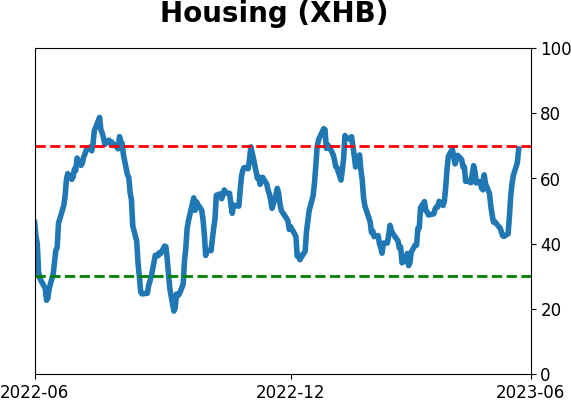
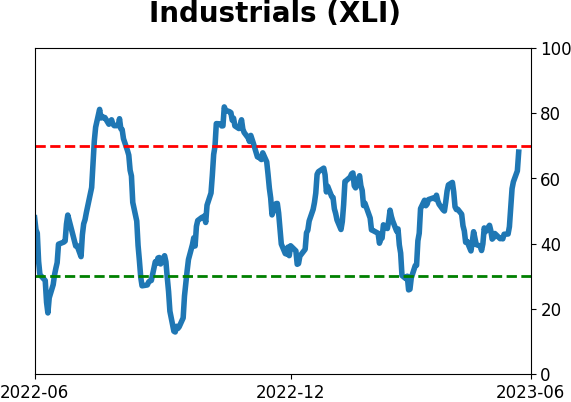
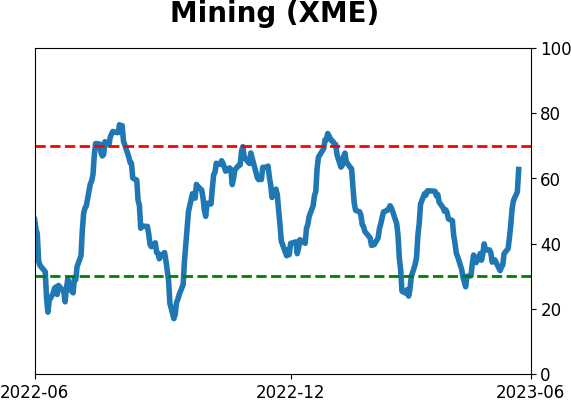
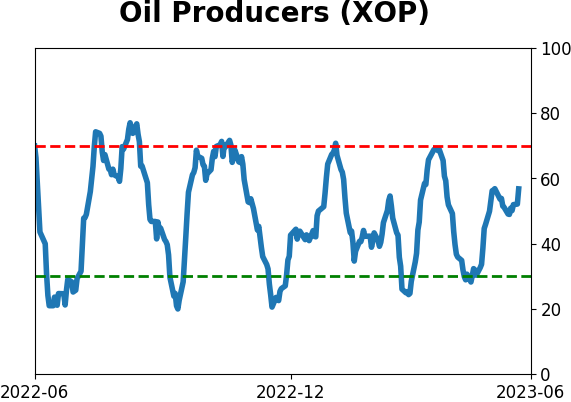
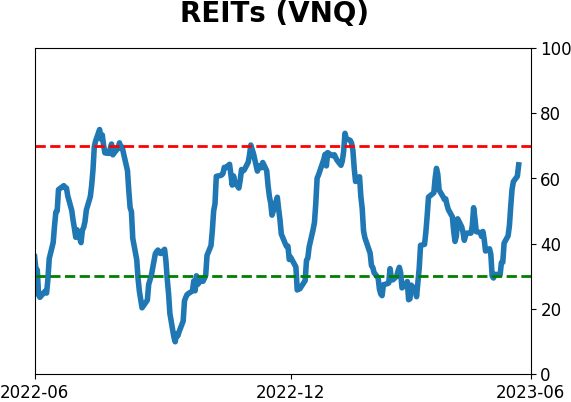
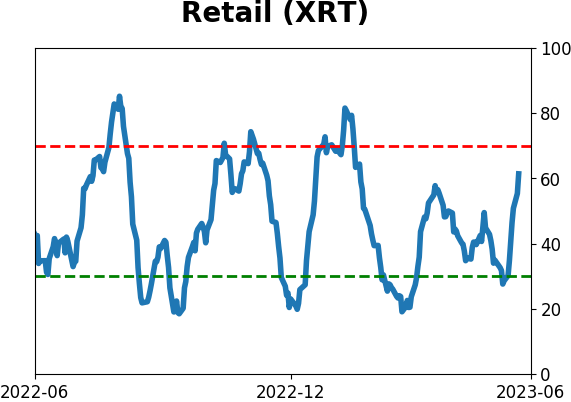
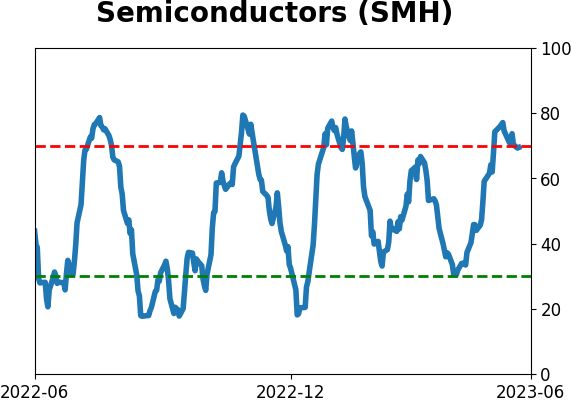
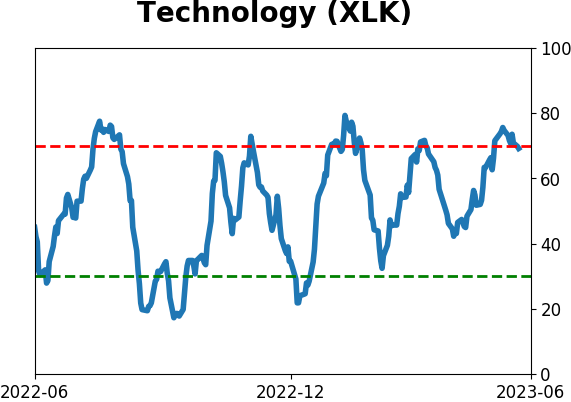
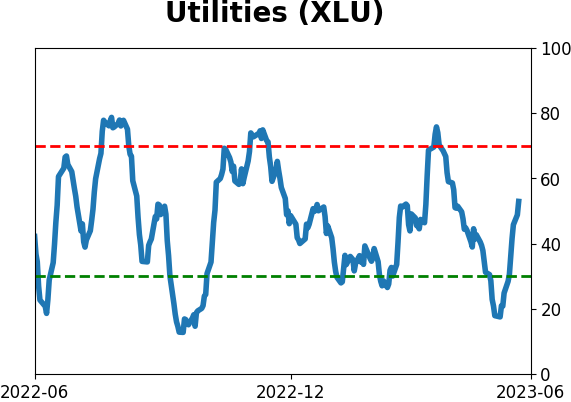
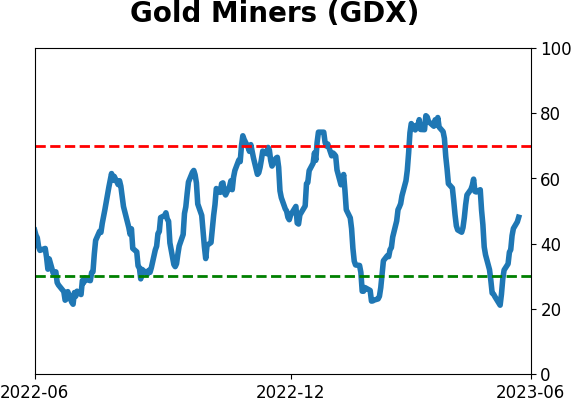
Sector ETF's - 10-Day Moving Average
|
|
|
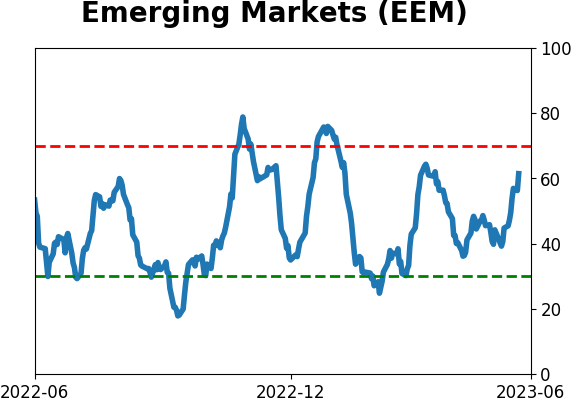
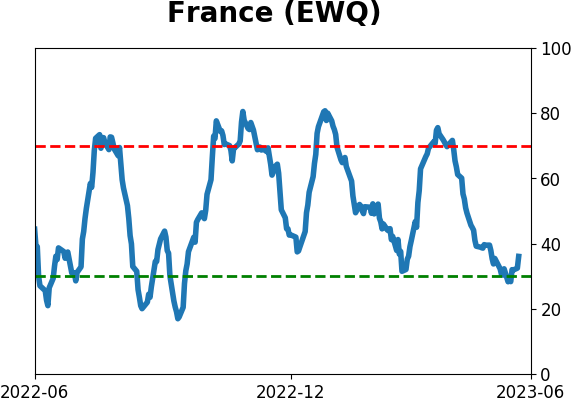
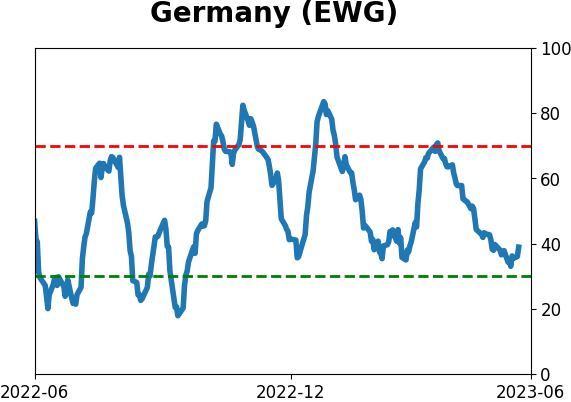
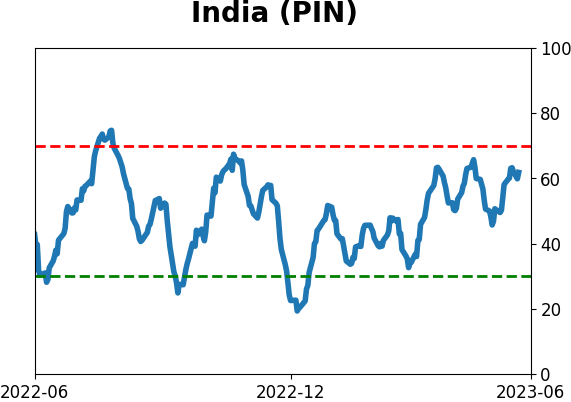
Country ETF's - 10-Day Moving Average
|
|
|
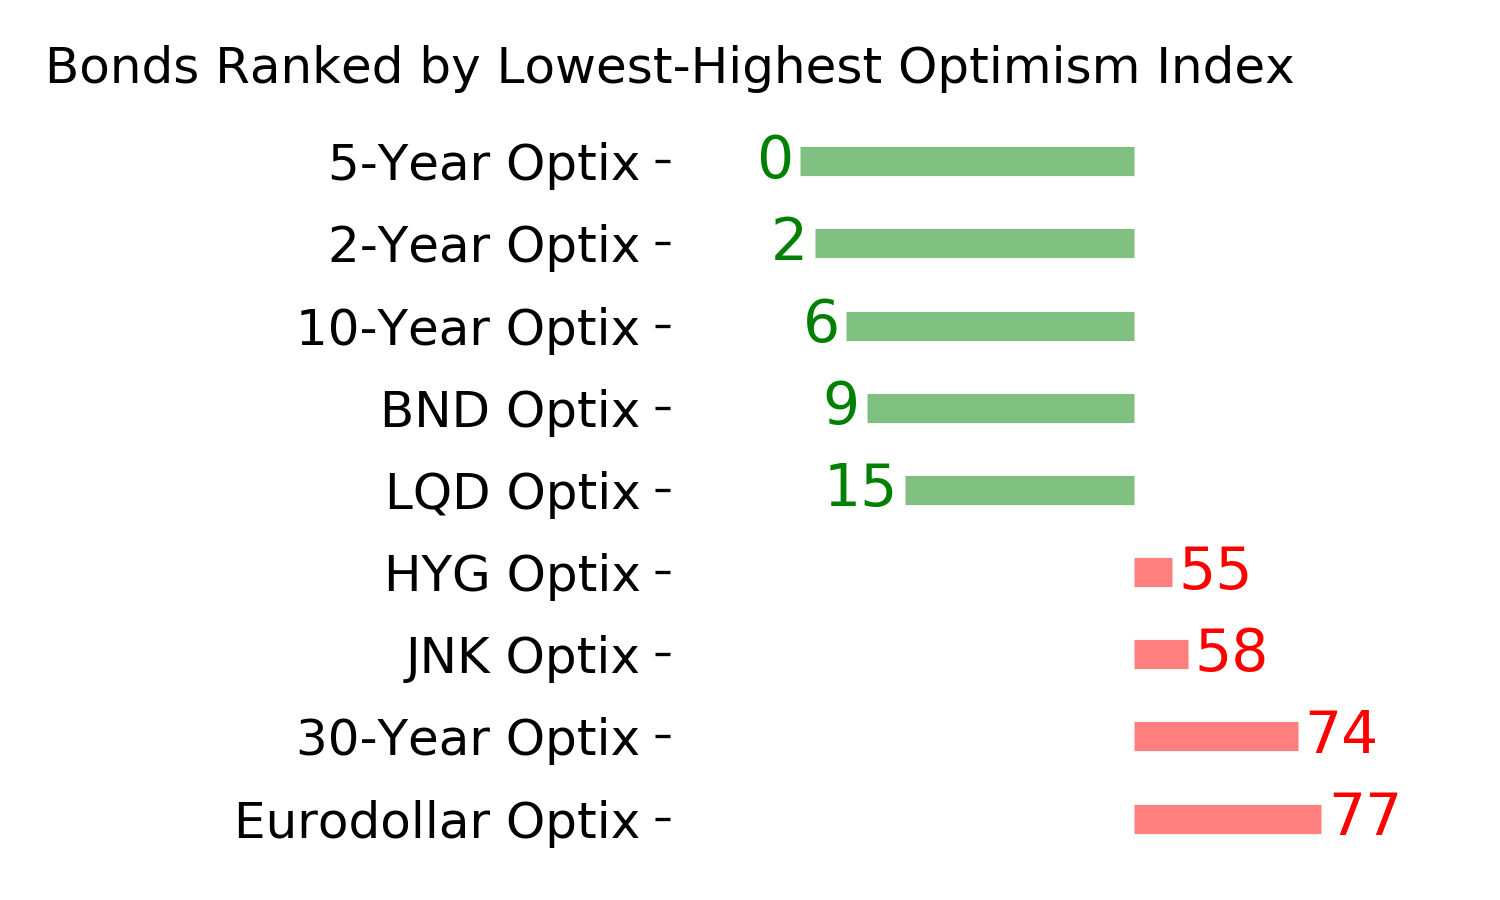
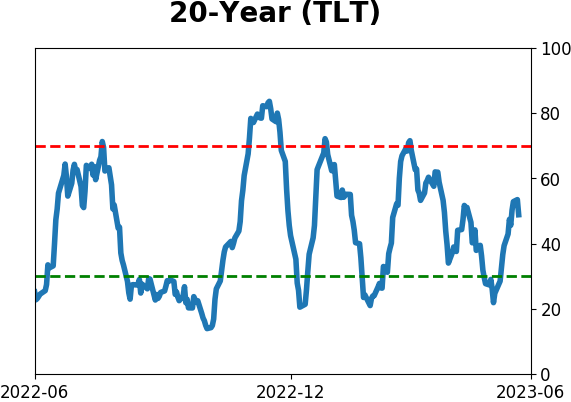
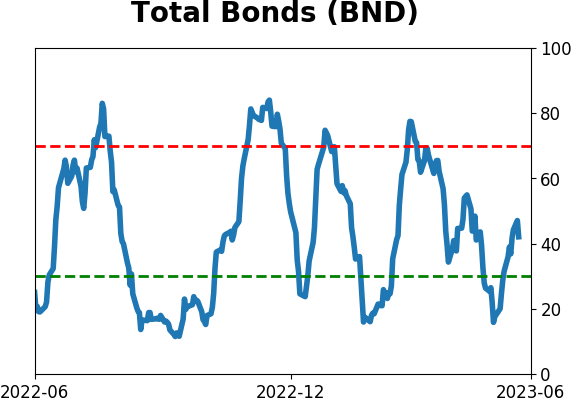
Bond ETF's - 10-Day Moving Average
|
|
|
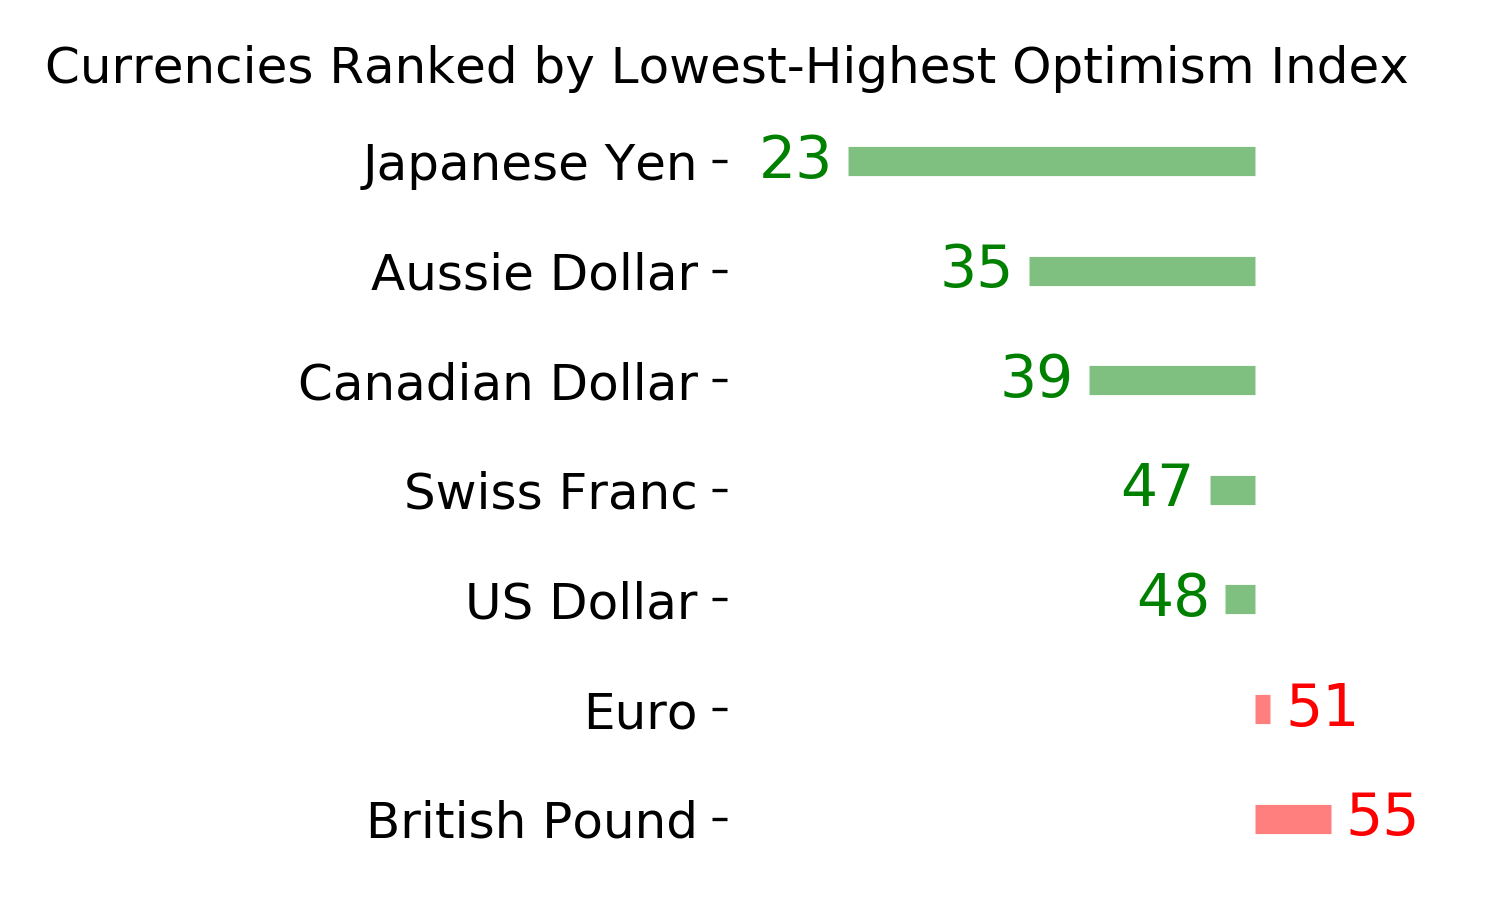
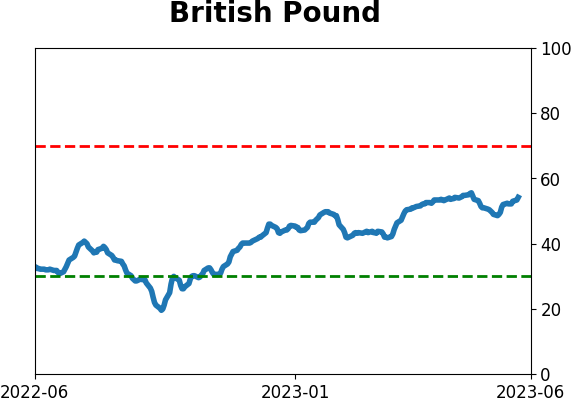
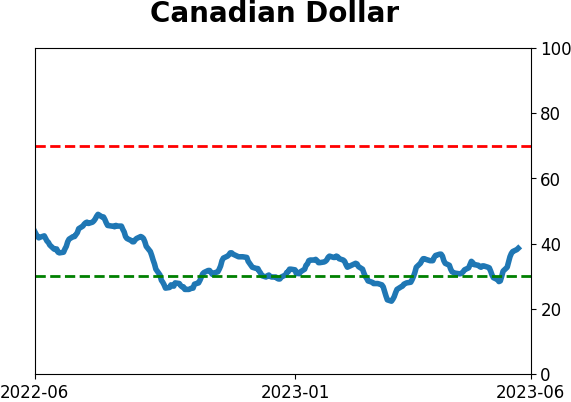
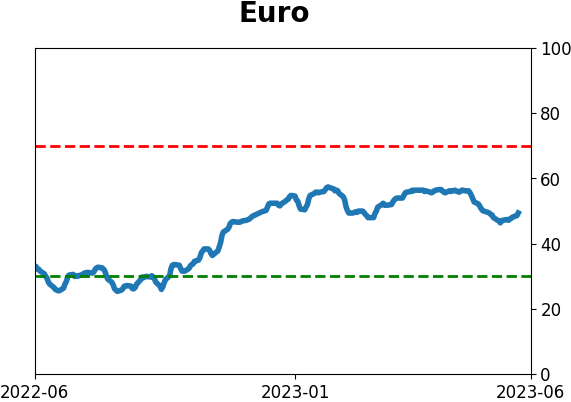
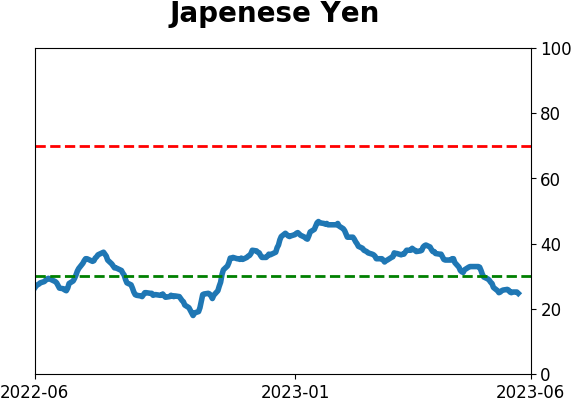
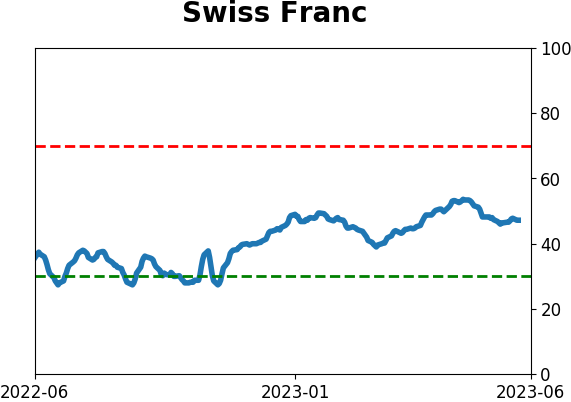
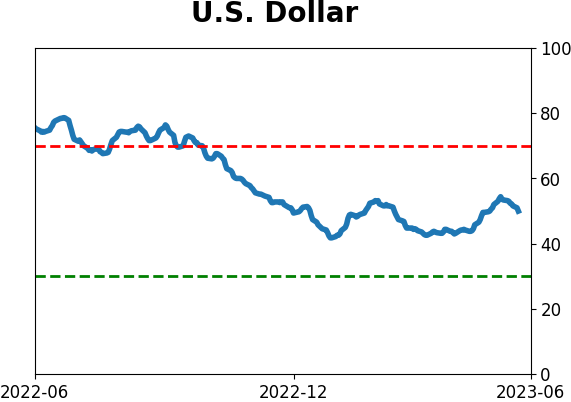
Currency ETF's - 5-Day Moving Average
|
|
|
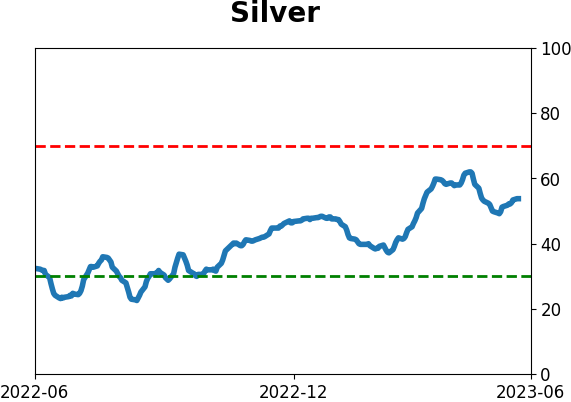
Commodity ETF's - 5-Day Moving Average
|
|