Headlines
|
|
Bear market behavior as relief rally fizzles:
The past few sessions have been horrid for investors, and the S&P 500 is on the cusp of a 3-day pattern that has only happened in bear markets. It has been the most prompt failure ever of at least a 7% relief rally, and it's something that Dumb Money had embraced. While this is discouraging price action, it has not necessarily led to protracted declines.
|
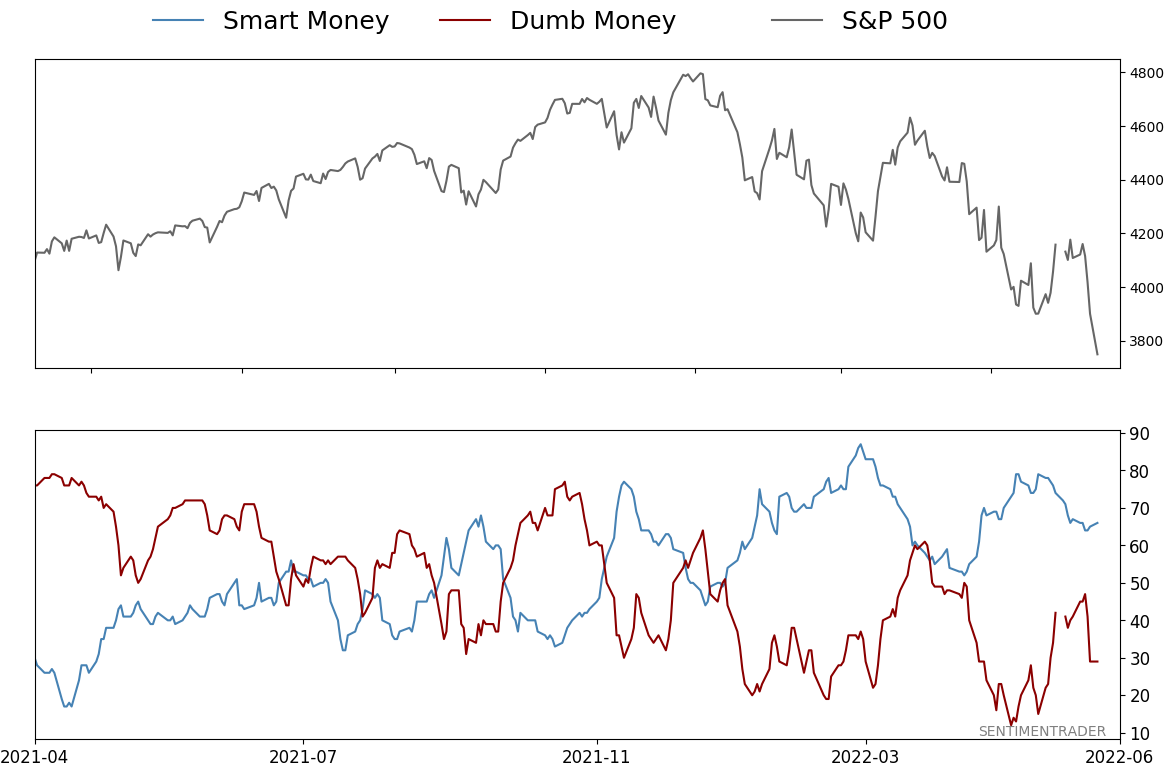
Smart / Dumb Money Confidence
|
Smart Money Confidence: 66%
Dumb Money Confidence: 29%
|
|
Risk Levels
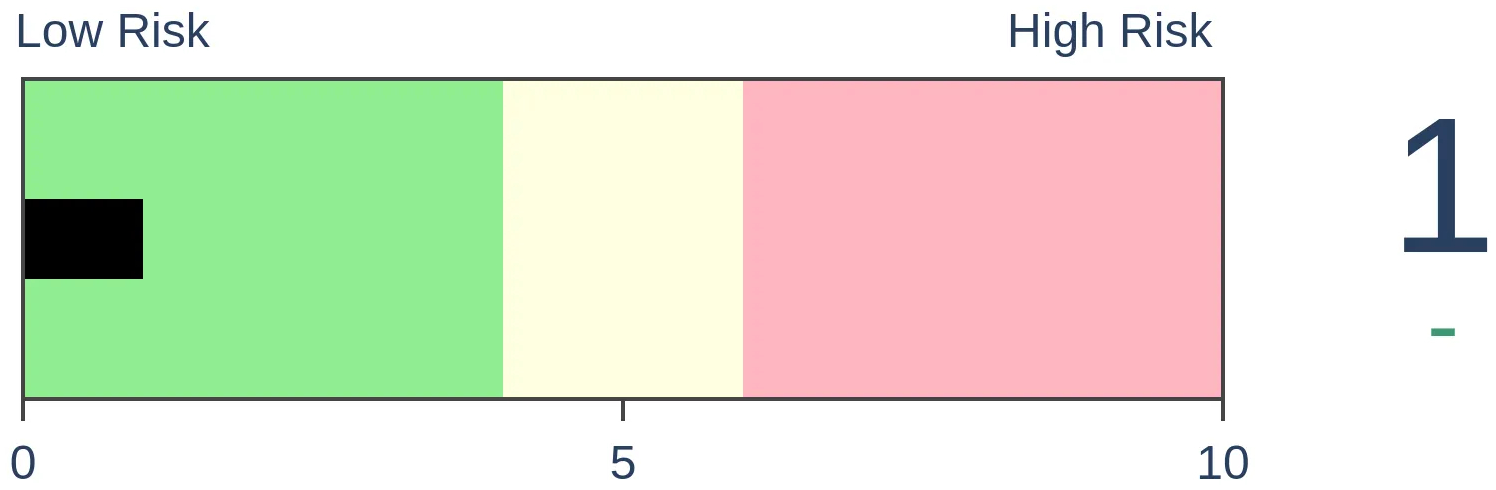
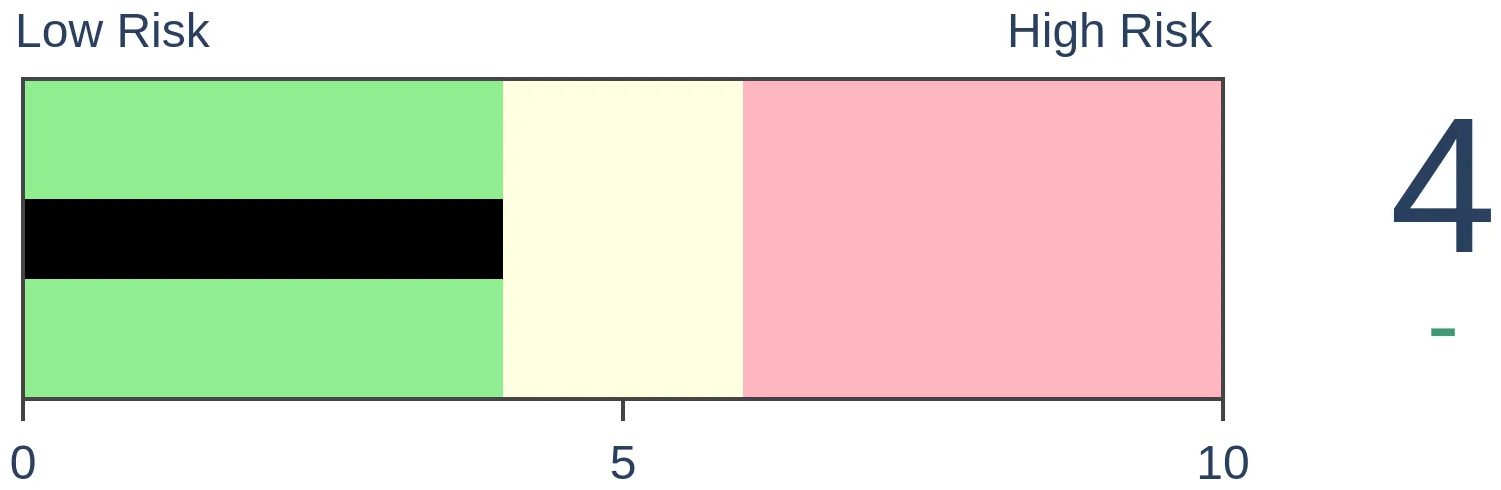
Stocks Short-Term
|
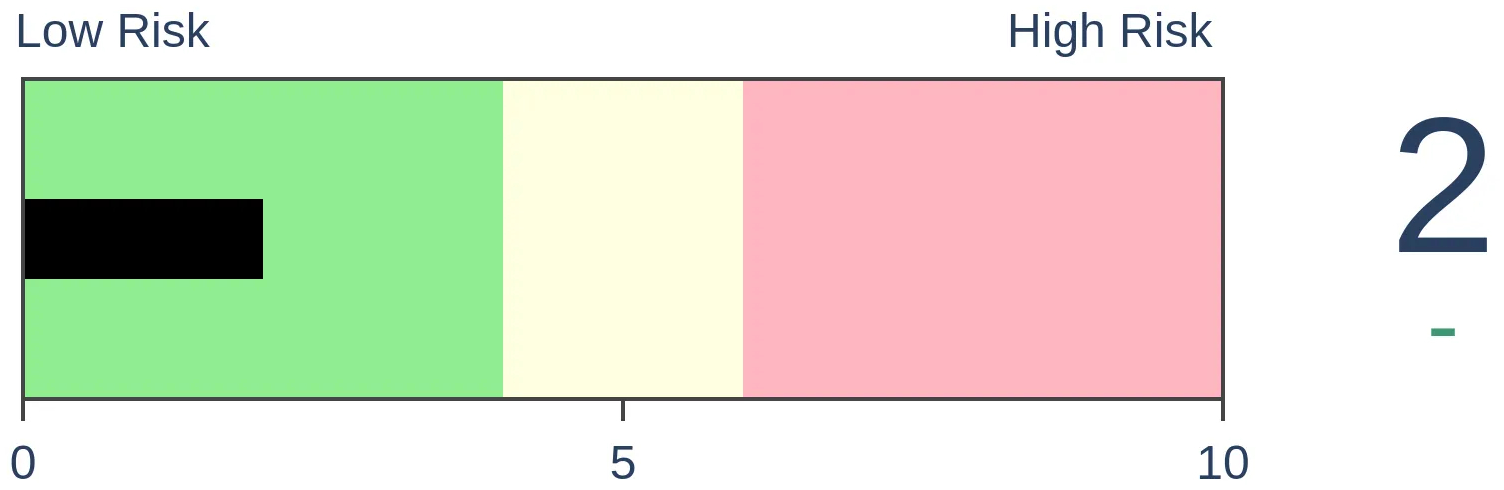
Stocks Medium-Term

|
|
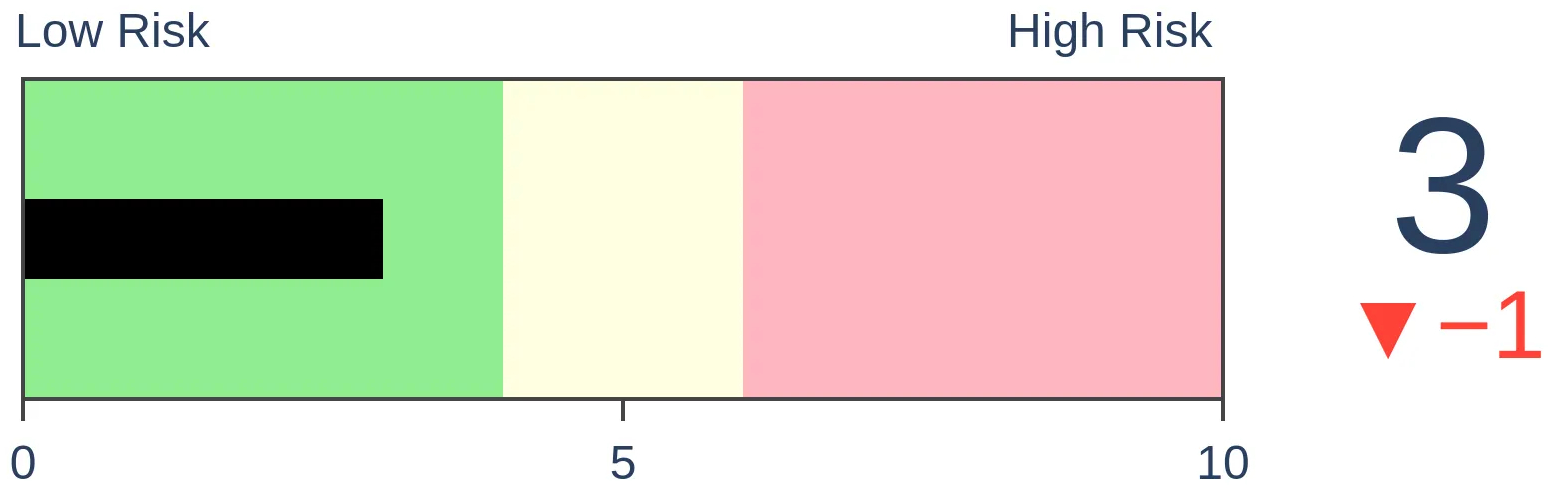
Bonds
|
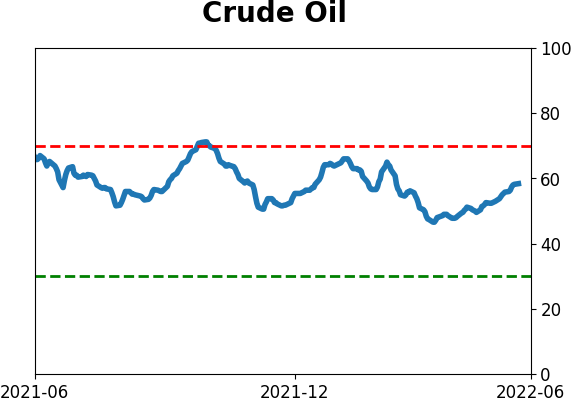
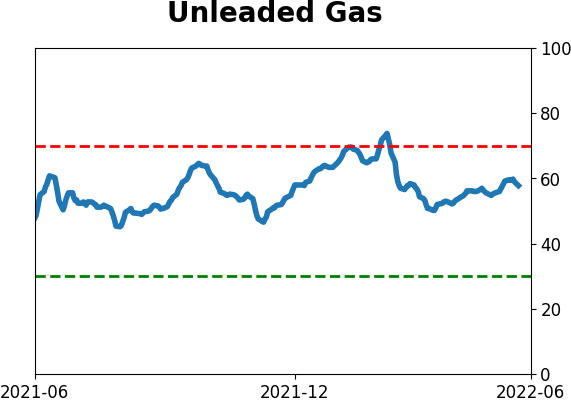
Crude Oil

|
|
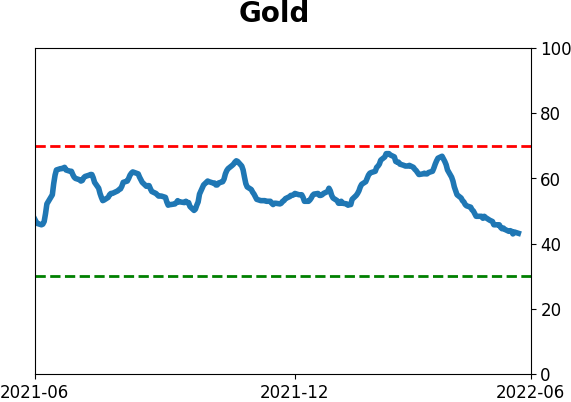
Gold
|
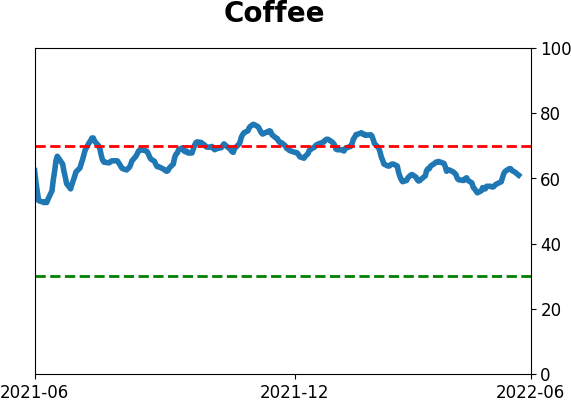
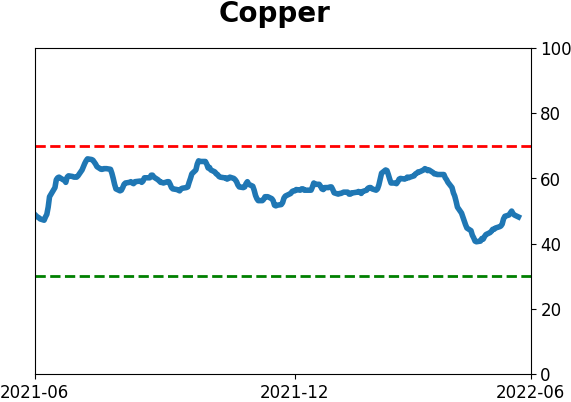
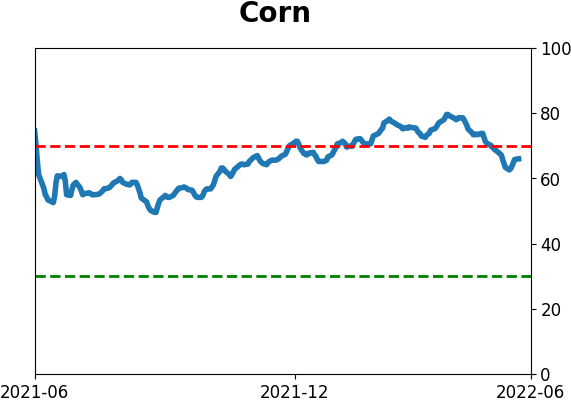
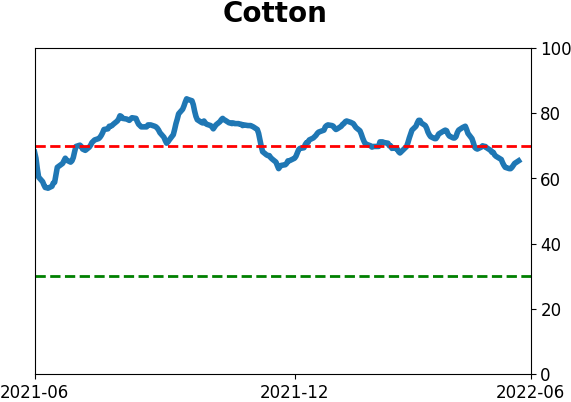
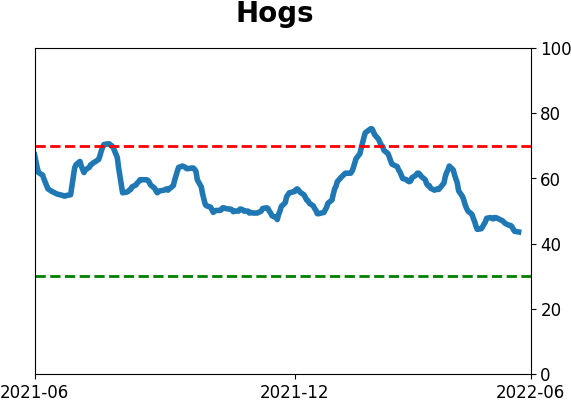
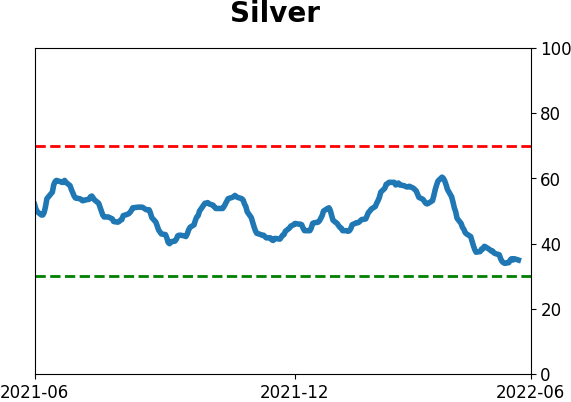
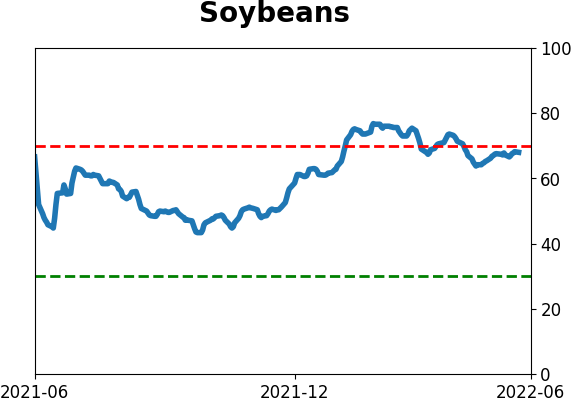
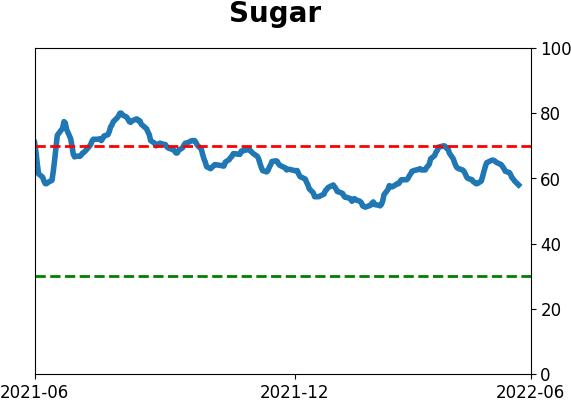
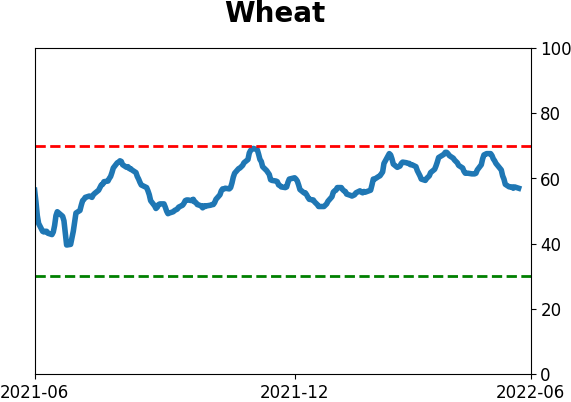
Agriculture
|
|
Research
By Jason Goepfert
BOTTOM LINE
The past few sessions have been horrid for investors, and the S&P 500 is on the cusp of a 3-day pattern that has only happened in bear markets. It has been the most prompt failure ever of at least a 7% relief rally, and it's something that Dumb Money had embraced. While this is discouraging price action, it has not necessarily led to protracted declines.
FORECAST / TIMEFRAME
None
|
Key points:
- Only during bear markets do we see selling pressure like the past several sessions in the S&P 500
- This has proved to be the first time the S&P has ever failed so quickly after a 7% relief rally
- Despite the weak rebound, Dumb Money Confidence has stayed above its prior extreme
- Prior instances did not necessarily lead to protracted declines
Only bear markets see selling like this
Well, this has been a kick in the pants for the bulls. After widespread evidence of washed-out sentiment, then a historically impressive buying thrust - one of the most consistently positive setups we ever see - prices are already back below their starting point.
The action since last Thursday has been horrific. This is being published well before the open on Monday, with S&P 500 futures indicated to open more than 2% below Friday's close. That's on the heels of back-to-back daily losses of more than 2%.
Since the inception of the futures, this has only happened in bear markets. Bulls might take a bit of solace because it also preceded snapbacks.
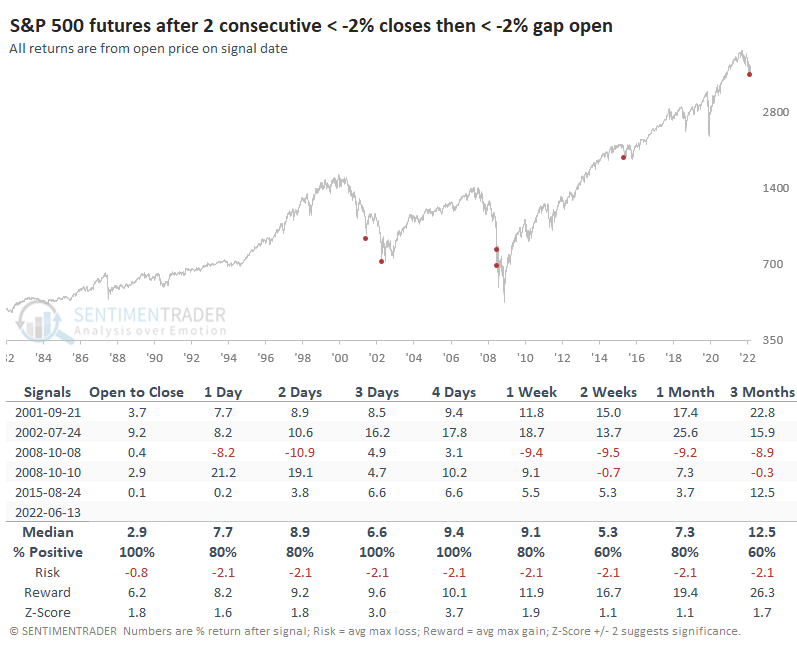
Failed rallies are hallmarks of bear markets, and this failure has been a doozy. It's extremely rare to see price action like this, especially after a thrust like investors enjoyed in recent weeks.
After going 15 trading days from its most recent 52-week low and rallying at least 7% during that time, the S&P 500 is right back to its starting point (and will be below there if Monday sees losses). Never before in its history has it done such a quick round-trip after rallying at least 7% from a low.
Again, some solace for bulls - this wasn't necessarily a hallmark of protracted bear markets. The next couple of weeks tended to show losses, and even three months later, there were more losses than gains. Still, S&P was higher a year later each time and with impressive returns.
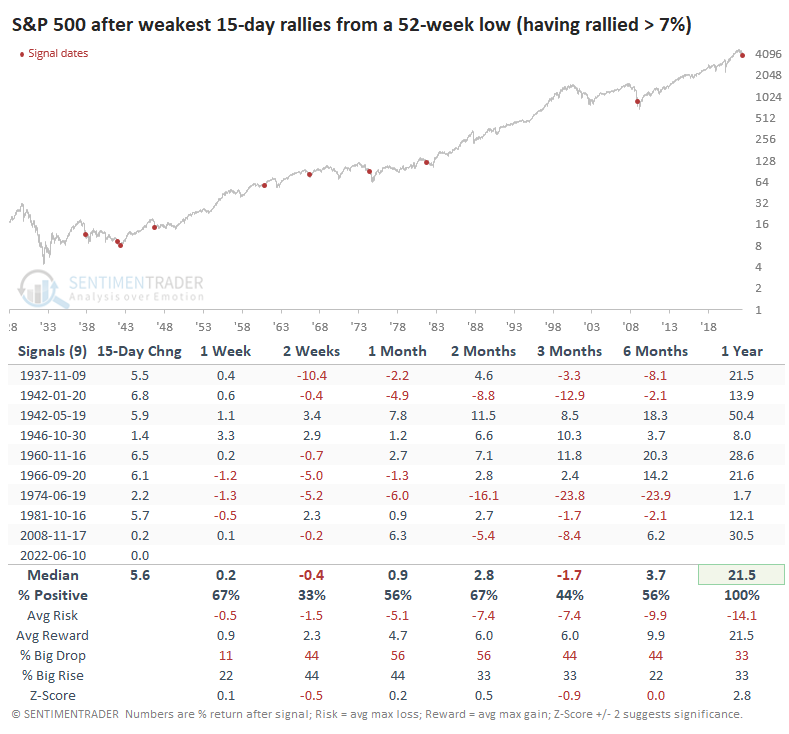
The converse was also true - just because the S&P enjoyed a super-strong 15-day rally from a low didn't mean that it had staying power.
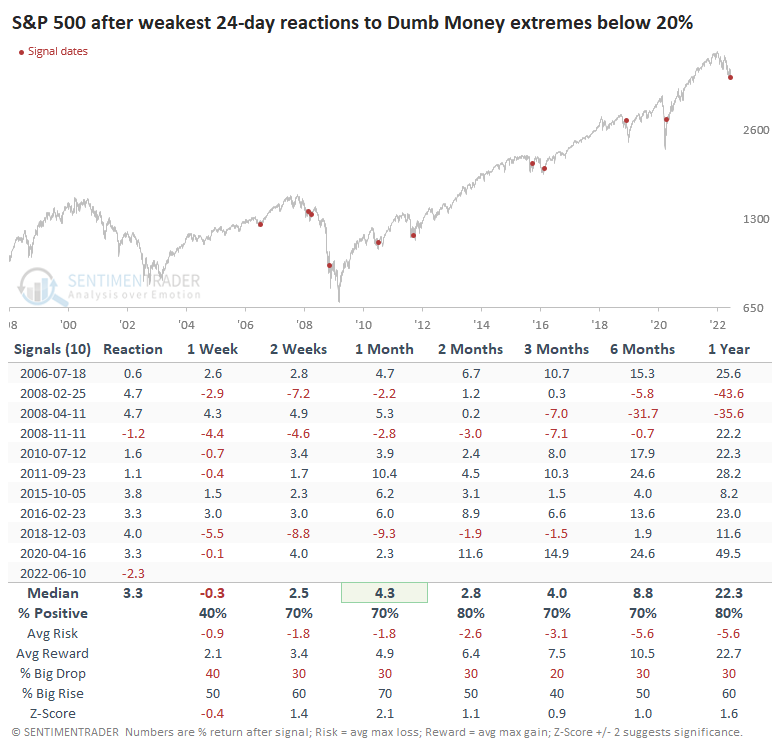
An unjustified rebound in Dumb Money Confidence
Investors embraced the relief rally, and Dumb Money Confidence rebounded. Dumb Money dipped below 20% in March, and stocks soared over the next few weeks, but that strong counter-reaction immediately failed. This time, the reaction has been far weaker, and stocks are back to where they were when sentiment was much more pessimistic.
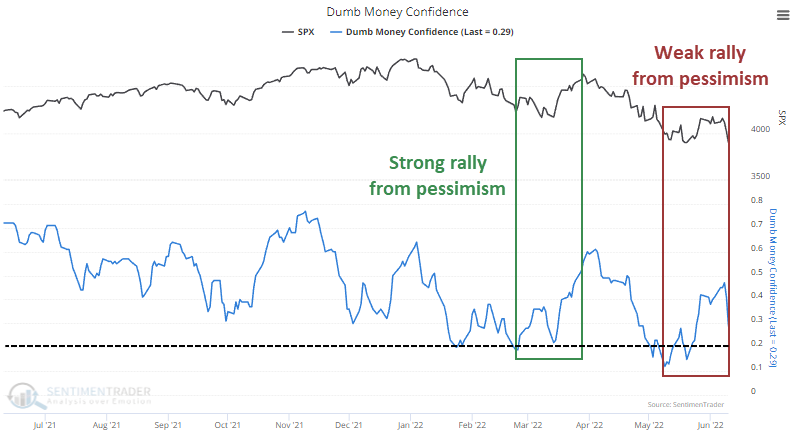
When Dumb Money gets more confident, but prices barely moved, it wasn't necessarily a terrible sign. It happened a couple of times in early 2008, which proved to be a good heads-up that there were outside forces about to overwhelm any sentiment extremes. It also preceded a wicked (but short-lived) drop in late 2018. But the others led to gains.
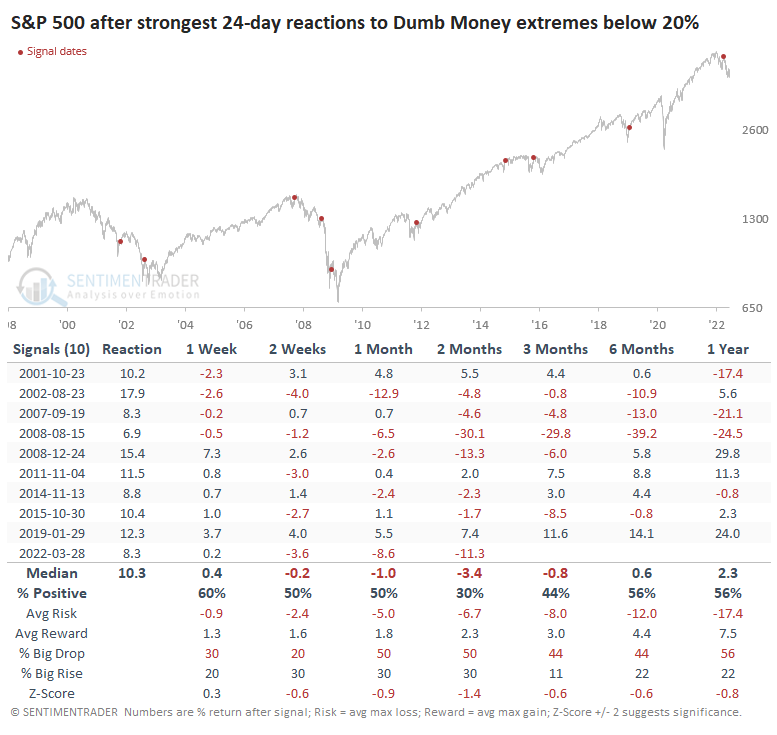
And, conversely, a big rebound off a low Dumb Money Confidence reading didn't mean a low was at hand. When the S&P 500 had the strongest 24-day reactions from a pessimistic extreme, it consistently showed losses in the months ahead.
What the research tells us...
There is no doubt that this is discouraging price action. Investors have shown zero interest in following through on prior extremes and subsequent buying thrusts, which is the most discouraging of all. It is the gold standard for bear market behavior. Now that we're on the cusp of lower lows, there is no reason to expect relief because everything is failing. For buyers, it is a hazardous time without a lot of support. For existing holders, it becomes a more difficult question about risk tolerance, especially since an objective look at previous failed rallies does not give a clear picture of whether the selling is likely to persist.
Indicators at Extremes
Phase Table
Ranks
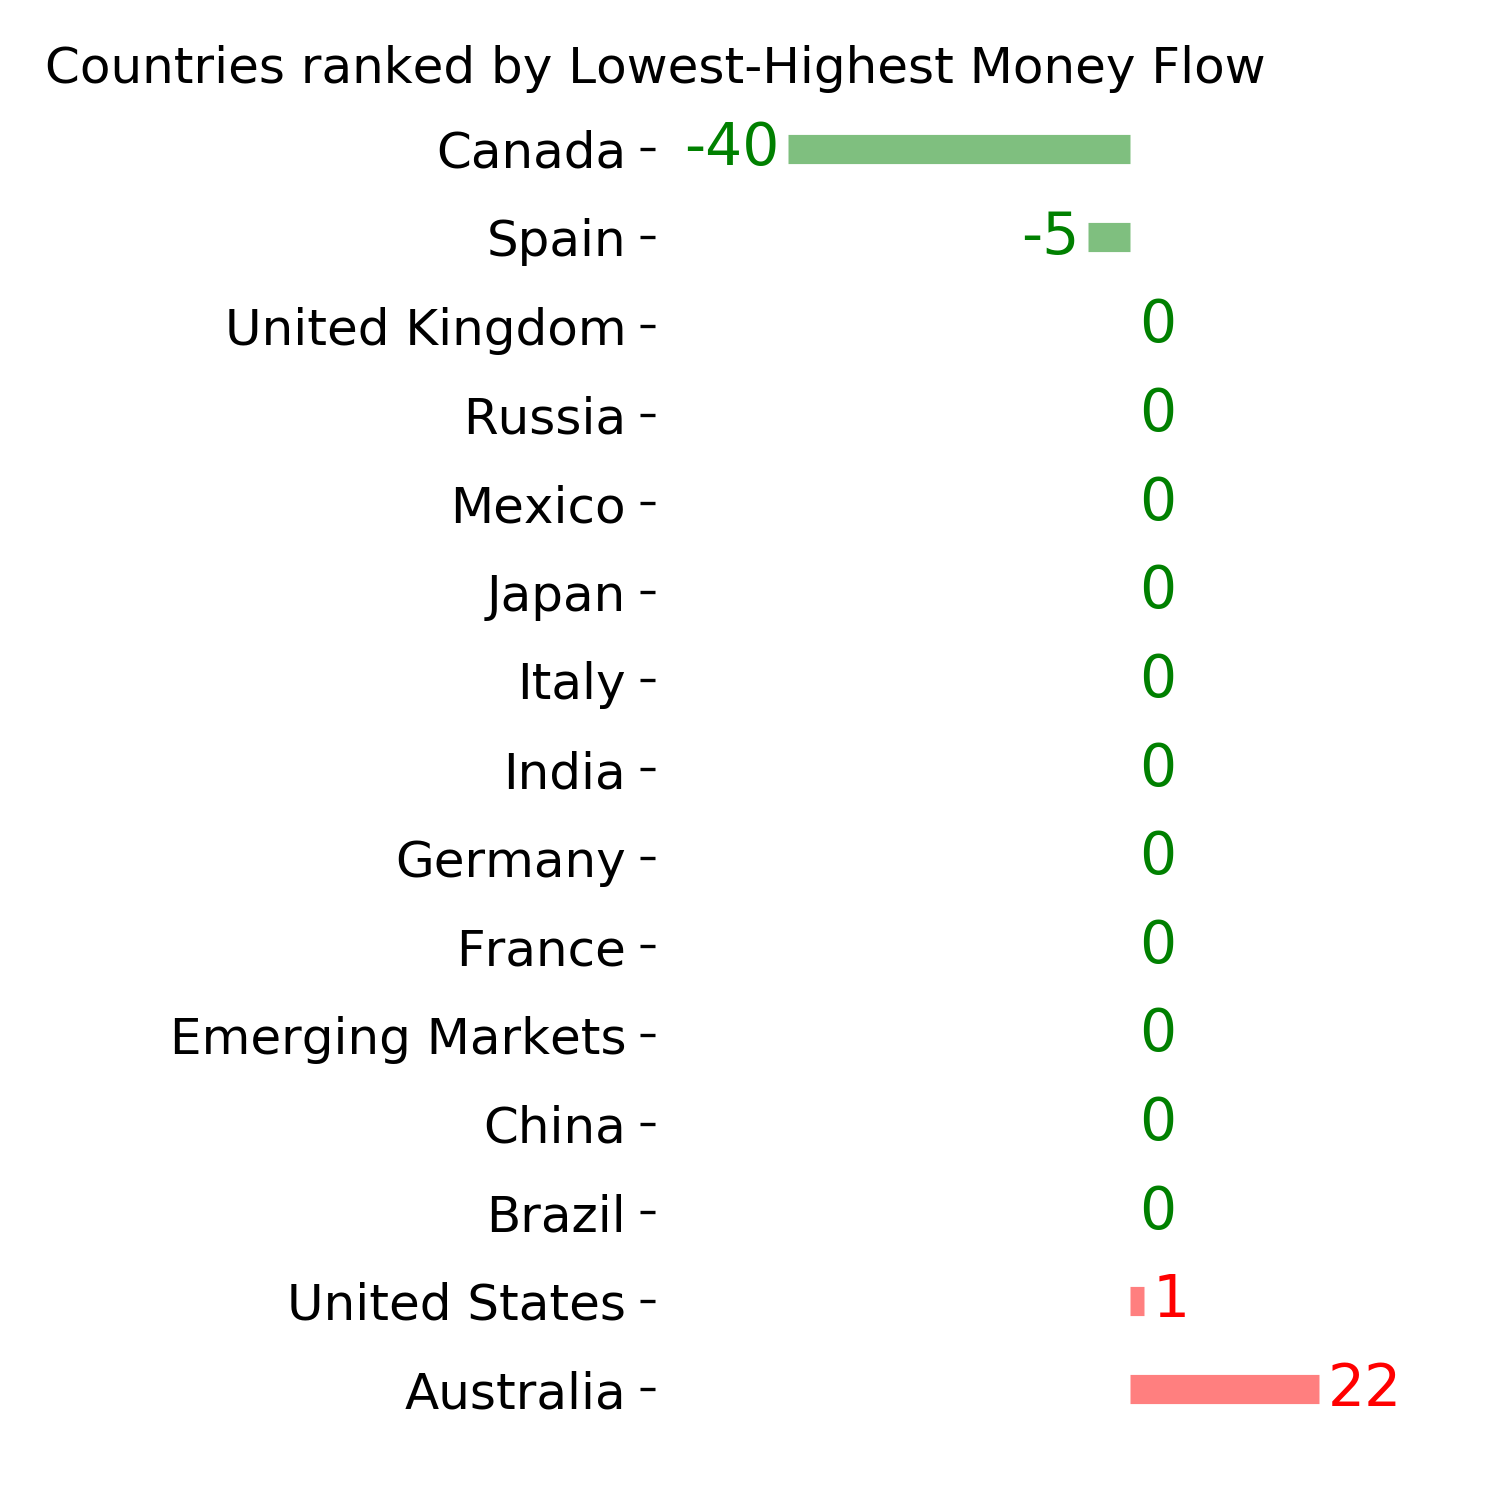
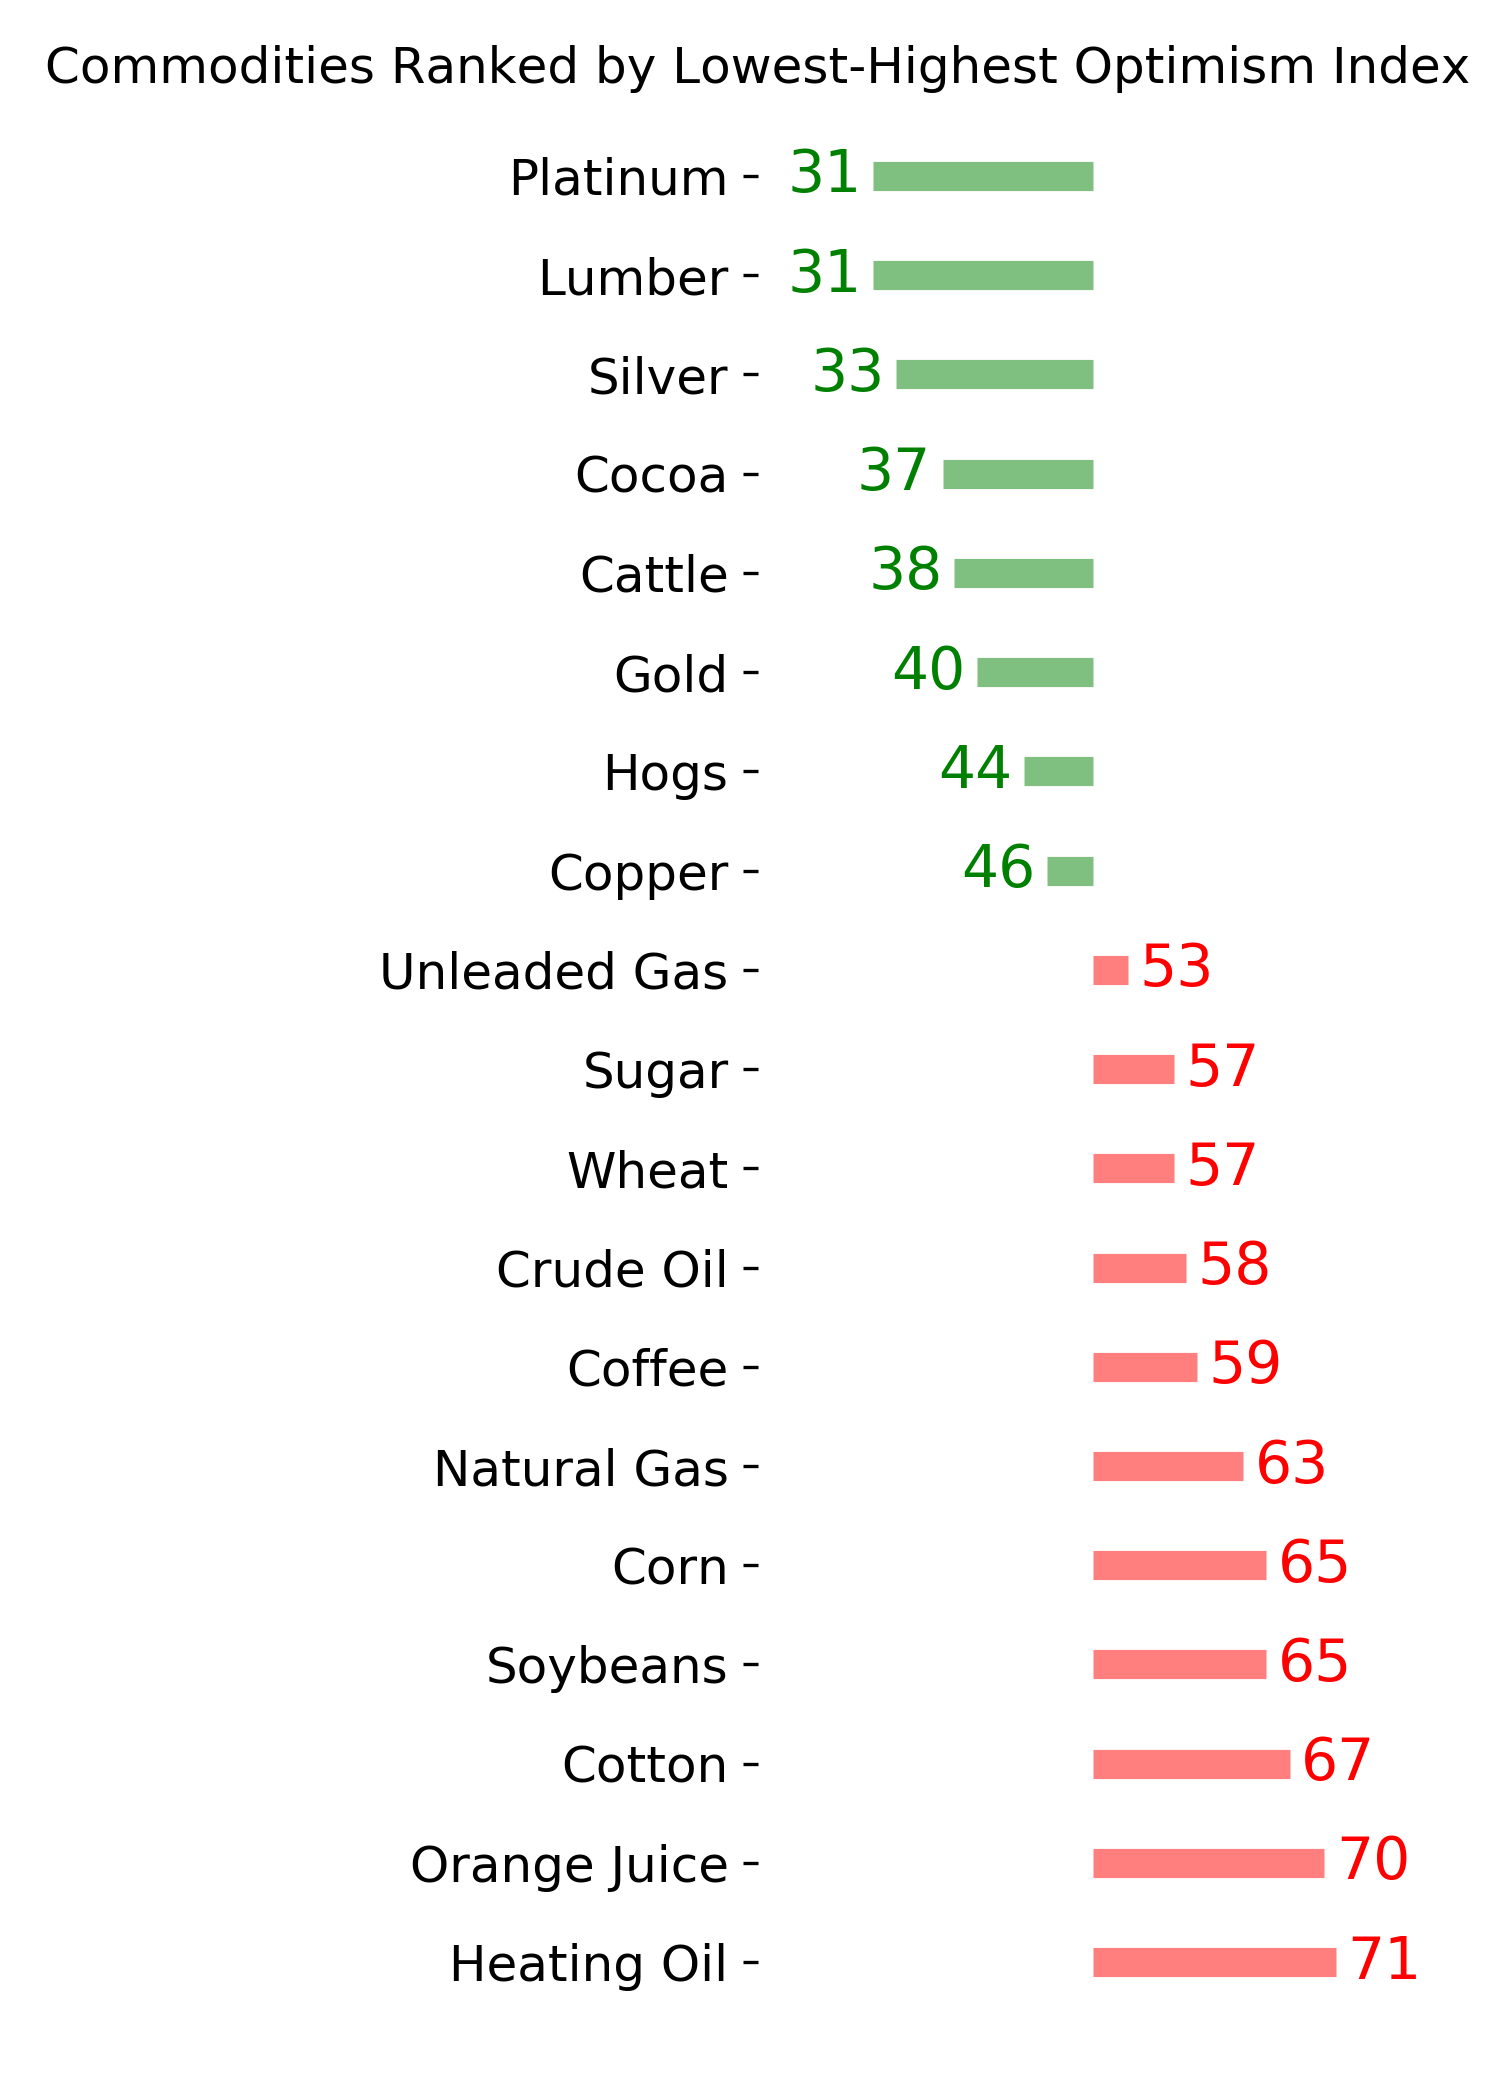
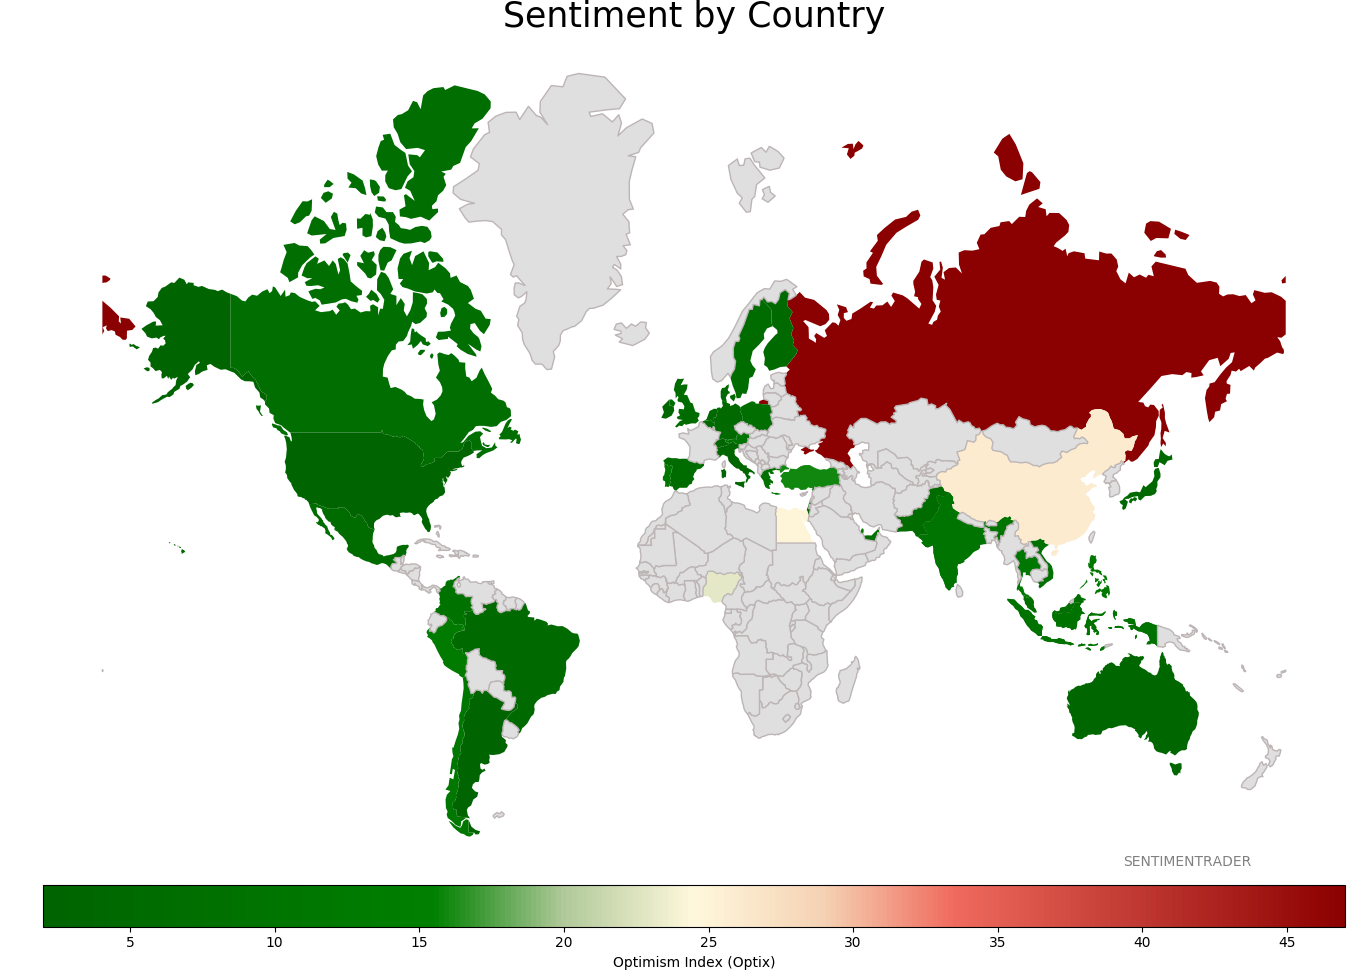
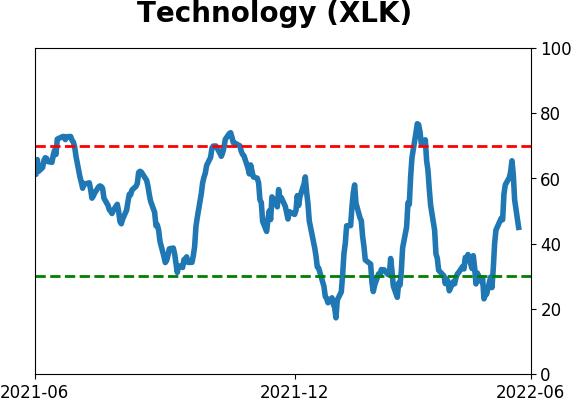
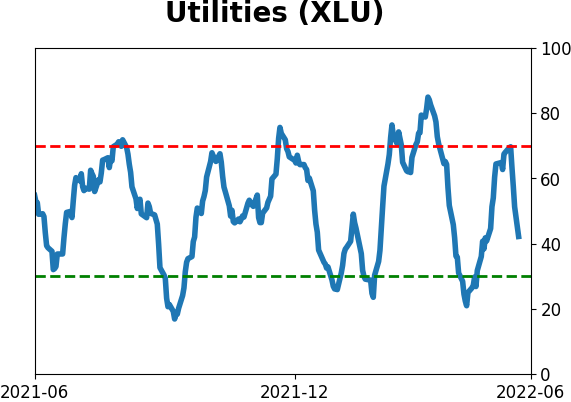
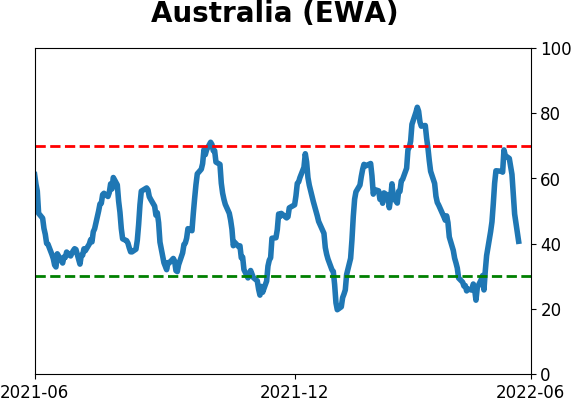
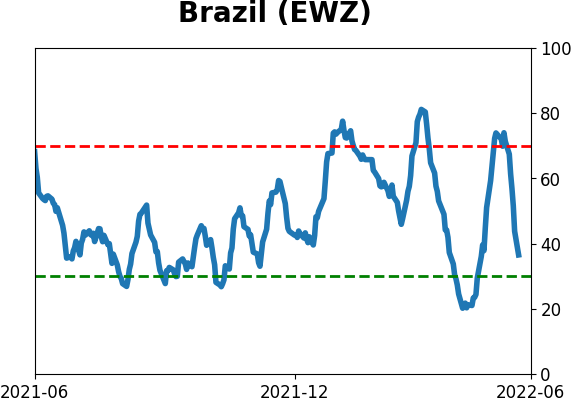
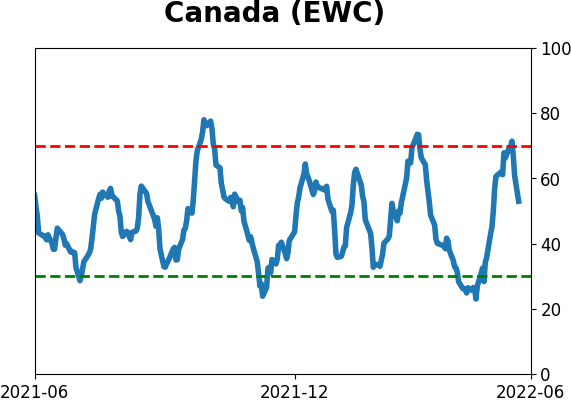
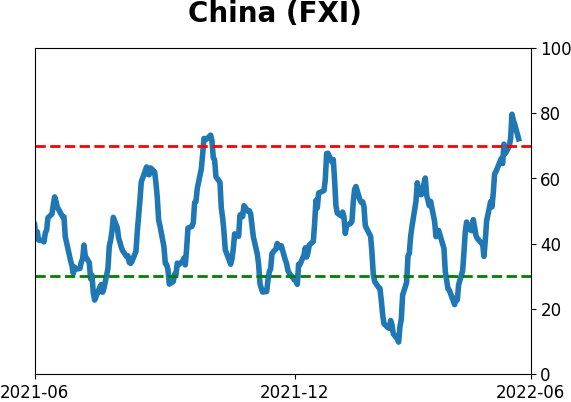
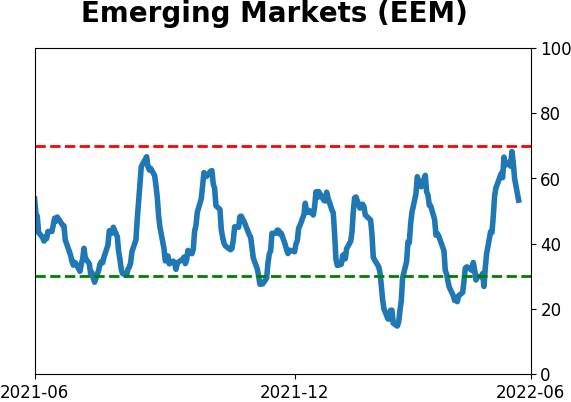
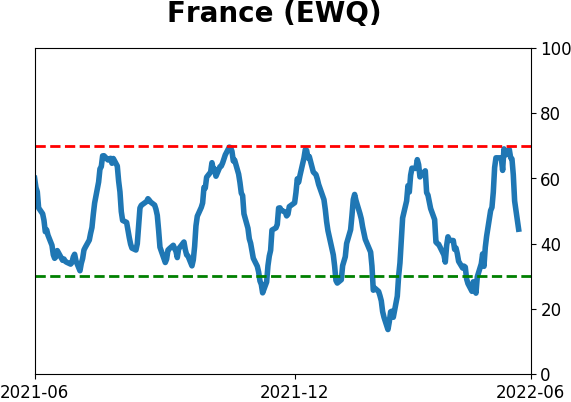
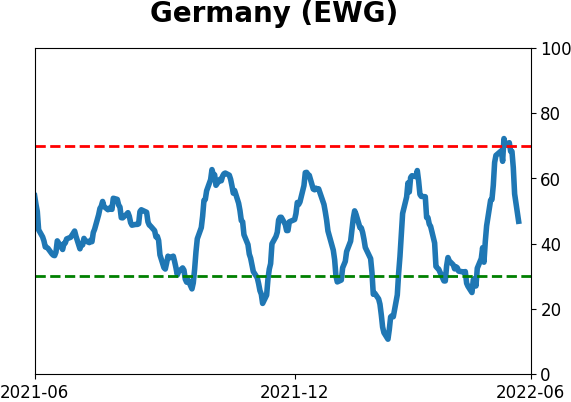
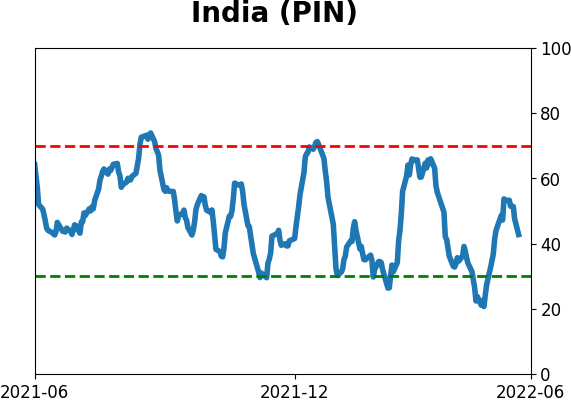
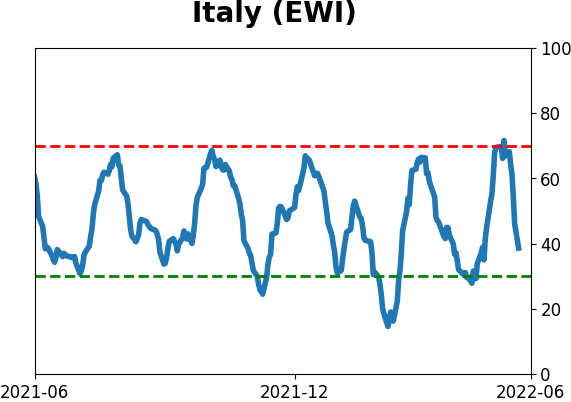
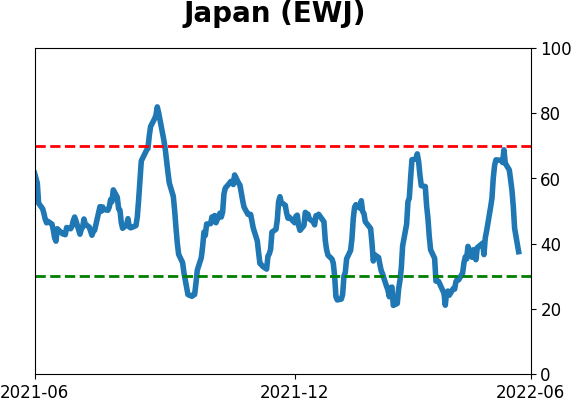
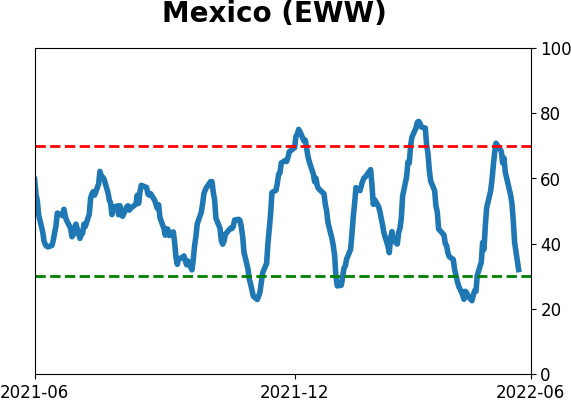
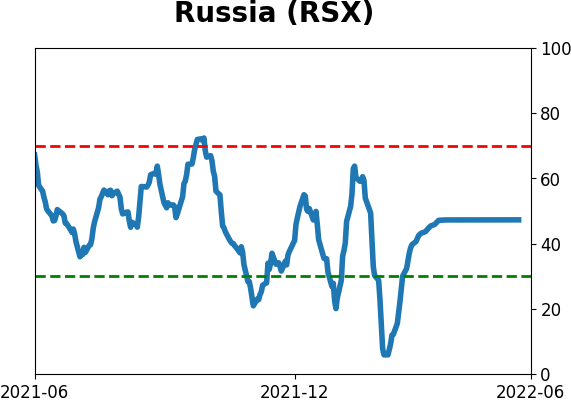
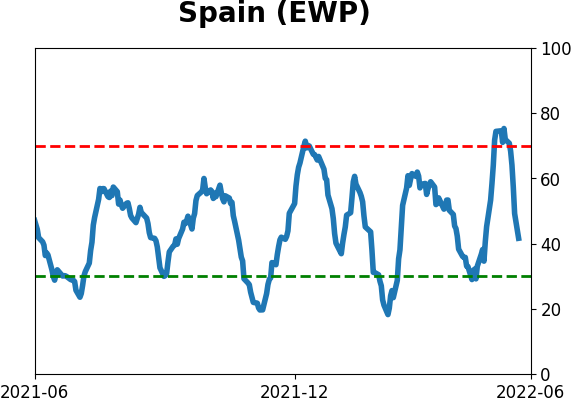
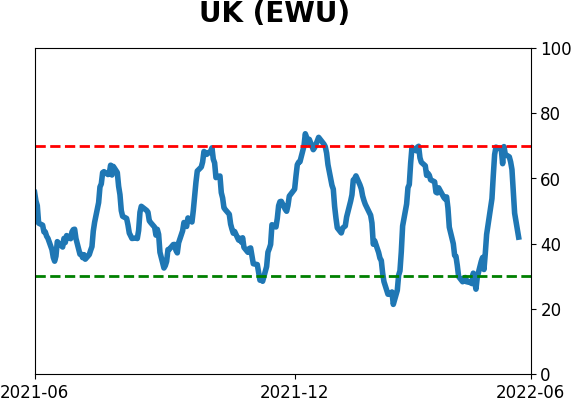
Sentiment Around The World
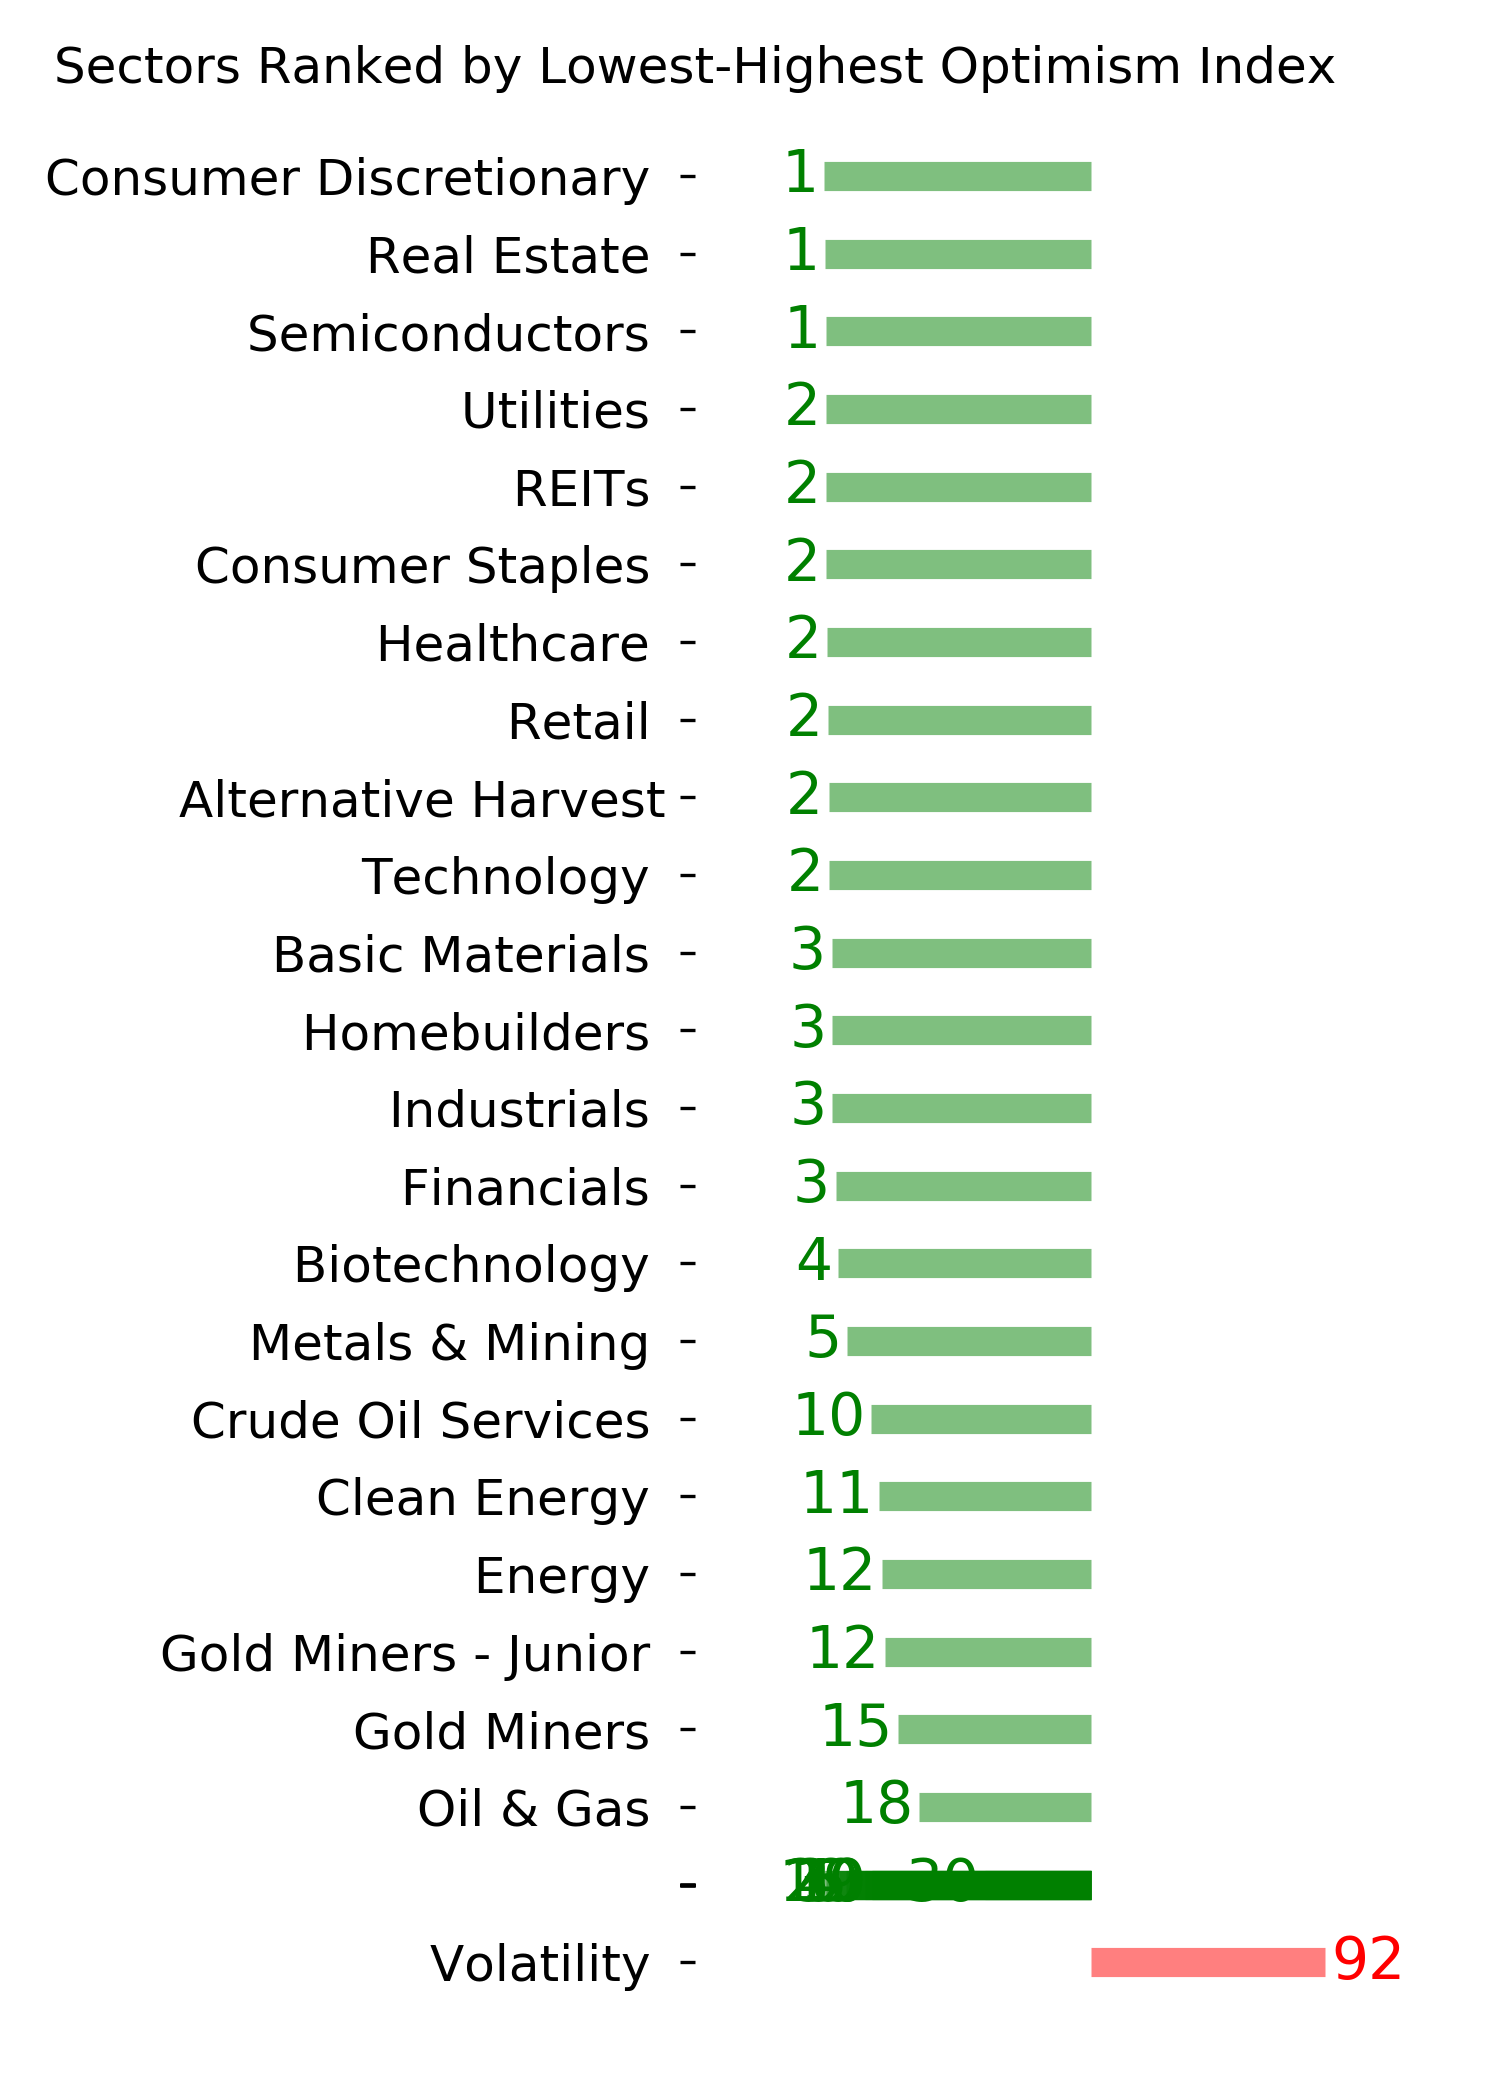
Optimism Index Thumbnails
|
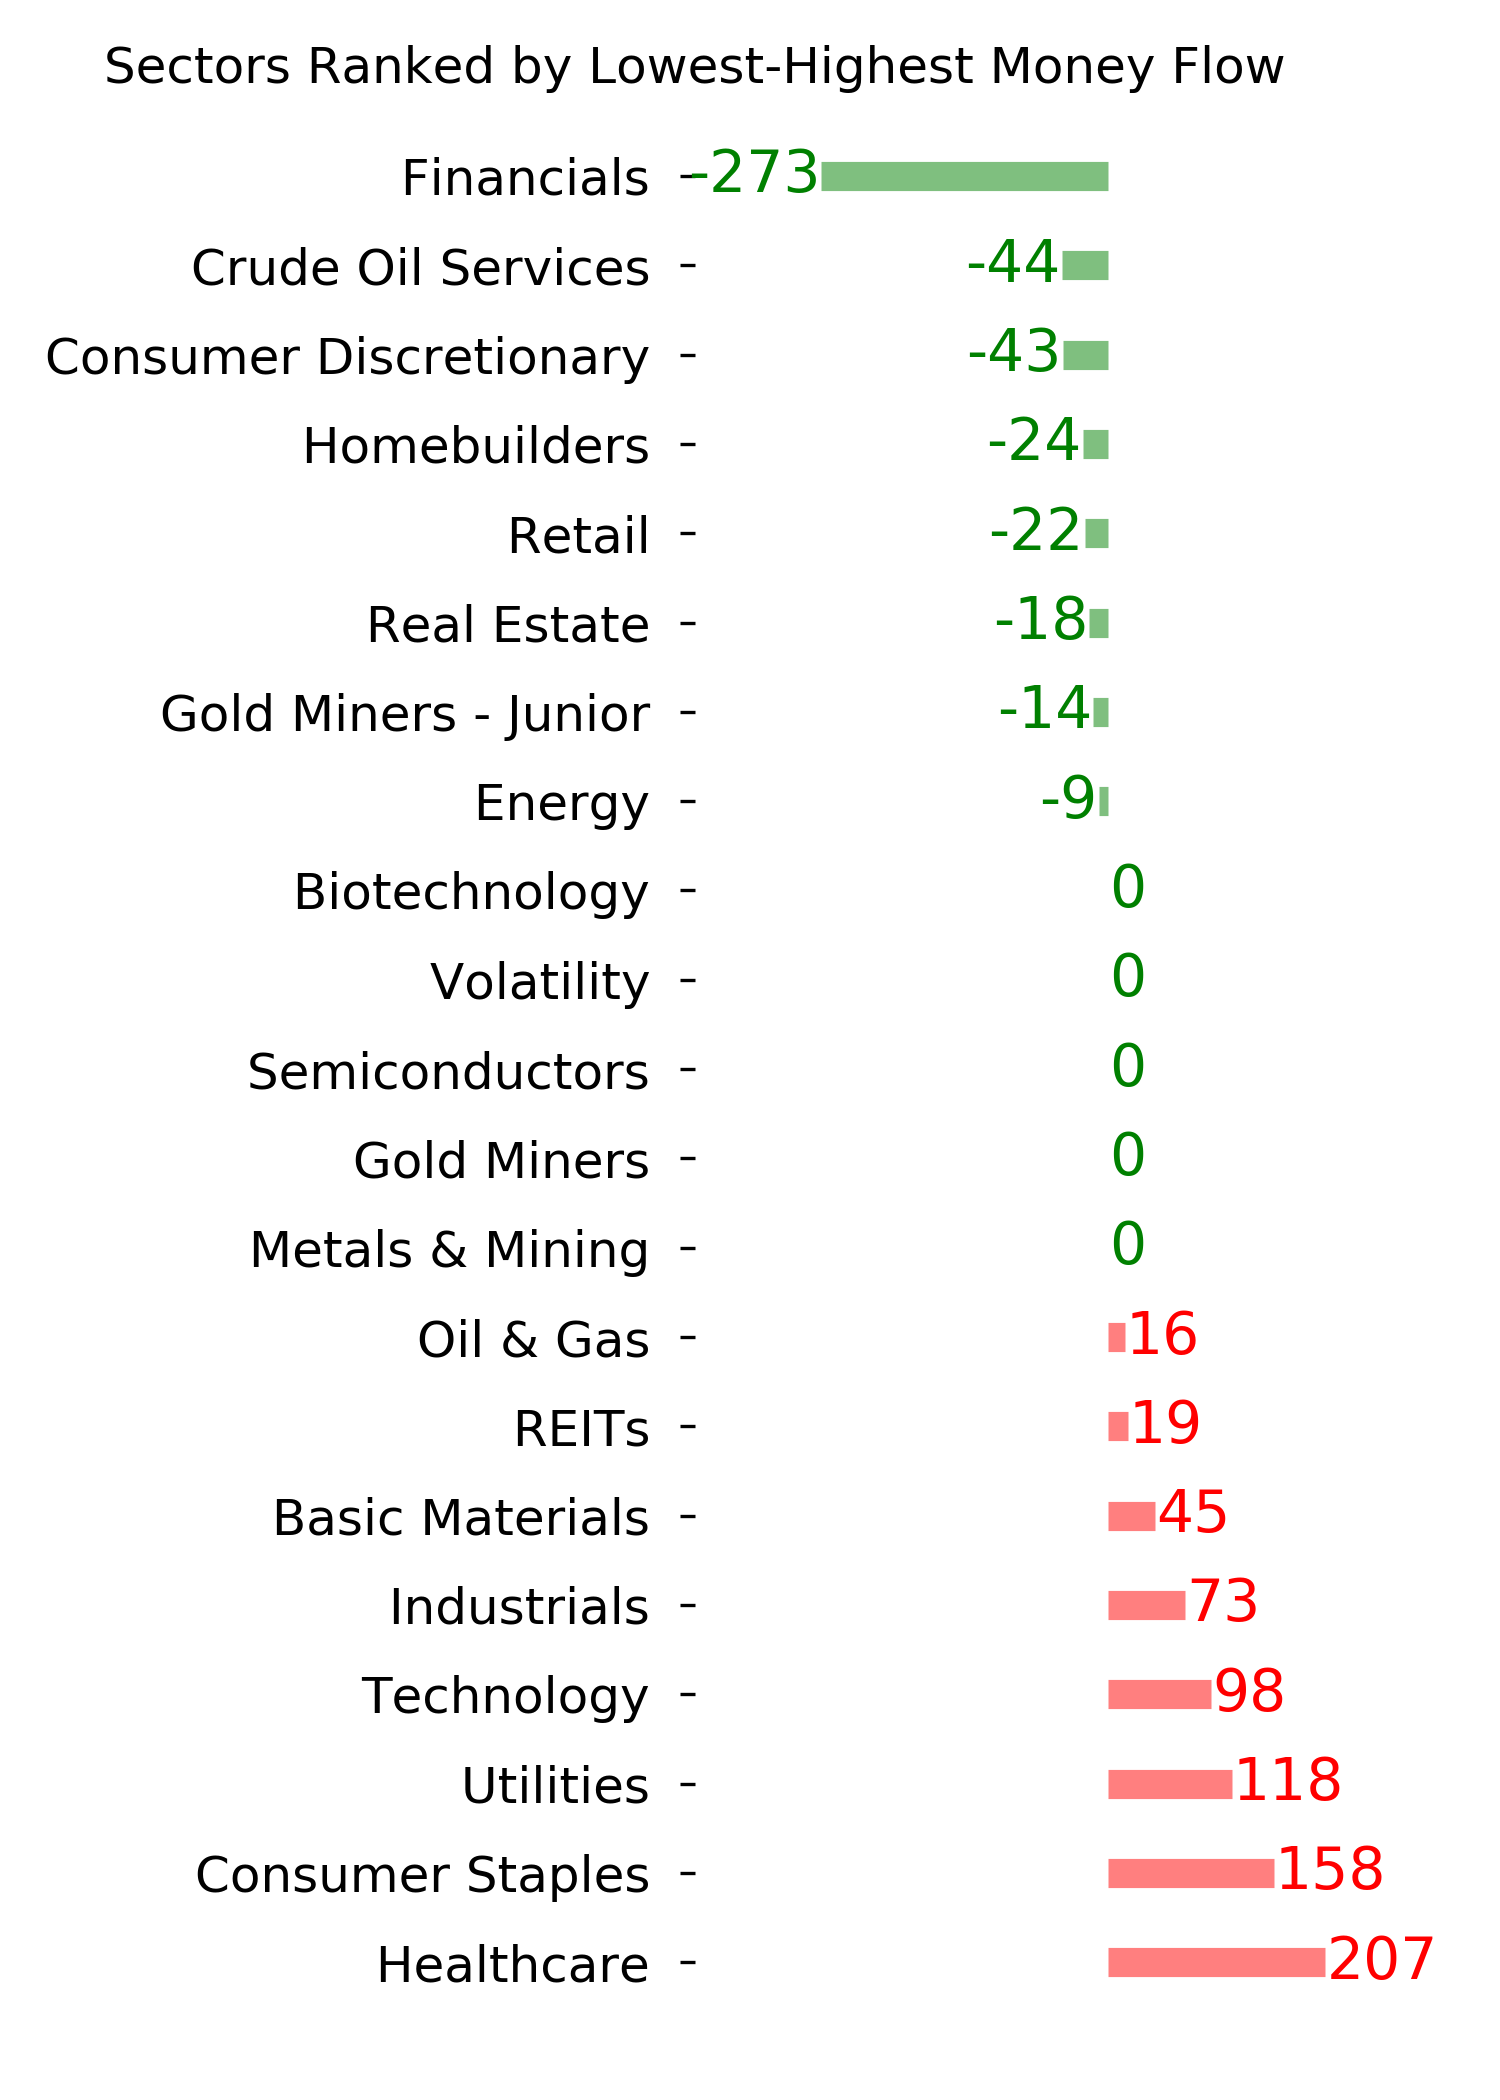
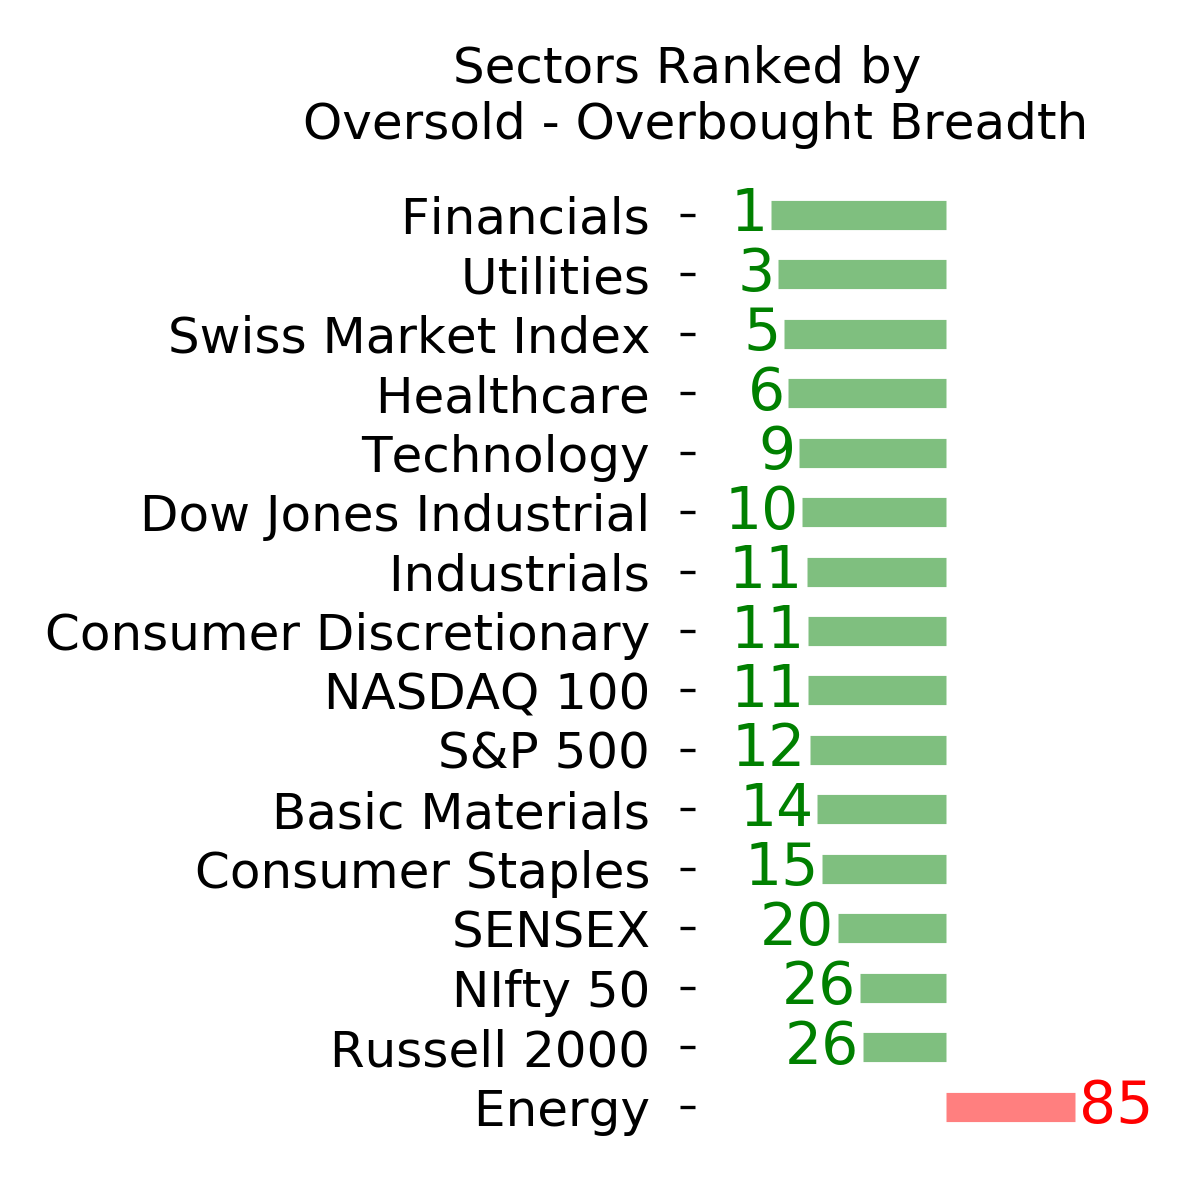
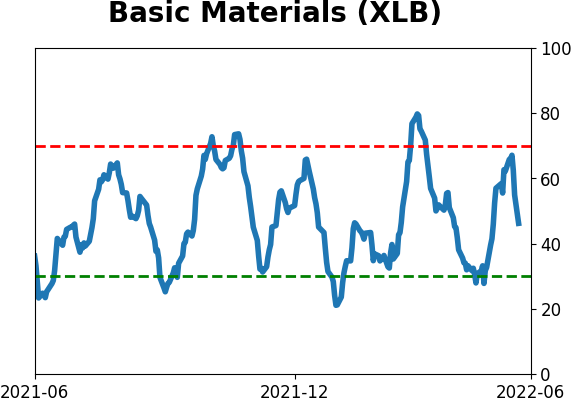
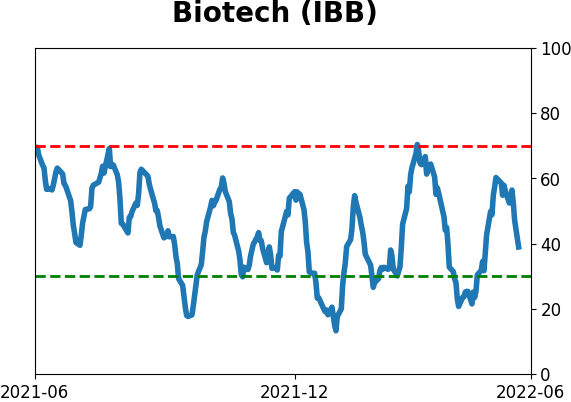
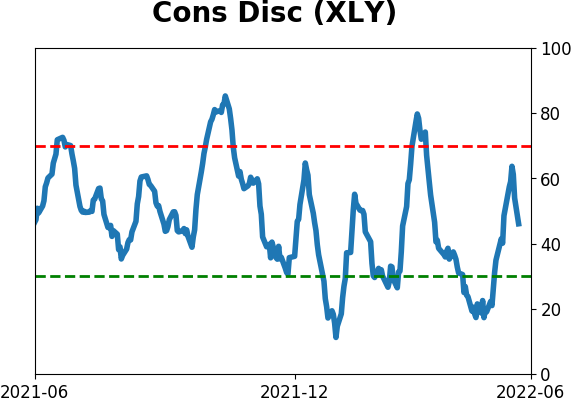
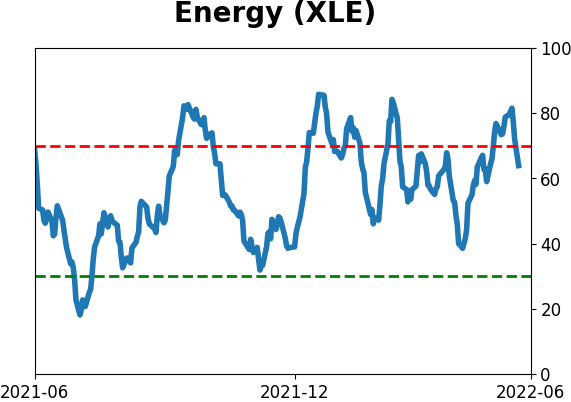
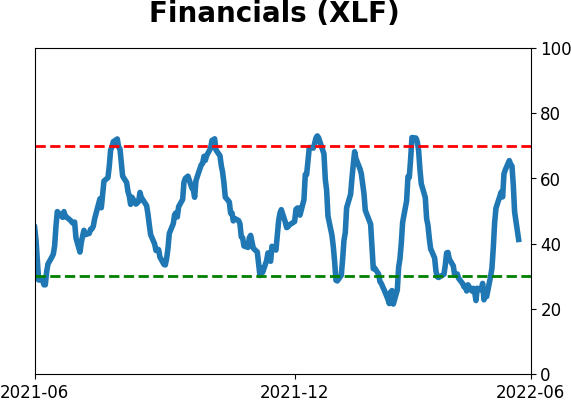
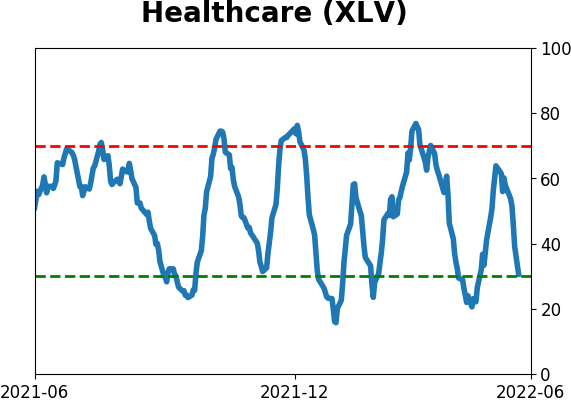
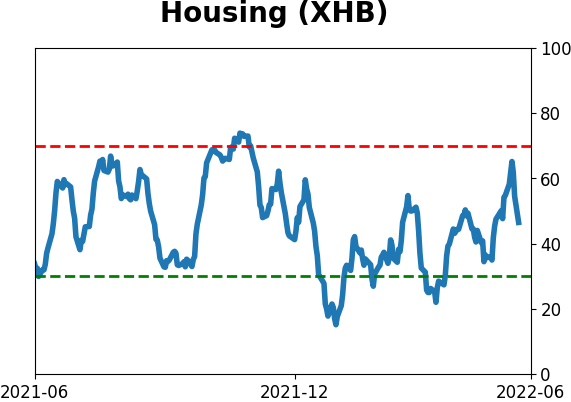
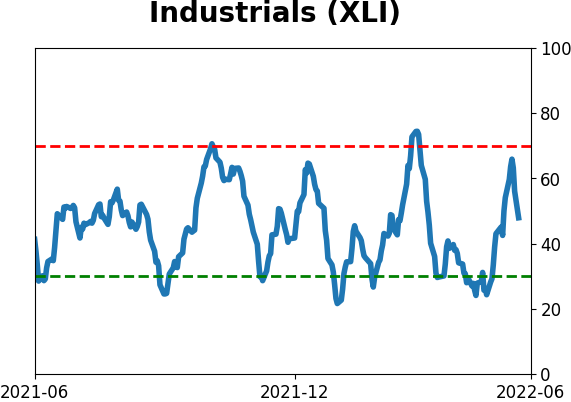
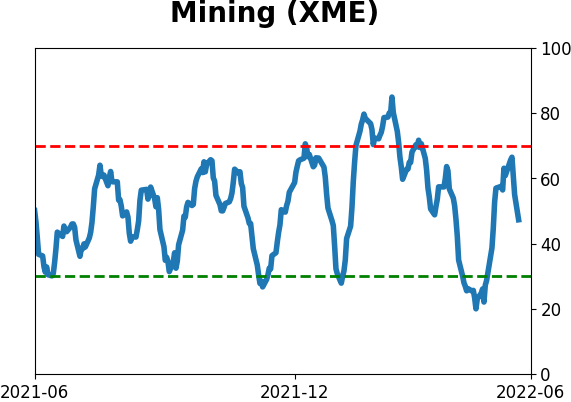
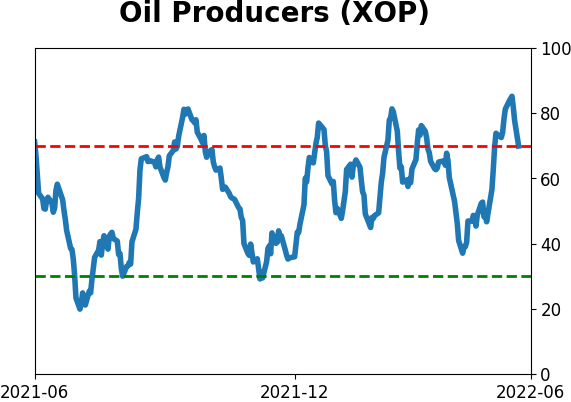
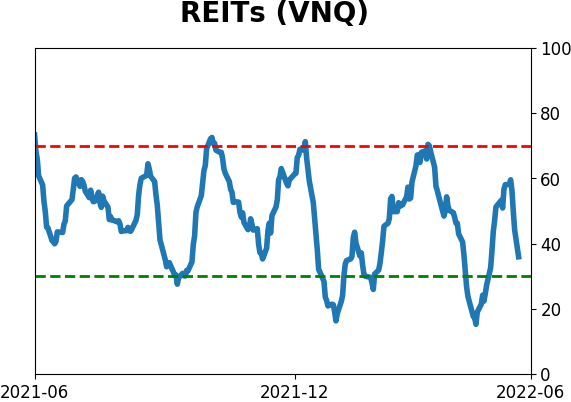
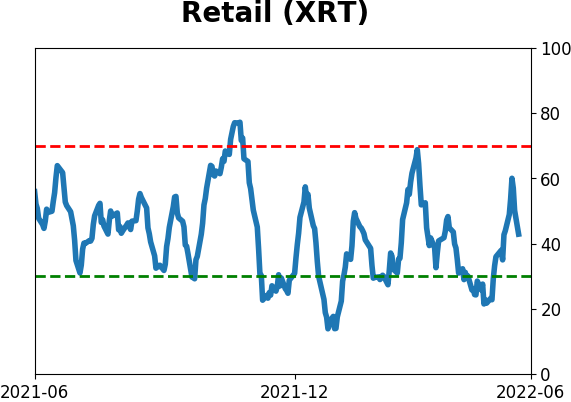
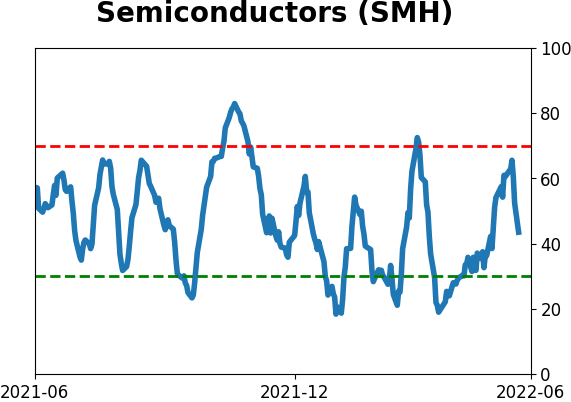
Sector ETF's - 10-Day Moving Average
|
|
|
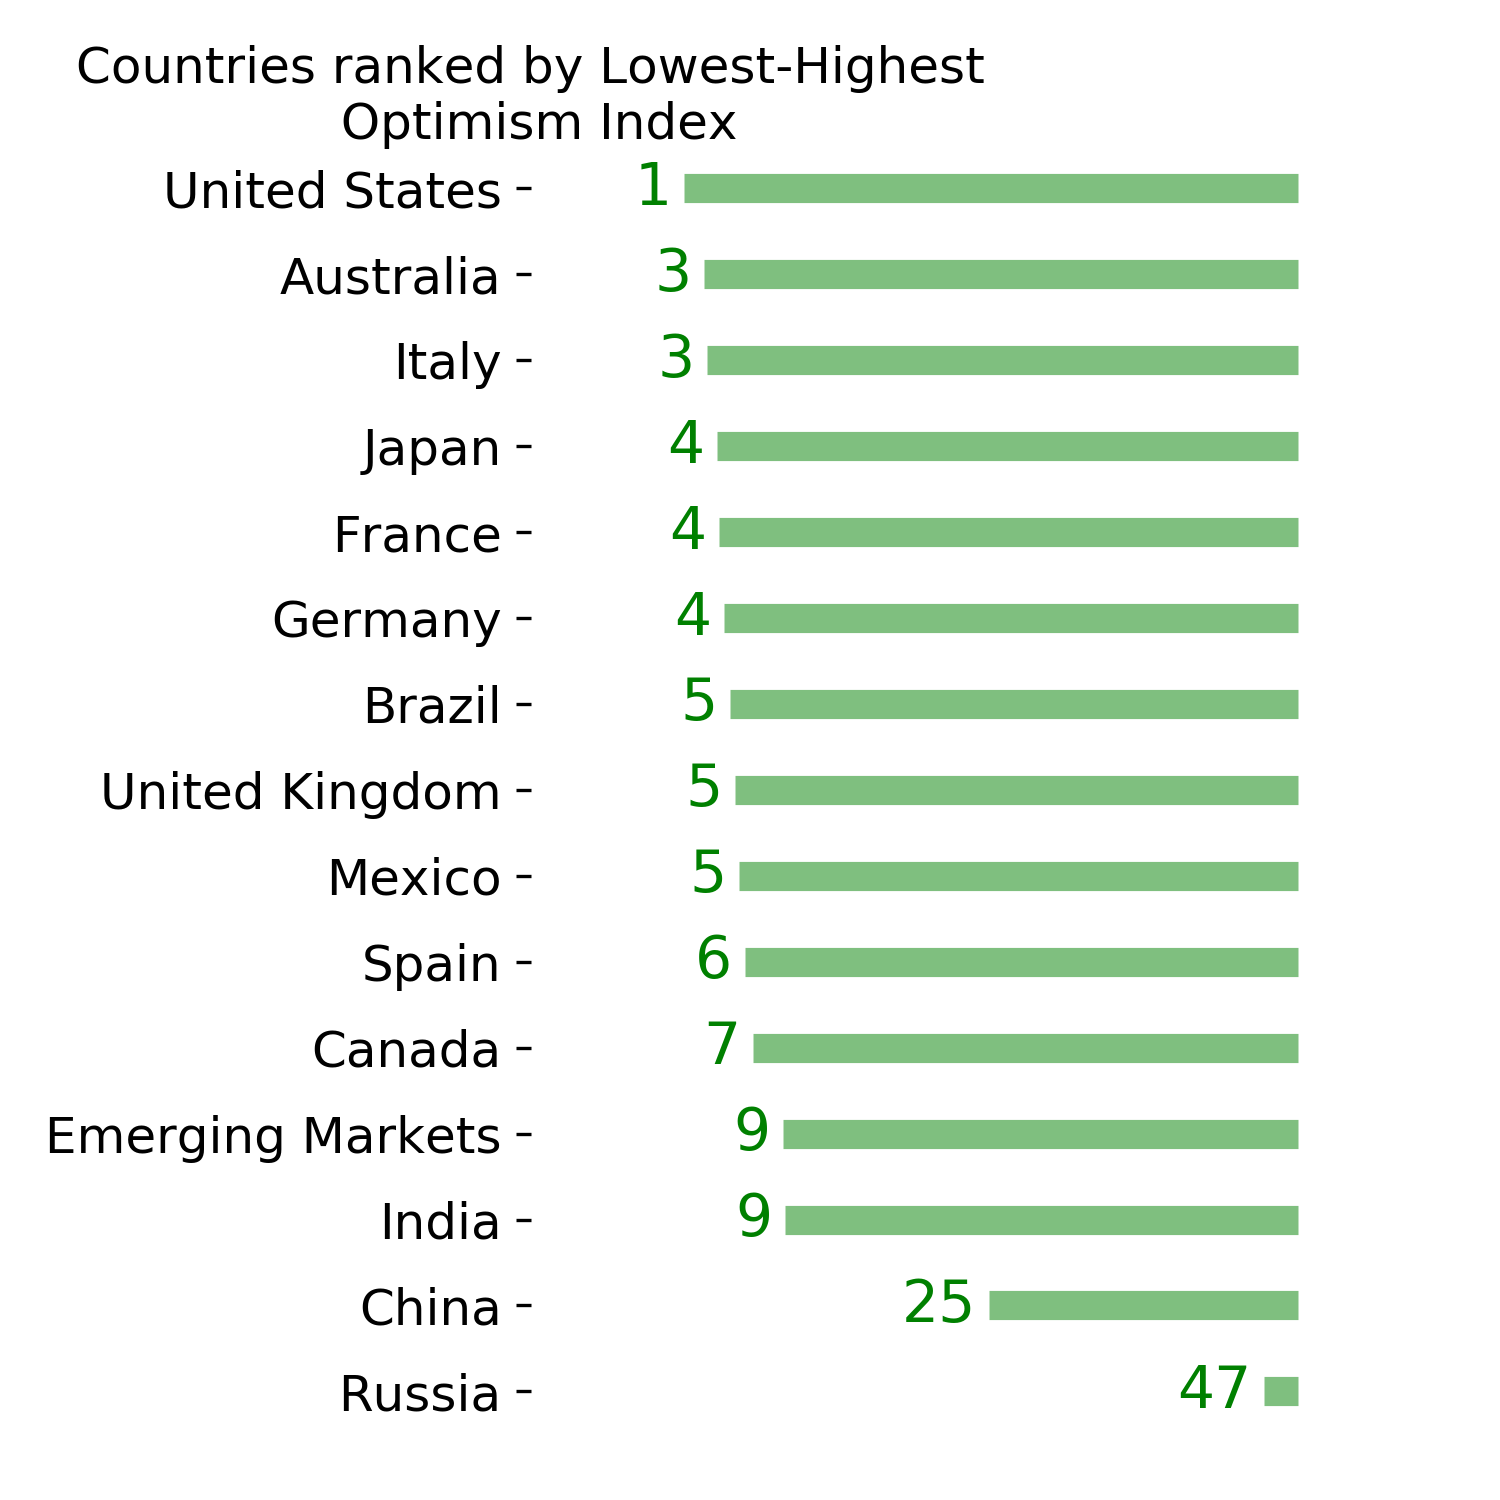
Country ETF's - 10-Day Moving Average
|
|
|
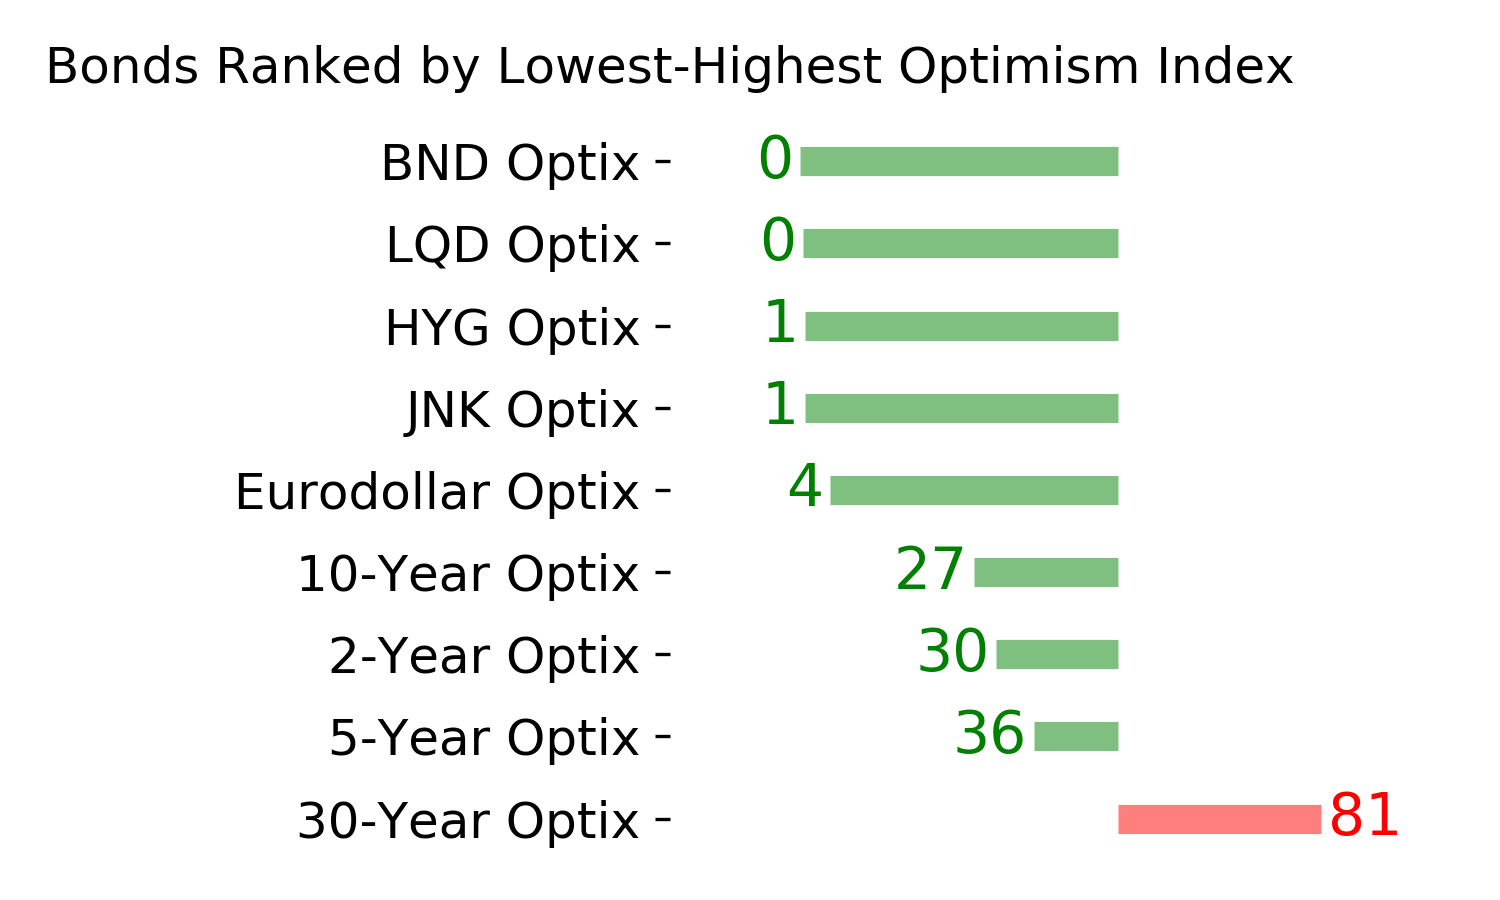
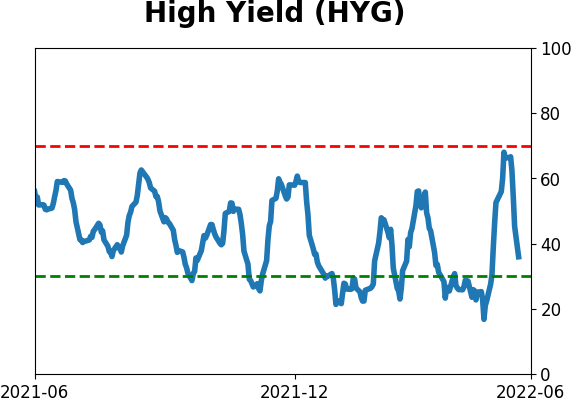
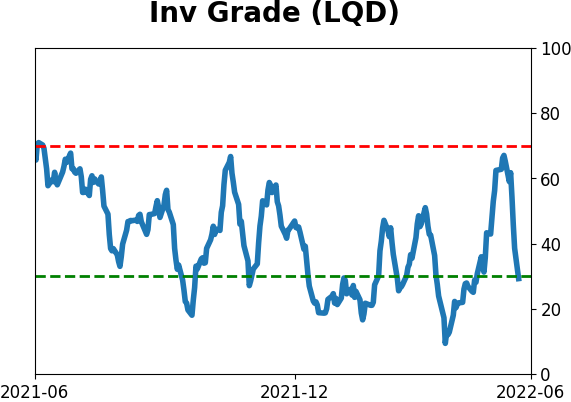
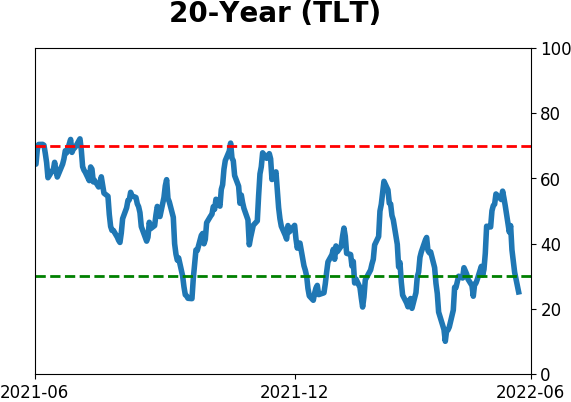
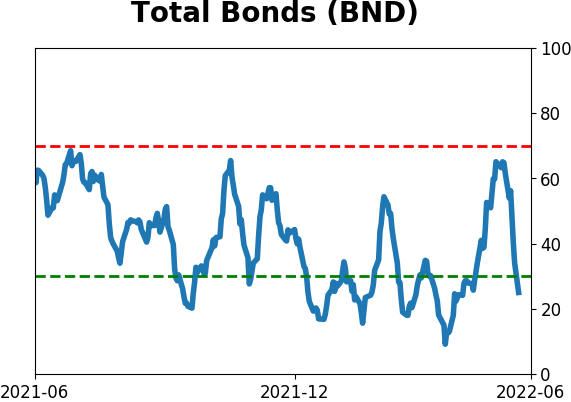
Bond ETF's - 10-Day Moving Average
|
|
|
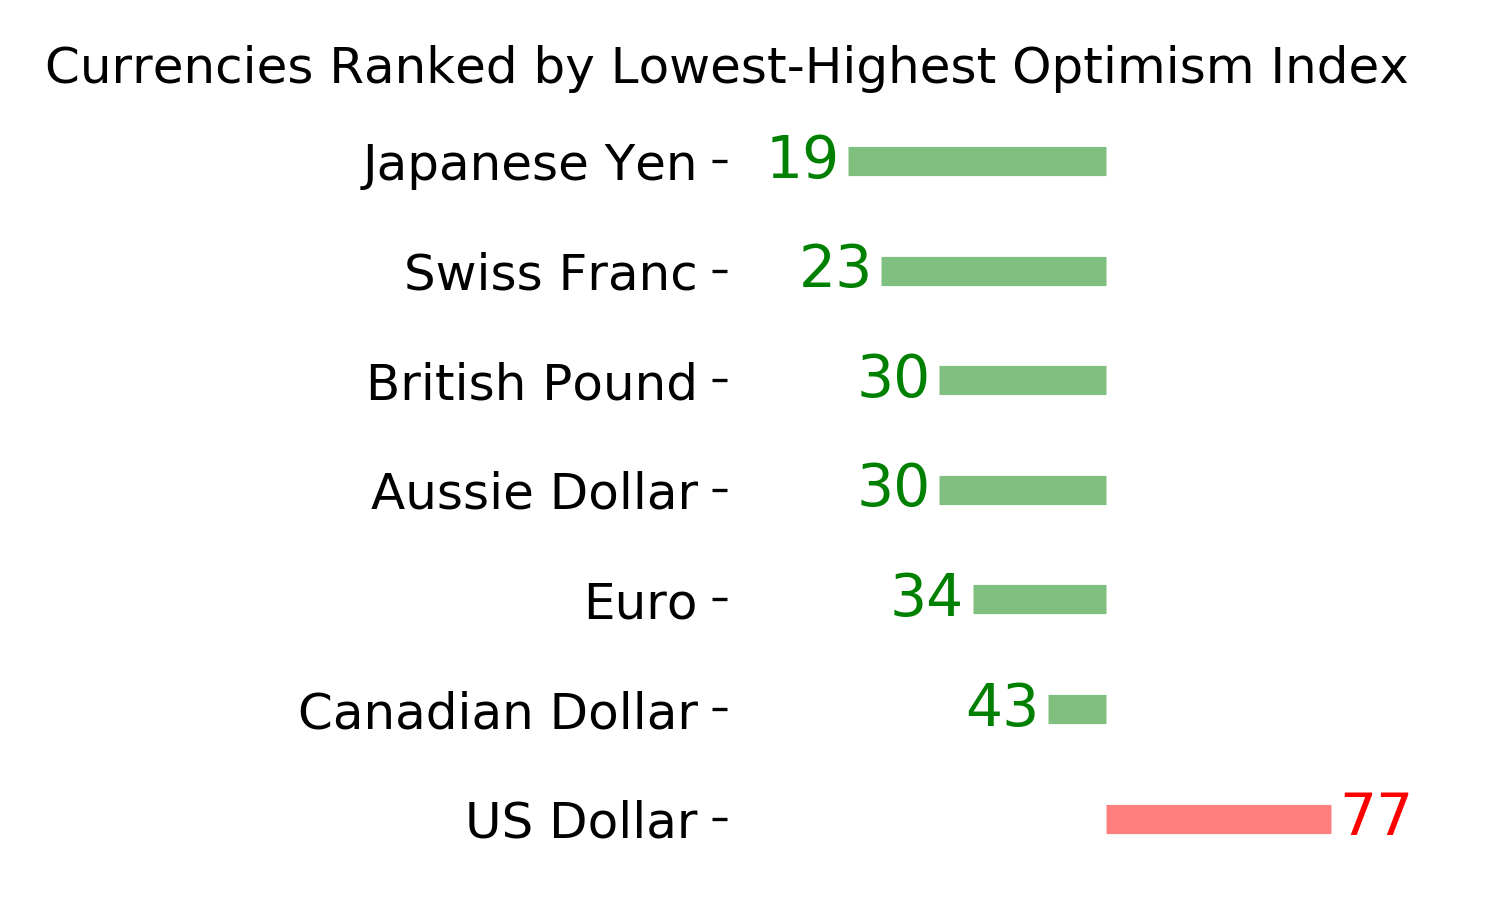
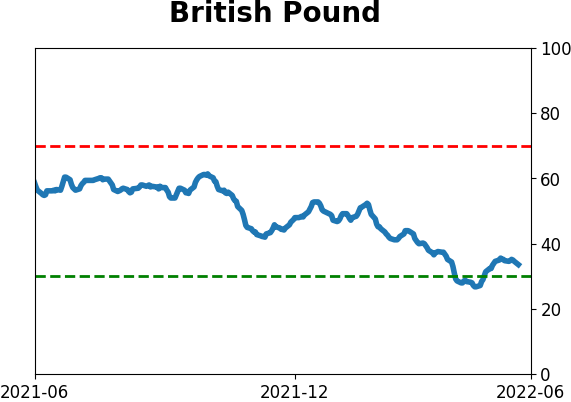
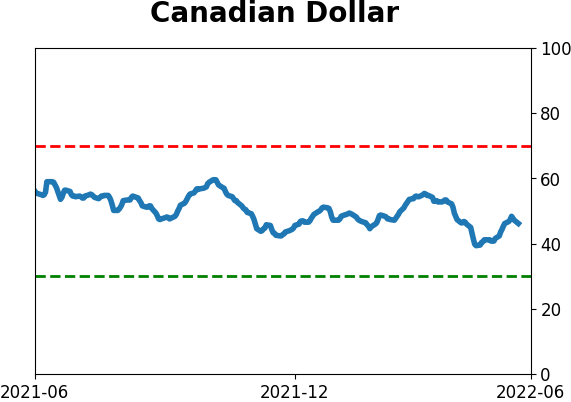
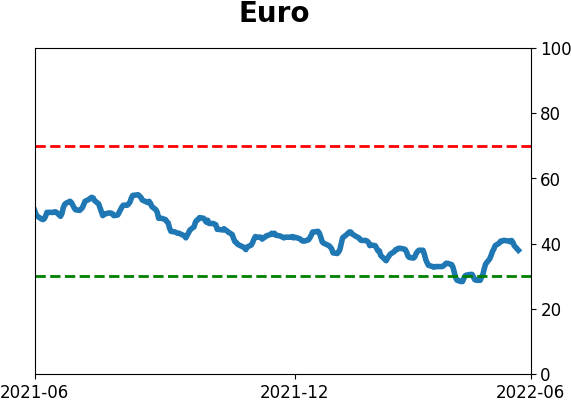
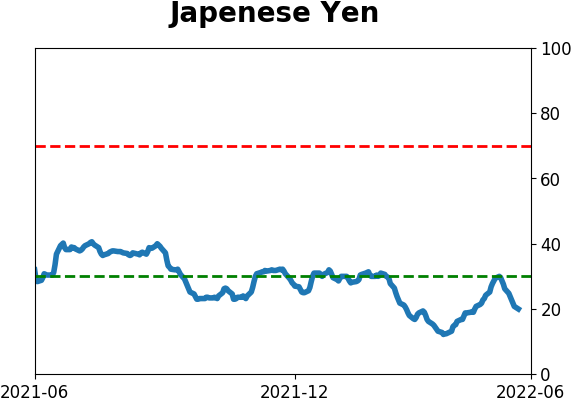
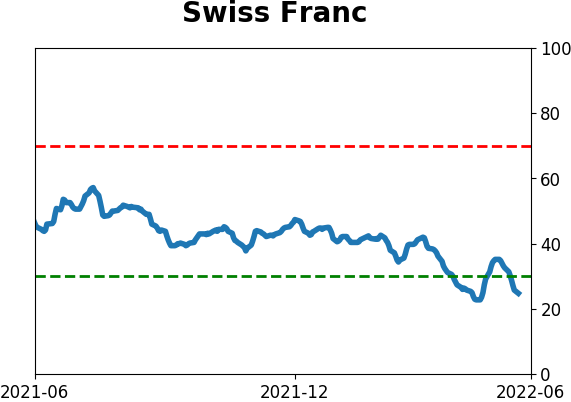
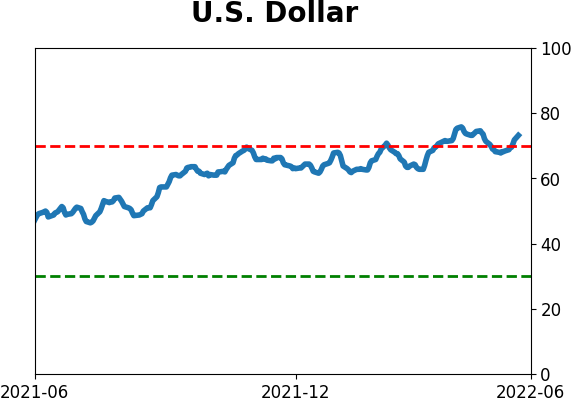
Currency ETF's - 5-Day Moving Average
|
|
|
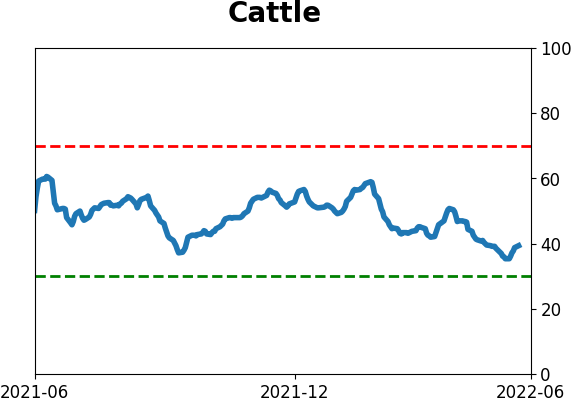
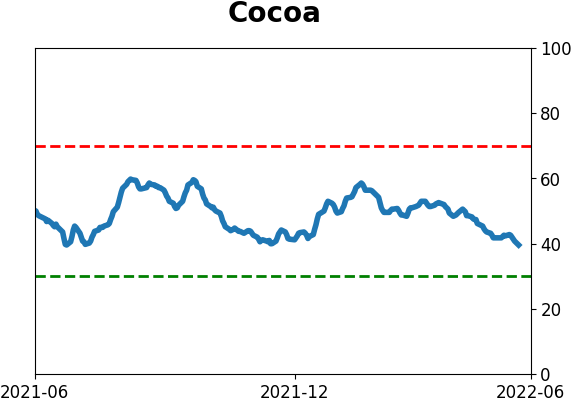
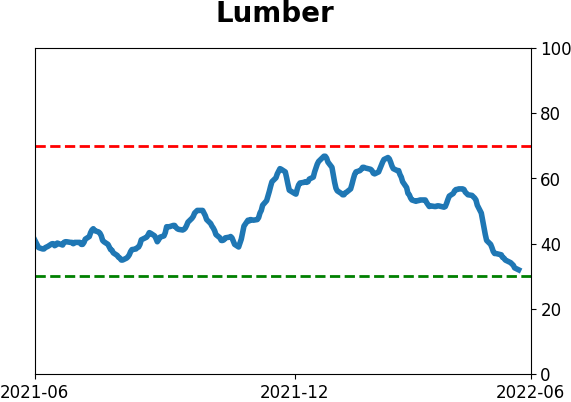
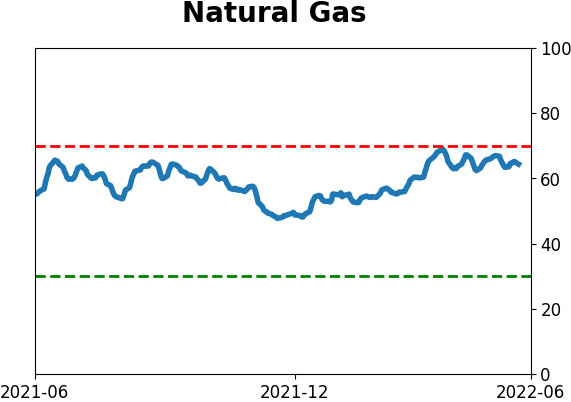
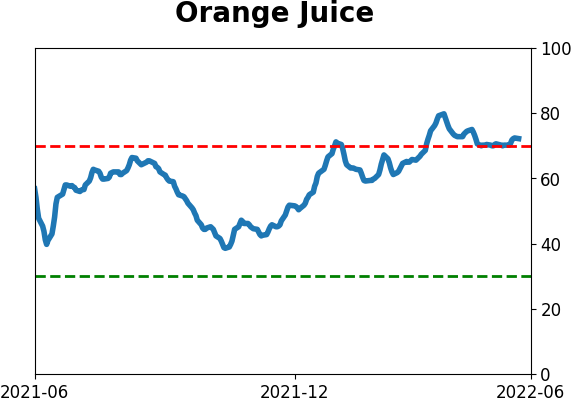
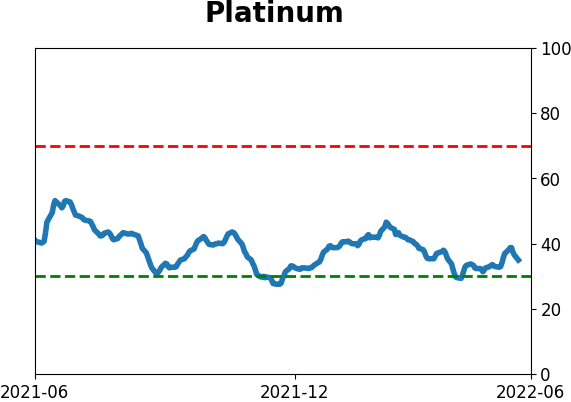
Commodity ETF's - 5-Day Moving Average
|
|