Headlines
|
|
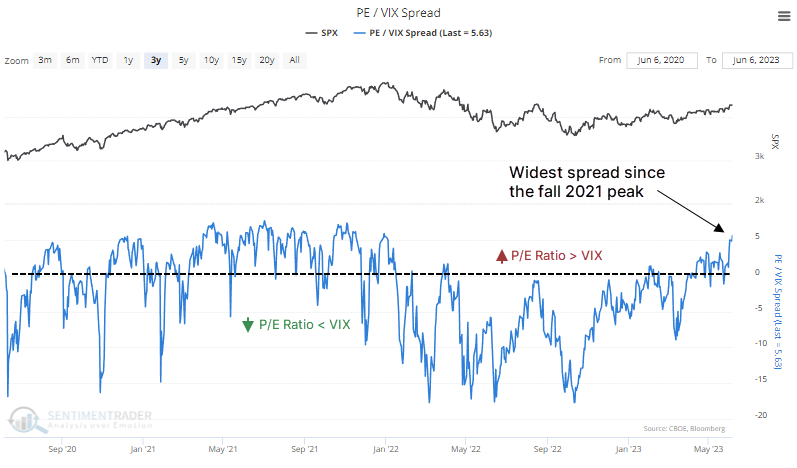
Stocks are expensive compared to expected volatility:
With a continued rally in stocks, valuation measures are getting stretched, and volatility is compressing. The price/earnings ratio on the S&P 500 is now more than five points higher than the VIX "fear gauge" for the first time since the late 2021 market peak. It's important to note that these conditions can last for a while, though.
|
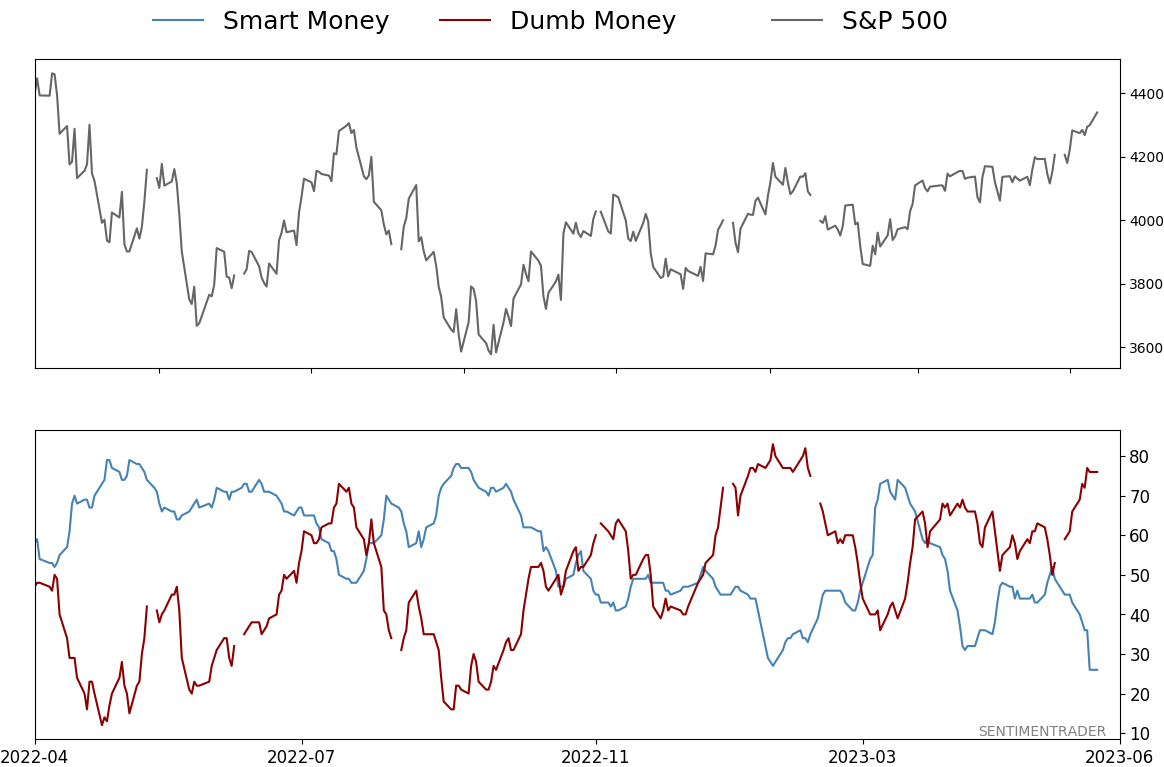
Smart / Dumb Money Confidence
|
Smart Money Confidence: 26%
Dumb Money Confidence: 76%
|
|
Risk Levels
Stocks Short-Term
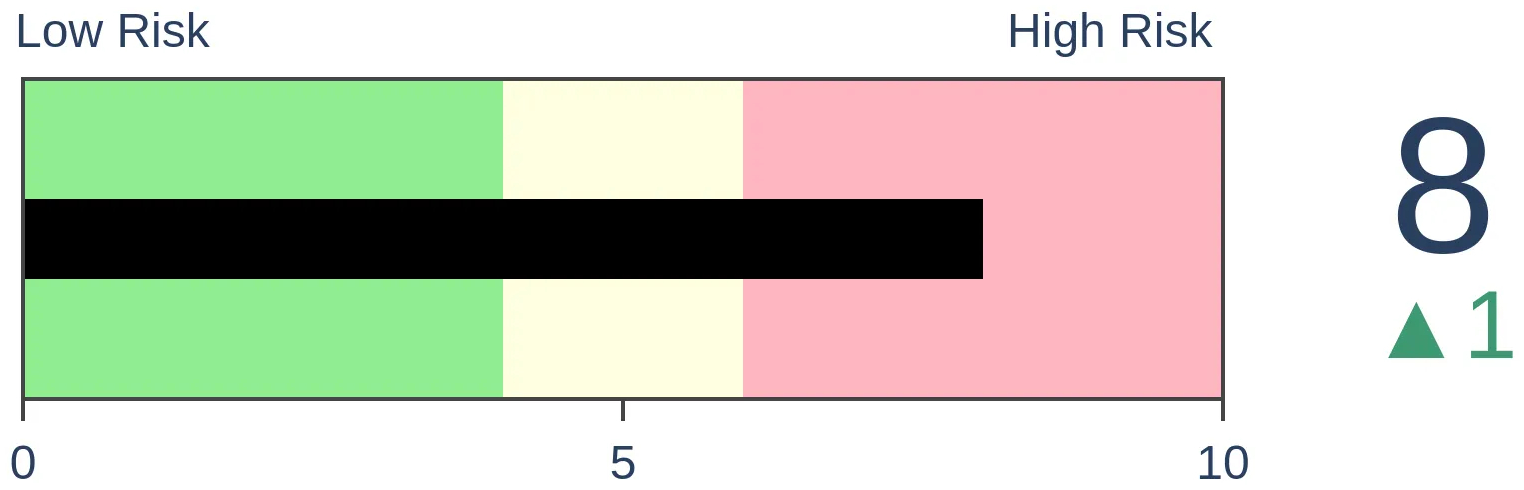
|
Stocks Medium-Term
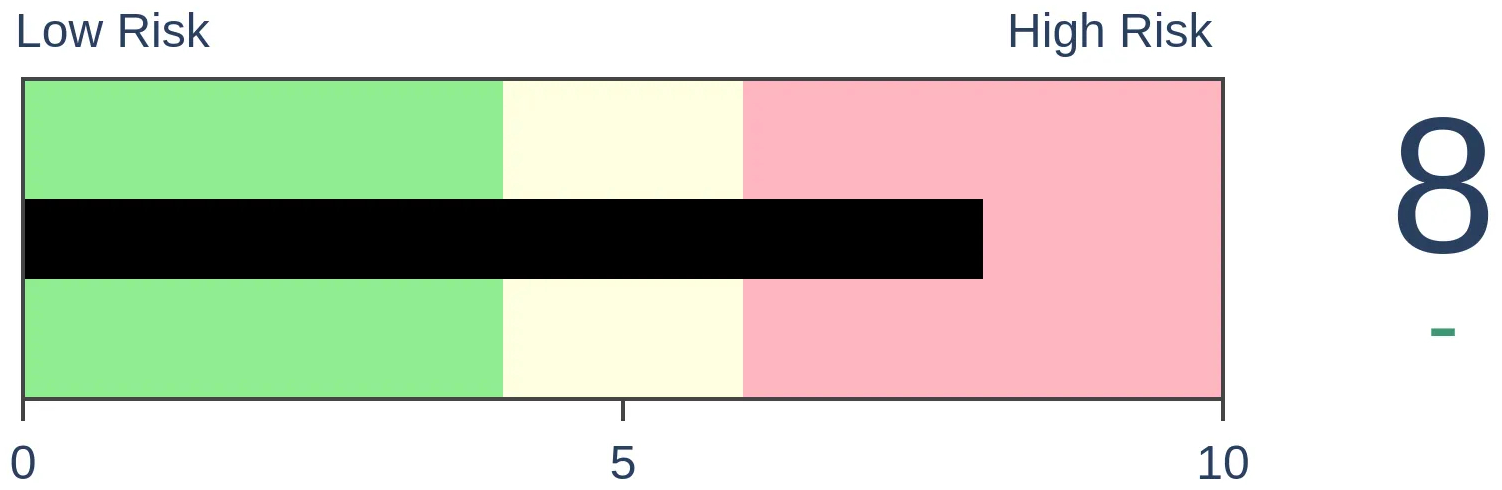
|
|
Bonds

|
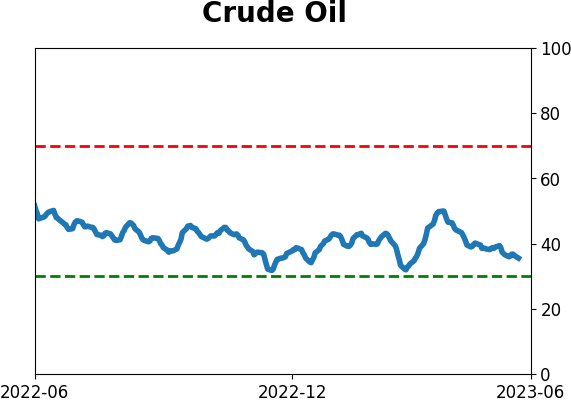
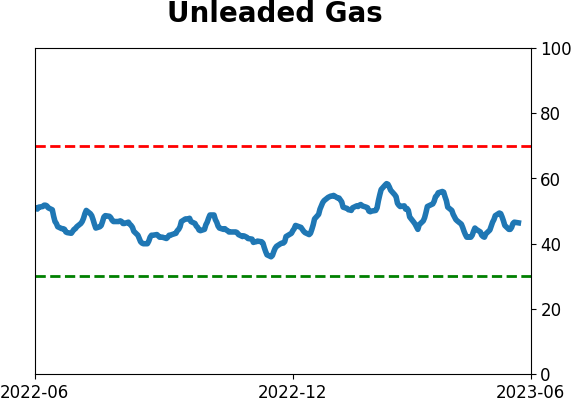
Crude Oil
|
|
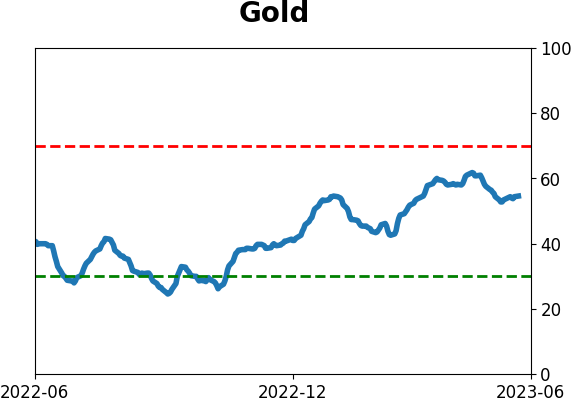
Gold
|
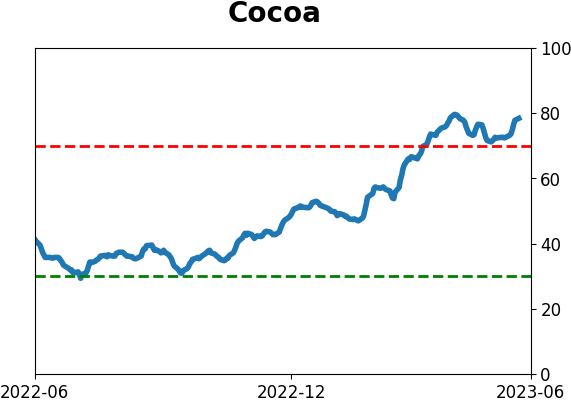
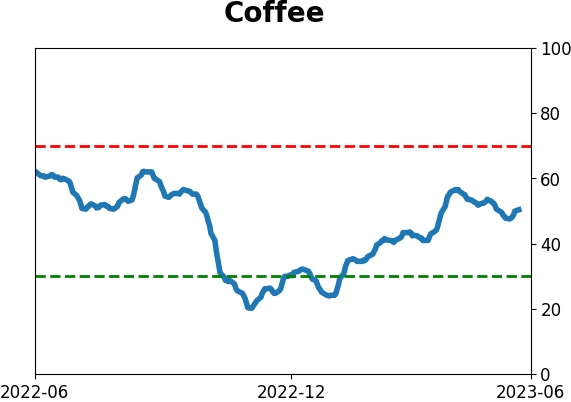
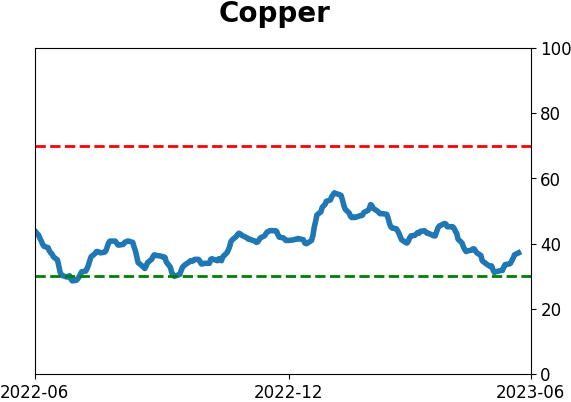
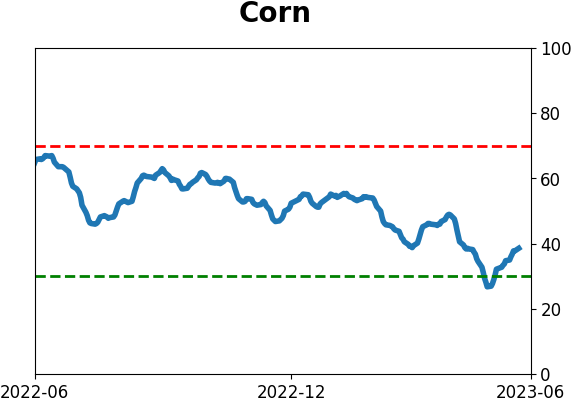
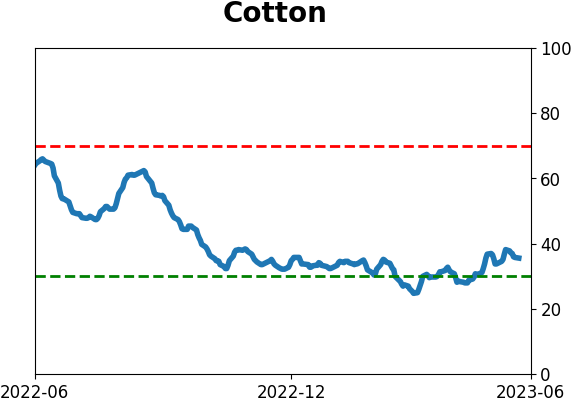
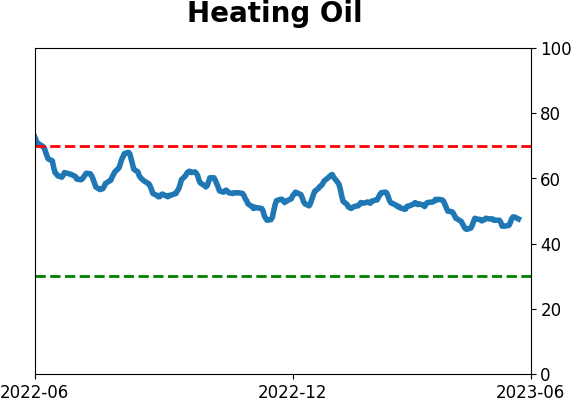
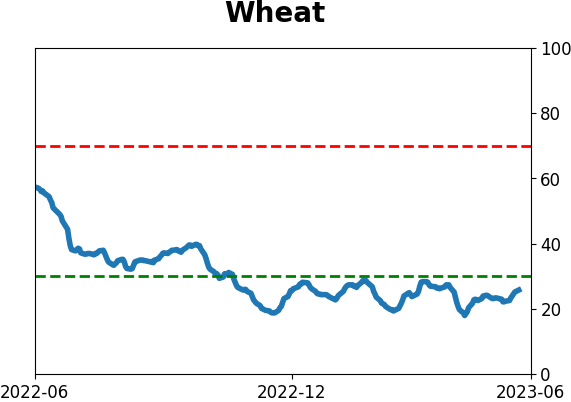
Agriculture
|
|
Research
By Jason Goepfert
BOTTOM LINE
With a continued rally in stocks, valuation measures are getting stretched, and volatility is compressing. The price/earnings ratio on the S&P 500 is now more than five points higher than the VIX "fear gauge" for the first time since the late 2021 market peak. It's important to note that these conditions can last for a while, though.
FORECAST / TIMEFRAME
None
|
Key points:
- The forward P/E ratio on the S&P 500 is five points higher than the VIX "fear gauge"
- This is the widest spread since the market peak in late 2021
- Future returns with such wide spreads were weak, but not after the condition first triggered
Stocks are priced richly compared to expected volatility
Over the past few weeks, stocks have become more expensive, and volatility has been crushed. As a result, investors are willing to the most to take the most apparent risk since the 2021 market peak.
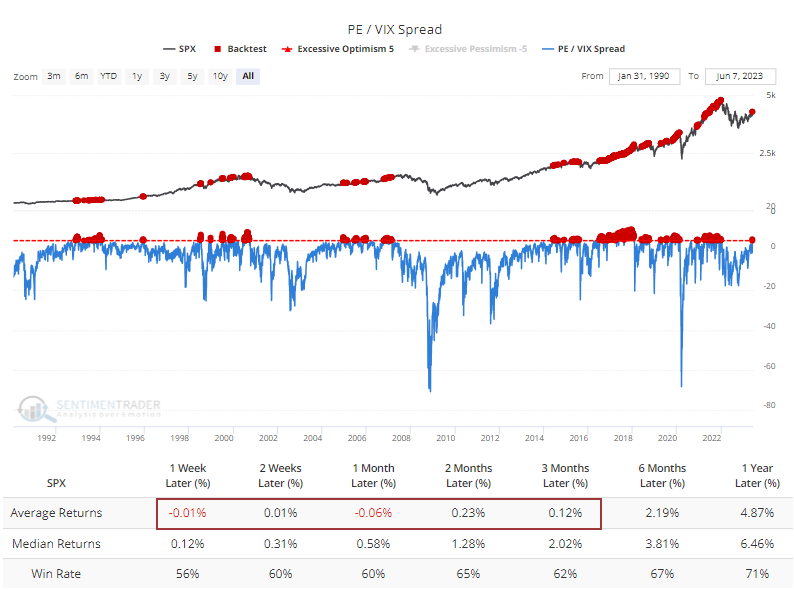
The forward price/earnings ratio for the S&P 500 has recently pushed higher while the VIX gauge of implied future volatility has tanked. The spread between the two measures now exceeds five points for the first time since the opening session of 2022.
The Backtest Engine shows that when the spread is above five points, average returns in the S&P 500 going forward were quite a bit below a random return and were especially poor up to three months later.
Median returns were better, with the difference between "average" and "median" telling us that some substantial declines dragged down the overall average. Still, the S&P managed to show a positive return most of the time across all time frames.
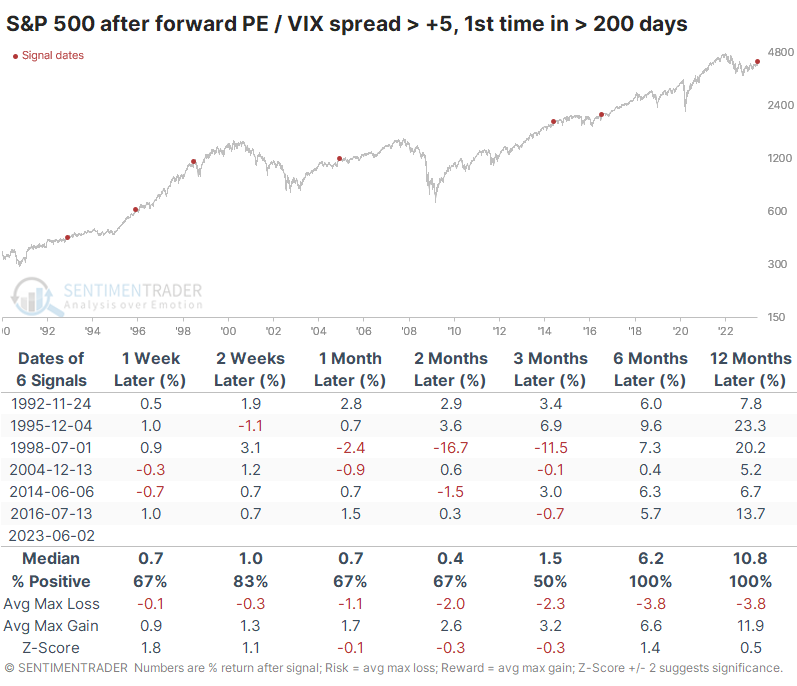
The first signal led to rallies in stocks but also increased volatility
If we take a signal-based approach, the implications change somewhat. The table below shows future returns in the S&P after the spread exceeded five points for the first time in at least 200 sessions. Again, up to three months later, stocks didn't do so well, with three moderate gains and three losses. But 6-12 months later, the S&P rallied every time.
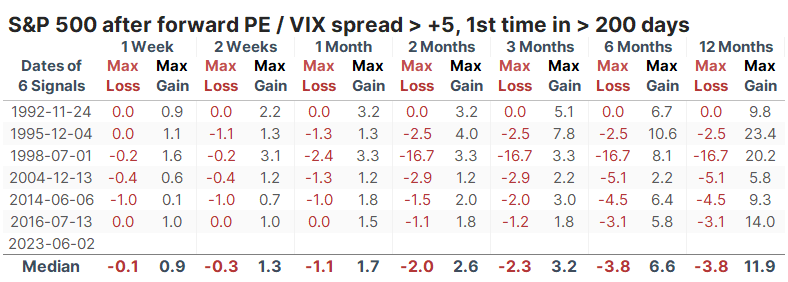
The table of maximum gains to maximum losses across each time frame shows that risk was relatively modest up to a year later. The S&P lost more than -5.1% at some point within the next year only once, in 1998. All the others saw only a small drawdown.
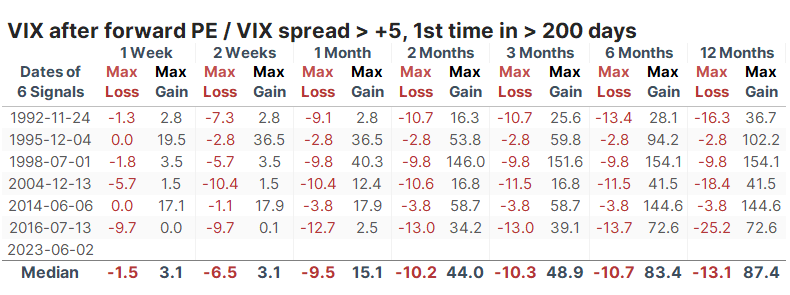
While stock returns and volatility tend to have an inverse relationship, it's not set in stone. Stocks can rally along with volatility expectations, though the inverse scenario (stocks down, volatility down) tends to occur much less frequently.
We can see that in the table below. It shows how the VIX performed after extremes in the PE/VIX spread. The VIX spiked every time over the next three months, even though the S&P sported a gain half the time.
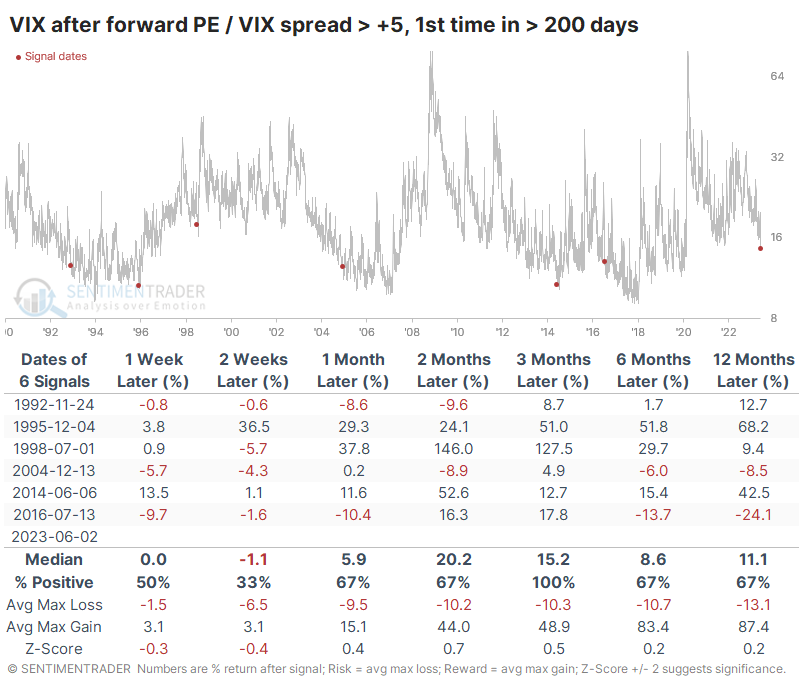
The table of max gains and losses across time frames shows particularly egregious differences between three and six months. Over those time frames, the VIX averaged a maximum decline of less than -11% while spiking an average of 49% and 83%, respectively.
What the research tells us...
Valuation metrics for the most benchmarked index in the world never exactly got cheap during the tumult of 2022. The recent rally has pushed many of them from "not cheap" to downright expensive. The forward price/earnings ratio for the S&P 500 is far above what traders are pricing in for volatility expectations, a condition that has preceded weak returns in the months ahead. But when the condition triggered for the first time in a while, those returns were still positive - the weakness tended to occur after the P/E was well above the VIX for weeks or even months. There is a stronger case to be made that even if stocks rally, volatility may not come down much and is likely to spike significantly.
Indicators at Extremes
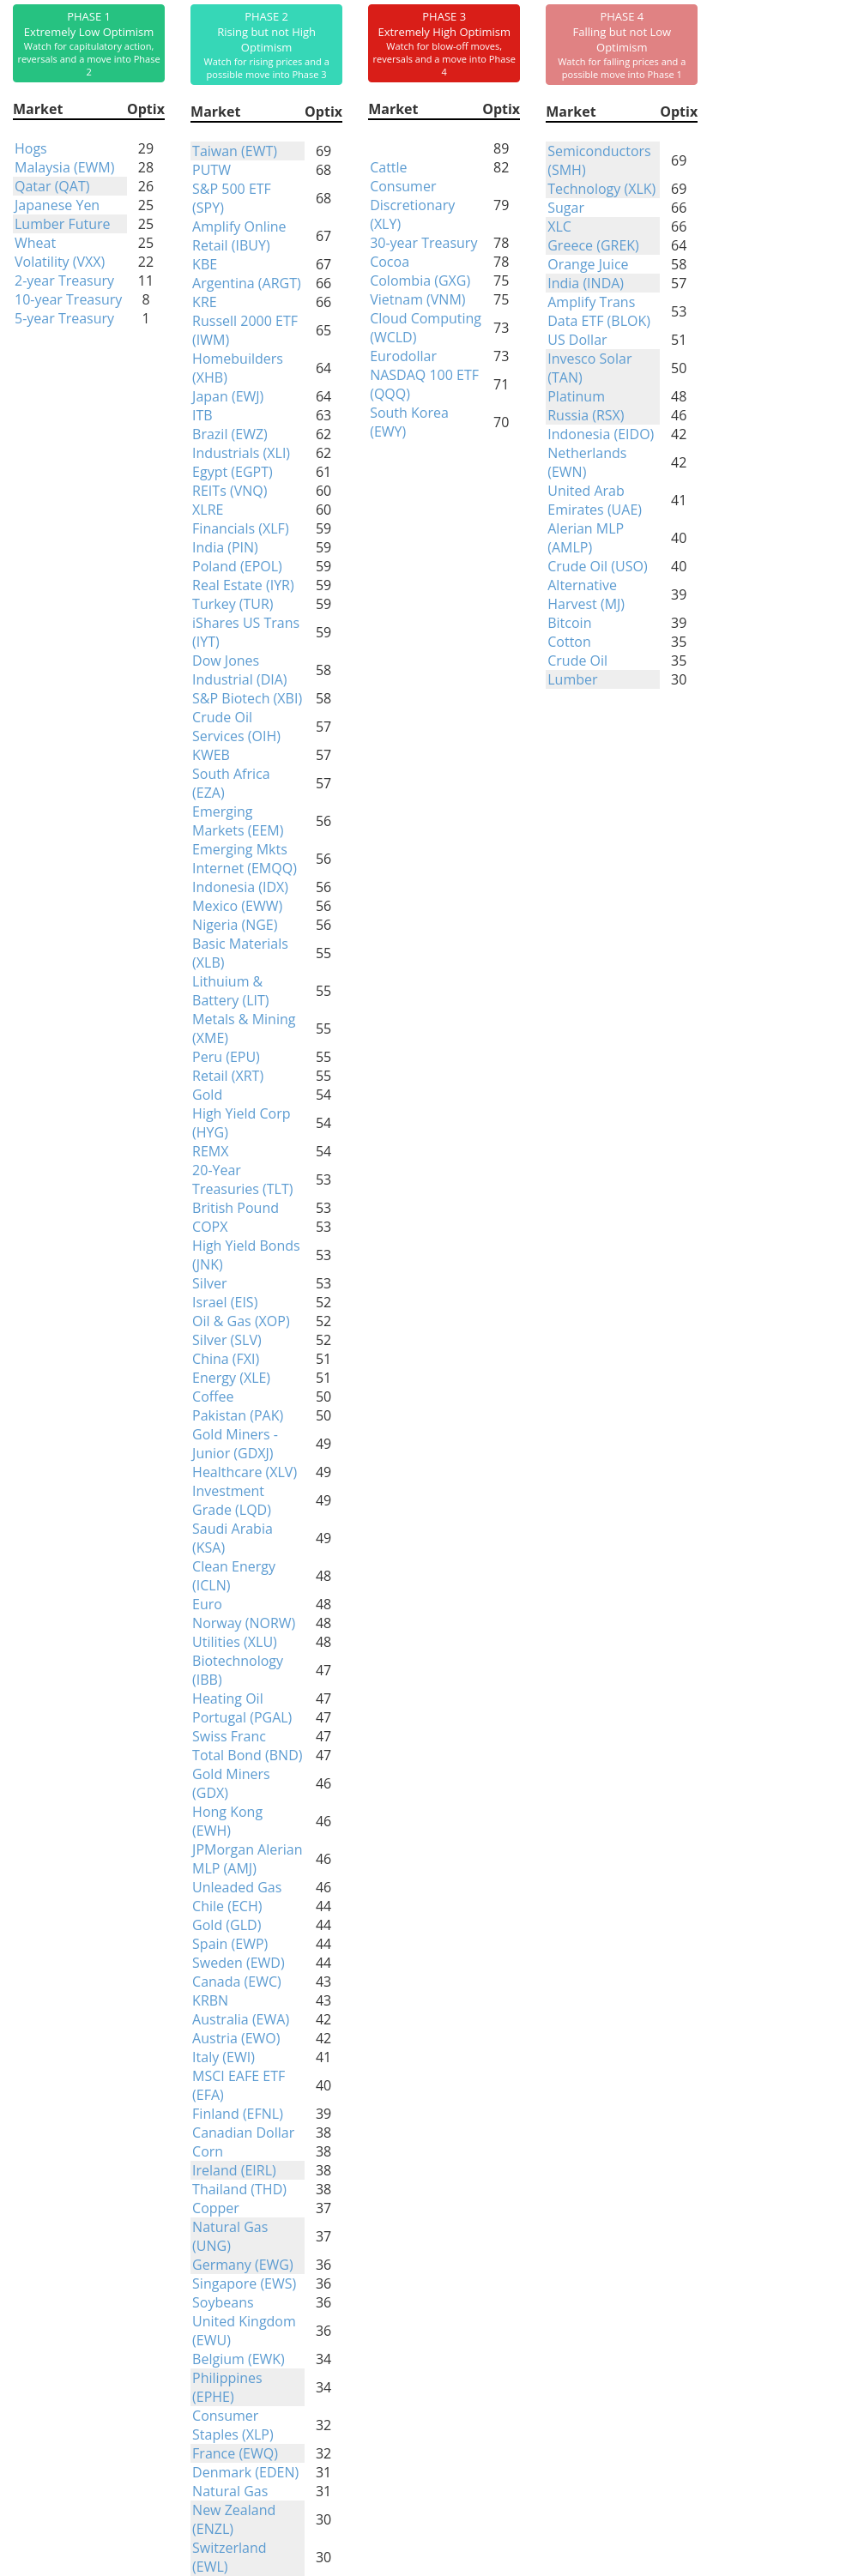
Phase Table
Ranks
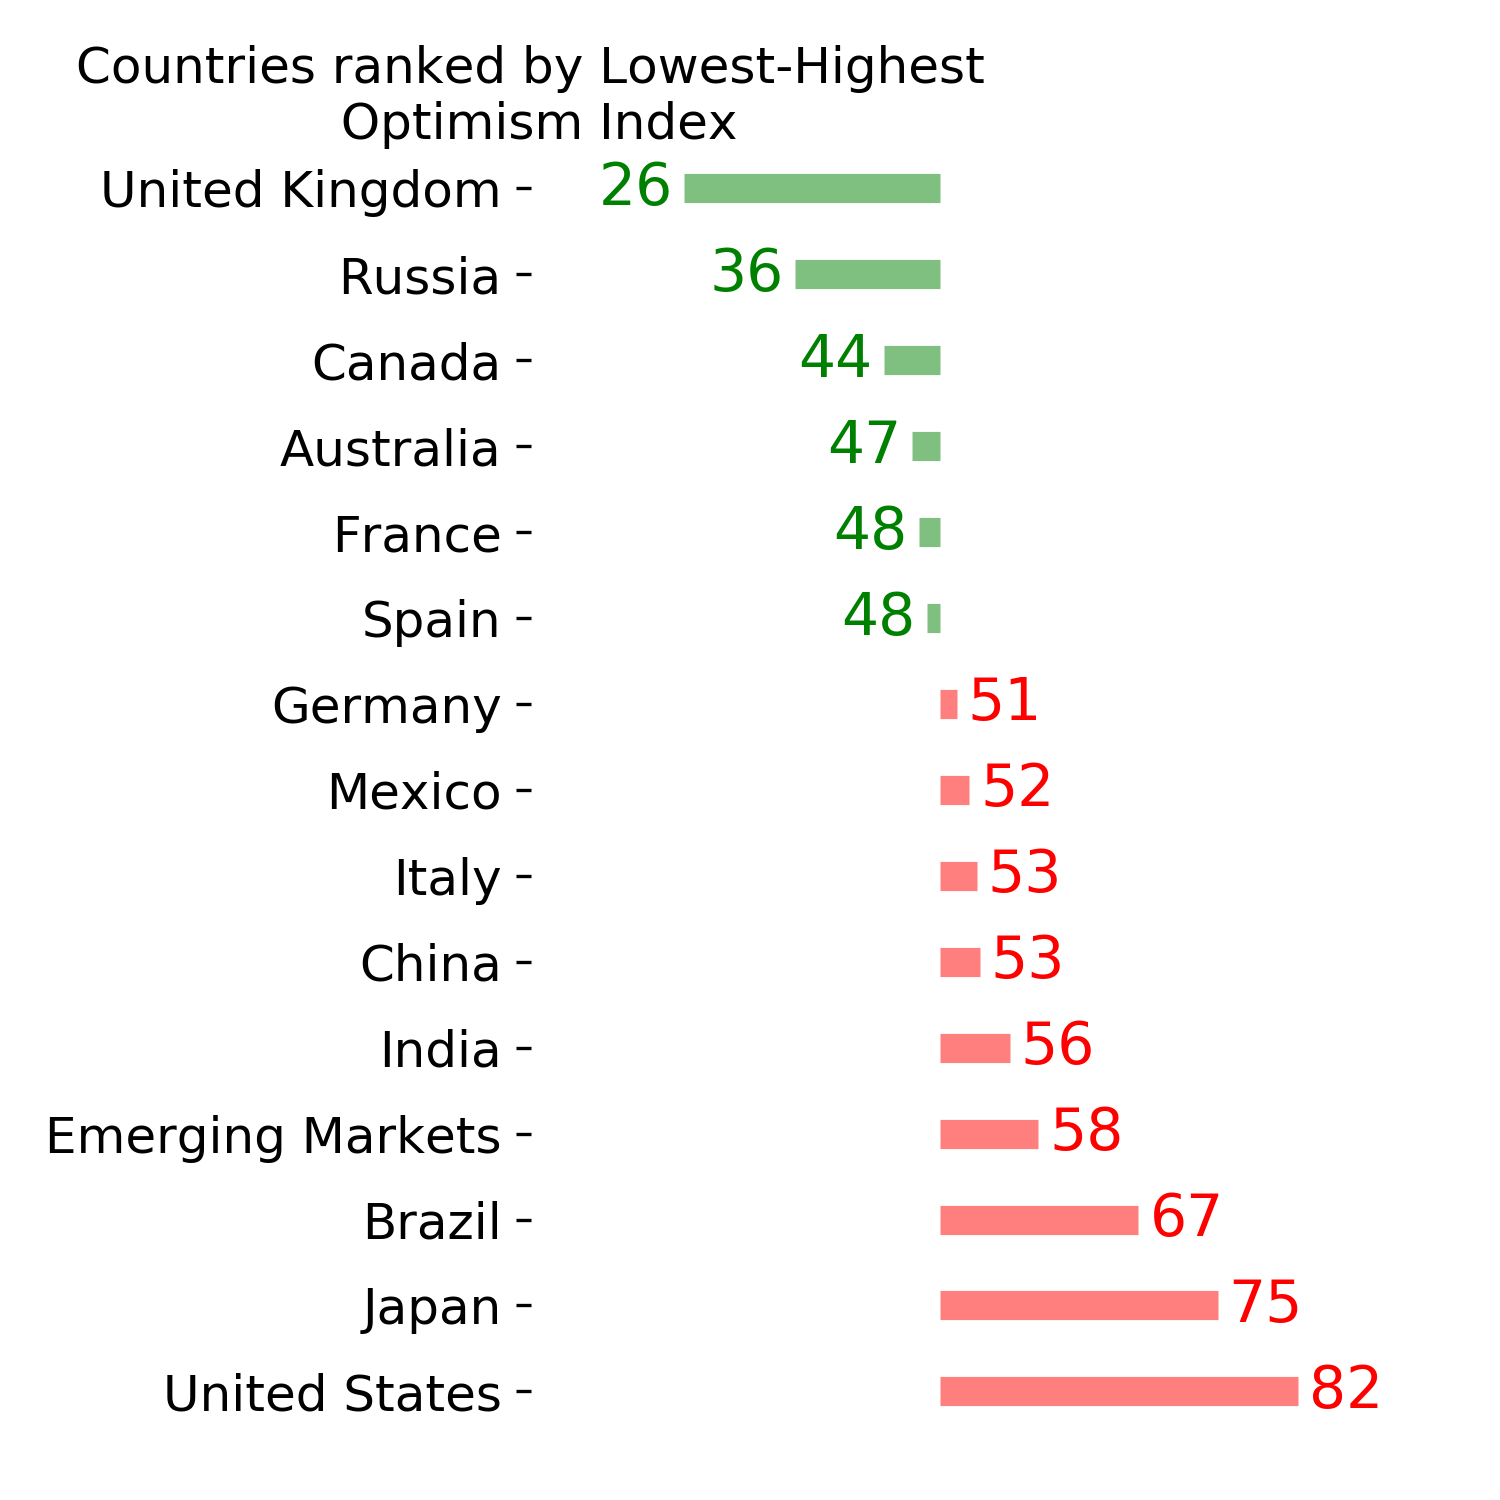
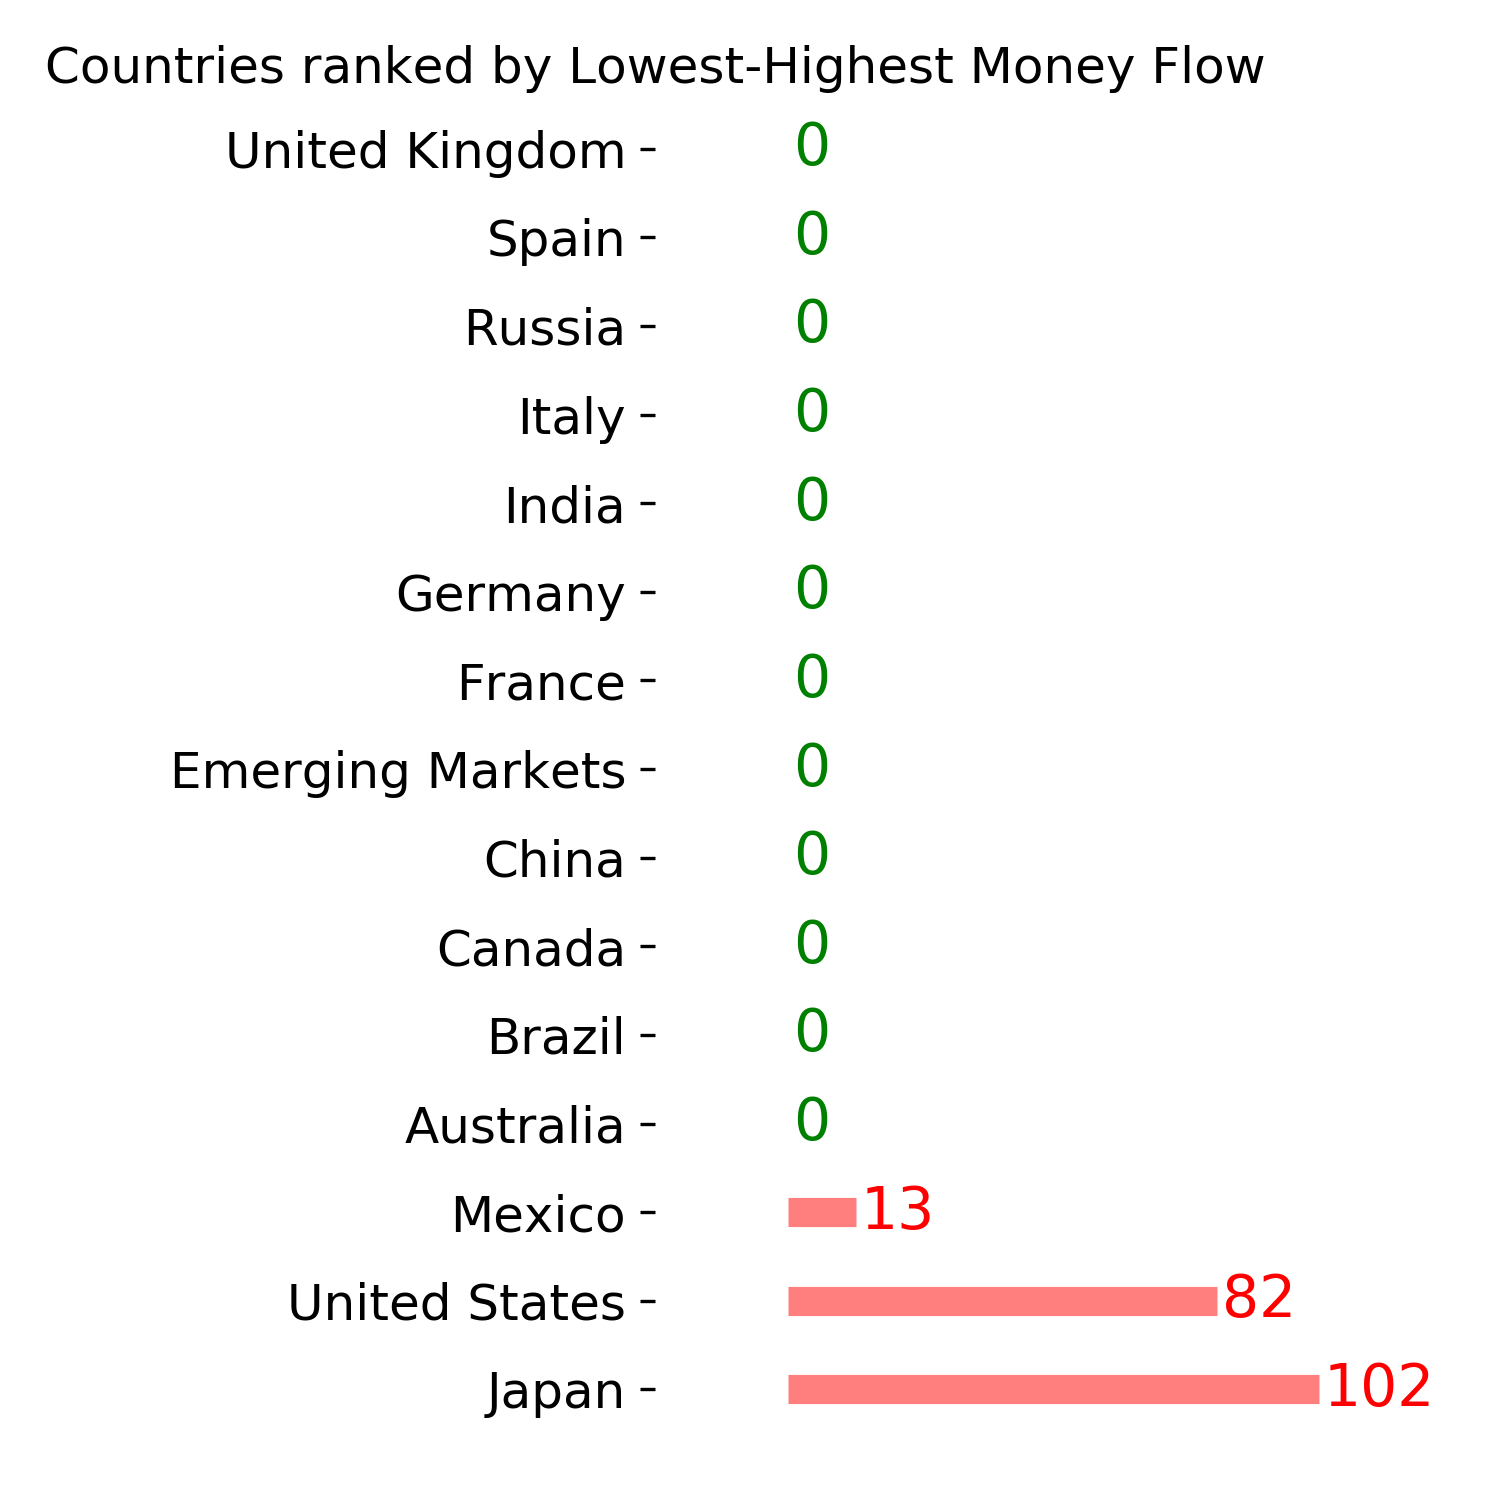
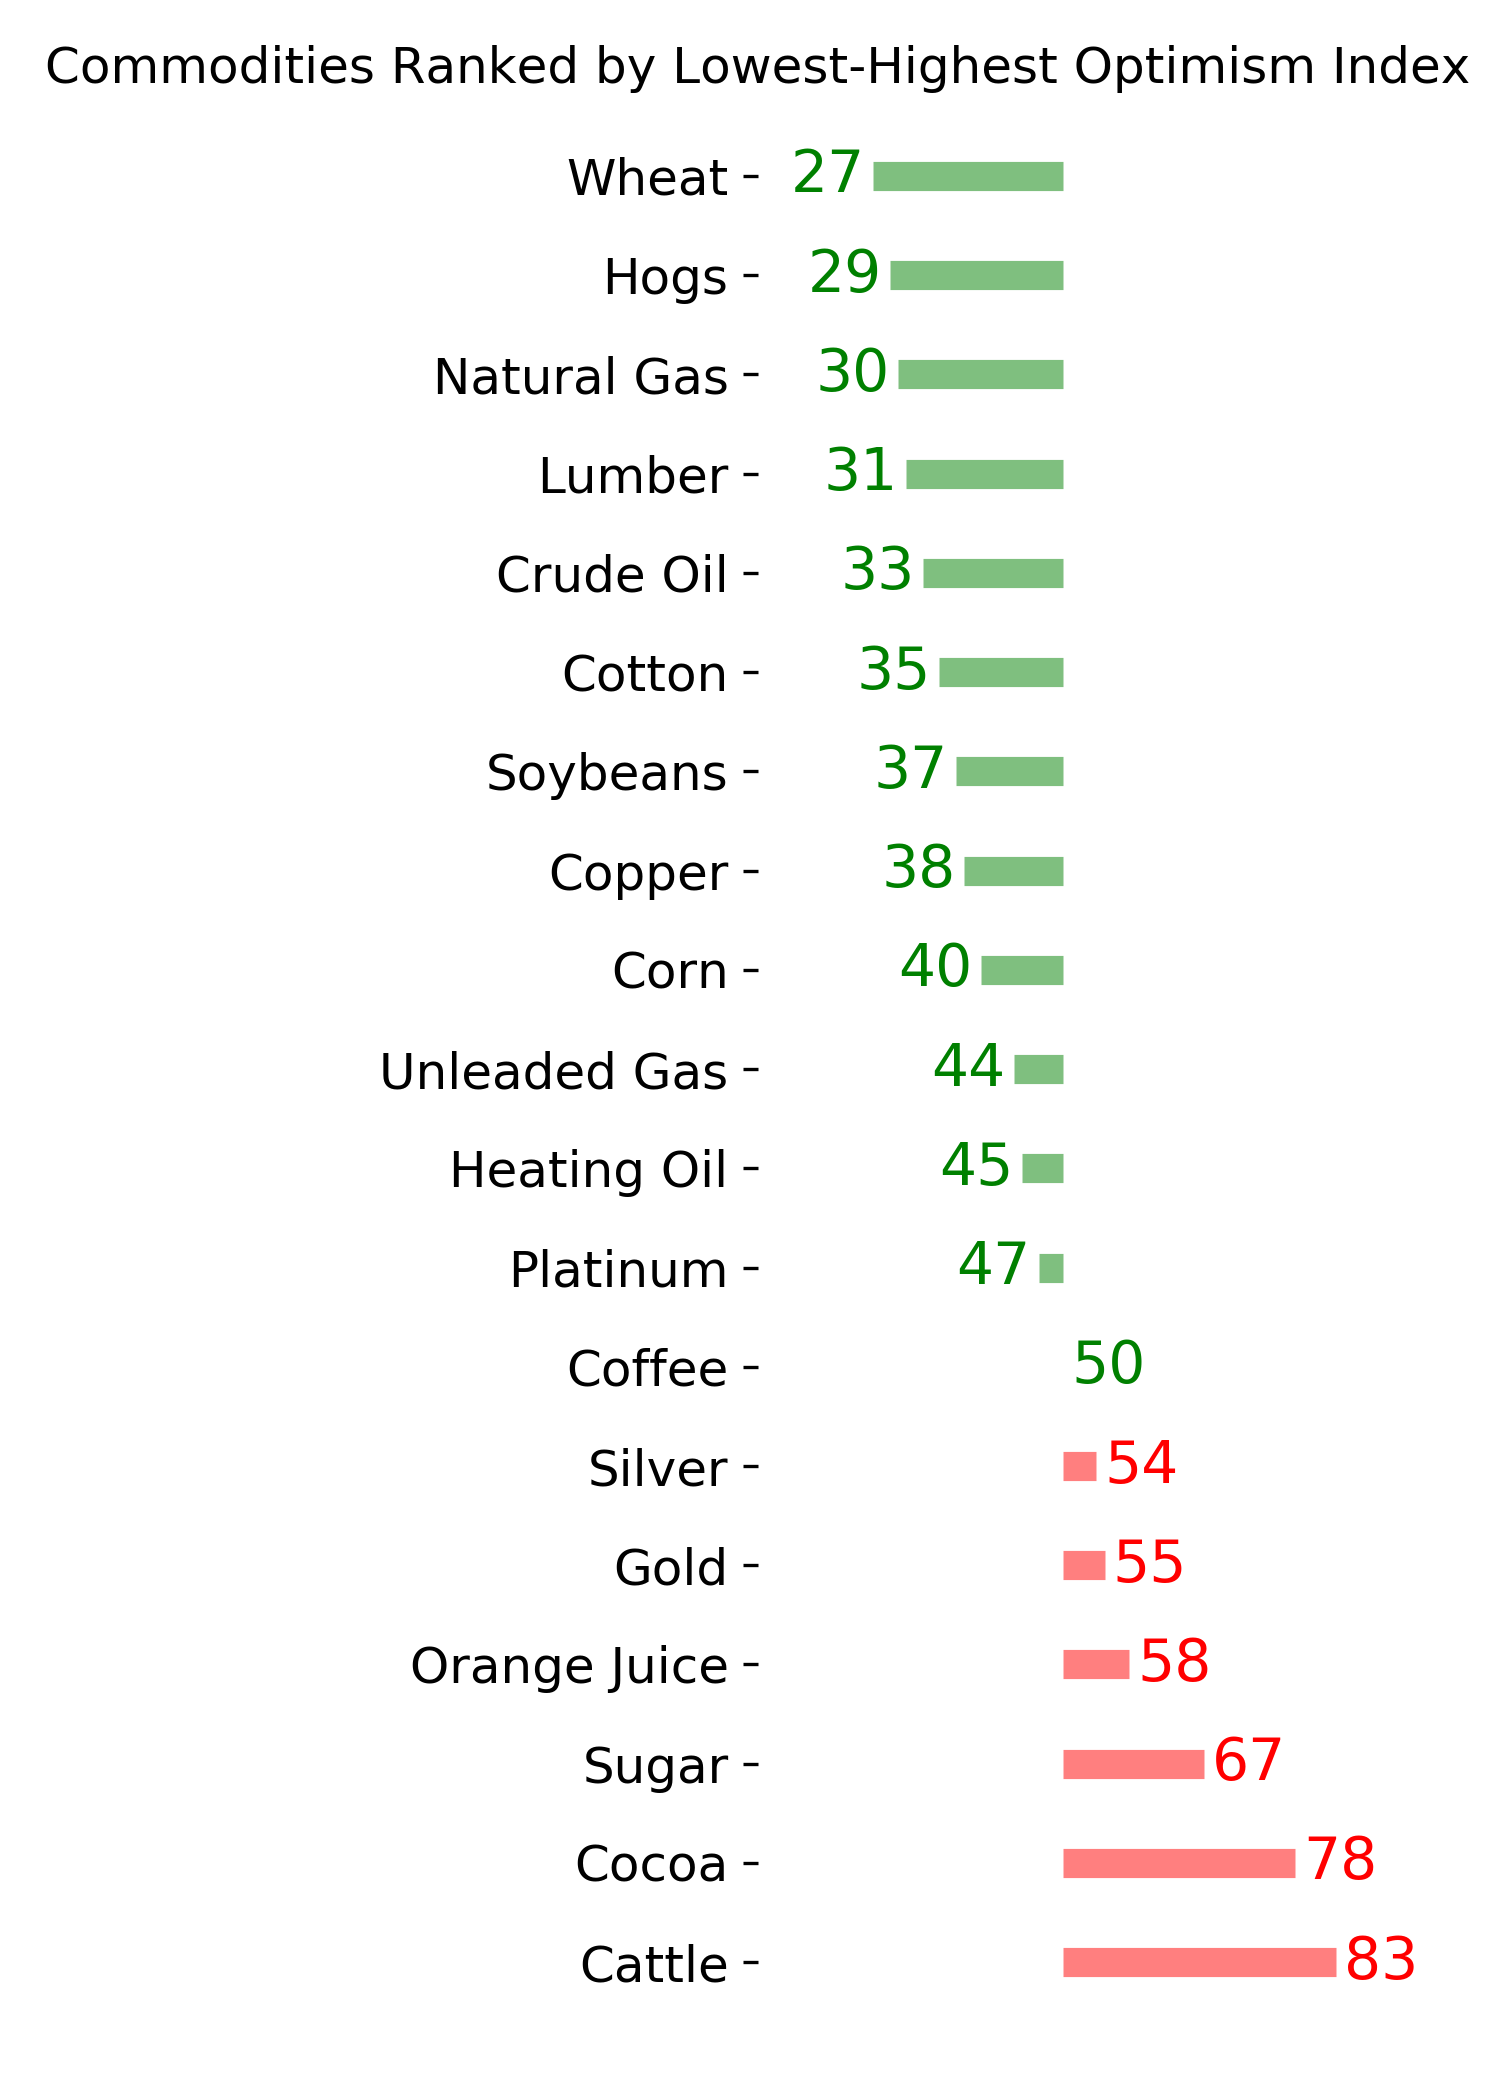
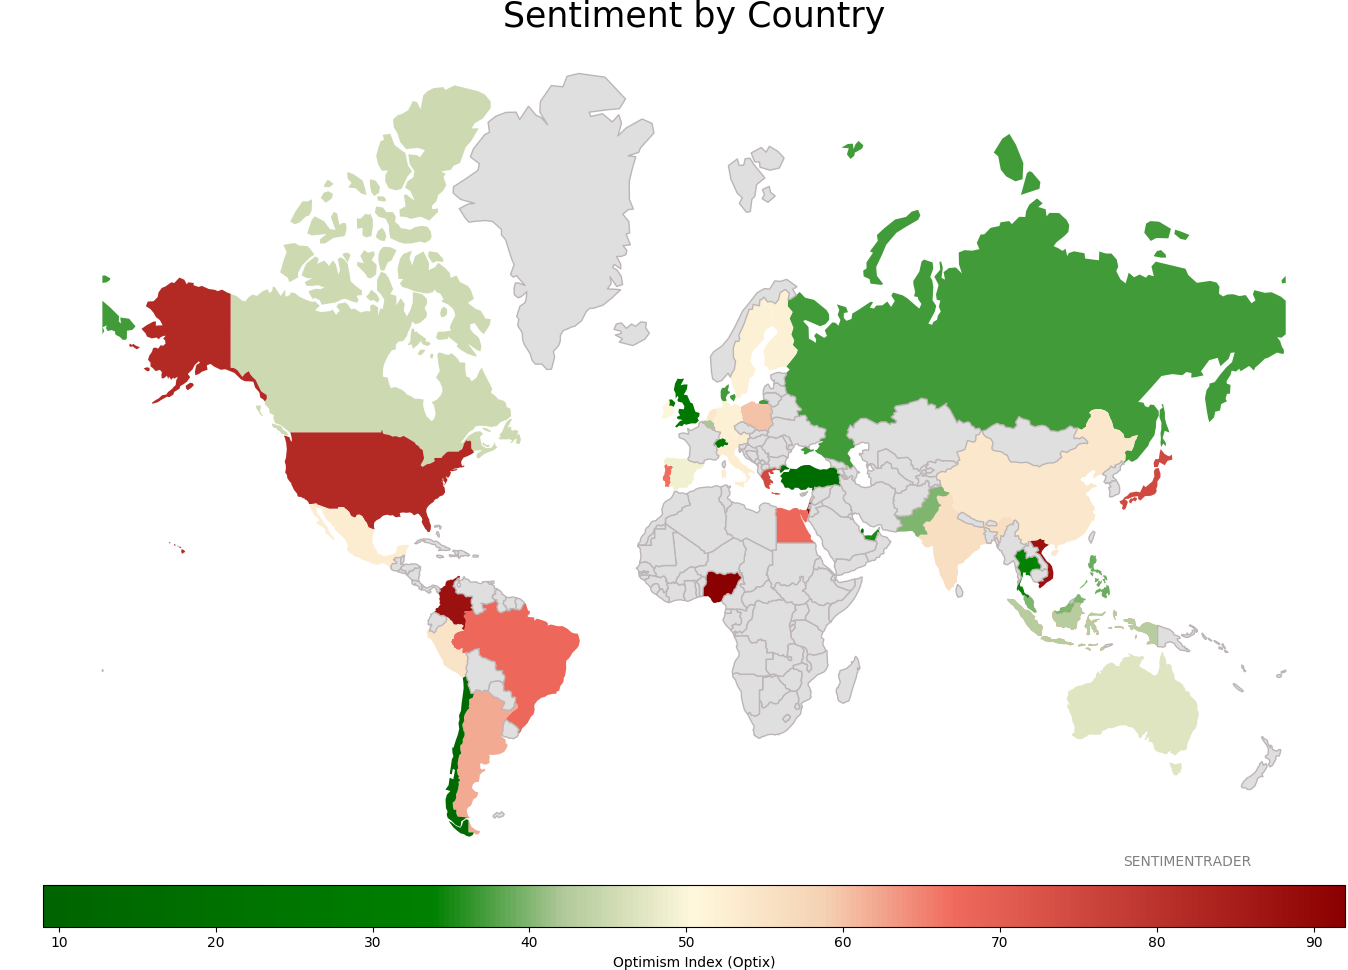
Sentiment Around The World
Optimism Index Thumbnails
|
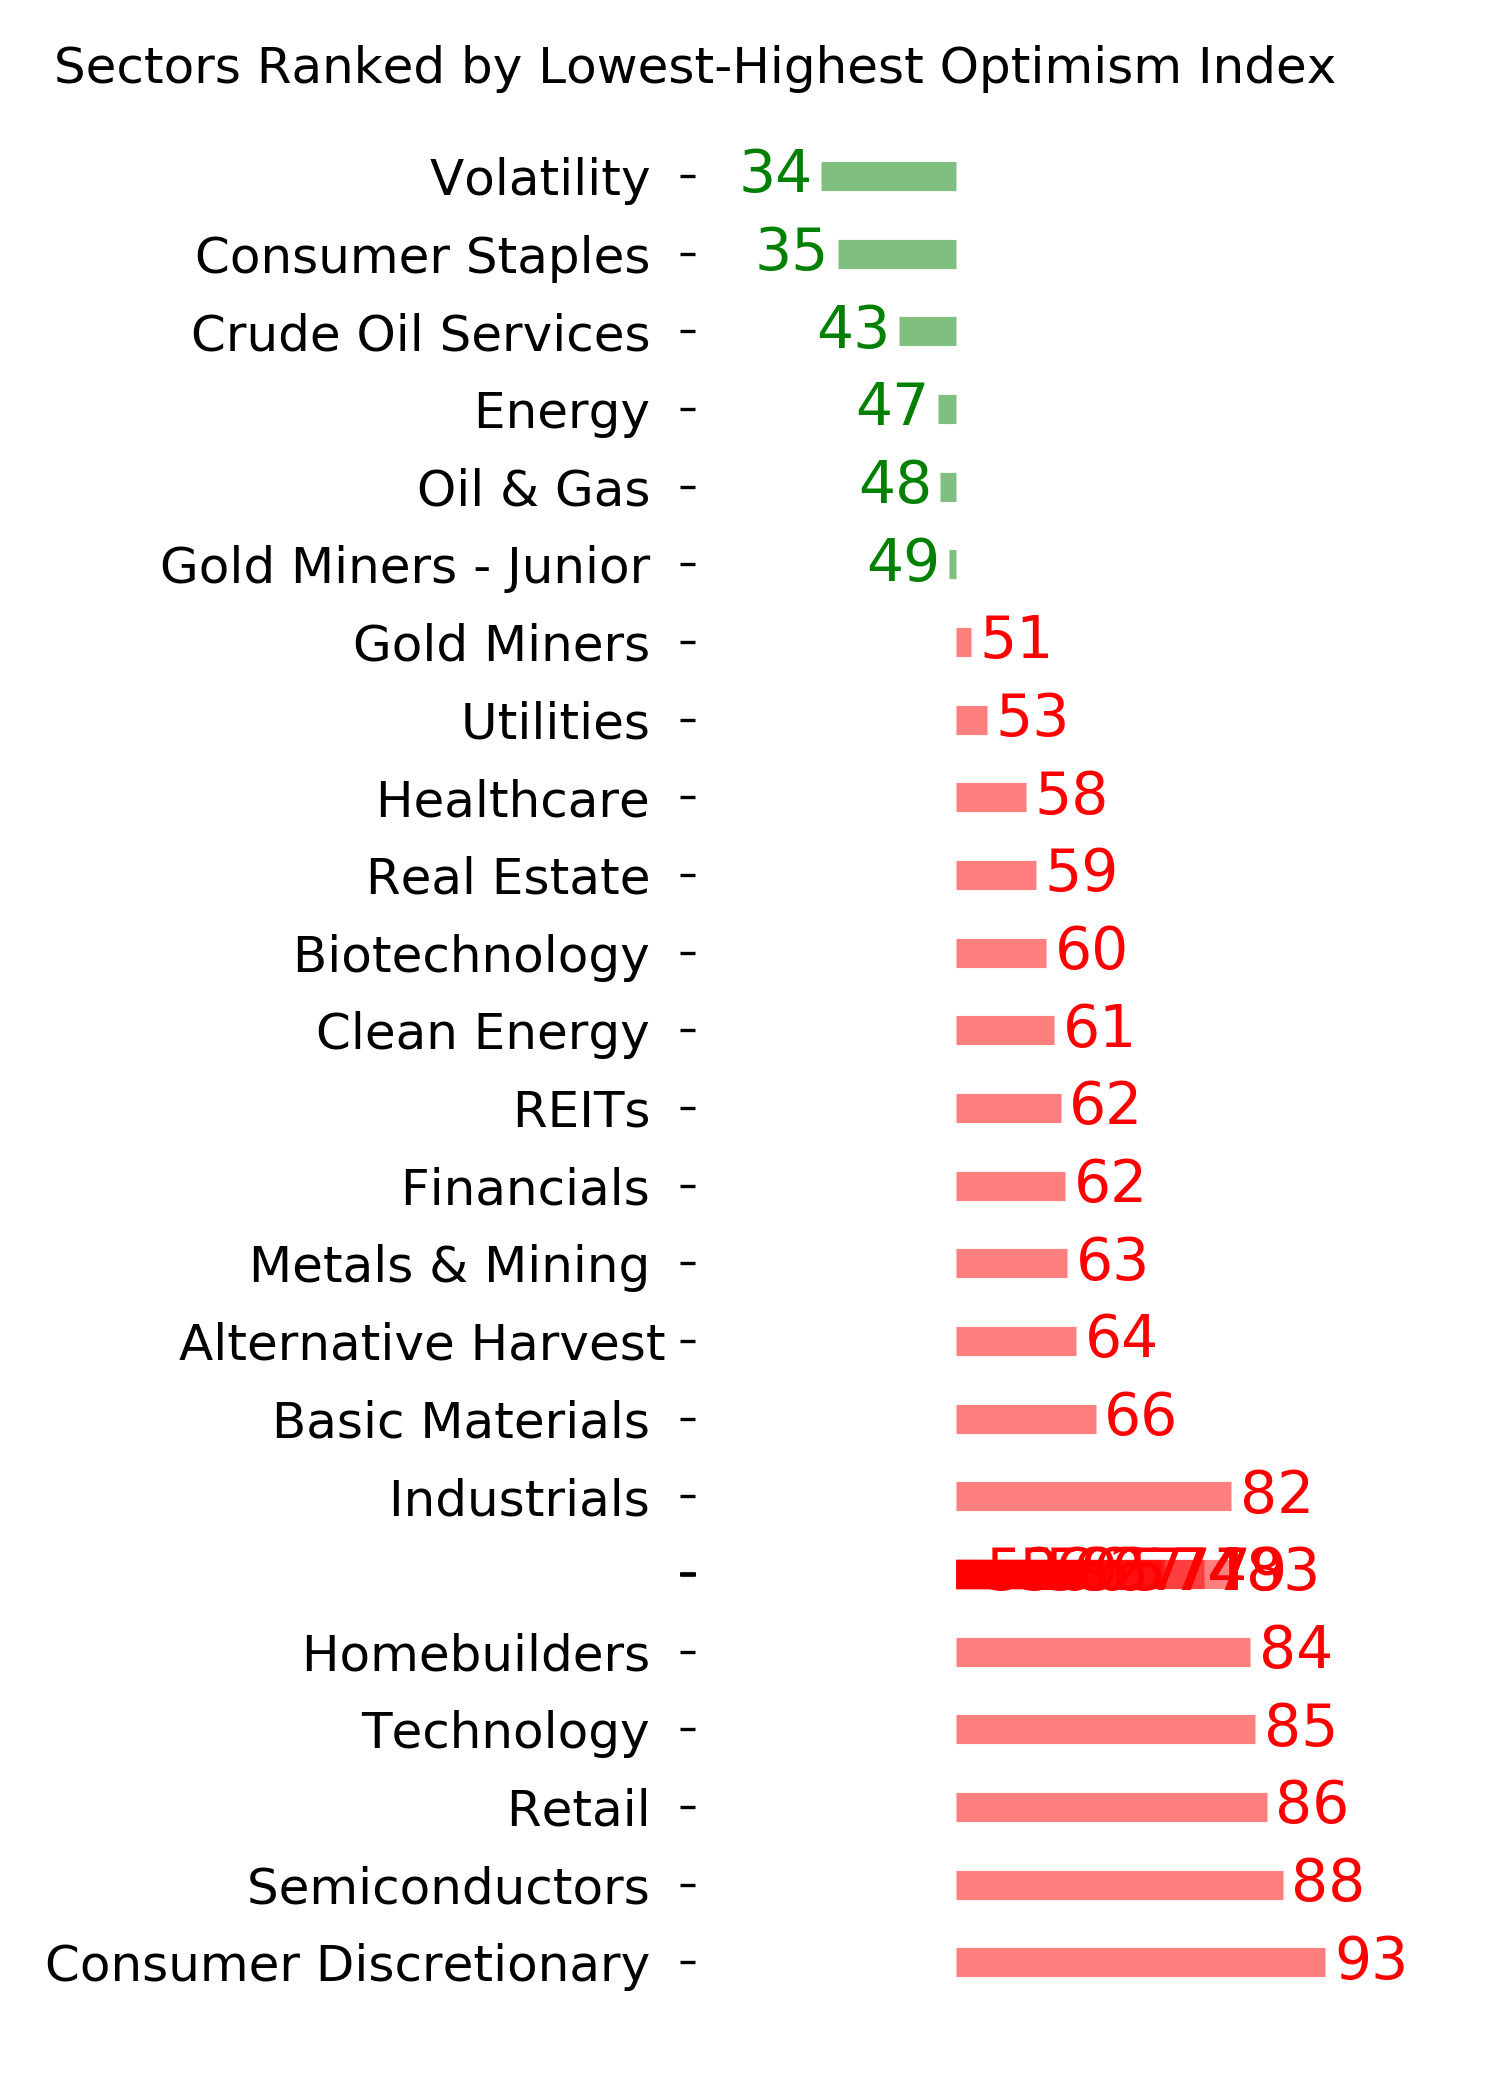
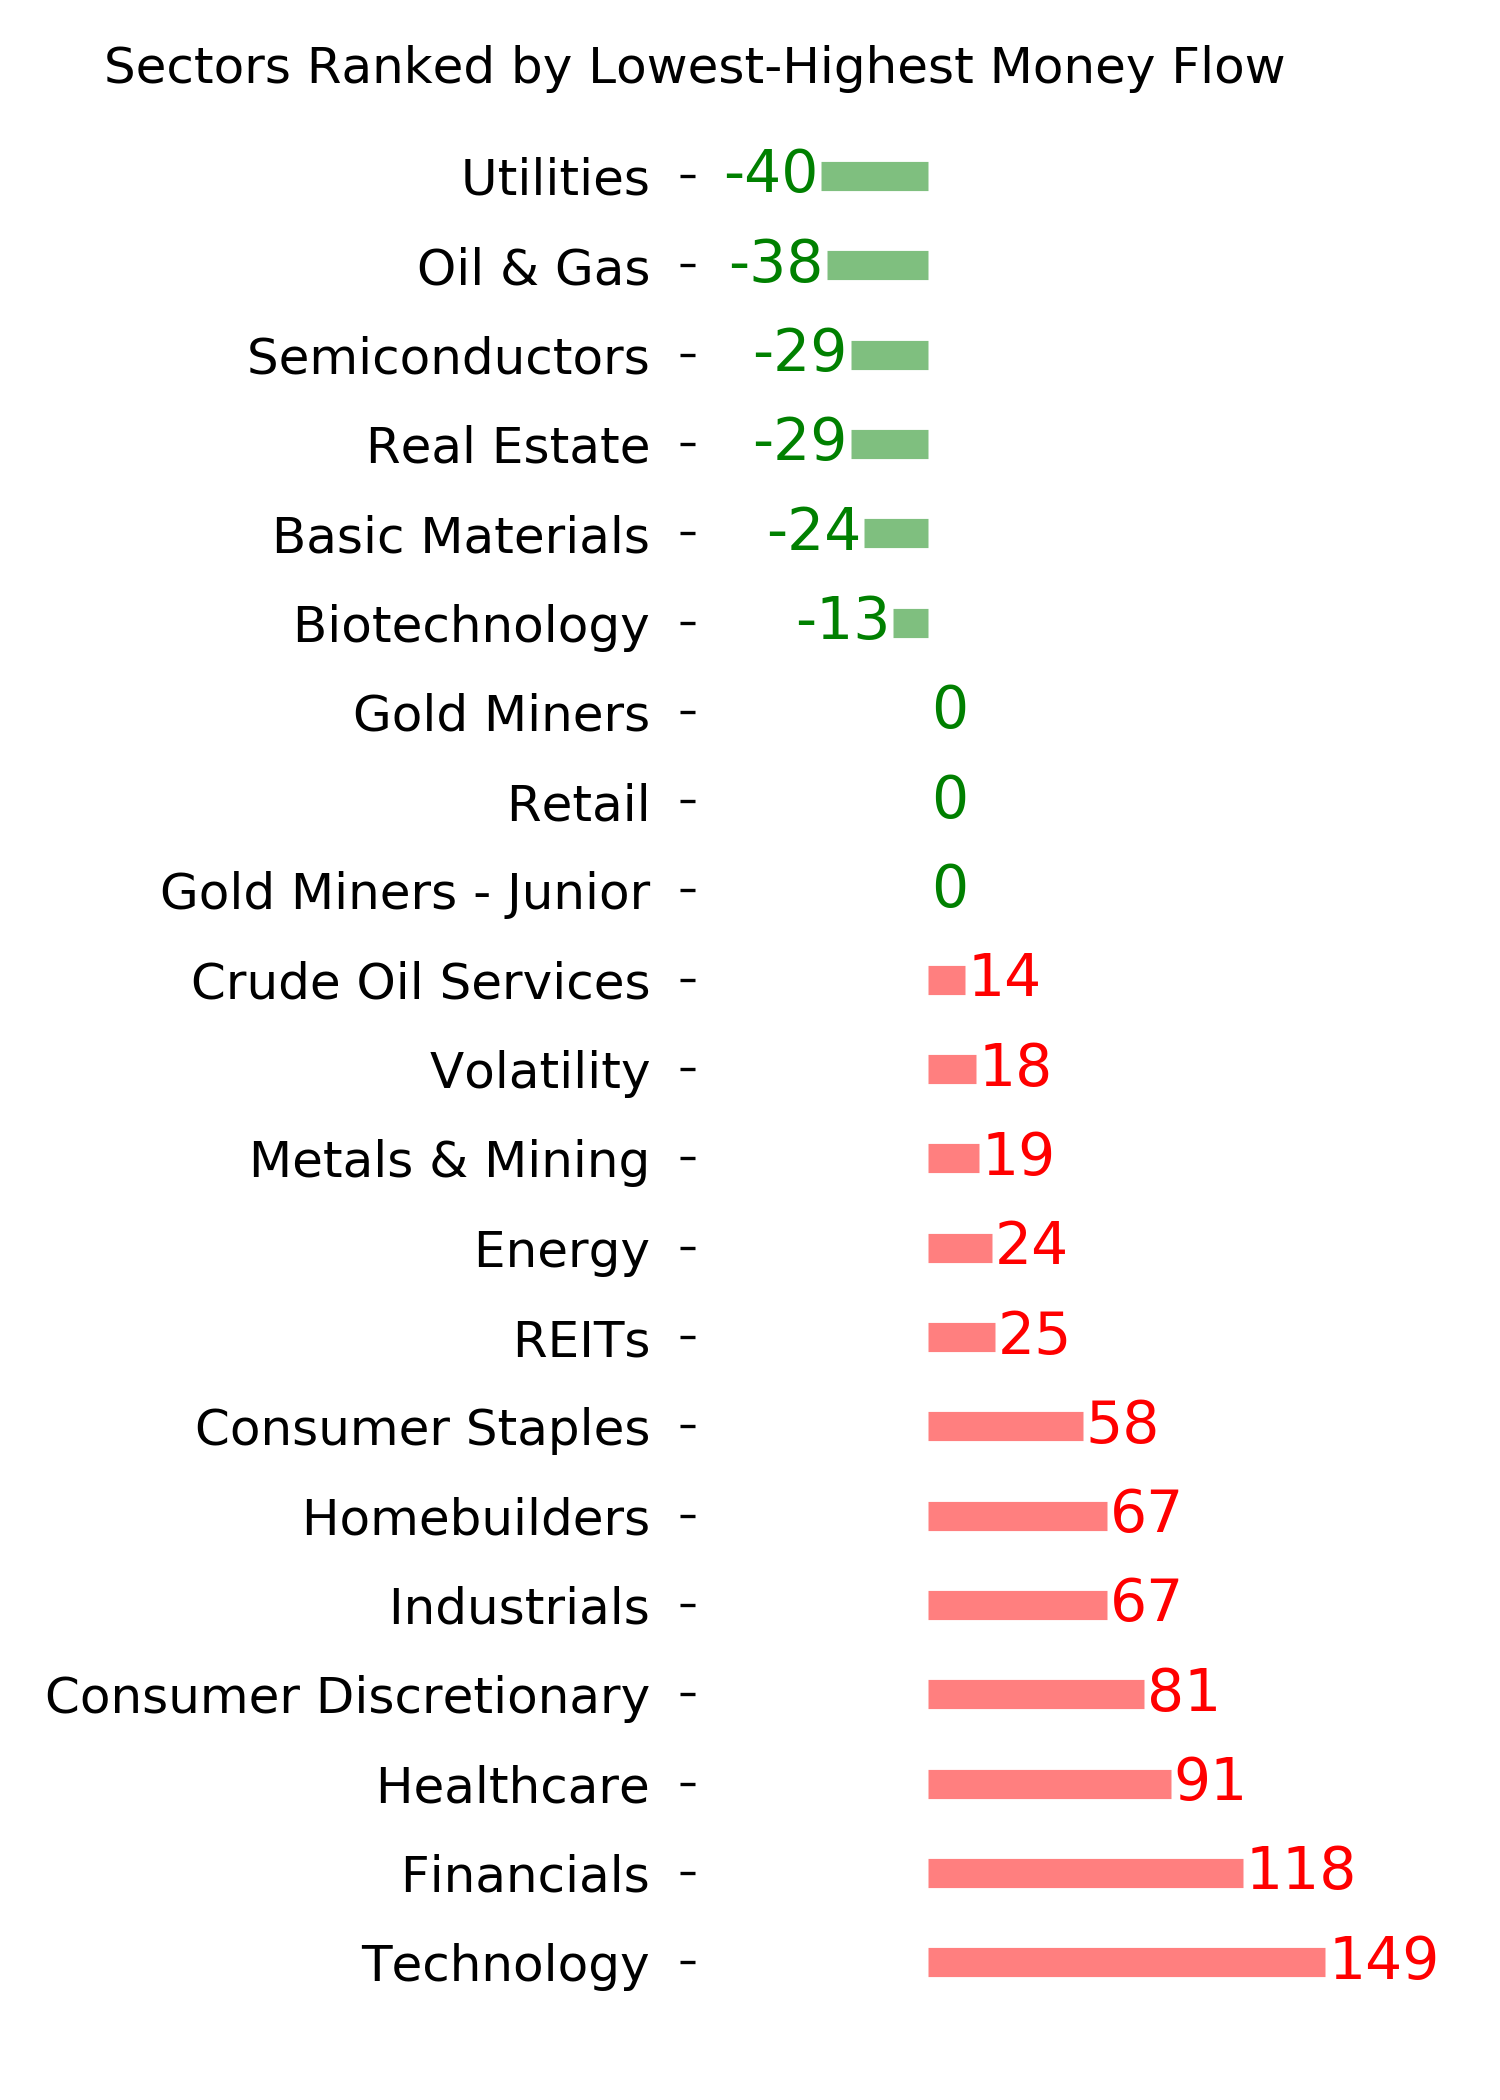
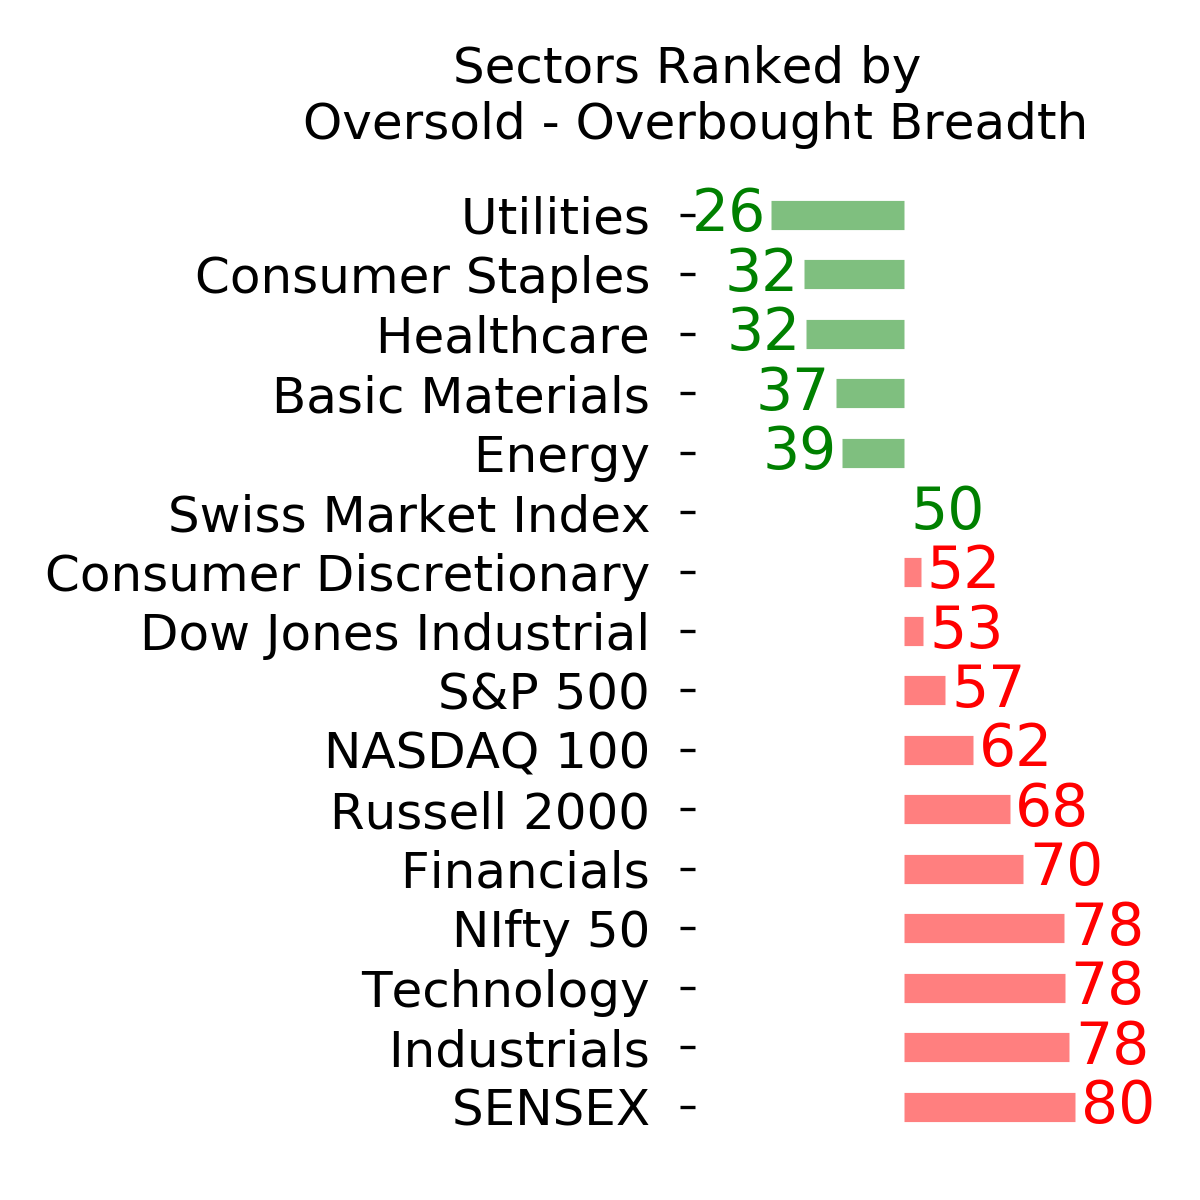
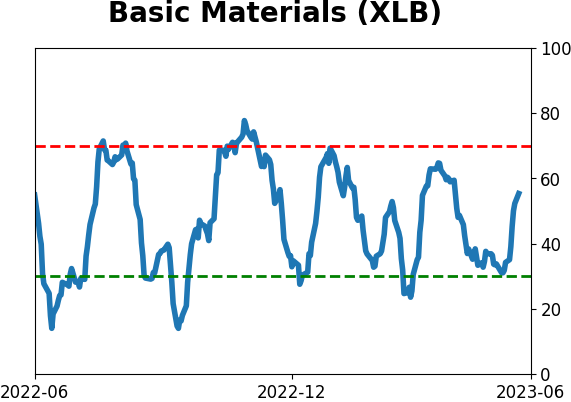
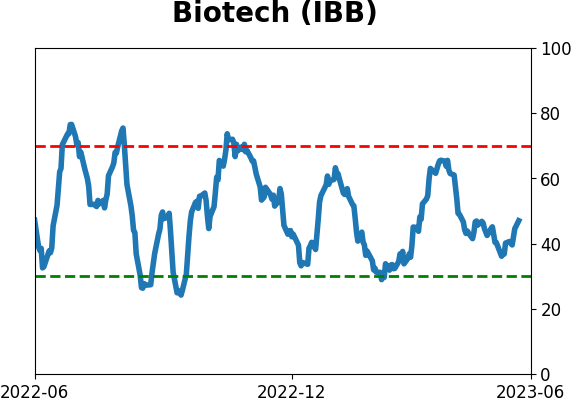
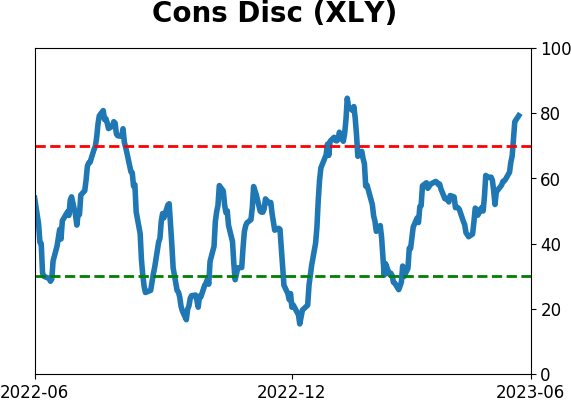
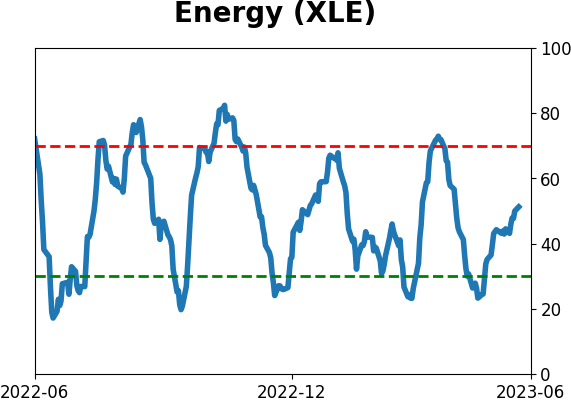
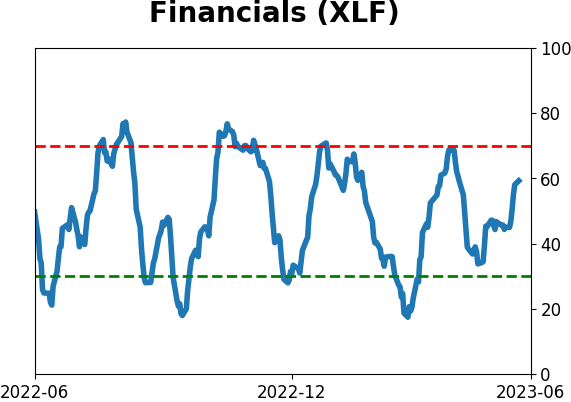
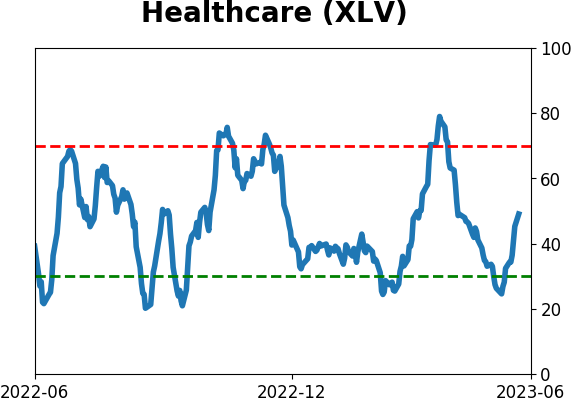
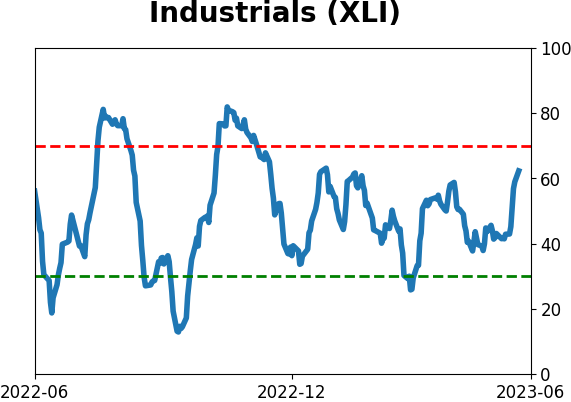
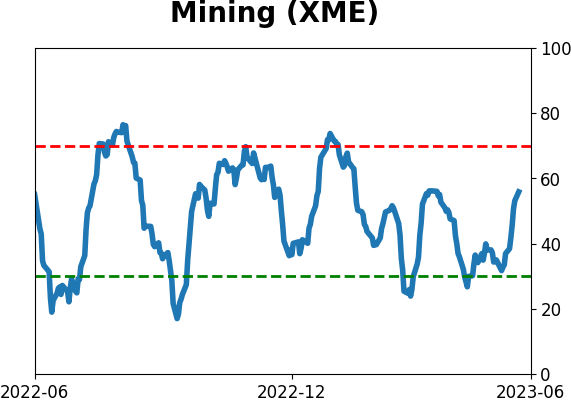
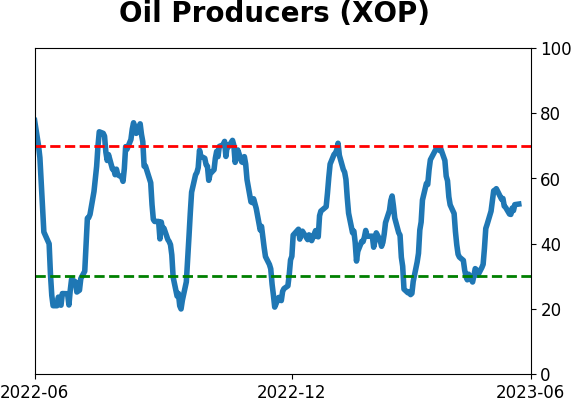
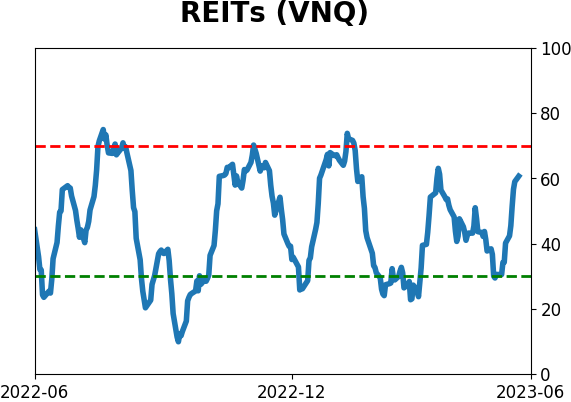
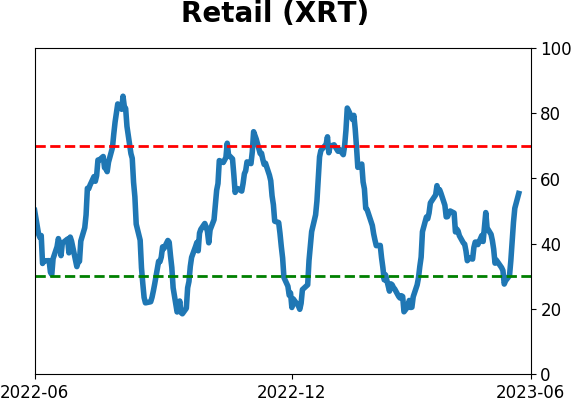
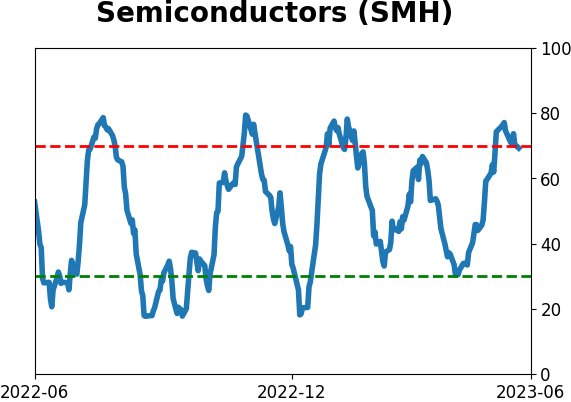
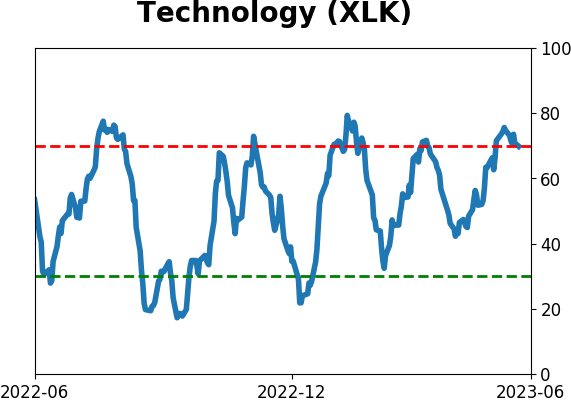
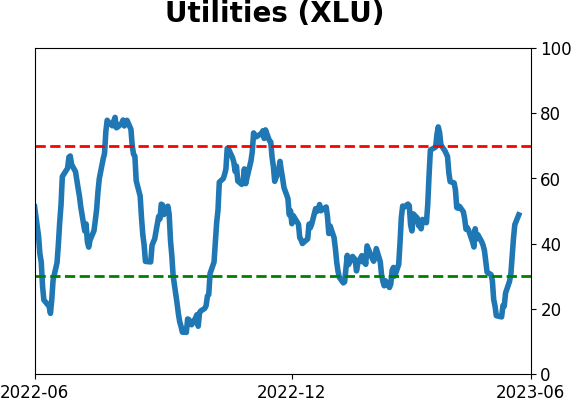
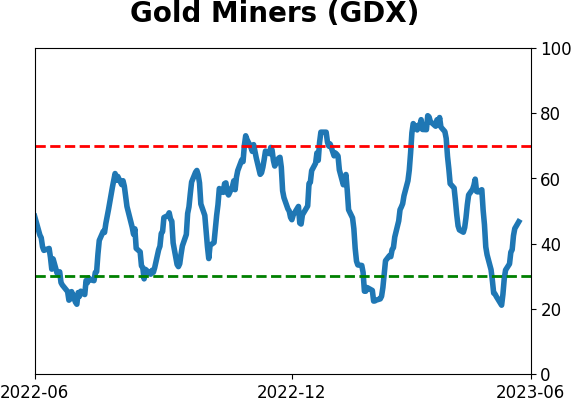
Sector ETF's - 10-Day Moving Average
|
|
|
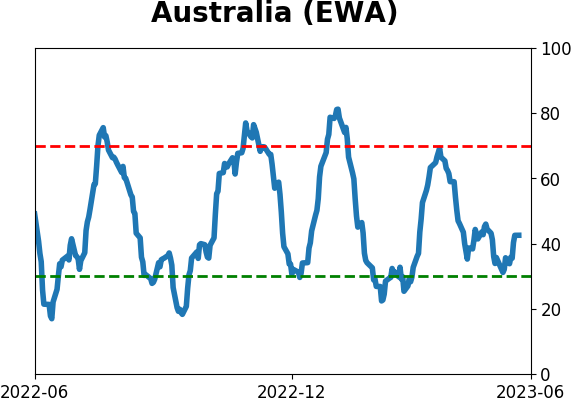
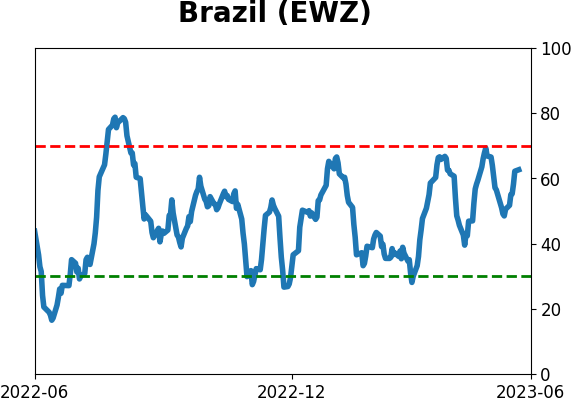
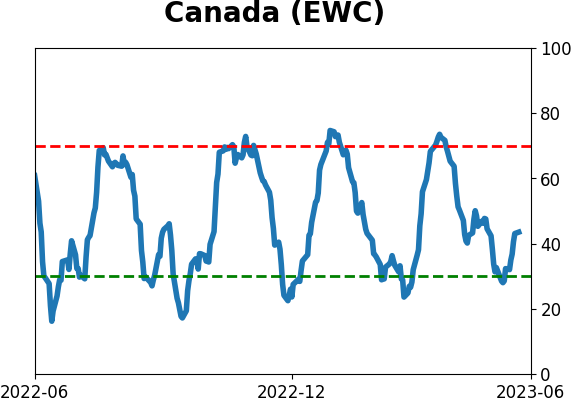
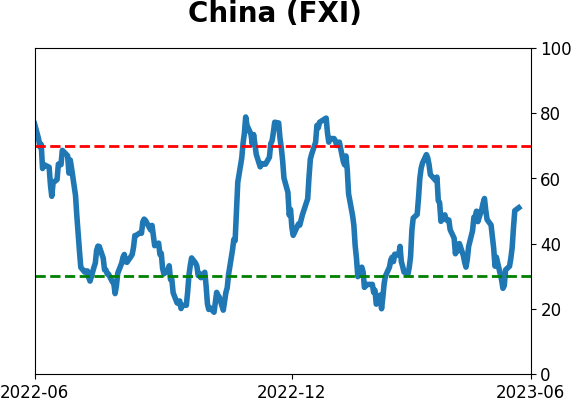
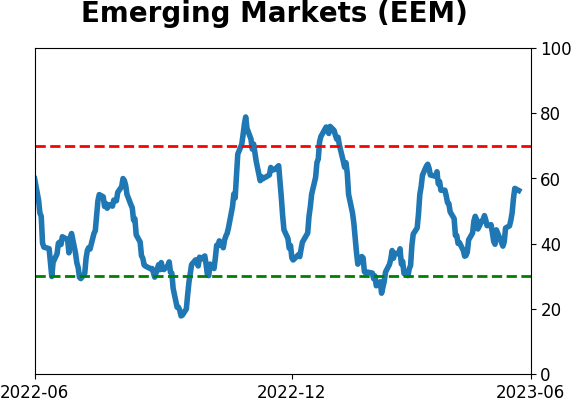
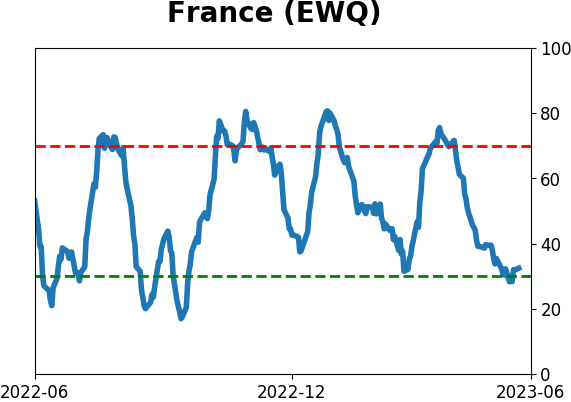
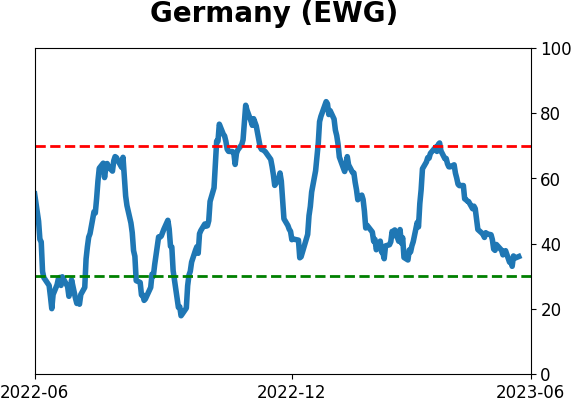
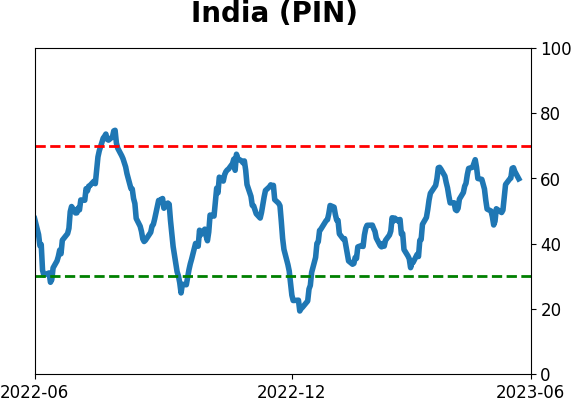
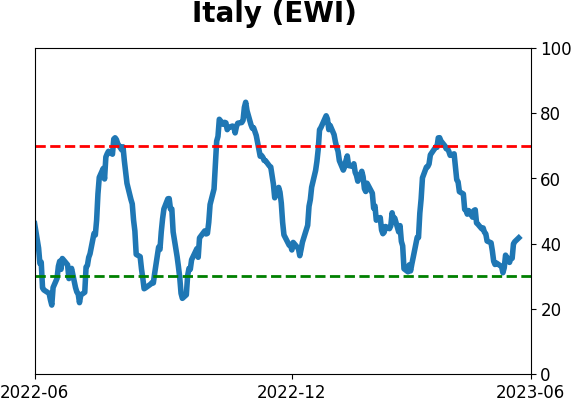
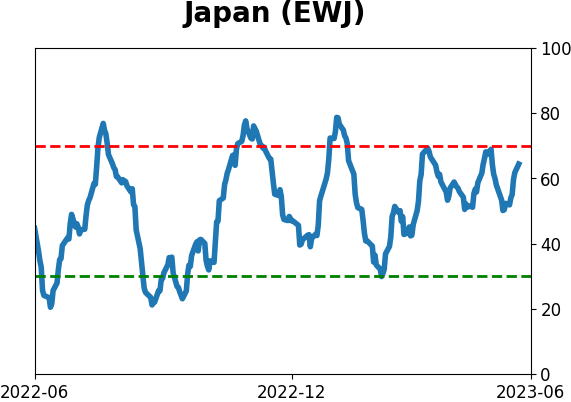
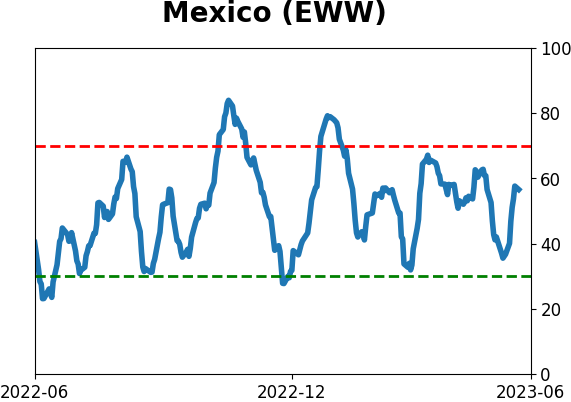
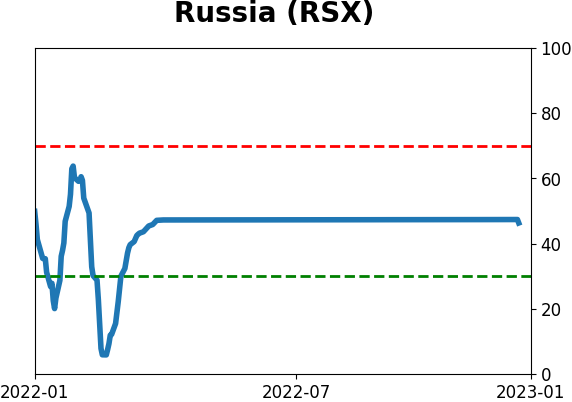
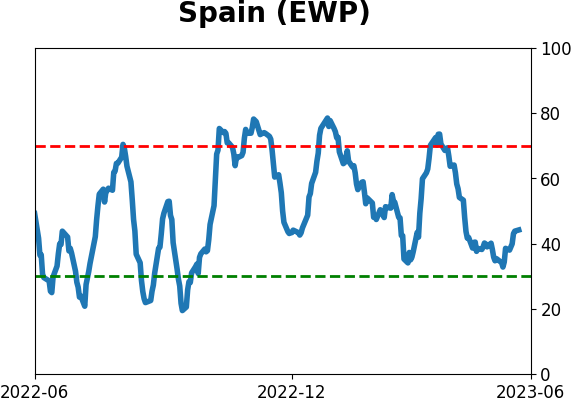
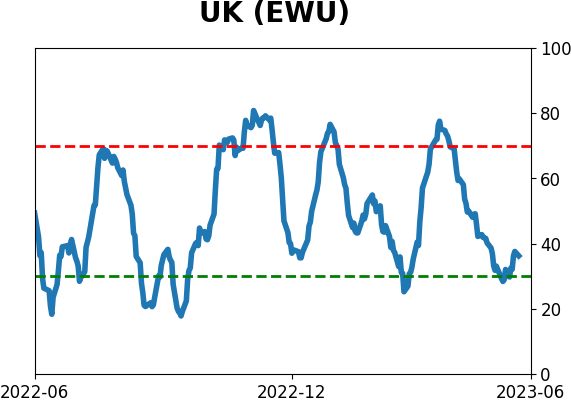
Country ETF's - 10-Day Moving Average
|
|
|
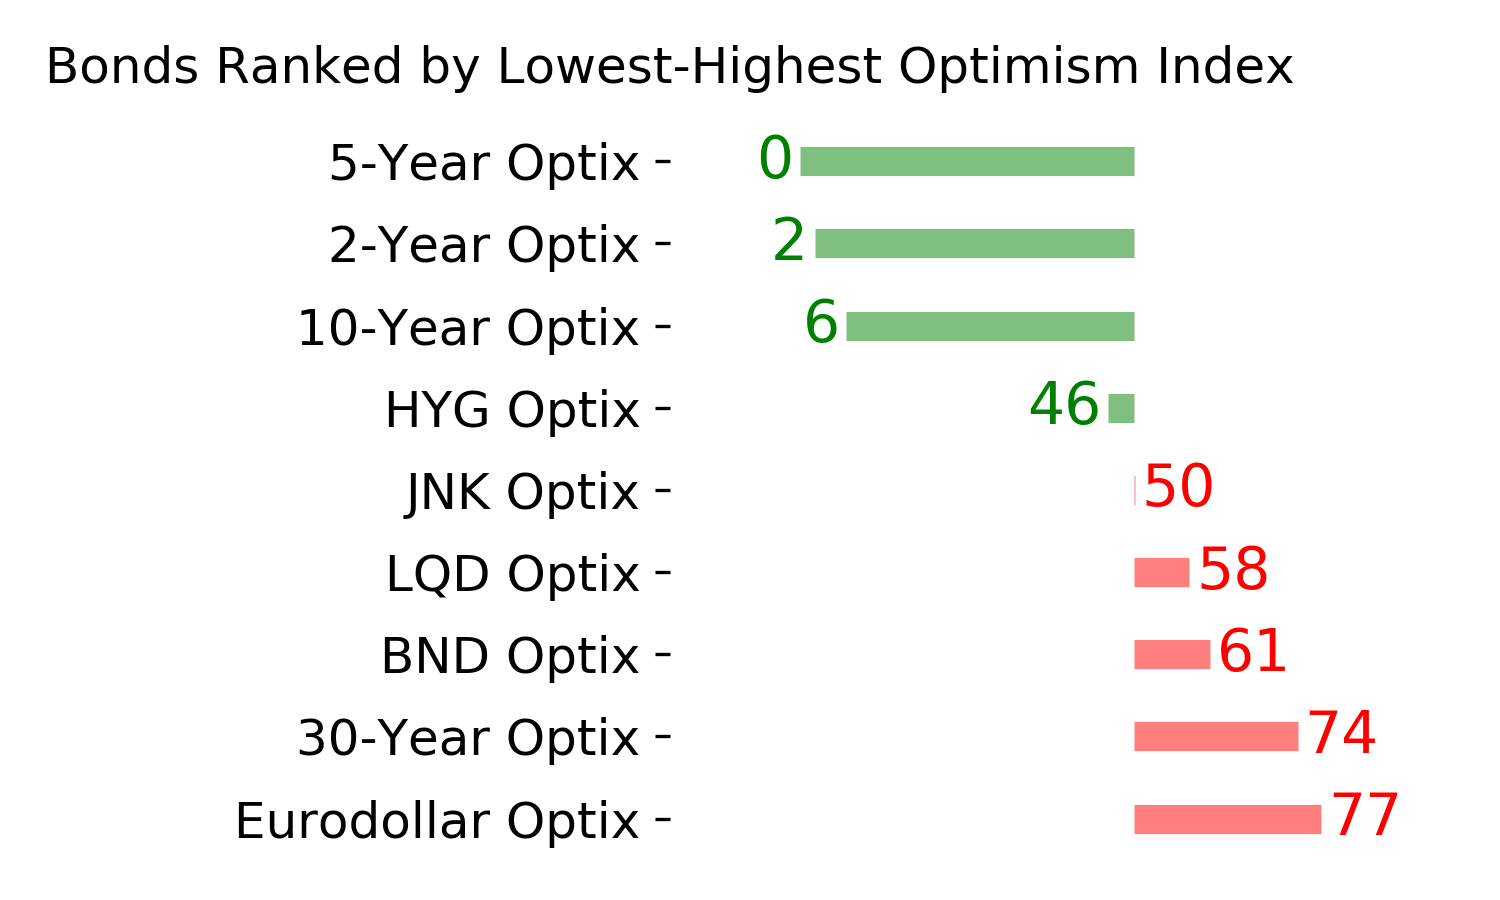
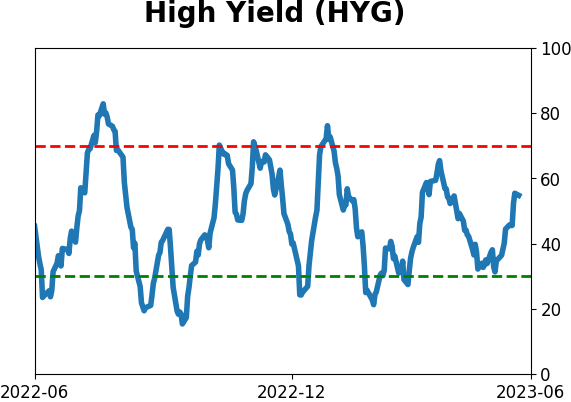
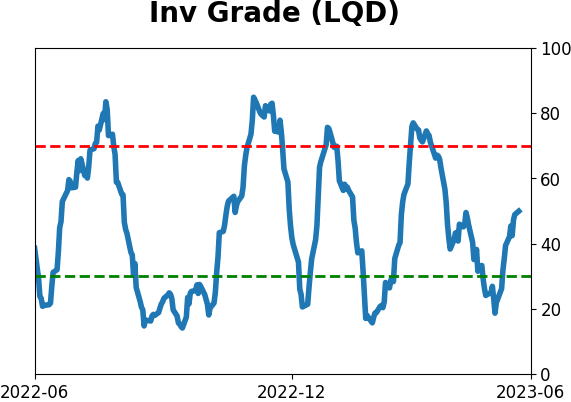
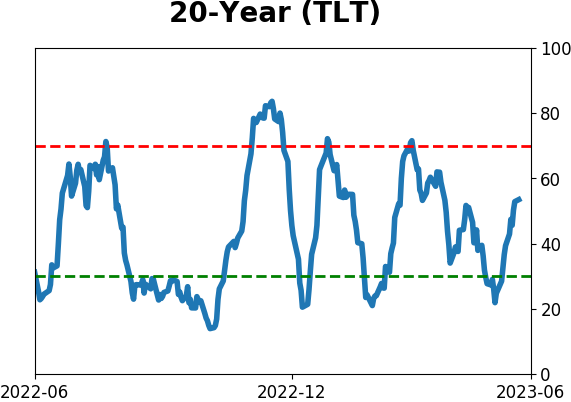
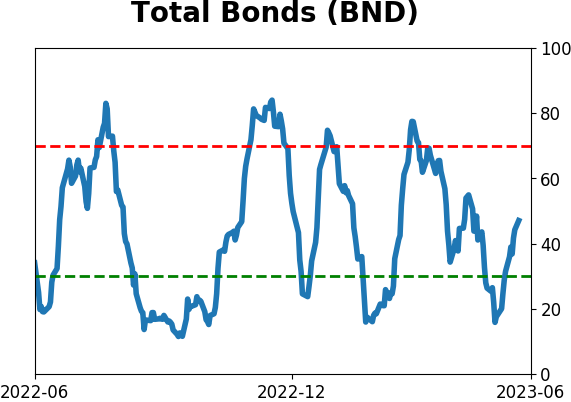
Bond ETF's - 10-Day Moving Average
|
|
|
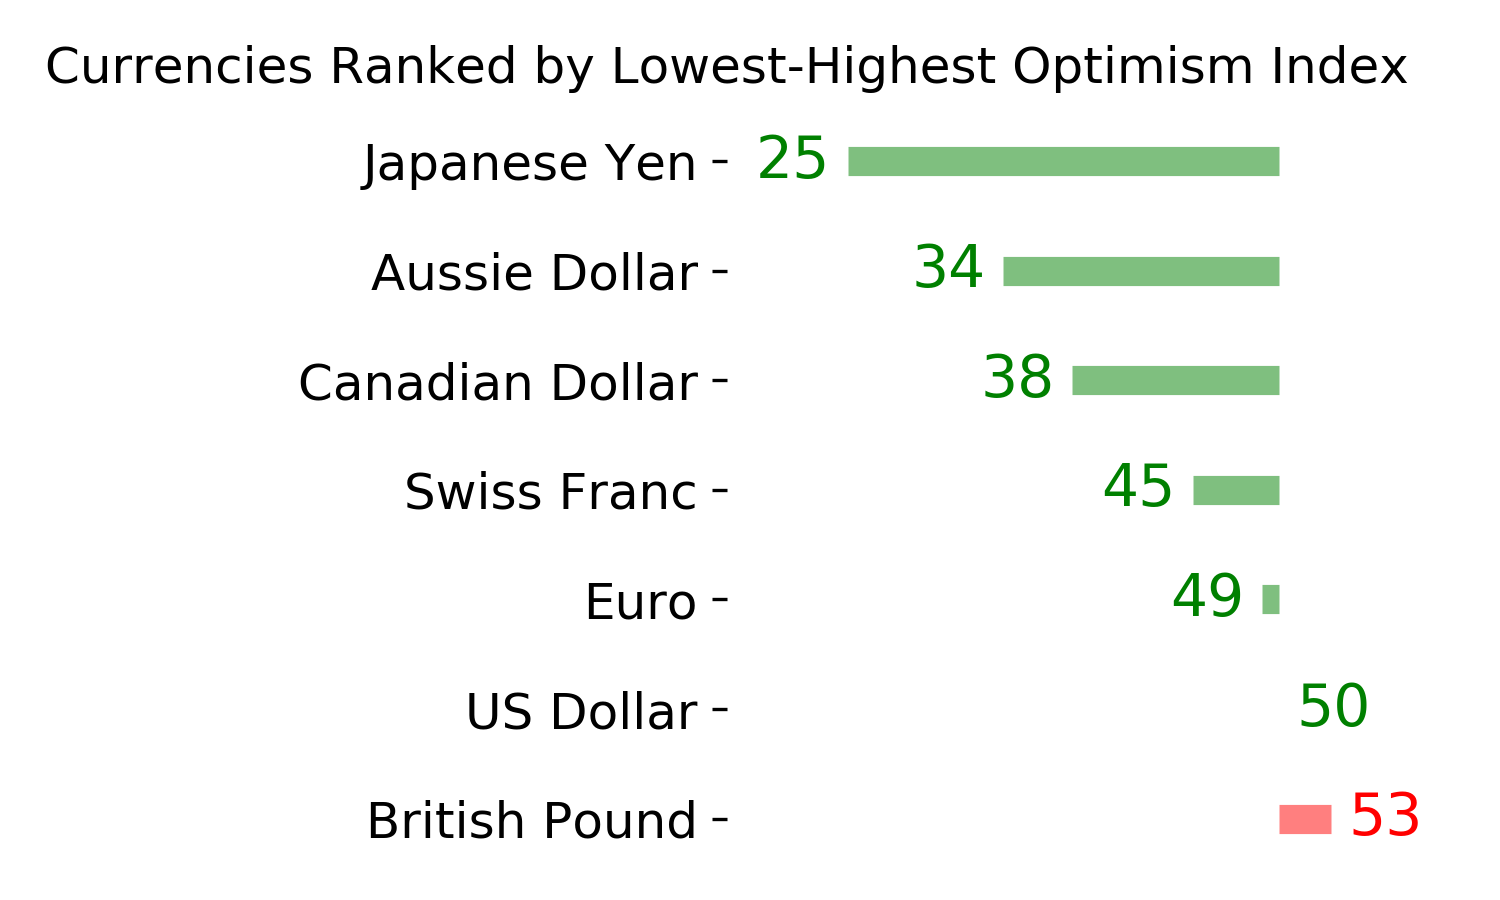
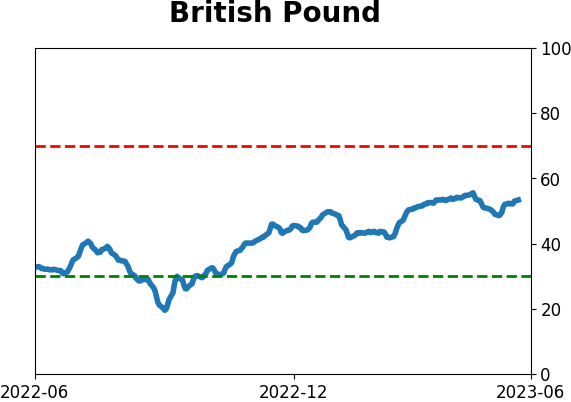
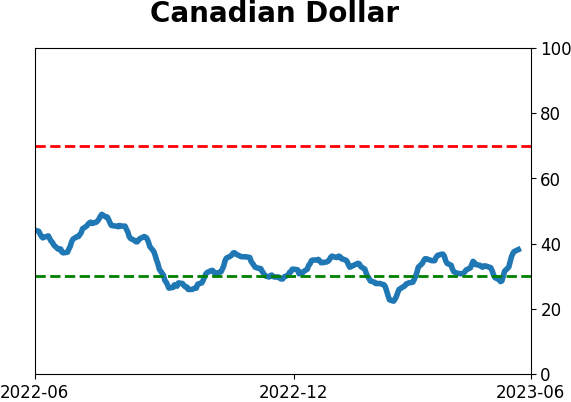
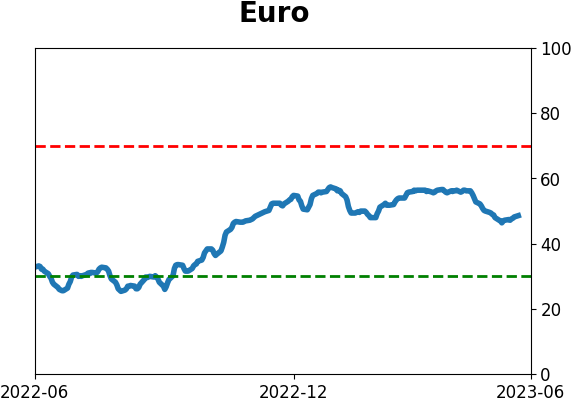
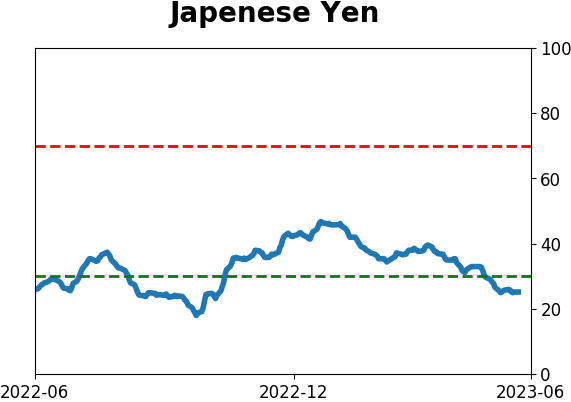
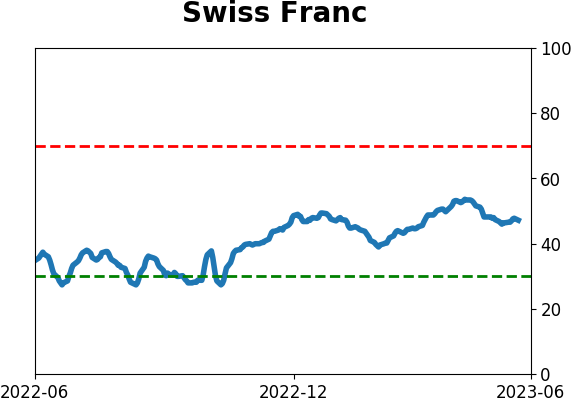
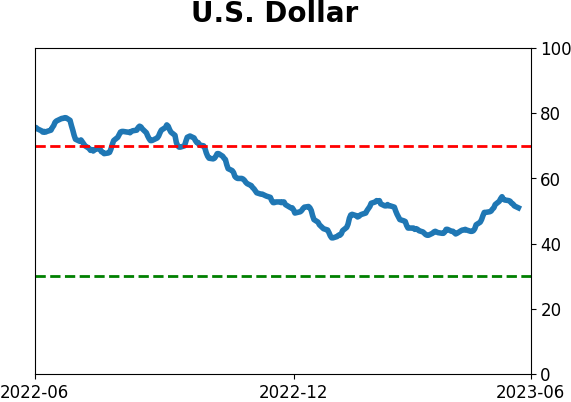
Currency ETF's - 5-Day Moving Average
|
|
|
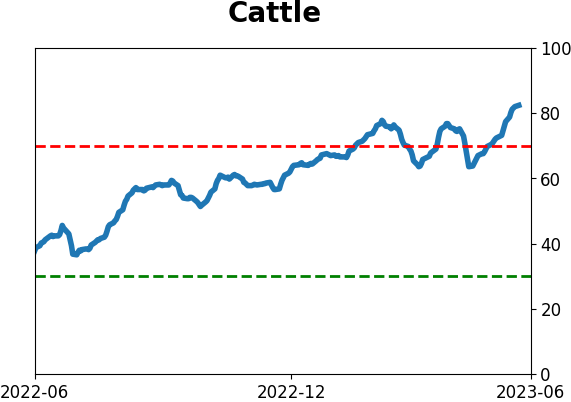
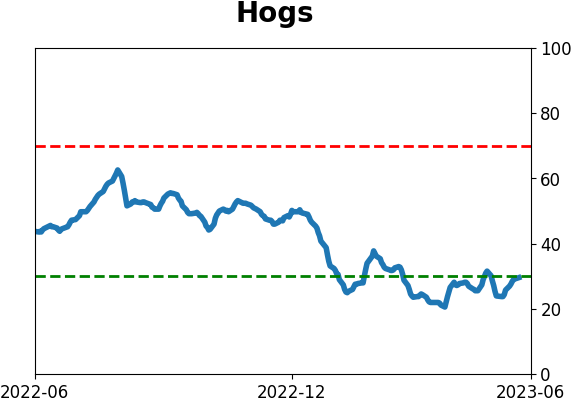
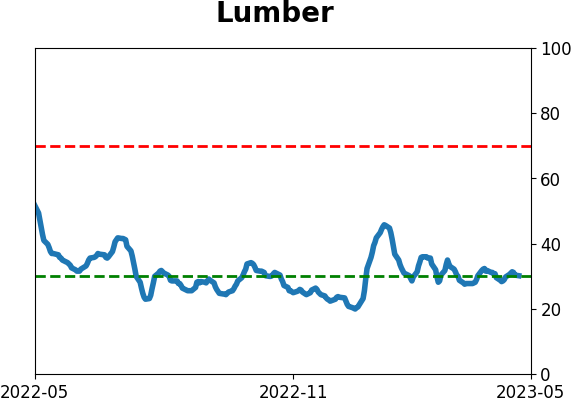
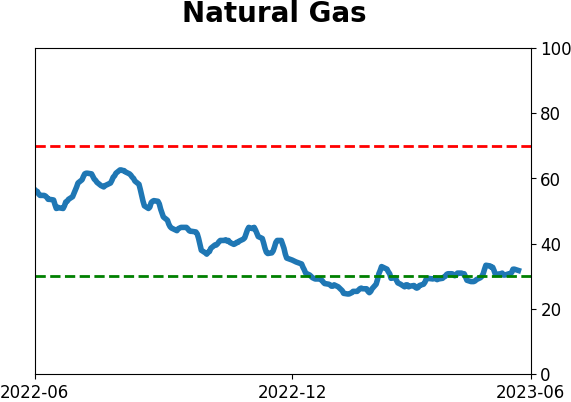
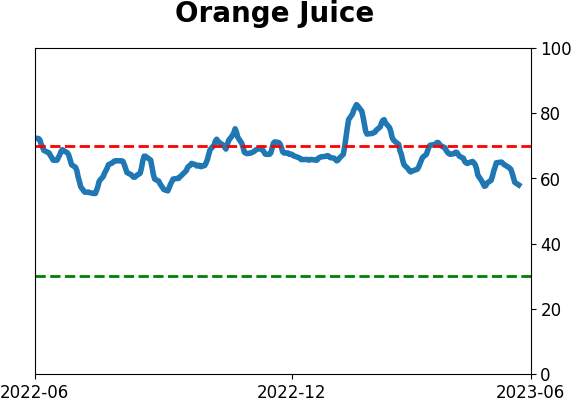
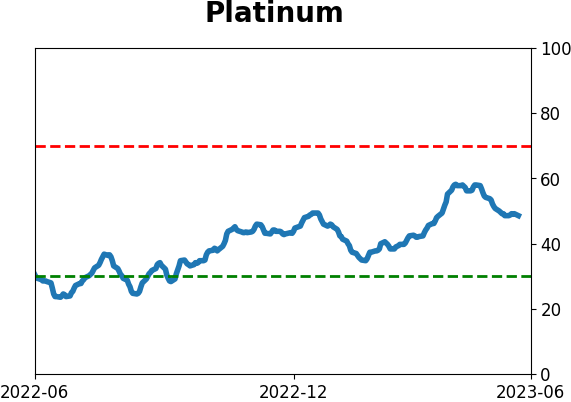
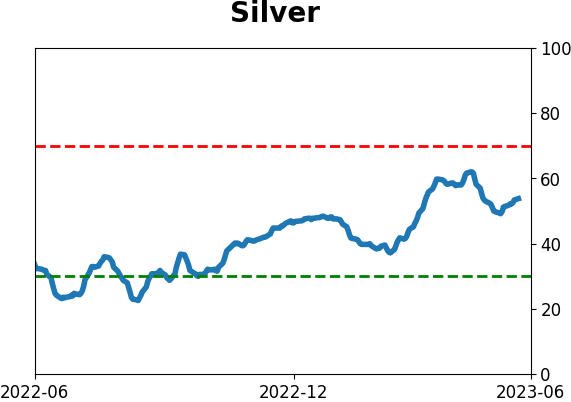
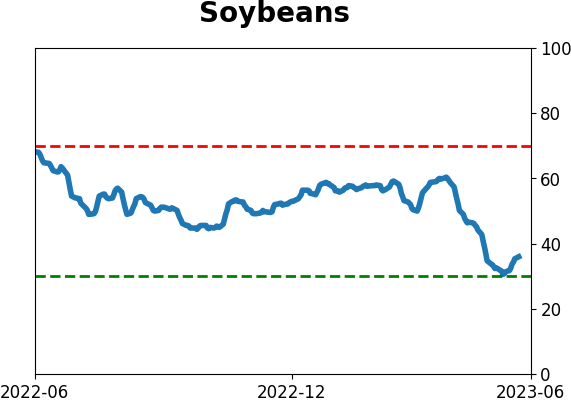
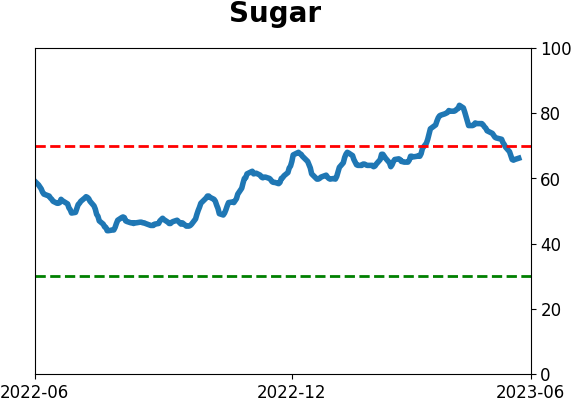
Commodity ETF's - 5-Day Moving Average
|
|