Headlines
|
|
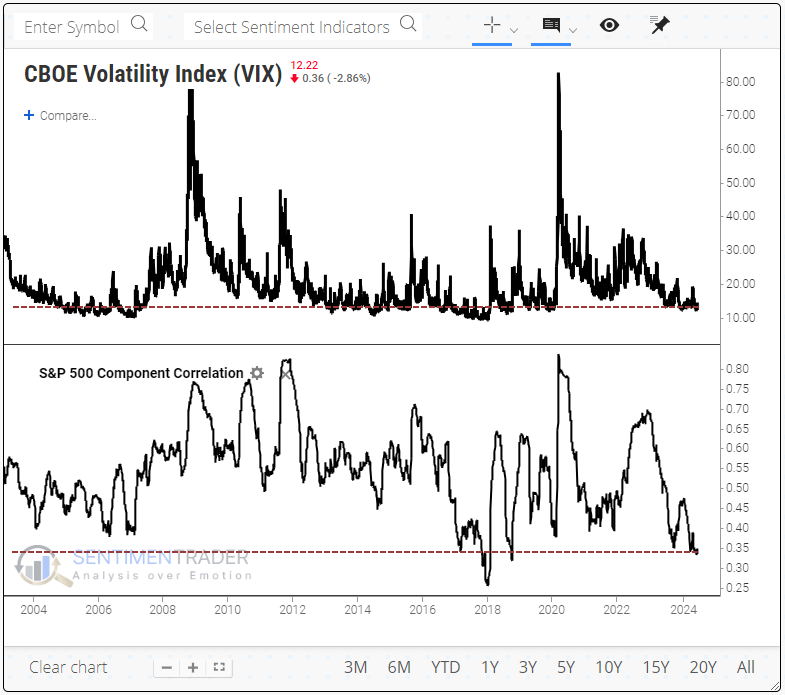
Stocks are calm and uncorrelated:
Volatility in the S&P 500 is low, and investors are complacent. We know that because the correlation among stocks in the index is historically depressed. That only happens when investors are comfortable buying and selling stocks on their individual merits, unlike high volatility periods when they panic and sell everything together. Similar conditions tended to see a spike in volatility.
|
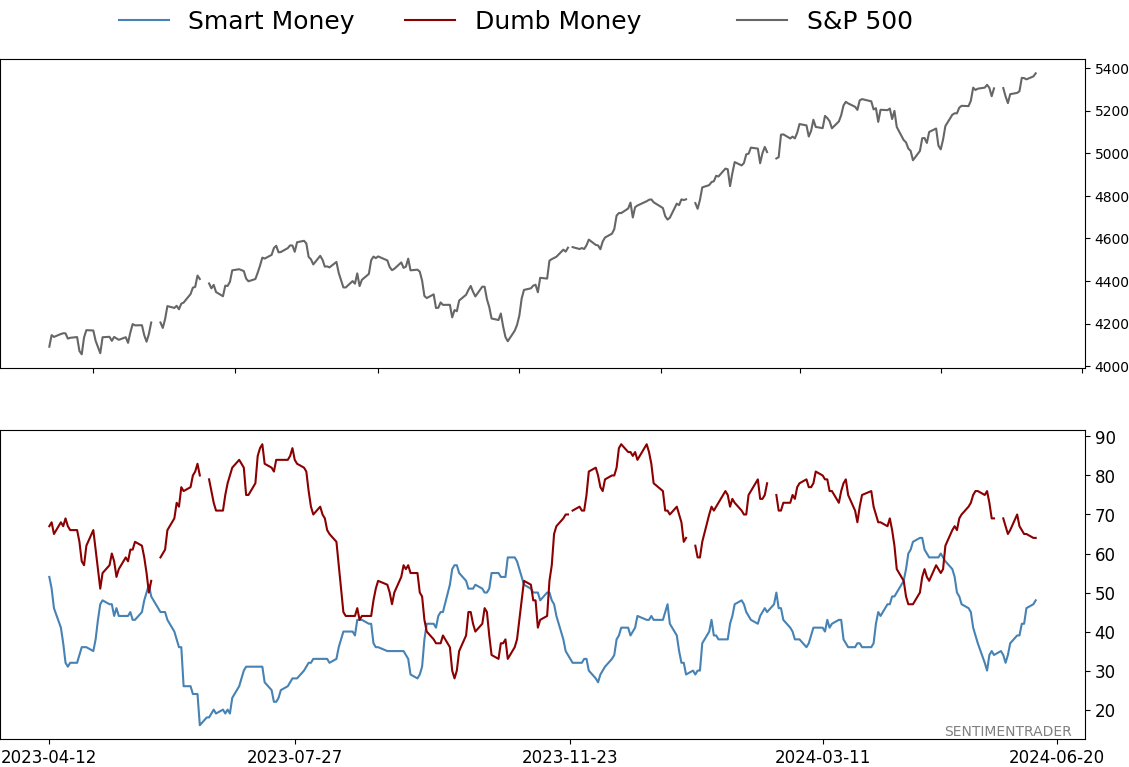
Smart / Dumb Money Confidence
|
Smart Money Confidence: 48%
Dumb Money Confidence: 64%
|
|
Risk Levels
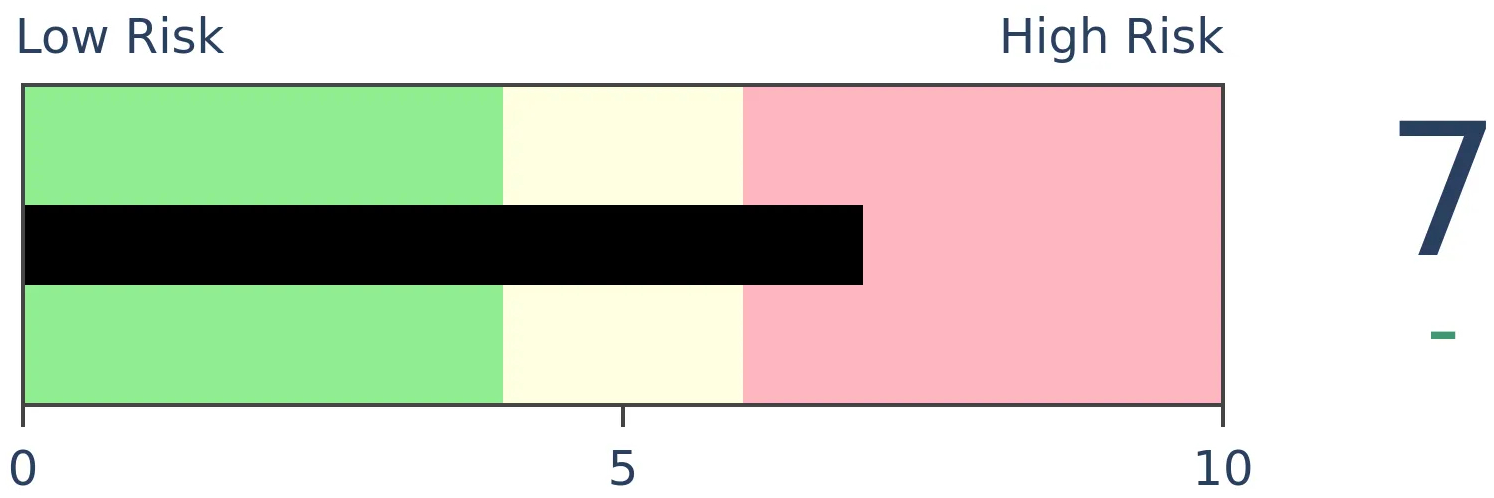
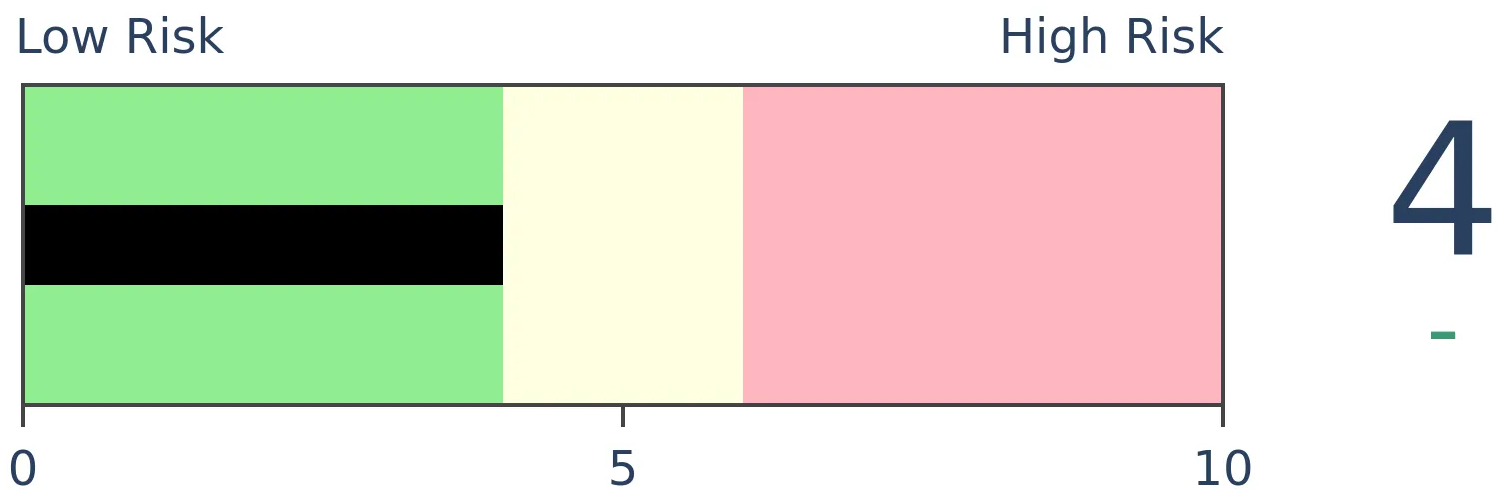
Stocks Short-Term
|
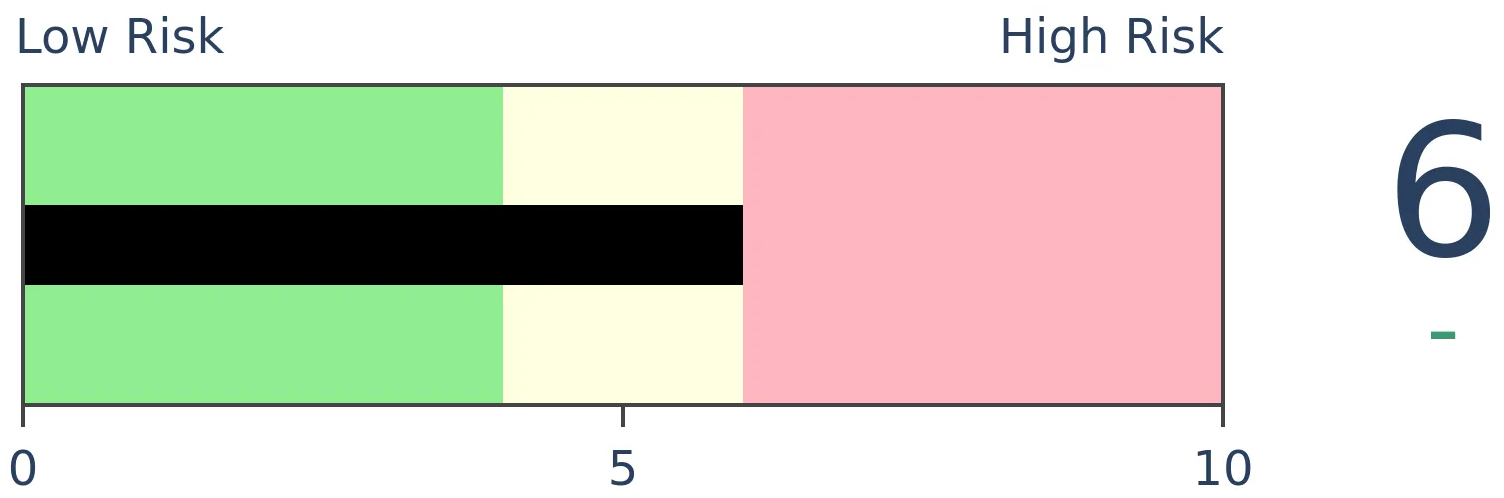
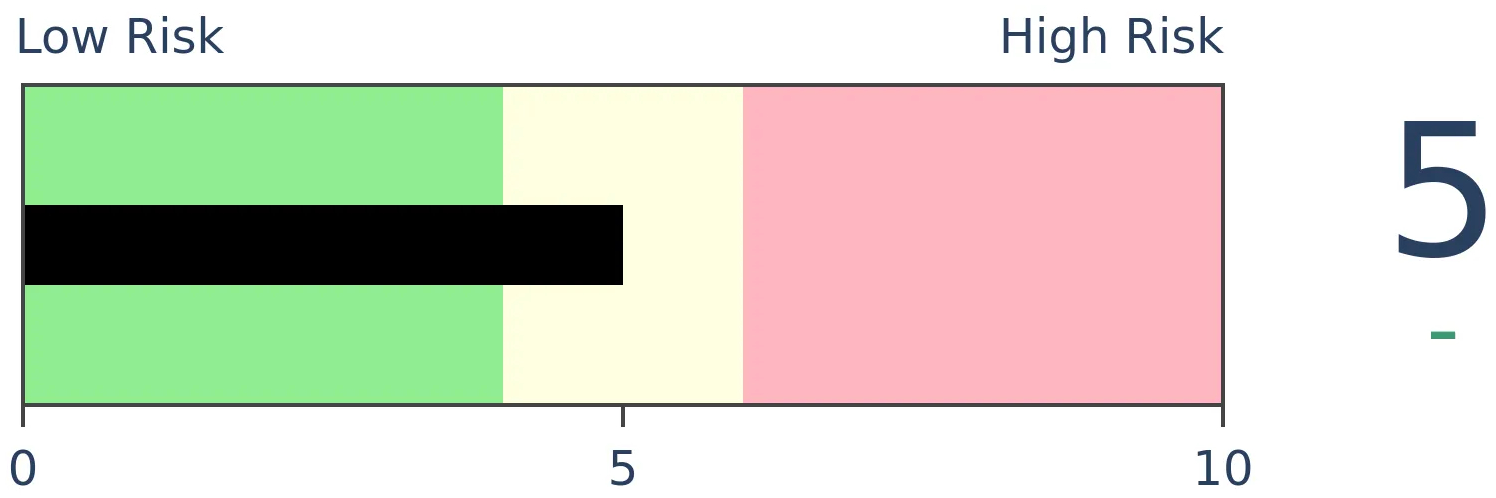
Stocks Medium-Term
|
|
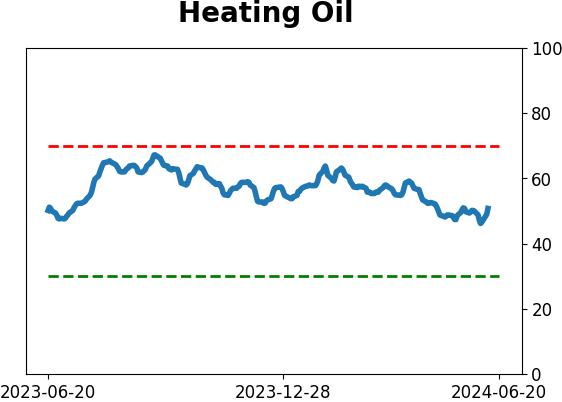
Bonds

|
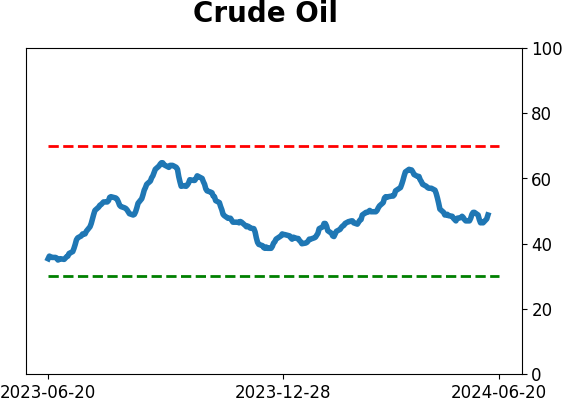
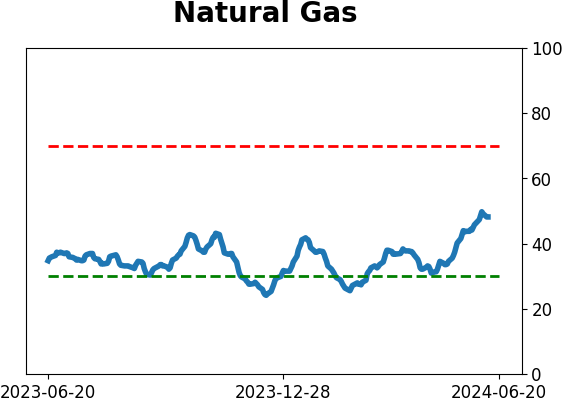
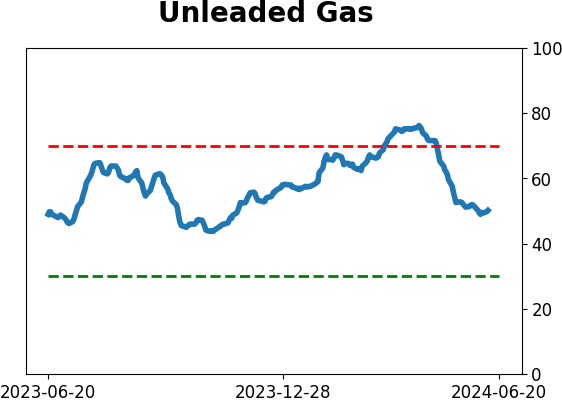
Crude Oil
|
|
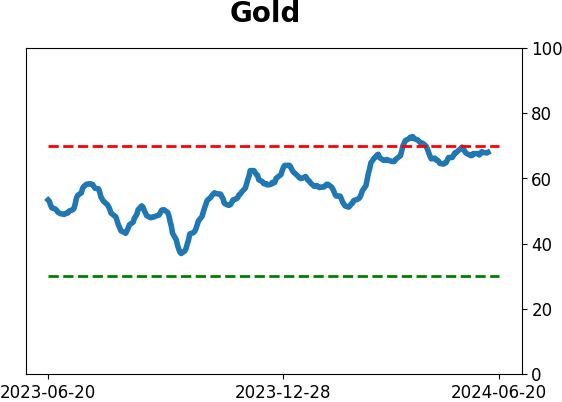
Gold

|
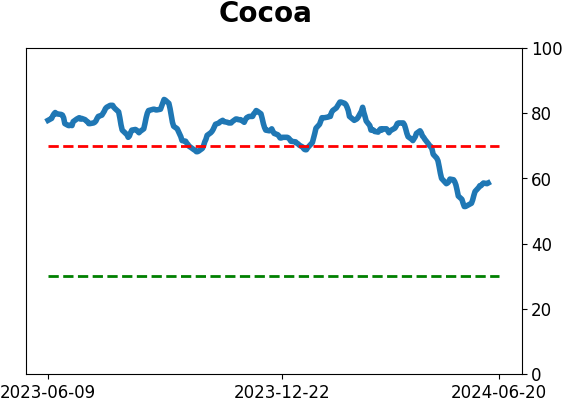
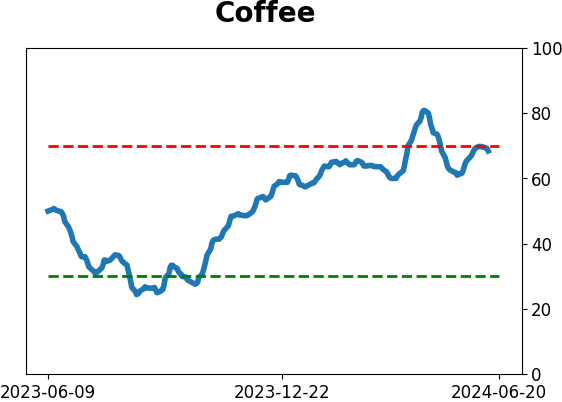
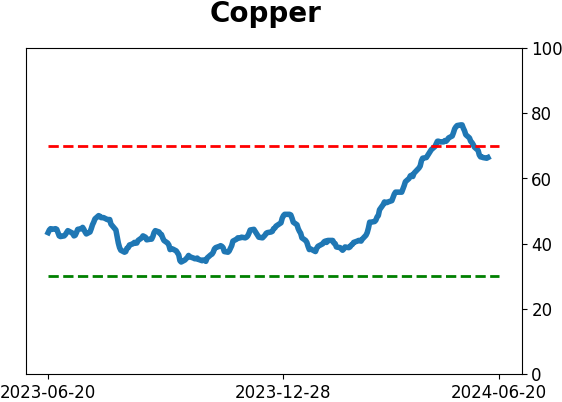
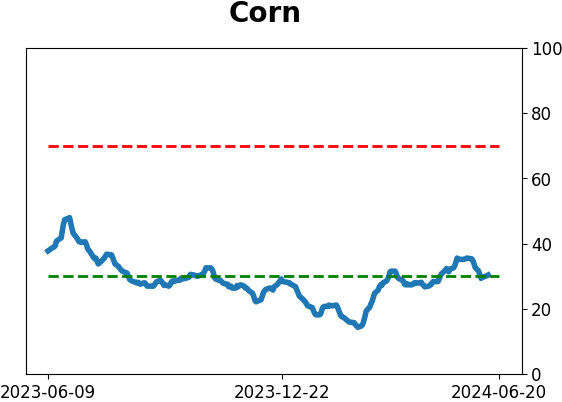
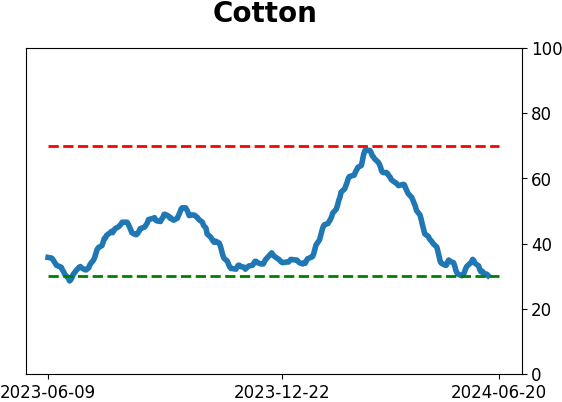
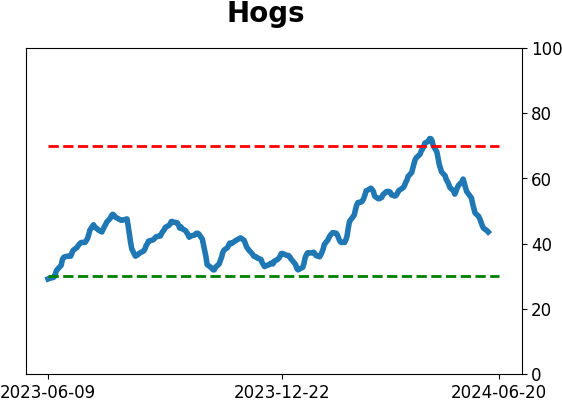
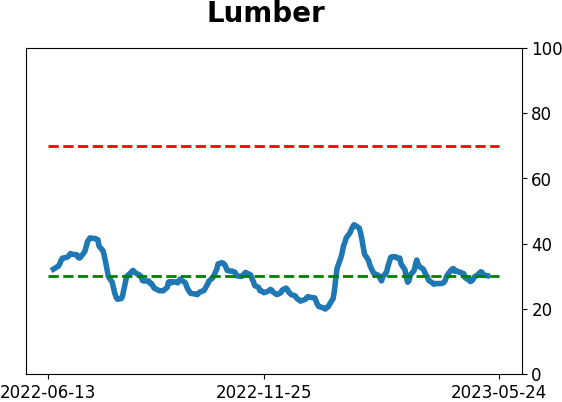
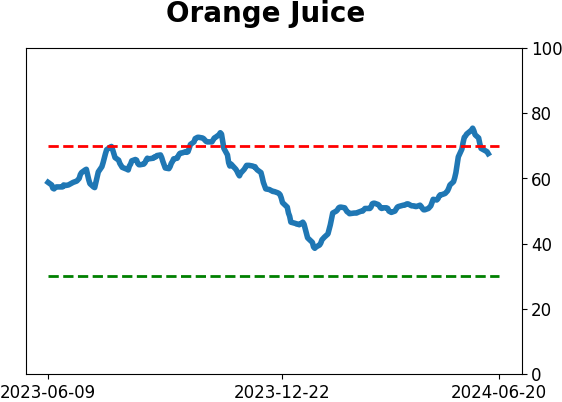
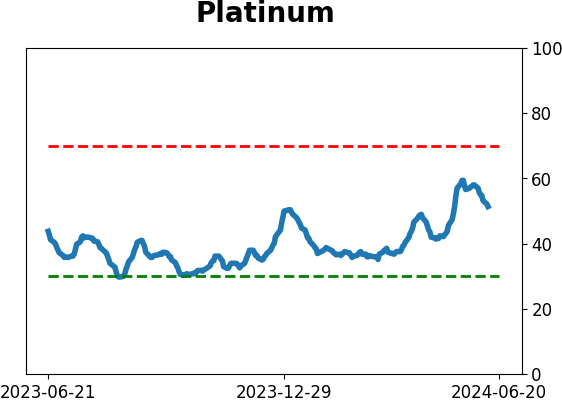
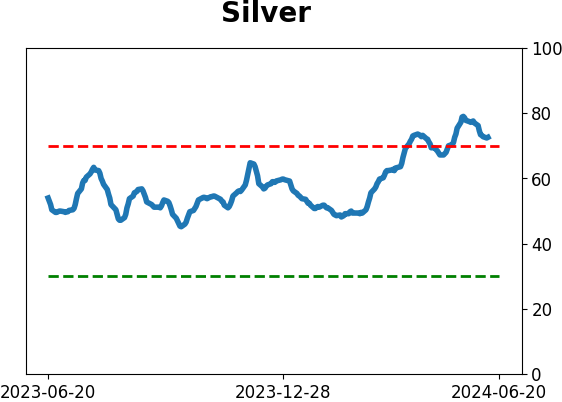
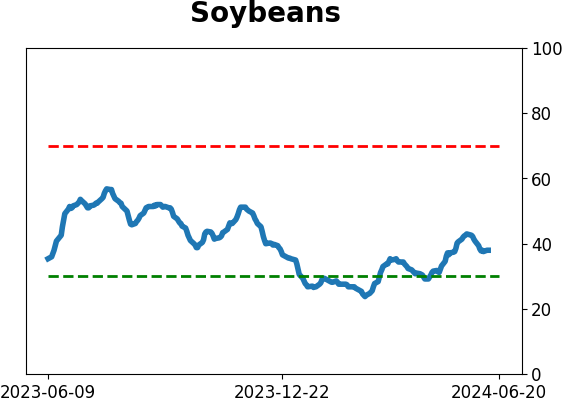
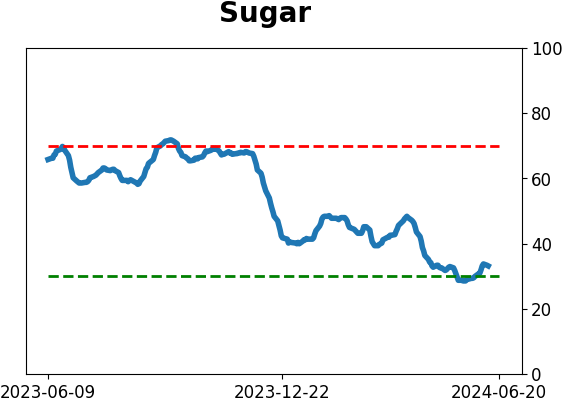
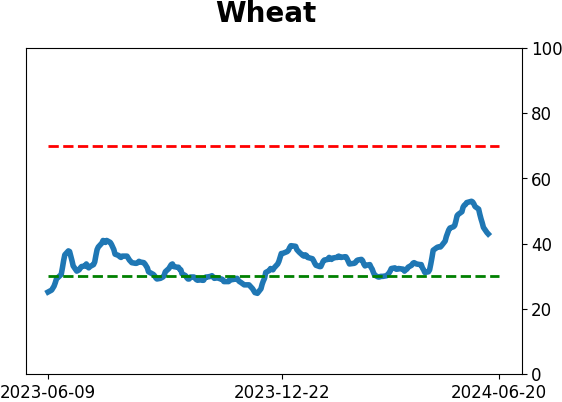
Agriculture
|
|
Research
By Jason Goepfert
BOTTOM LINE
Volatility in the S&P 500 is low, and investors are complacent. We know that because the correlation among stocks in the index is historically depressed. That only happens when investors are comfortable buying and selling stocks on their individual merits, unlike high volatility periods when they panic and sell everything together. Similar conditions tended to see a spike in volatility.
FORECAST / TIMEFRAME
None
|
Key points:
- The VIX "fear gauge" is historically low, and investors are trading stocks based on their merits
- When implied volatility and stock correlations are low, the VIX has a strong tendency to spike
- Higher volatility expectations do not necessarily (or even usually) translate to lower stock prices
Low volatility and correlations
We all know volatility is low. It has been so since November, except for a few weeks in April. As both a cause and effect of the low volatility, investors have gotten quite comfortable trading stocks on their own merits.
When investors panic, they tend to do so similarly - sell everything simultaneously. They're much more willing to buy, sell, and hold stocks based on their individual outlooks when they're complacent. That's why when markets get volatile, and people get scared, the correlation among stocks rises quickly toward 1 (correlations range from totally uncorrelated at -1.0 to totally correlated at +1.0). When they're comfortable, stocks behave more individually, and their correlation drops.
There is a strong relationship between the VIX "fear gauge" and the correlation among stocks in the S&P 500. So, it's not a great surprise that we're seeing one of the lowest correlations among stocks in 20 years, along with the low VIX.
A recipe for rising volatility expectations
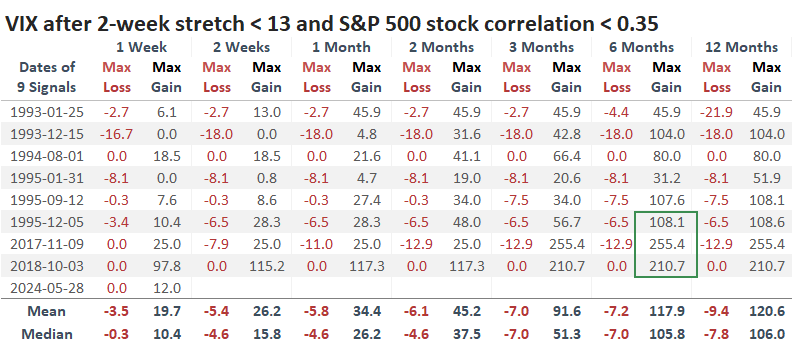
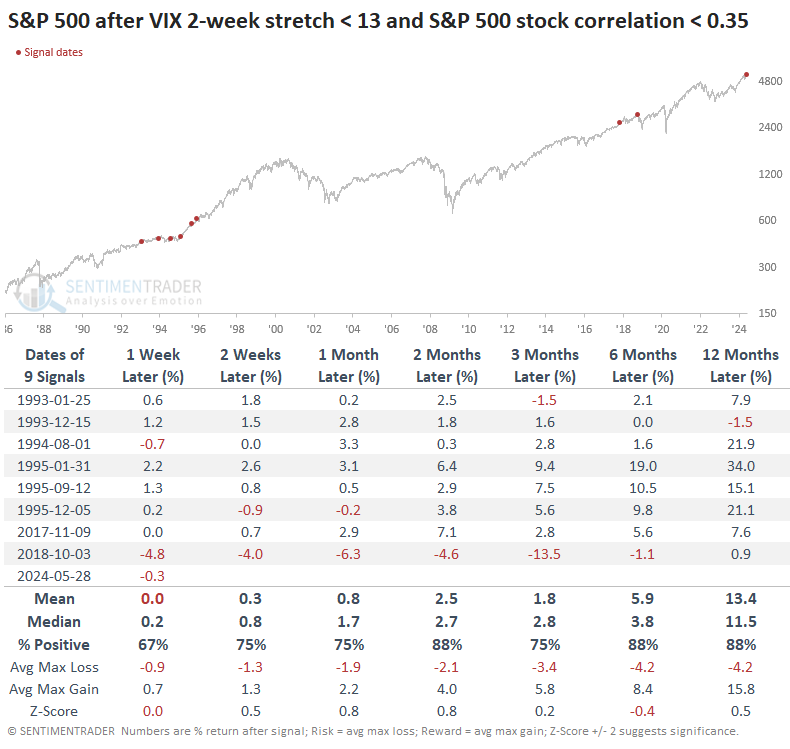
There haven't been too many periods in the past ~40 years when the VIX was below 13, and the correlation among S&P 500 stocks was under 0.35. The table below shows times when these conditions persisted for at least two weeks.
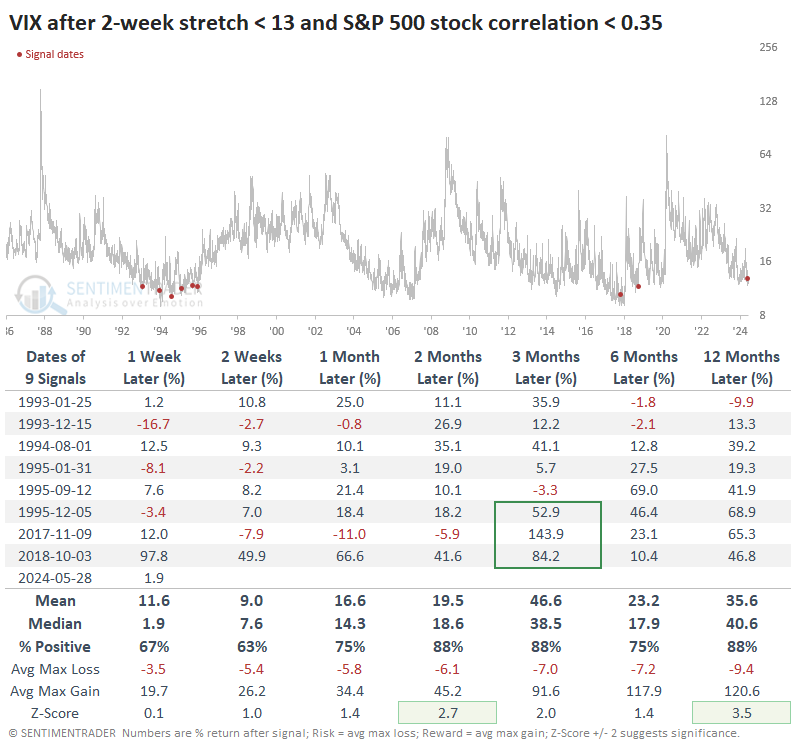
The conditions did not persist for much longer. The VIX showed a powerful tendency to rise after the other signals. On average, it doubled at some point within the next 3-6 months. After the recent signals, the VIX was at least 50% higher three months later.
Below, we can see the maximum gains and losses in the VIX after each signal. The last few all saw the VIX at least double within six months.
A widespread trade when betting on rising volatility is buying puts on the S&P 500. Theoretically, it makes sense. Practically, it makes losses.
The table below shows that even though volatility expectations rose among options traders, it didn't necessarily (or even usually) mean that stocks dropped. Quite the opposite, as low volatility conditions tend to reflect positive conditions for stocks, except for the last signal that saw stocks plunge into year-end.
The sample size is small because of the unusual conditions, and most signals clustered in the early to mid-1990s. The table below relaxes the parameters to show times when the VIX held below 16 and stock correlations were below 0.40.
Here, we see that the VIX tended to spike less in the weeks and months ahead. However, much of that subdued volatility was due to the early 1990s.
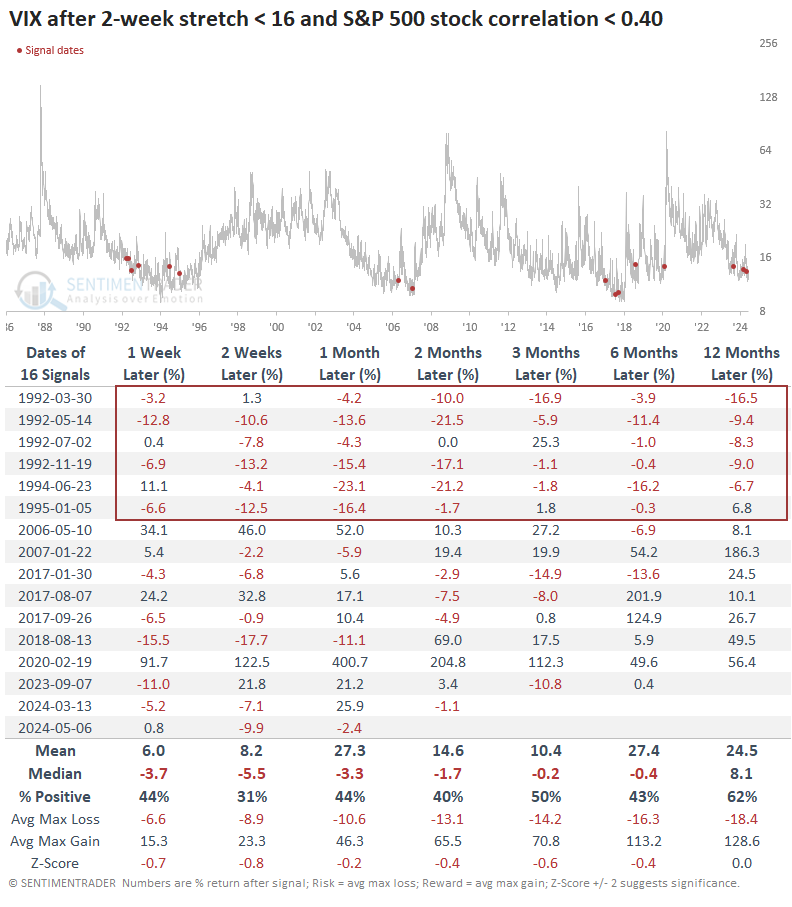
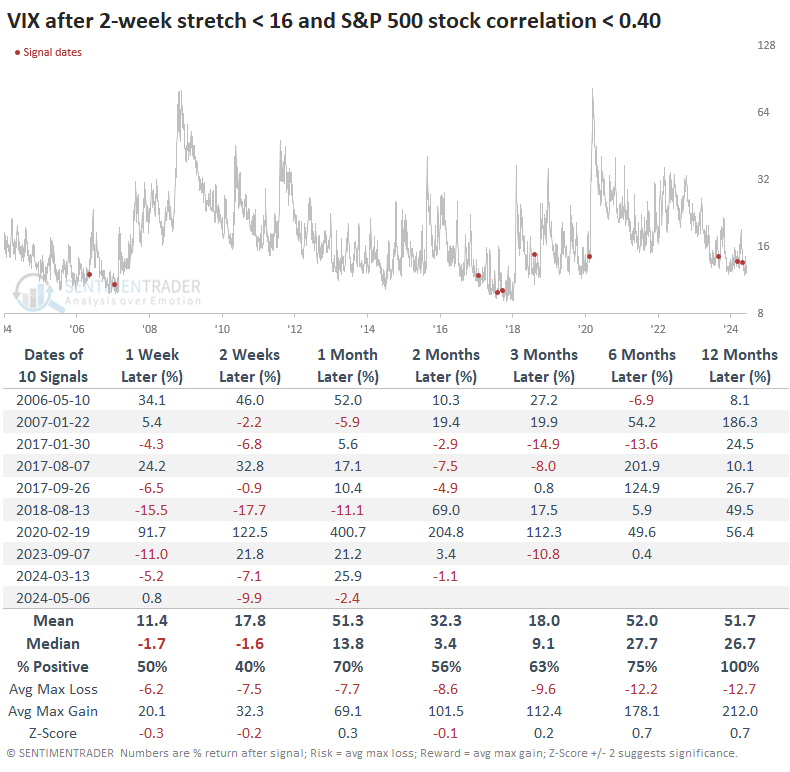
The following table focuses on the more recent signals triggered in the past 20 years. While there was nothing notable in the short term, volatility rose in the months ahead in most instances. Over the next year, the VIX was higher each time.
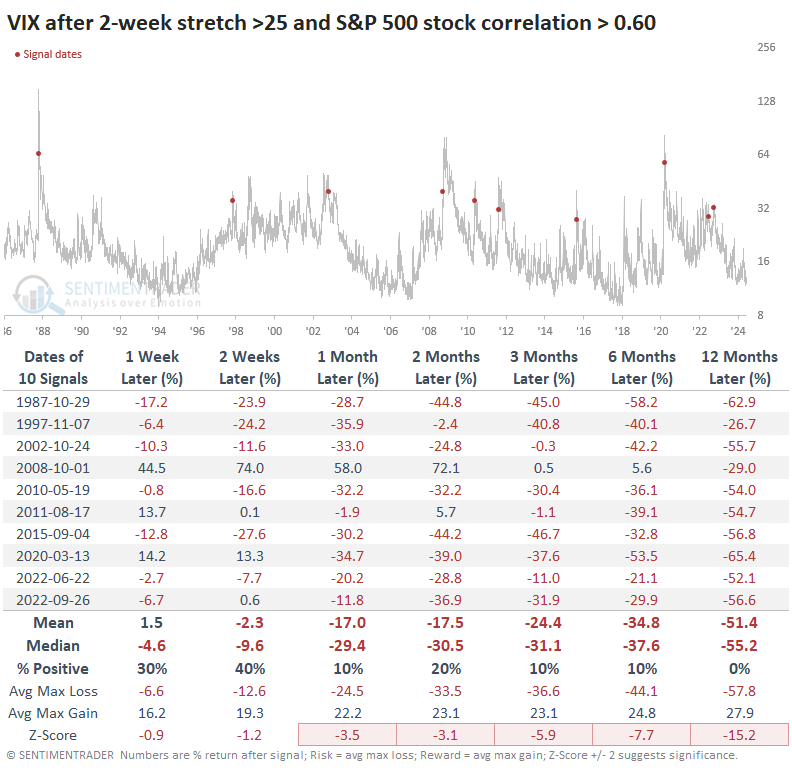
We like to examine the opposite conditions to see if there is any difference in returns. When the VIX was above 25, and stock correlations were above 0.6 for two straight weeks, the VIX was slammed lower every time. Only once, during the final stages of the 2008 financial crisis, did the VIX make any substantial rise before plunging.
What the research tells us...
Low volatility is good for stocks. Investors like the feeling of certainty and intensely dislike the feeling of checking their portfolios after a long day at work and seeing swings of 1% or more. Because conditions are calm, they see little reason to make changes, which helps perpetuate the low volatility.
That continues until...it doesn't. Many brilliant people have spent a lot of time trying to figure out when the tipping point occurs, but to my knowledge, nobody has figured that out. And if they did, they certainly wouldn't share it publicly. Regardless, we at least know that conditions are favorable for longs and that it will end at some point, probably sooner rather than later.
The most straightforward way to bet on that outcome is to place modest bets on rising volatility. That's easier said than done for the layperson. Call options tied to the VIX, with expirations out at least several months, is probably the most forthright trade, with the knowledge that the VIX is a manipulated index, and options have a strong tendency to lose value every day until suddenly they don't. And you have to be willing to endure the constant bleed until the potential "don't" part.
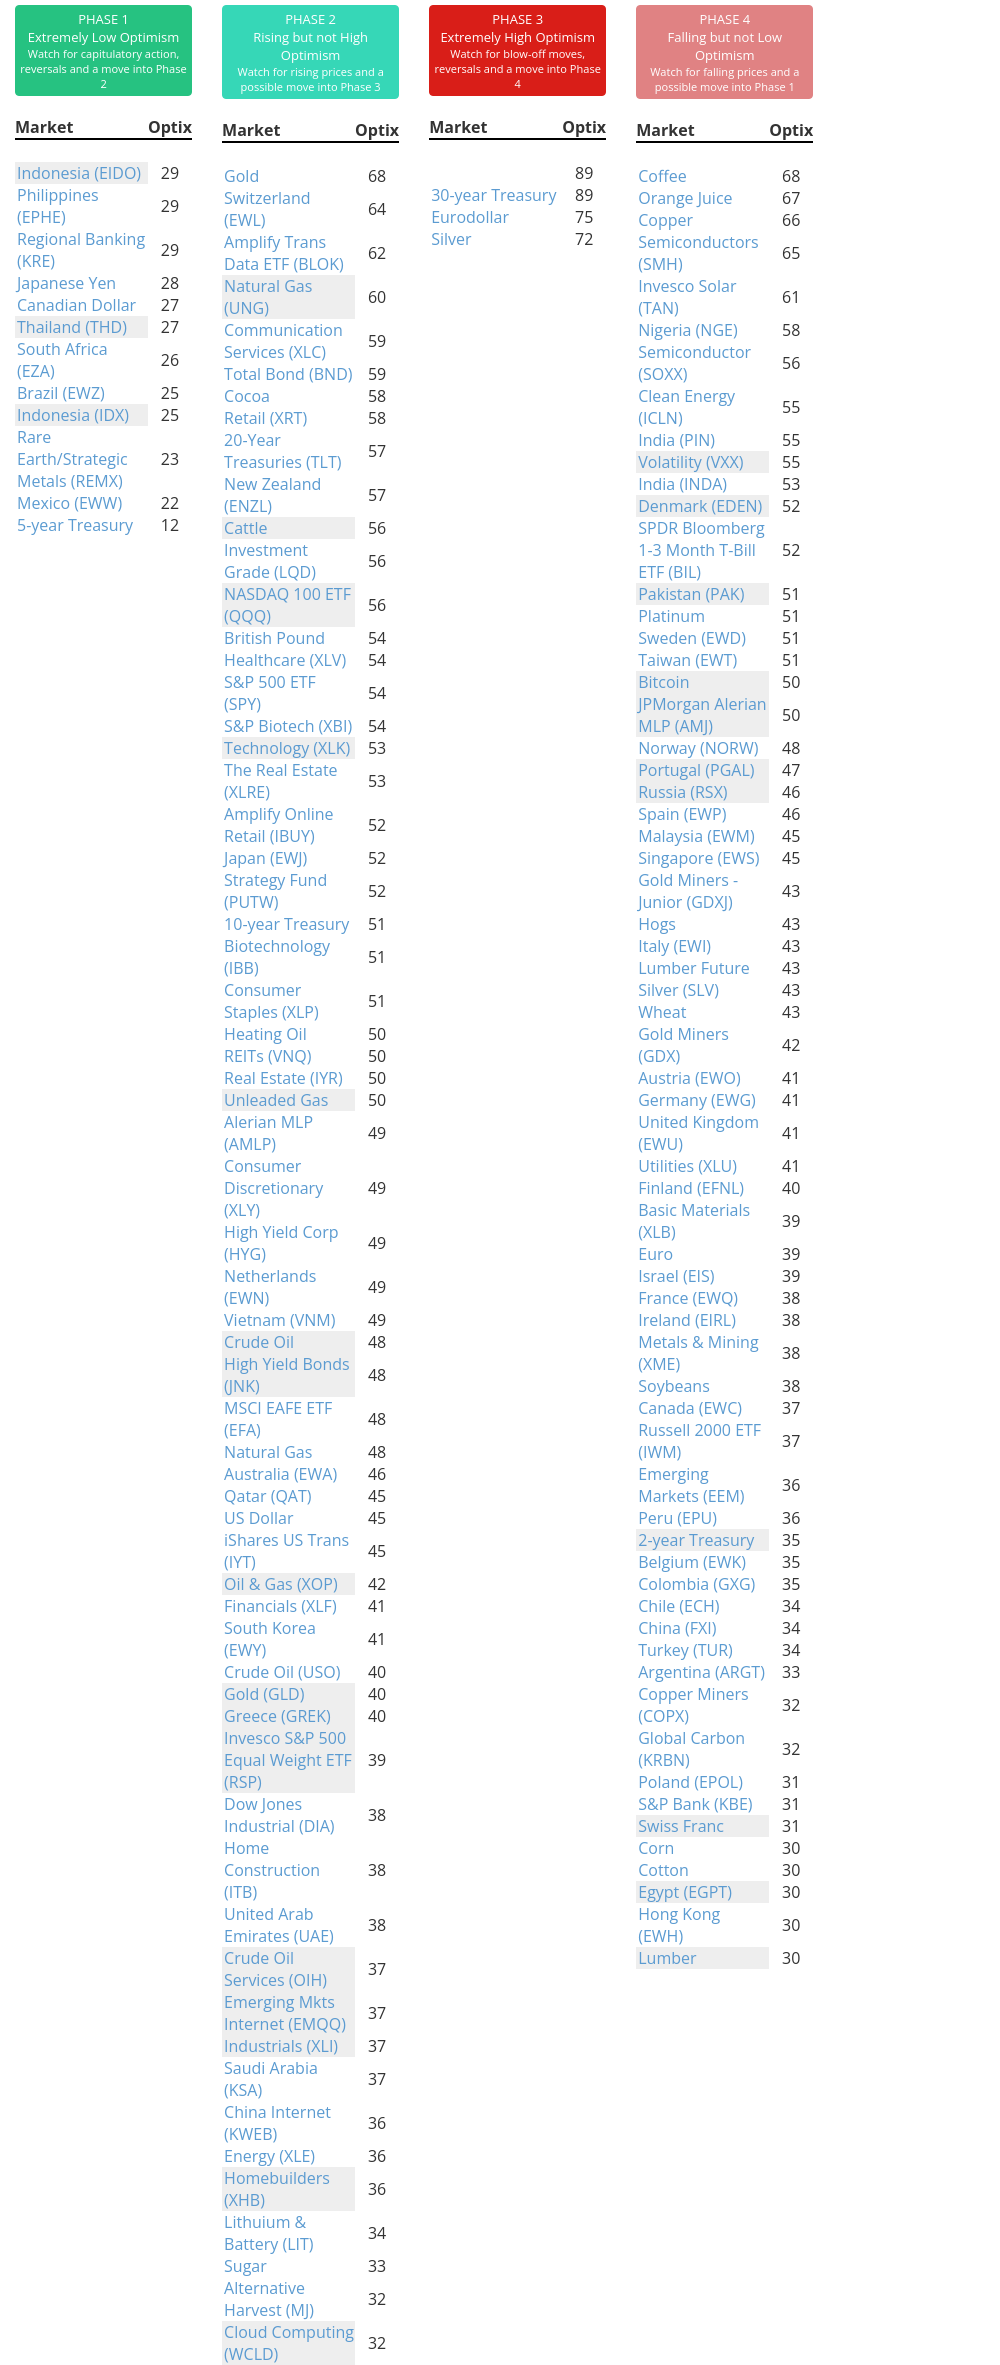
Indicators at Extremes
Phase Table
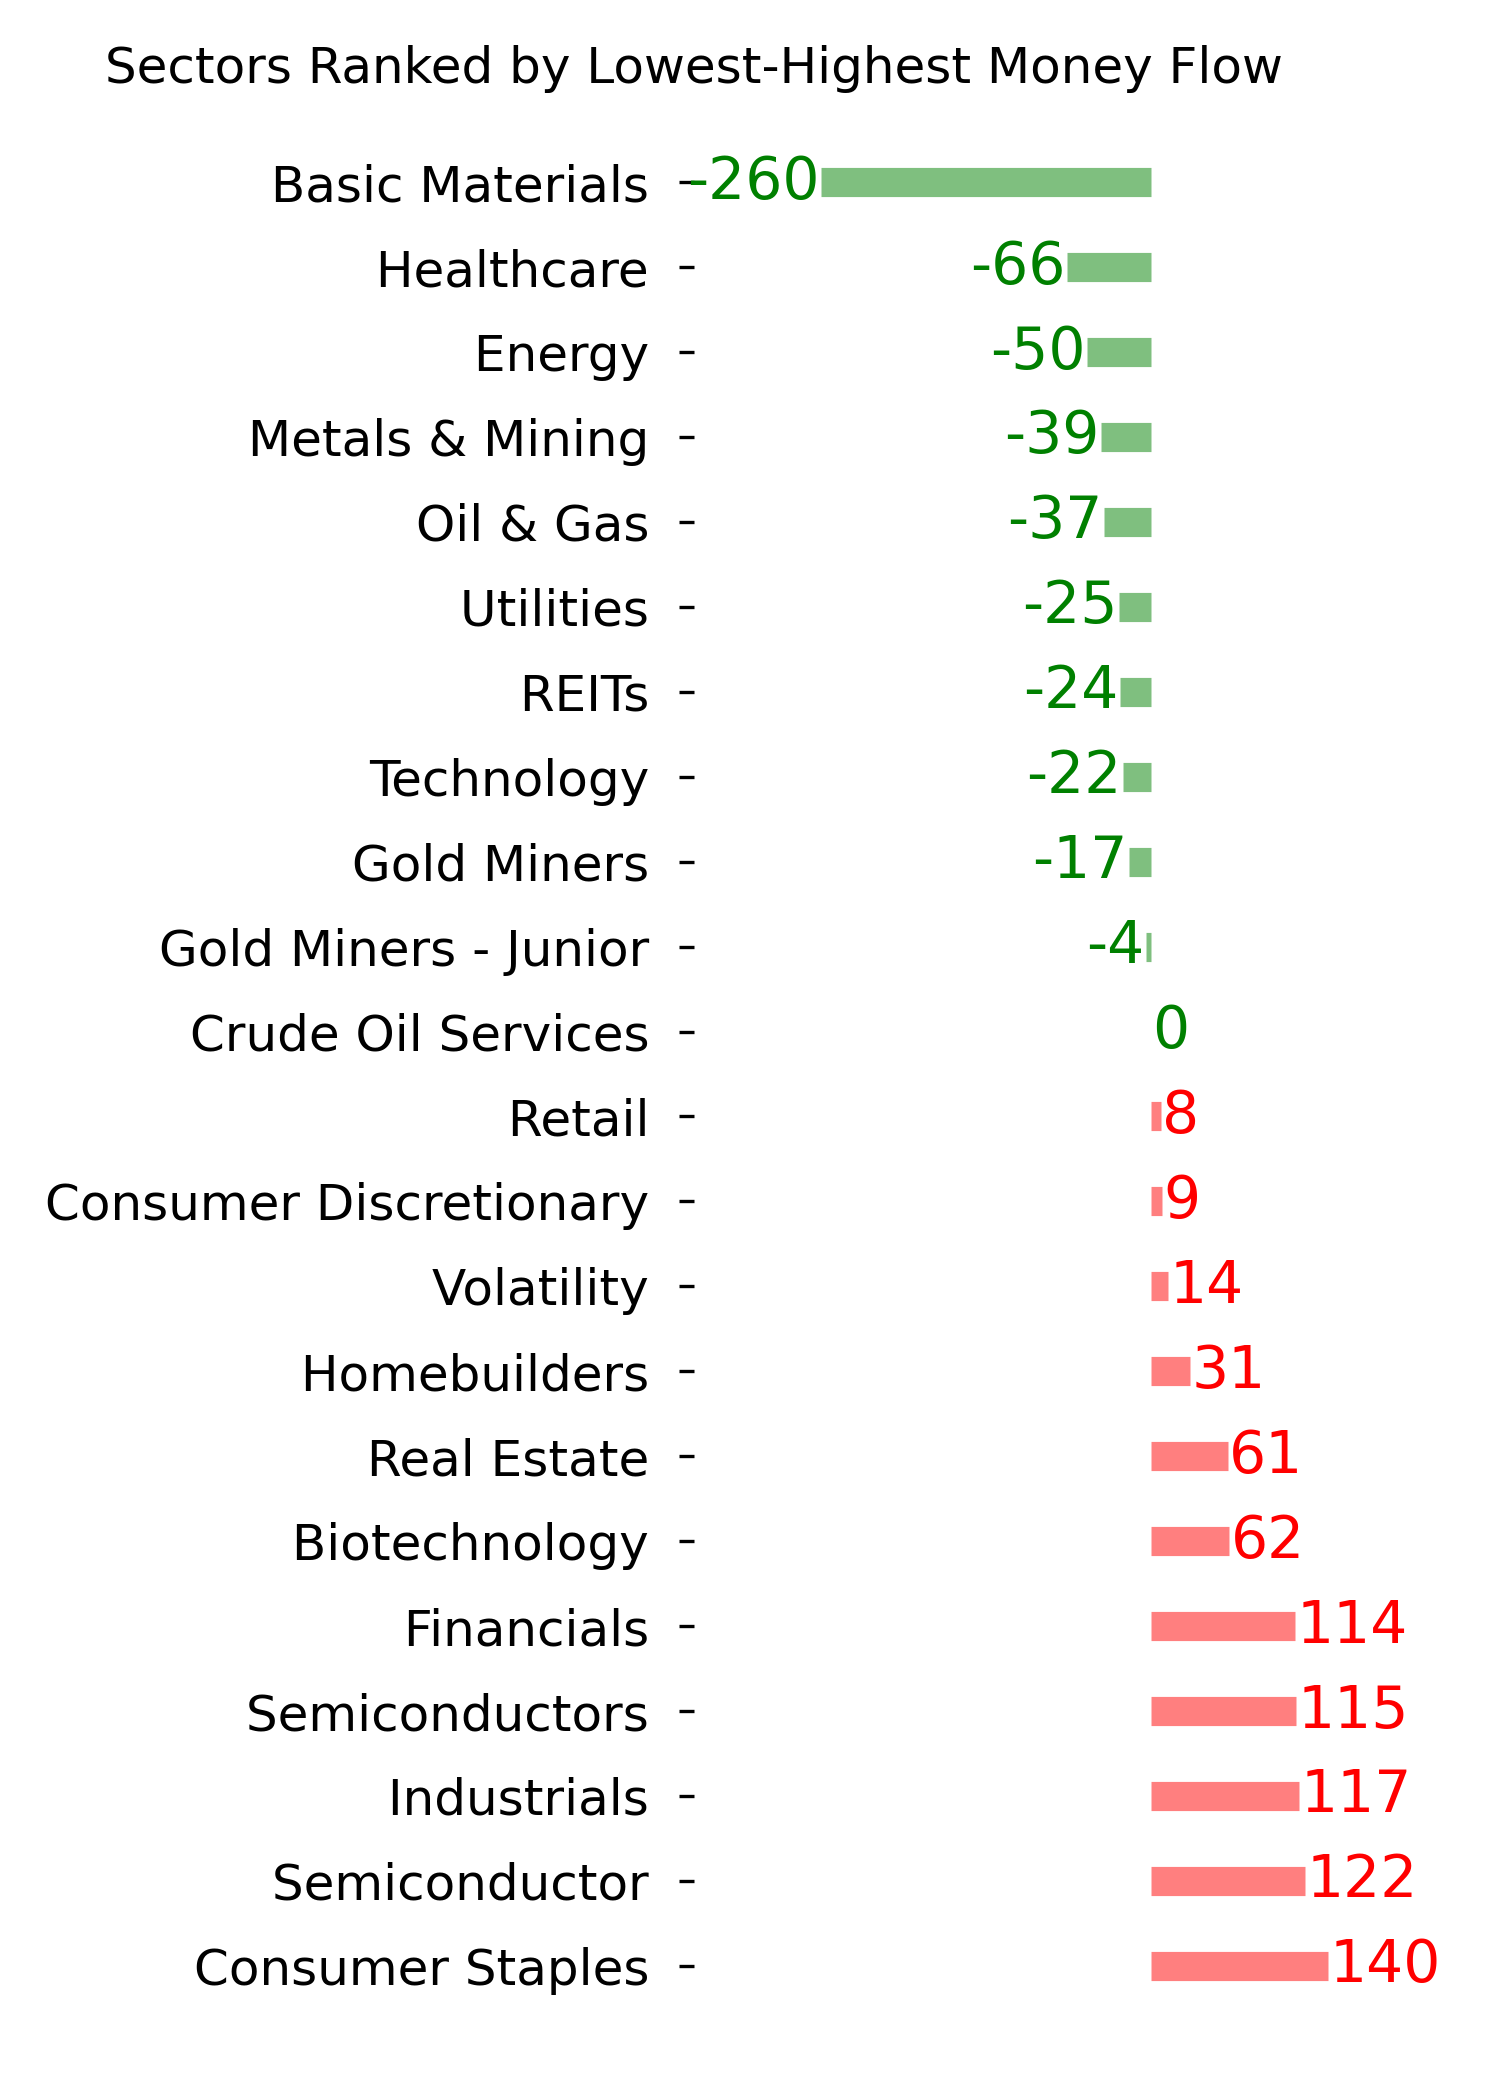
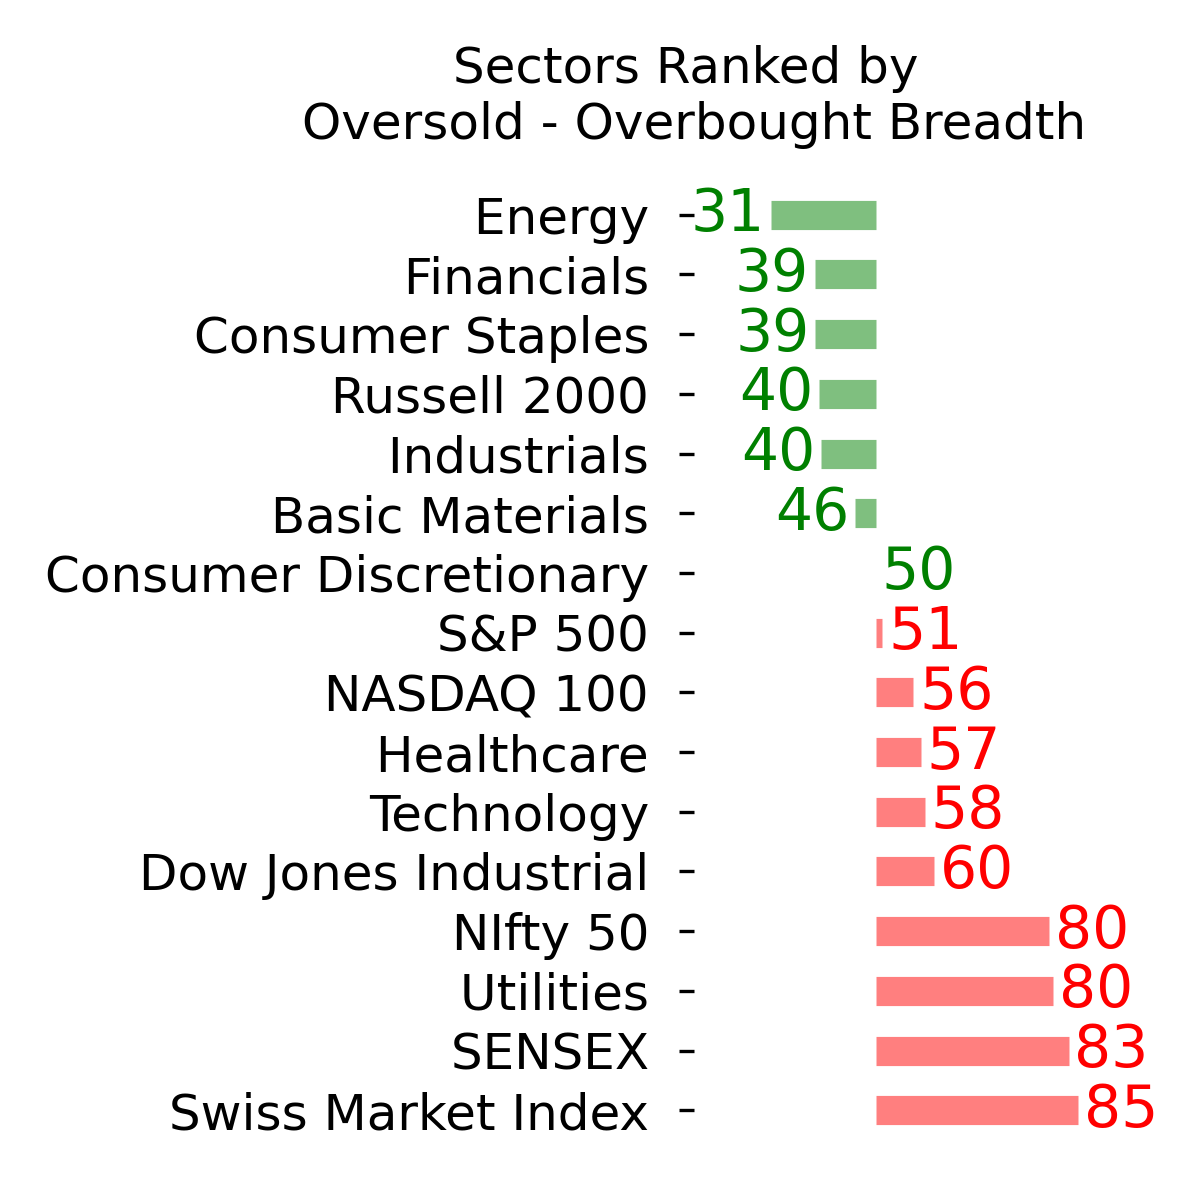
Ranks
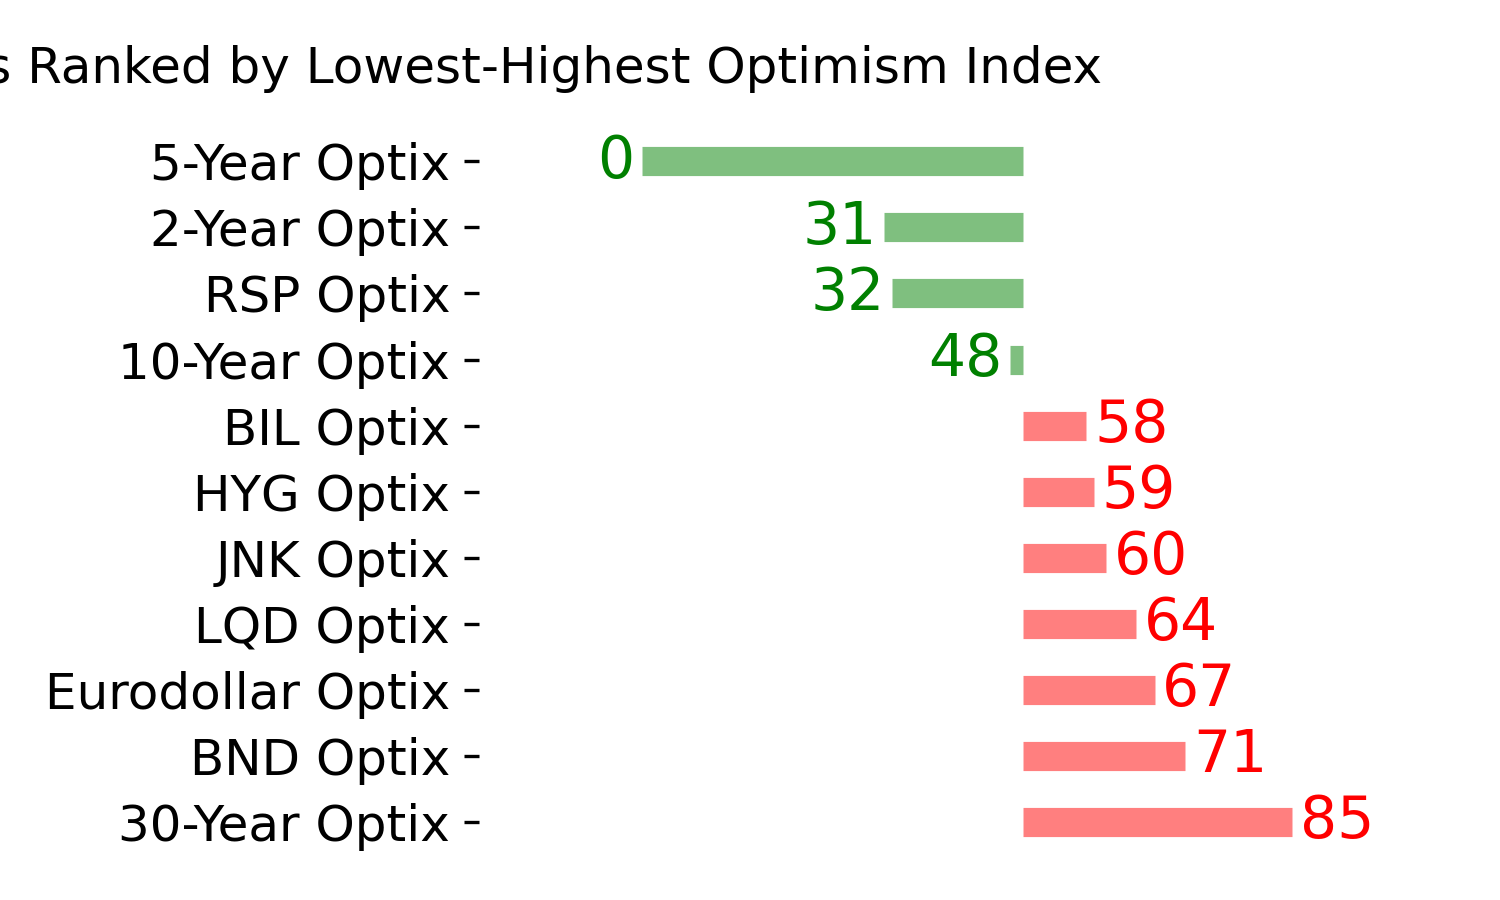
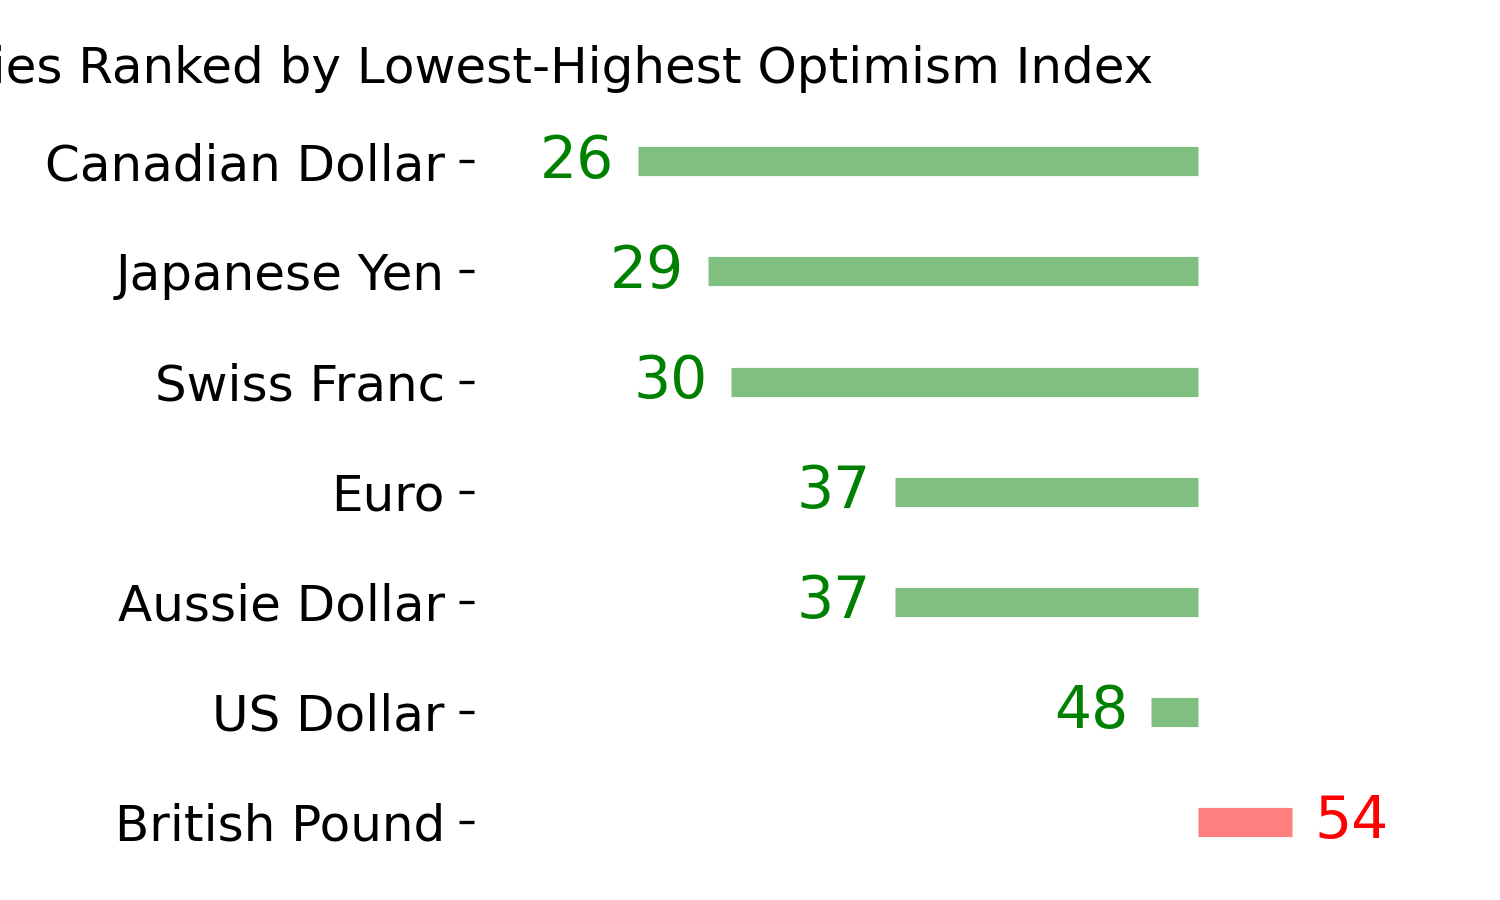
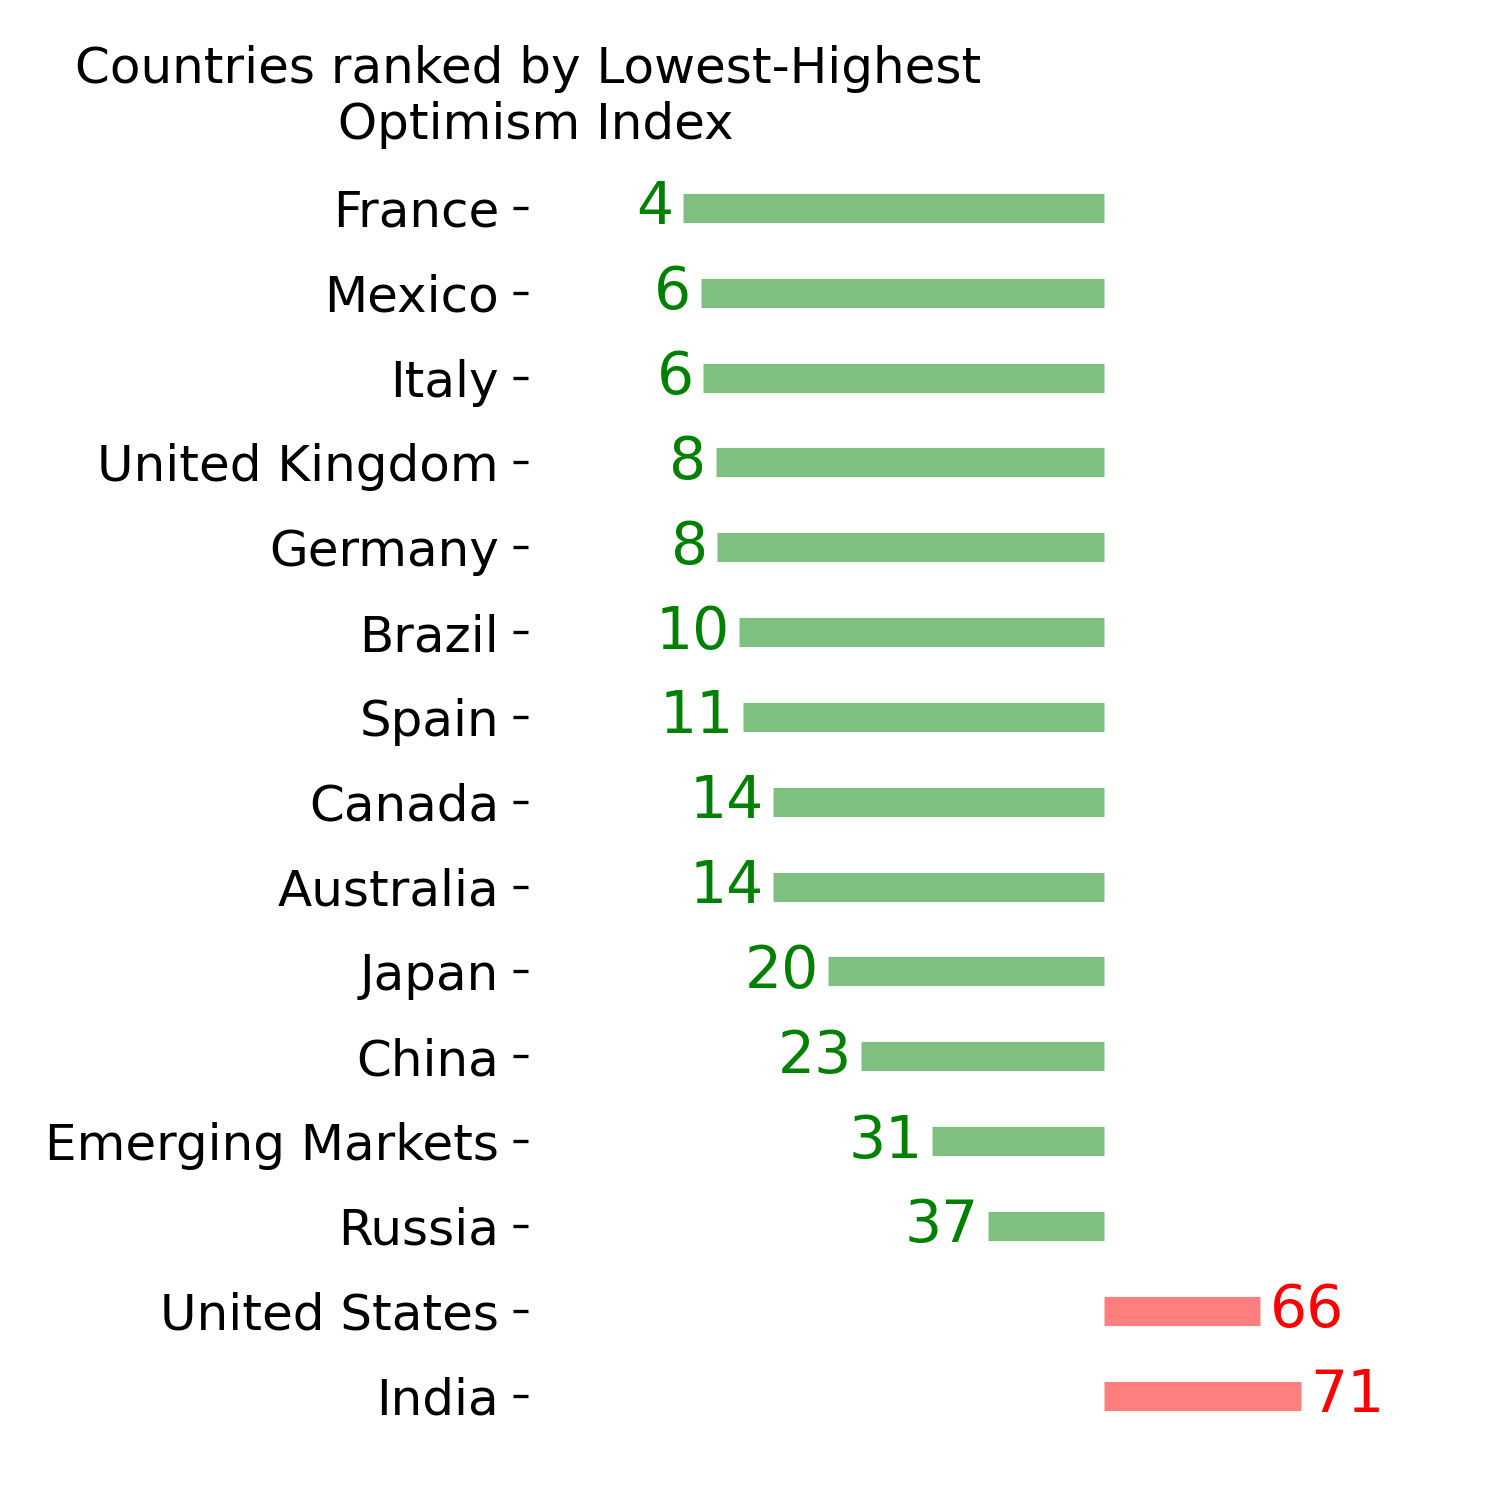
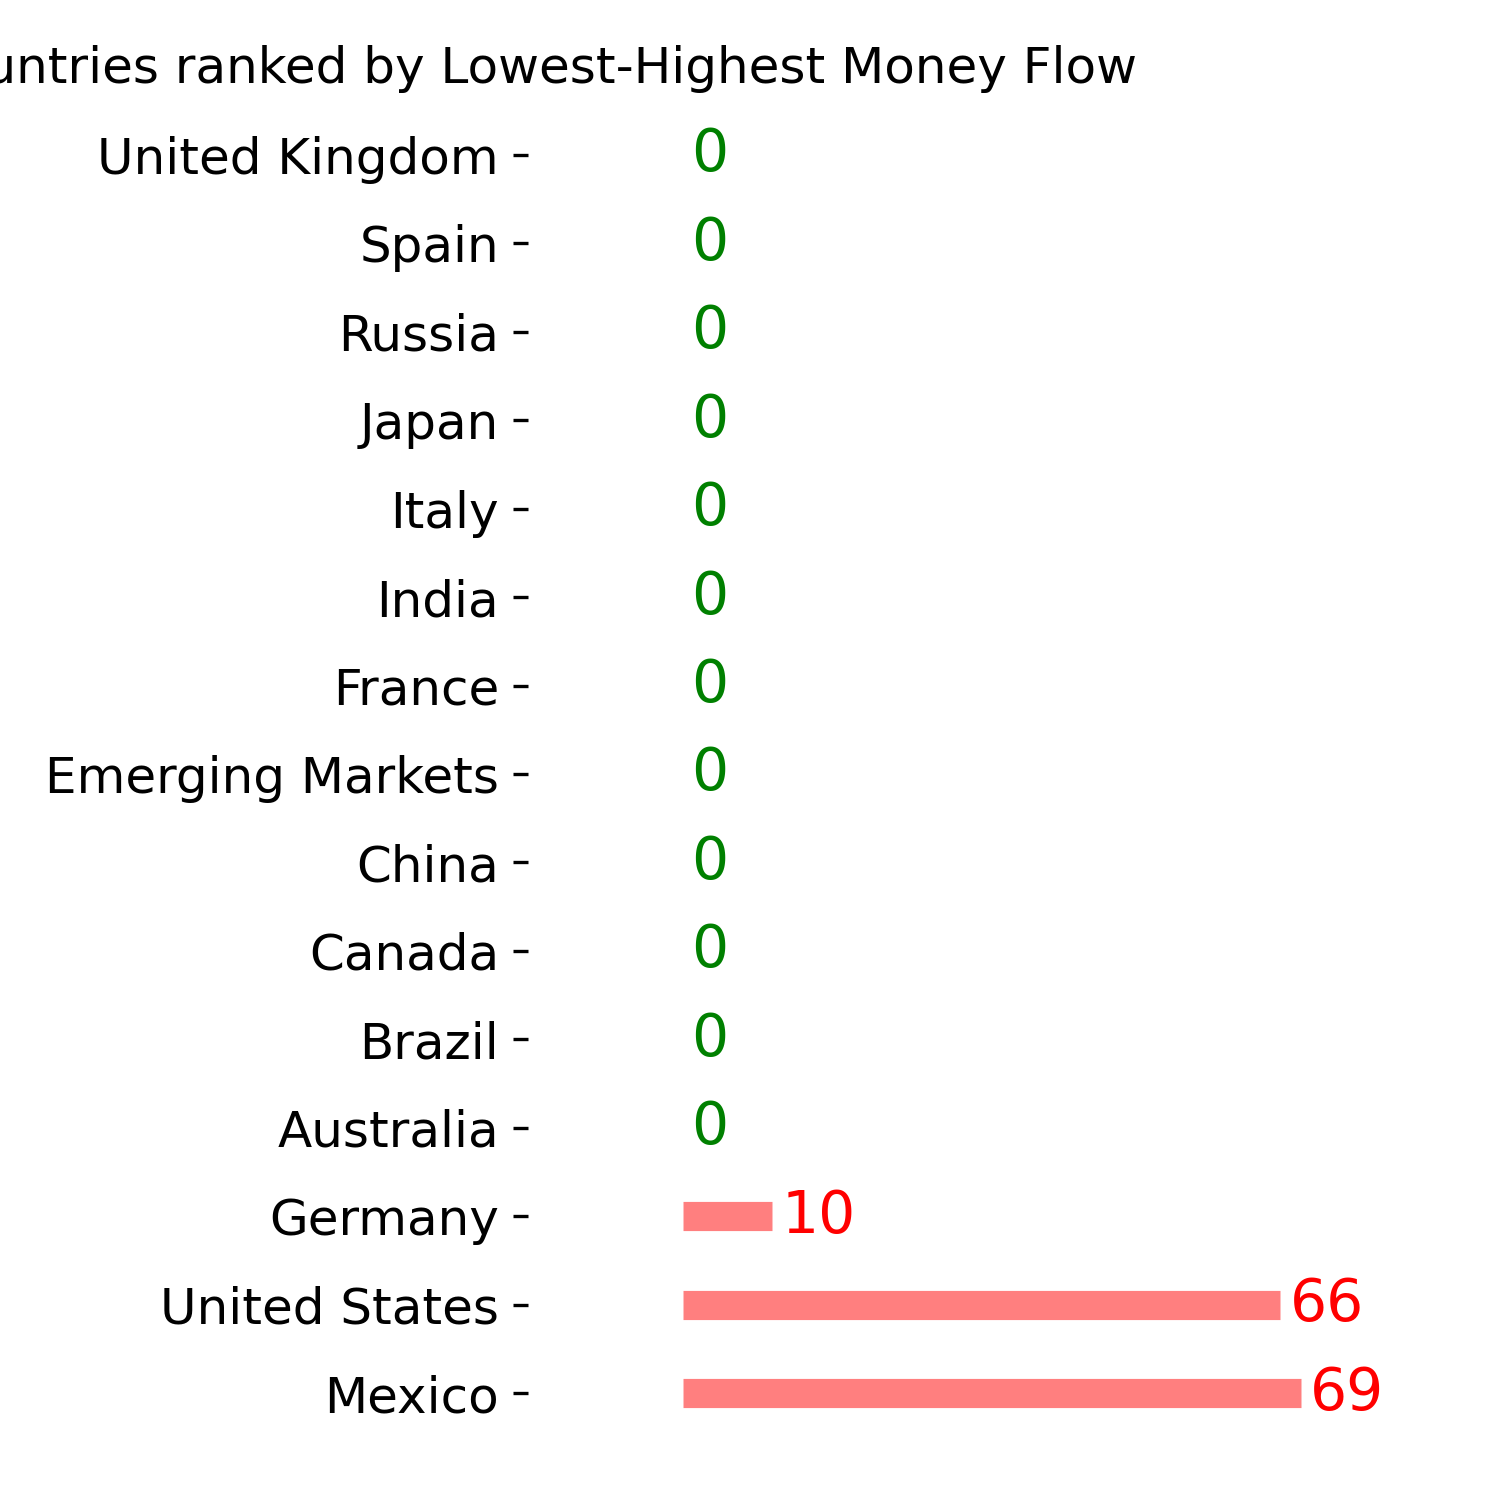
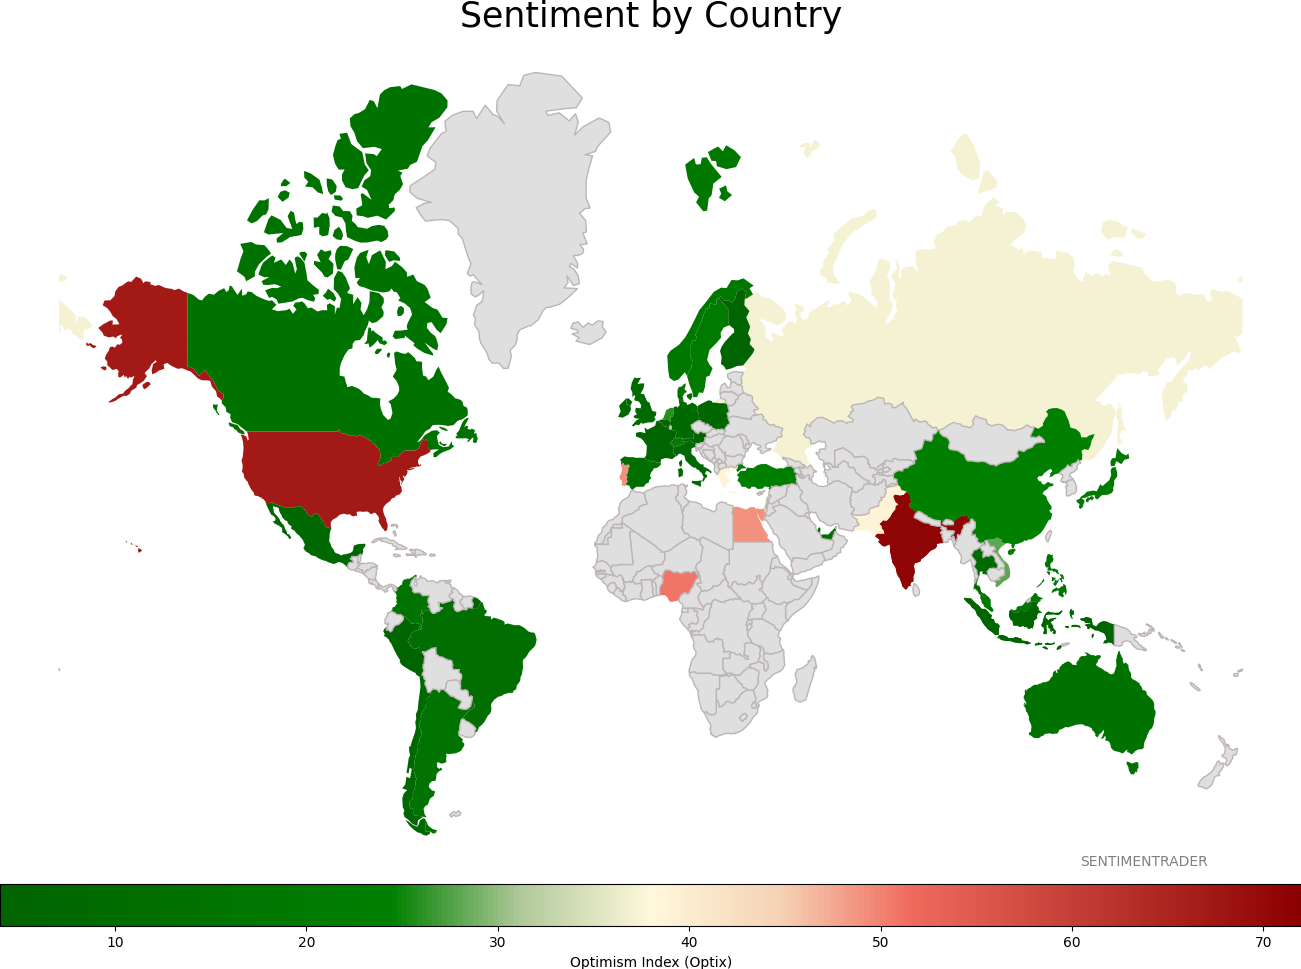
Sentiment Around The World
Optimism Index Thumbnails
|
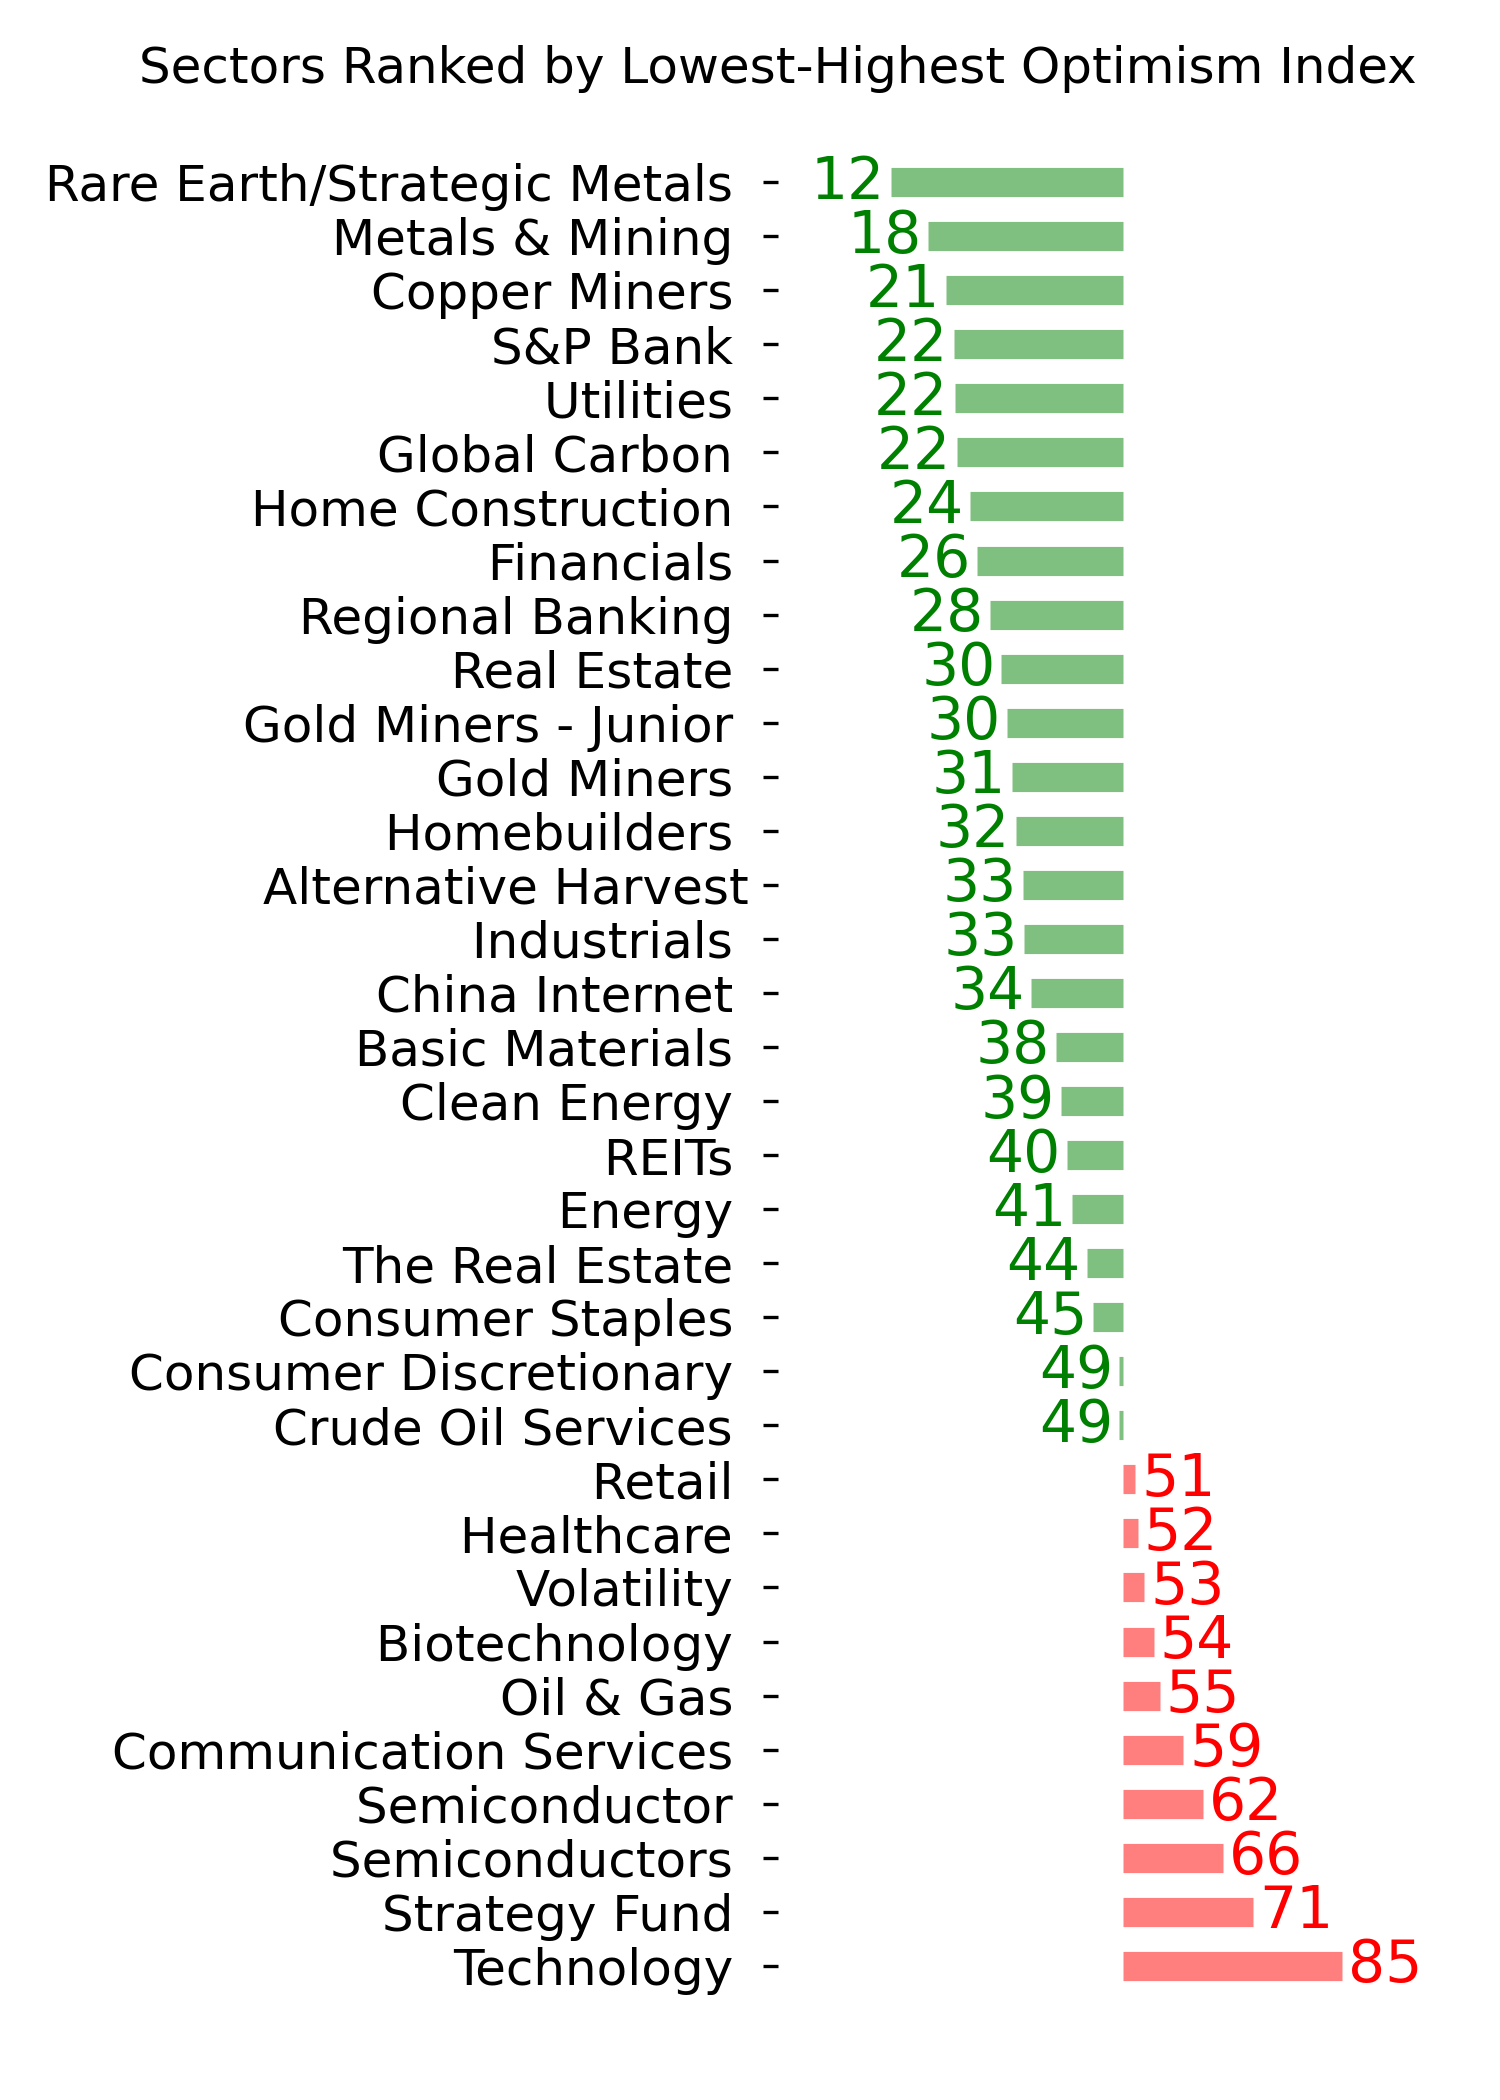
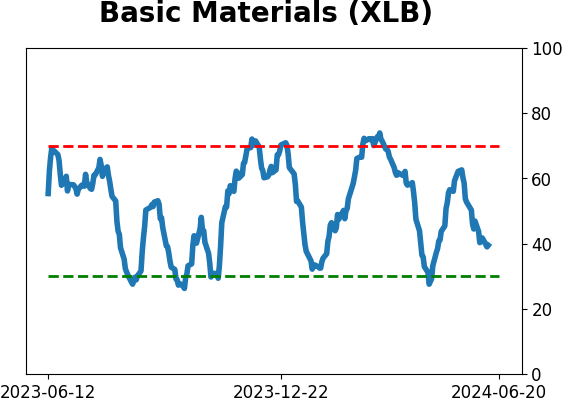
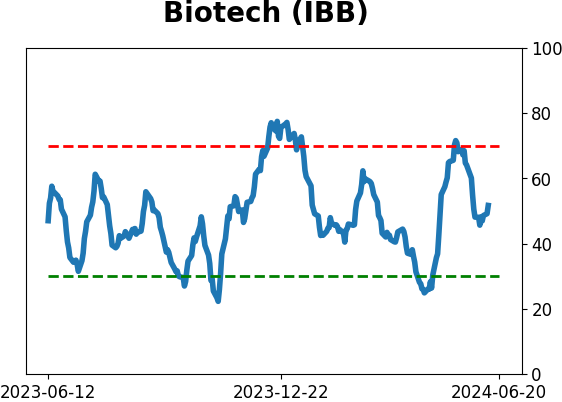
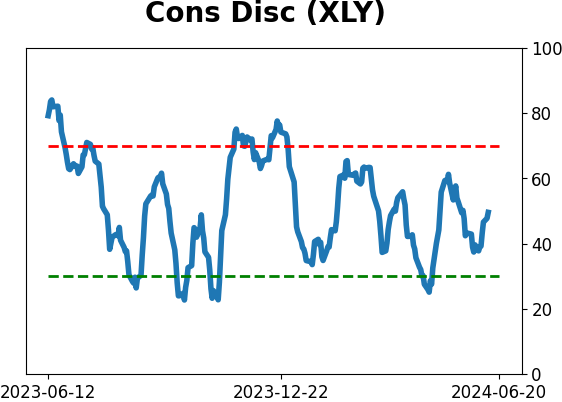
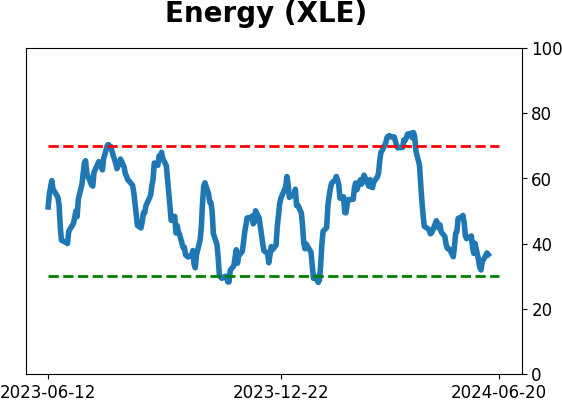
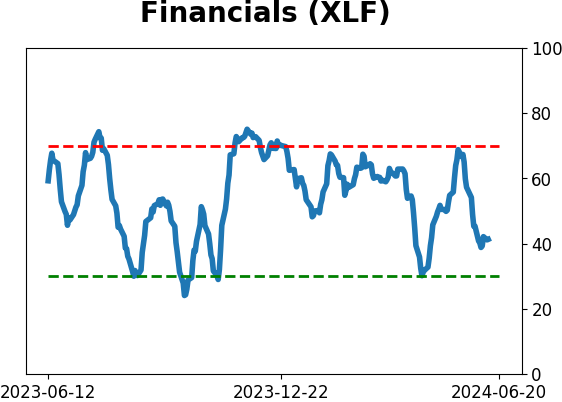
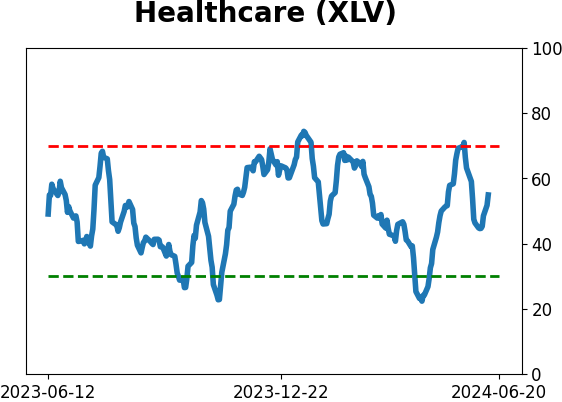
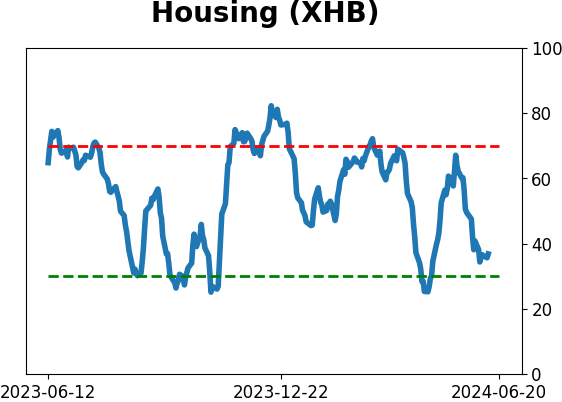
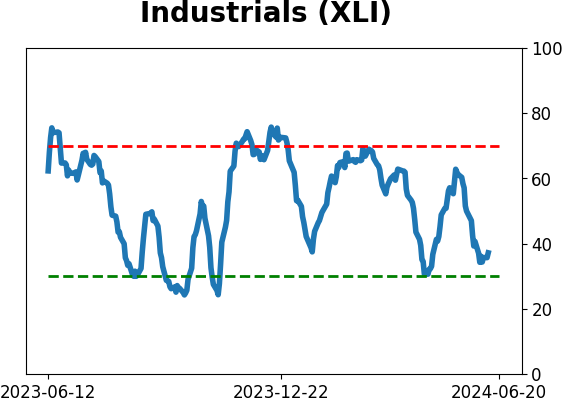
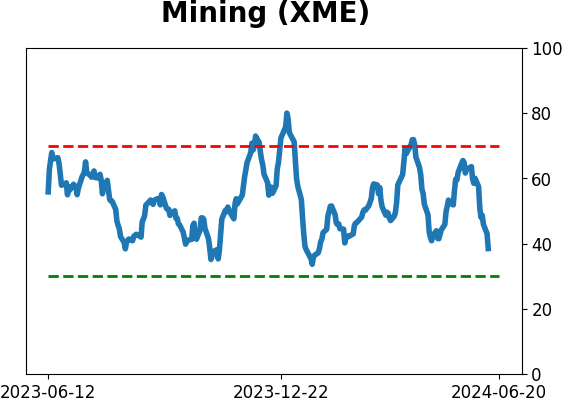
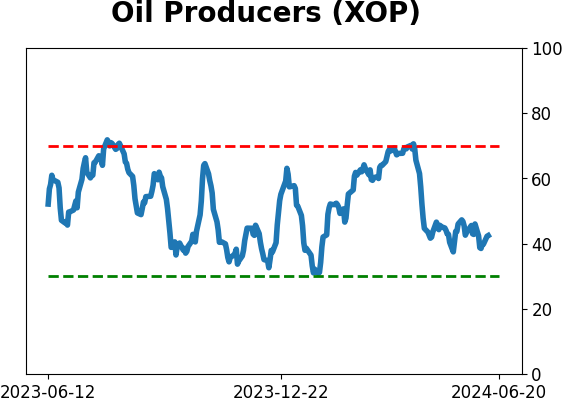
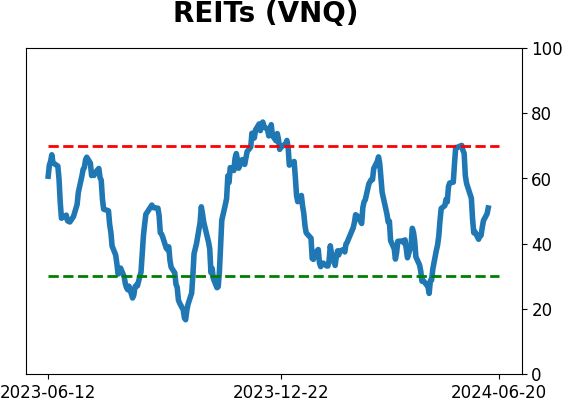
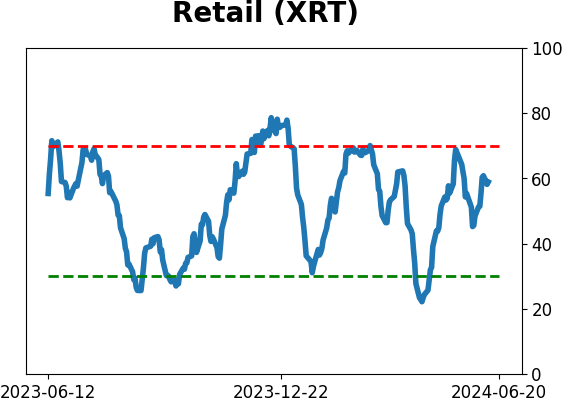
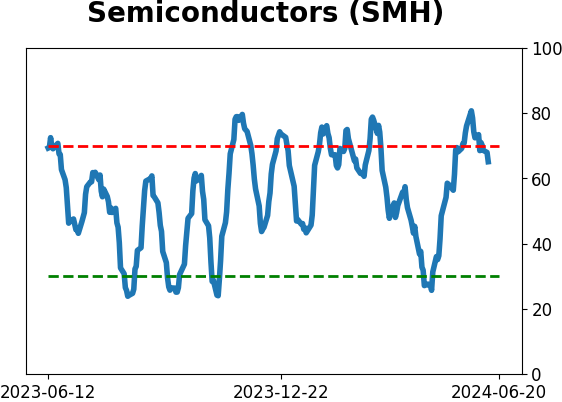
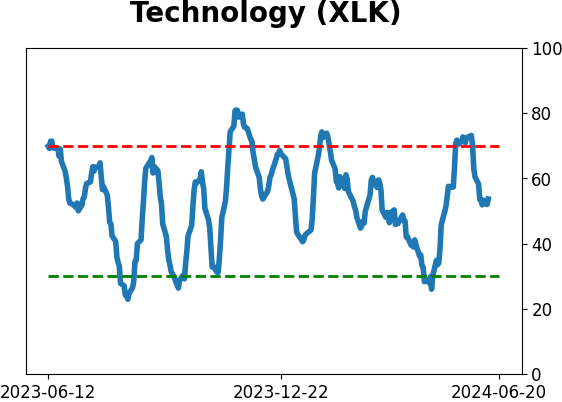
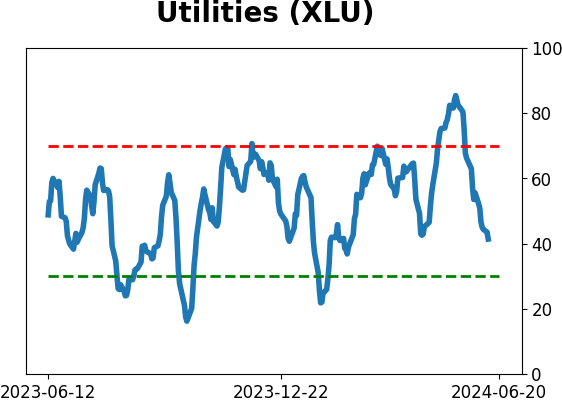
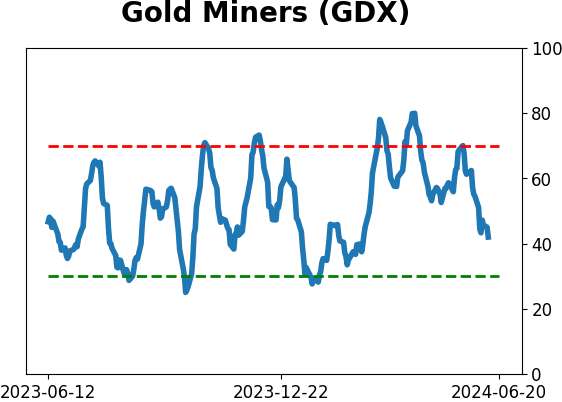
Sector ETF's - 10-Day Moving Average
|
|
|
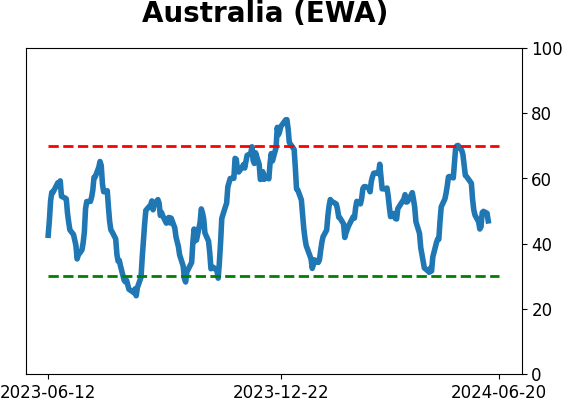
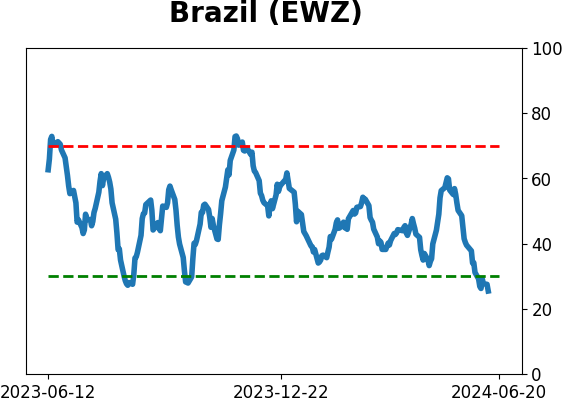
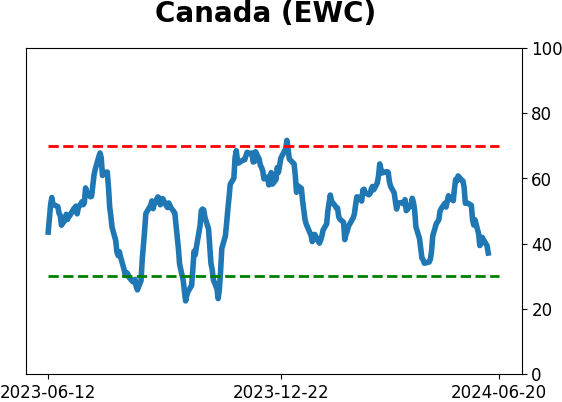
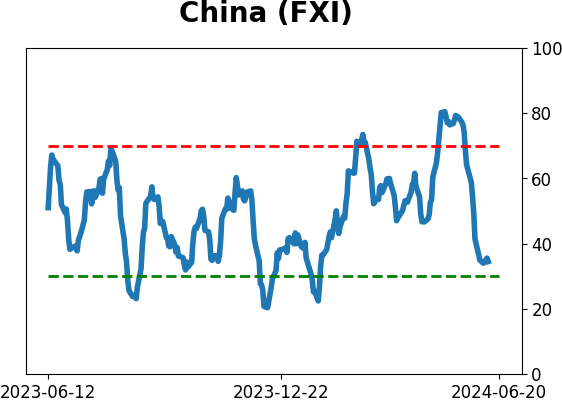
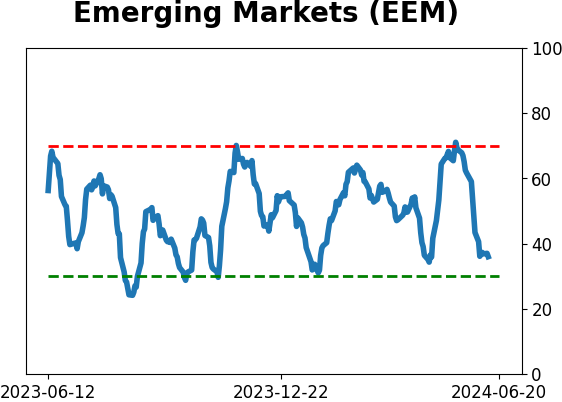
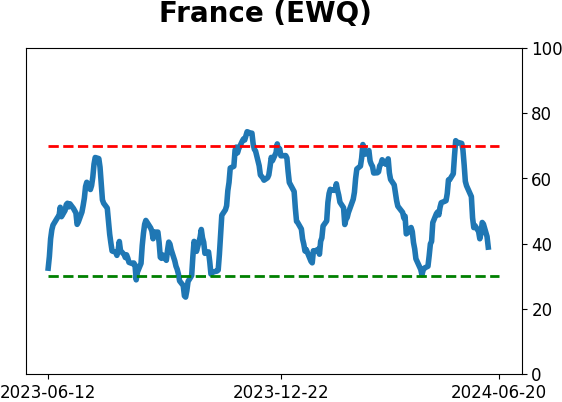
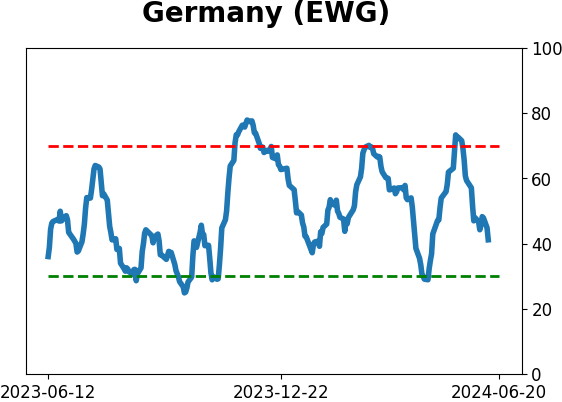
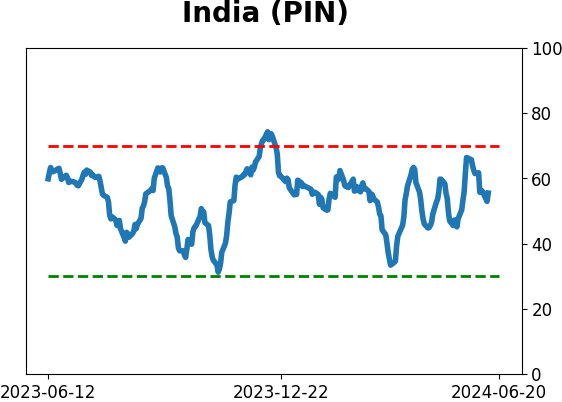
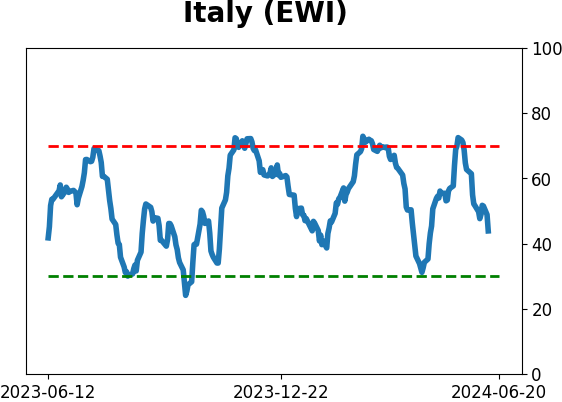
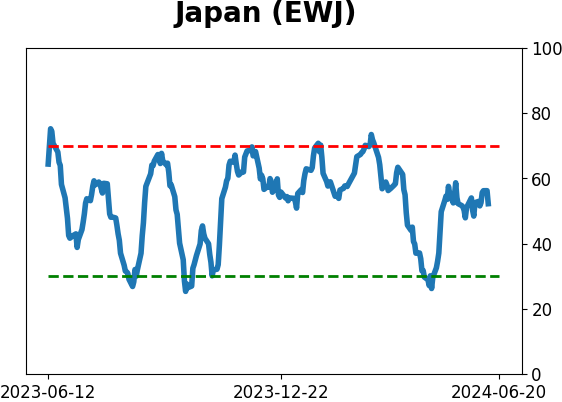
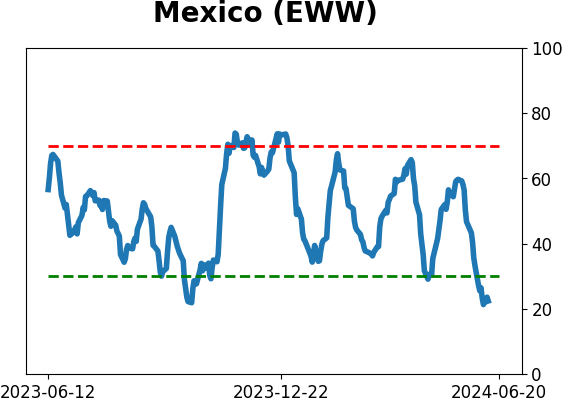
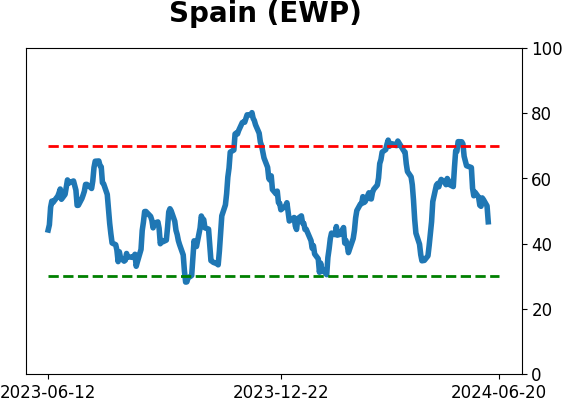
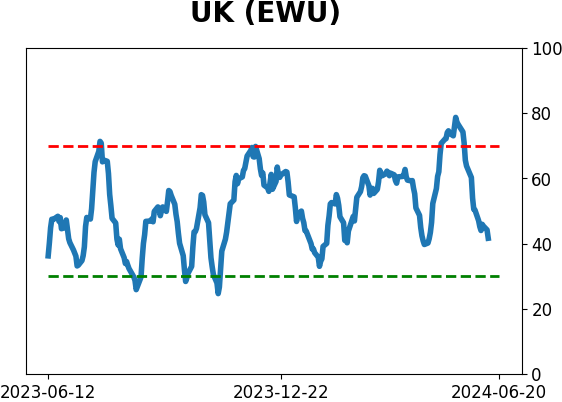
Country ETF's - 10-Day Moving Average
|
|
|
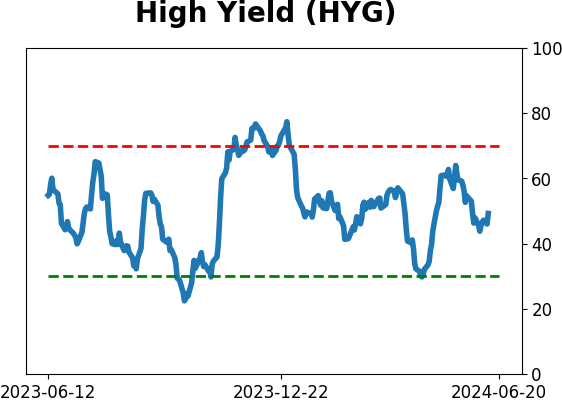
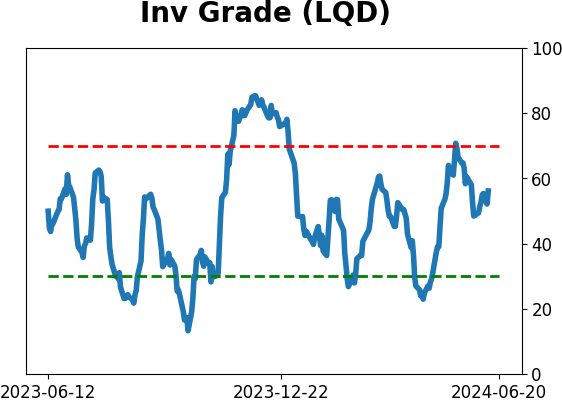
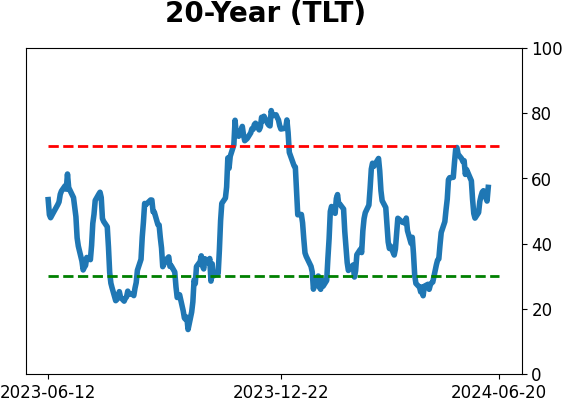
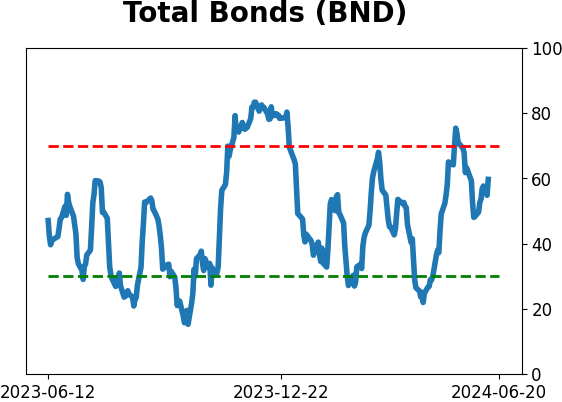
Bond ETF's - 10-Day Moving Average
|
|
|
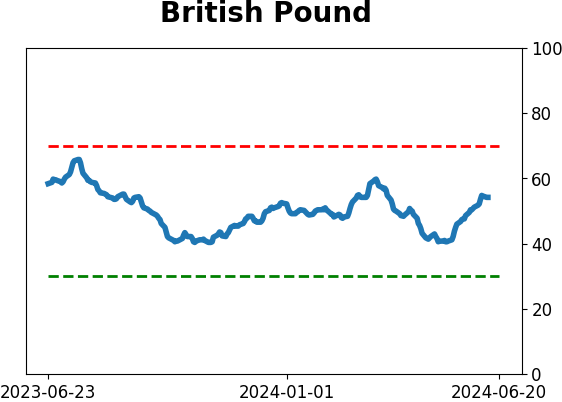
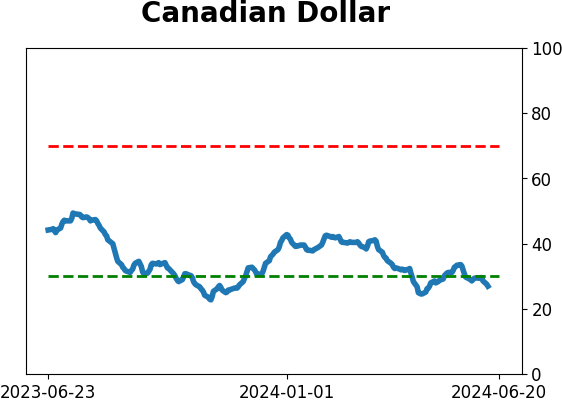
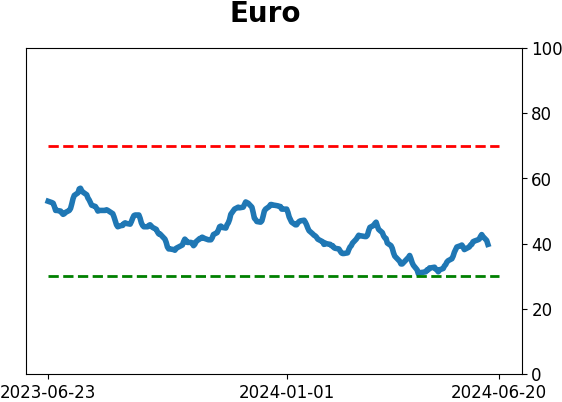
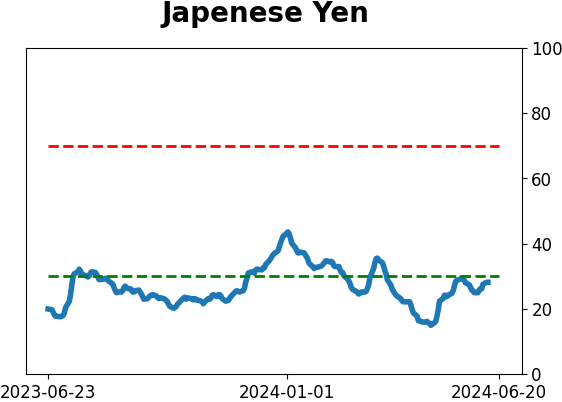
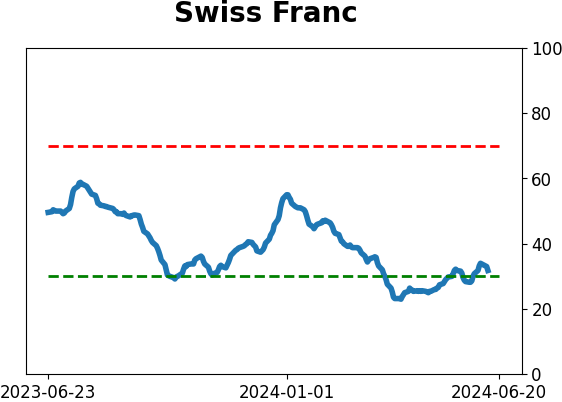
Currency ETF's - 5-Day Moving Average
|
|
|
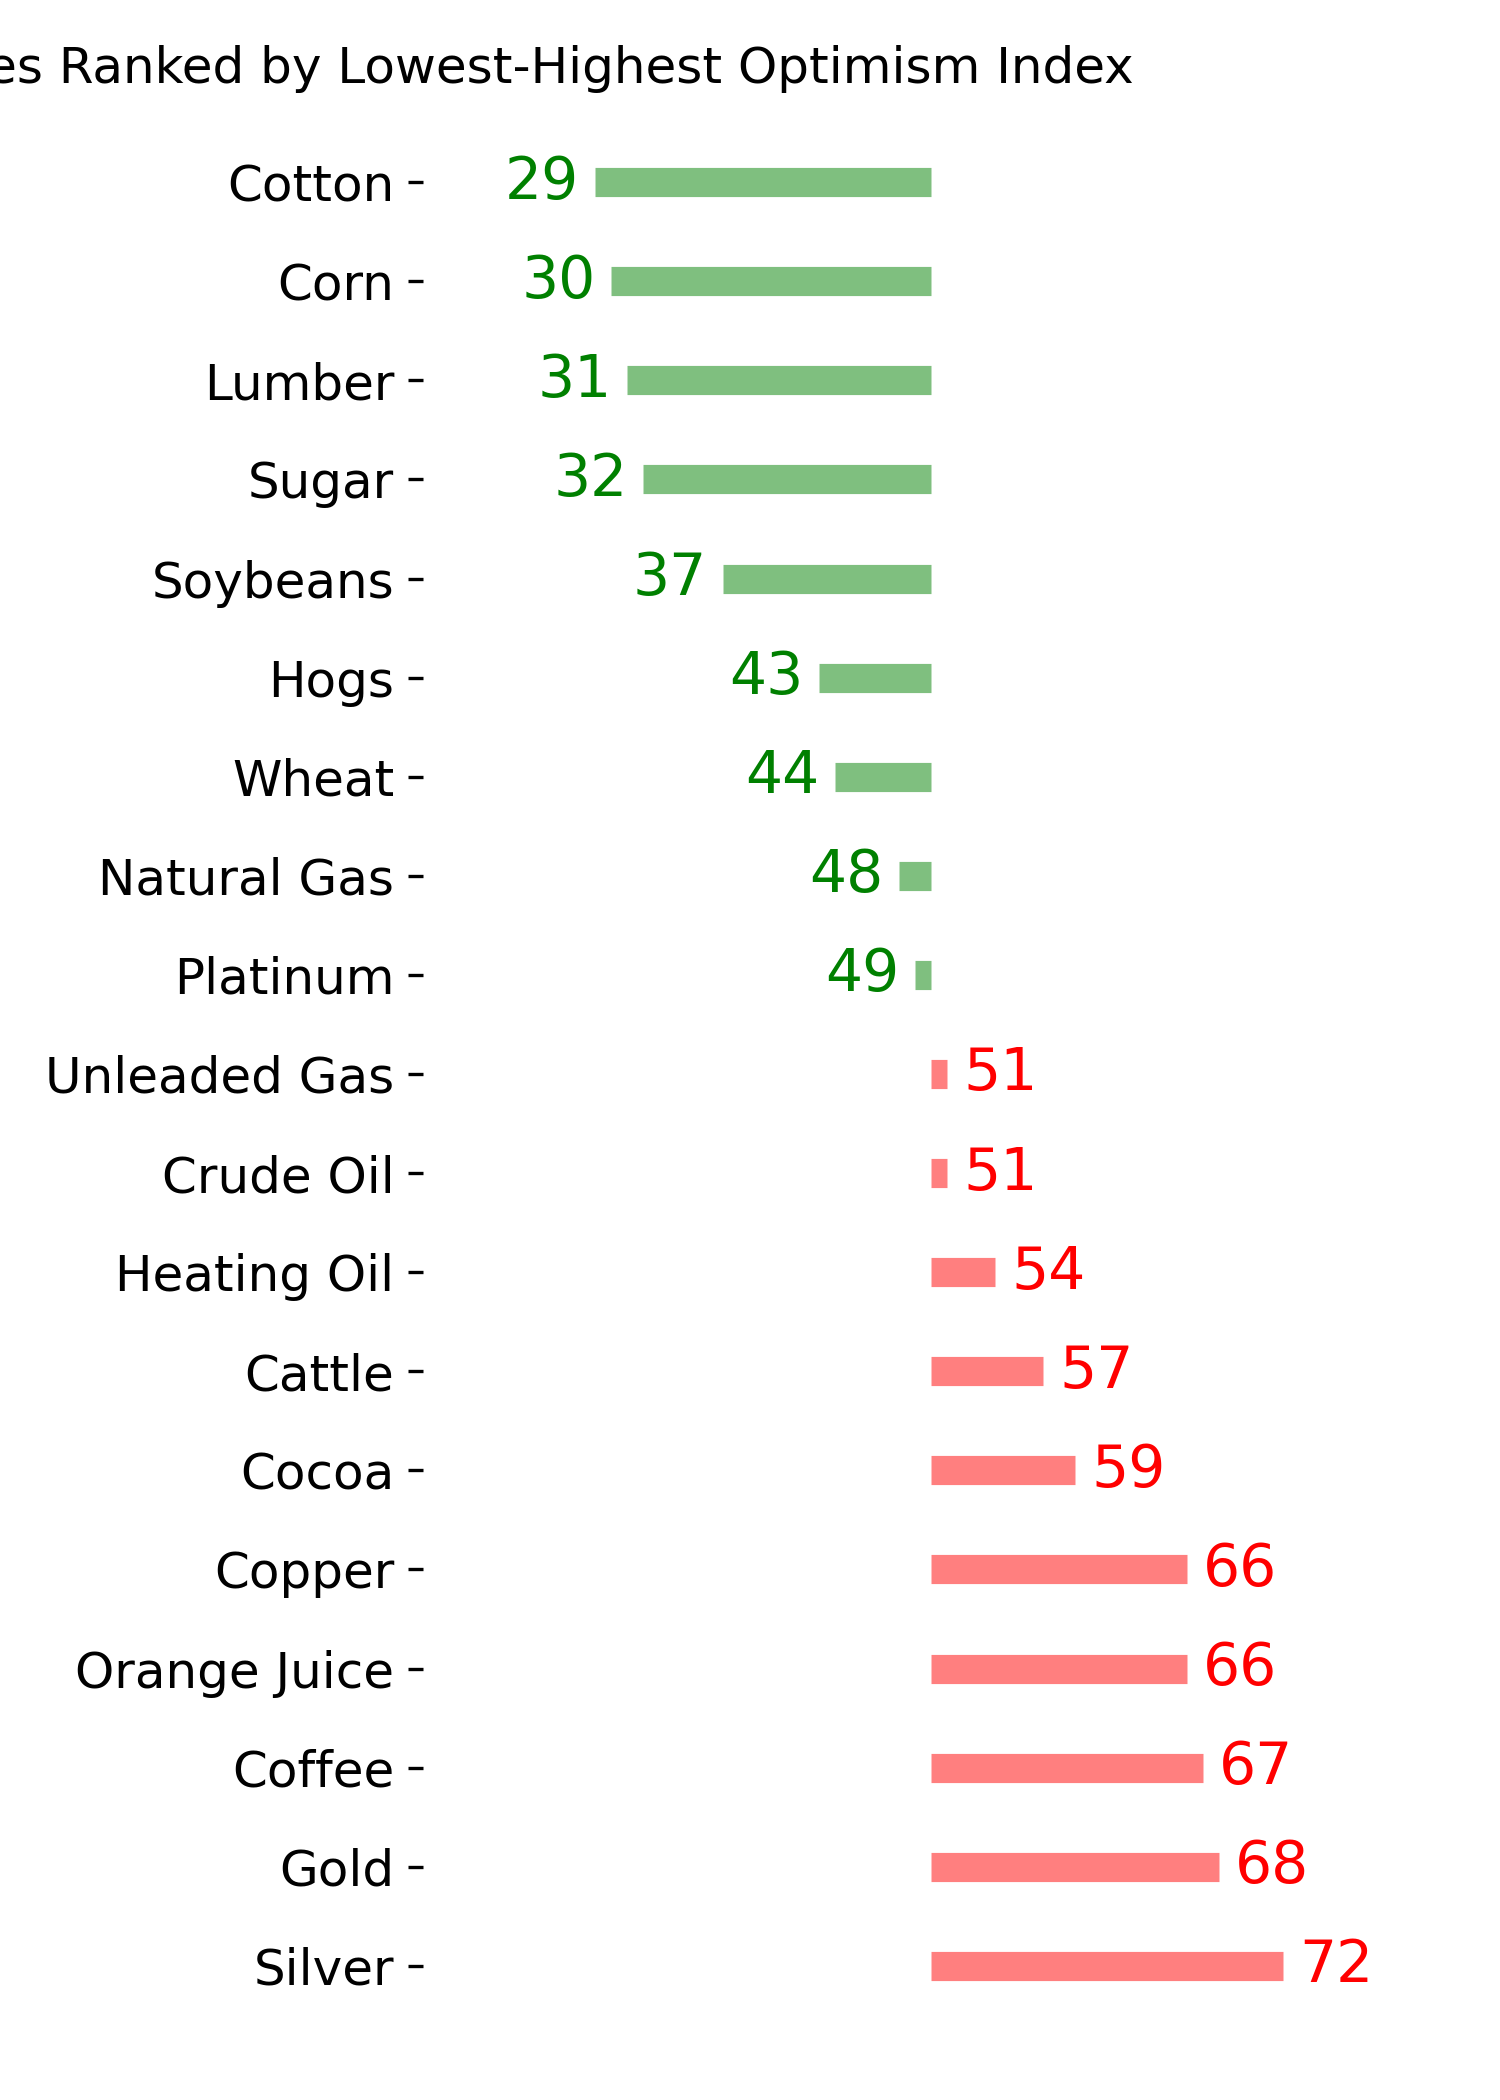
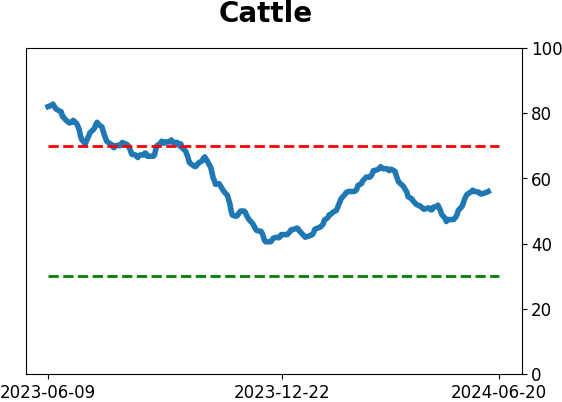
Commodity ETF's - 5-Day Moving Average
|
|