Headlines
|
|
A year since the bull market was confirmed:
About a year ago, the S&P 500 confirmed that something had changed from a miserable 2022. At that point, the index broke out to higher highs and suggested the worst of the selling was over. Similar one-year patterns to the past year suggested a tougher road ahead, particularly when those analogs concluded in the summer months.
|
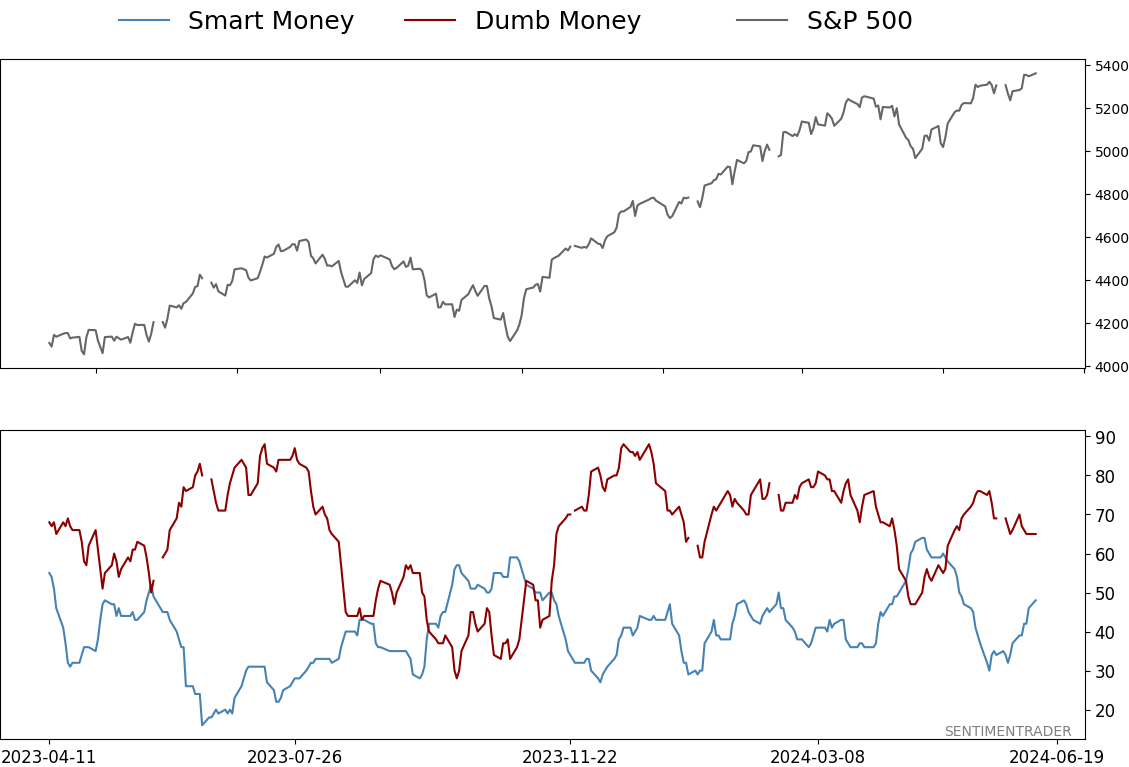
Smart / Dumb Money Confidence
|
Smart Money Confidence: 48%
Dumb Money Confidence: 65%
|
|
Risk Levels
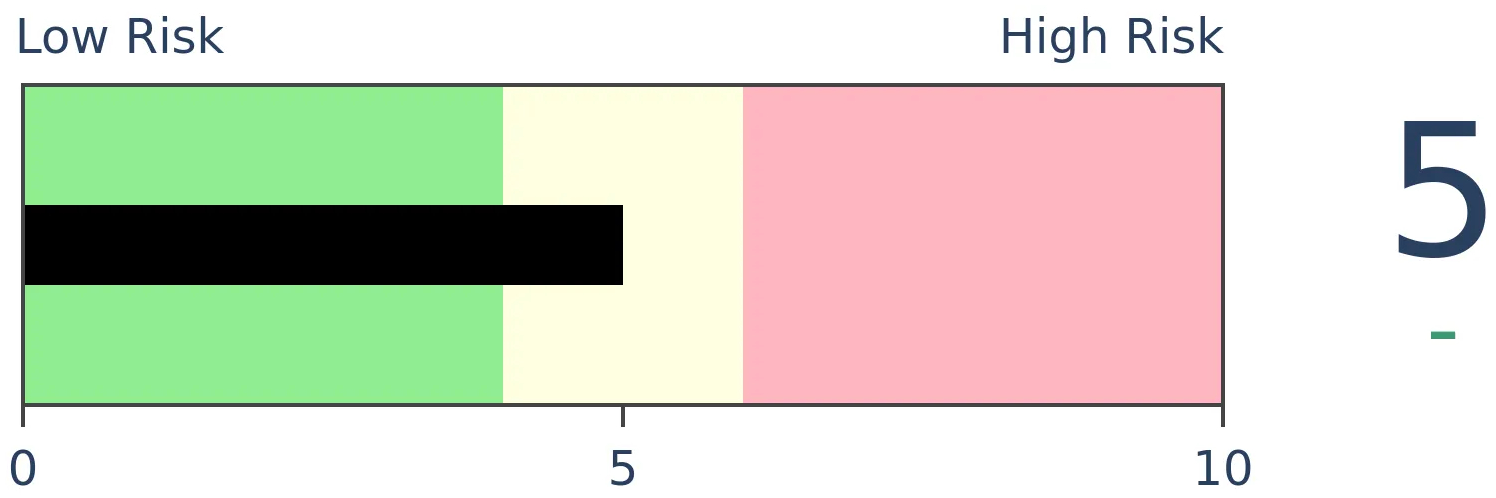
Stocks Short-Term
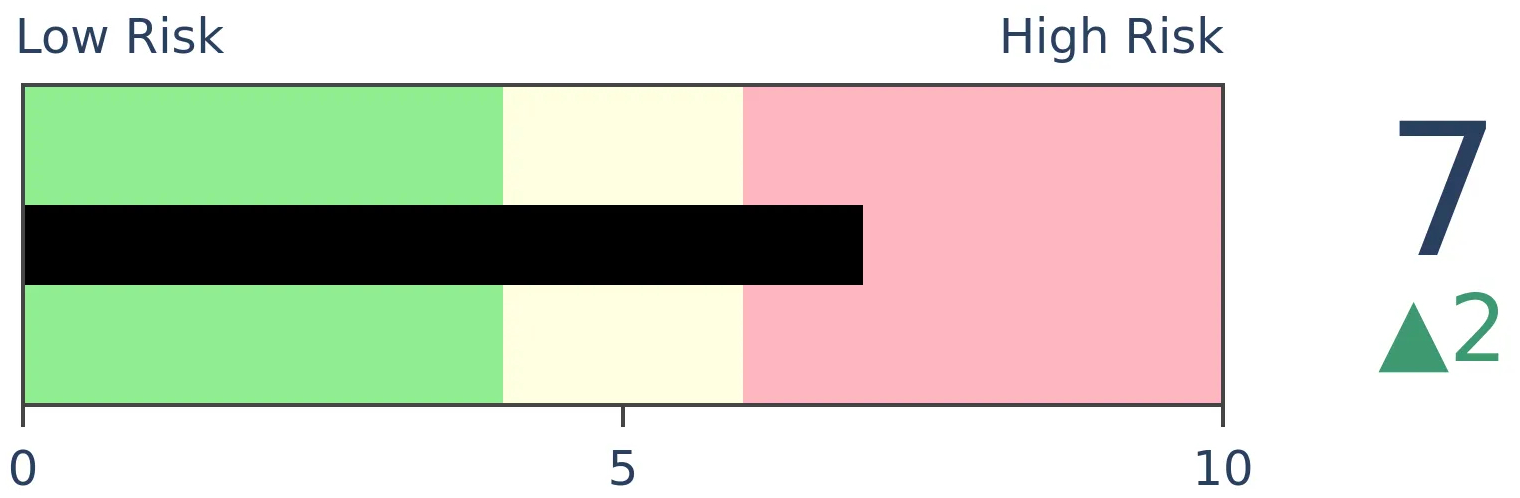
|
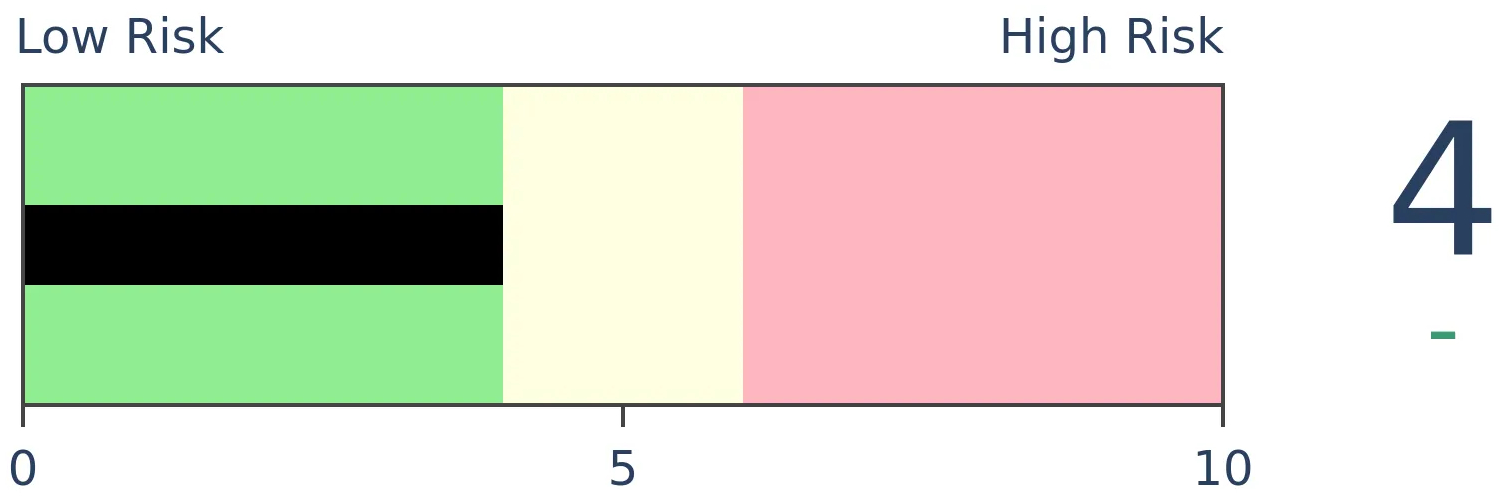
Stocks Medium-Term
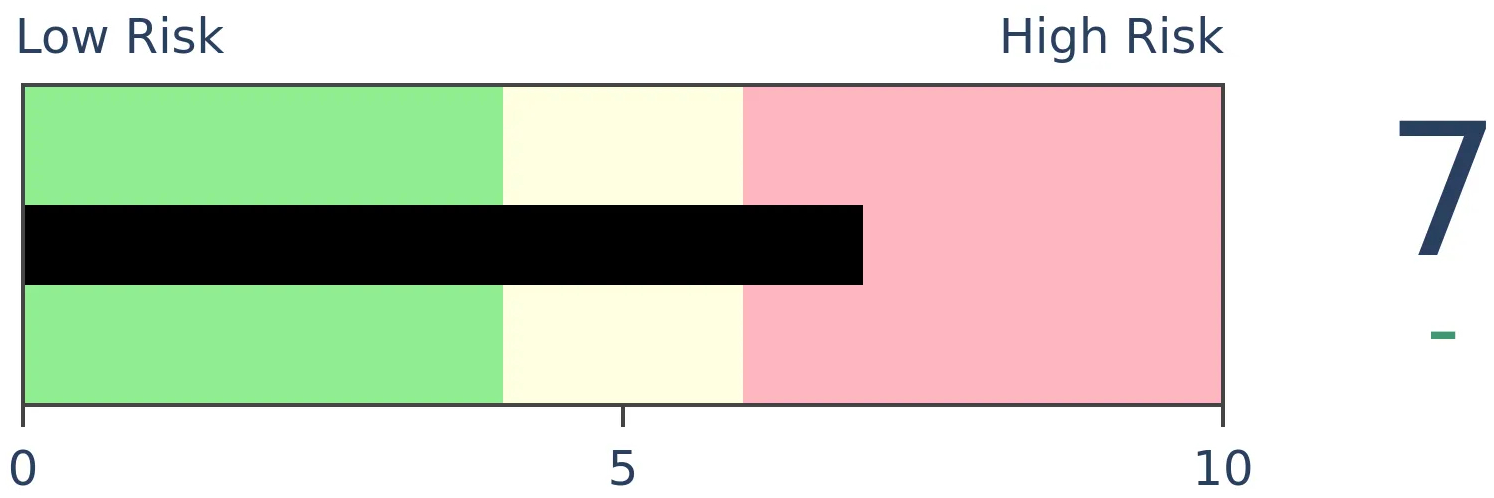
|
|
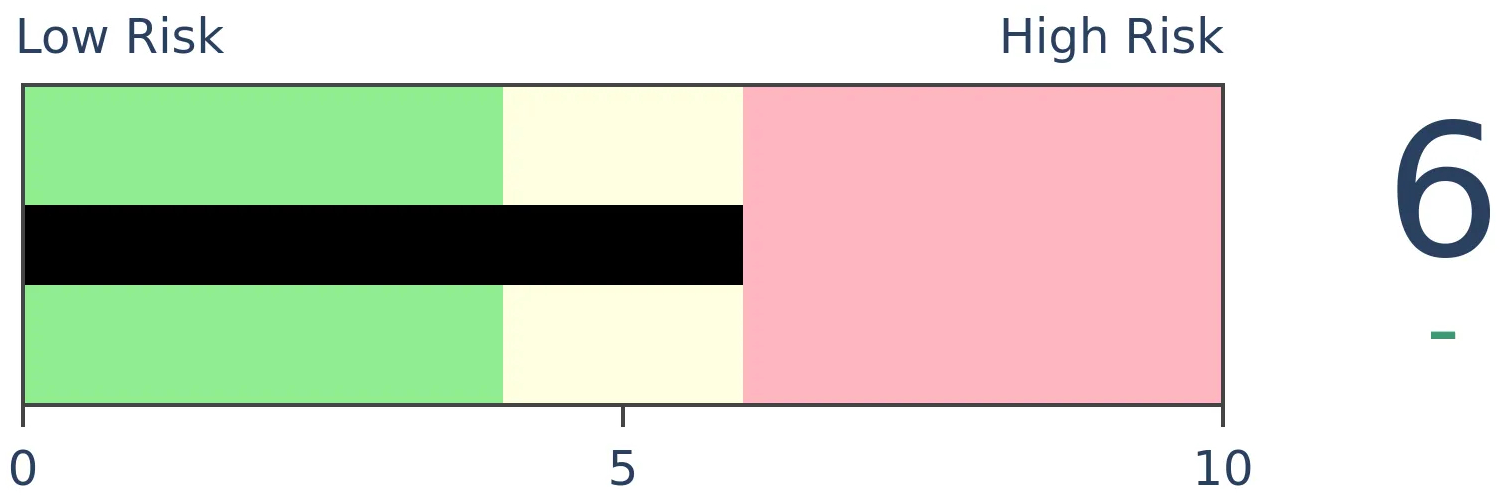
Bonds
|
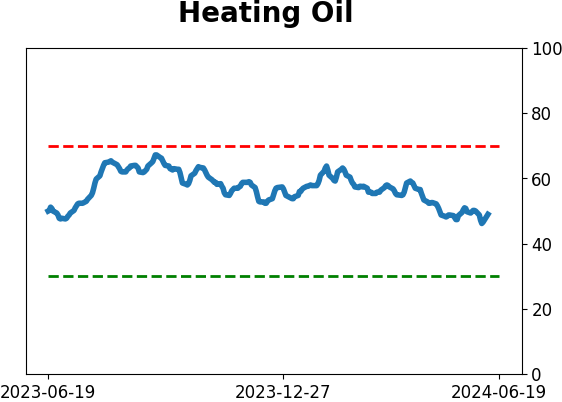
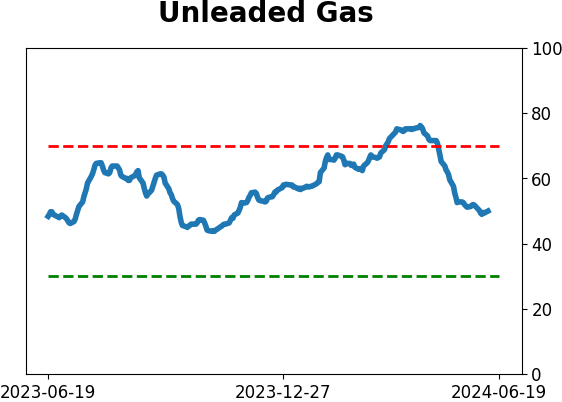
Crude Oil
|
|
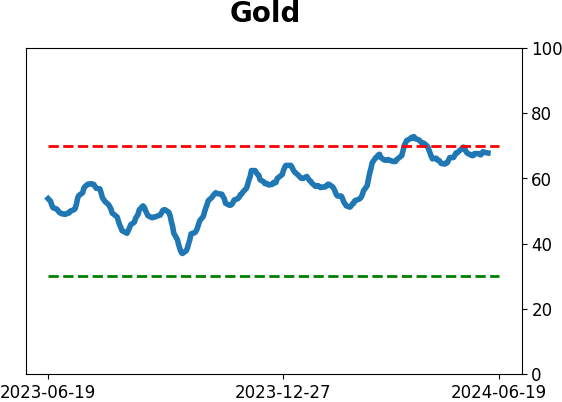
Gold
|
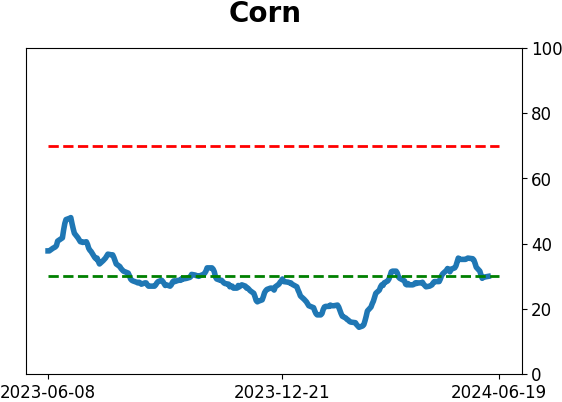
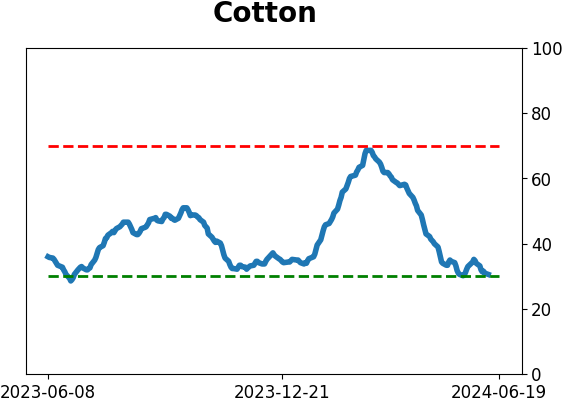
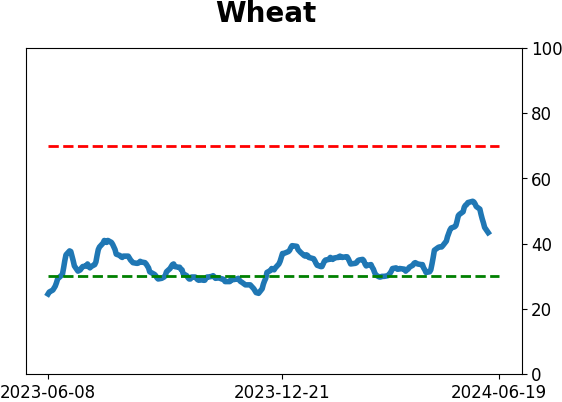
Agriculture

|
|
Research
By Jason Goepfert
BOTTOM LINE
About a year ago, the S&P 500 confirmed that something had changed from a miserable 2022. At that point, the index broke out to higher highs and suggested the worst of the selling was over. Similar one-year patterns to the past year suggested a tougher road ahead, particularly when those analogs concluded in the summer months.
FORECAST / TIMEFRAME
None
|
Key points:
- It's been about a year since the S&P 500 confirmed a breakout to a new bull market
- Similar one-year analogs preceded relatively weak returns in the months ahead
- Returns were weaker when the analogs concluded during the summer months
A year since the breakout
It's been a year since the most benchmarked index in the world told investors that something had changed. We looked at numerous conditions during the summer and (especially) the fall of 2022 that suggested an end to the carnage was at hand. Then, almost daily, we looked at evidence that markets were showing the hallmarks of a sustained rally.
But it wasn't until June 2023 that investors had their first tangible evidence that price was following through. It was the first real breakout from what had been a miserable year. During the fall of 2023, there was the potential of a false breakout, but it was quickly reversed.
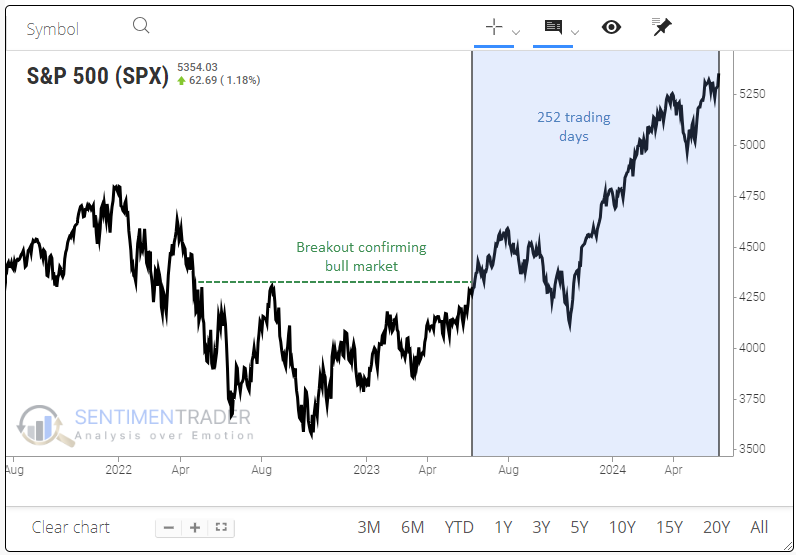
The year since then has been mostly pleasant for those who believed the signs. There was a sizable pullback last fall, but other than that, it's been pretty clear sailing.
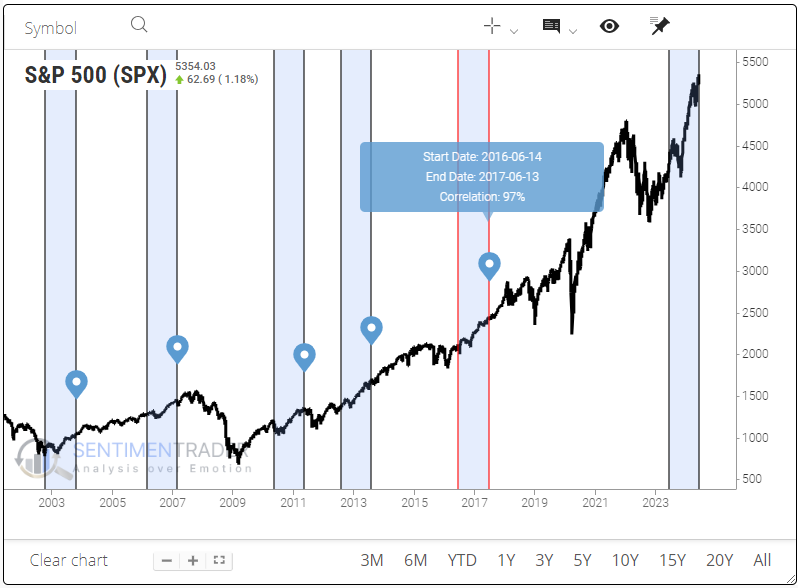
The Correlation Pattern Match tool allows users to look for other times with similar price structures. By using the tool to find other 252-day (one trading year) price patterns most similar to the past year, we can see how those panned out going forward. When you run the tool, the blue highlighted sections show other time periods with a high correlation.
Clicking them will show the start and end dates and the correlation to the past year. The chart below shows that June 2016 through June 2017 had a 0.97 correlation to the past year (on a scale of -1.0 to +1.0).
Relatively weak returns
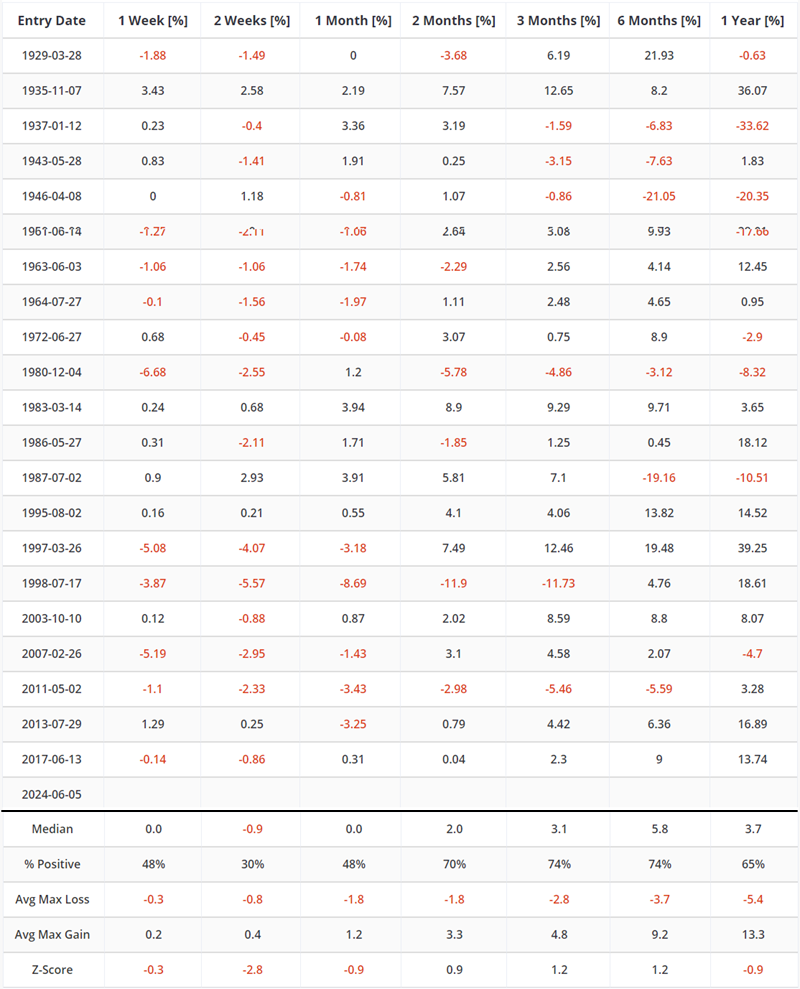
The tool also allows users to backtest those periods to see future returns. We're using the S&P 500 for this test, and the Multi-Timeframe Results show some weakness in the short term but decent strength after that. One-year returns weren't very impressive.
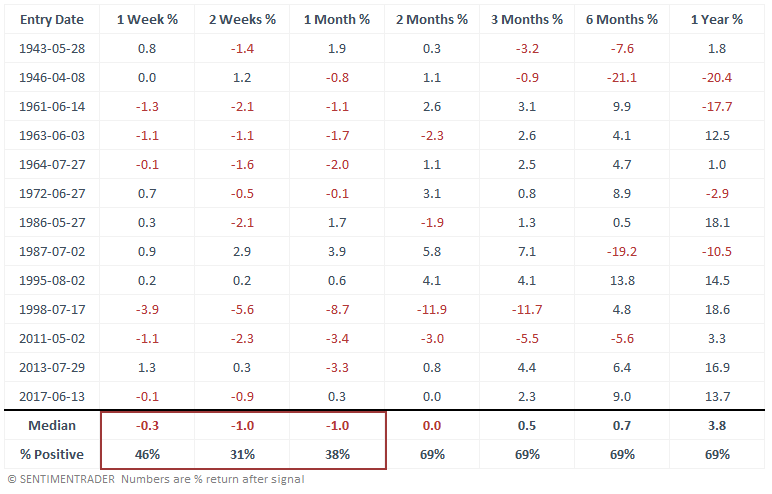
One thing to consider is seasonality. The table below shows the signals triggered during the summer months (roughly). These showed very weak returns up to a month later, then improved. Even though longer-term returns were mostly positive, the average return was relatively weak. They were especially weak if using mean returns instead of median.
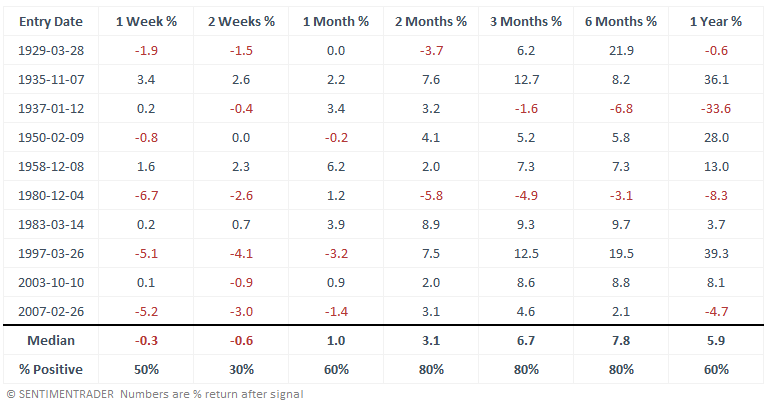
We can compare that to the non-summer months. Again, short-term returns were pretty terrible. But here, over the next 2-6 months, returns were significantly stronger and more likely to be positive.
What the research tells us...
For what is really the first time since the fall of 2022, we're seeing a relatively large cluster of concerning signals for stocks. It is more concentrated in areas like the Nasdaq exchange, but generally, there are signs that investors are a bit exhausted and becoming more discerning with their buys.
Analog comparisons like the above are a bit like seasonality. They can give us some idea about how investors may behave in the future, given how they've behaved in the past under similar one-factor conditions. Of course, millions of factors are at play, and these types of analyses are considered tertiary at best. And those "at best" times are when conclusions are consistent and compelling. In terms of the most similar one-year analogs, future returns in the S&P 500 were relatively weak across time frames, especially when they were triggered during the summer months.
Indicators at Extremes
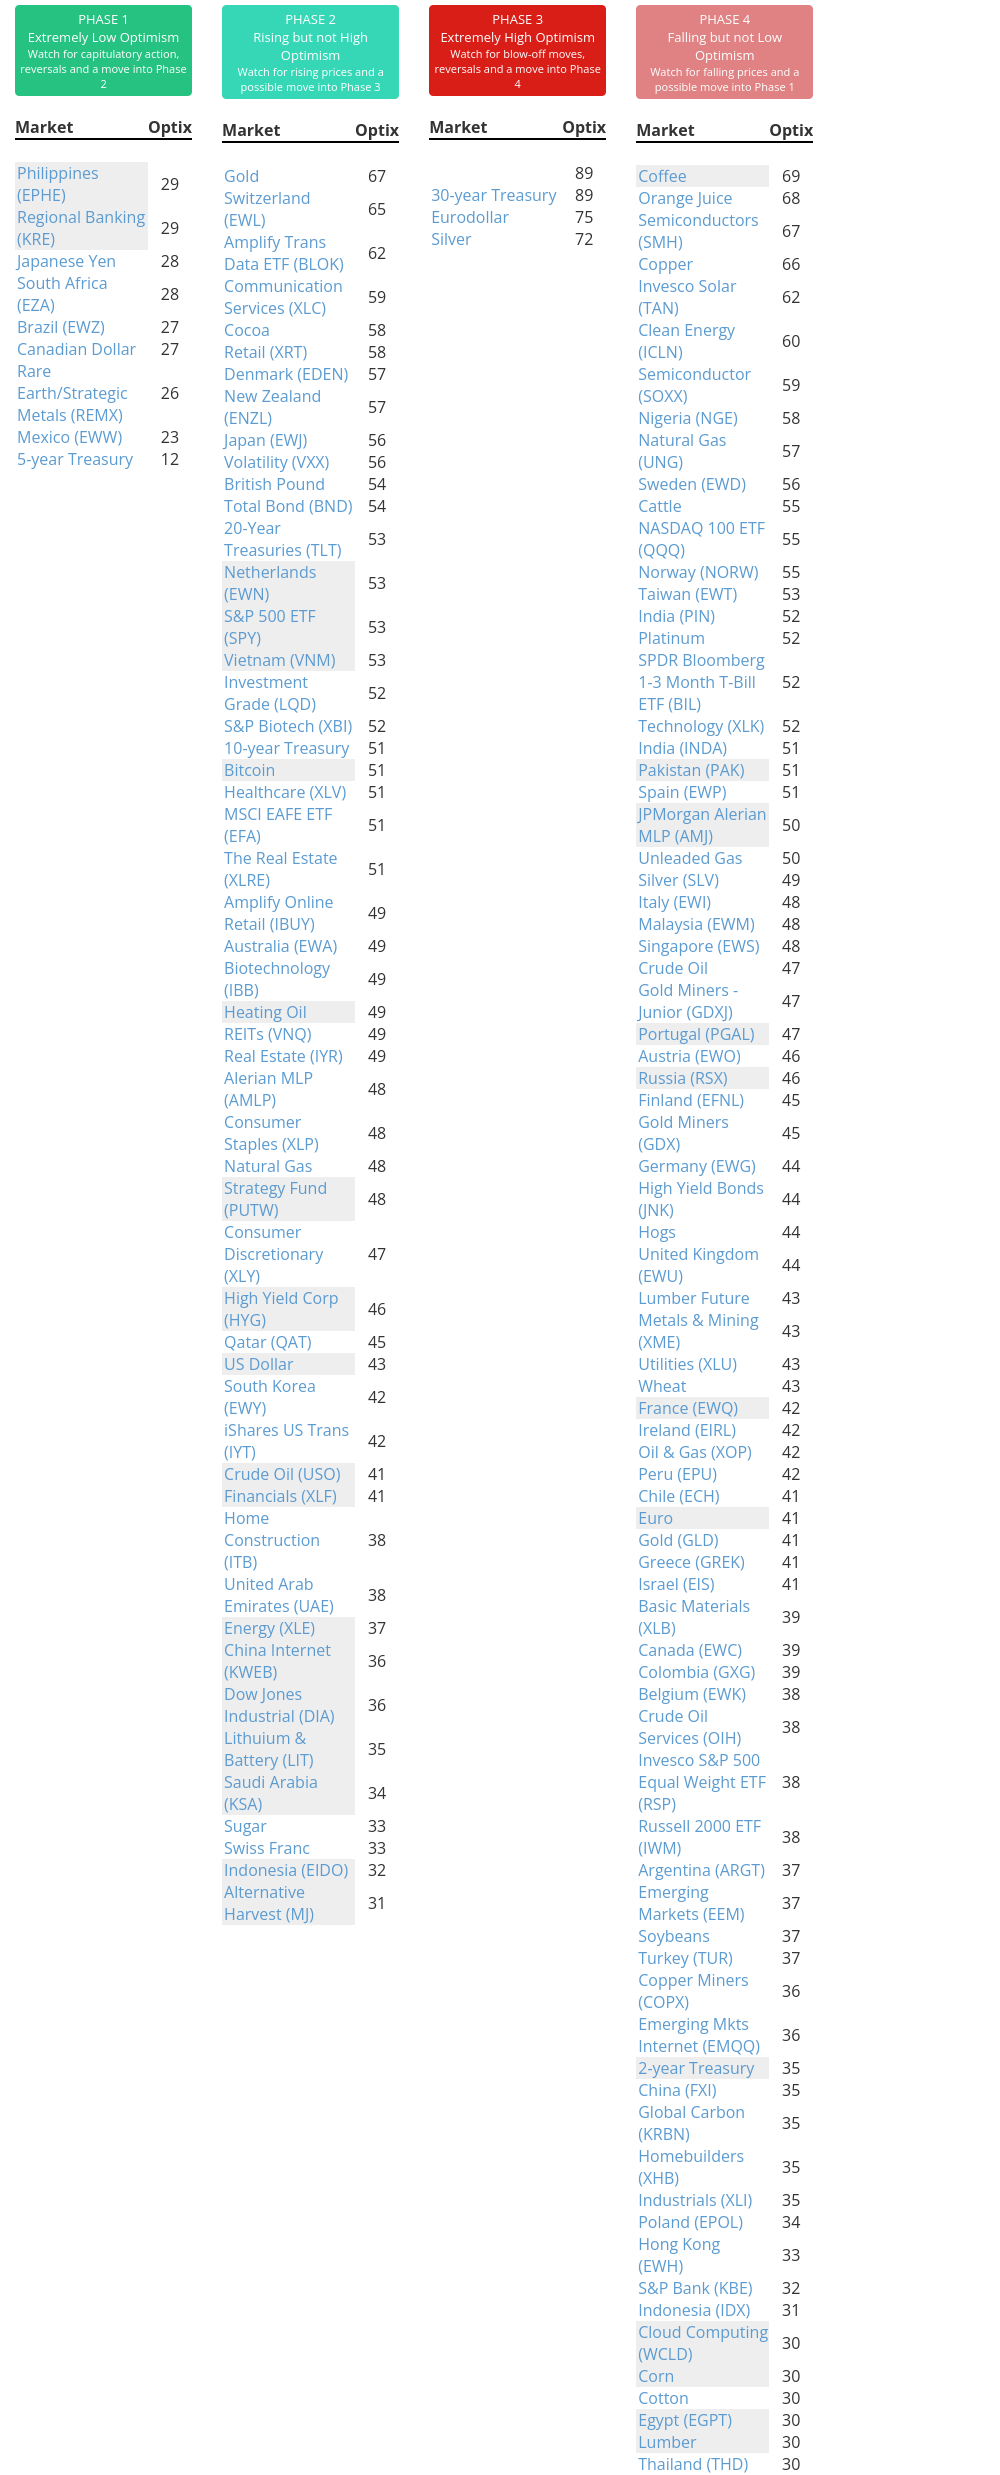
Phase Table
Ranks
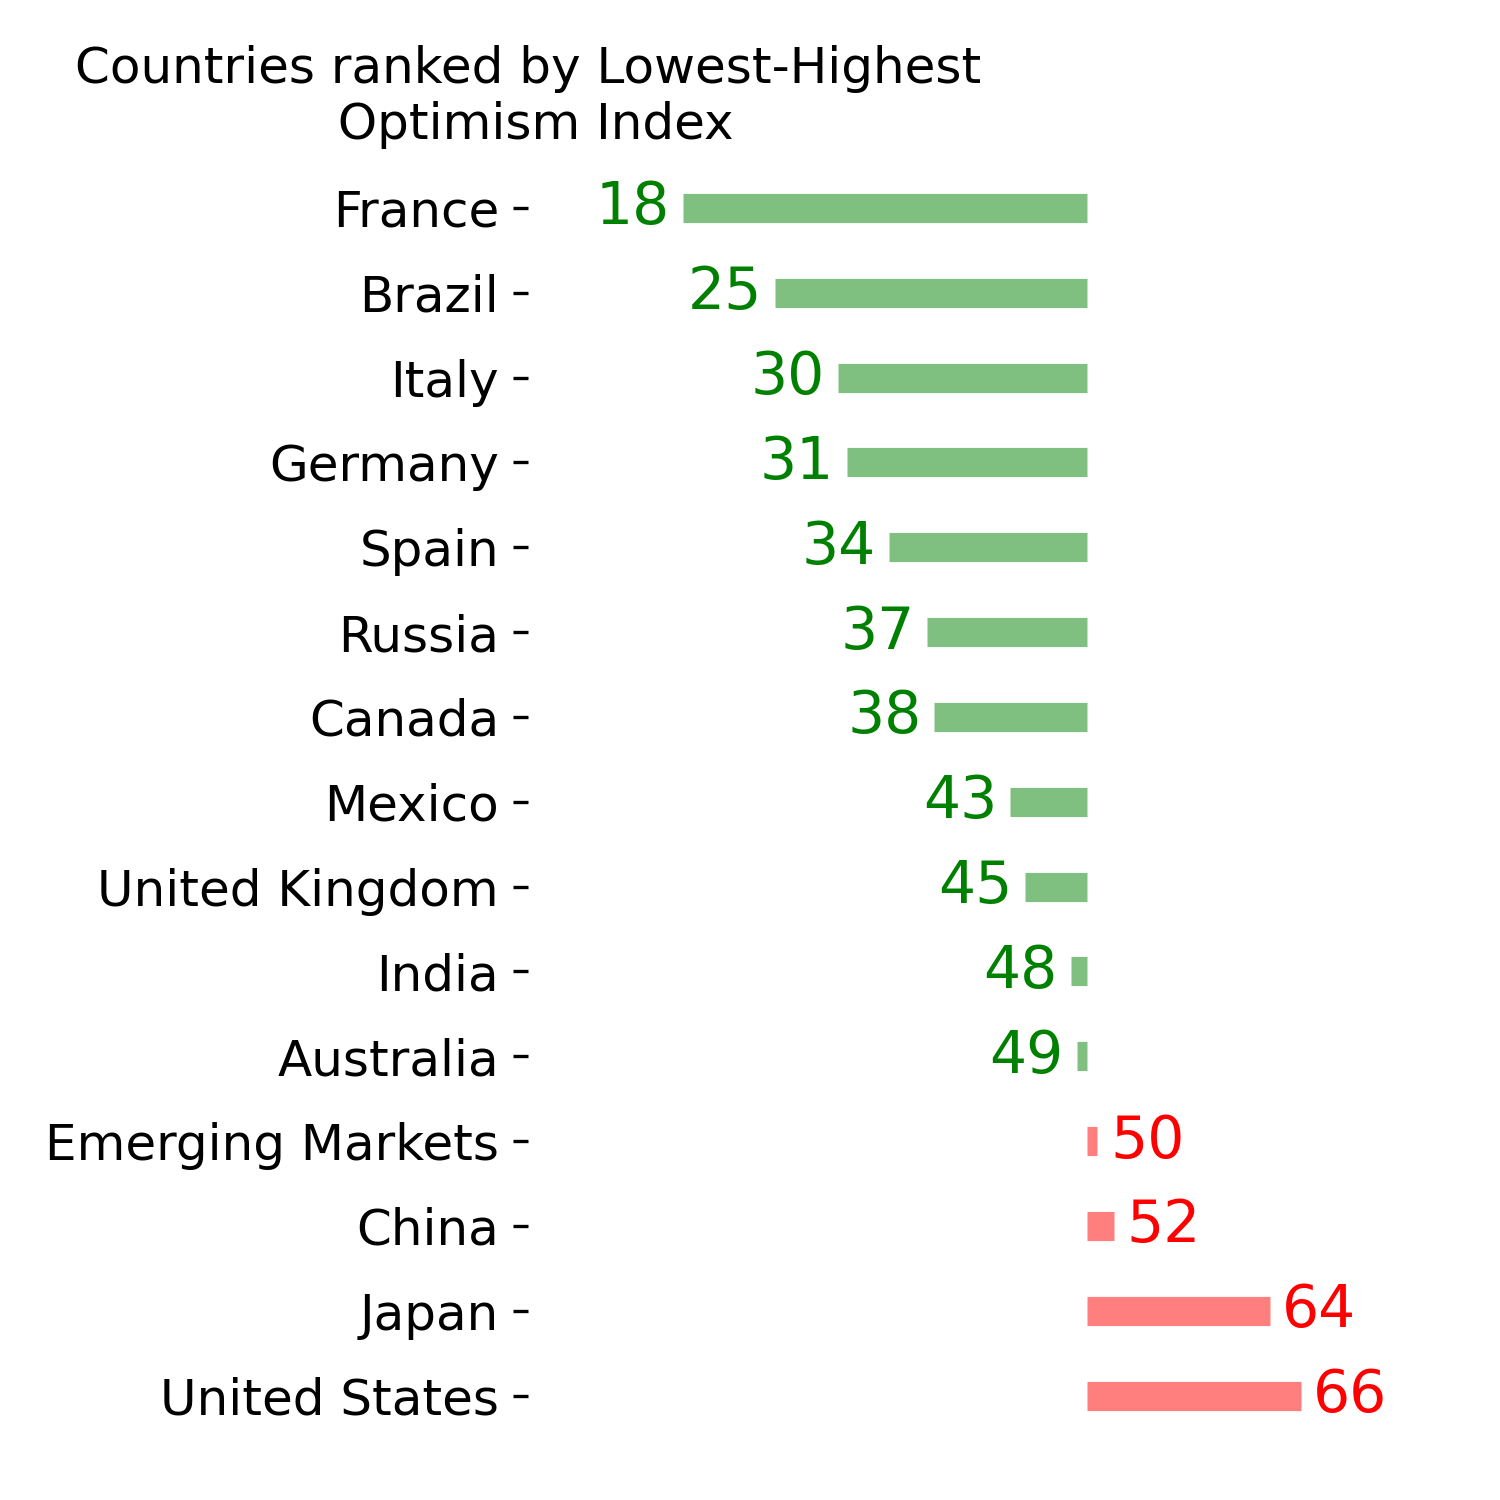
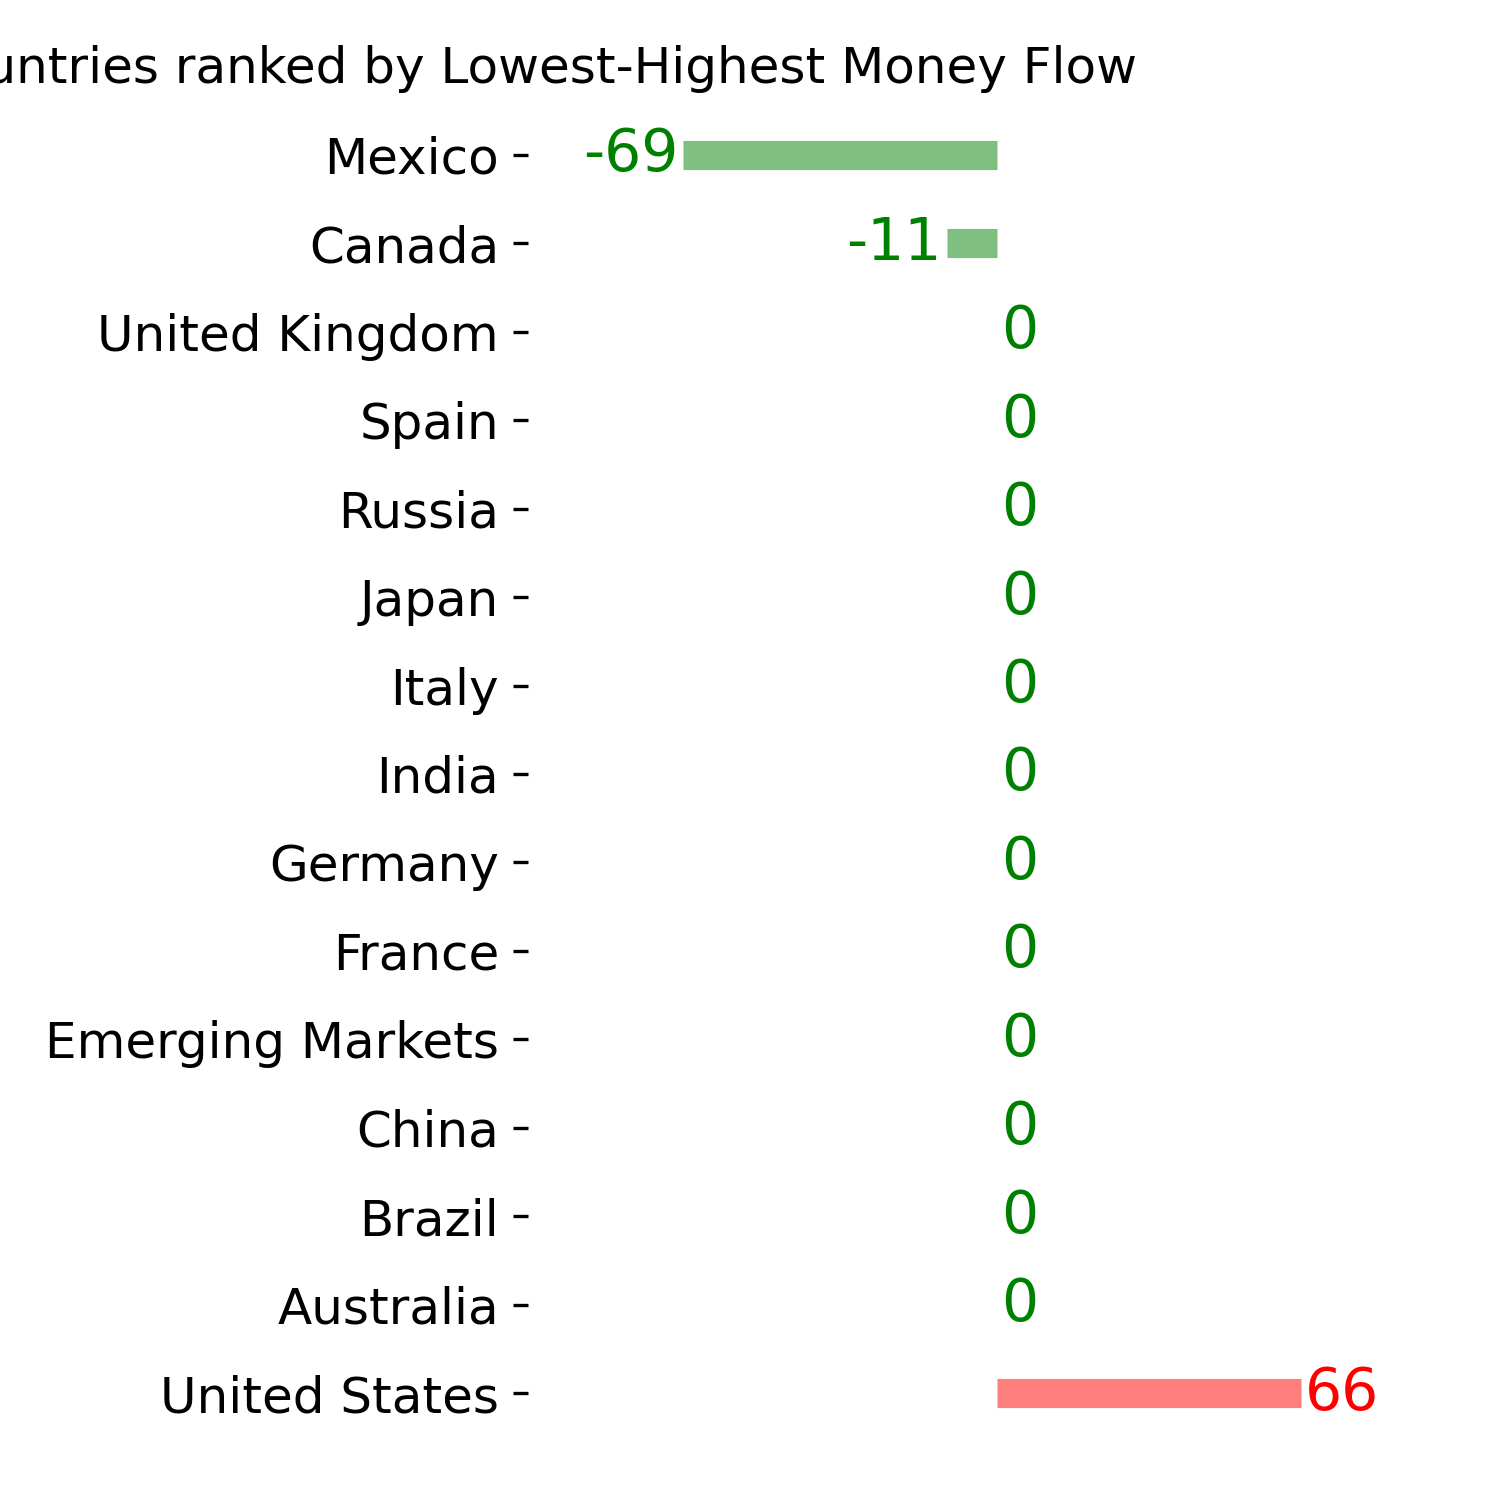
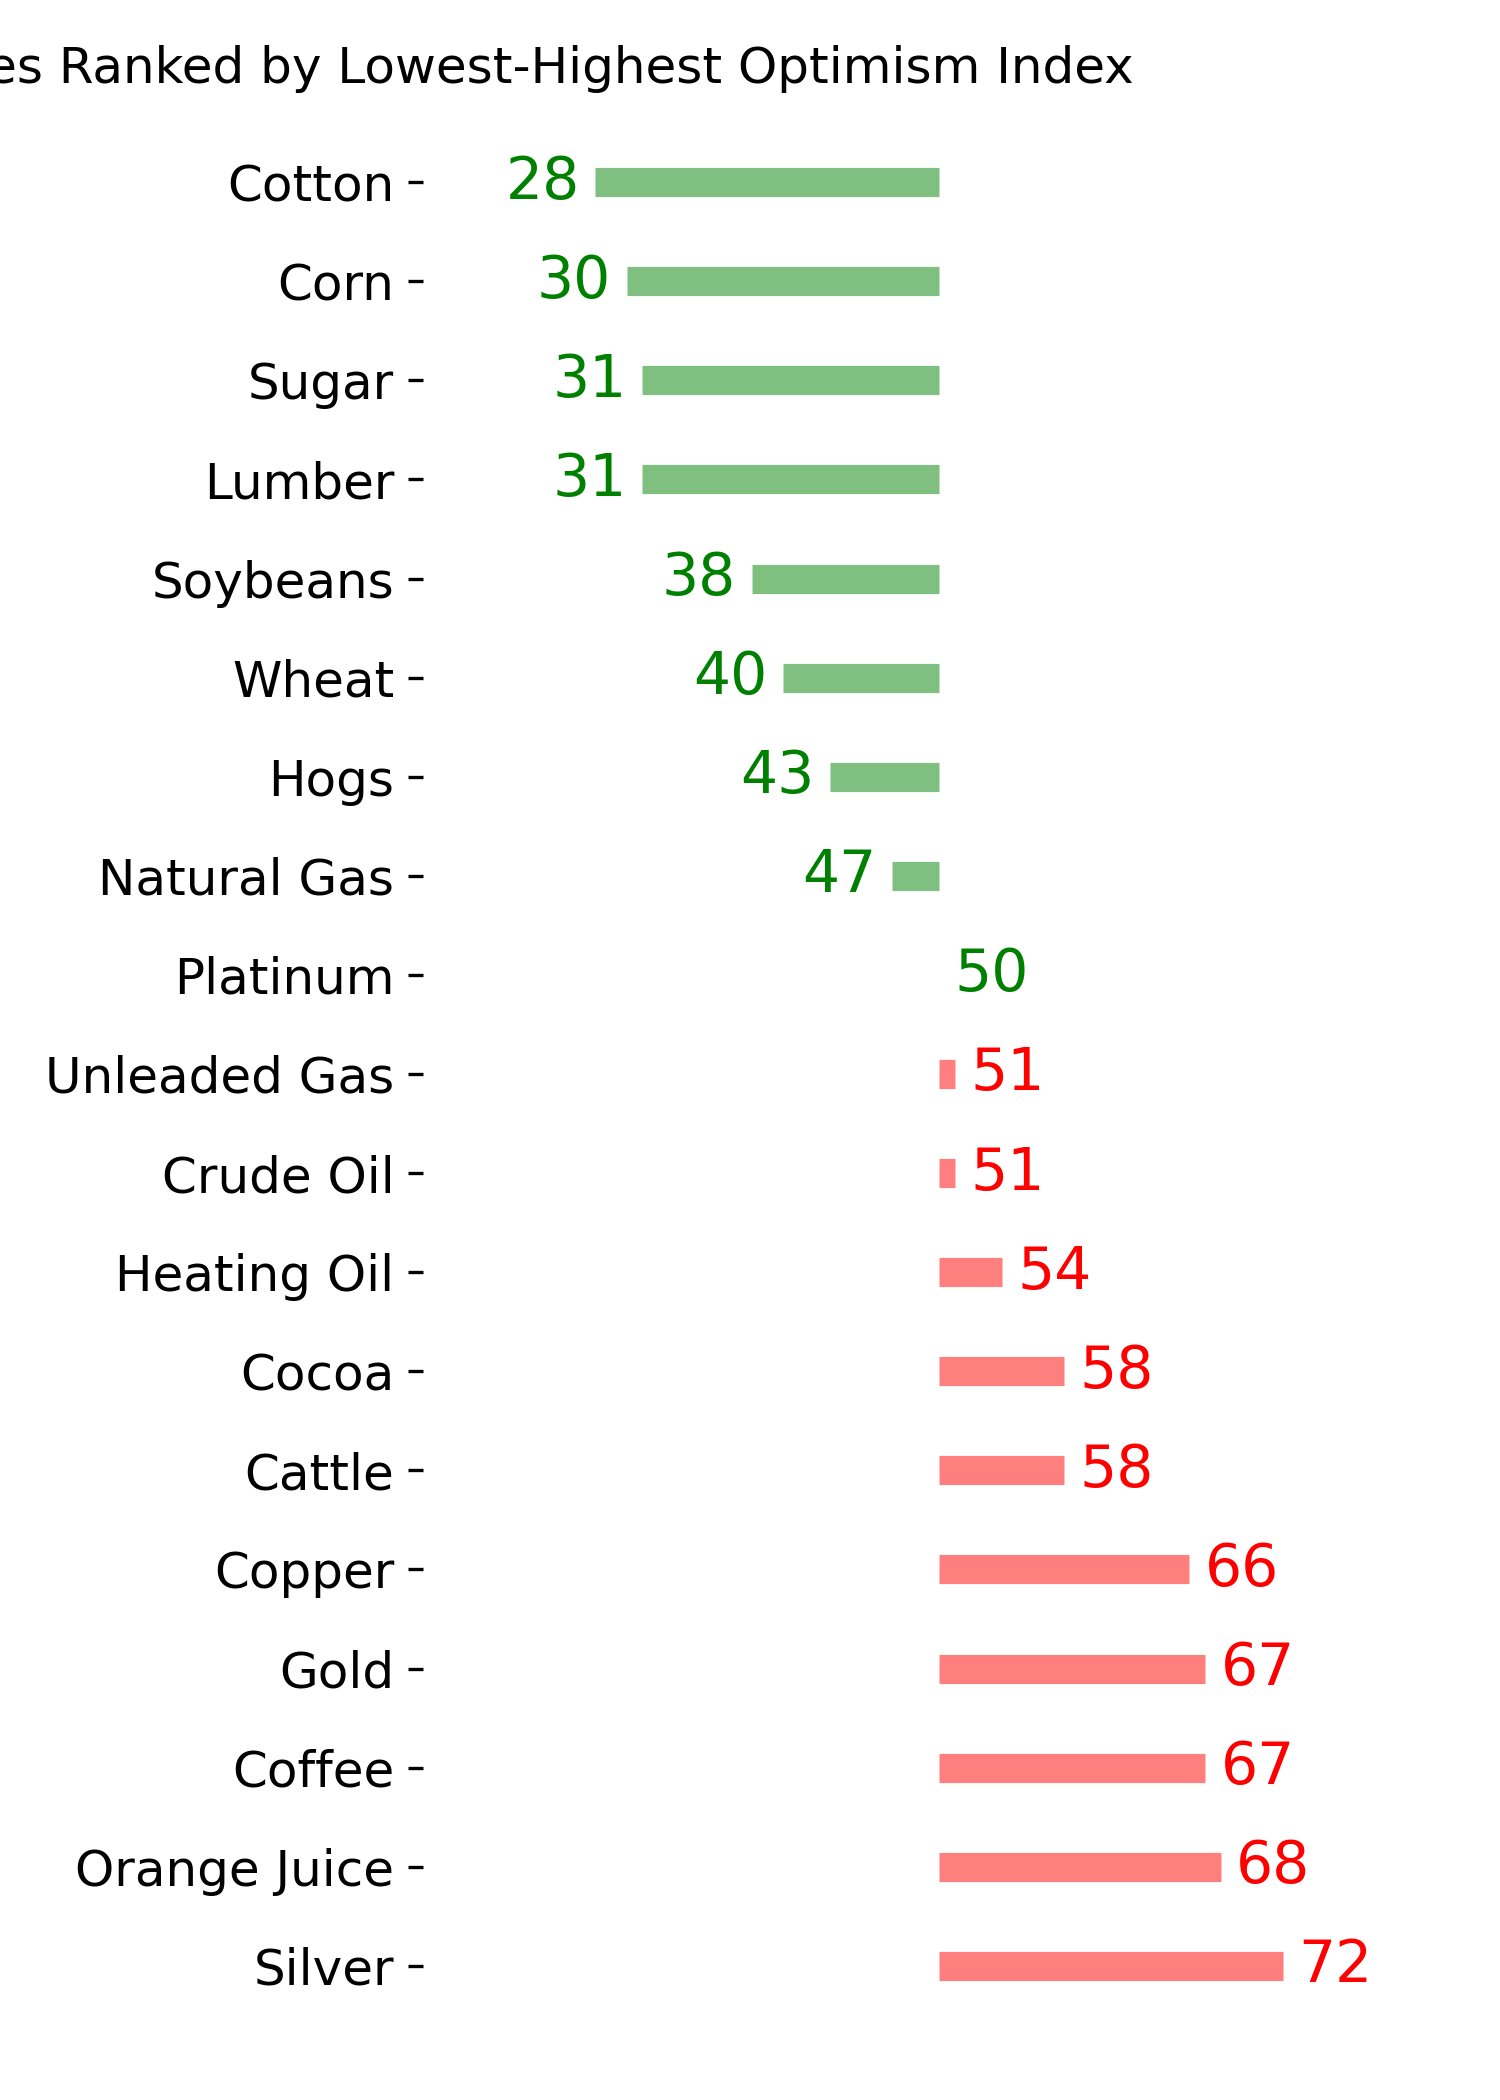
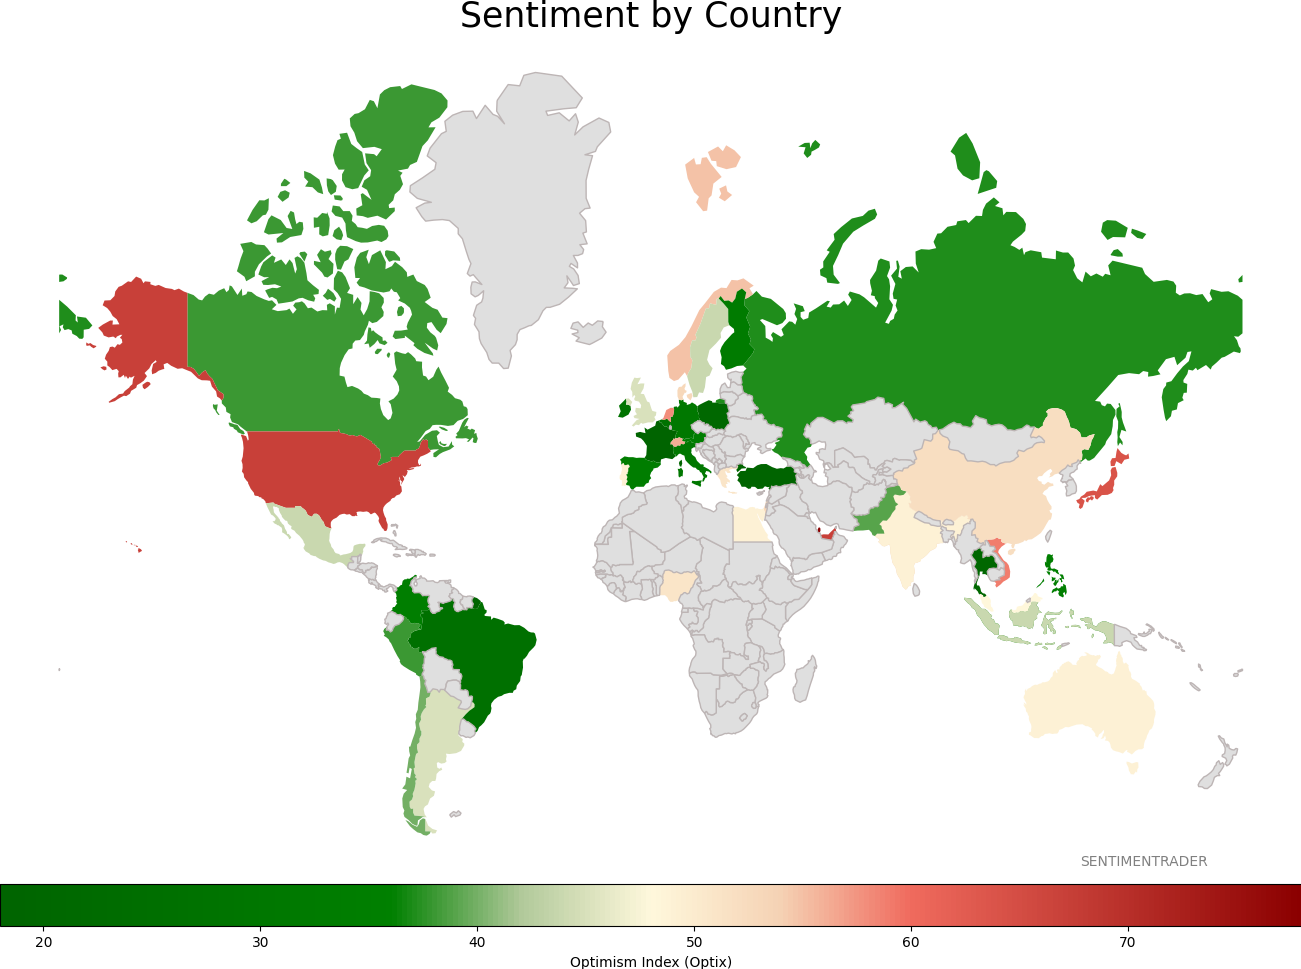
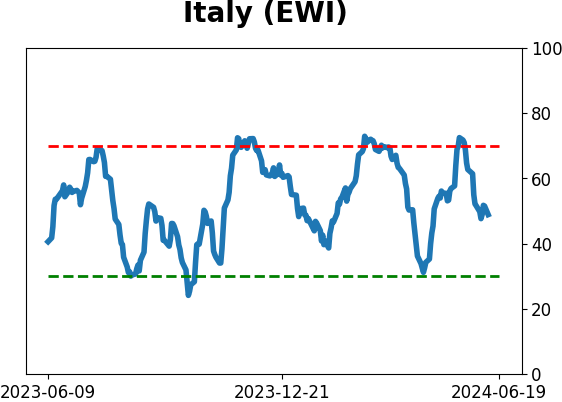
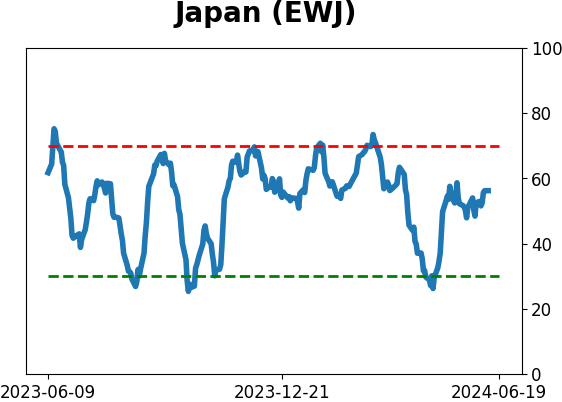
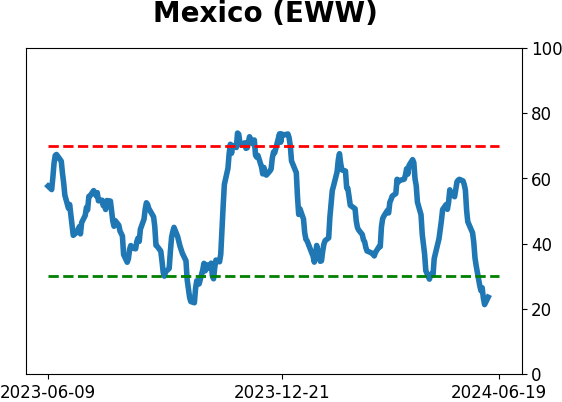
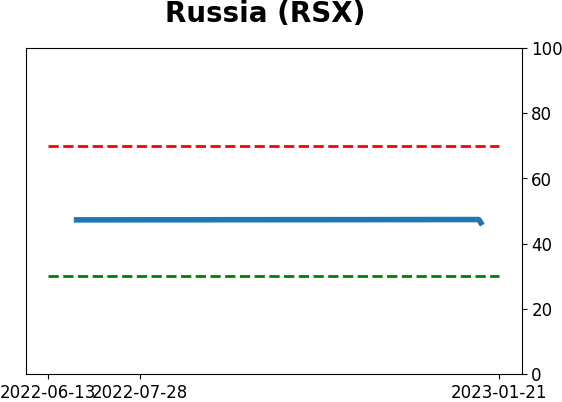
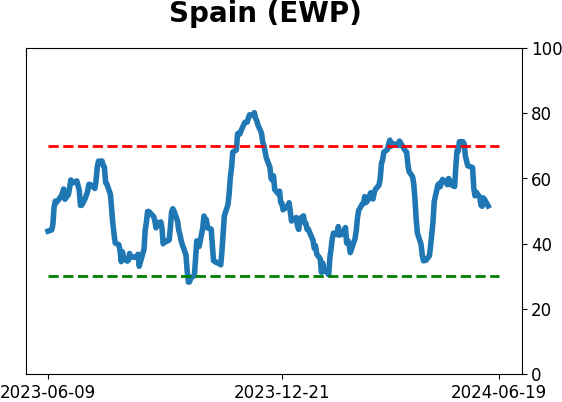
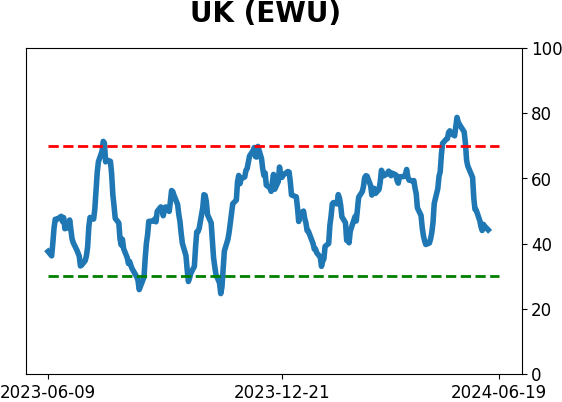
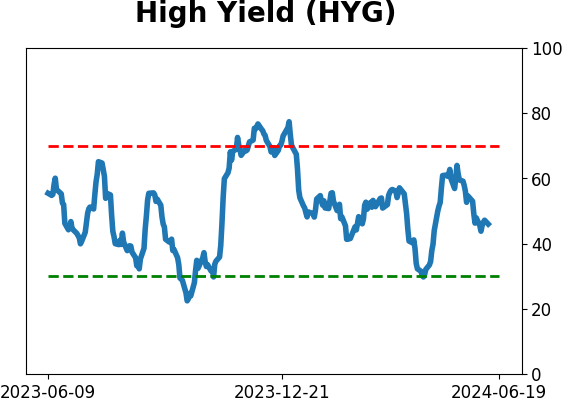
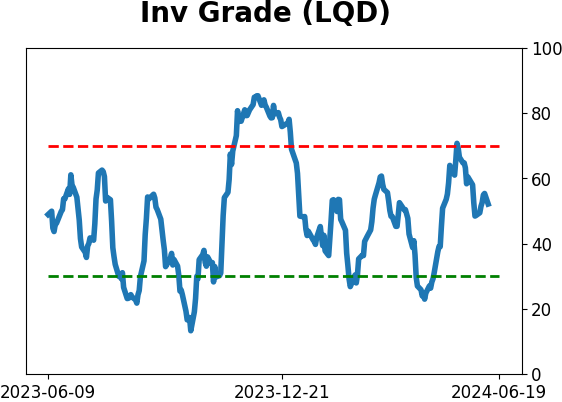
Sentiment Around The World
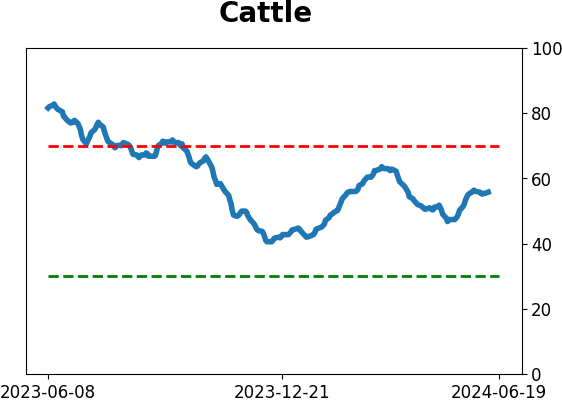
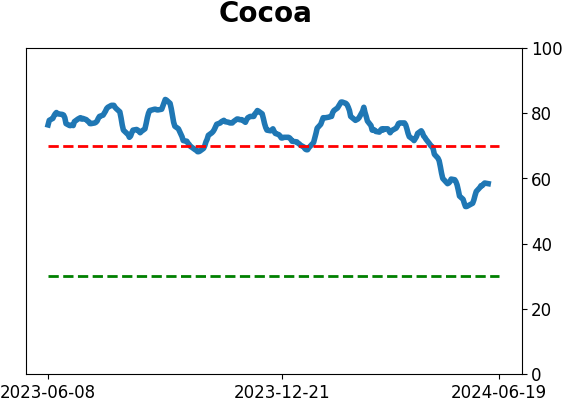
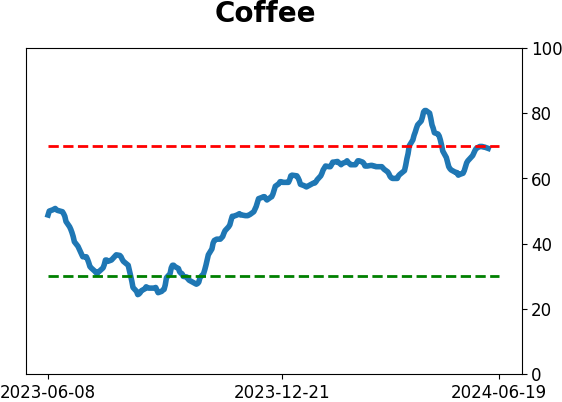
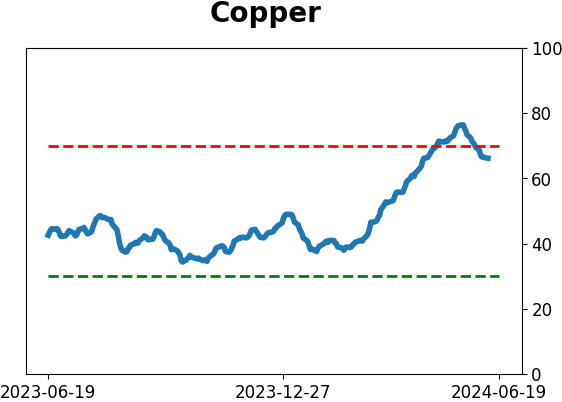
Optimism Index Thumbnails
|
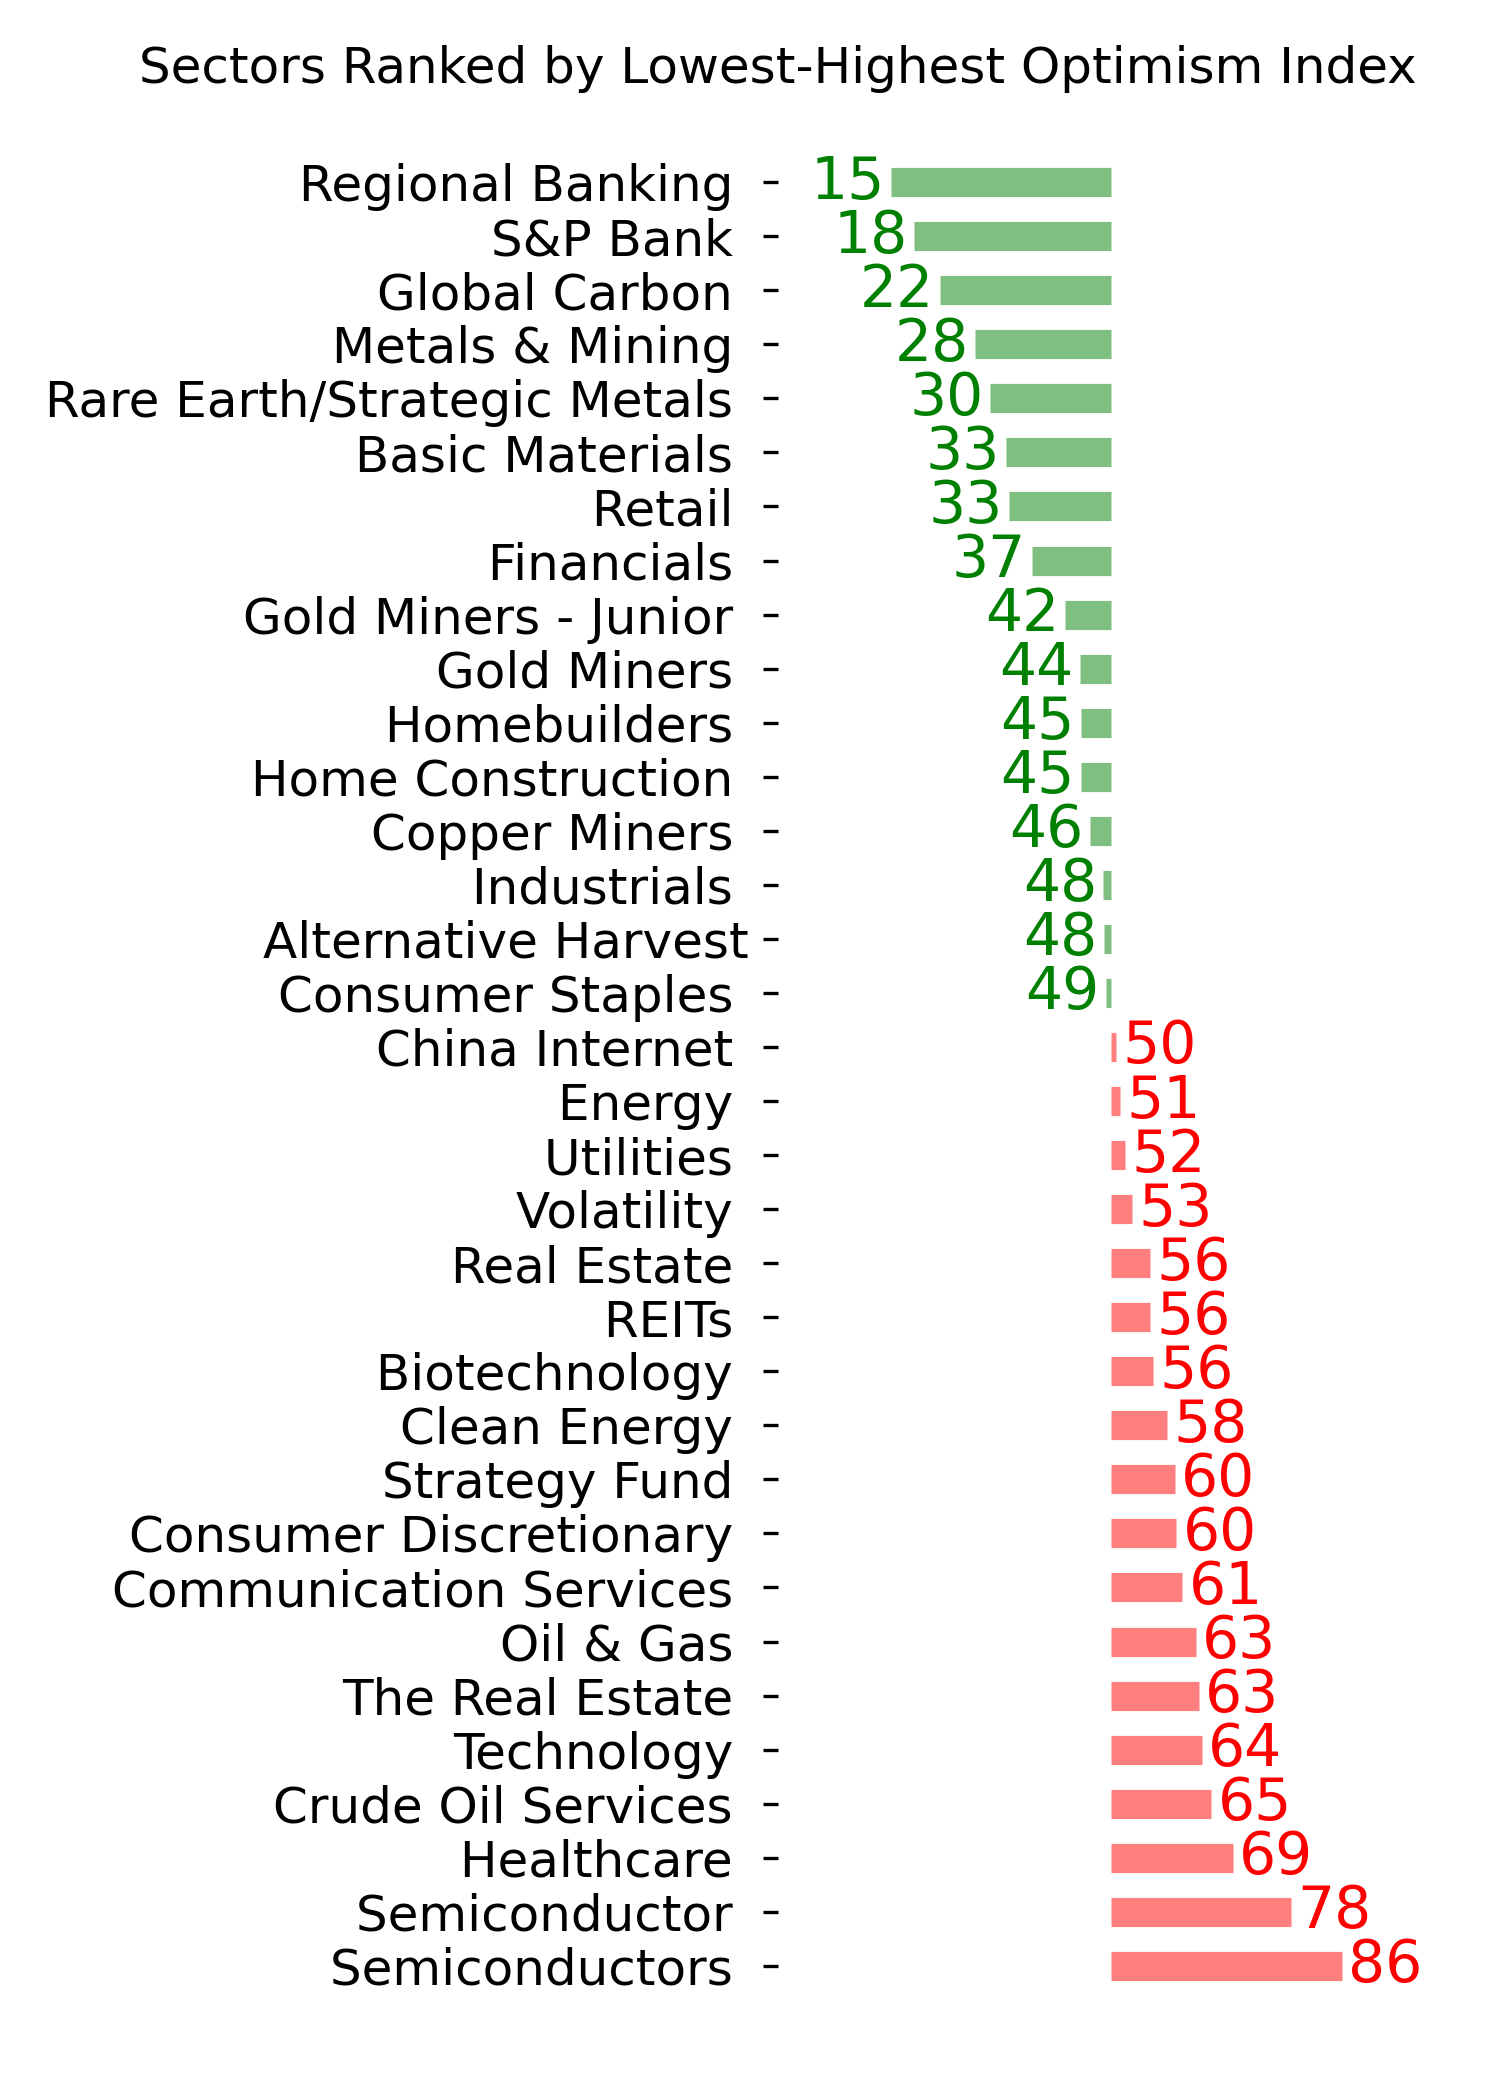
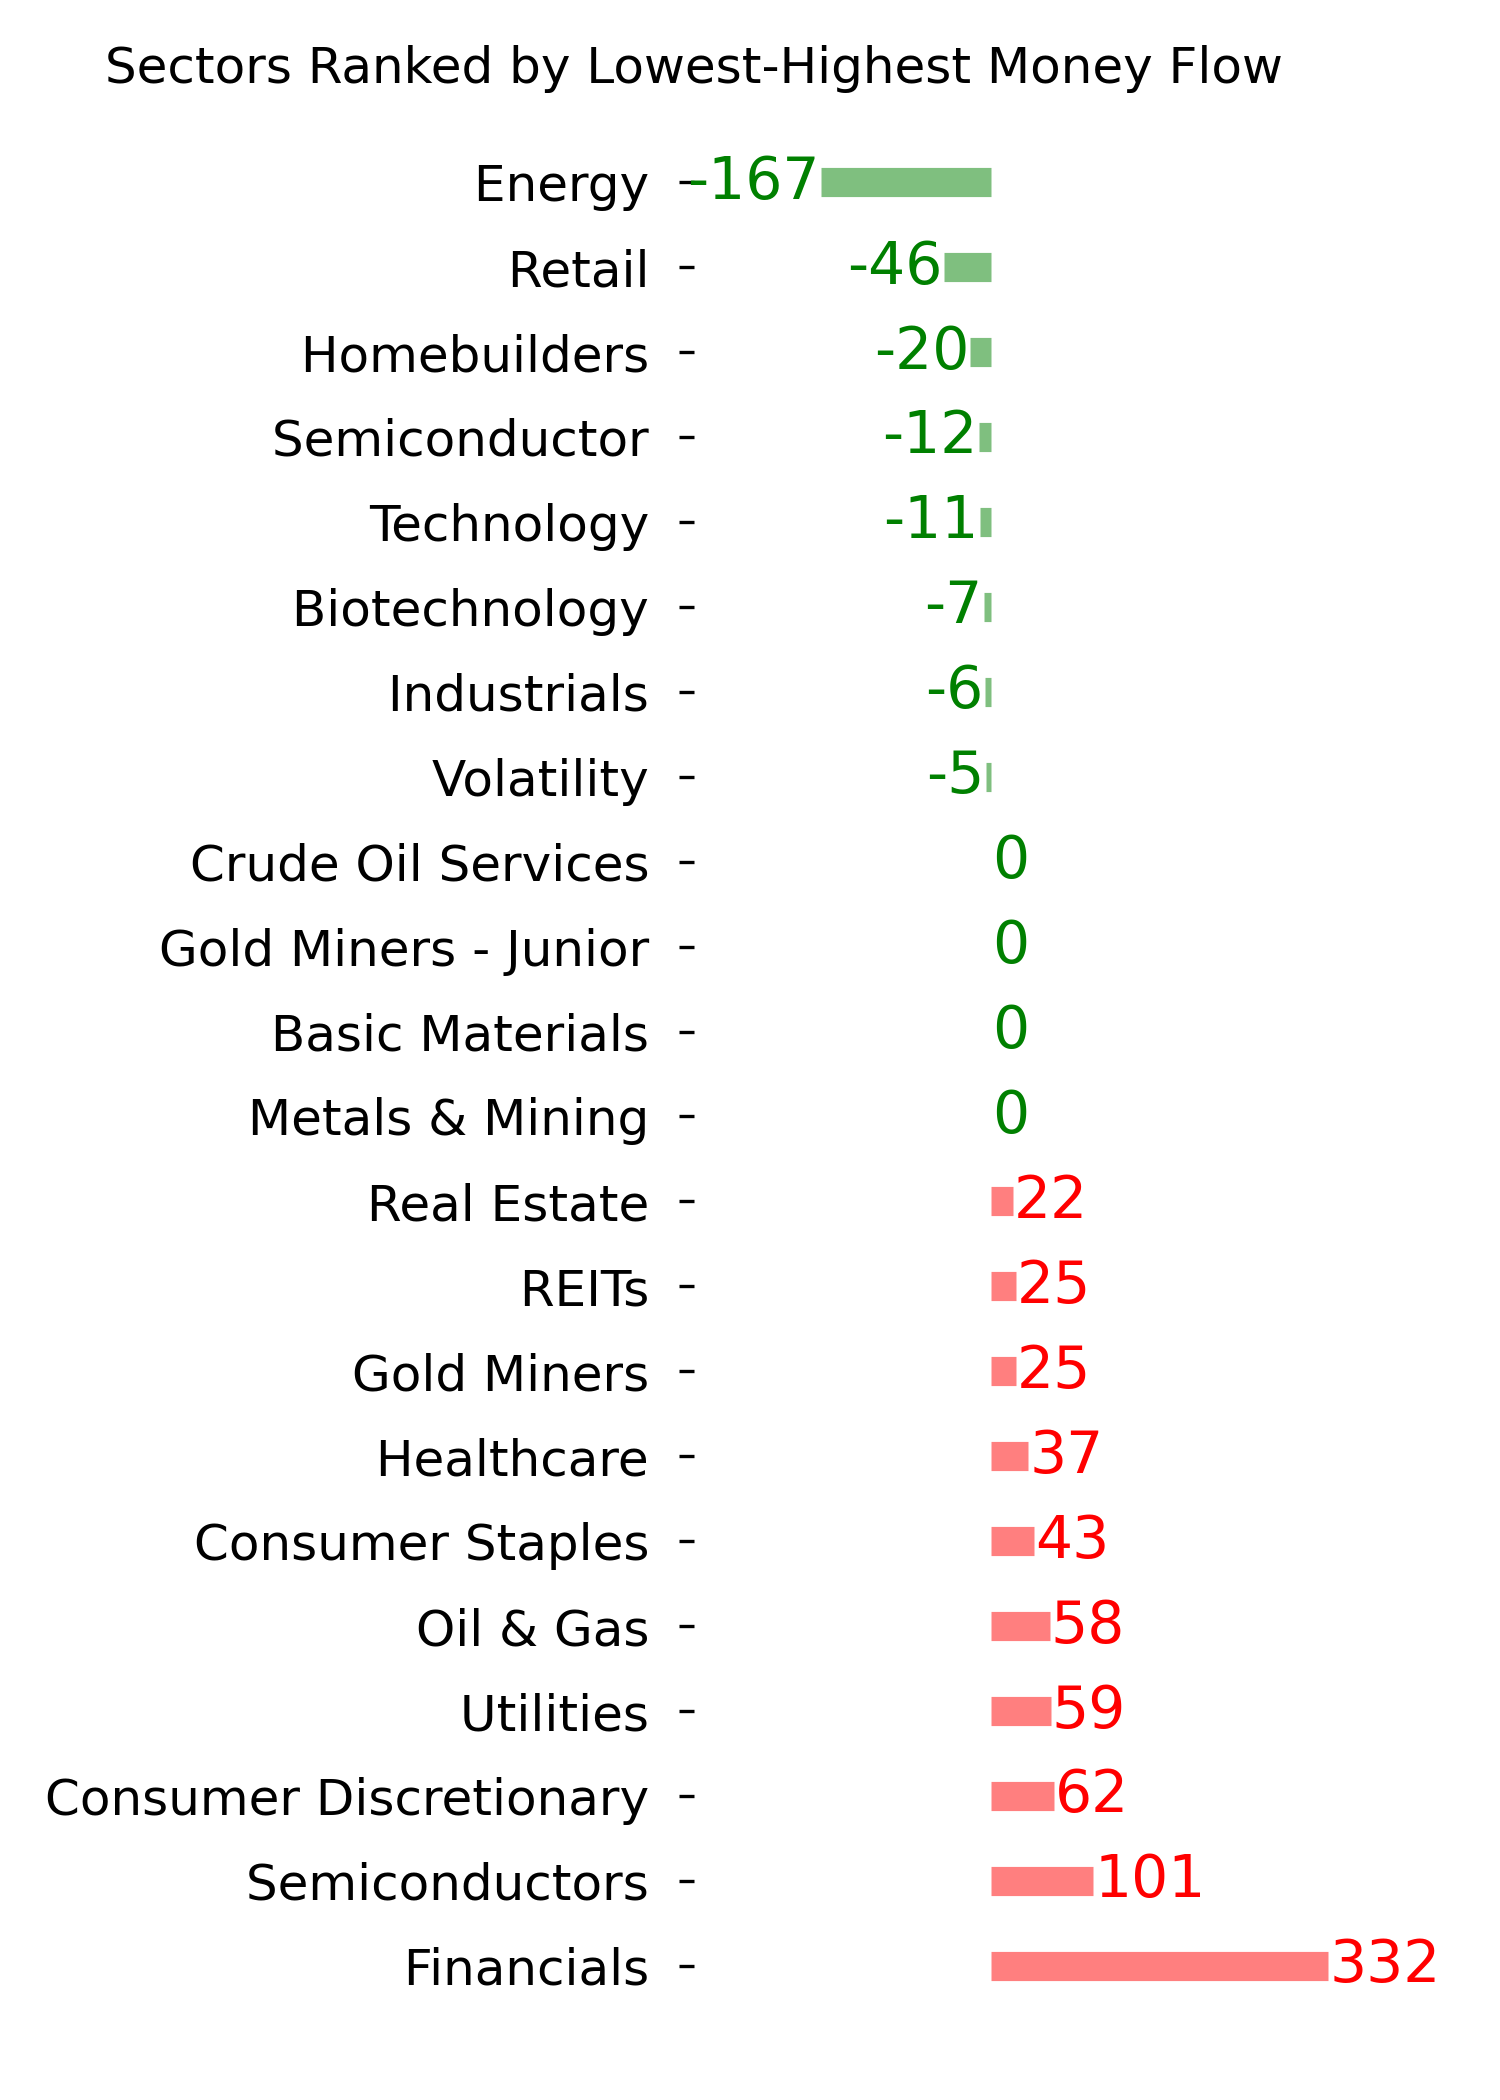
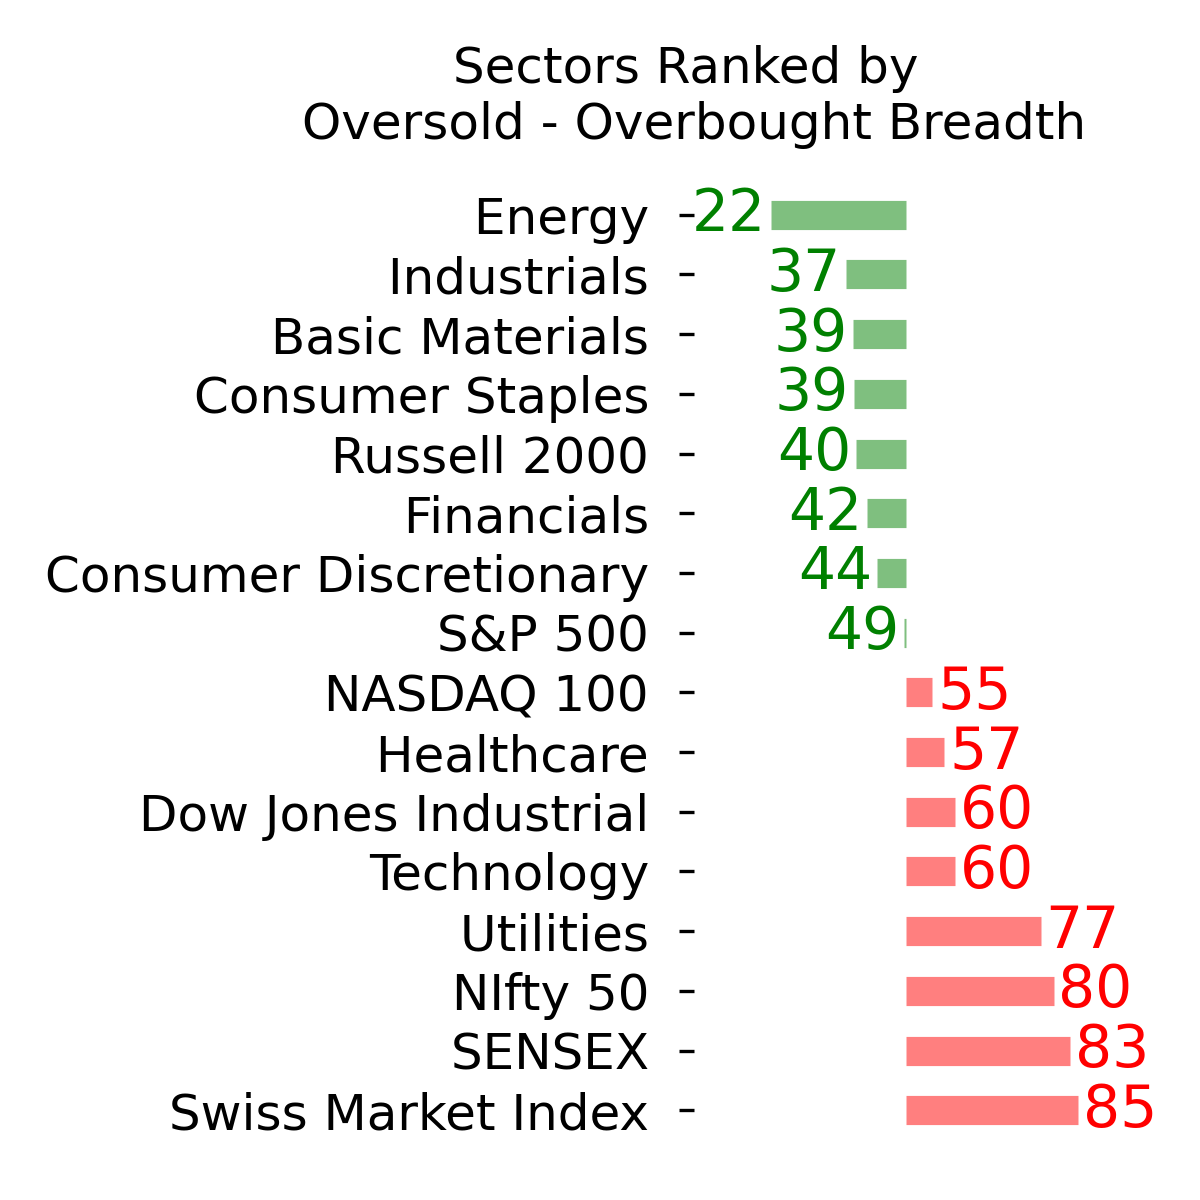
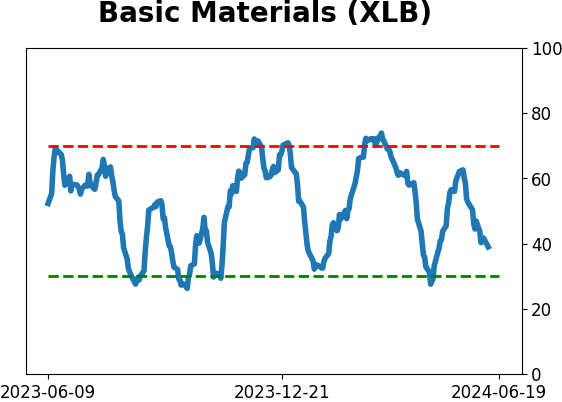
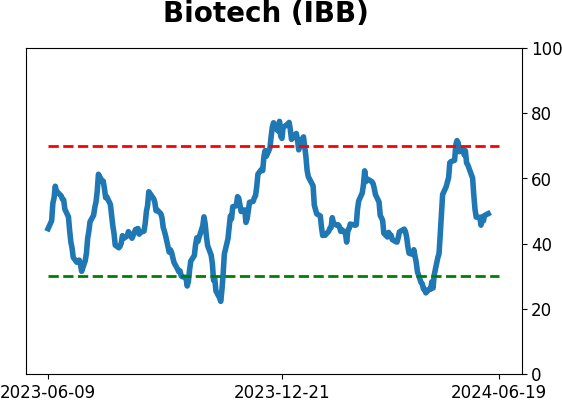
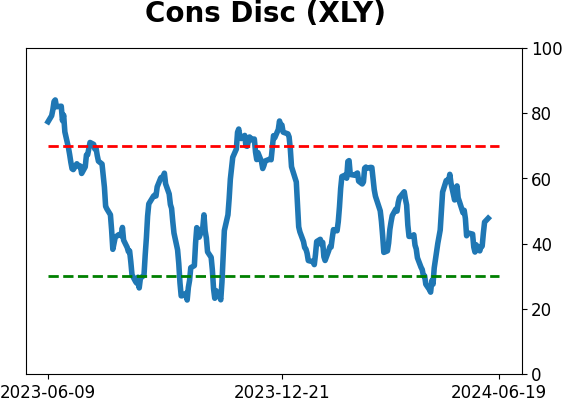
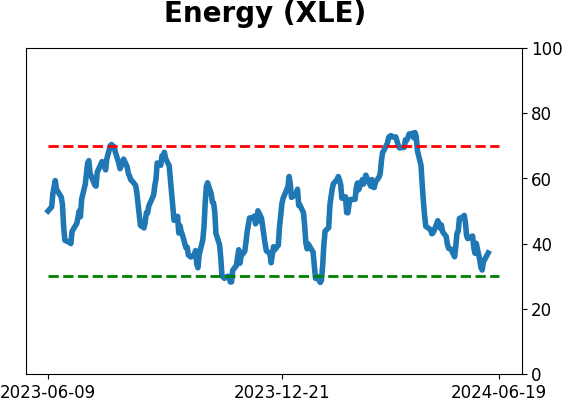
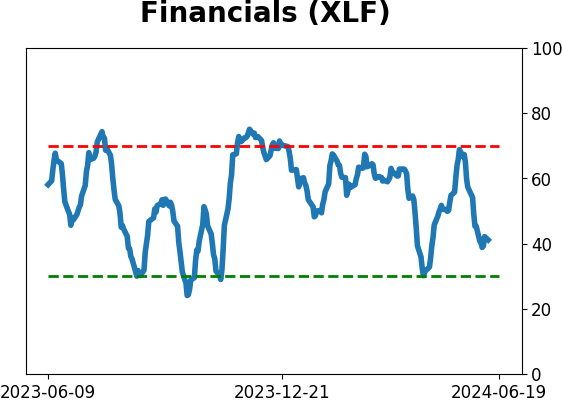
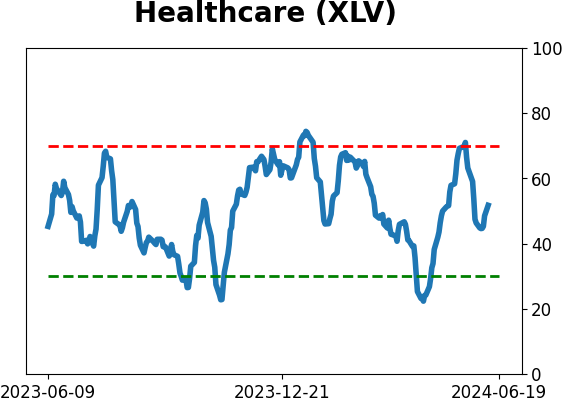
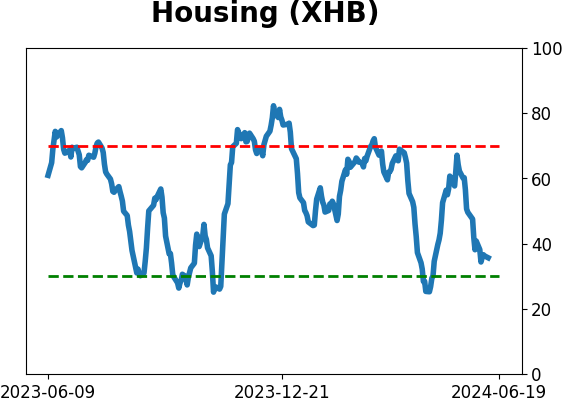
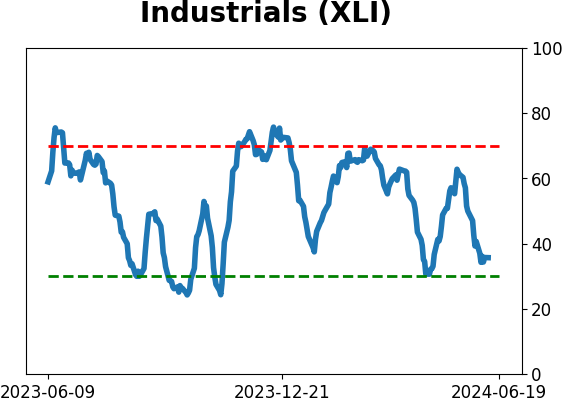
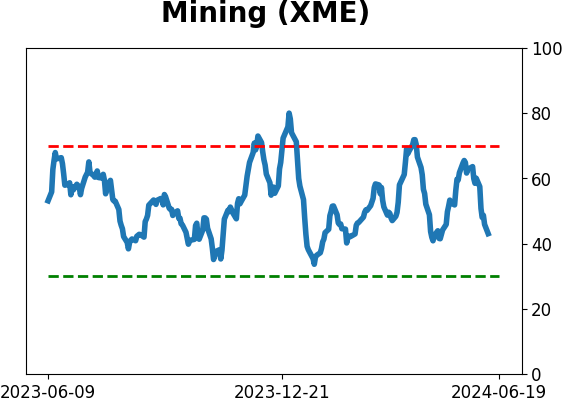
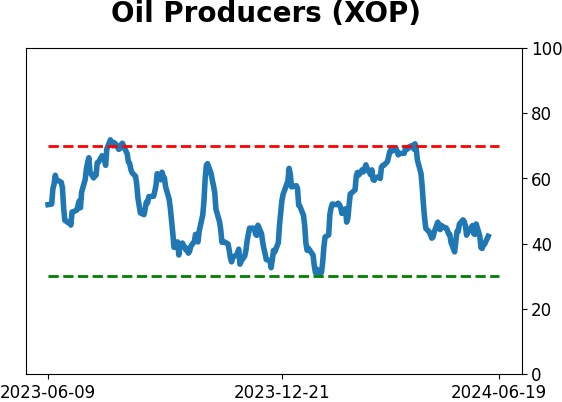
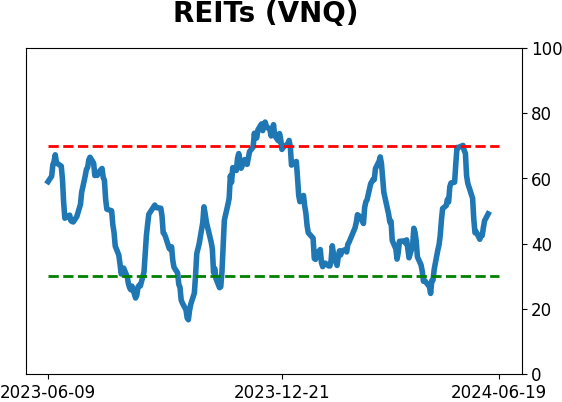
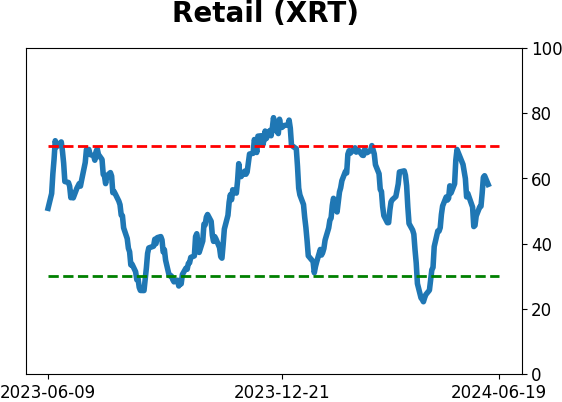
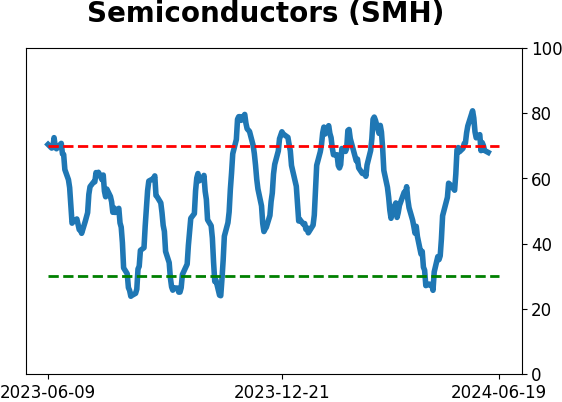
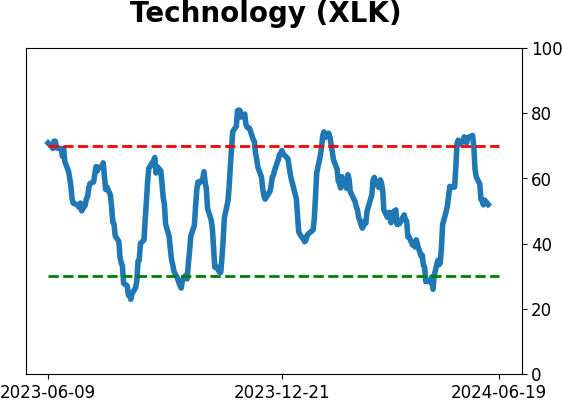
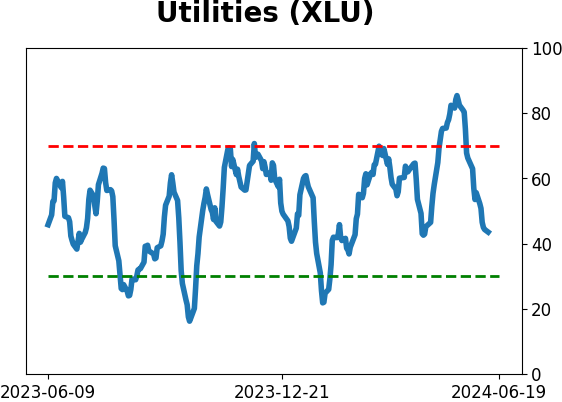
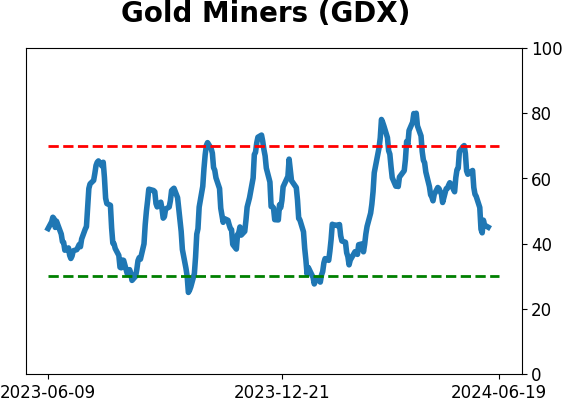
Sector ETF's - 10-Day Moving Average
|
|
|
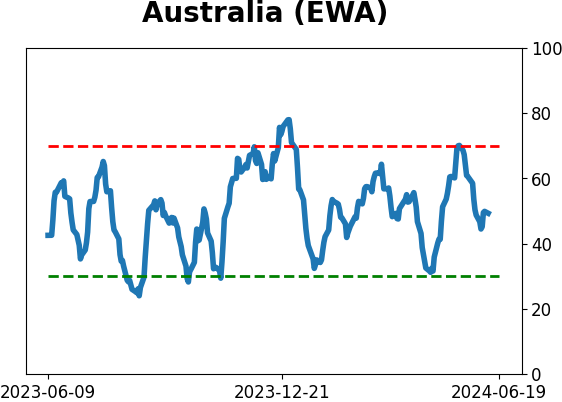
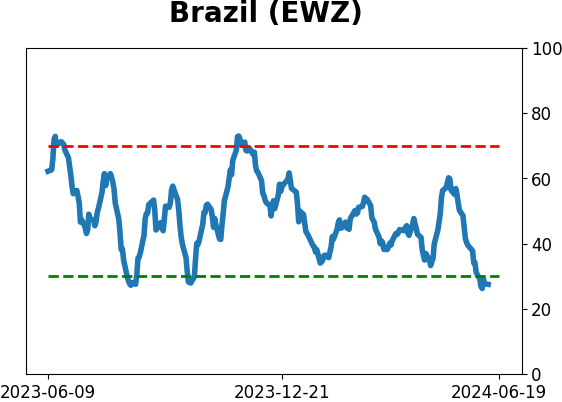
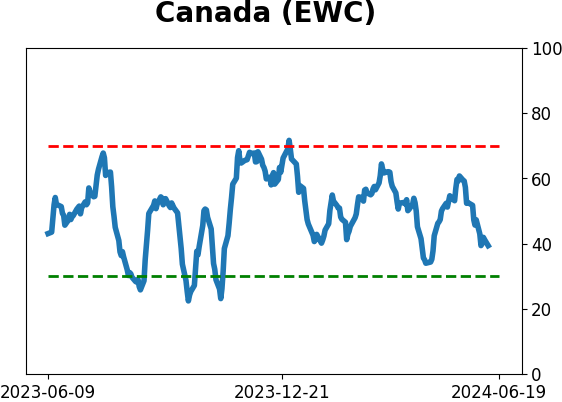
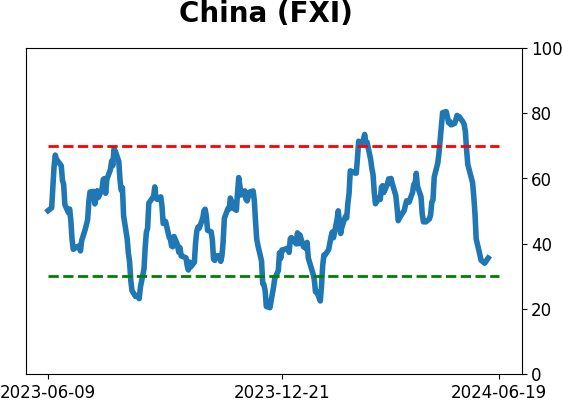
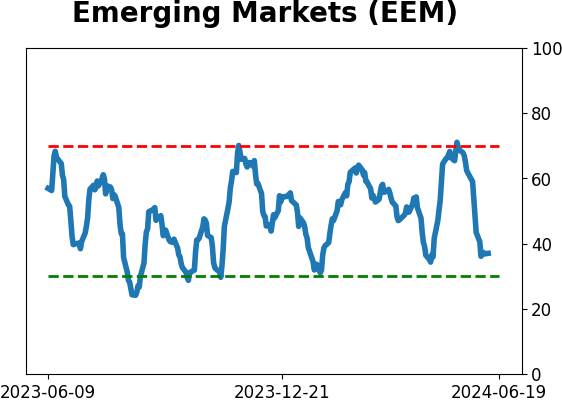
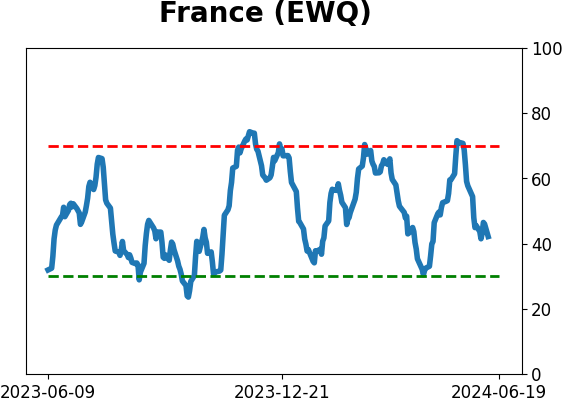
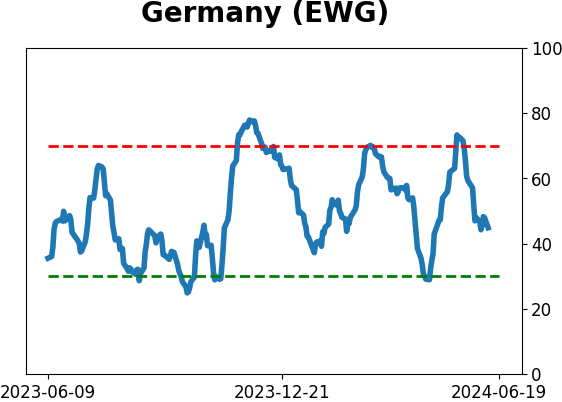
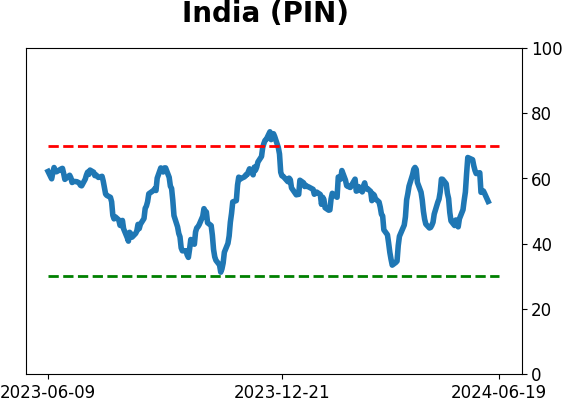
Country ETF's - 10-Day Moving Average
|
|
|
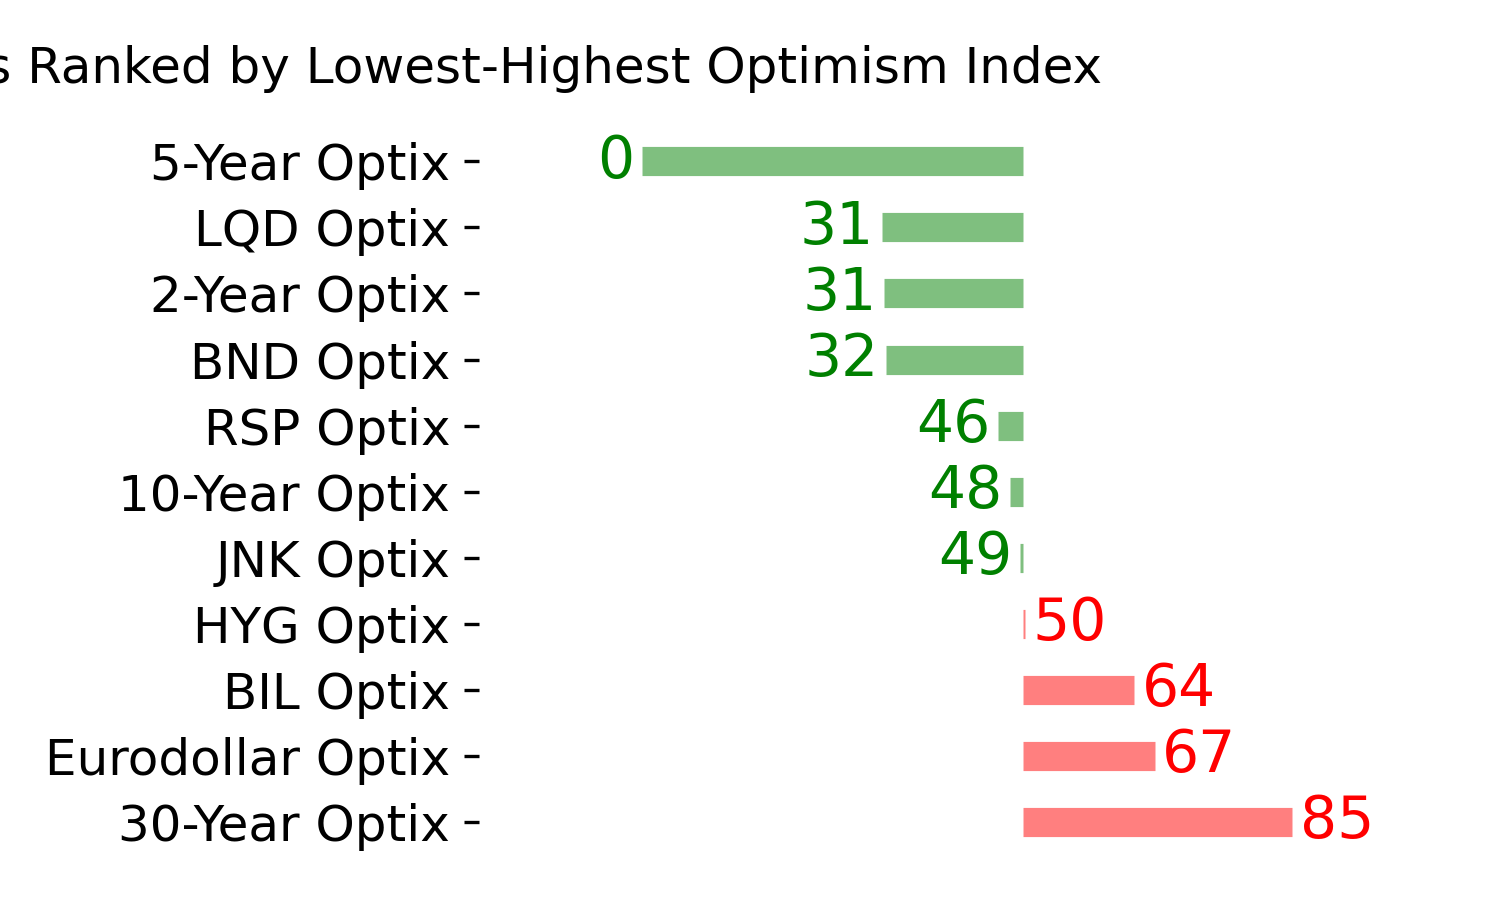
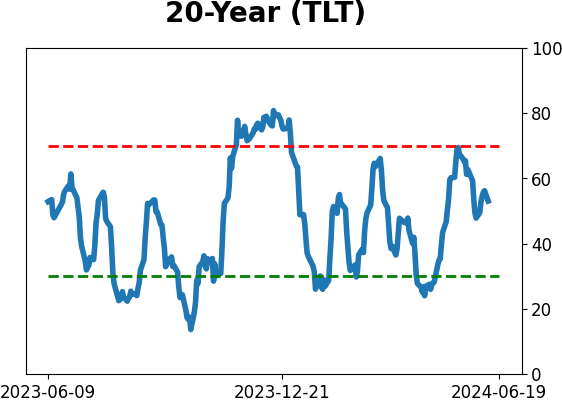
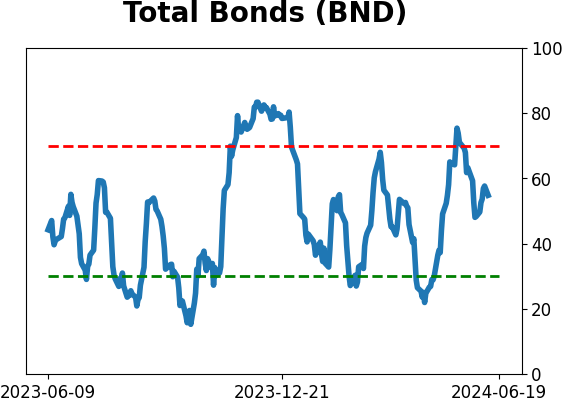
Bond ETF's - 10-Day Moving Average
|
|
|
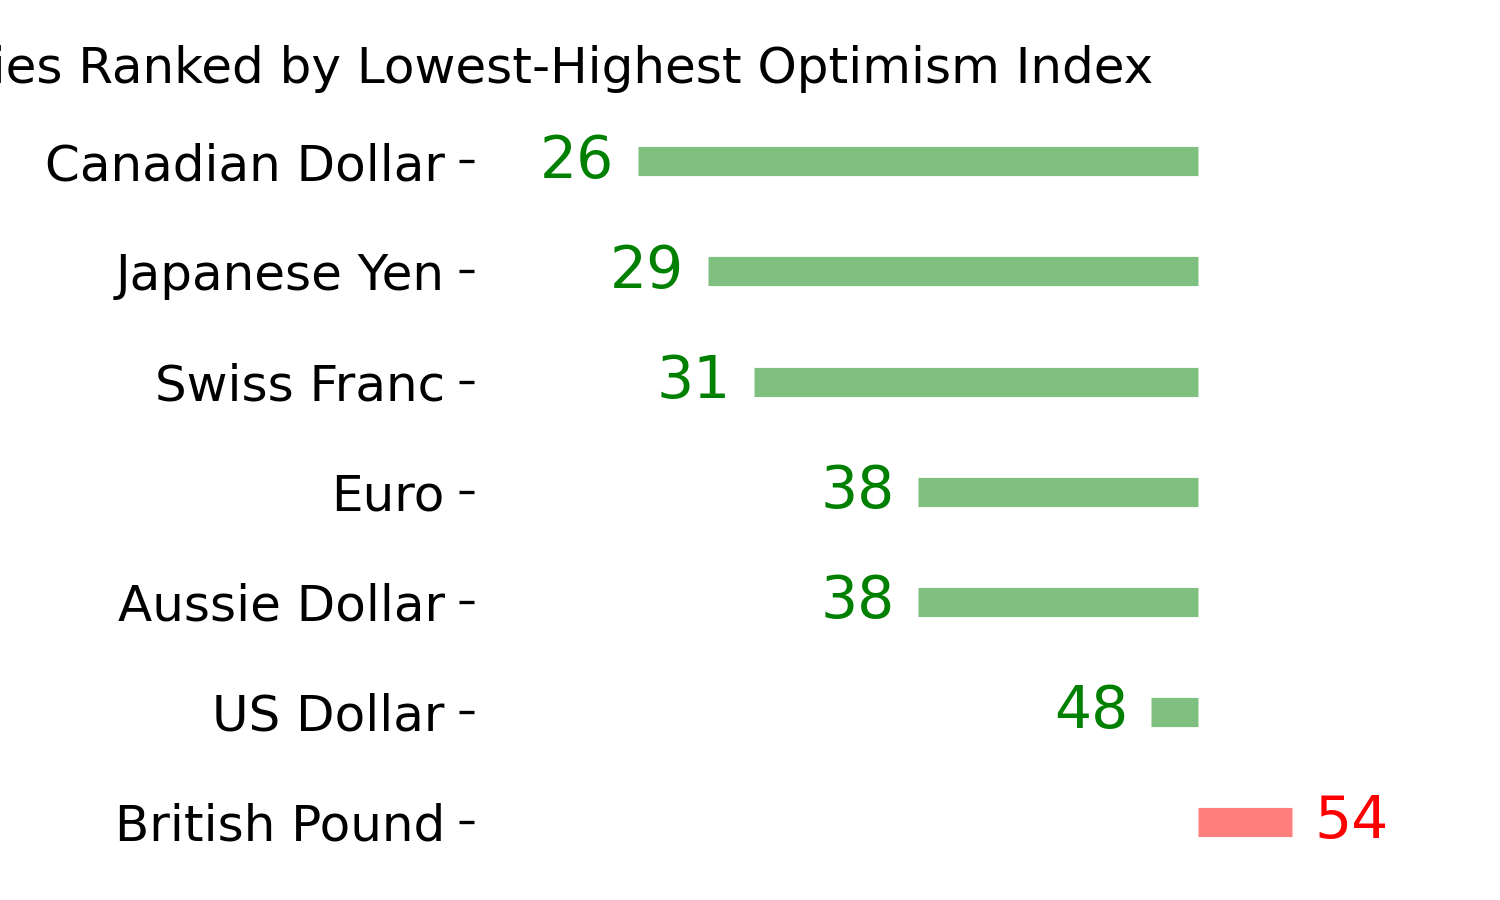
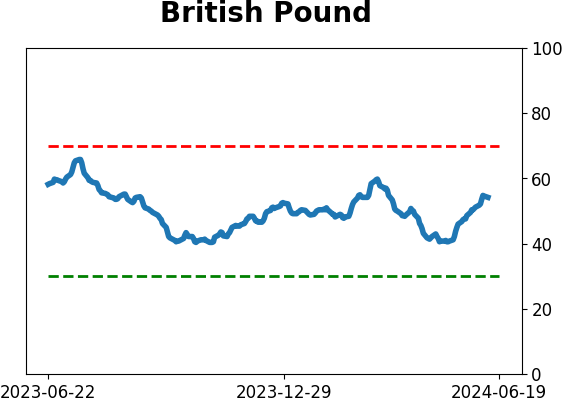
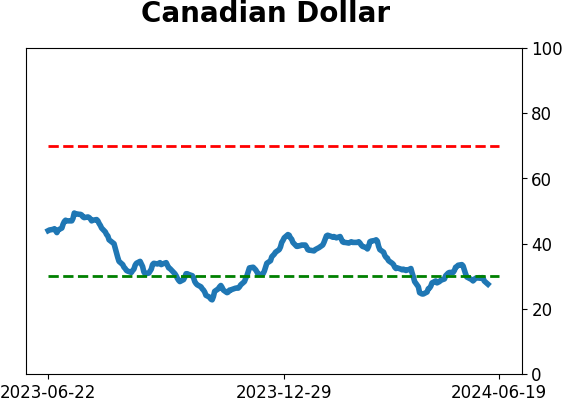
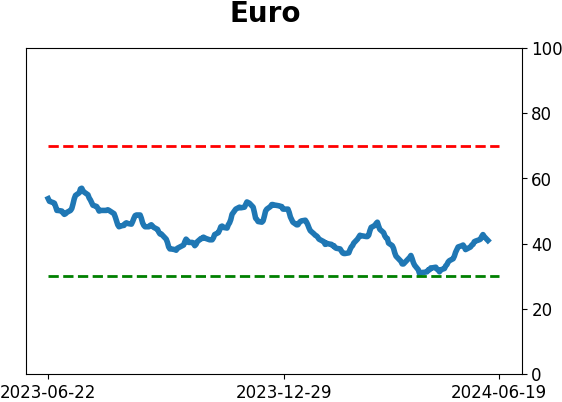
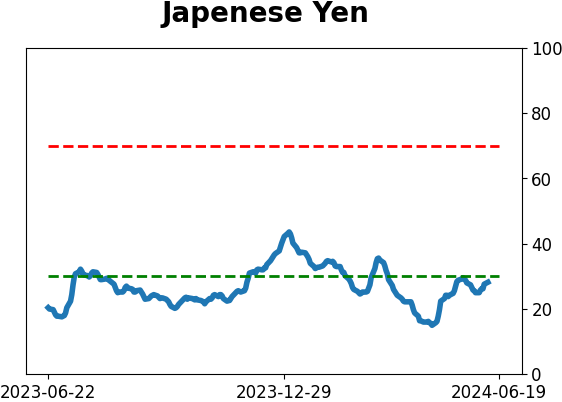
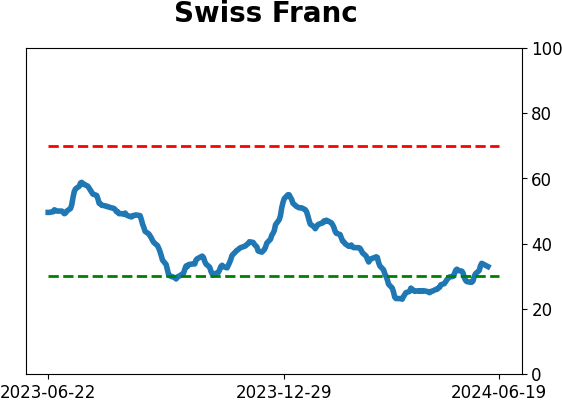
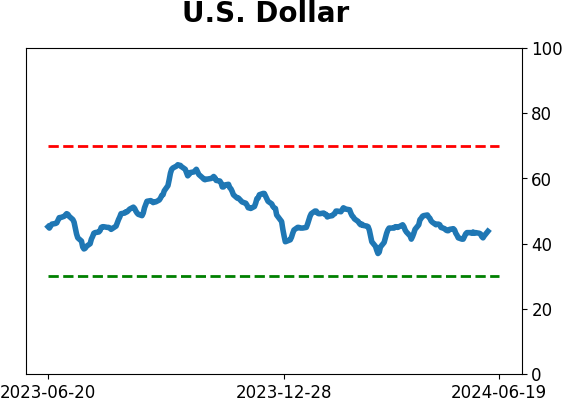
Currency ETF's - 5-Day Moving Average
|
|
|
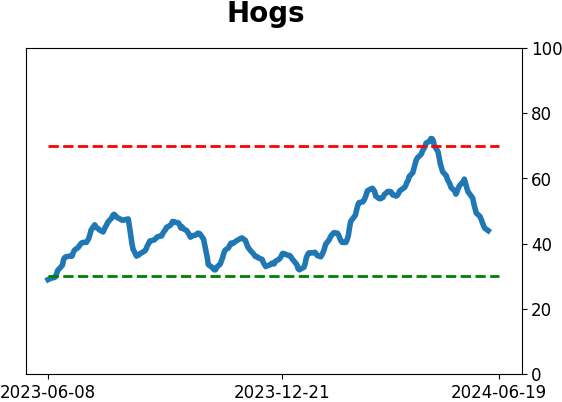
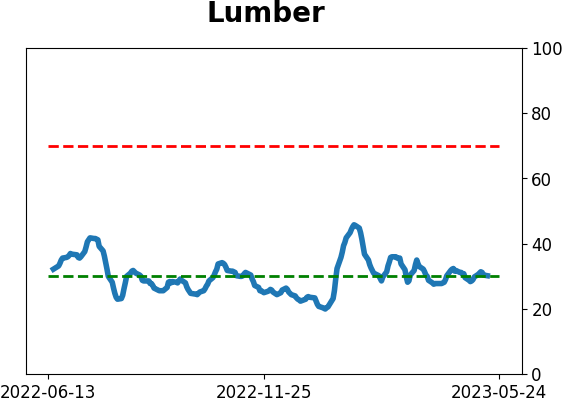
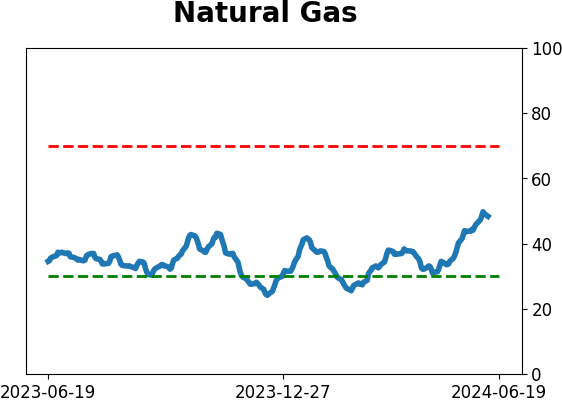
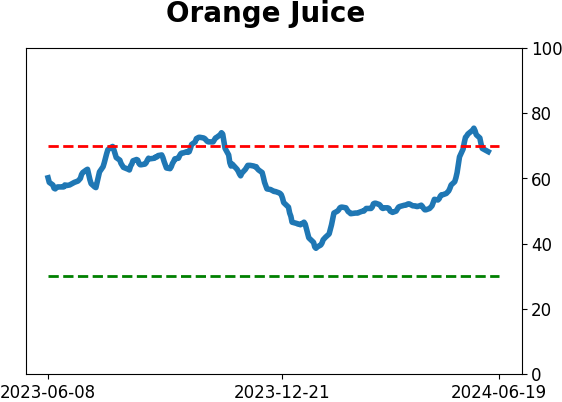
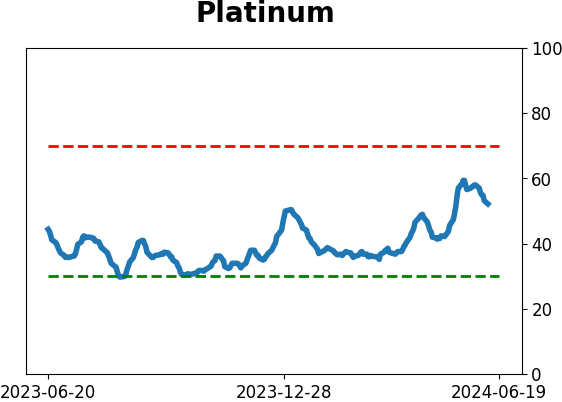
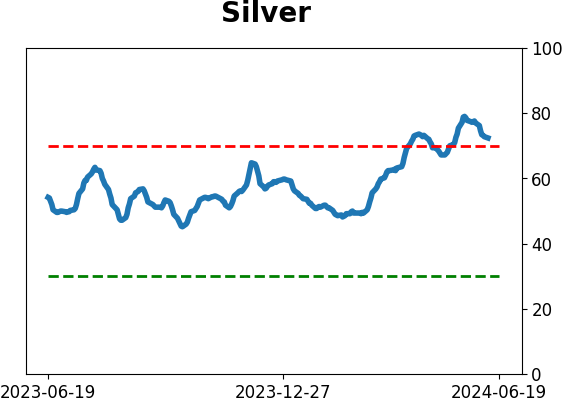
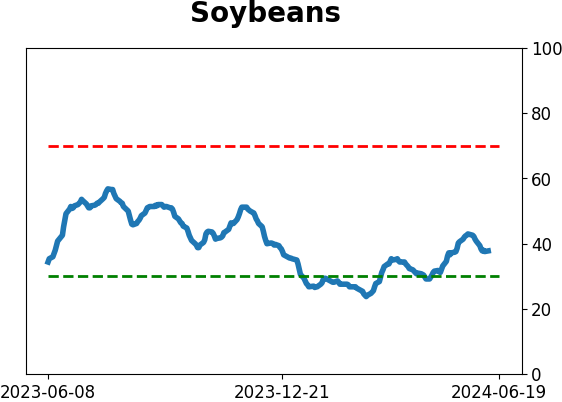
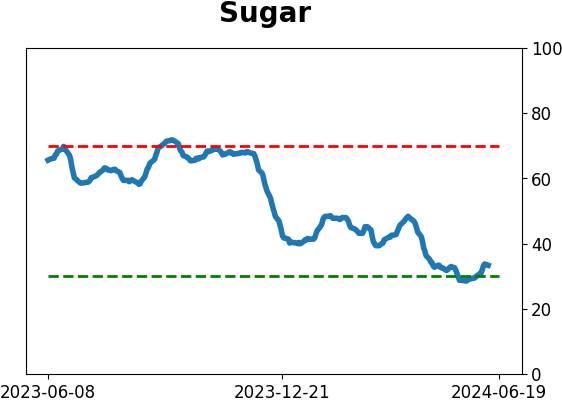
Commodity ETF's - 5-Day Moving Average
|
|