Daily Report : TradingEdge Weekly for Jun 10 - Bear market extremes, signs of recovery, worrying fundamentals

| View/Print a PDF version of this Report |
Headlines
|
TradingEdge Weekly for Jun 10 - Bear market extremes, signs of recovery, worrying fundamentals: This week, we saw continued signs of just how deep investor pessimism got recently. But there are more signs of recovery from oversold conditions, even though fundamentals continue to be an issue. The "tech is dead" narrative is popular but may be premature, especially among Chinese tech stocks. |
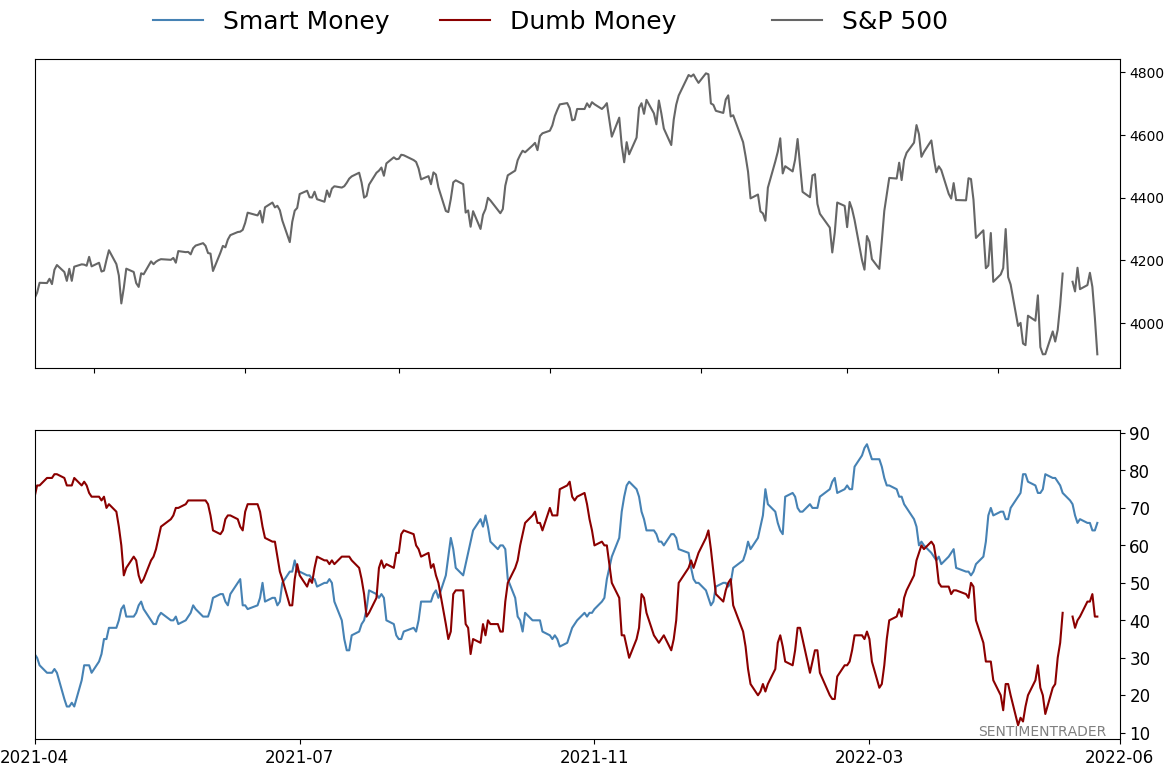
Smart / Dumb Money Confidence
|
|
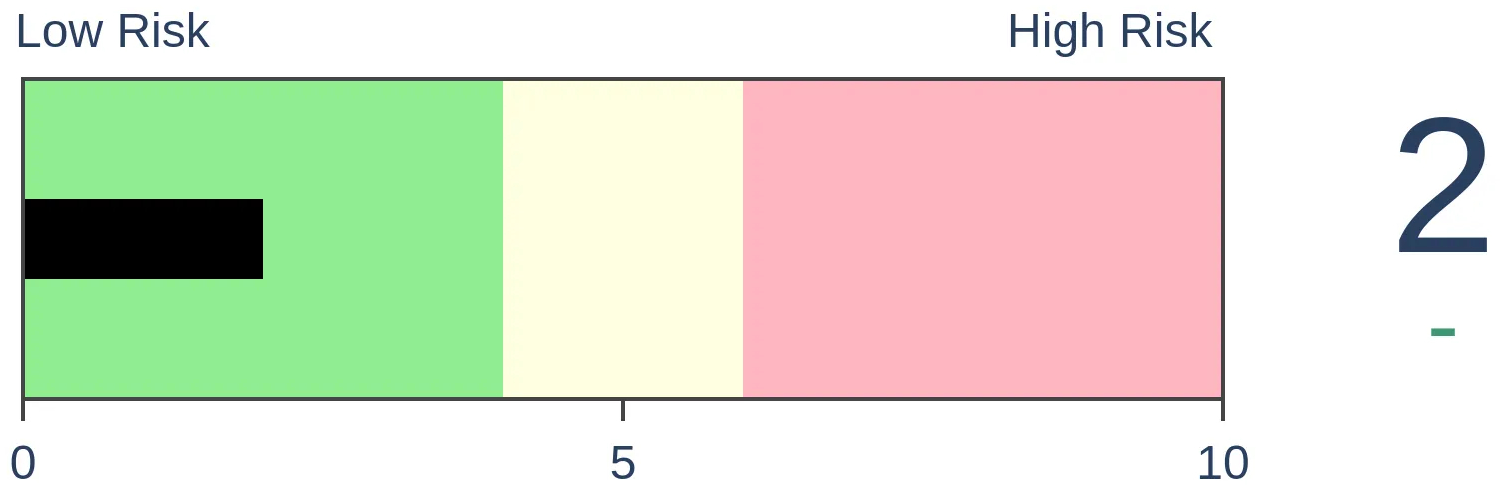
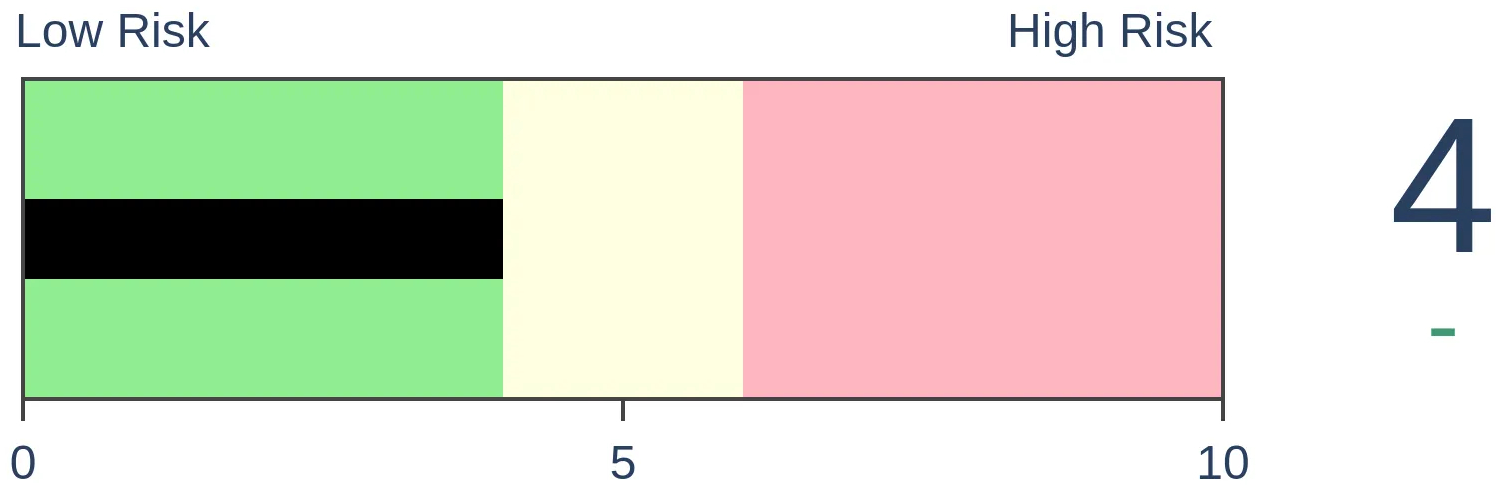
Risk Levels
|

|

|


Research
TradingEdge Weekly for Jun 10 - Bear market extremes, signs of recovery, worrying fundamentalsBy Jason GoepfertBOTTOM LINEThis week, we saw continued signs of just how deep investor pessimism got recently. But there are more signs of recovery from oversold conditions, even though fundamentals continue to be an issue. The "tech is dead" narrative is popular but may be premature, especially among Chinese tech stocks. FORECAST / TIMEFRAME |
Key points:
- Even if this is a bear market, they often see a relief rally right about now
- Investors pulled more than $10 billion from sector ETFs in May, a record
- While other investors exit, corporate insiders are stepping in
- There have been more signs of relief from severe oversold conditions
- Fundamentals are still an issue, and our Macro Index Model has plunged
- Credit spreads continue to rise, also an issue
- Why the "tech is dead" narrative may be premature
- Chinese tech stocks, in particular, are trying to make a comeback
- Good months for crude oil
If this is a bear market...
Last week, we looked at the years with the highest correlated 100-day starts to a year. Right about now, most of these bad starts witnessed a multi-month reprieve.
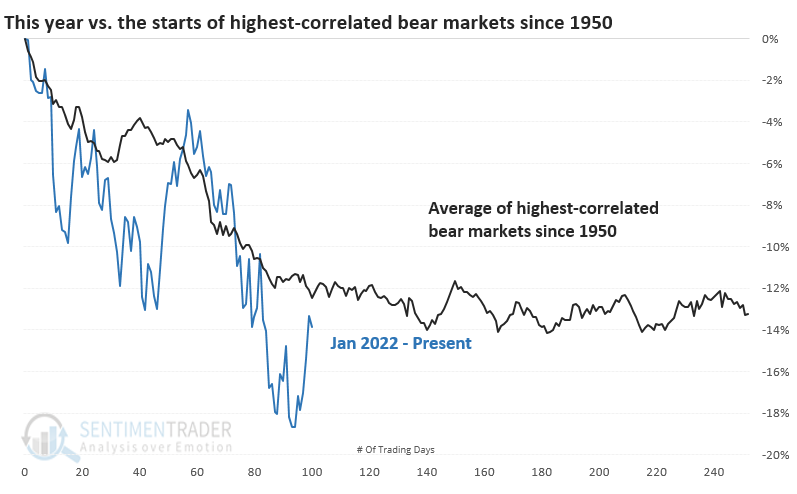
But let's assume the worst. Let's assume that we're mired in a bear market, whether it ends up being declared or not. Since 1950, there have been 21 bear markets. Many of the bear markets don't look anything like the current (potential) one. So, let's focus solely on those with a correlation of at least +0.50 (on a scale of -1.0 to +1.0) to the current (potential) one.
Here, the average line tracks closely to what investors have suffered in 2022, though this year has been worse than most.
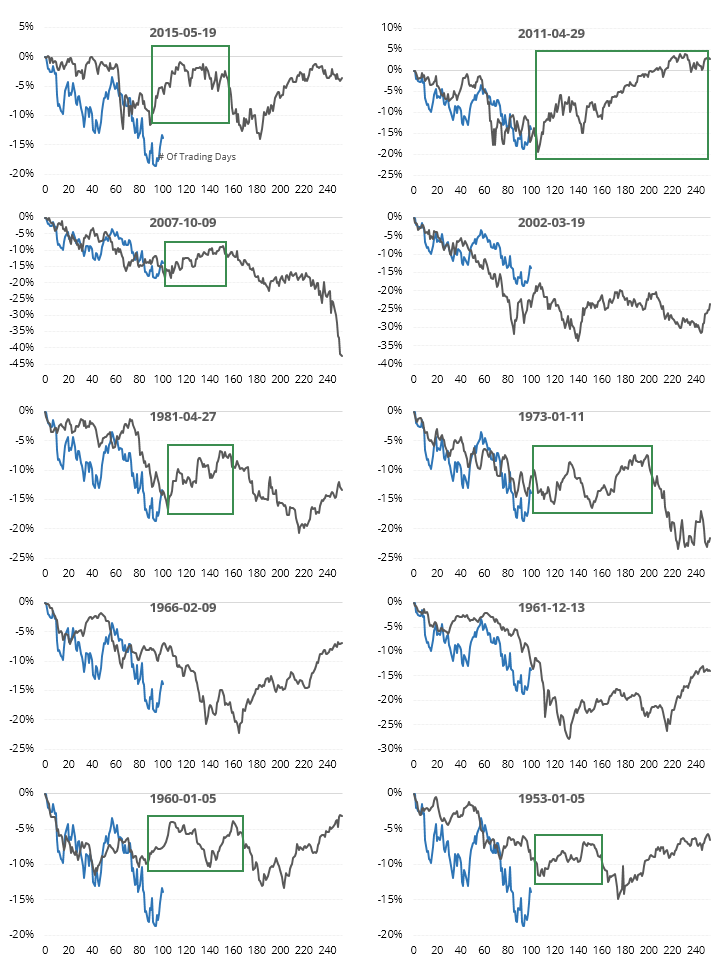
The ten most recent highly-correlated bear markets are below. The green boxes show that most of these enjoyed a multi-month rebound right about now.
Investors aren't waiting around just in case
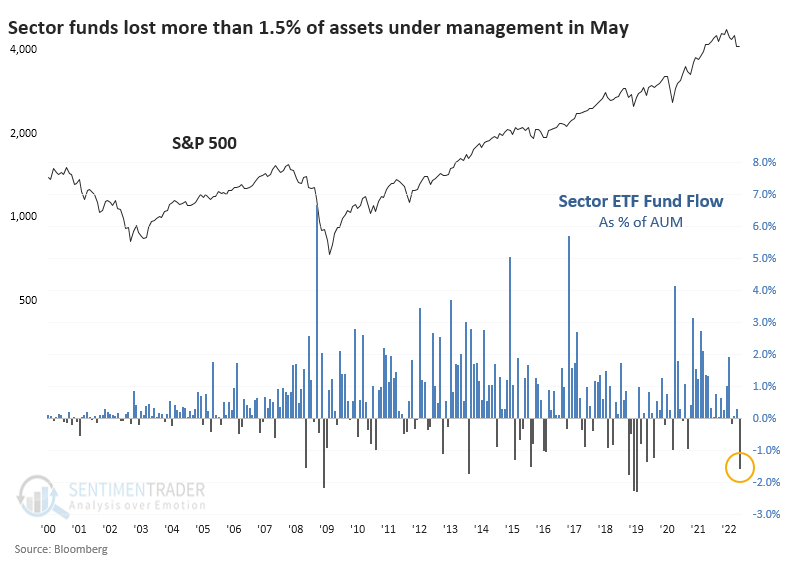
Investors weren't kidding around in May. They got scared - panicked, even - and voted with their feet.
In May alone, investors pulled more than $10 billion from sector ETFs. Few sectors were spared. Financials bore the brunt of the redemptions, with more than $5.2 billion pulled from funds like XLF, VFH, and KRE.
The total outflow of $10.6 billion was the worst since at least the year 2000. No month in over 20 years had seen a more concentrated exodus. Markets have grown since 2000, but as a percentage of assets under management, May's outflow was still substantial - the 6th-largest out of the past 269 months.
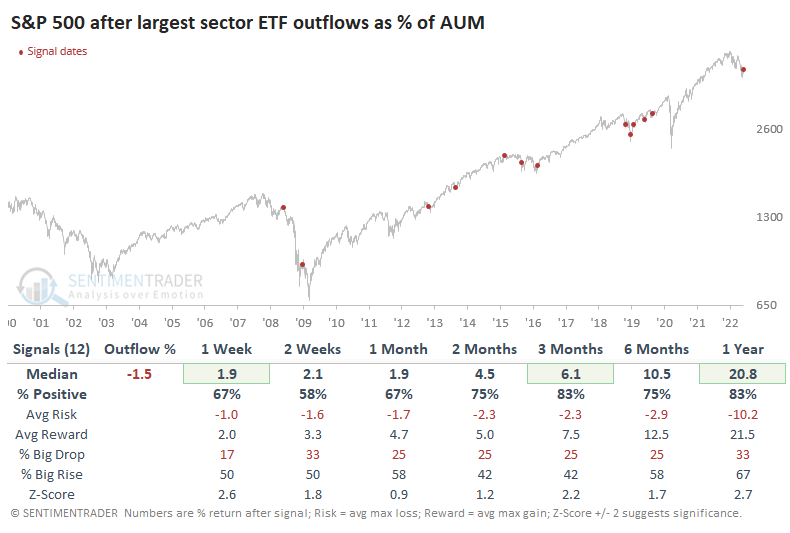
Returns in the S&P 500 were good after other months when investors pulled more than 1% of assets from sector ETFs. While this occurred right before a steep drop in 2008 and before the final plunge in early 2009, other signals saw almost universally positive returns.
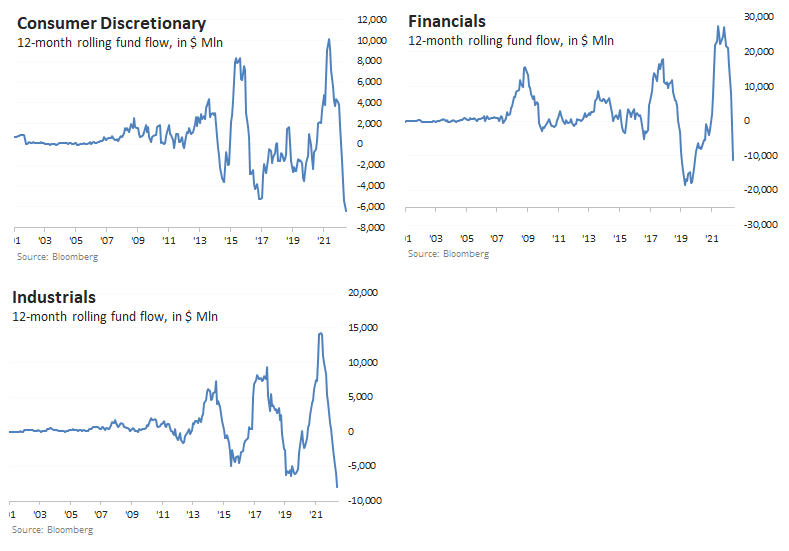
The rolling 12-month flows among the sectors show wild dispersion. Some are at or near 20-year lows (Discretionary, Financials, Industrials - not surprisingly, those heavily influenced by rising rates), while others are at or near the opposite extreme (Staples, Health Care, Technology, Utilities). There is a modest contrary tint to sector ETF flows, with massive outflows being more of a bullish sign than extreme inflows are a bearish one.
As other investors exit, insiders step in
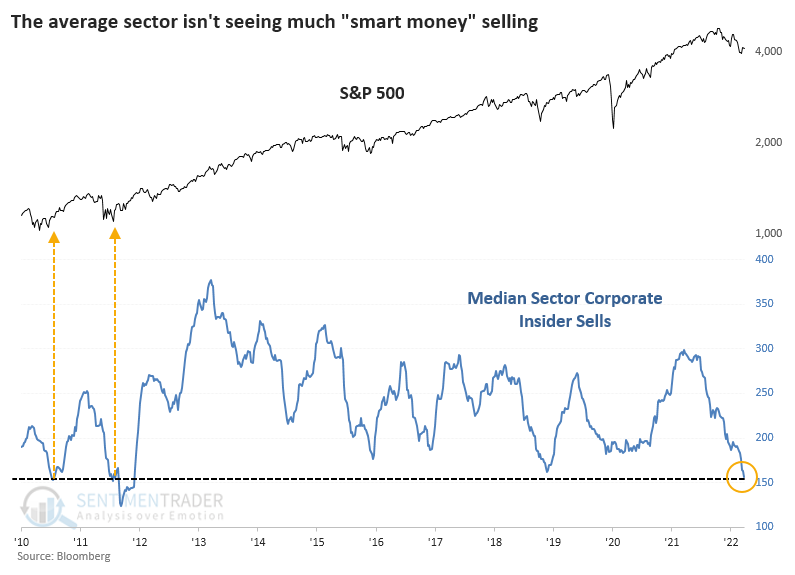
One group that has not seemed interested in participating in the selling frenzy is corporate insiders.
Among S&P 500 companies, the number of insiders with open market sales over the past six months has dropped to the lowest level in years. The four other periods of similarly repressed selling all coincided with major bottoms in the S&P (acknowledging the fact that the past decade has been dominated by a bull market tailwind).
If we look at all the major sectors and compute the median number of insider sells, it has now plunged to the lowest in a decade.
Buying interest has picked up, so the median number of insider buyers versus the median number of sellers has spiked.
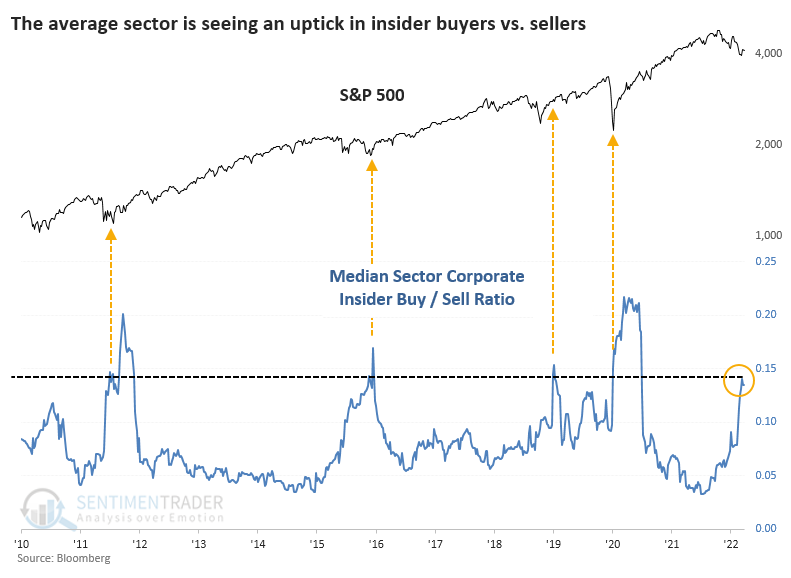
The drop-off in insider selling, often coupled with a rise in buying, has pushed the Insider Velocity to an extreme level. Within S&P 500 companies, the 4-week rate of change in the Buy/Sell Ratio recently jumped above 25%. Again, returns were aided by the market environment but returns over the next 2-12 months were excellent.
More signs of an oversold reversal
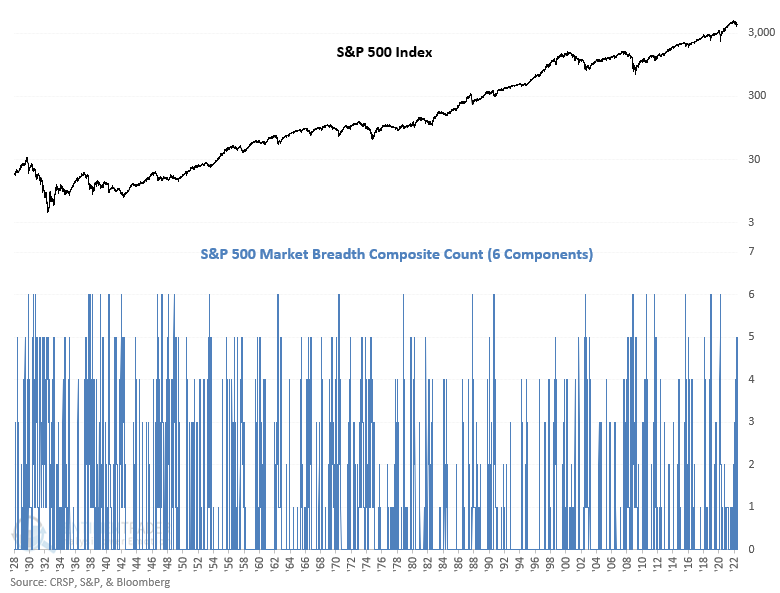
Dean showed that a breadth composite that identifies an oversold condition increased to a bullish level and subsequently reversed, triggering a buy signal for stocks.
The trading model uses a market breadth composite comprised of 6 components. The constituents identify an oversold condition when each indicator value achieves its respective threshold level in a trailing 5-day lookback period.
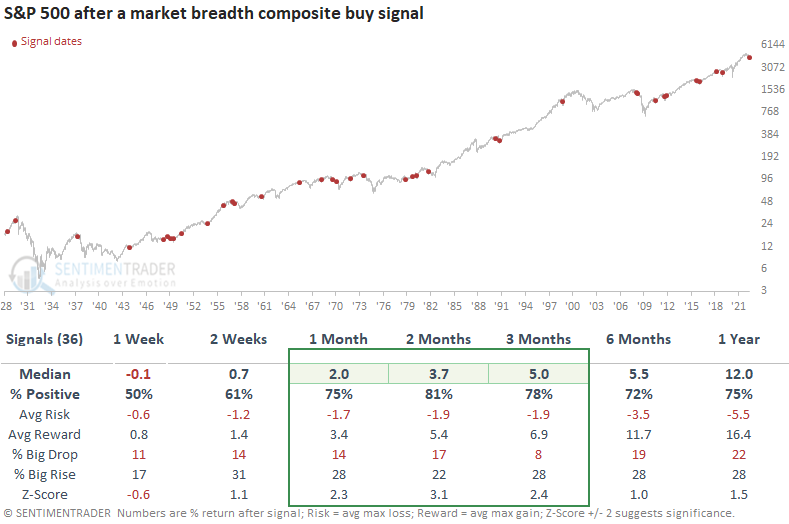
This model generated a signal 74 other times over the past 94 years. After the others, S&P 500 future returns, win rates, and risk/reward profiles look uninspiring in the first couple of weeks.
But let's add some context to the oversold condition. The outlook table will only include signals that occurred when the S&P 500 was down 20% or less, which is the case now. The non-bear market signals occurred 36 other times over the past 94 years. After the others, S&P 500 future returns, win rates, and risk/reward profiles look significantly better across all metrics.
Fundamentals are still troubling, however
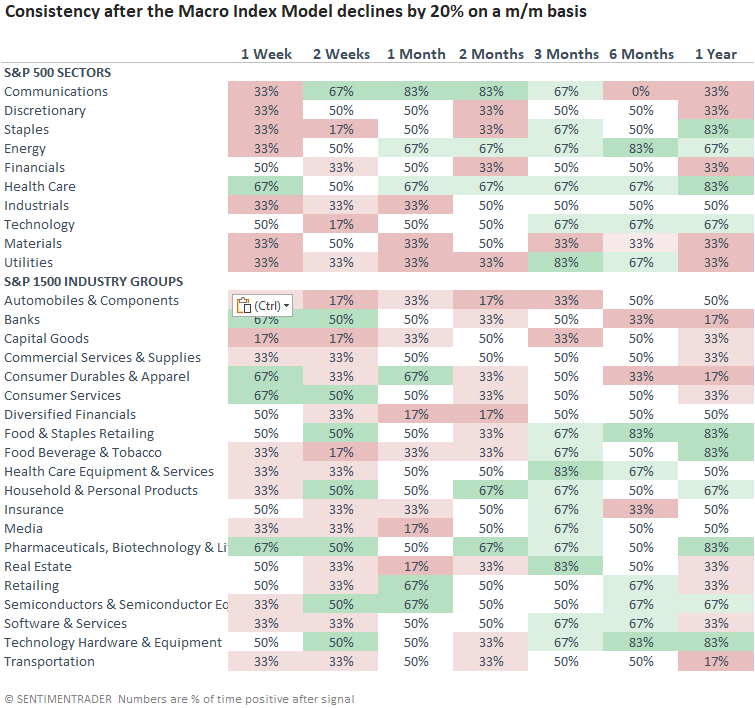
The Macro Index Model declined by 27% in the month of May. Dean noted that after similar contractions, the S&P 500 showed flat to slightly negative returns. Sector and industry group returns and consistency look more unfavorable.
The SentimenTrader Macro Index Model combines 11 diverse economic indicators to determine the state of the U.S. economy. The Index plunged by the 2nd most significant amount in history, with data reporting in May. Powerful m/m contractions occurred just before recessions in 1981-82 and 2007-08.
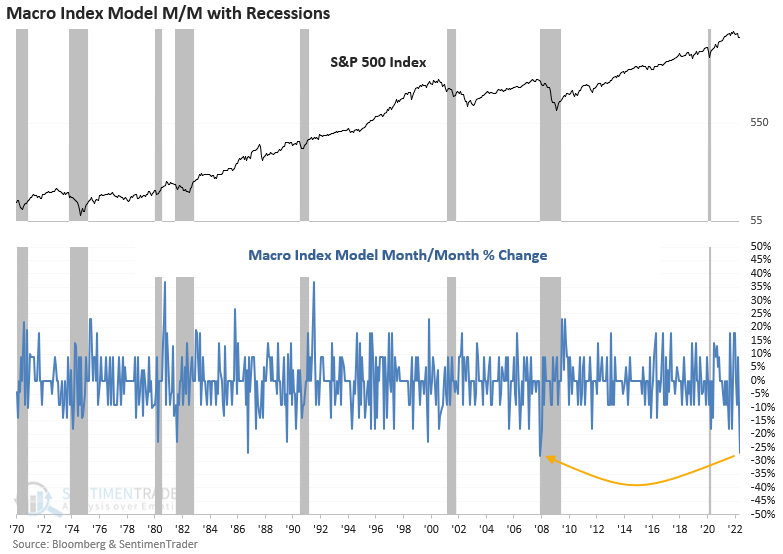
This model plunged 20% or more in a month 6 other times over the past 42 years. After the others, the S&P 500 showed flat to slightly negative returns and a coin toss on the win rate across almost all time frames.
The sector and industry group table appears more alarming than a broad index like the S&P 500. The slowing economic backdrop looks unfavorable toward most cyclical and value-oriented groups, especially financials/banks. Not surprisingly, defensive-oriented groups perform the best. Energy, health care, and staples show the most consistent trends, especially in the 3 to 12-month time frames.
Jay expanded on the weakness in the Macro Index Model by combining it with the Bear Market Probability model. We've looked at this several times in the past, as it essentially marries valuation and economic conditions.
The chart below displays the net result when the value for the Macro Index Model is subtracted from the Bear Market Probability indicator. It also highlights when the value crossed above 29 for the first time in six months.
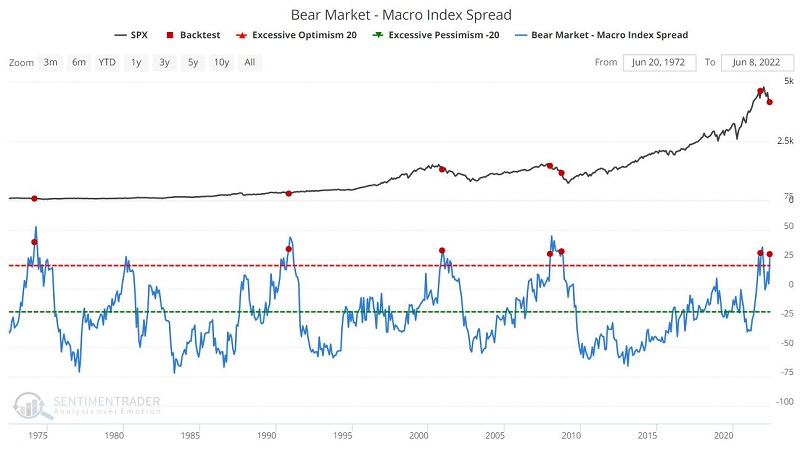
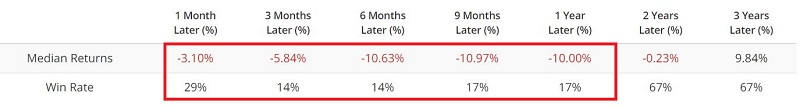
Results during the six months following a signal have been particularly subpar. The exception was 1990, which showed no ill effects as the economy recovered quickly and the stock market soared. But all other readings - including the 10/29/2021 signal - witnessed significant market weakness over the next 12 months.
Using credit spreads to trade bank loans
Jay showed that credit spreads tend to rise in periods of doubt and fear and fall when things are calm. Bank loans tend to have a highly inverse relationship to credit spreads.
The chart below displays the spread between yields on BBB-rated and AAA-rated bonds.
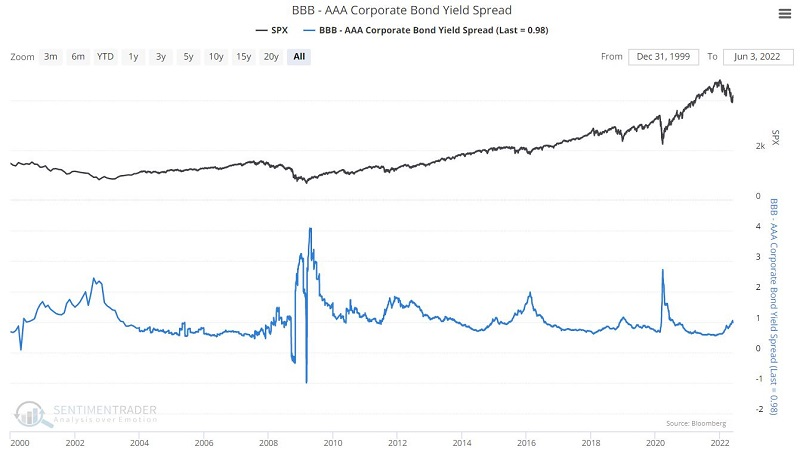
During periods of uncertainty in the financial markets in general - and the credit markets specifically - this spread widens, and investors dump lower-rated credits and seek the safer haven of higher-rated securities. Same for credit default swap prices.
To build a model for trading a fund like BKLN (Invesco Senior Loan ETF), we can use its price and the behavior of credit spreads.
In English:
- If the 9-day EMA for the BBB-AAA spread is trending lower, that is bullish
- If the 9-day EMA for CDX Index is trending lower, that is bullish
- If the 9-day EMA for BKLN is trending higher, that is bullish
The chart below displays the cumulative % +(-) for BKLN if held long only when the conditions are bullish. These results are illustrative and do not deduct anything for slippage or commissions. The cumulative % gain was +74.3%.

When conditions are NOT bullish, the cumulative % decline in BKLN was -23.3%.
Is tech really dead?
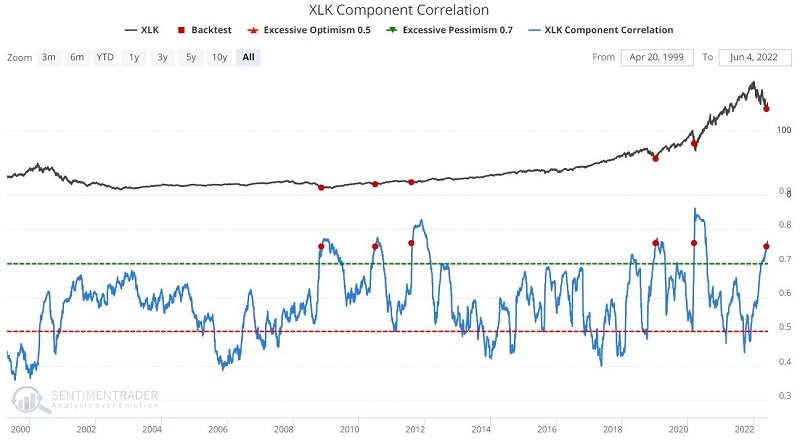
Jay looked at the "tech is dead" narrative. From December into May, ticker XLK (Technology Select Sector SPDR Fund) fell -29% before rebounding slightly. The narrative among pundits seems to suggest that this is just the beginning of a 2000-2002 type collapse. The problem with this line of thinking is that corporate insiders are acting bullish, and speculators are acting bearish.
XLK insider buying picked up significantly starting in November 2020. Amazingly, they kept buying heavily during the rally in 2021 and kept right on buying heavily throughout the 2022 decline. While strong insider XLK buying continues unabated, XLK insider selling has steadily declined over the past year.
Component correlation measures the degree to which the stocks in an index are trending similarly. Typically, high readings tend to be bullish. A high reading during a price downtrend suggests that investors are dumping the stocks in the index indiscriminately.
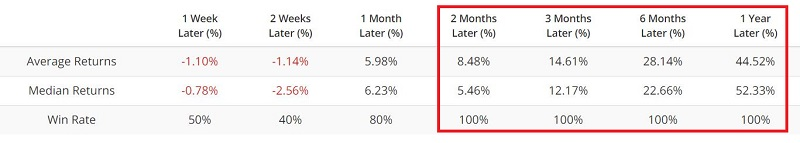
The chart below displays those weeks when our XLK Component Correlation was above 0.75 for the first time in six months.
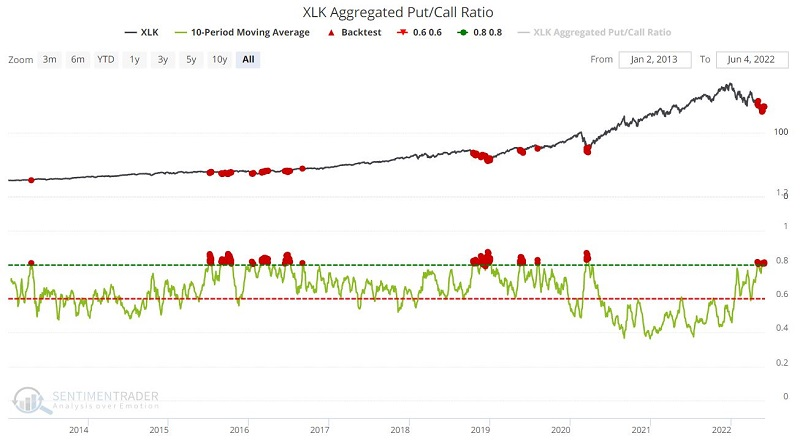
The Aggregated Put/Call ratio is another sign that investors are giving up on tech stocks. When this ratio reaches a high level, options traders are betting heavily against tech stocks by buying many put options relative to the number of call options purchased.
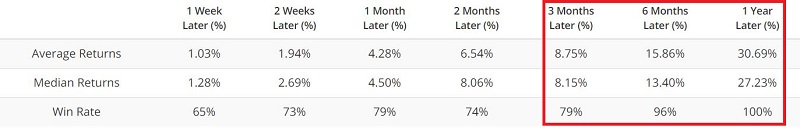
The chart below displays all days when the 10-day average for XLK Aggregated Put/Call Ratio was above 0.80. The table below displays a summary of the results.
The "story" is that technology sector stocks got "too overvalued" during the 2020-2021 bull market and are now due for a comeuppance on a par with the 2000-2002 bear market. And maybe they are. But the potential "fly in the ointment" to this line of argument is that technology corporate insiders are bullish and retail traders are bearish. Historically, that is a recipe for favorable action, not a continued bearish decline.
Even Chinese tech stocks are trying to recover
Maybe the long nightmare has finally ended for Chinese tech.
The shift in mood among investors and the media is pronounced. Not that long ago, the stocks were believed to be uninvestable (the same thing they said about energy two years ago).
Now it's starting to thaw as the media focus on policy changes and rising stock prices. More and more, we see impressive buying interest in these stocks. There have been other false starts over the past six months, but none came from such a spectacular crash as we looked at in mid-March.
For the first time in what seems like forever, "more than zero" stocks have climbed above their 200-day moving averages.
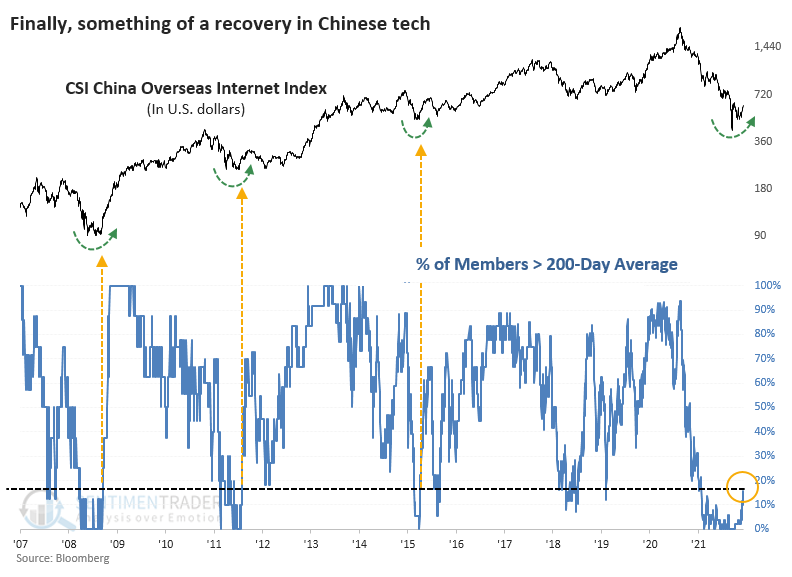
That's a little hyperbolic since every stock hasn't been pinned below its long-term average. But it's been close. This is the first time in nearly a year that even 15% of the stocks in the CSI China Overseas Internet Index have climbed above their averages, far beyond any of the other crashes these stocks have suffered.
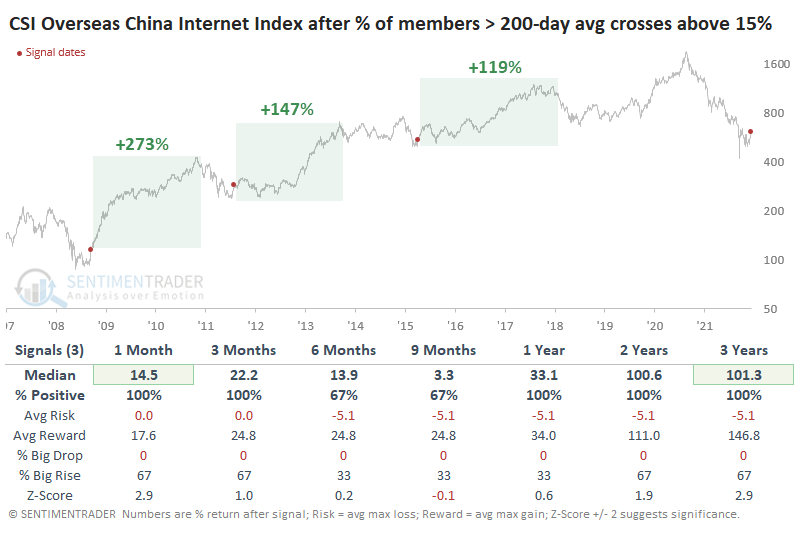
There isn't a lot of history here, only about 15 years. So, the sample size for pretty much any extreme will be tiny, and this is no exception. It's only the fourth time the stocks have recovered from a prolonged bout of selling pressure. All three of the others preceded double-digit gains over the next couple of months.
The recovery has come in fits and starts, but the "starts" have been impressive. Over the past three months, there were seven days when more than 90% of member stocks advanced on the same day. This ties the record for overwhelming buying days, and it's something that had been missing during earlier parts of the decline.
Why June might be a good month for crude oil
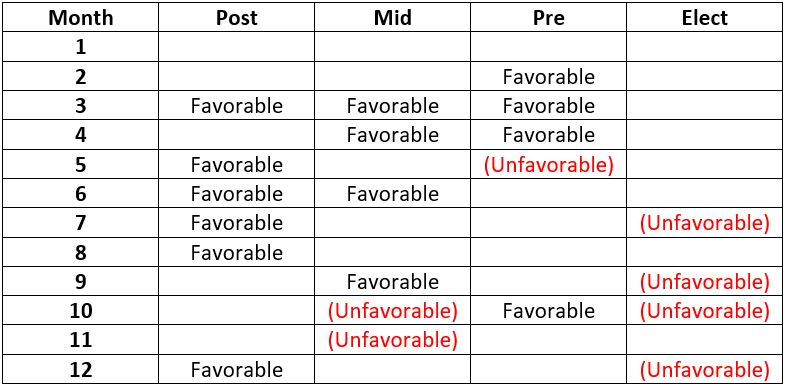
Many traders are familiar with the Election Cycle related to the stock market. Far fewer are familiar with the same concept applied to crude oil. Jay noted that since crude oil began trading in 1983, certain months within the 48 months comprising an election cycle have tended to show strength, while others have tended to show weakness.
The table below displays the 48-month election cycle and highlights months that tend to be favorable, unfavorable, or with no preference (blank) for crude oil futures.
These months were chosen based on optimization using monthly data from 3/31/1983 through 12/31/2012. The chart below displays the hypothetical performance achieved by holding long a crude oil futures contract only during "Favorable" months during the optimization period of 1983 through 2012.
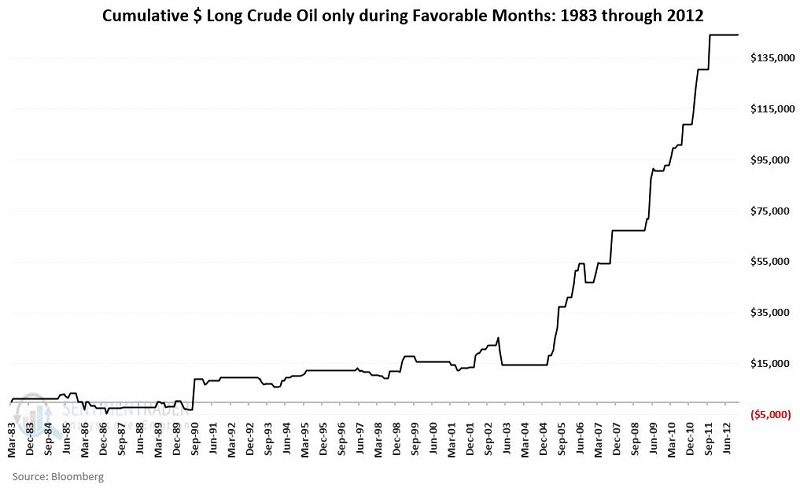
Looks great, right? Of course, it does. That's how optimized, back-tested results always look. The real question for any optimized test is, how does it hold up in real-time? The chart below displays the performance achieved by holding long a crude oil futures contract only during "Favorable" months from 2013 to the present.
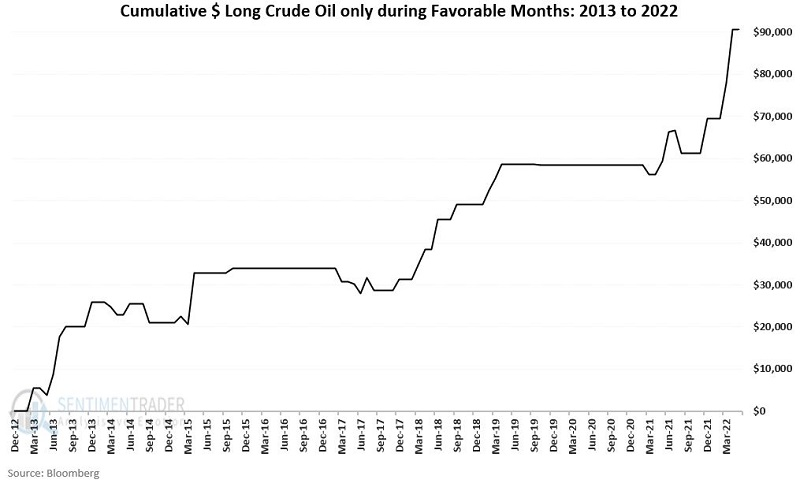
The good news is that a given market can move according to a given seasonal framework for an extended period of time. The bad news is that there is NEVER any guarantee that any given seasonal trend will continue to "work" the next time around or at all in the future.
Rising oil should be more good news for Energy stocks
If oil continues to rally, then it should be good news for Energy stocks. Dean noted that a relative RSI model has given a buy signal for Oil & Gas stocks, and the rally has been broad-based among them.
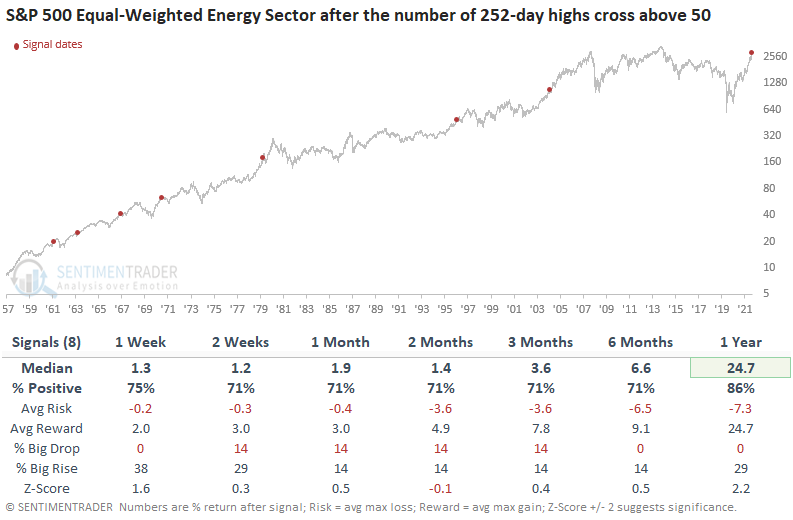
The S&P 500 Equal-Weighted Energy Sector keeps hitting new one-year highs, for the 50th time in the past year. The prior first cross above 50 occurred near the outset of the last energy bull market in November 2004.
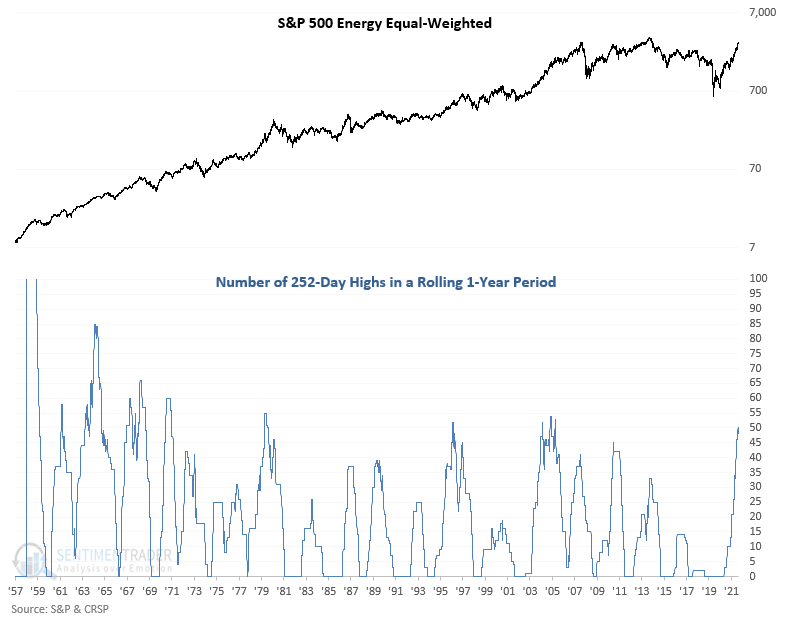
When the number of 252-day highs for the equal-weighted energy sector cross above 50, the bullish trend backdrop continues. A year later, the sector was higher in 7 out of 8 cases. The lone loss in 1961 was minuscule, and one had ample time to make a profit based on the 3-month return.
About TradingEdge Weekly...
The goal of TradingEdge Weekly is to summarize the research published to SentimenTrader over the past week. Sometimes there is a lot to digest and this summary is meant to highlight the highest conviction or most compelling ideas we discussed. This is NOT the full research that's published, rather it pulls out some of the most relevant parts. It includes links to the published research for convenience; if you don't subscribe to those products it will present the options for access.
Indicators at Extremes
|
|
|
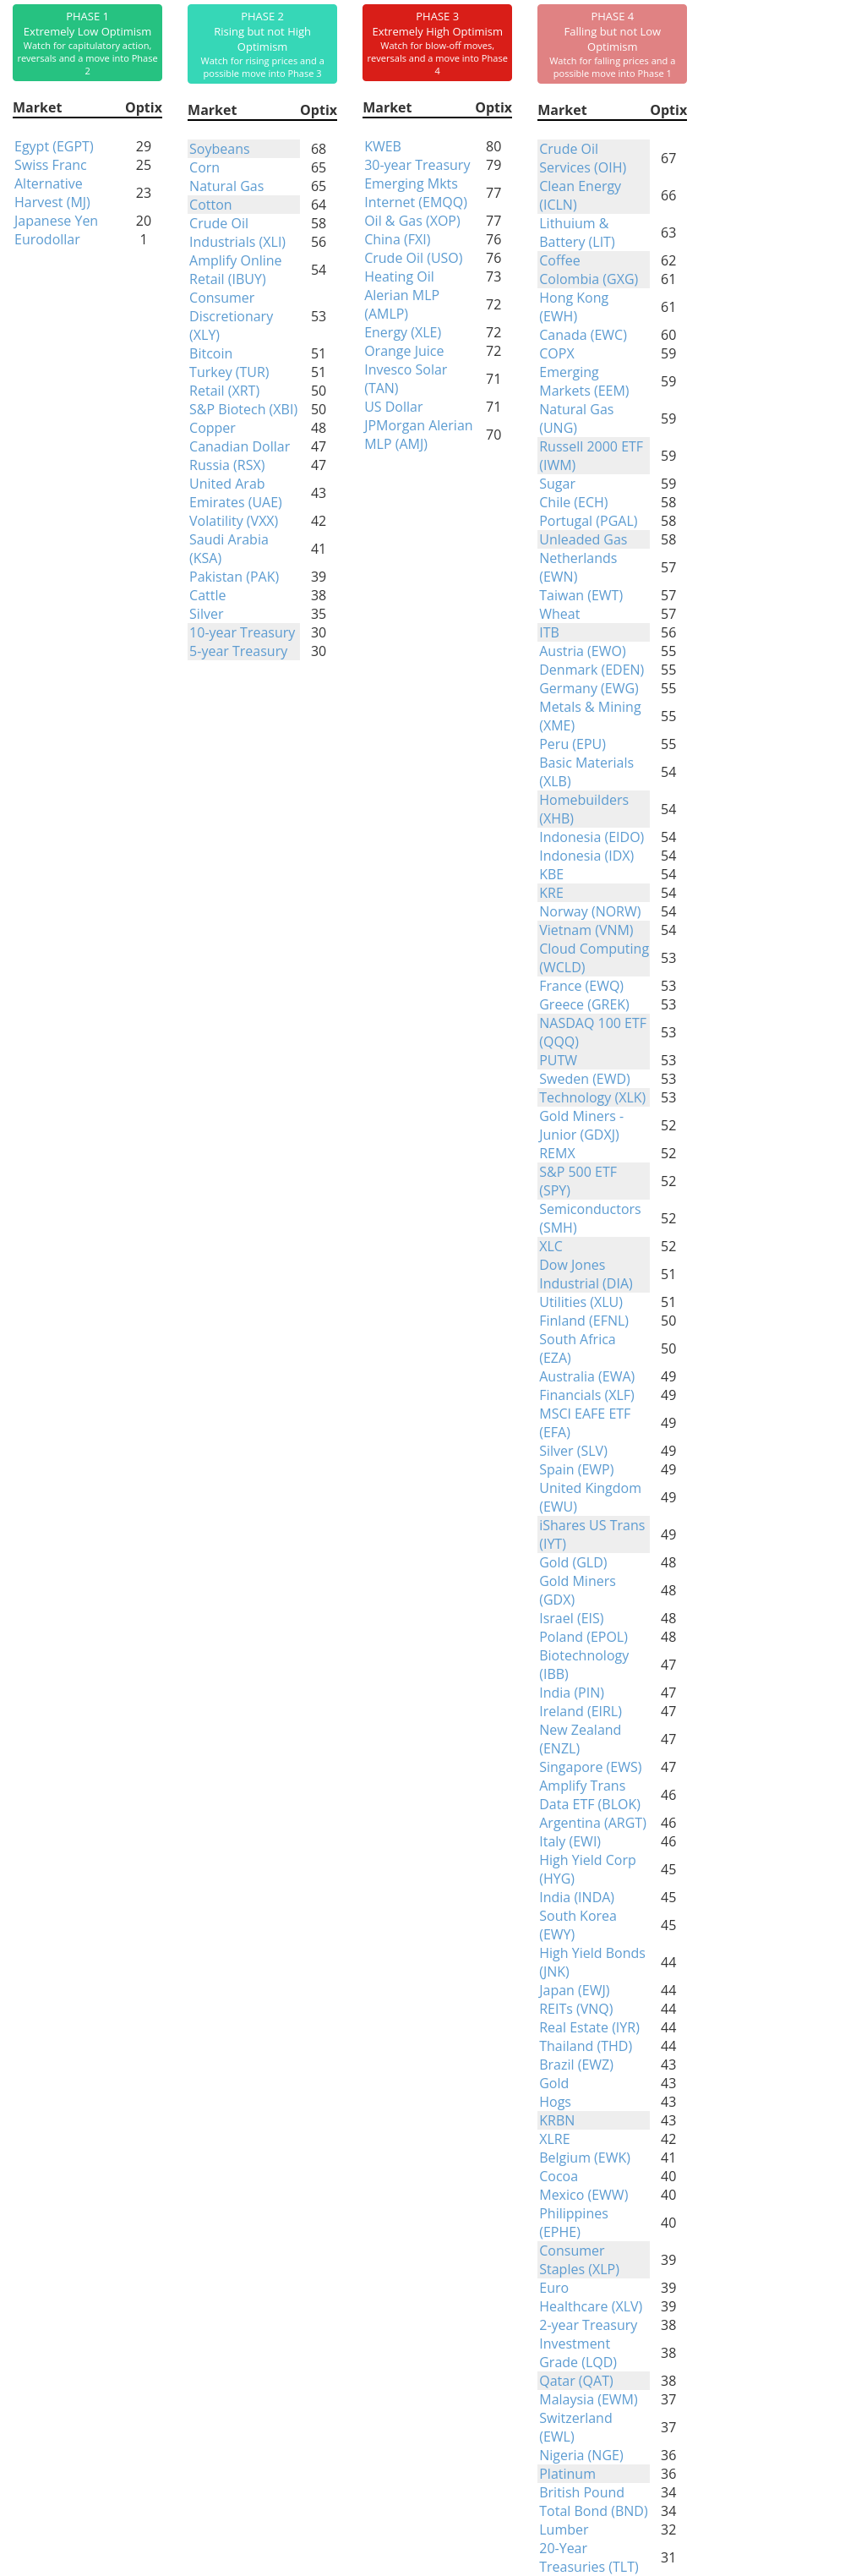
Phase Table
|
|
|
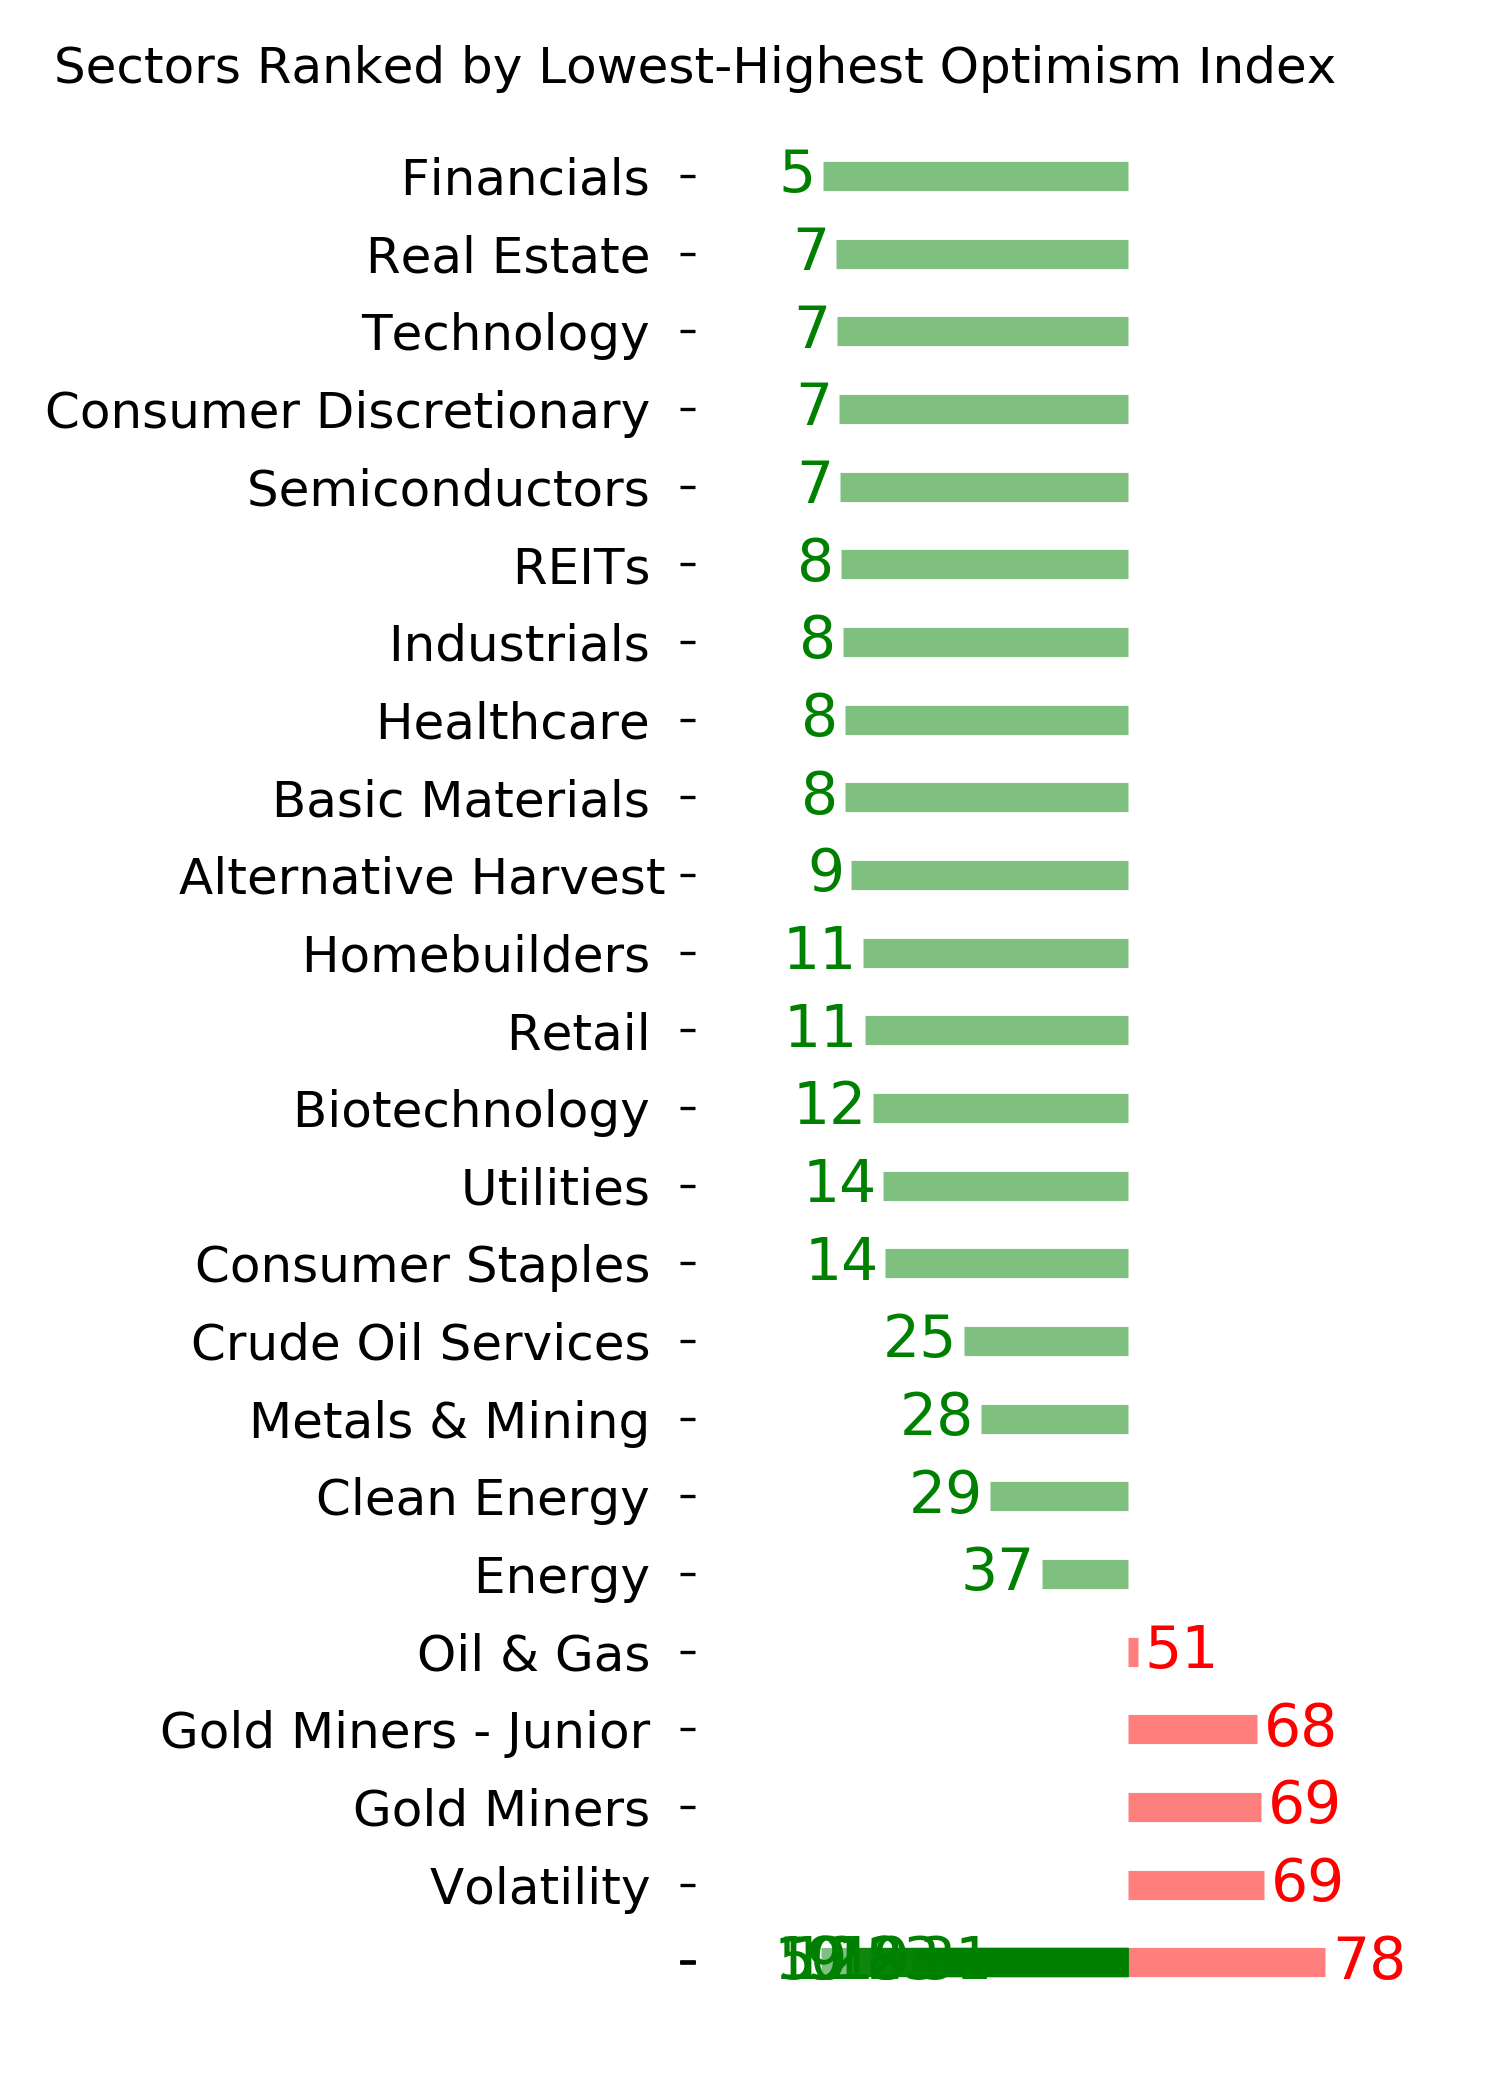
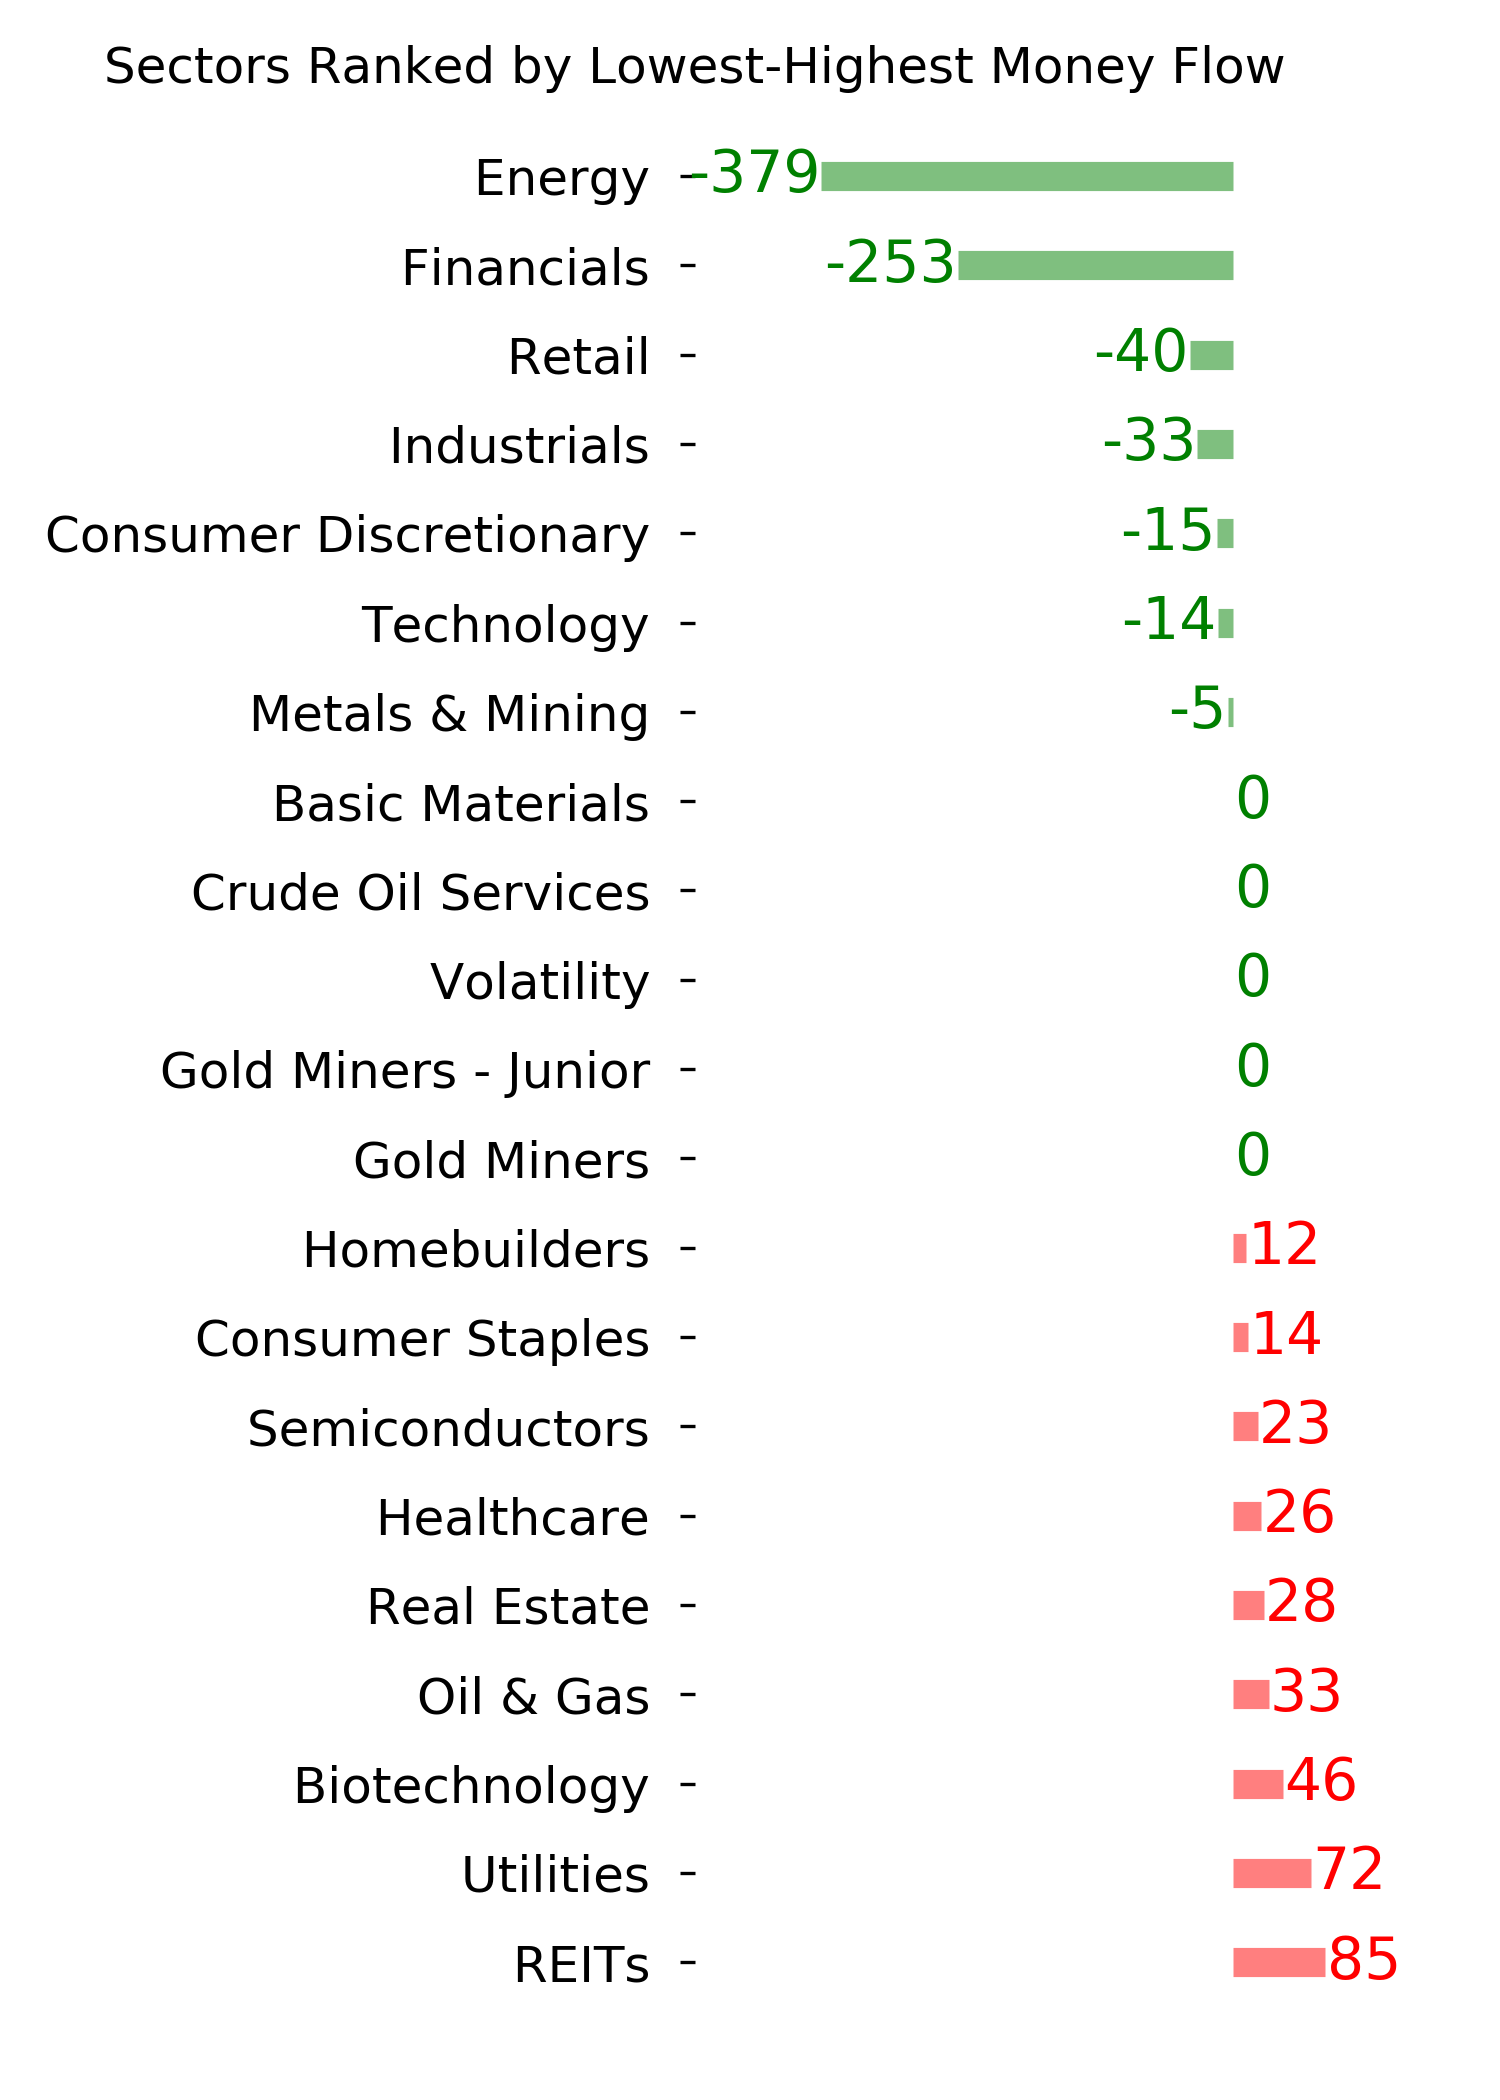
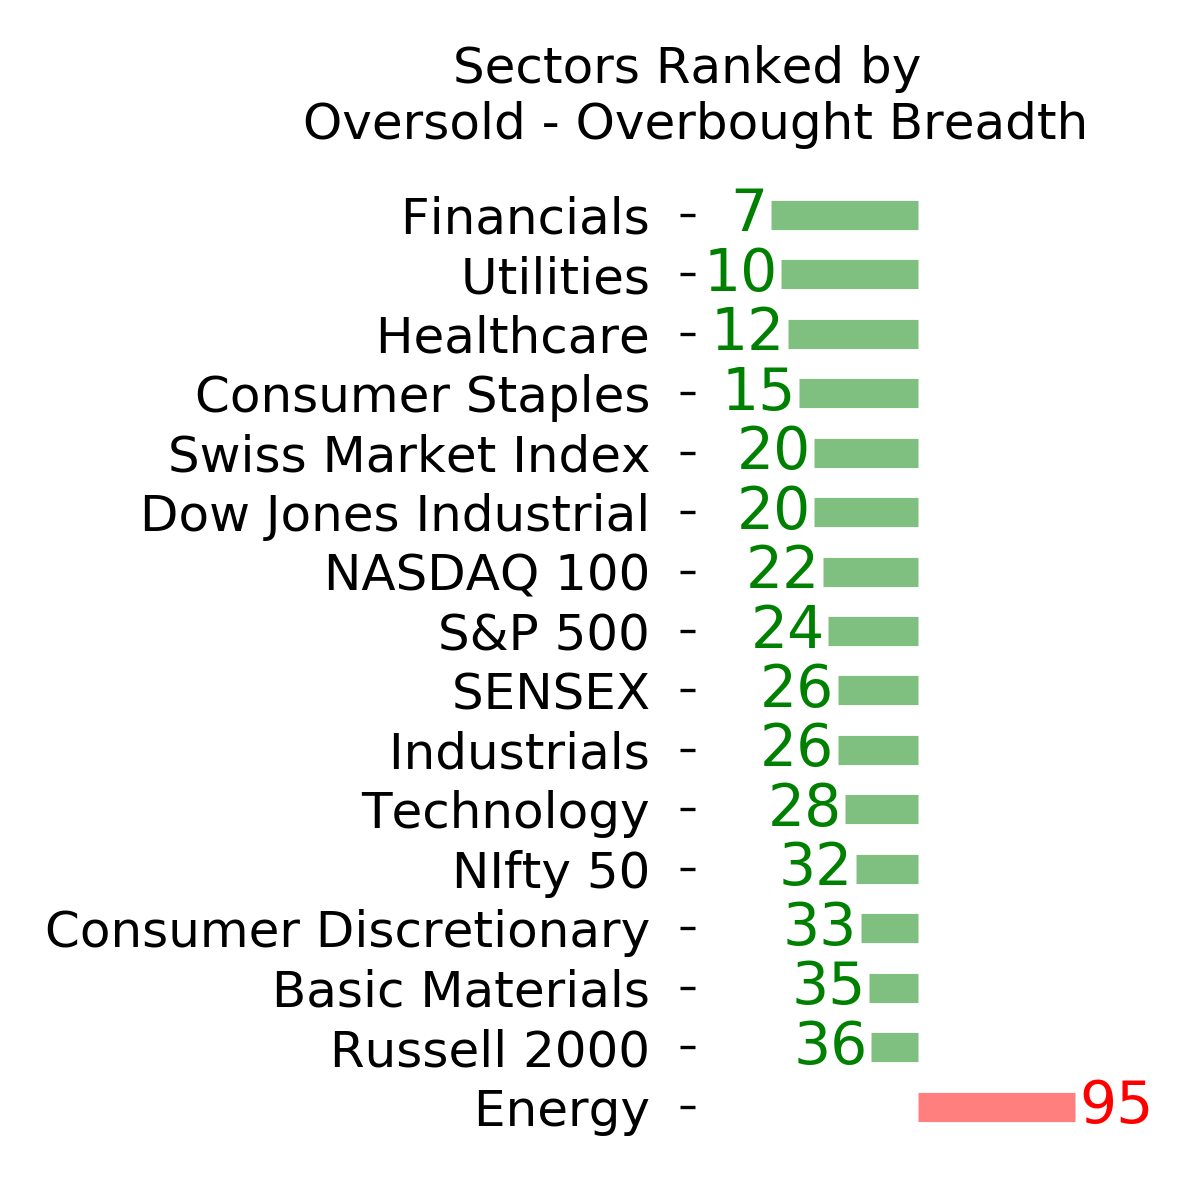
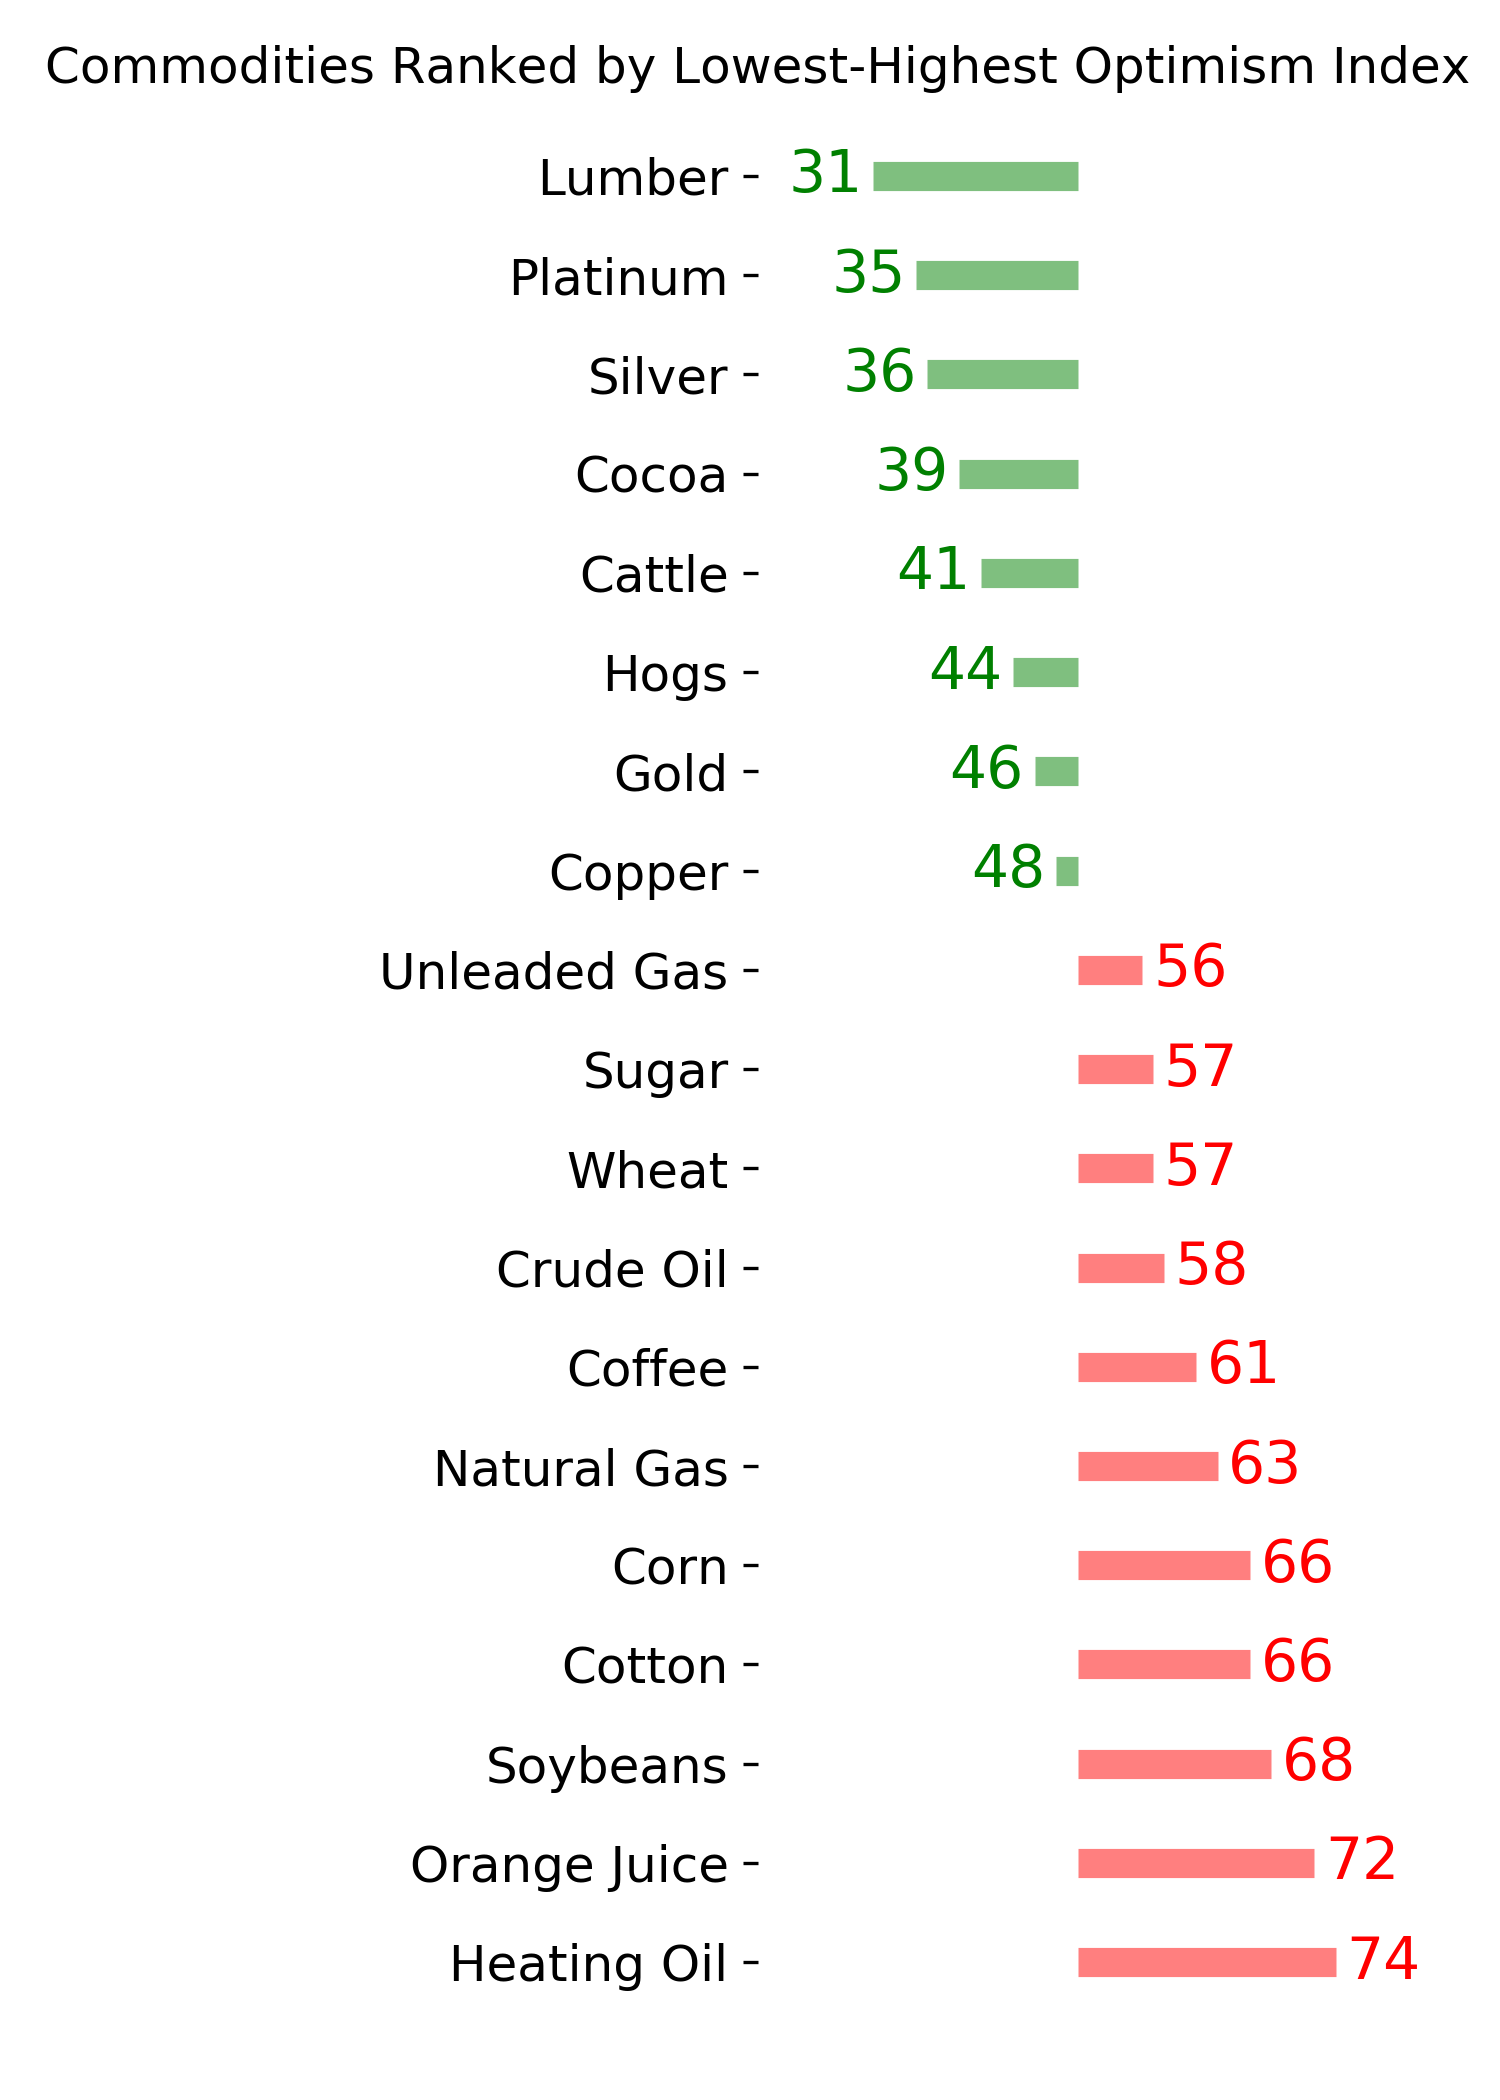
Ranks
|
|
|
|
|
|
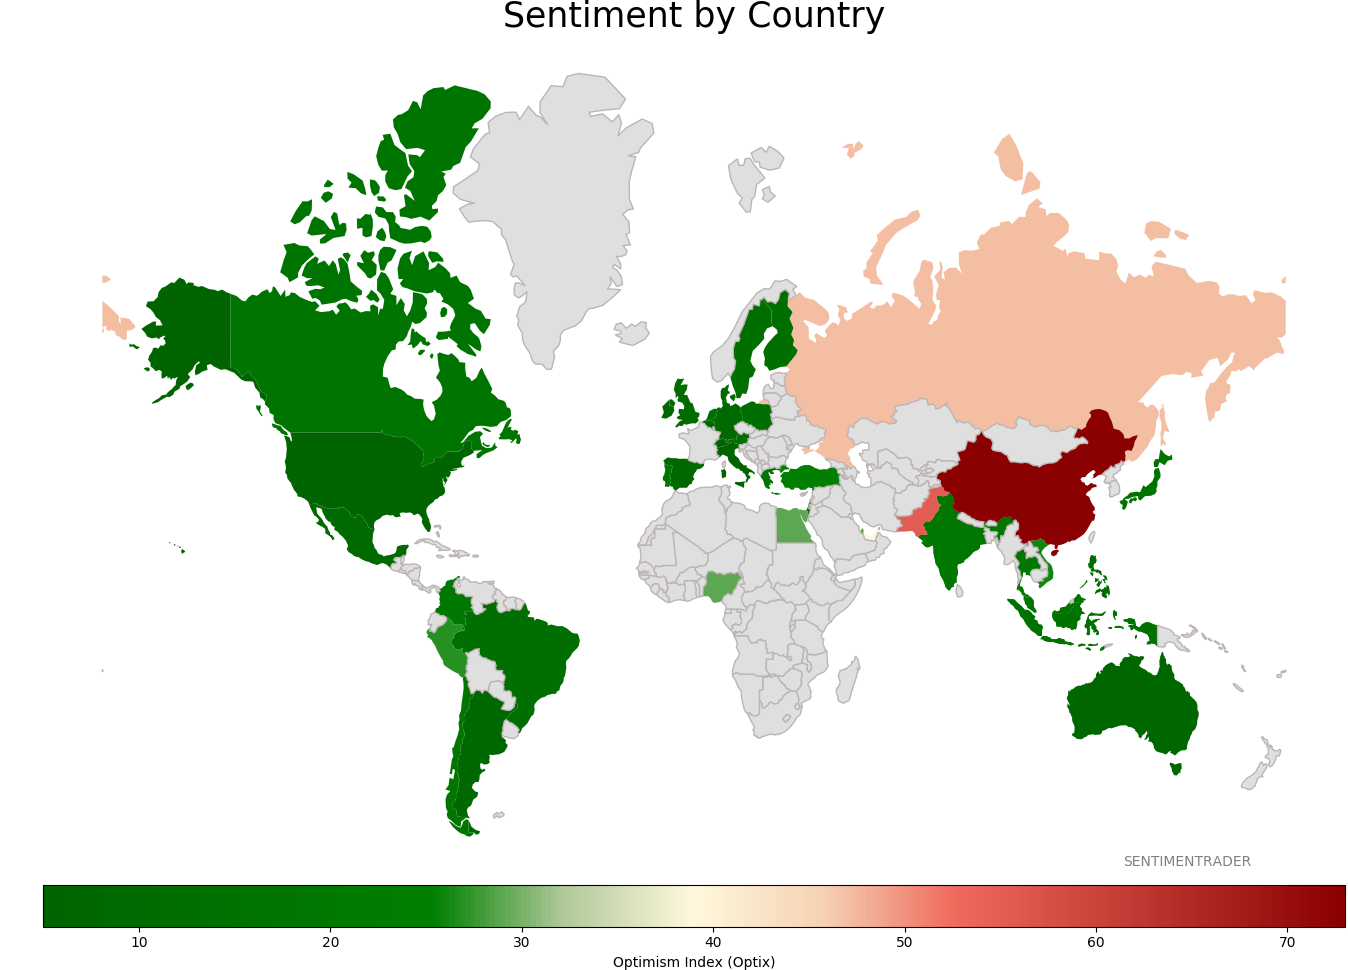
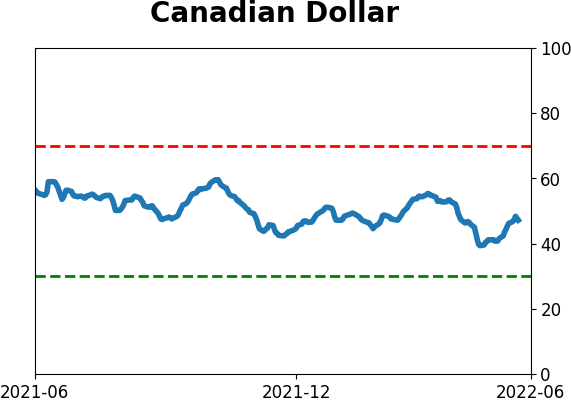
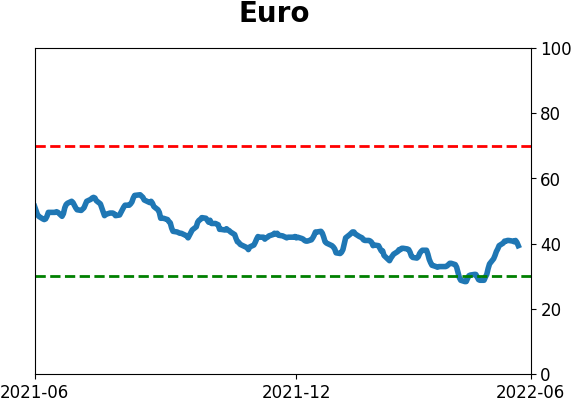
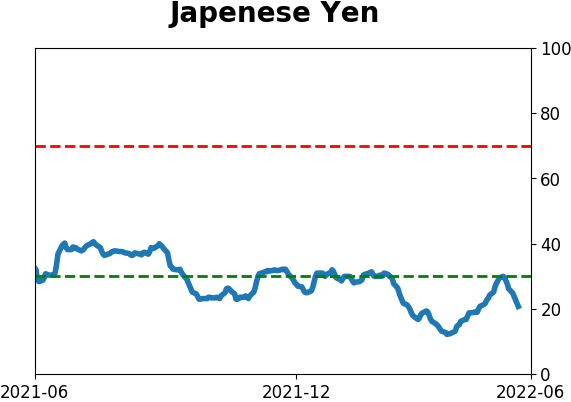
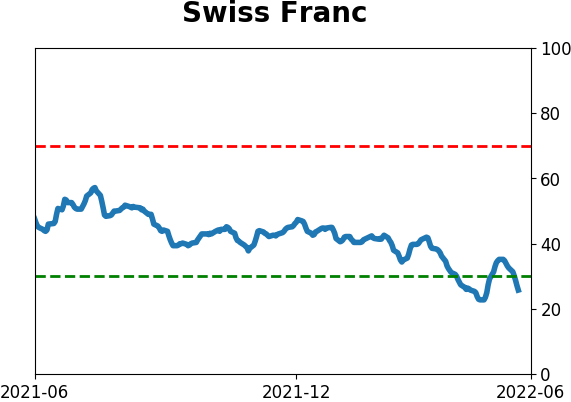
Sentiment Around The World
|
|
|
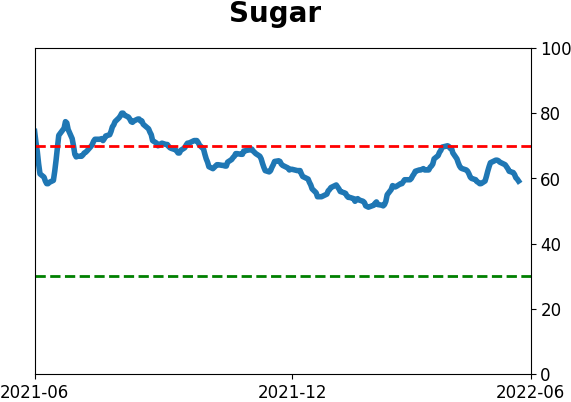
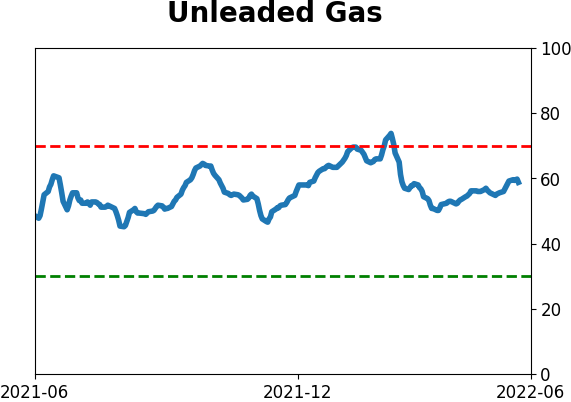
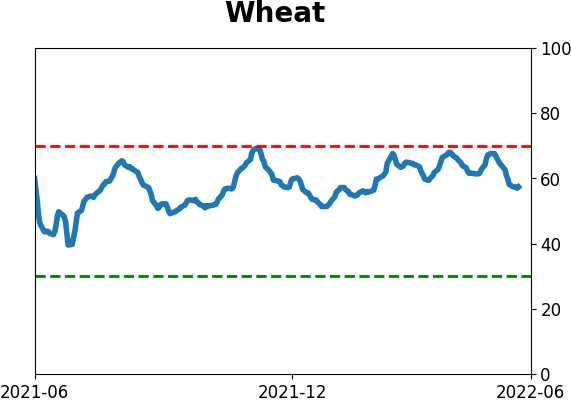
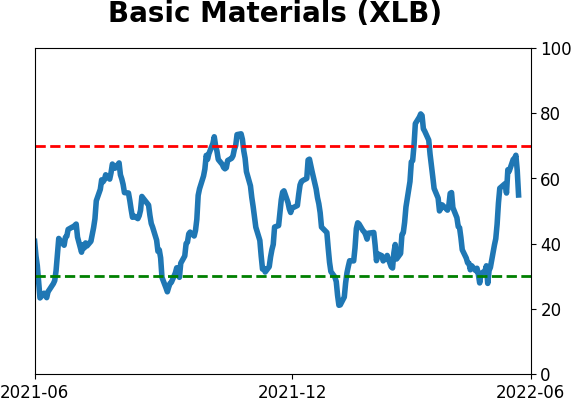
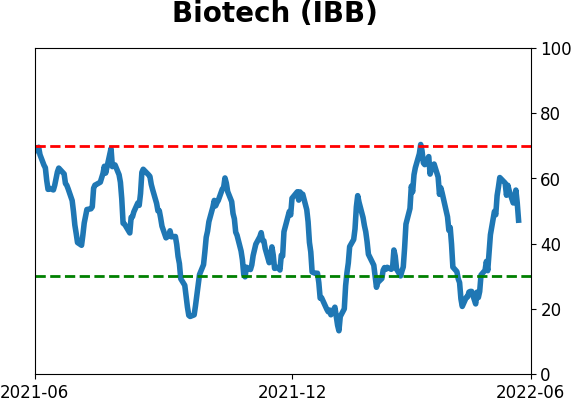
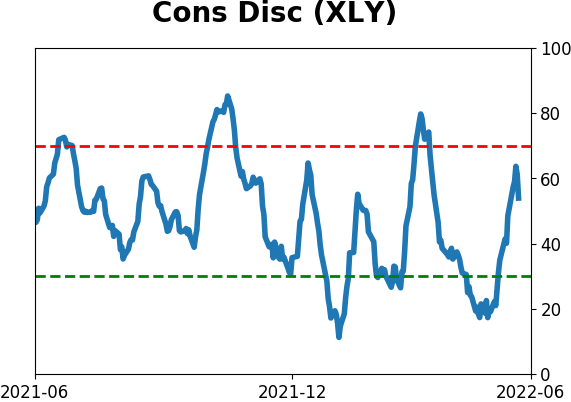
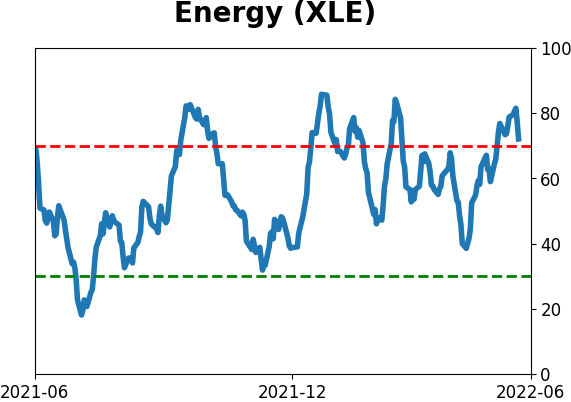
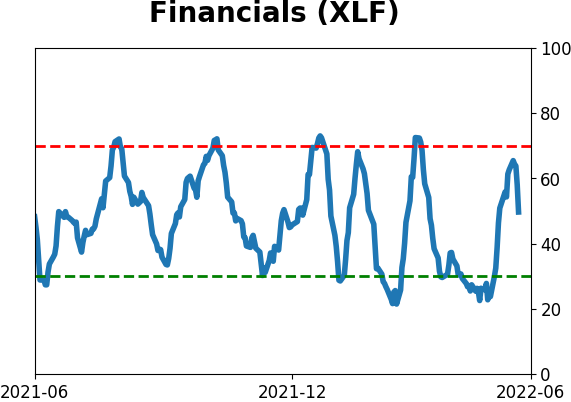
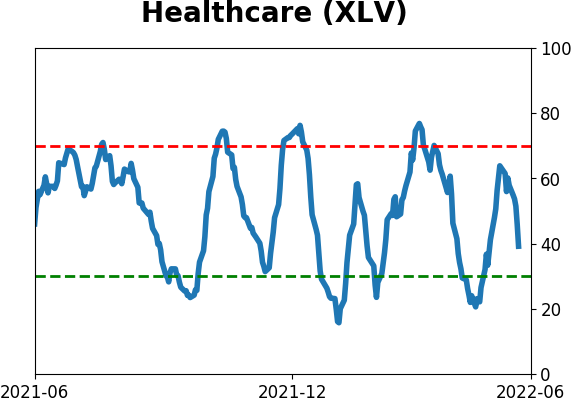
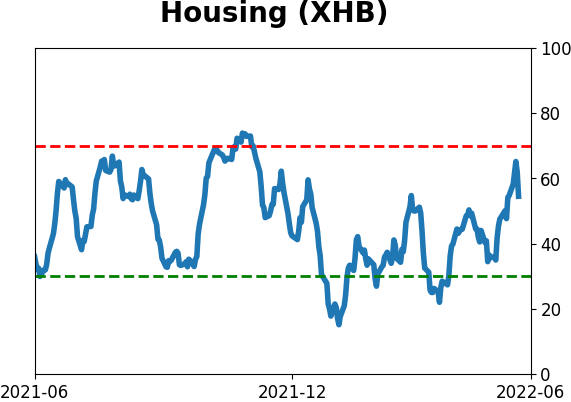
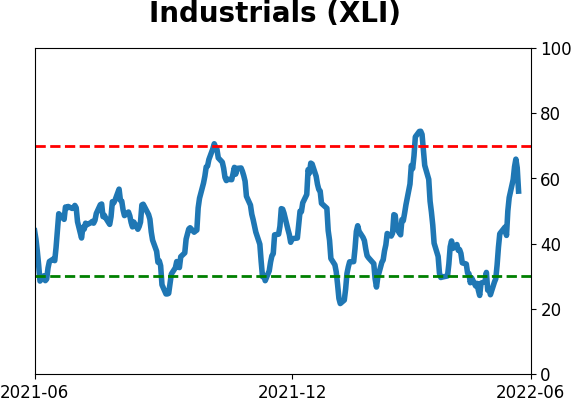
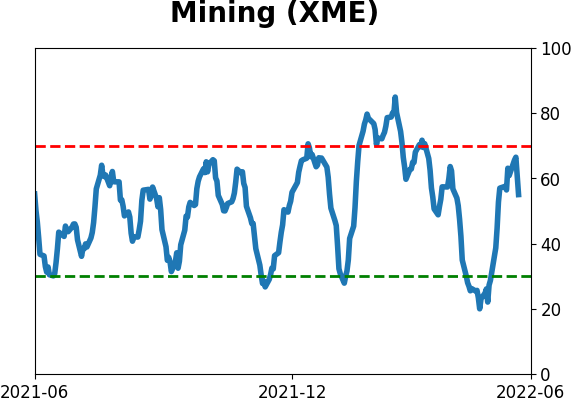
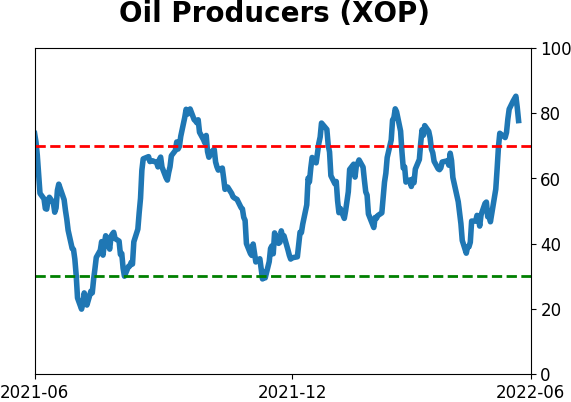
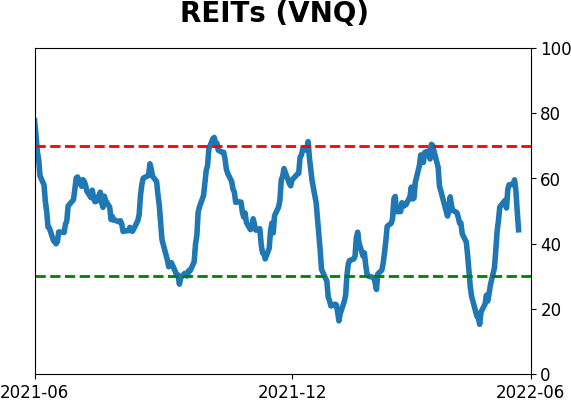
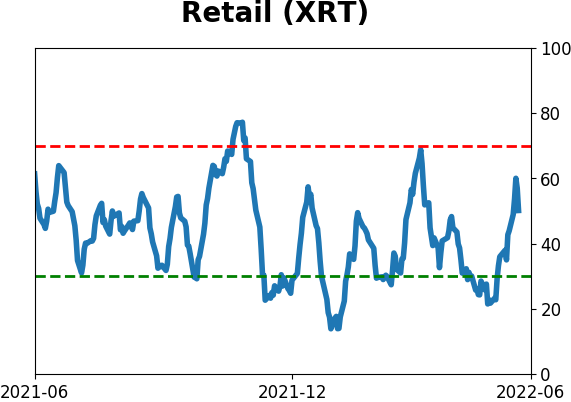
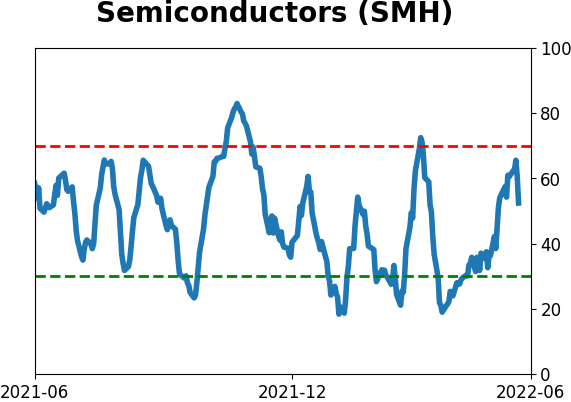
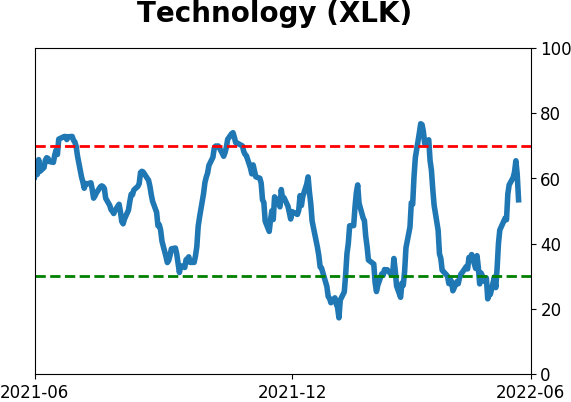
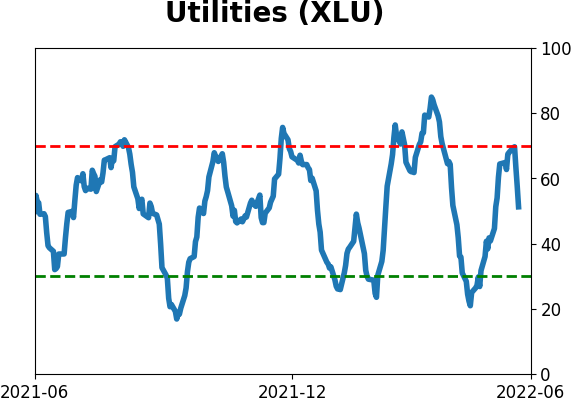
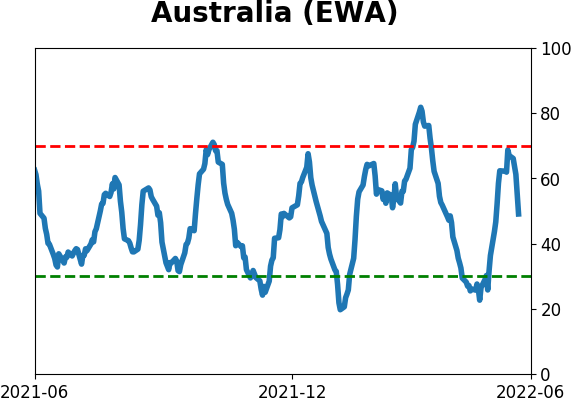
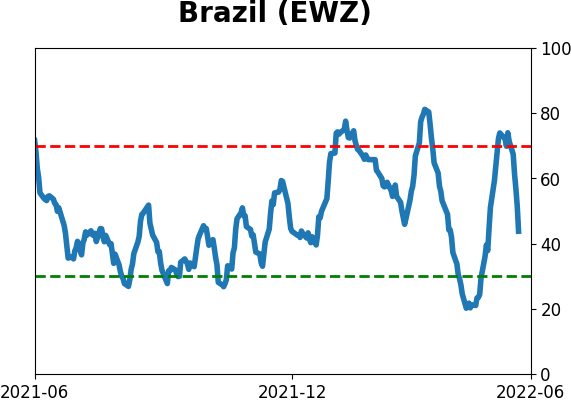
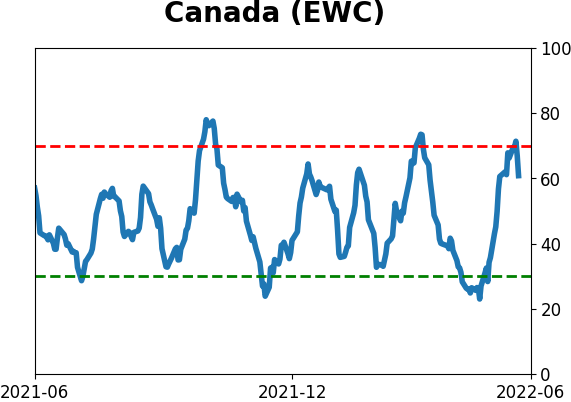
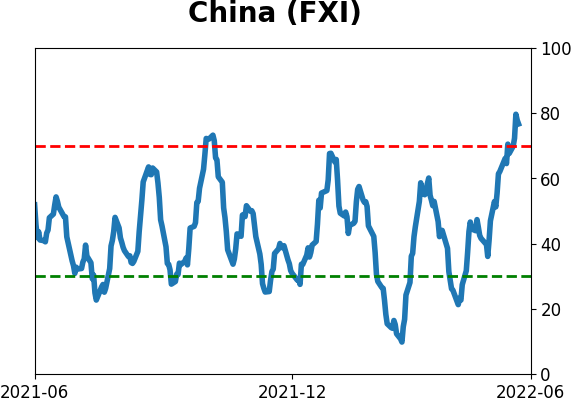
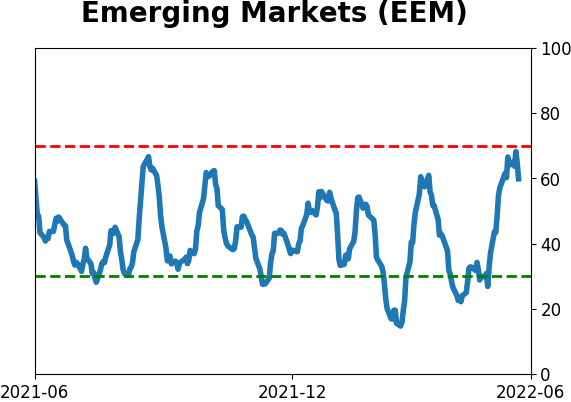
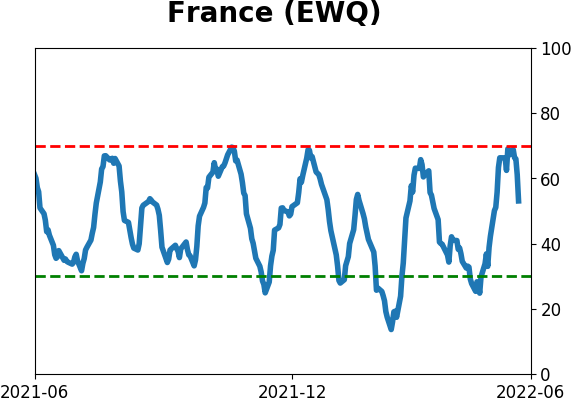
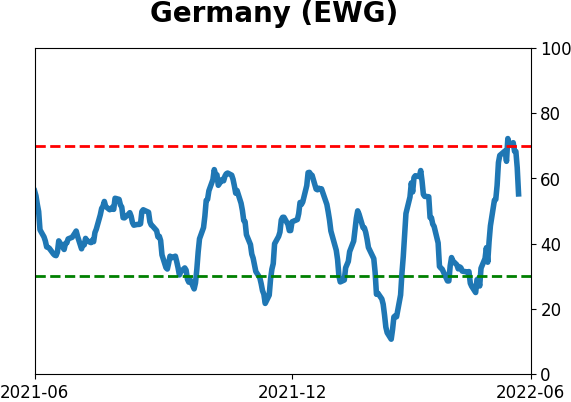
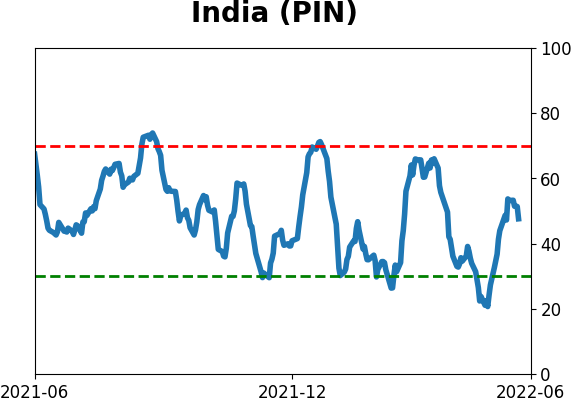
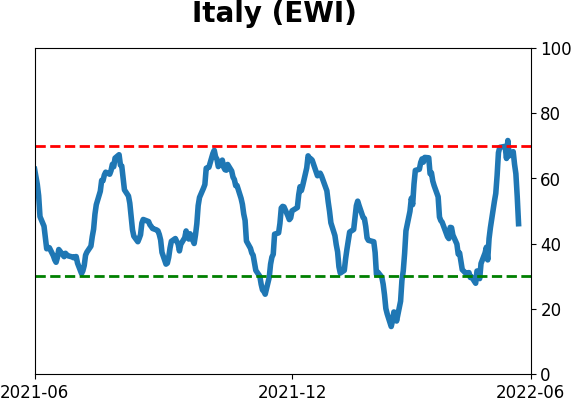
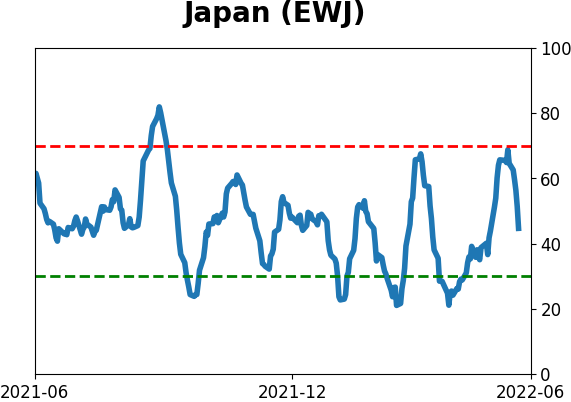
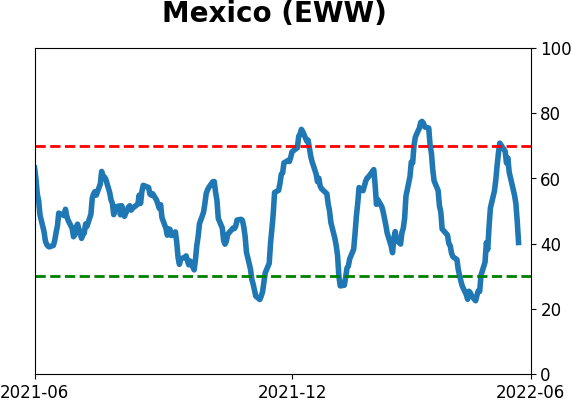
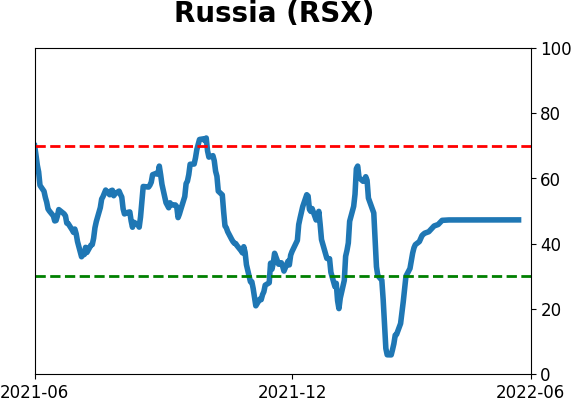
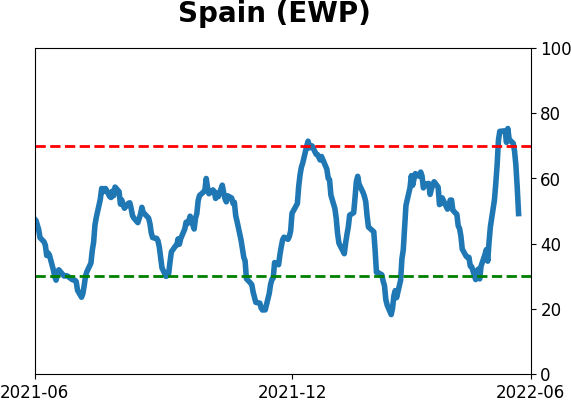
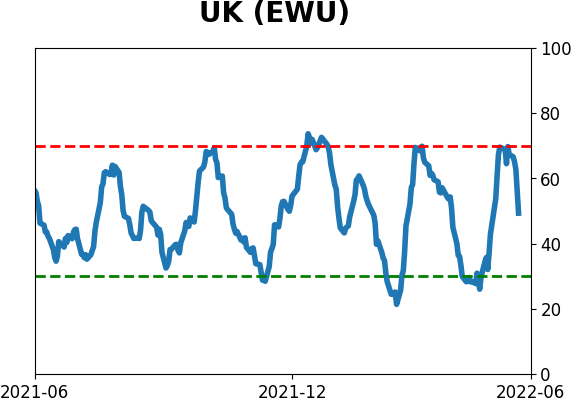
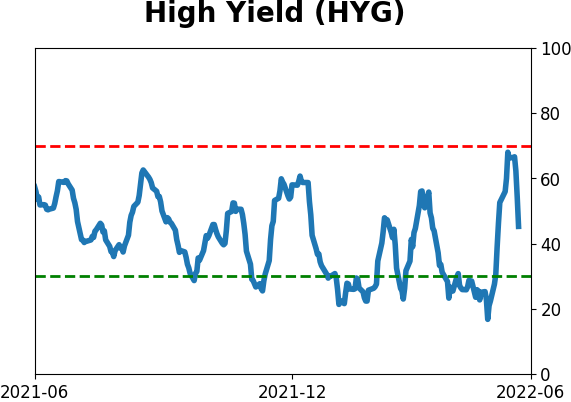
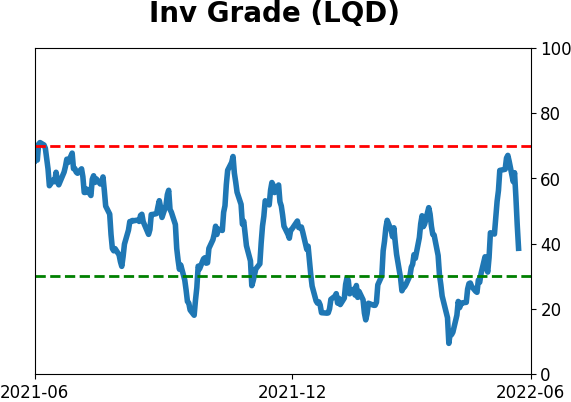
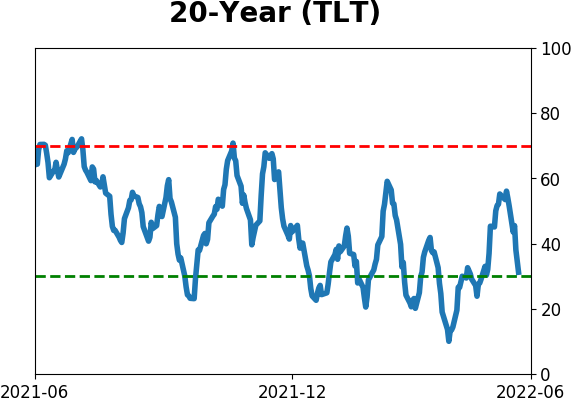
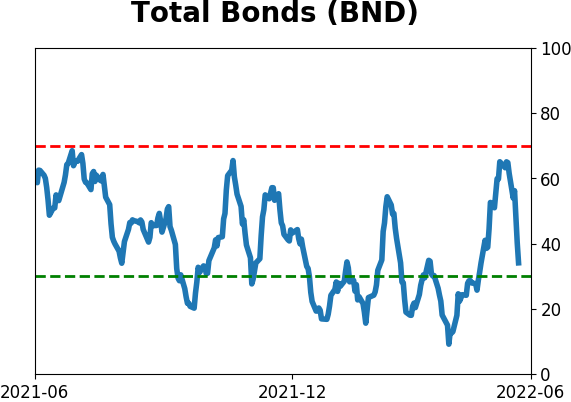
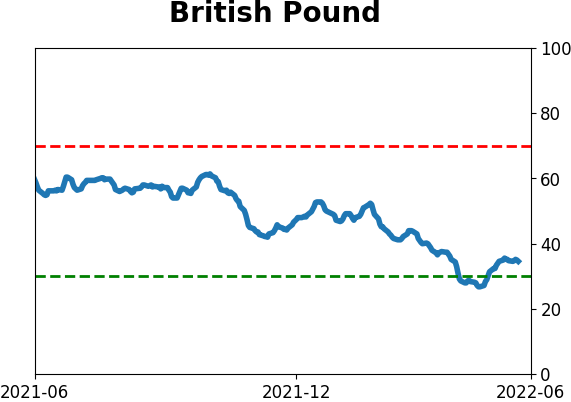
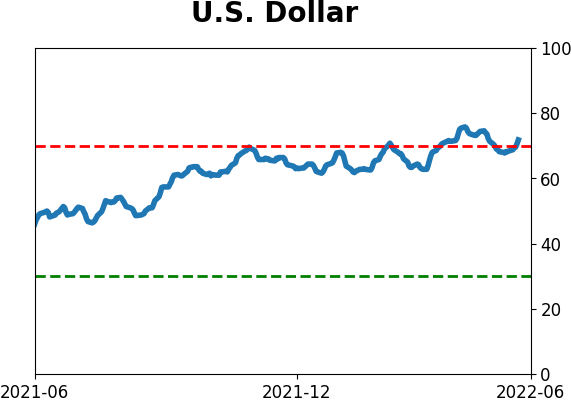
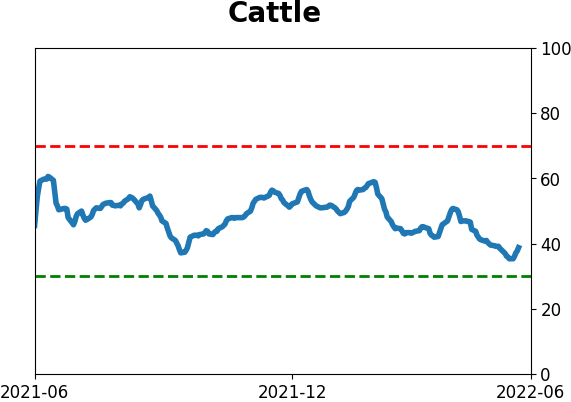
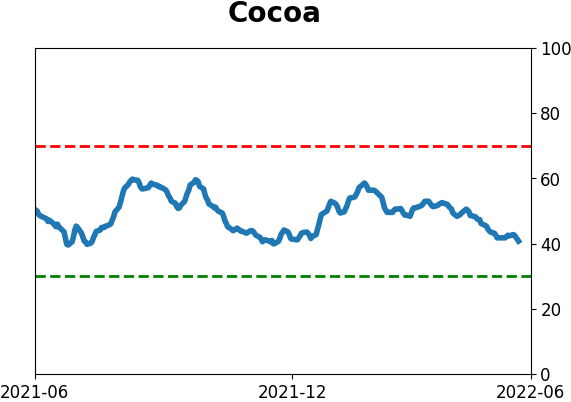
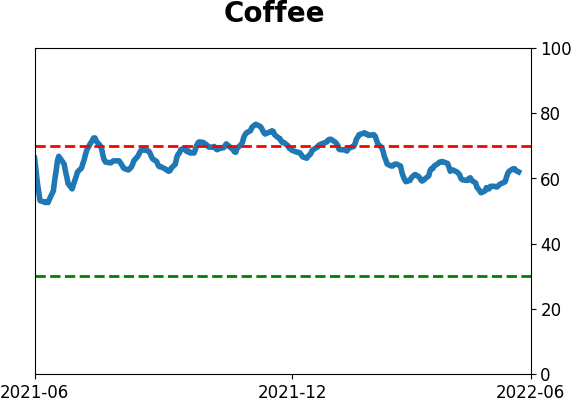
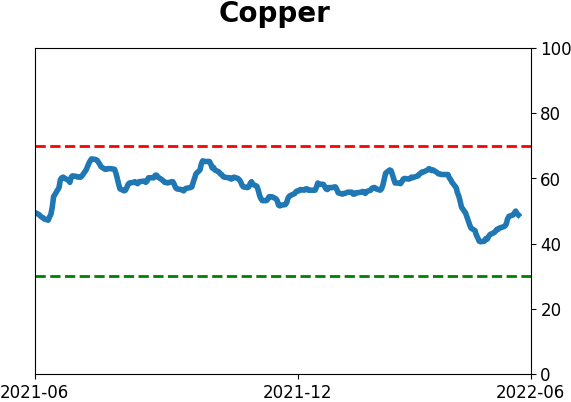
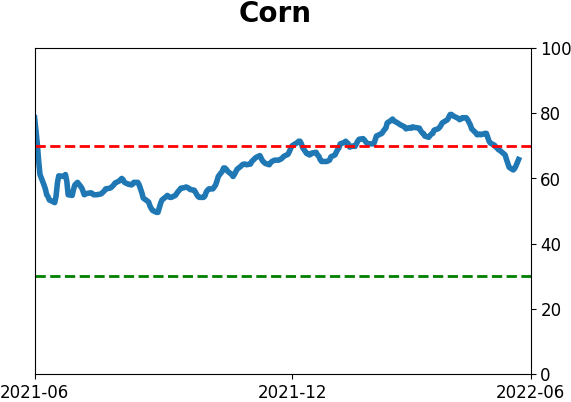
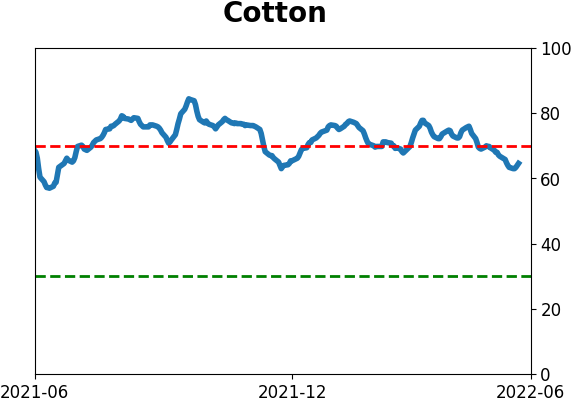
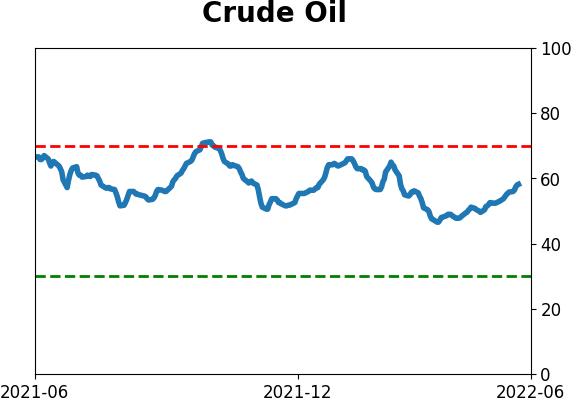
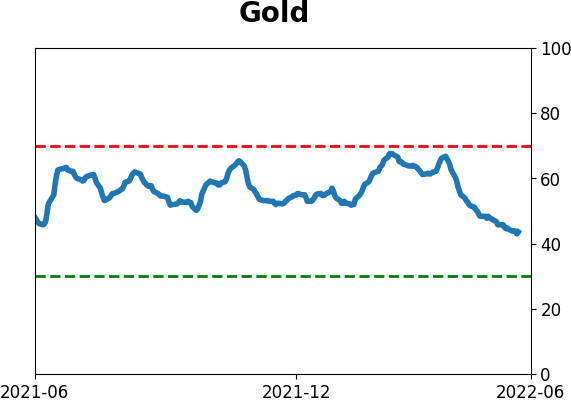
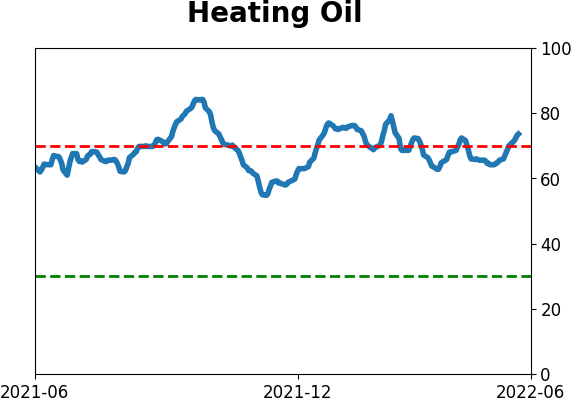
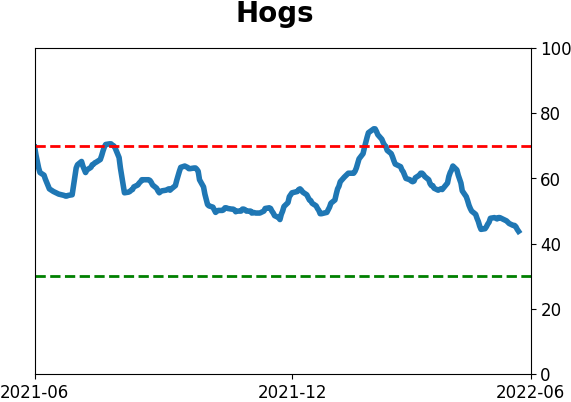
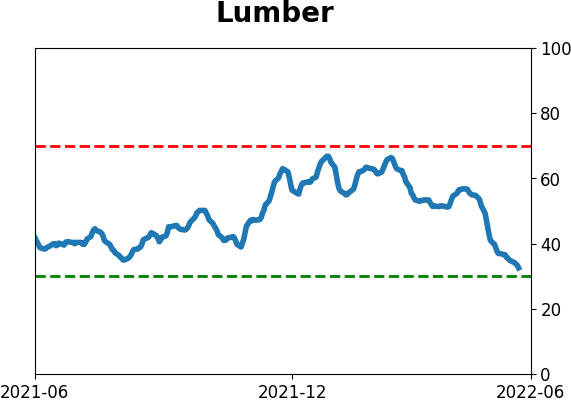
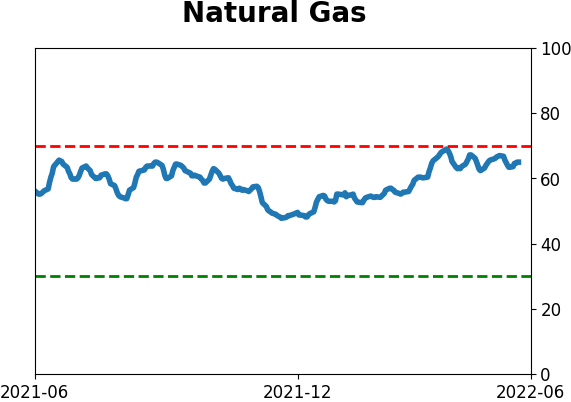
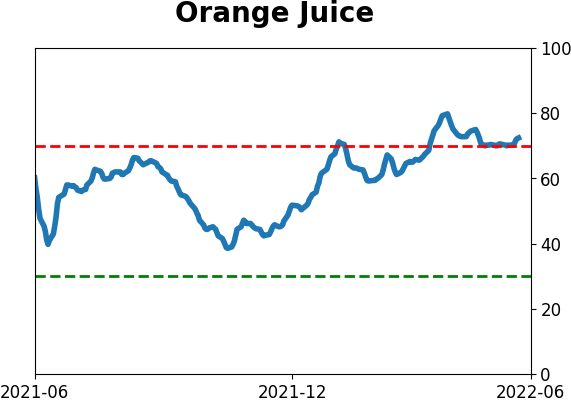
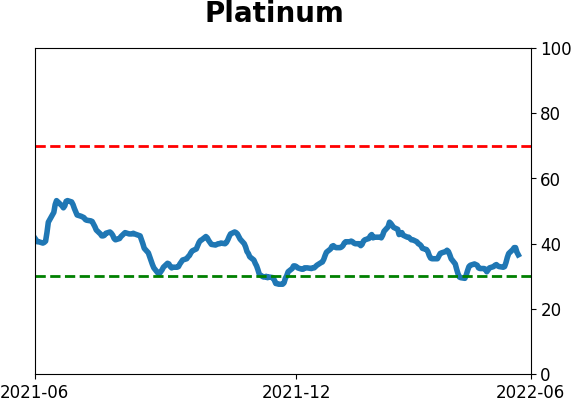
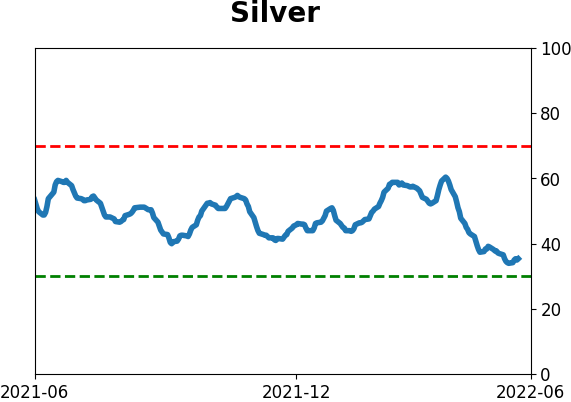
Optimism Index Thumbnails
|
|
|
|
|
|
|
|
|
|
|
|
|
|
|
|
|
|
|
|
|