Headlines
|
|
What it Means When Global Markets Are Outpacing the U.S.:
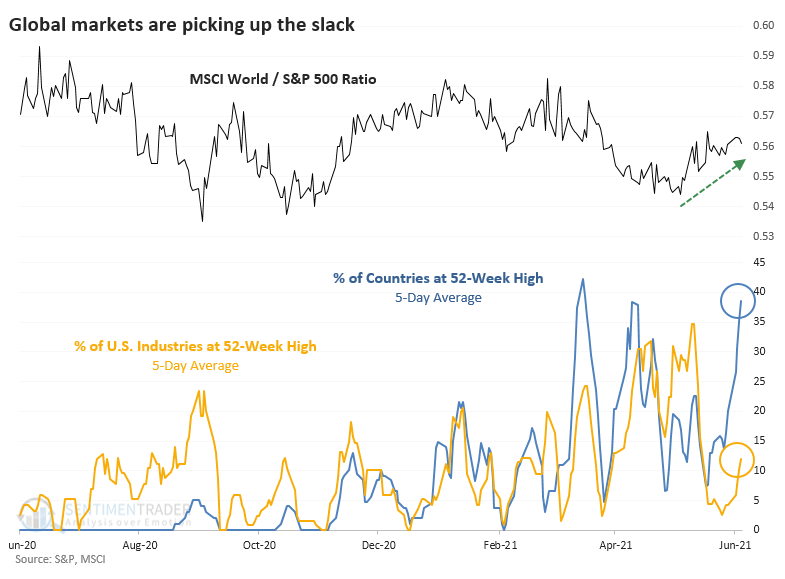
In recent weeks, there has been a surge in global equity indexes hitting 52-week highs. At the same time, there are fewer U.S. industries also reaching 52-week highs. When there are spreads like this, it has been a good sign for the MSCI World Index relative to the S&P 500.
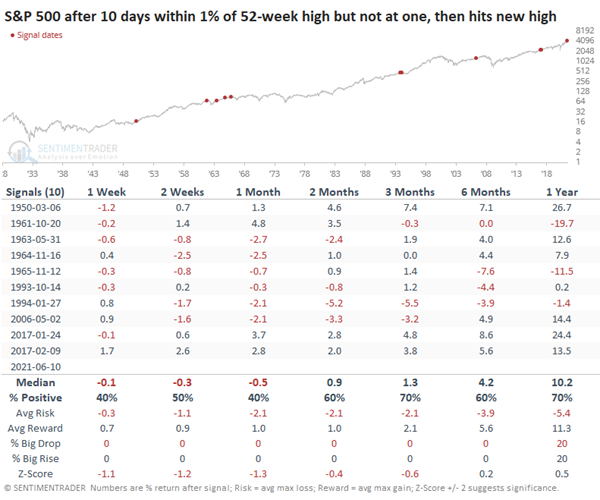
Breakout!: After going 10 days without setting a new high, but still closing within 1% of one, buyers finally managed to show enough interest to break the logjam. Interestingly, the S&P's returns in the short-term were worse when it broke out to the upside than when it broke down. Of the 5 times it broke its range to the downside, it rallied over the next month 5 out of 6 times. When it broke out to a new high, like now, it rallied 4 out of 10 times.
Bottom Line:
See the Outlook & Allocations page for more details on these summaries STOCKS: Hold
The speculative frenzy in February is wrung out. Internal dynamics have mostly held up, with some exceptions. Many of our studies still show a mixed to poor short-term view, with medium- and long-term ones turning more positive. BONDS: Hold
Various parts of the market got hit in March, with the lowest Bond Optimism Index we usually see during healthy environments. After a shaky couple of weeks, the broad bond market has modestly recovered. Not a big edge here either way. GOLD: Hold
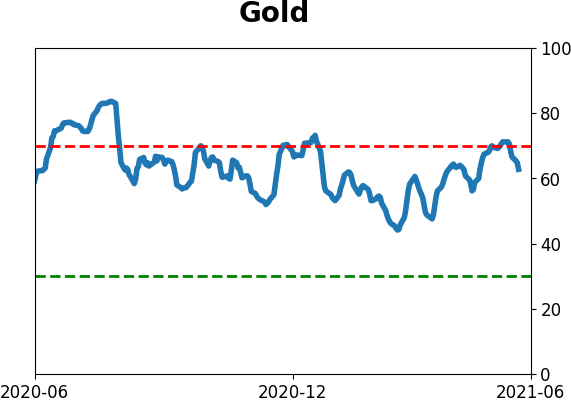
Gold and miners have done very well, recovering above long-term trend lines. The issue is that both have tended to perform poorly after similar situations - will have to wait and see how it plays out.
|
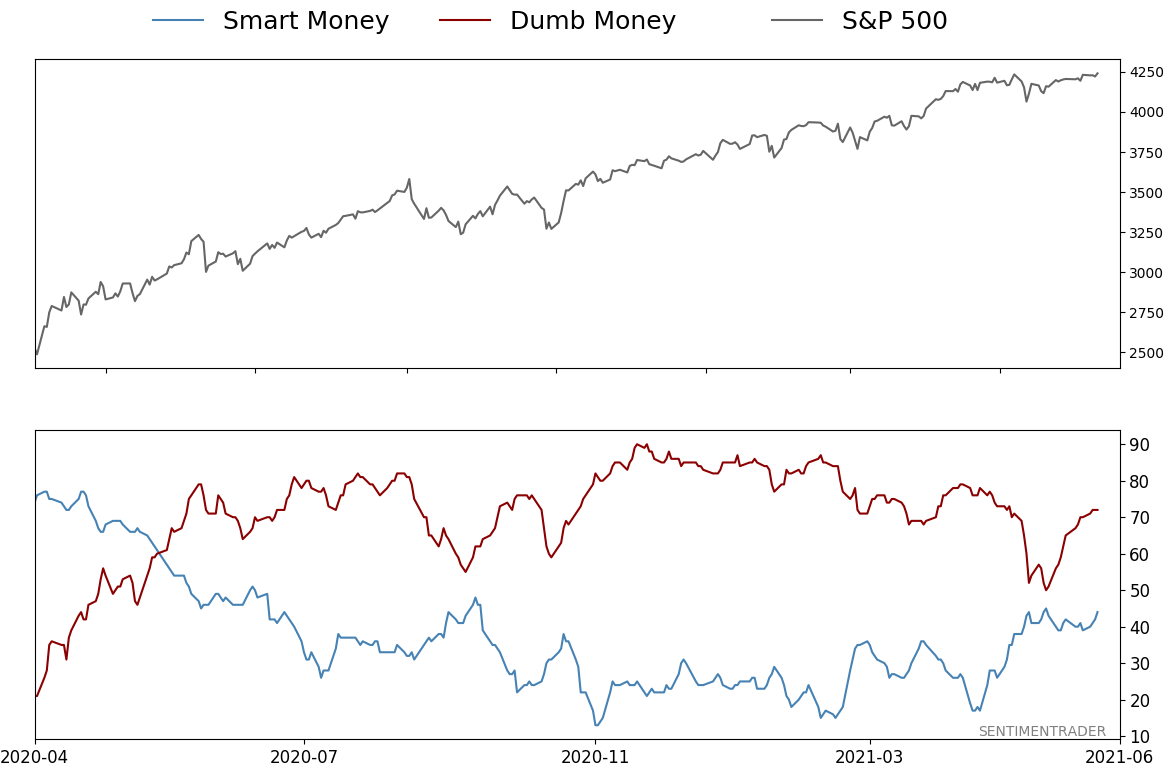
Smart / Dumb Money Confidence
|
Smart Money Confidence: 44%
Dumb Money Confidence: 72%
|
|
Risk Levels
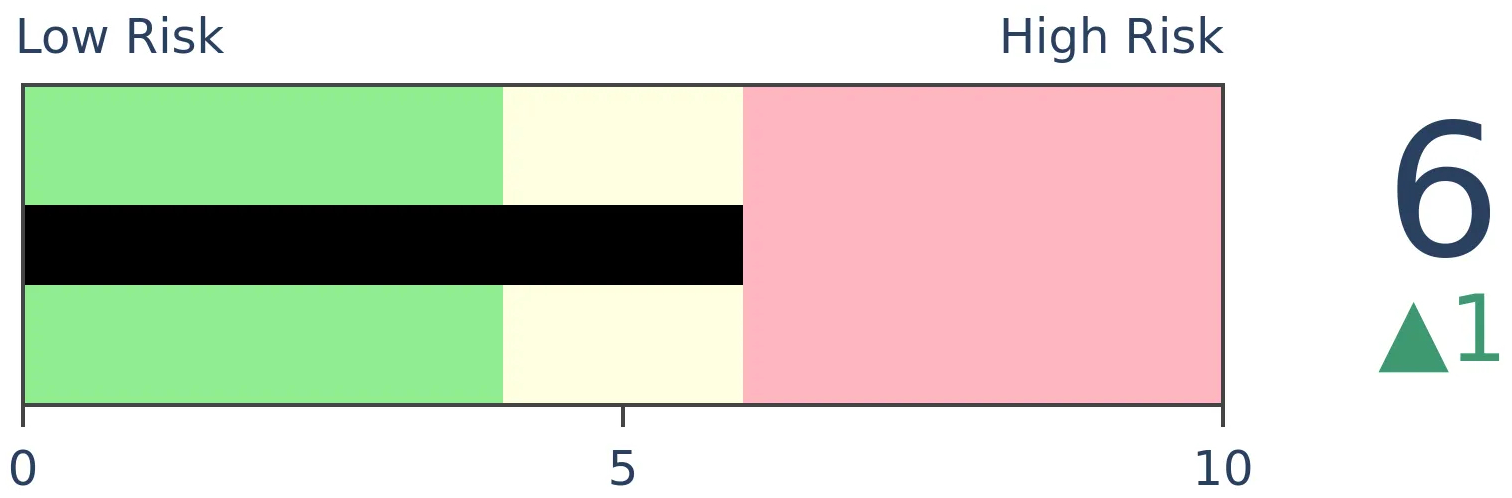
Stocks Short-Term
|
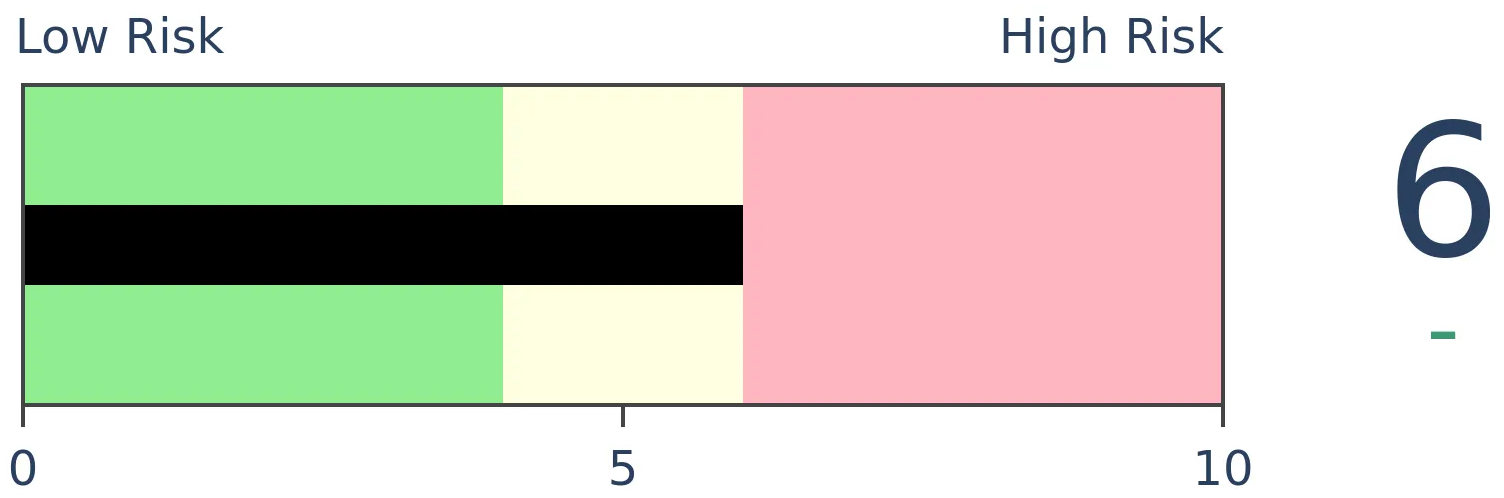
Stocks Medium-Term
|
|
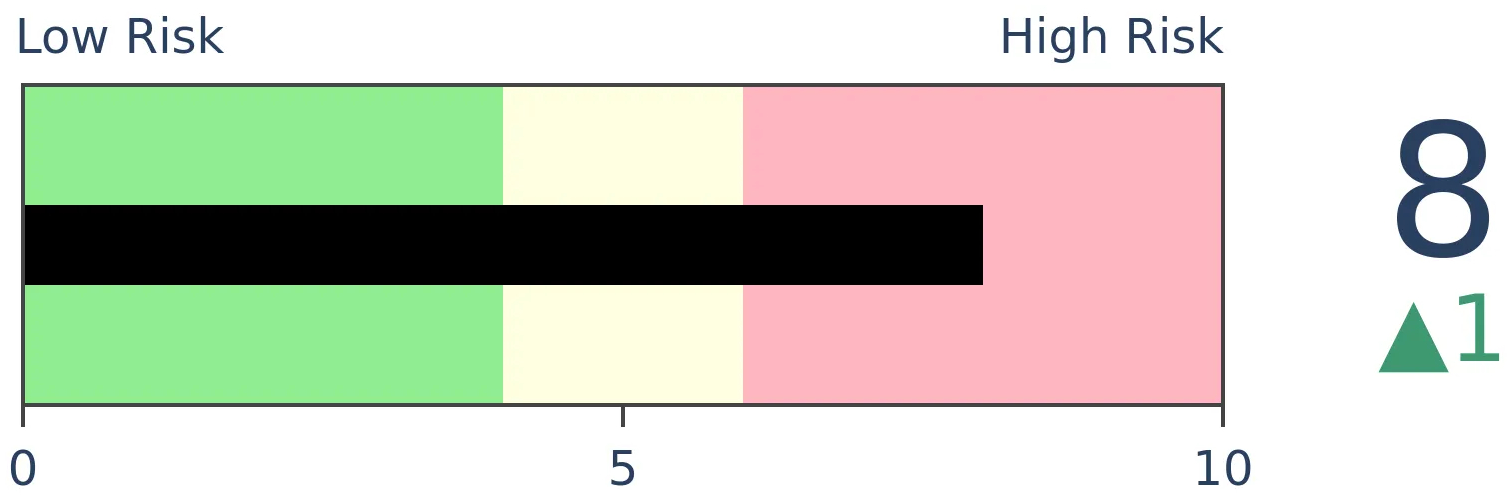
Bonds
|
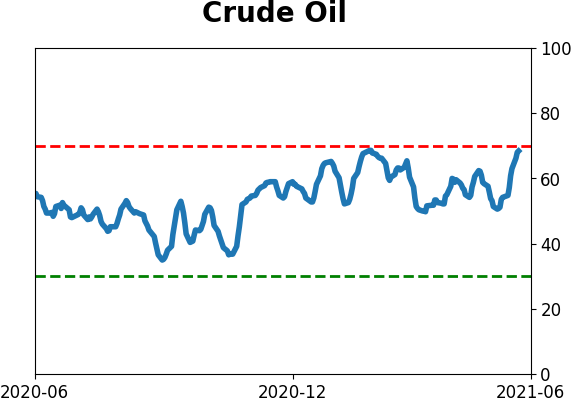
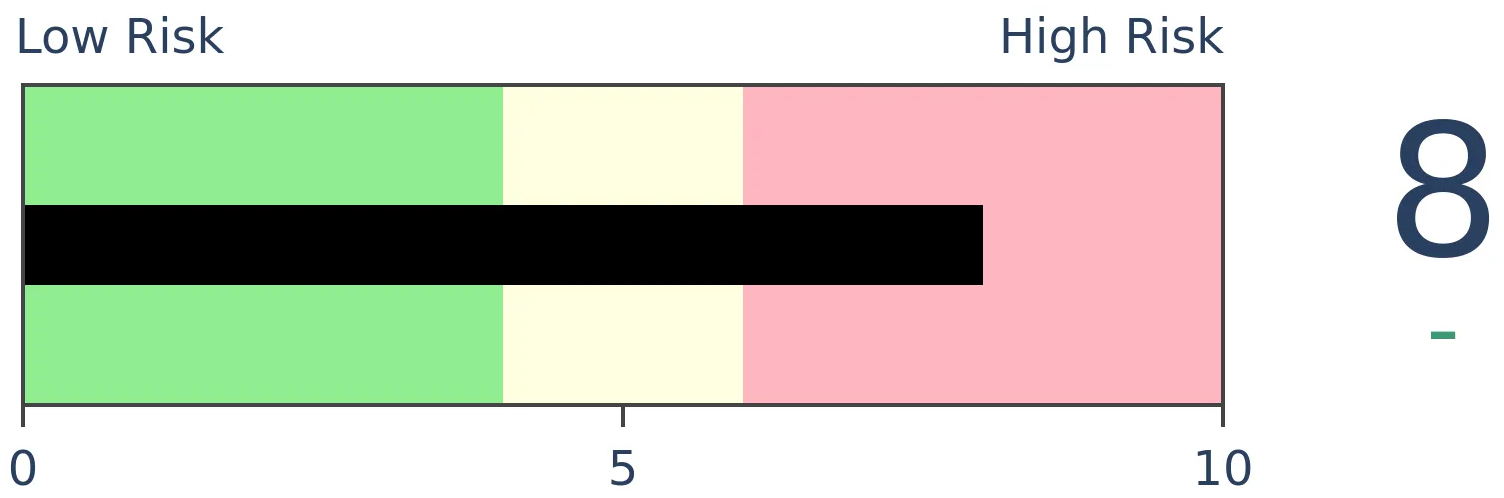
Crude Oil
|
|
Gold
|
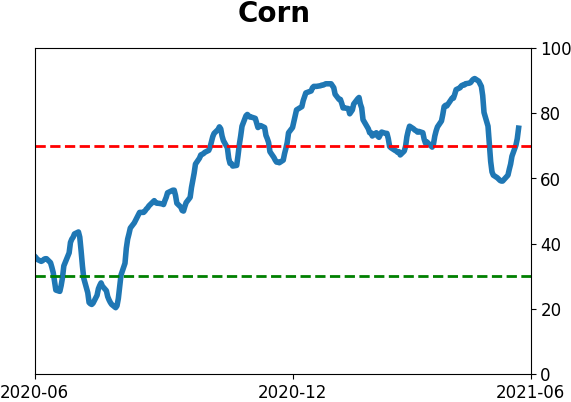
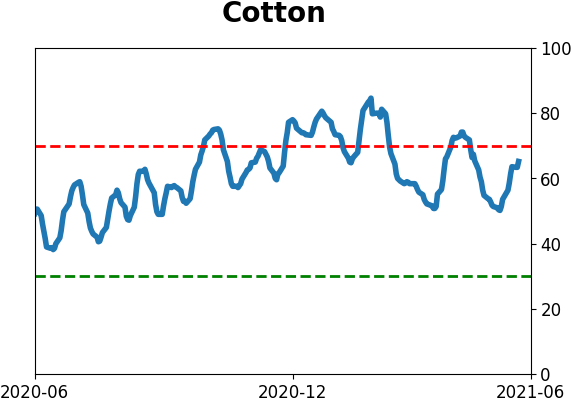
Agriculture

|
|
Research
BOTTOM LINE
In recent weeks, there has been a surge in global equity indexes hitting 52-week highs. At the same time, there are fewer U.S. industries also reaching 52-week highs. When there are spreads like this, it has been a good sign for the MSCI World Index relative to the S&P 500.
FORECAST / TIMEFRAME
None
|
Global markets are picking up, and many of them have been hitting new highs.
Dean has noted a pickup in absolute and relative trends in many global markets, and several developing markets have been triggering internal breadth thrusts. The momentum has been enough to push 30% or more of global indexes to fresh highs in recent weeks.
This is interesting because the percentage of developed countries at a 52-week high has greatly exceeded the percentage of U.S. industries at a new high, as pointed out by Willie Delwiche. This is a stark change from last summer when there were many more U.S. industries at new highs than overseas indexes. This is consistent with some stagnation among stocks within the S&P 500.
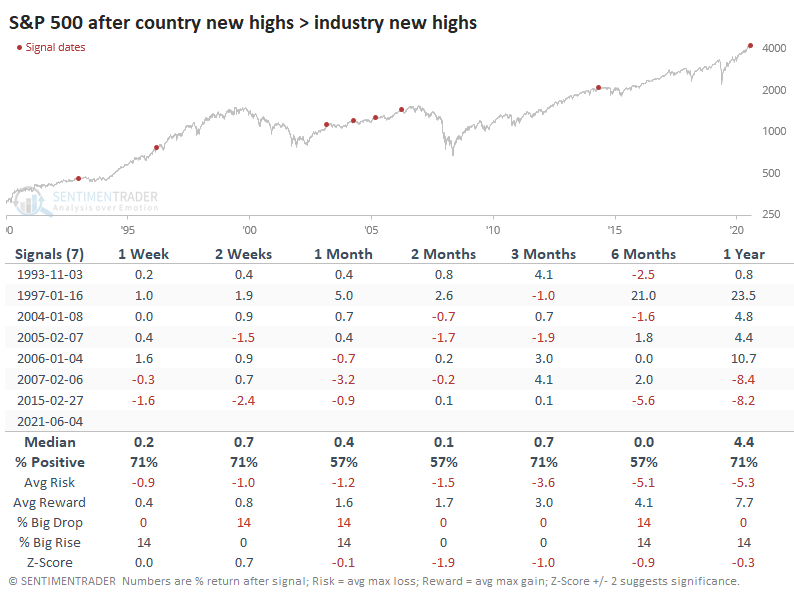
RETURNS AFTER COUNTRIES LEAD INDUSTRIES
It's not like scenarios like this were a bad sign for the S&P 500 going forward. On the contrary, it usually rose, or if it lost ground, those losses were minor.
This was a better sign for world markets over the medium-term. The MSCI World Index (excluding the United States) showed some short-term weakness but consistently rose over the next 2-6 months.
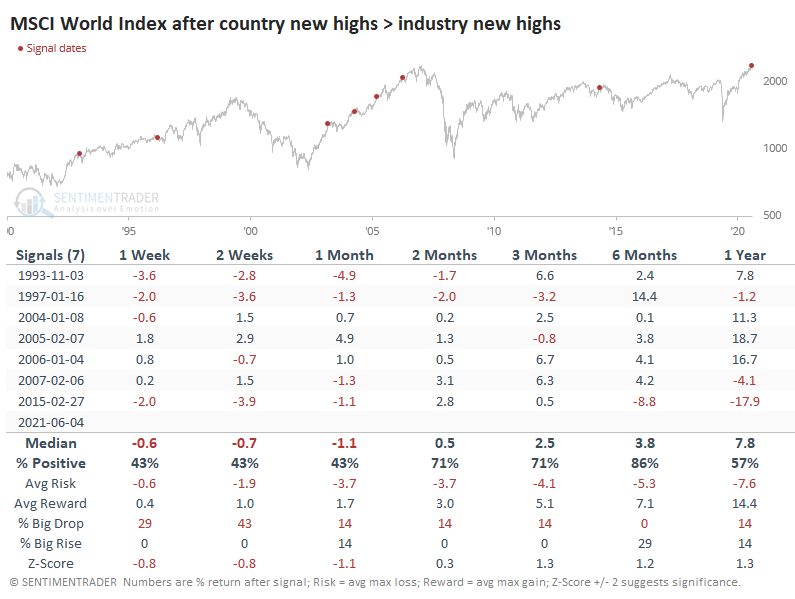
A RELATIVELY GOOD SIGN FOR OVERSEAS
This means that the ratio between the two indexes tended to fall back in the short-term, then rise over the medium-term. There was only one loss over the next three months. That one was a complete failure.
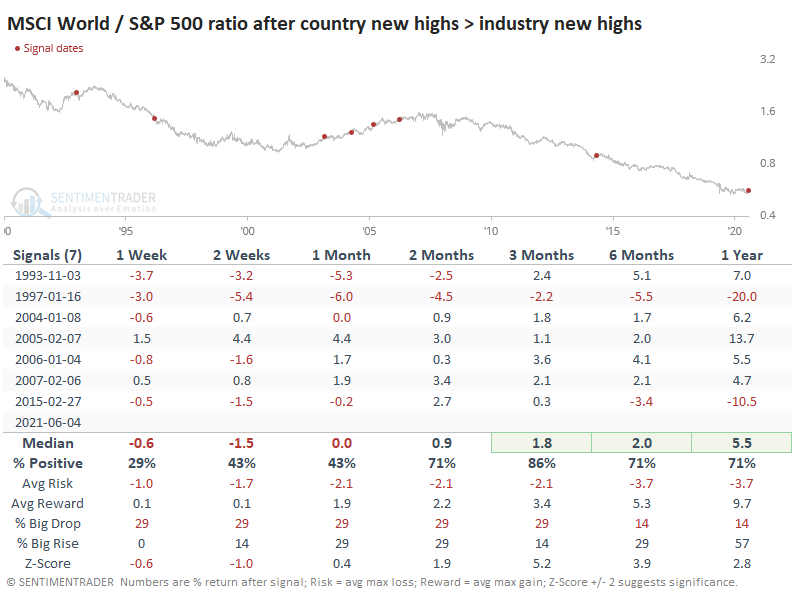
As Dean has pointed out repeatedly, signs like this tend to keep going. Many overseas markets are seeing thrusts, or at least positive trends both in an absolute sense and relative to the S&P 500. It's not a sure thing, but it is a decent sign suggesting that there are better places to look for equity exposure than the usual go-to indexes like the S&P 500.
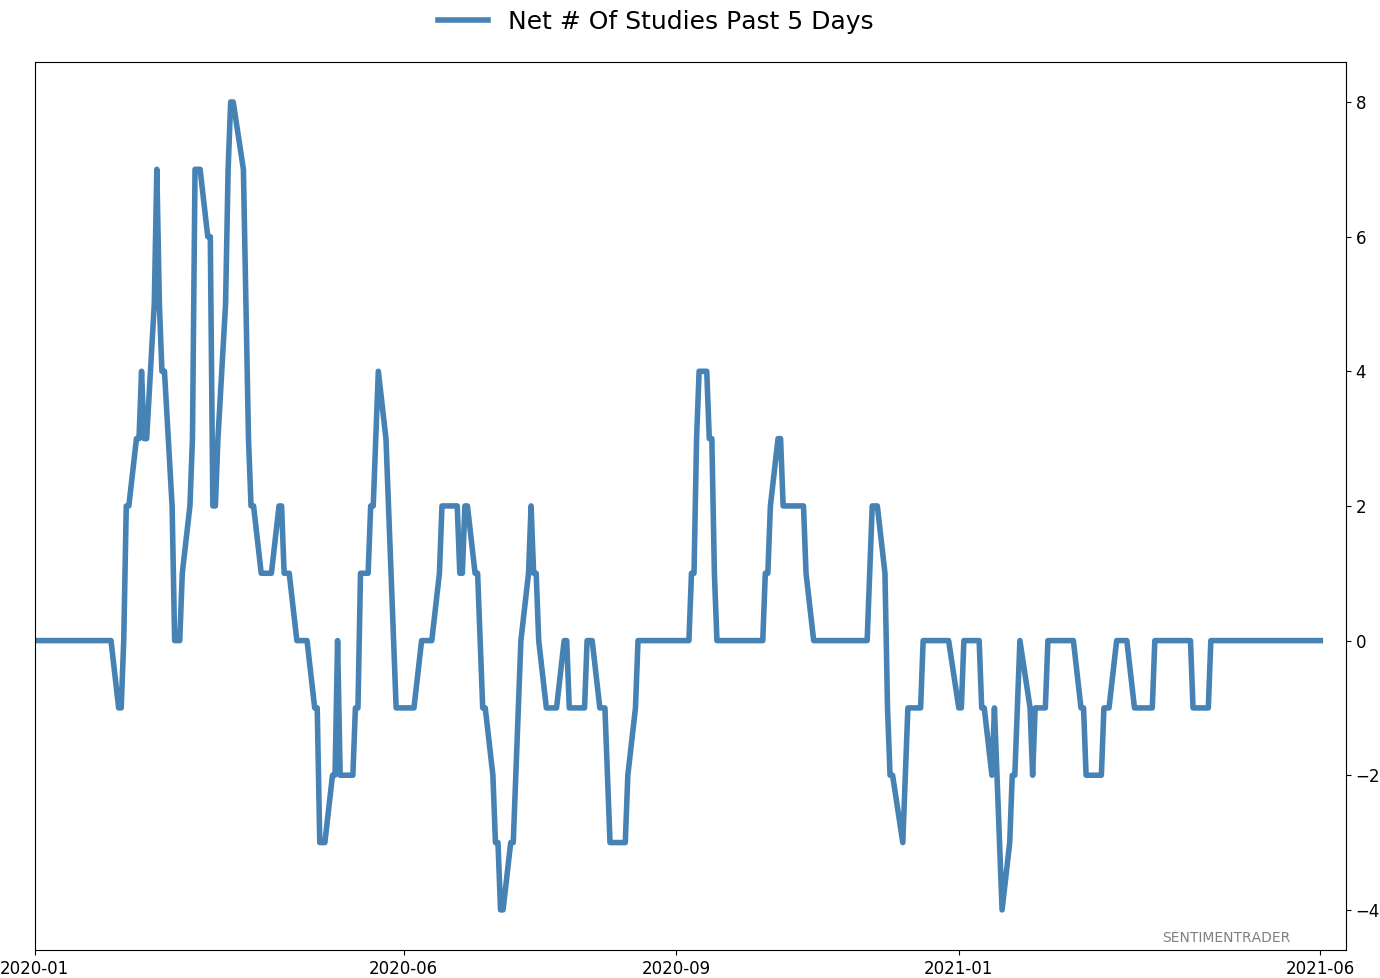
Active Studies
| Time Frame | Bullish | Bearish | | Short-Term | 0 | 0 | | Medium-Term | 2 | 12 | | Long-Term | 11 | 5 |
|
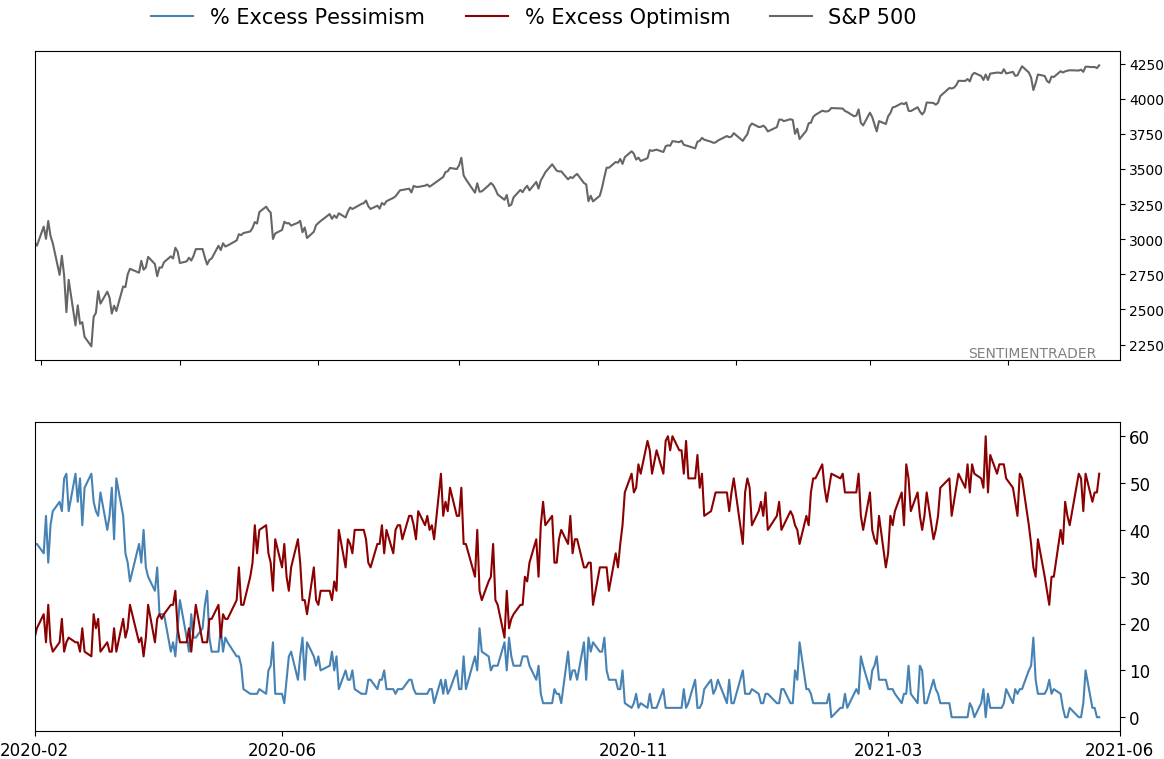
Indicators at Extremes
|
% Showing Pessimism: 0%
Bullish for Stocks
|
|
Portfolio
| Position | Description | Weight % | Added / Reduced | Date | | Stocks | RSP | 4.1 | Added 4.1% | 2021-05-19 | | Bonds | 23.9% BND, 6.9% SCHP | 30.7 | Reduced 7.1% | 2021-05-19 | | Commodities | GCC | 2.6 | Reduced 2.1%
| 2020-09-04 | | Precious Metals | GDX | 5.6 | Reduced 4.2% | 2021-05-19 | | Special Situations | 4.3% XLE, 2.2% PSCE | 7.6 | Reduced 5.6% | 2021-04-22 | | Cash | | 49.4 | | |
|
Updates (Changes made today are underlined)
Much of our momentum and trend work has remained positive for several months, with some scattered exceptions. Almost all sentiment-related work has shown a poor risk/reward ratio for stocks, especially as speculation drove to record highs in exuberance in February. Much of that has worn off, and most of our models are back toward neutral levels. There isn't much to be excited about here. The same goes for bonds and even gold. Gold has been performing well lately and is back above long-term trend lines. The issue is that it has a poor record of holding onto gains when attempting a long-term trend change like this, so we'll take a wait-and-see approach. RETURN YTD: 10.3% 2020: 8.1%, 2019: 12.6%, 2018: 0.6%, 2017: 3.8%, 2016: 17.1%, 2015: 9.2%, 2014: 14.5%, 2013: 2.2%, 2012: 10.8%, 2011: 16.5%, 2010: 15.3%, 2009: 23.9%, 2008: 16.2%, 2007: 7.8%
|
|
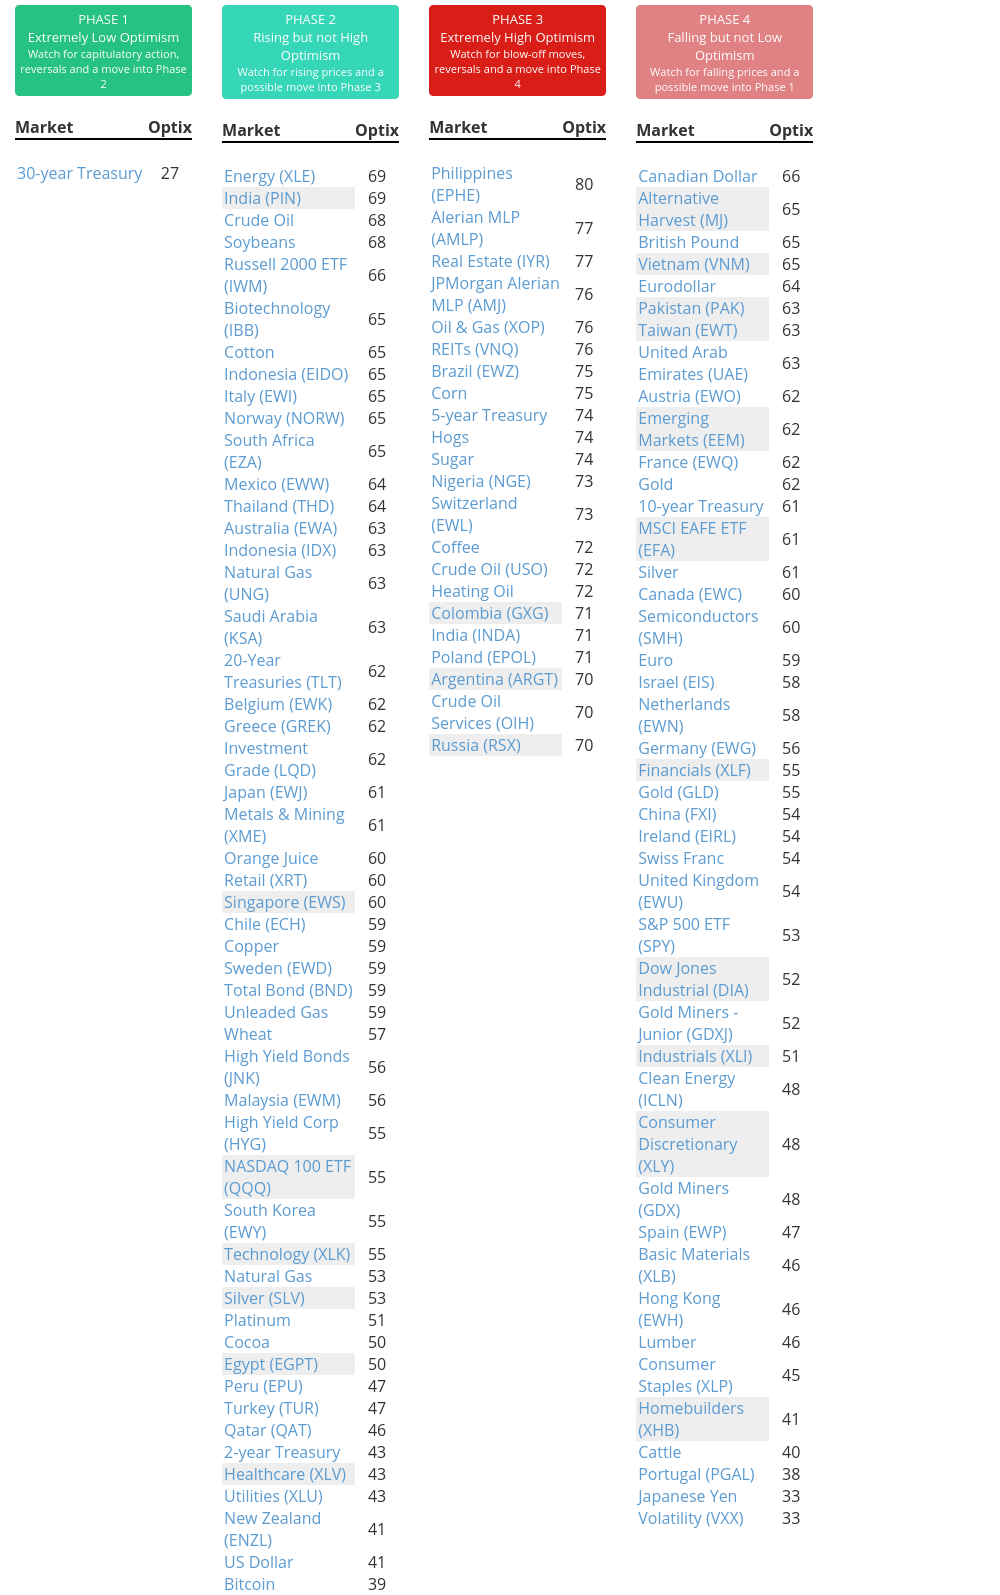
Phase Table
Ranks
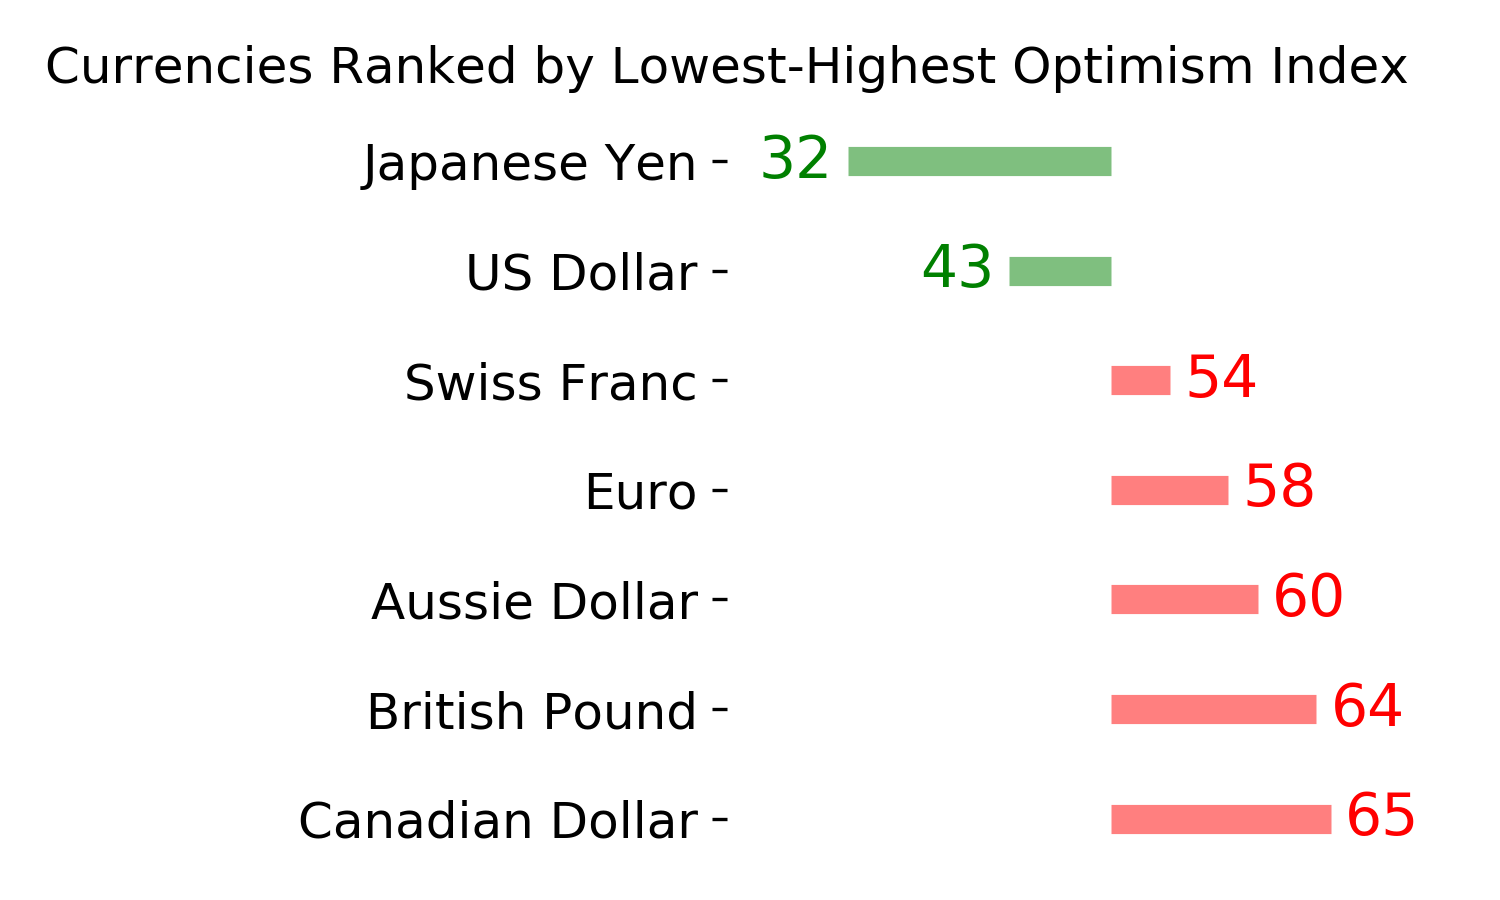
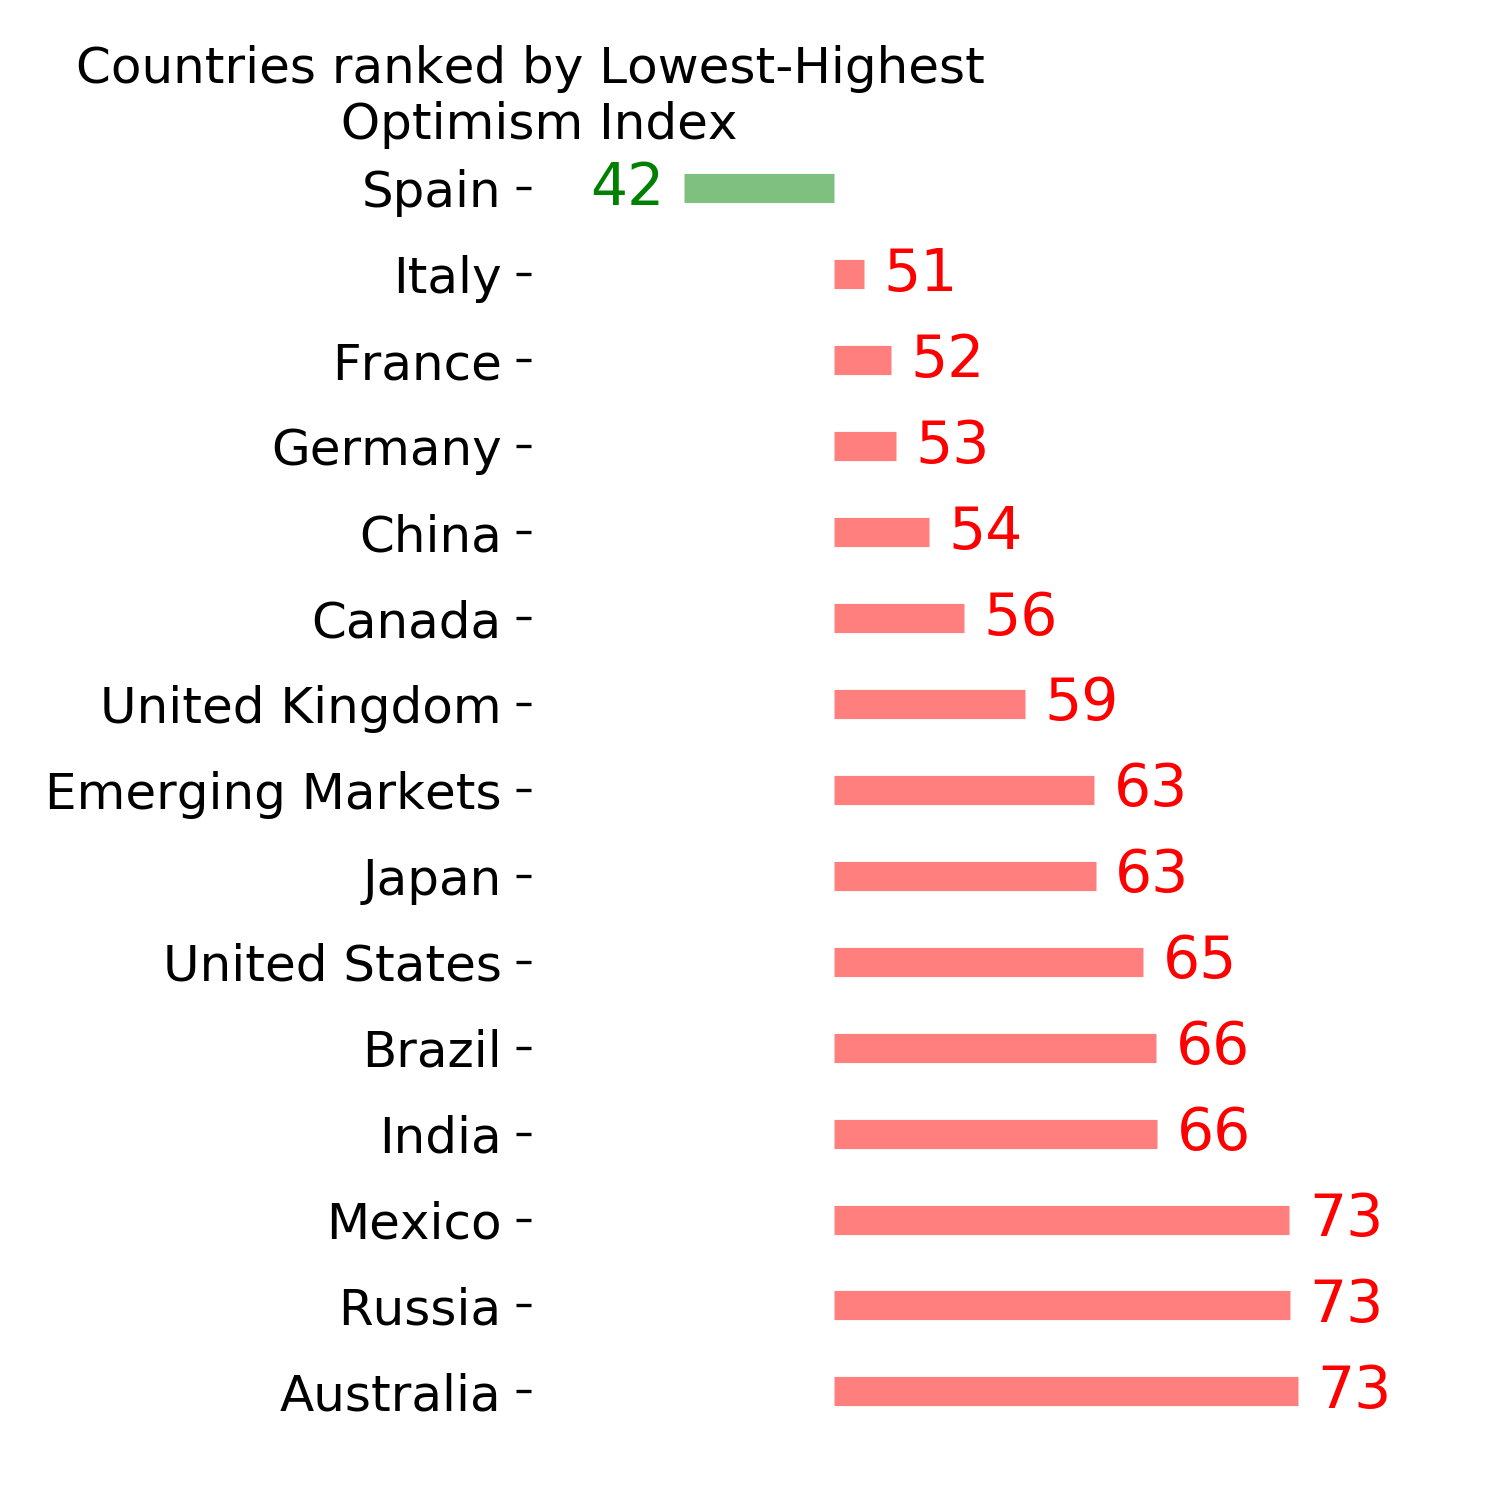
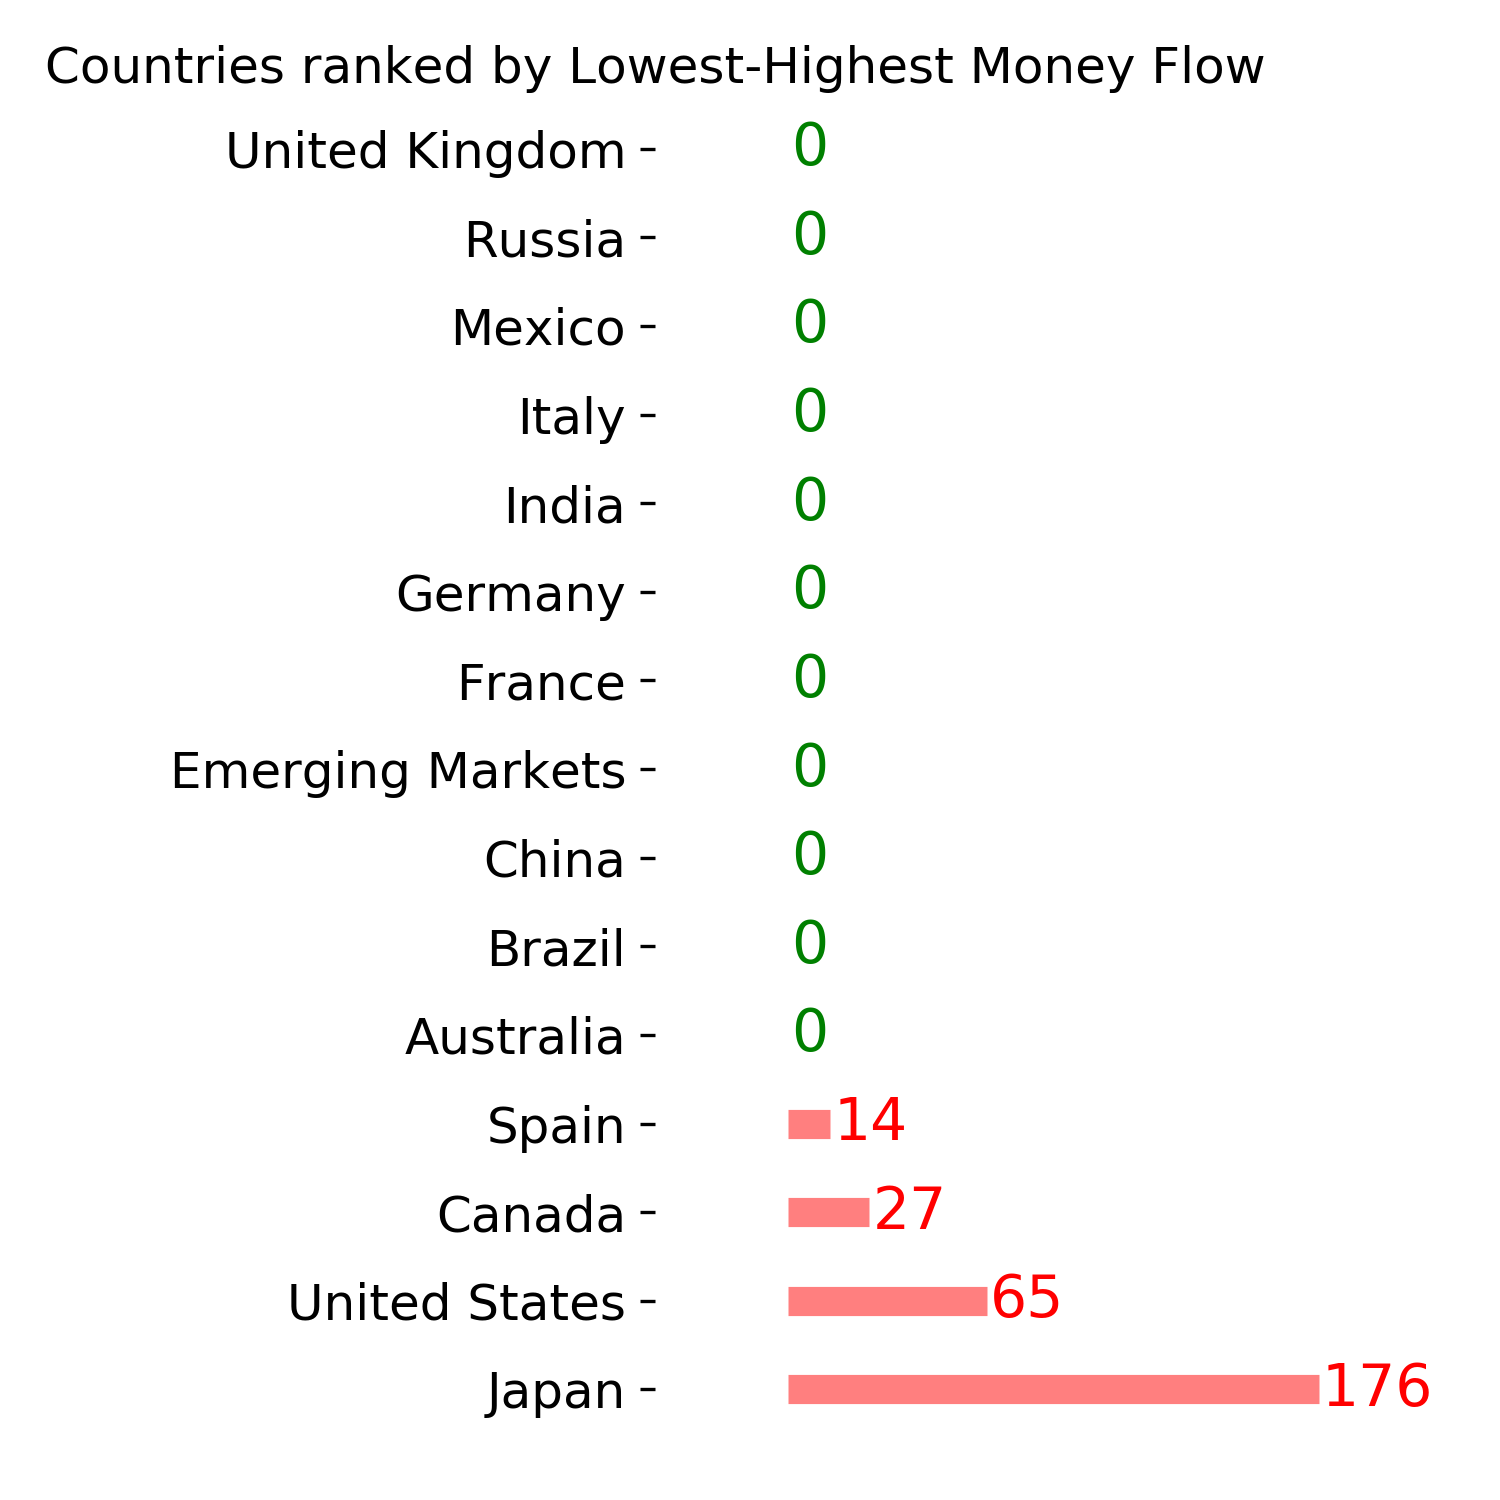
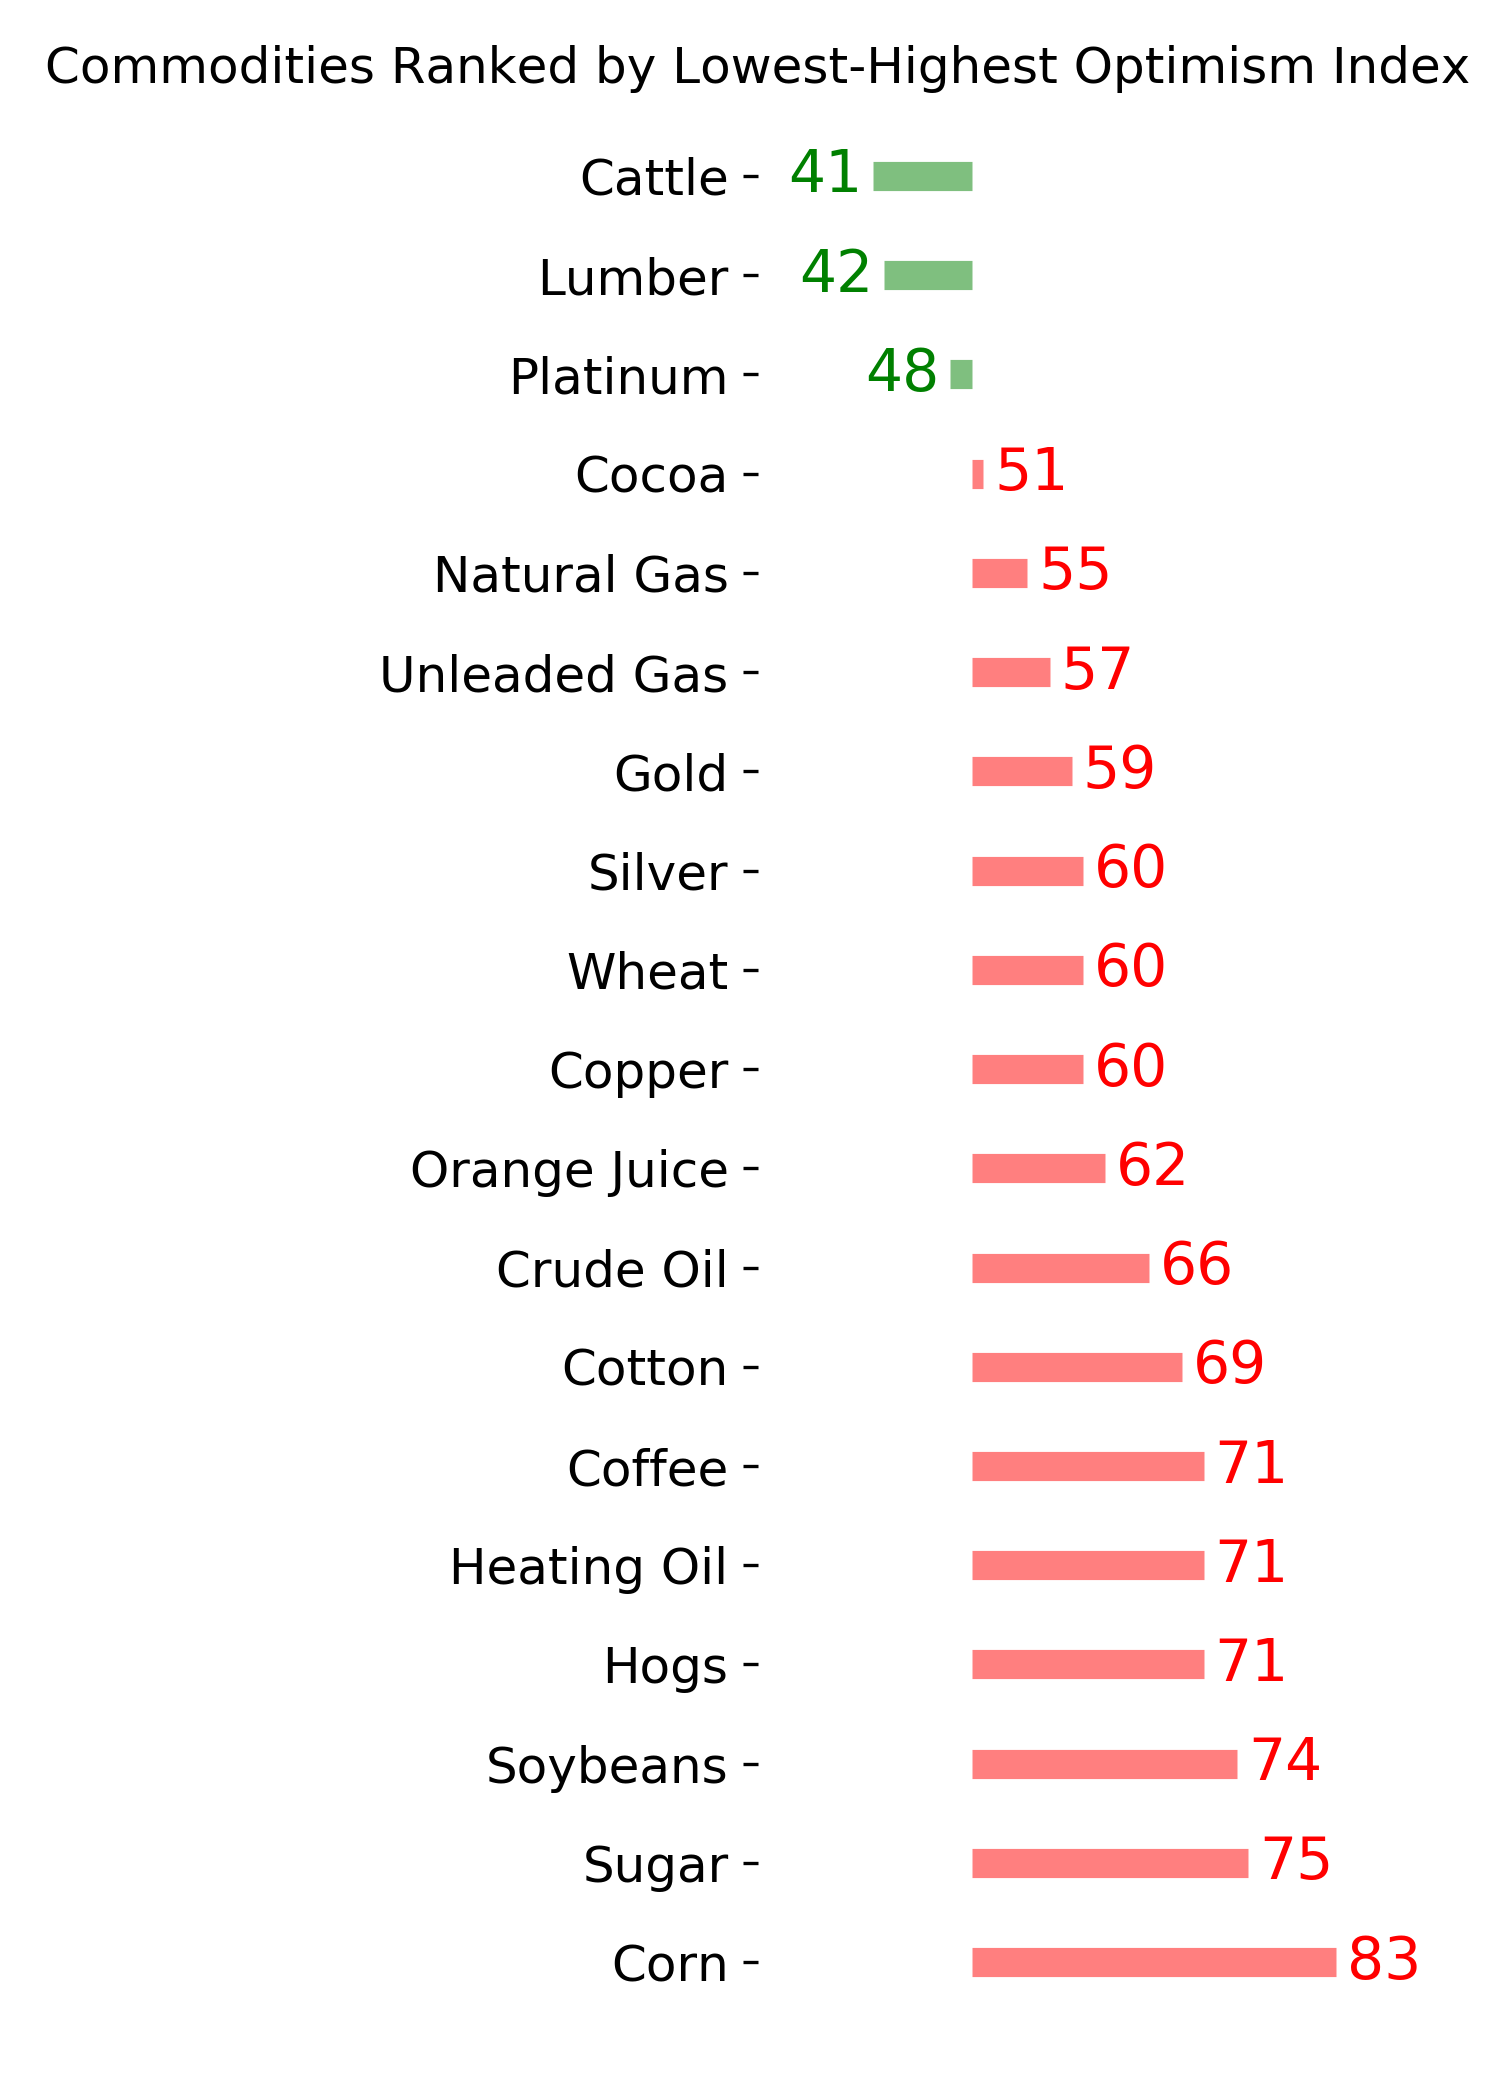
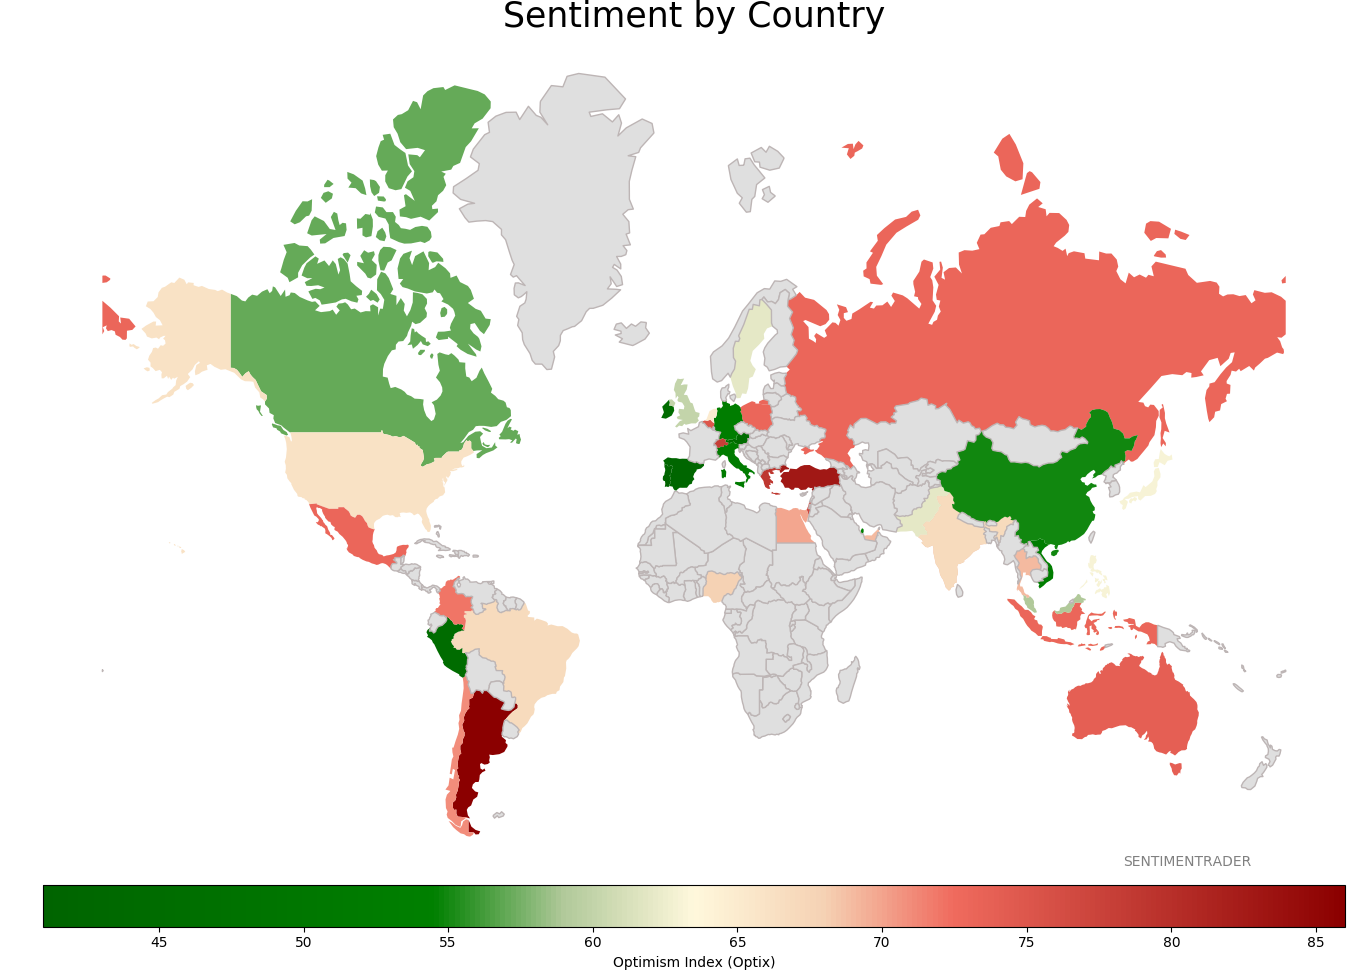
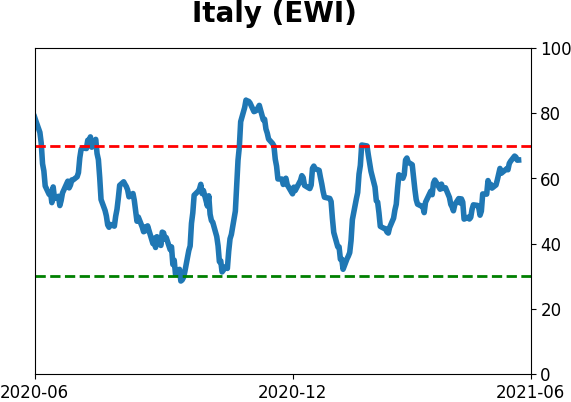
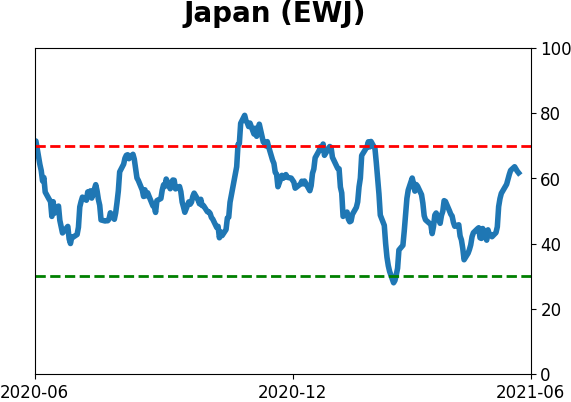
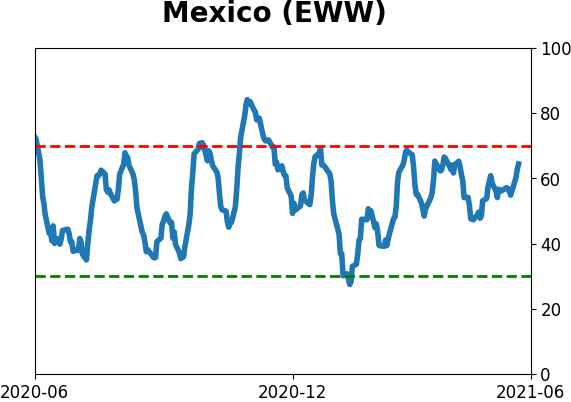
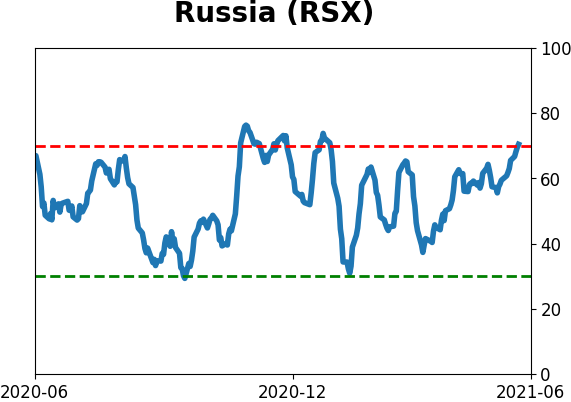
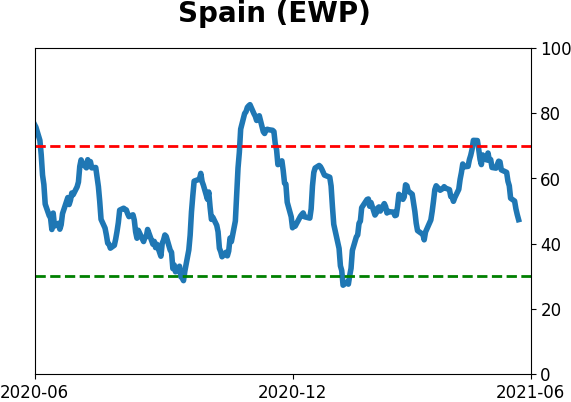
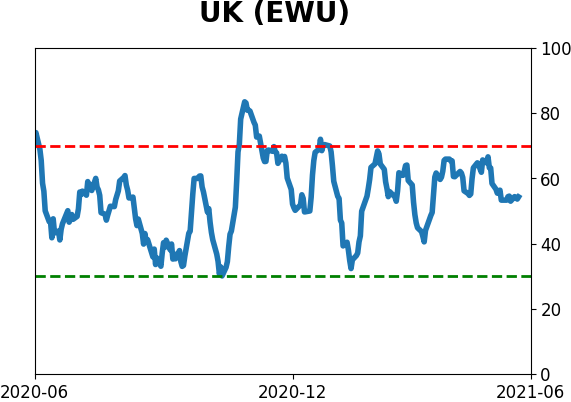
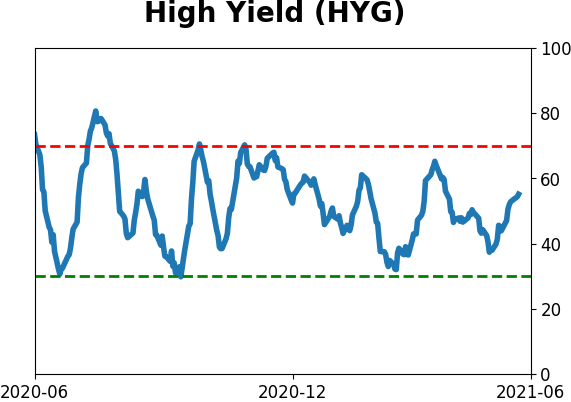
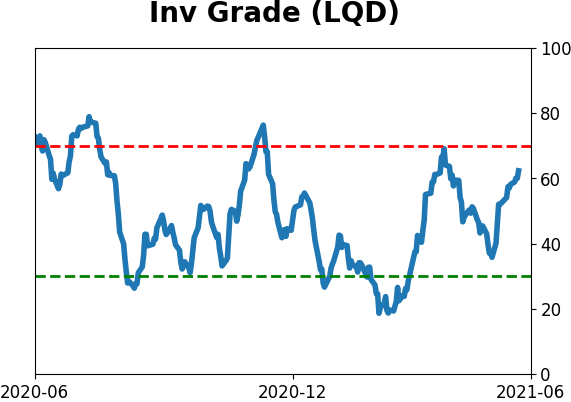
Sentiment Around The World
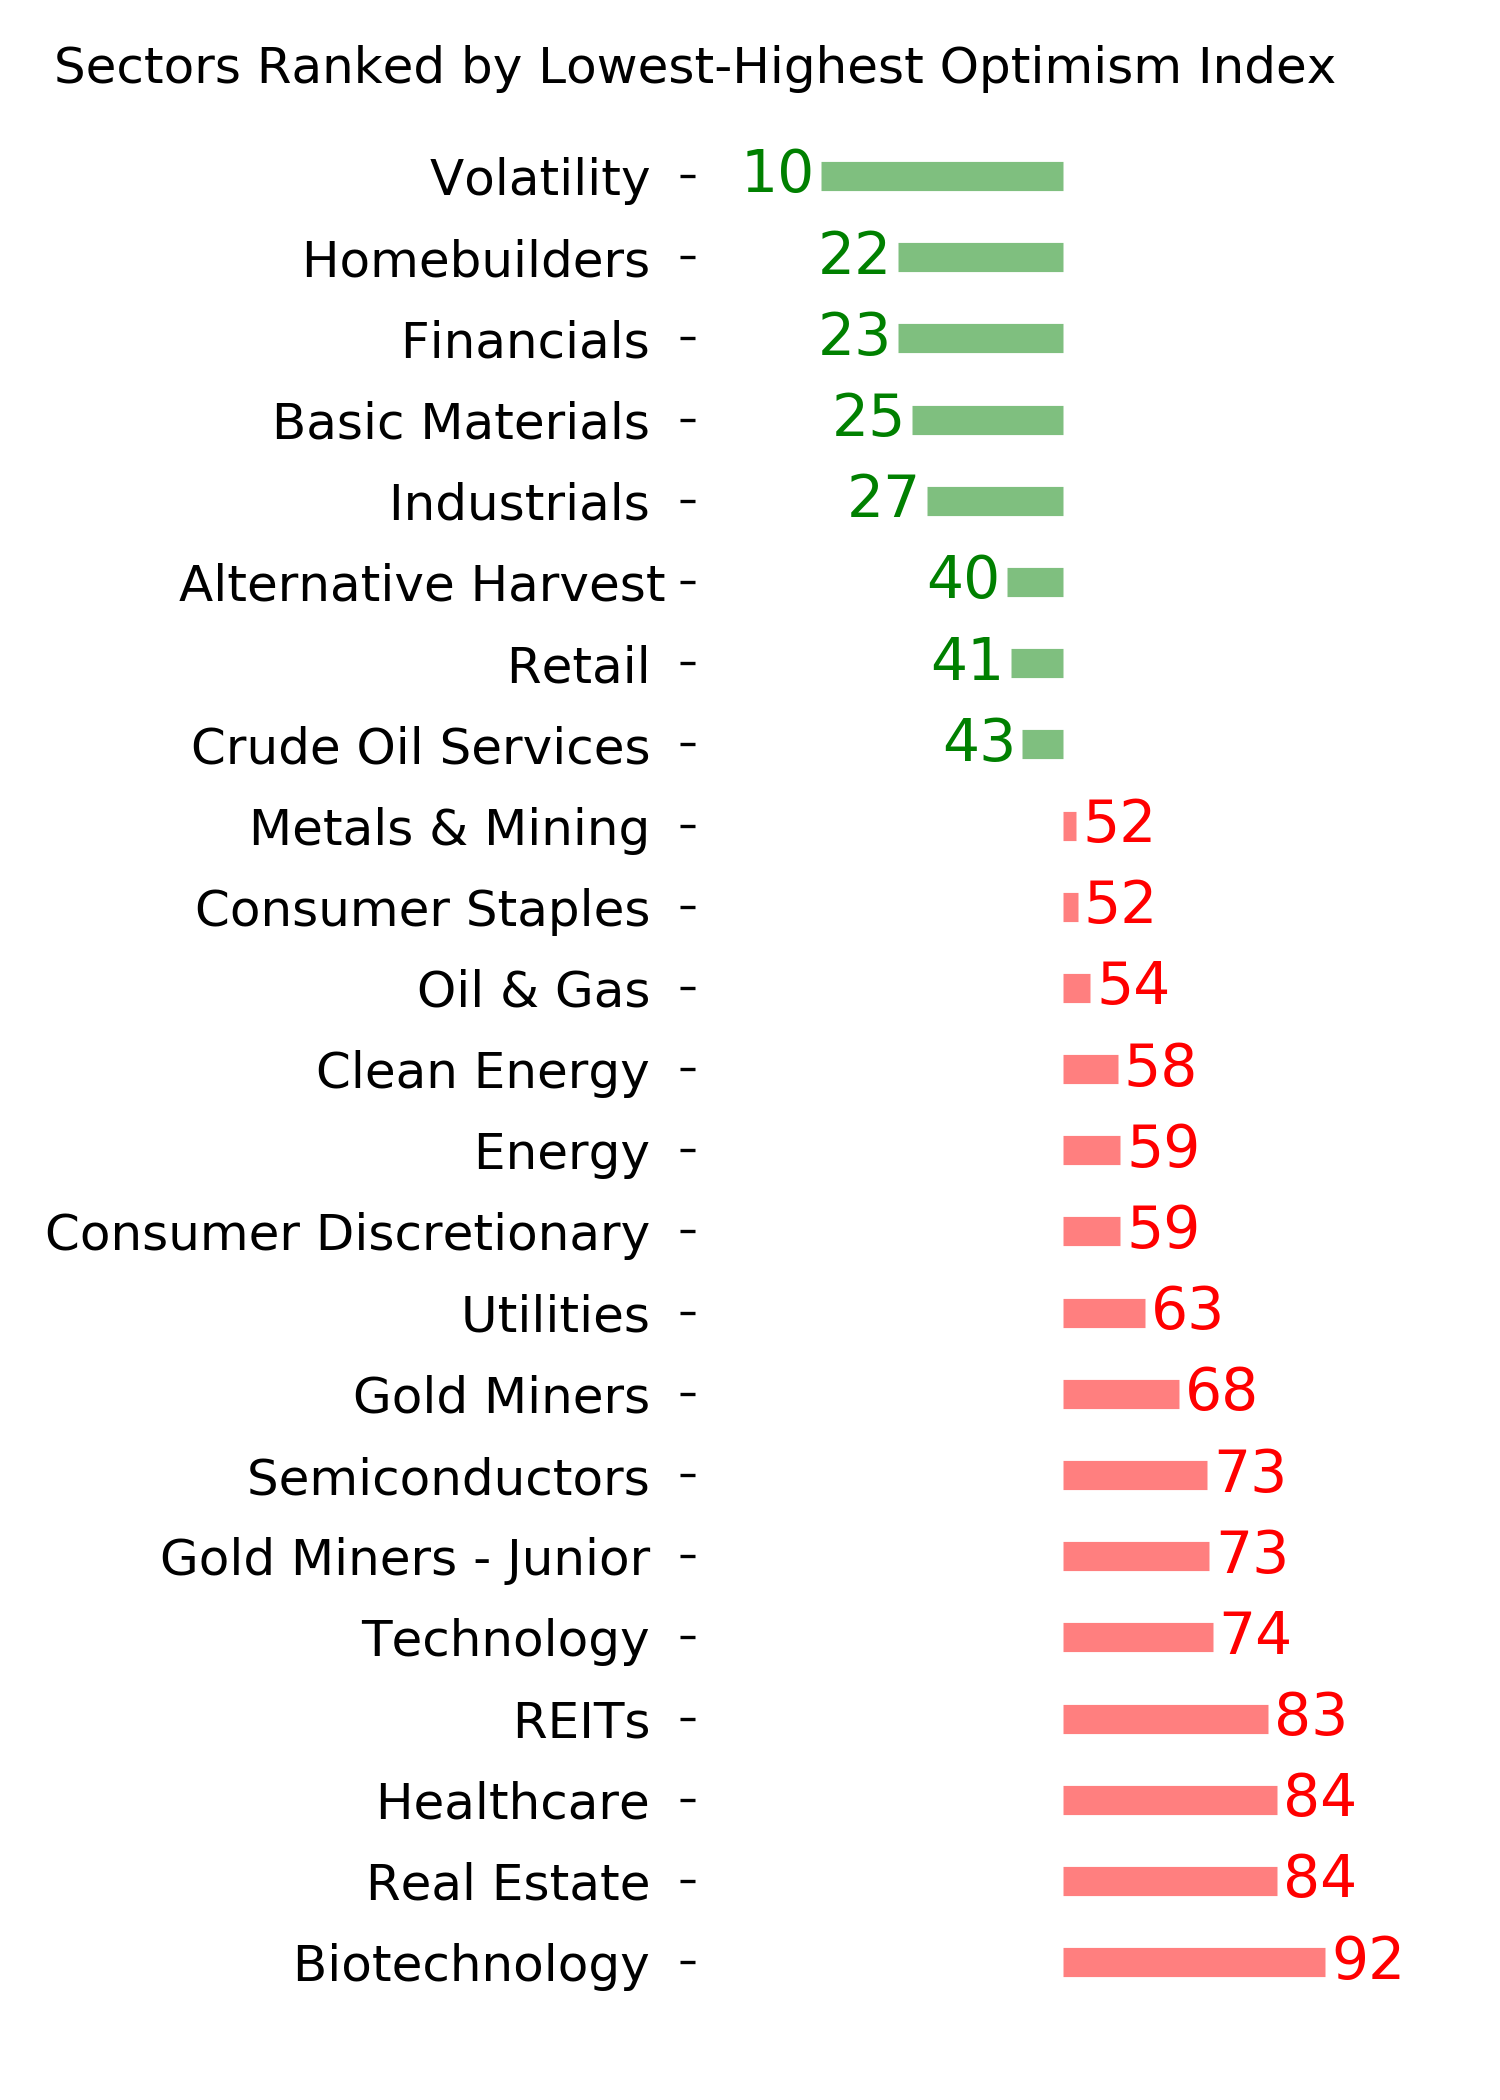
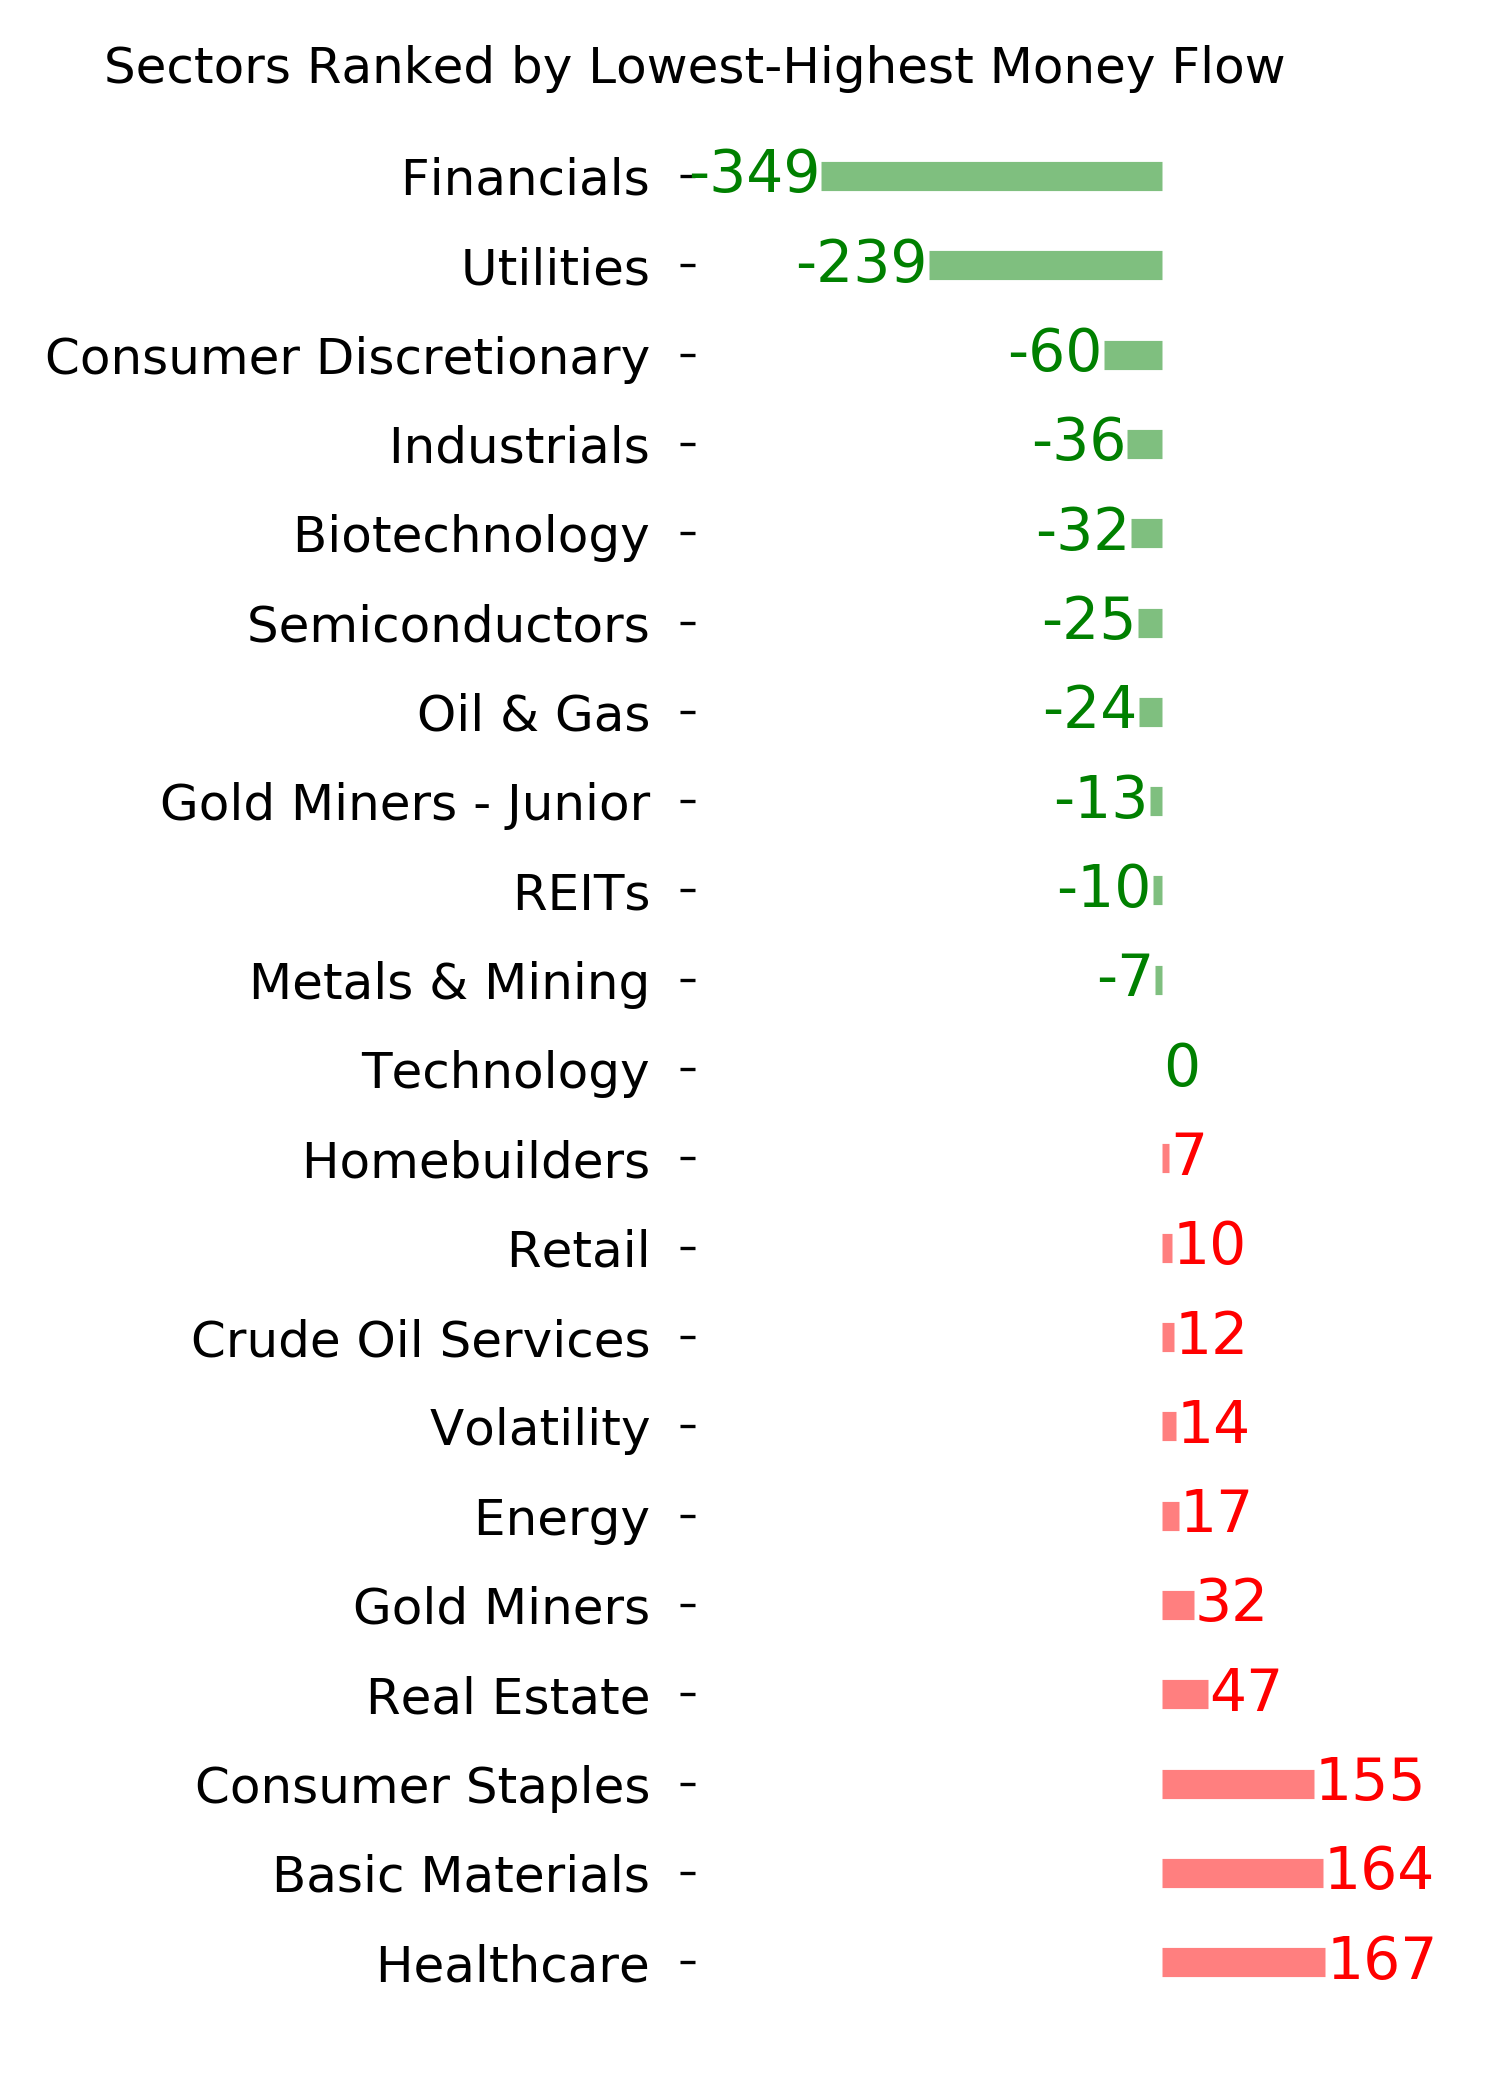
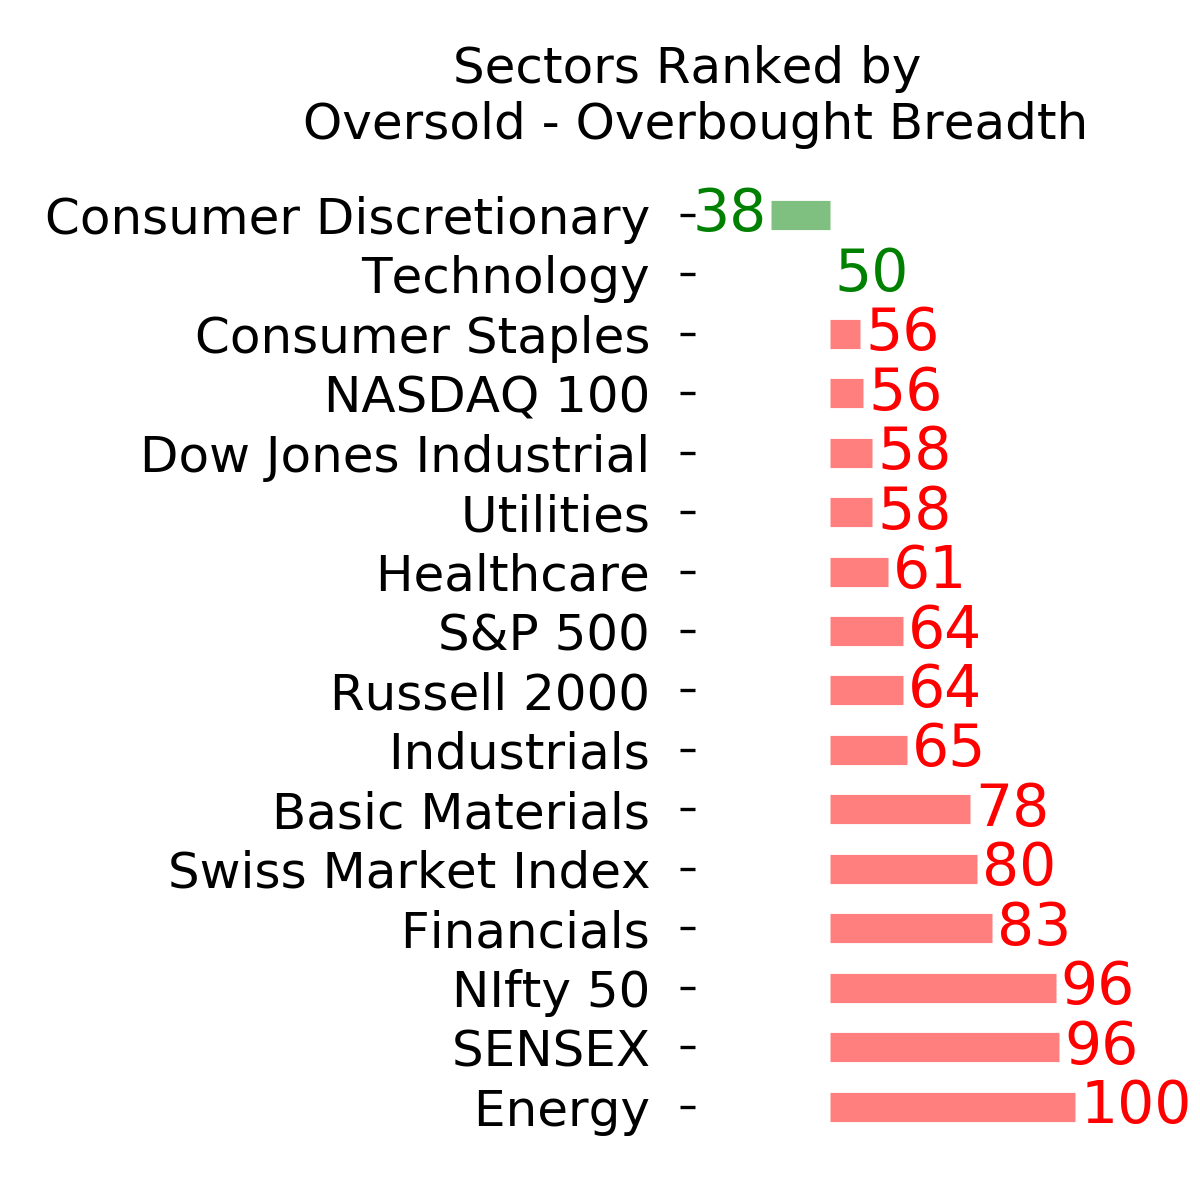
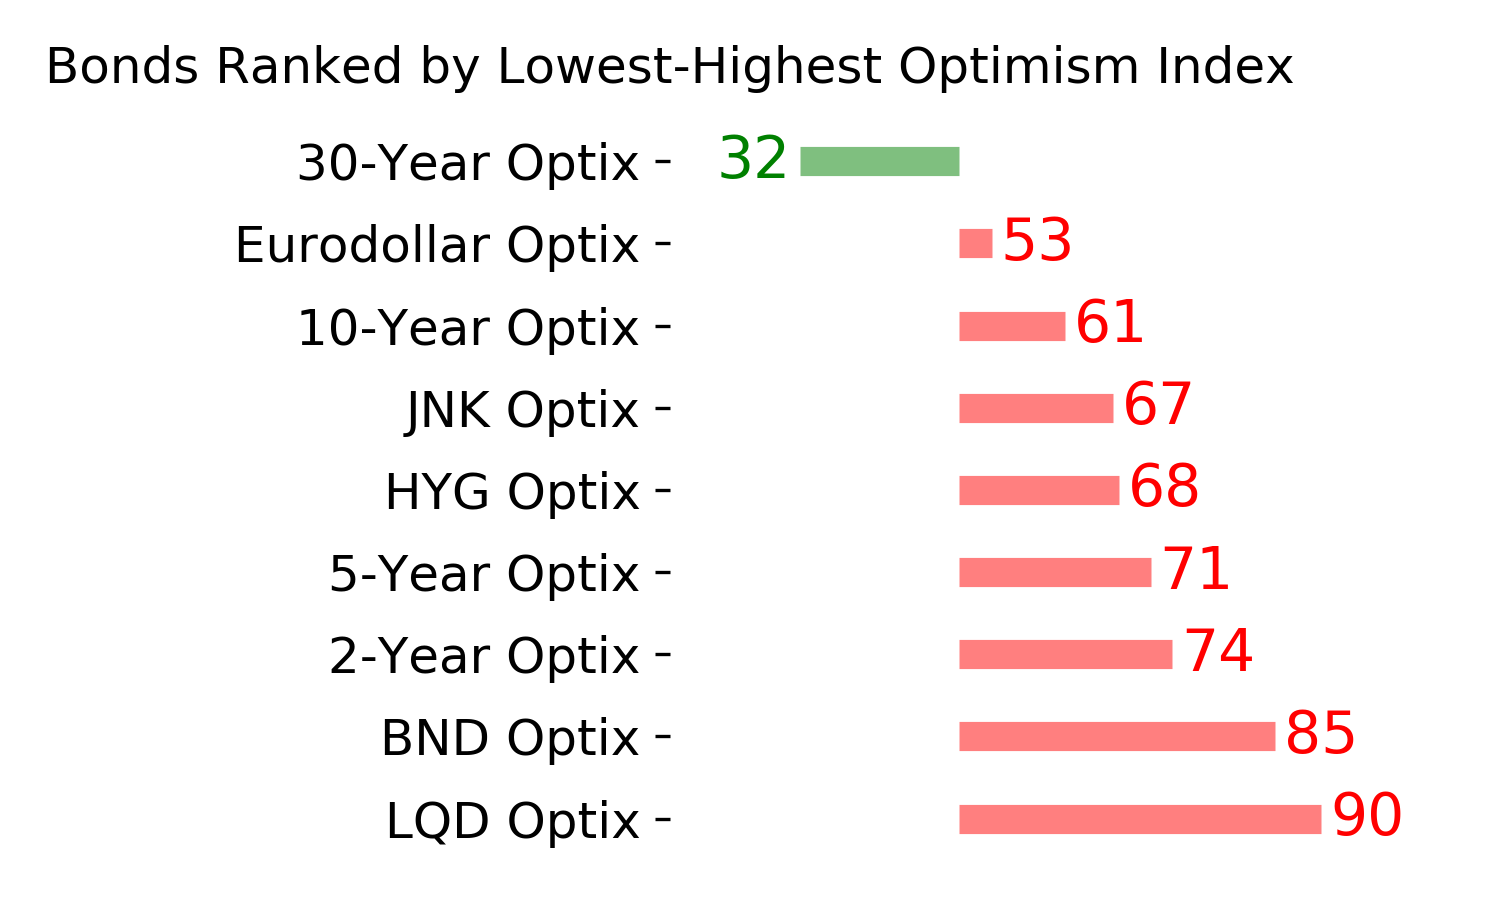
Optimism Index Thumbnails
|
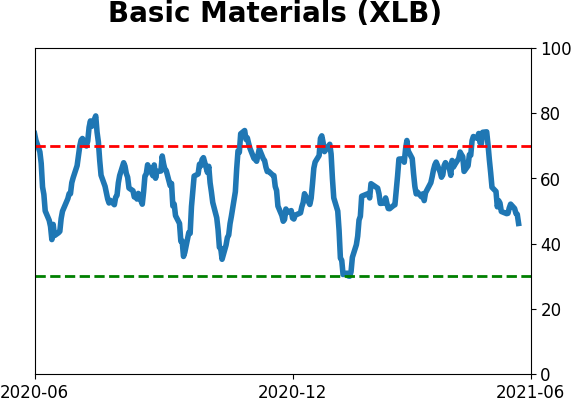
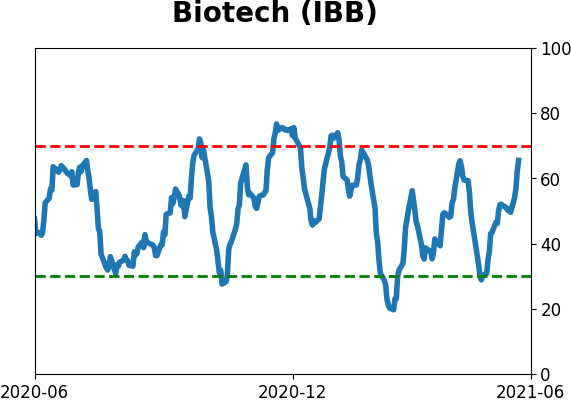
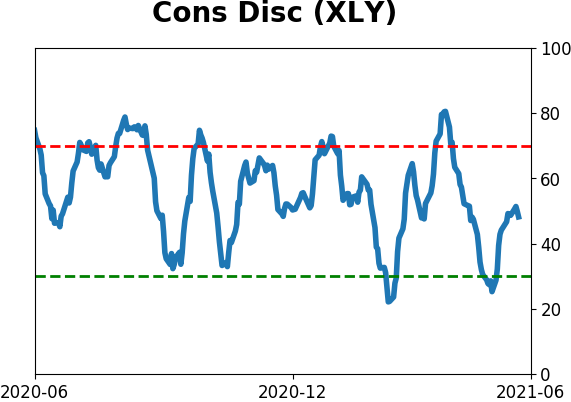
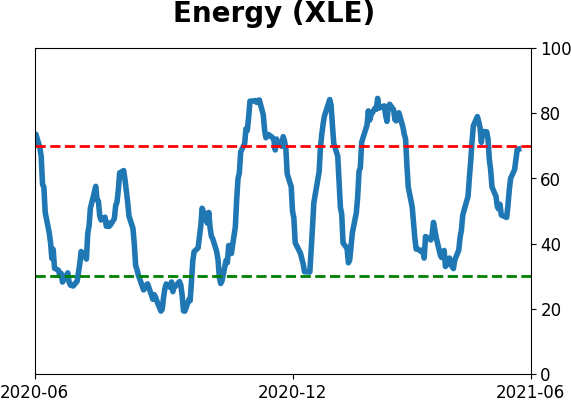
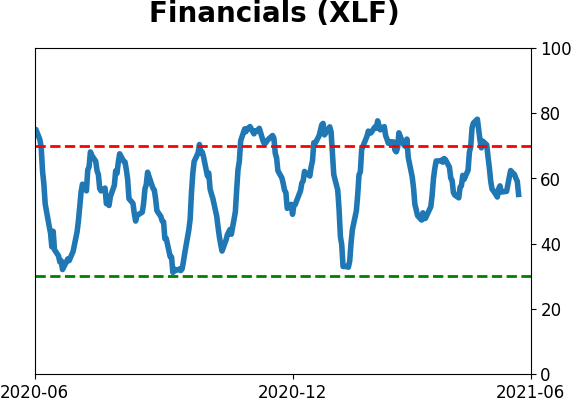
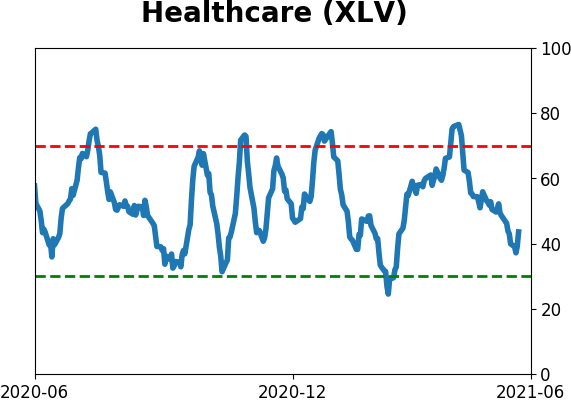
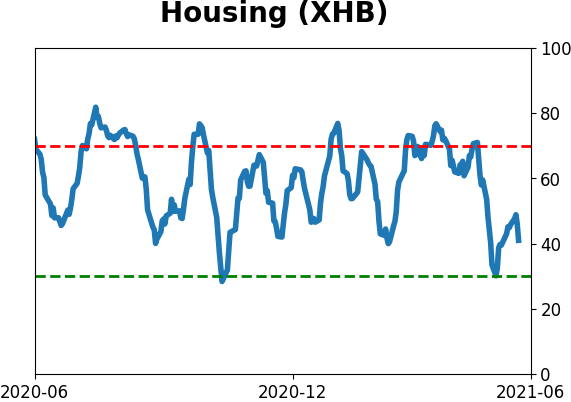
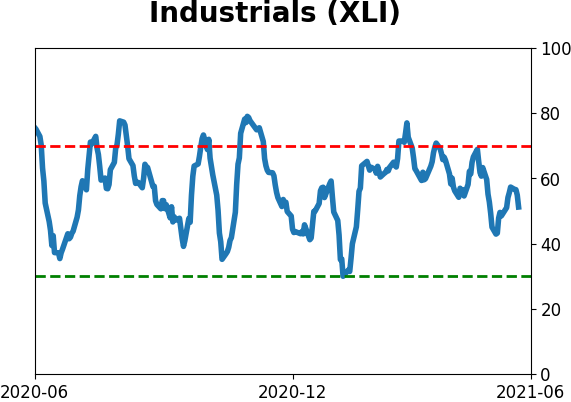
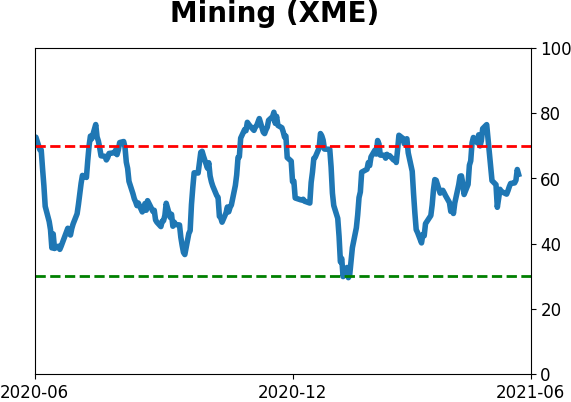
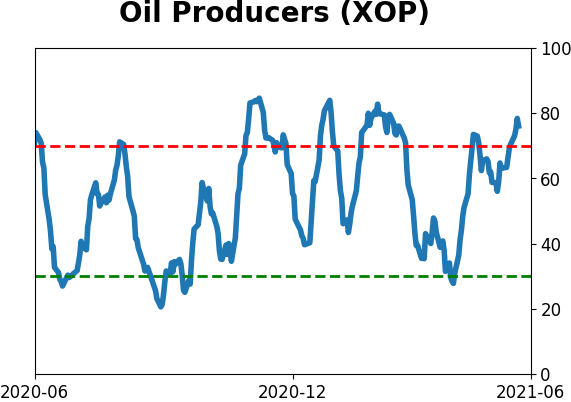
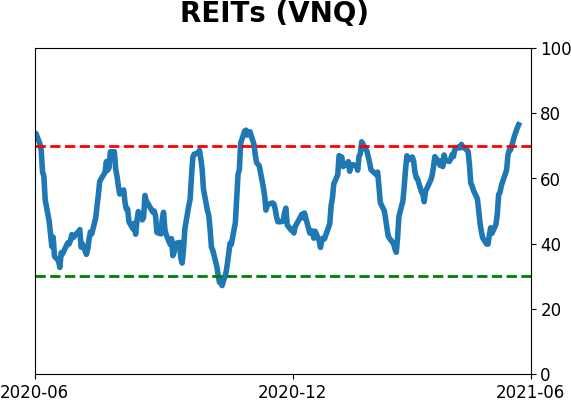
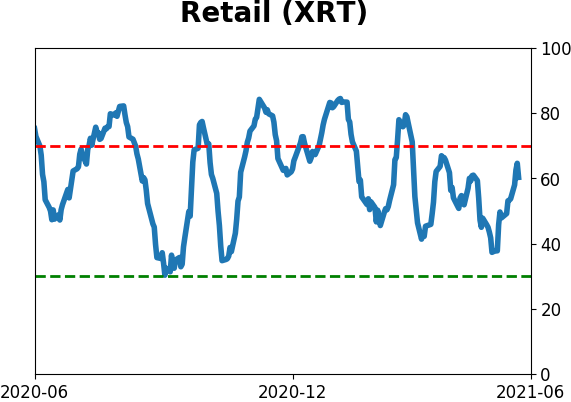
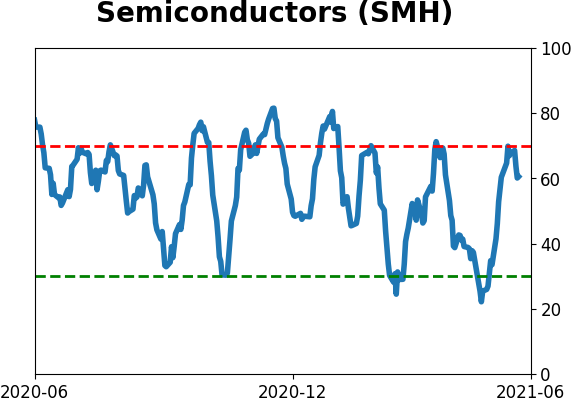
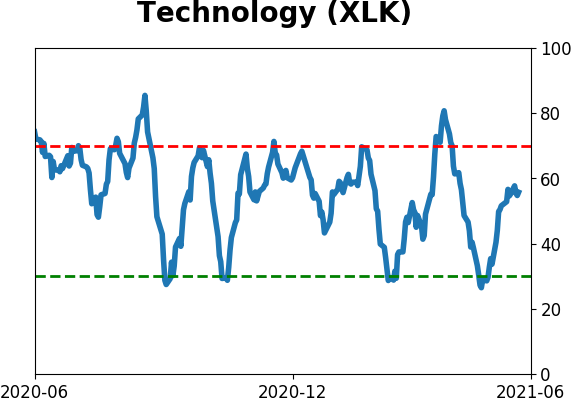
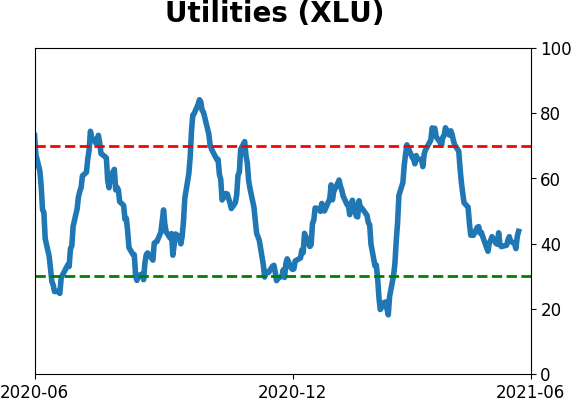
Sector ETF's - 10-Day Moving Average
|
|
|
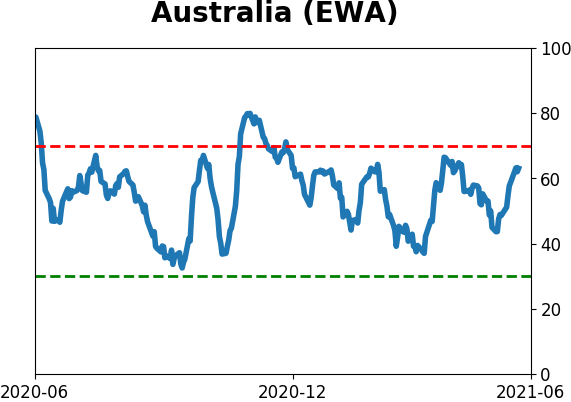
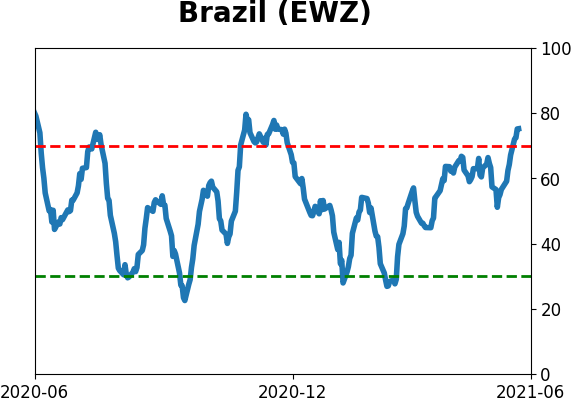
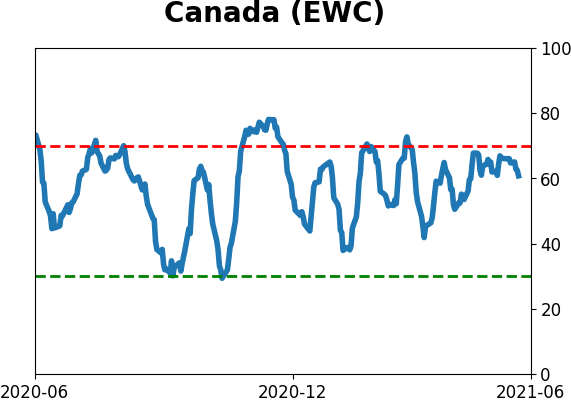
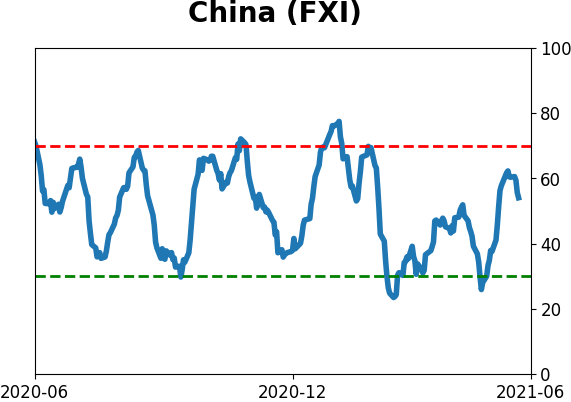
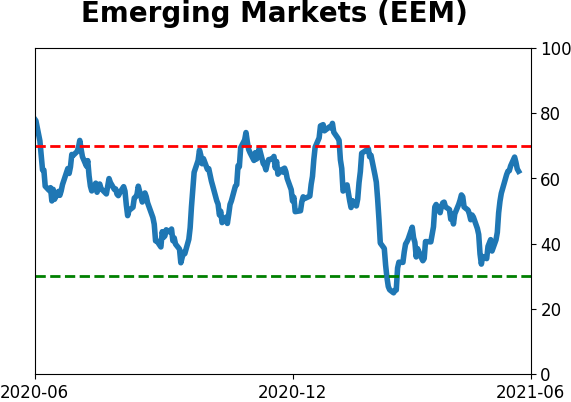
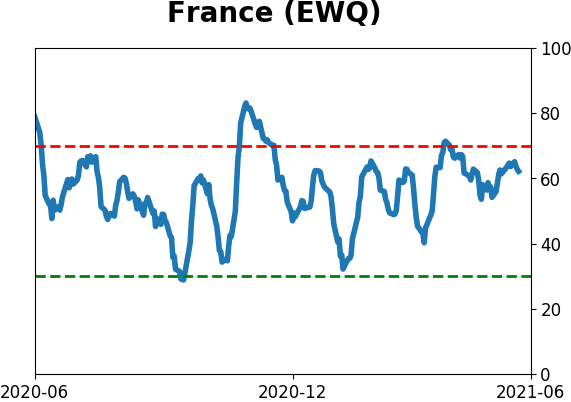
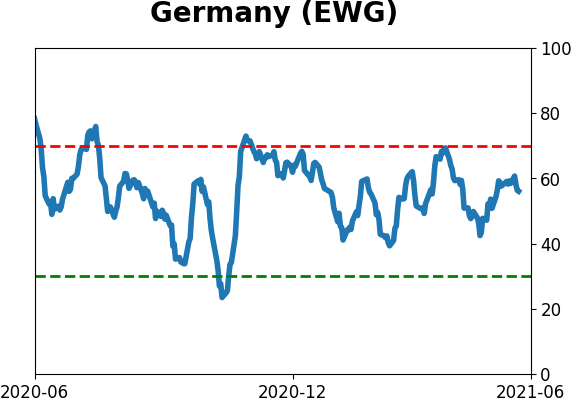
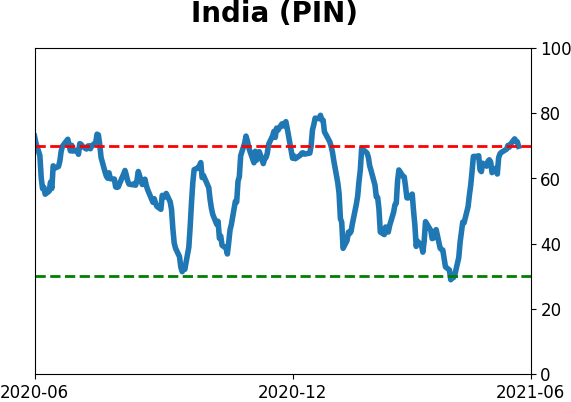
Country ETF's - 10-Day Moving Average
|
|
|
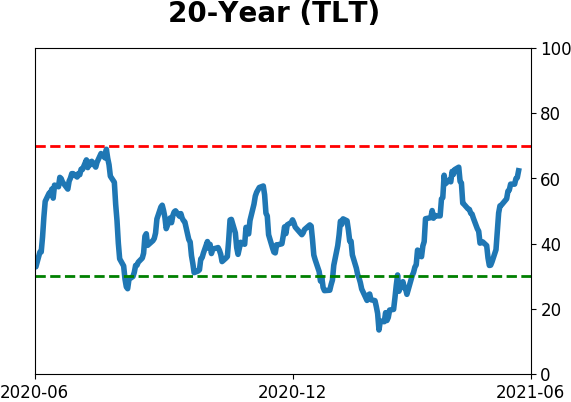
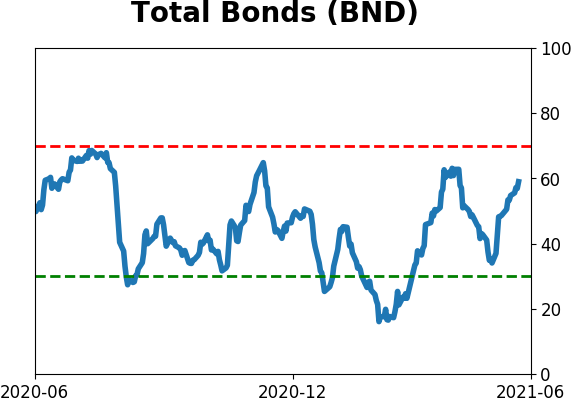
Bond ETF's - 10-Day Moving Average
|
|
|
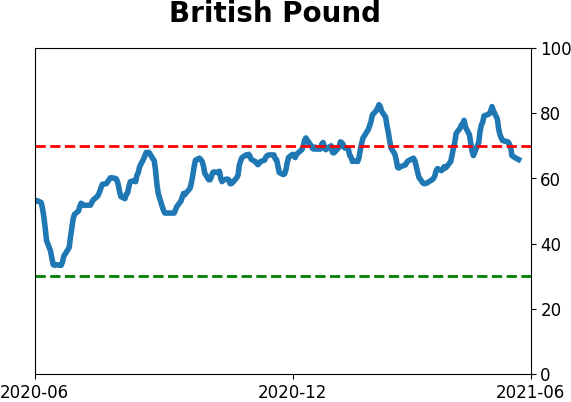
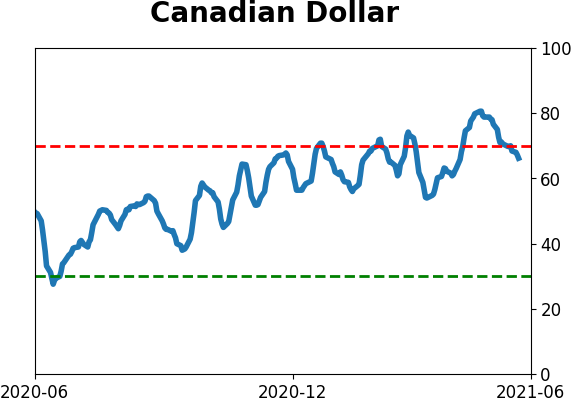
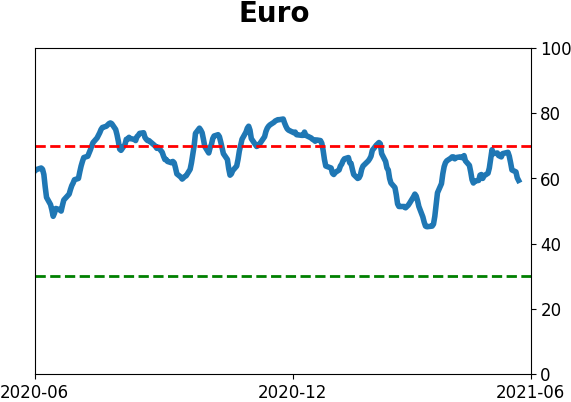
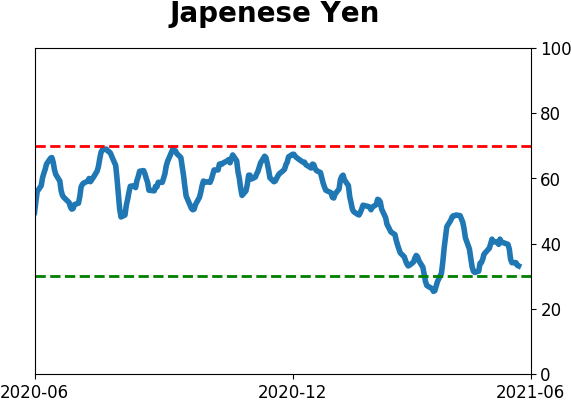
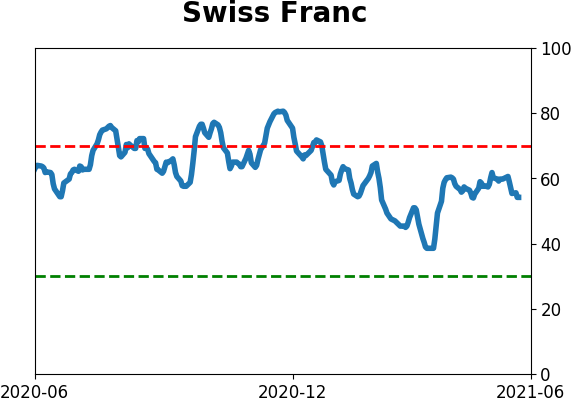
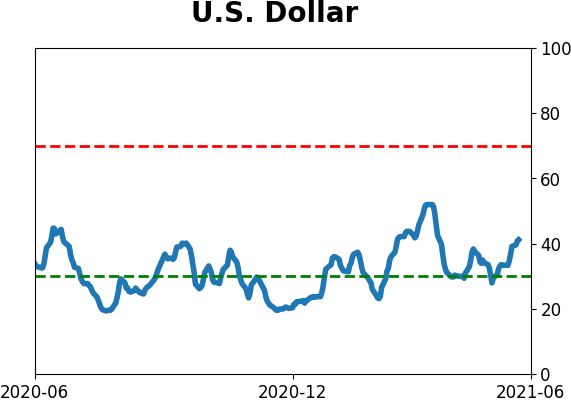
Currency ETF's - 5-Day Moving Average
|
|
|
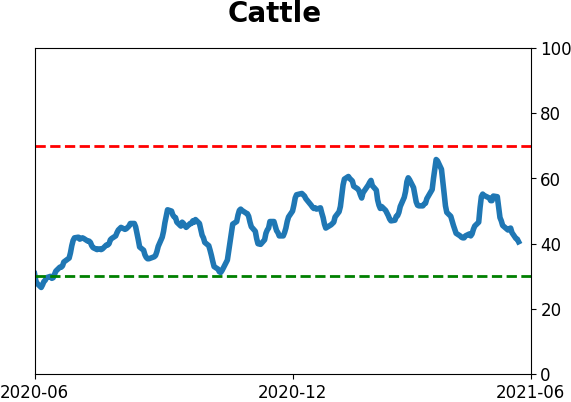
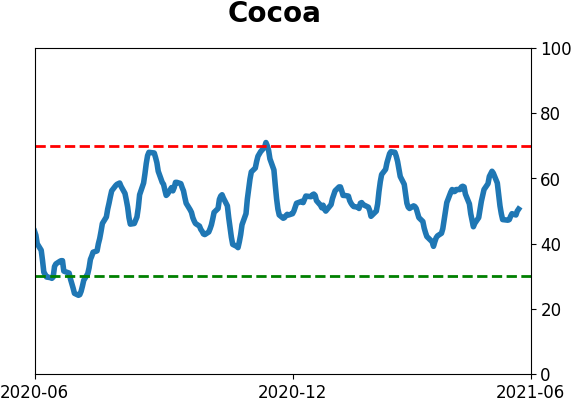
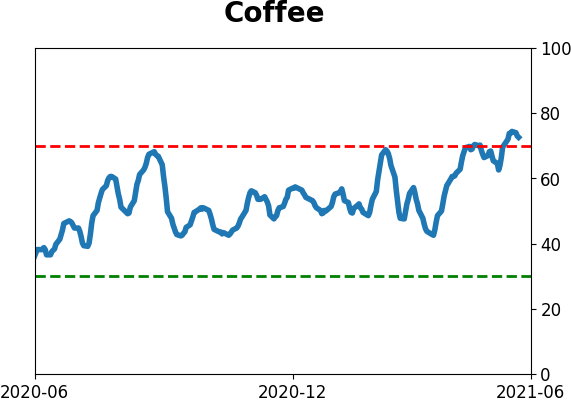
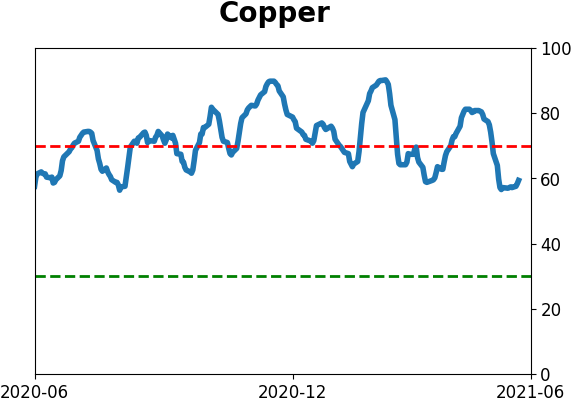
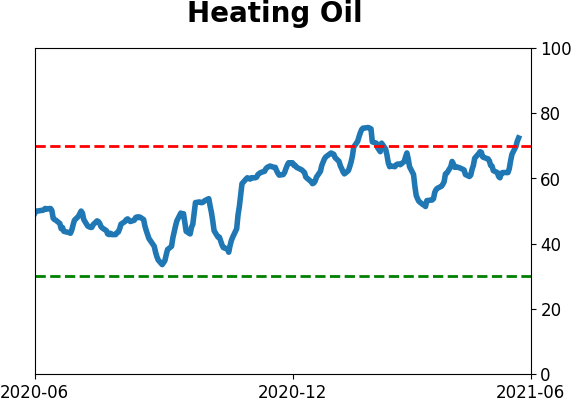
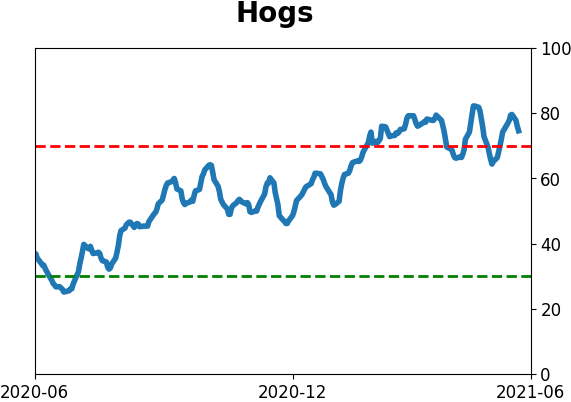
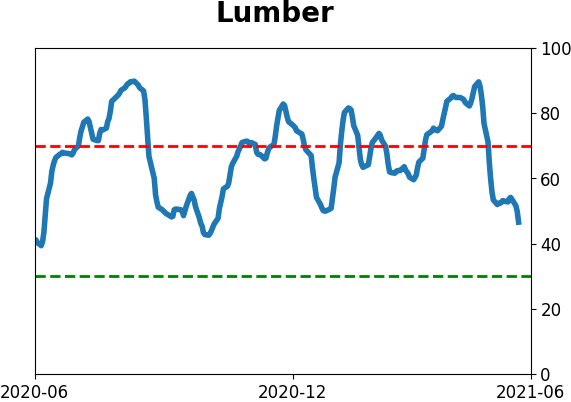
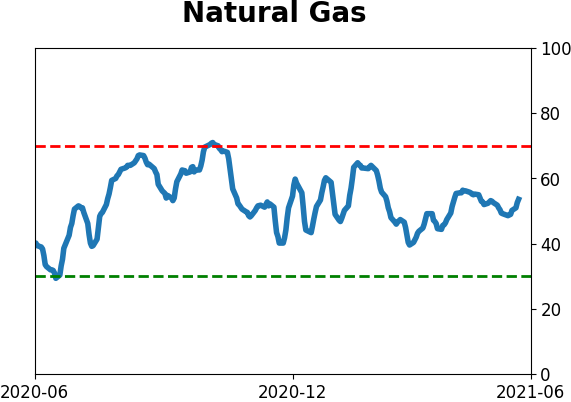
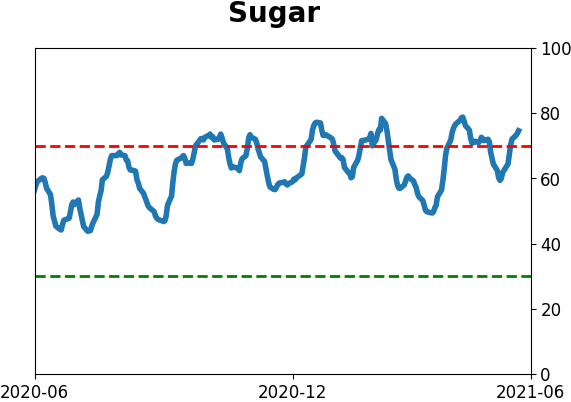
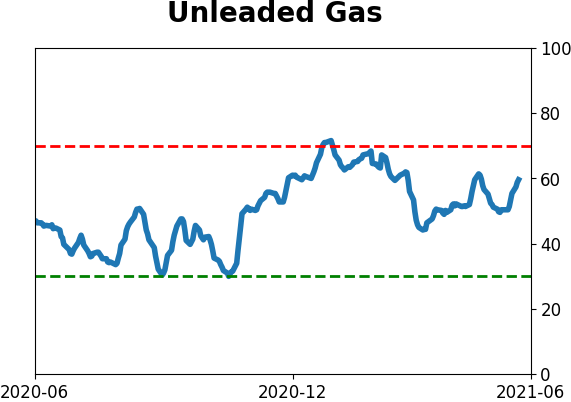
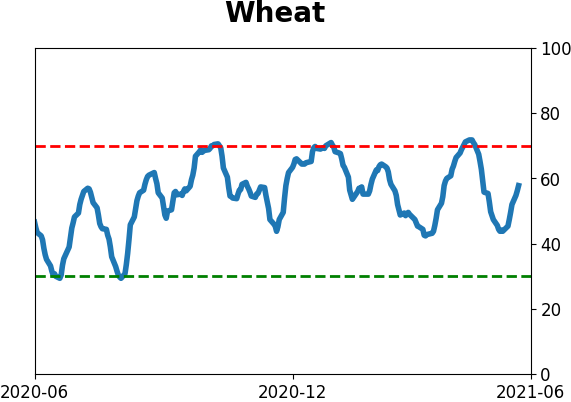
Commodity ETF's - 5-Day Moving Average
|
|