Headlines
|
|
Corporate insiders buy as other investors sell:
While many equity investors have been busy selling in recent months, a standout exception is corporate insiders. They have greatly pulled back on open market sales, especially in Technology and Health Care sectors. In Industrials and the broader S&P 500, the velocity of changes in the buy/sell ratio is high and bullish.
|
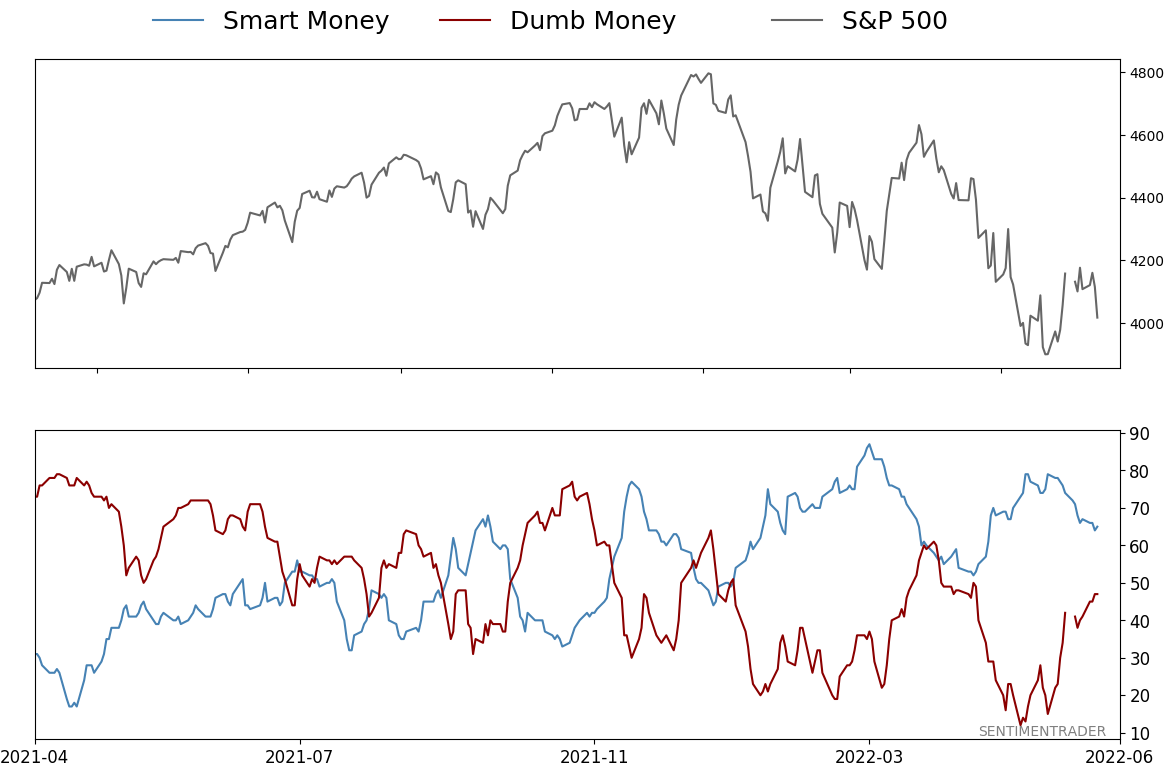
Smart / Dumb Money Confidence
|
Smart Money Confidence: 65%
Dumb Money Confidence: 47%
|
|
Risk Levels
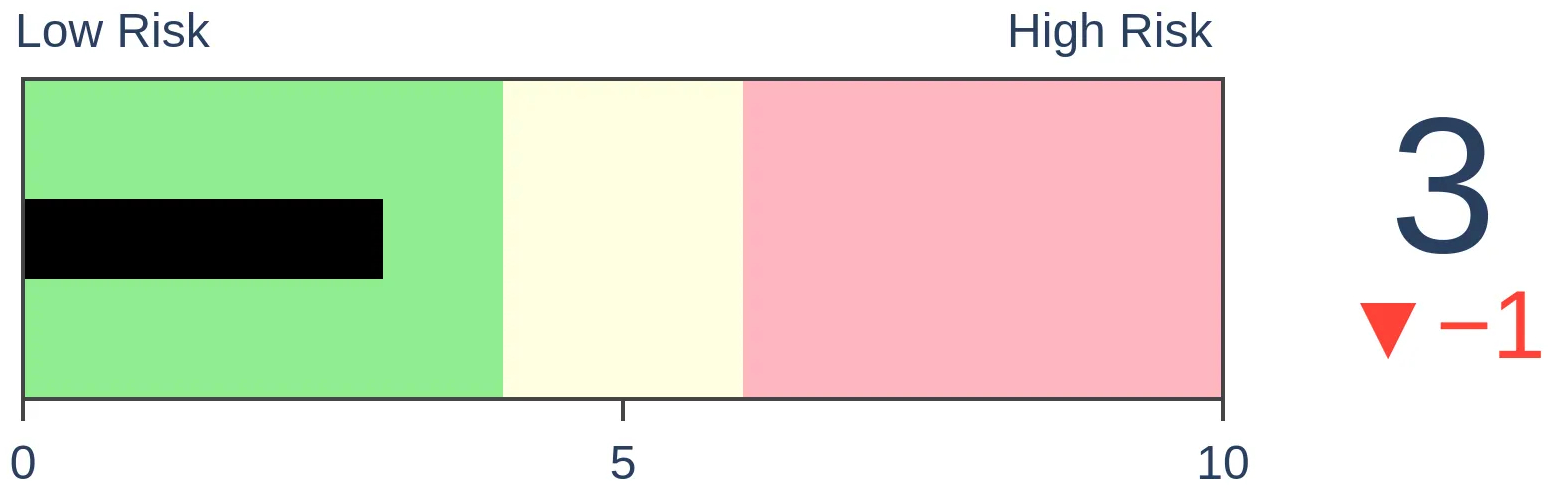
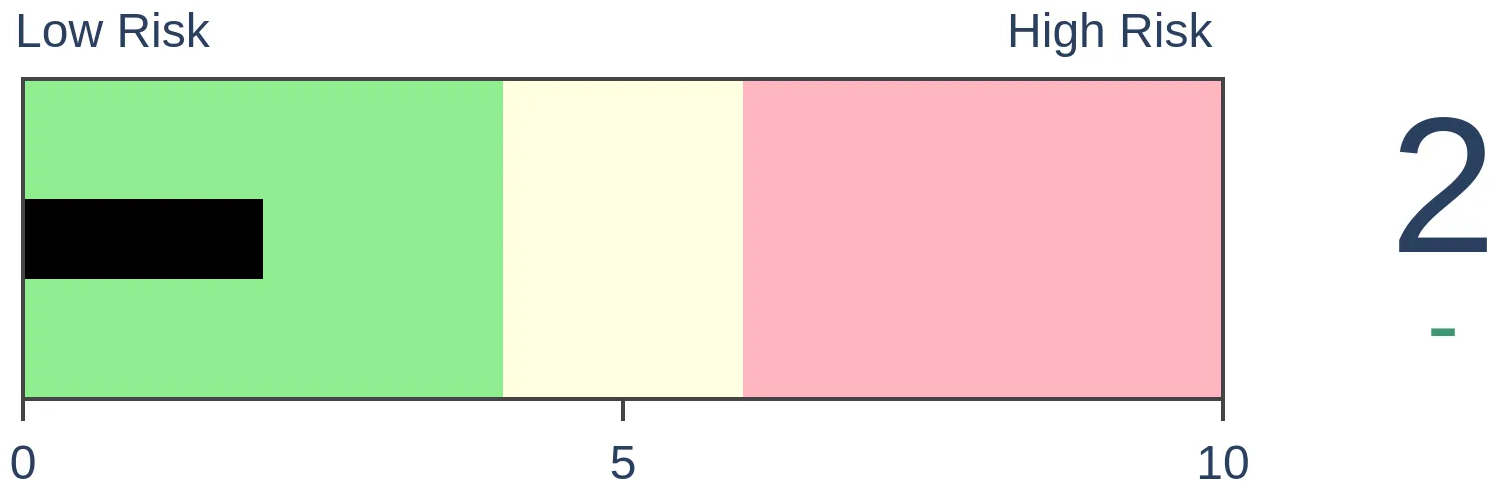
Stocks Short-Term
|
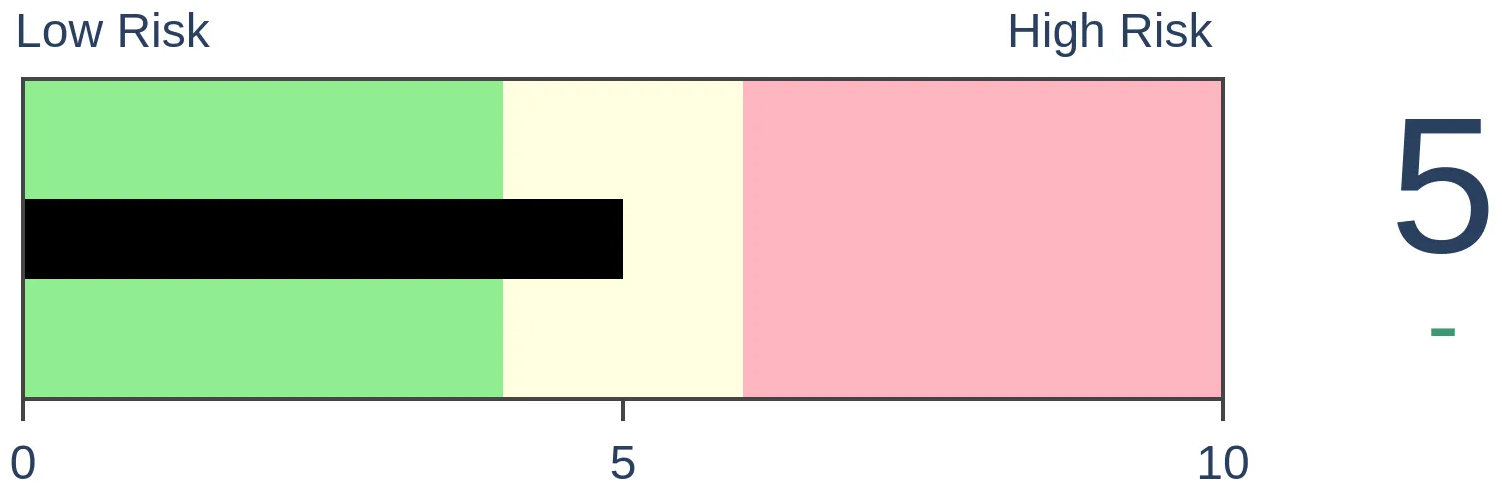
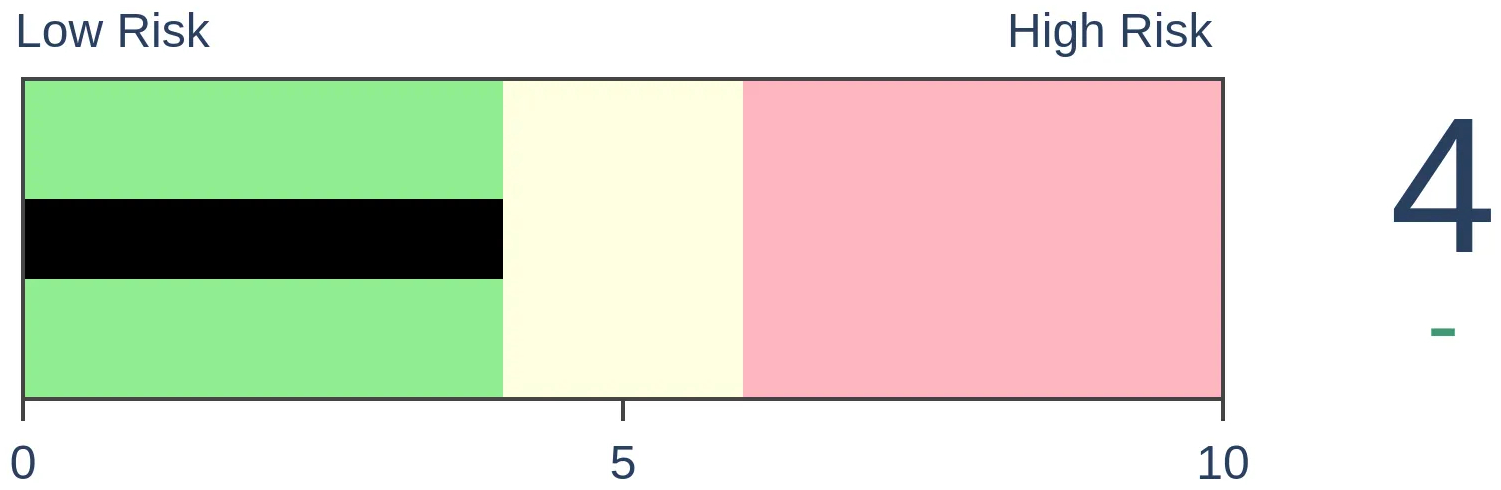
Stocks Medium-Term
|
|
Bonds
|
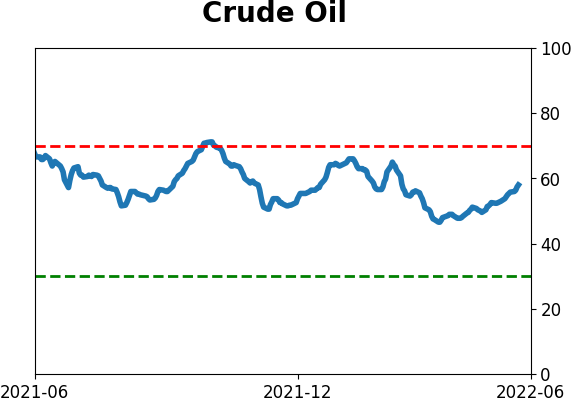
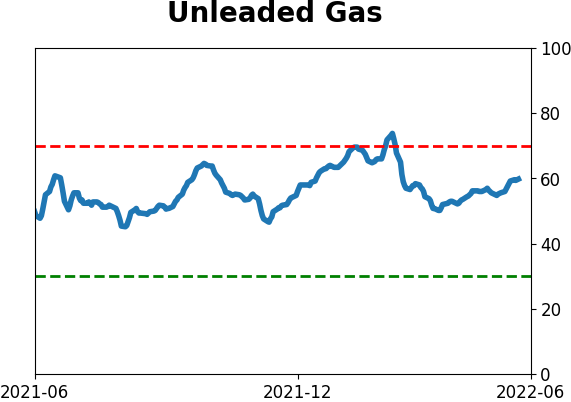
Crude Oil

|
|
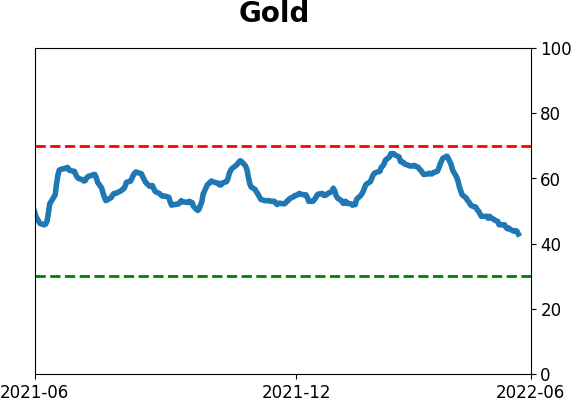
Gold

|
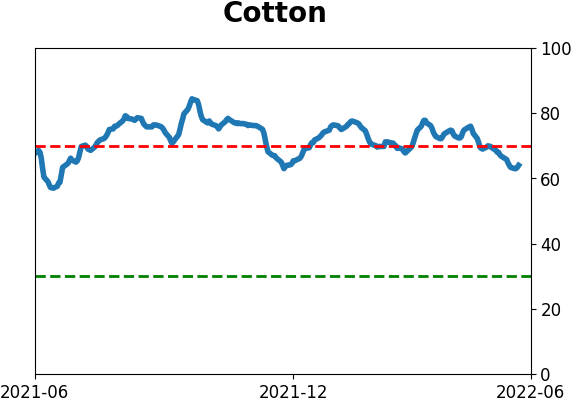
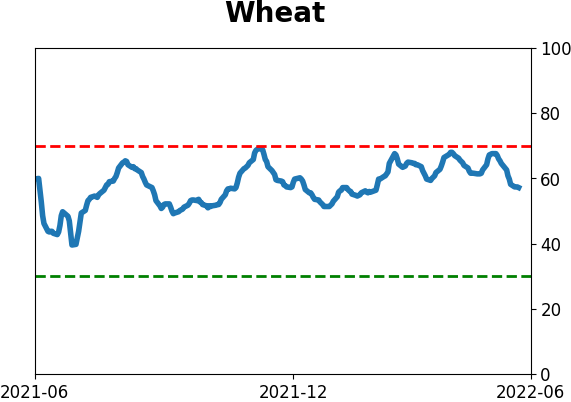
Agriculture
|
|
Research
By Jason Goepfert
BOTTOM LINE
While many equity investors have been busy selling in recent months, a standout exception is corporate insiders. They have greatly pulled back on open market sales, especially in Technology and Health Care sectors. In Industrials and the broader S&P 500, the velocity of changes in the buy/sell ratio is high and bullish.
FORECAST / TIMEFRAME
SPY -- Up, Long-Term
|
Key points:
- While other investors have been selling, corporate insiders backed off their open market sales
- Among Technology and Health Care companies, in particular, insider selling has plunged
- The velocity of changes among insider buy/sell activity in S&P 500 and Industrial stocks is impressively bullish
Smart money insiders have backed off selling
A couple of times lately, we've touched on the fact that sentiment among investors in general, and even consumers en masse, is horrid. Pessimism is so rampant that it's at or near washed-out levels.
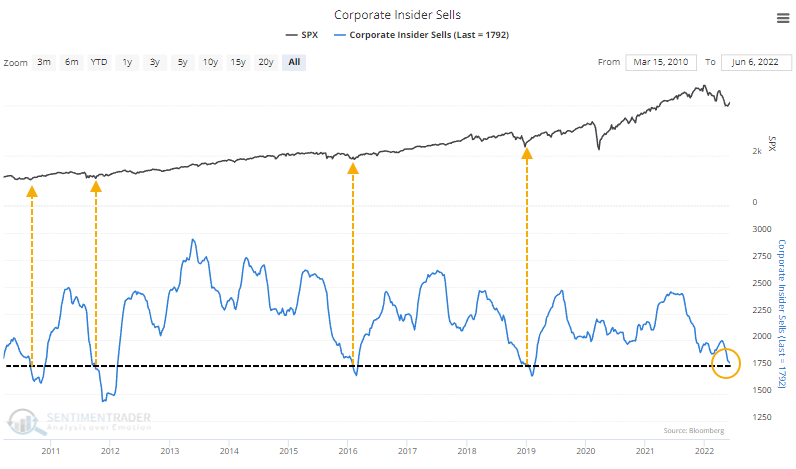
But one group that has not seemed interested in participating in the selling frenzy is corporate insiders. Among S&P 500 companies, the number of insiders with open market sales over the past six months has dropped to the lowest level in years. The four other periods of similarly repressed selling all coincided with major bottoms in the S&P (acknowledging the fact that the past decade has been dominated by a bull market tailwind).
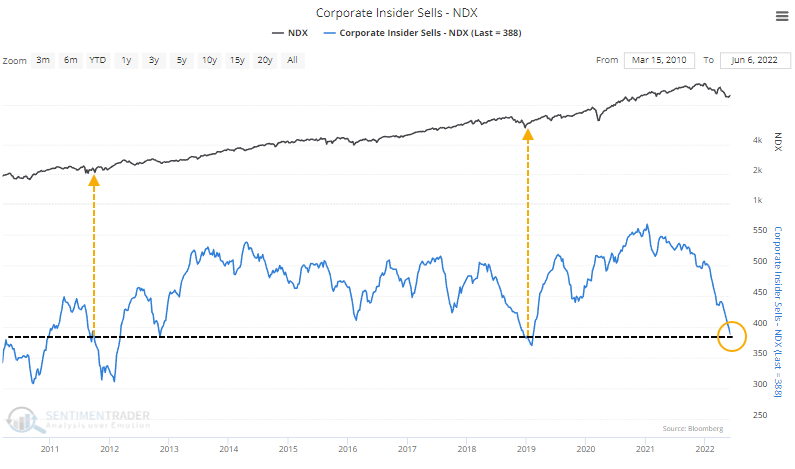
Jay has been noting for months that insiders among Technology companies have been curiously hesitant to sell. That's true for insiders in Nasdaq 100 members, in particular.
Even in the broader Technology sector, sales have been plunging.

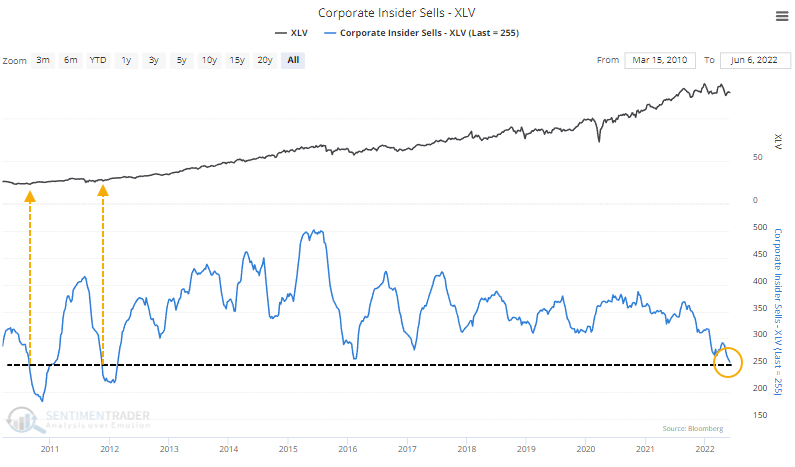
It's also true in the Health Care sector, where insider open market sells are the lowest since 2012.
If we look at all the major sectors and compute the median number of insider sells, it has now plunged to the lowest in a decade.
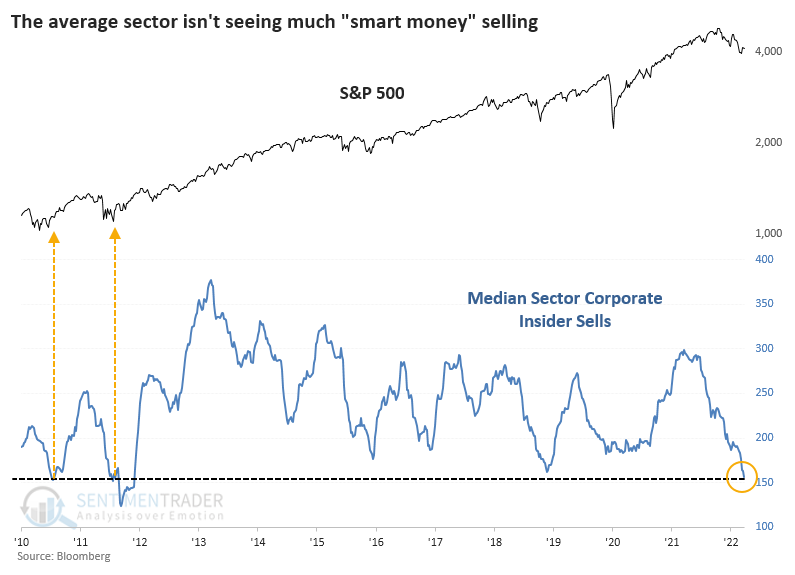
Buying interest has picked up, so the median number of insider buyers versus the median number of sellers has spiked.

The velocity of insider changes is remarkable
The drop-off in insider selling, often coupled with a rise in buying, has pushed the Insider Velocity to an extreme level. Within S&P 500 companies, the 4-week rate of change in the Buy/Sell Ratio recently jumped above 25%. Again, returns were aided by the market environment but returns over the next 2-12 months were excellent.

Another interesting one is Industrial companies. We saw on Tuesday how investors have been pulling money out of Industrial ETFs over the past year. Insiders have been eager to take the other side of those flows.

What the research tells us...
Evidence of widespread pessimism is easy to come by. While it has improved somewhat by the recent thrusts, sentiment among a wide variety of investor groups in May was depressed. We could see that among most of our indicators, showing that it wasn't just a few pockets of traders or investors who were intent on selling. The standout among all that selling pressure was corporate insiders, and it has become even more compelling in recent weeks. While the indicators have room to become more extreme (especially on the buying side), the lack of selling interest is notable and should be another tailwind for stocks in the months ahead.
Indicators at Extremes
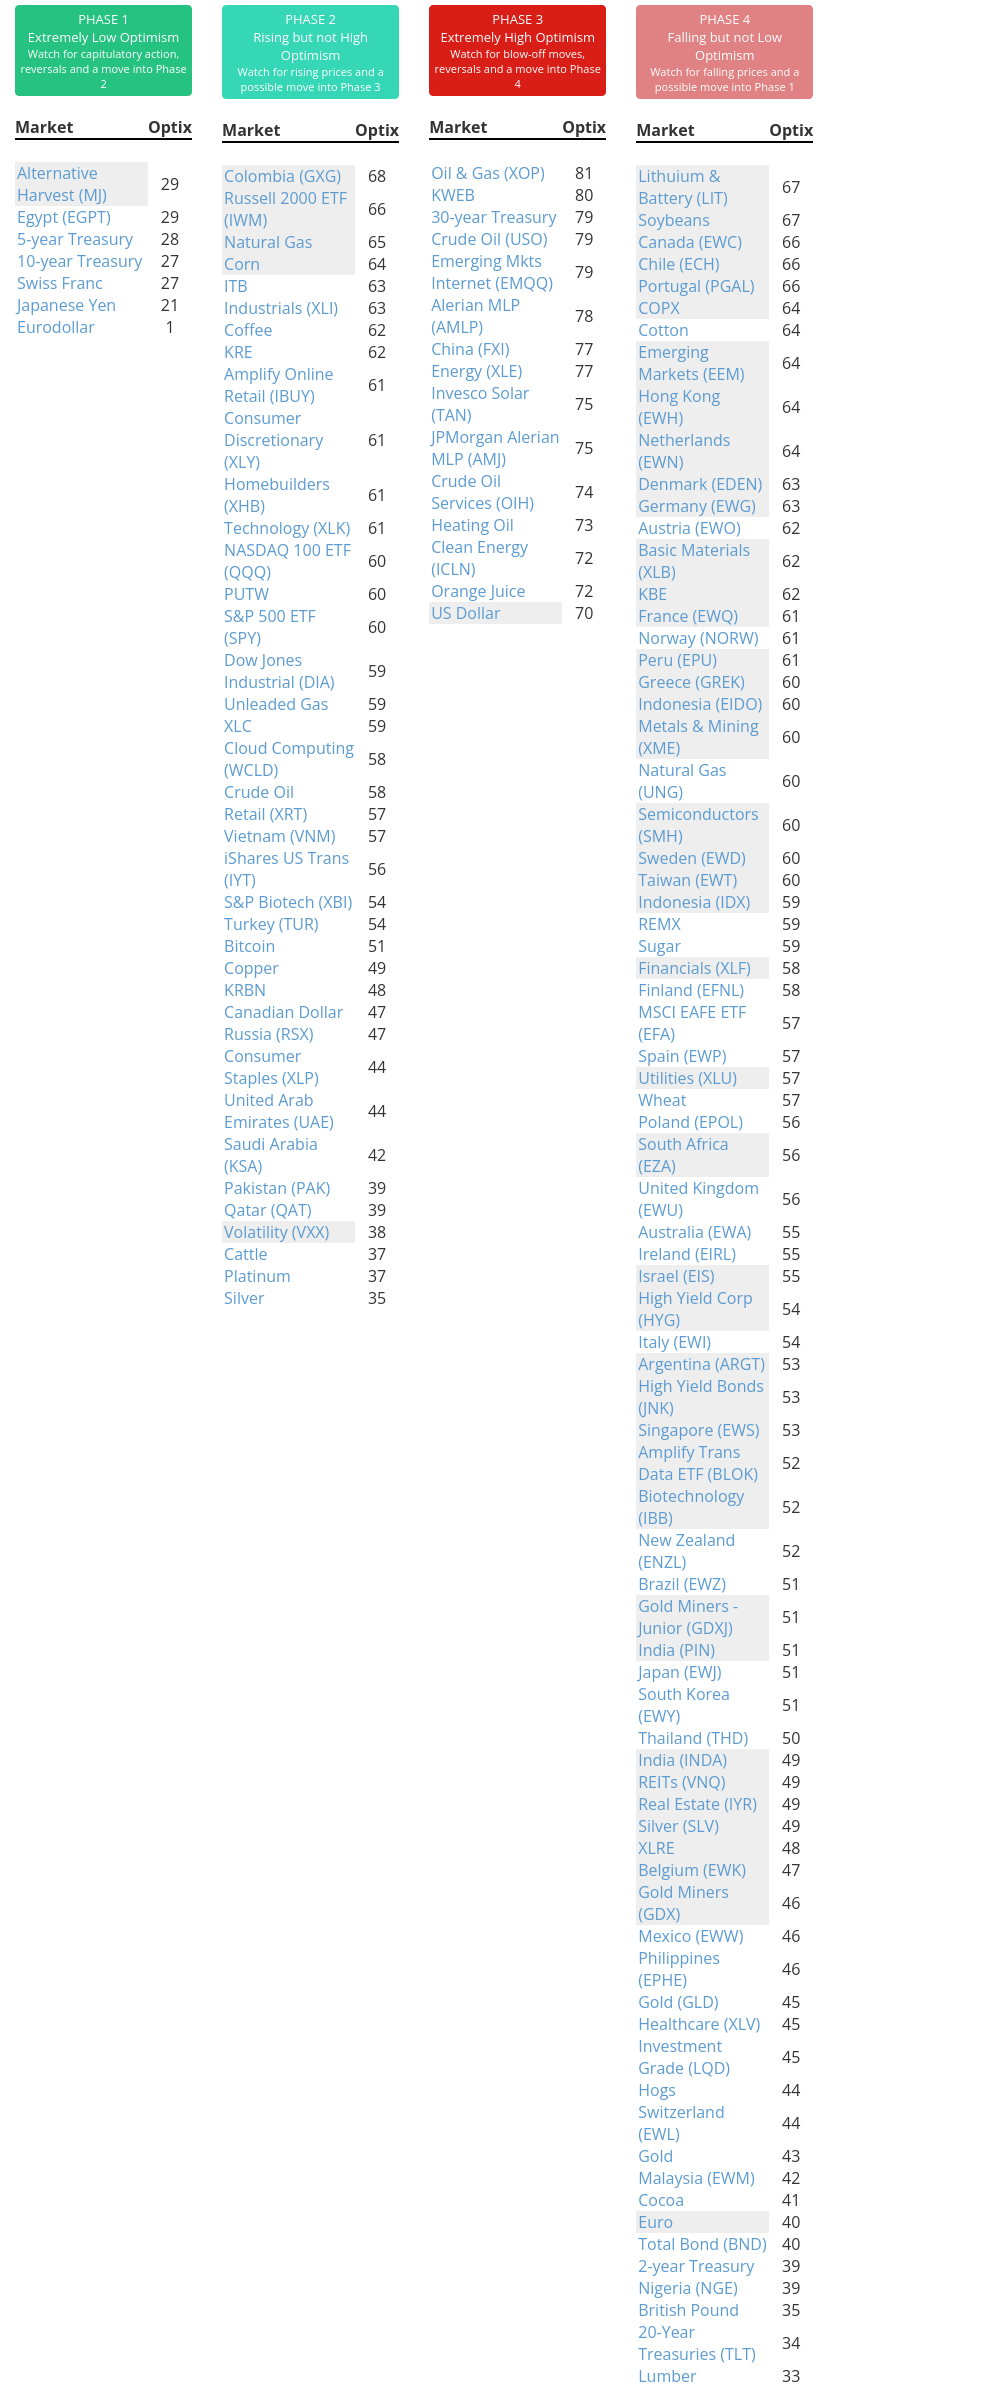
Phase Table
Ranks
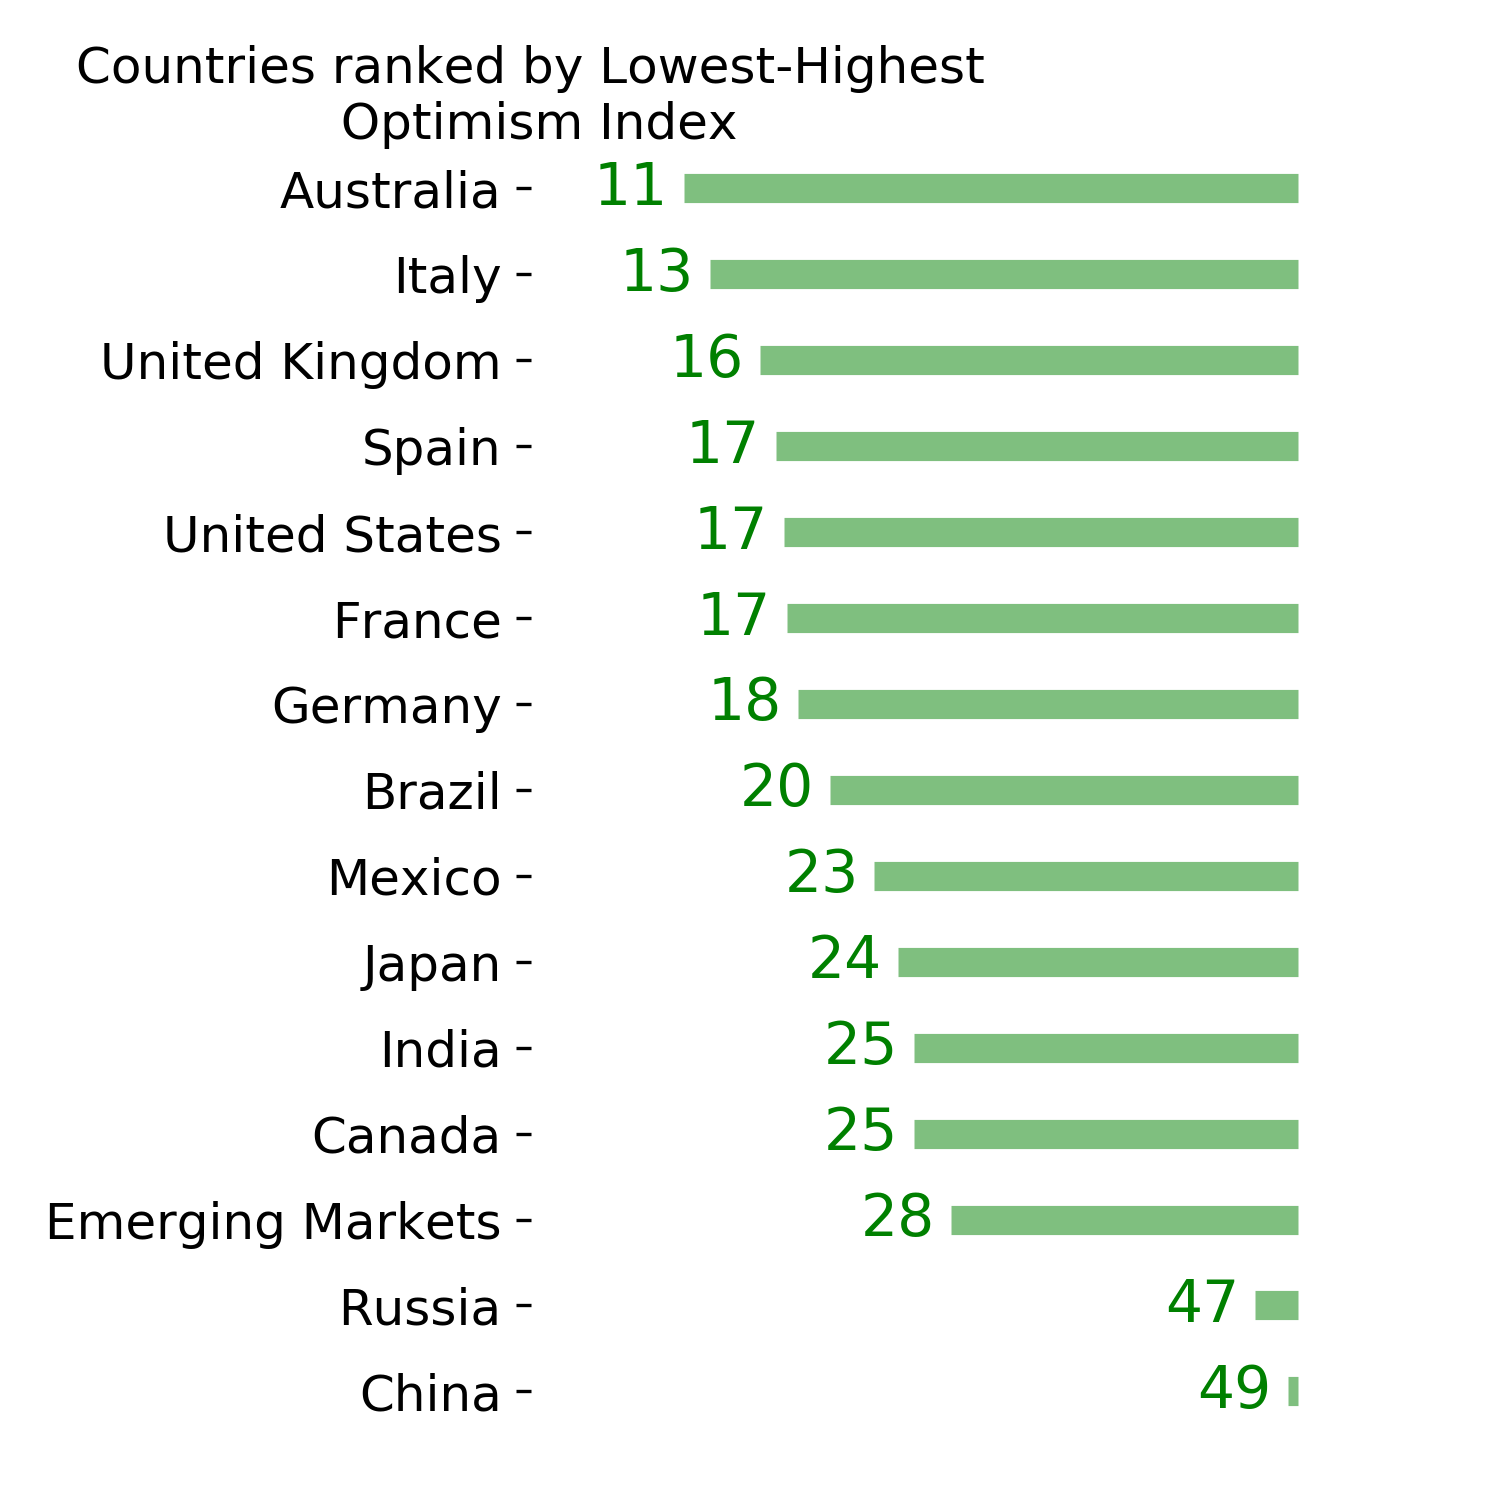
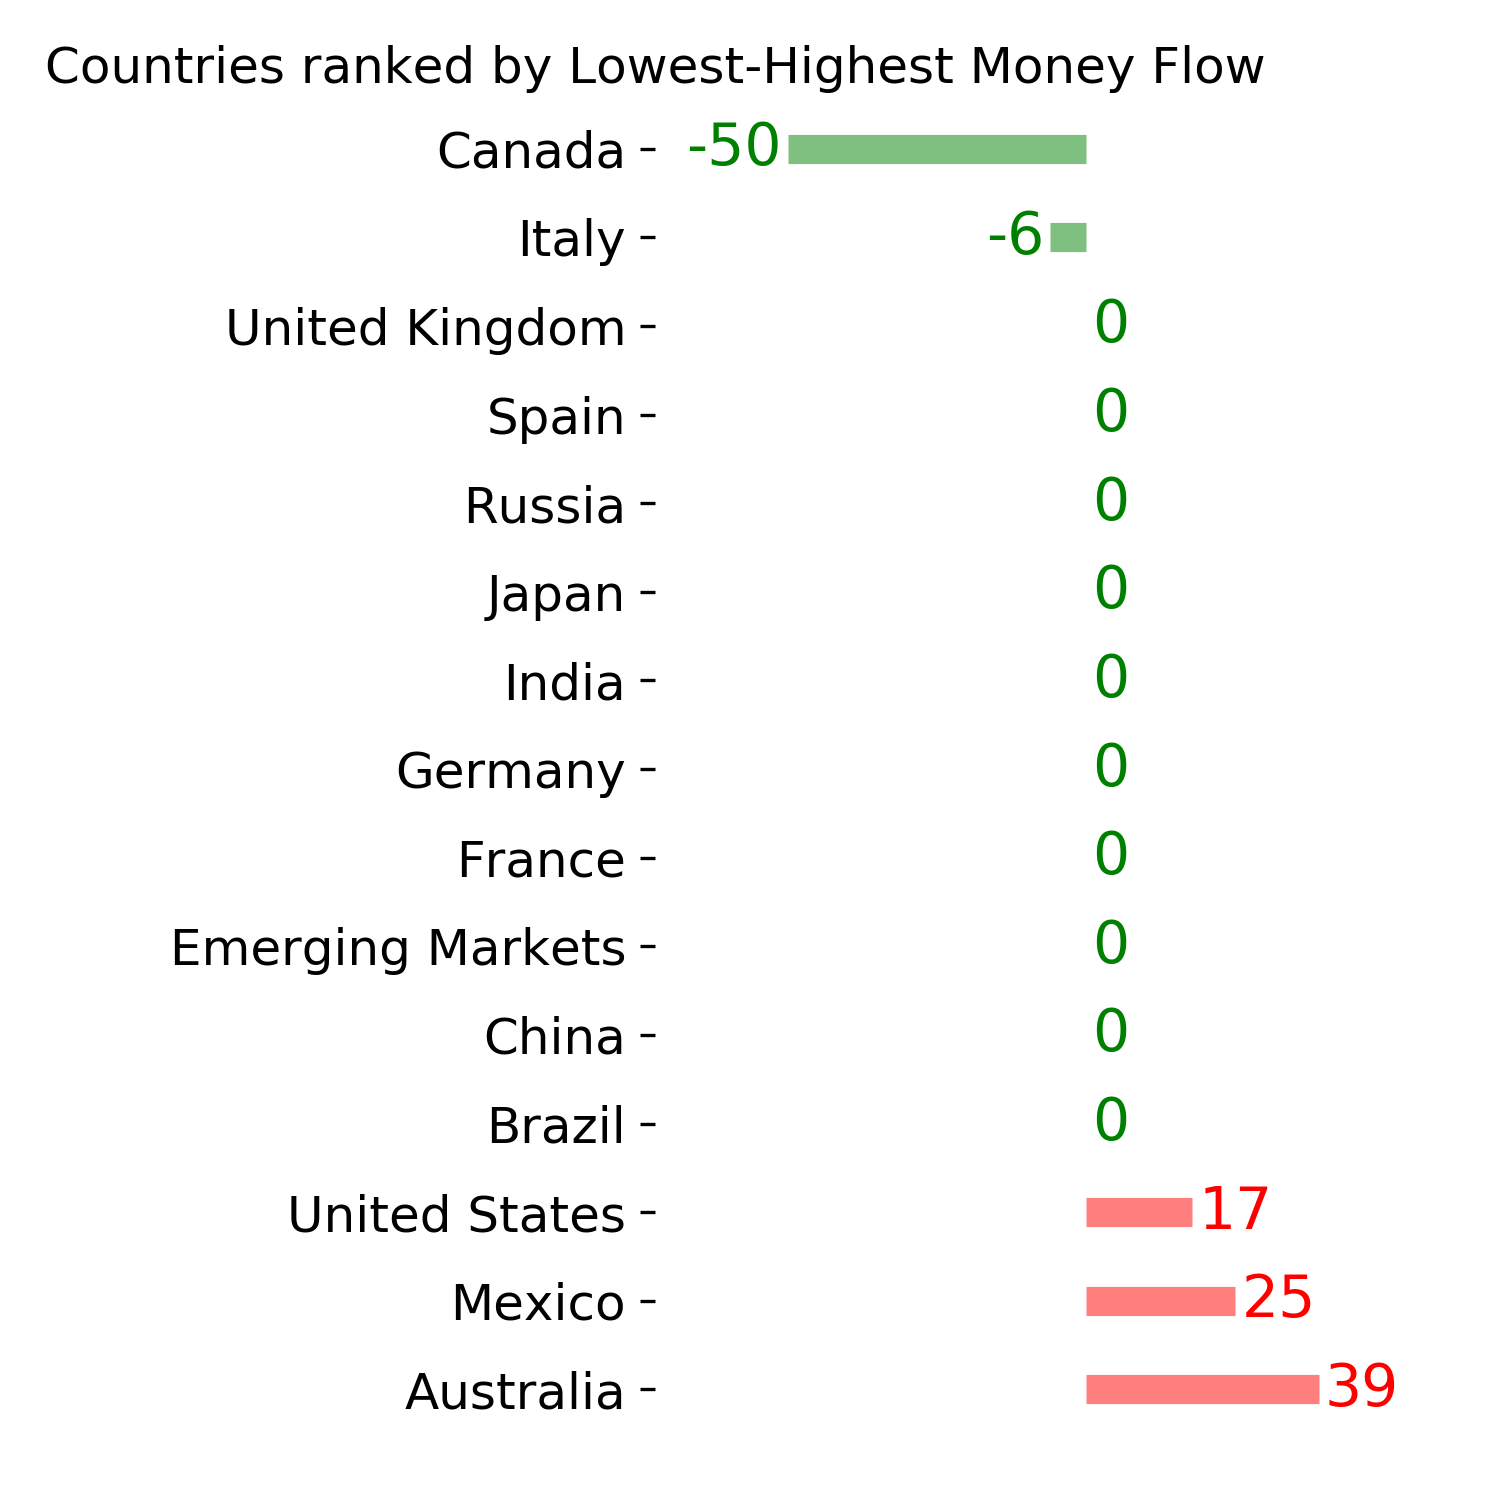
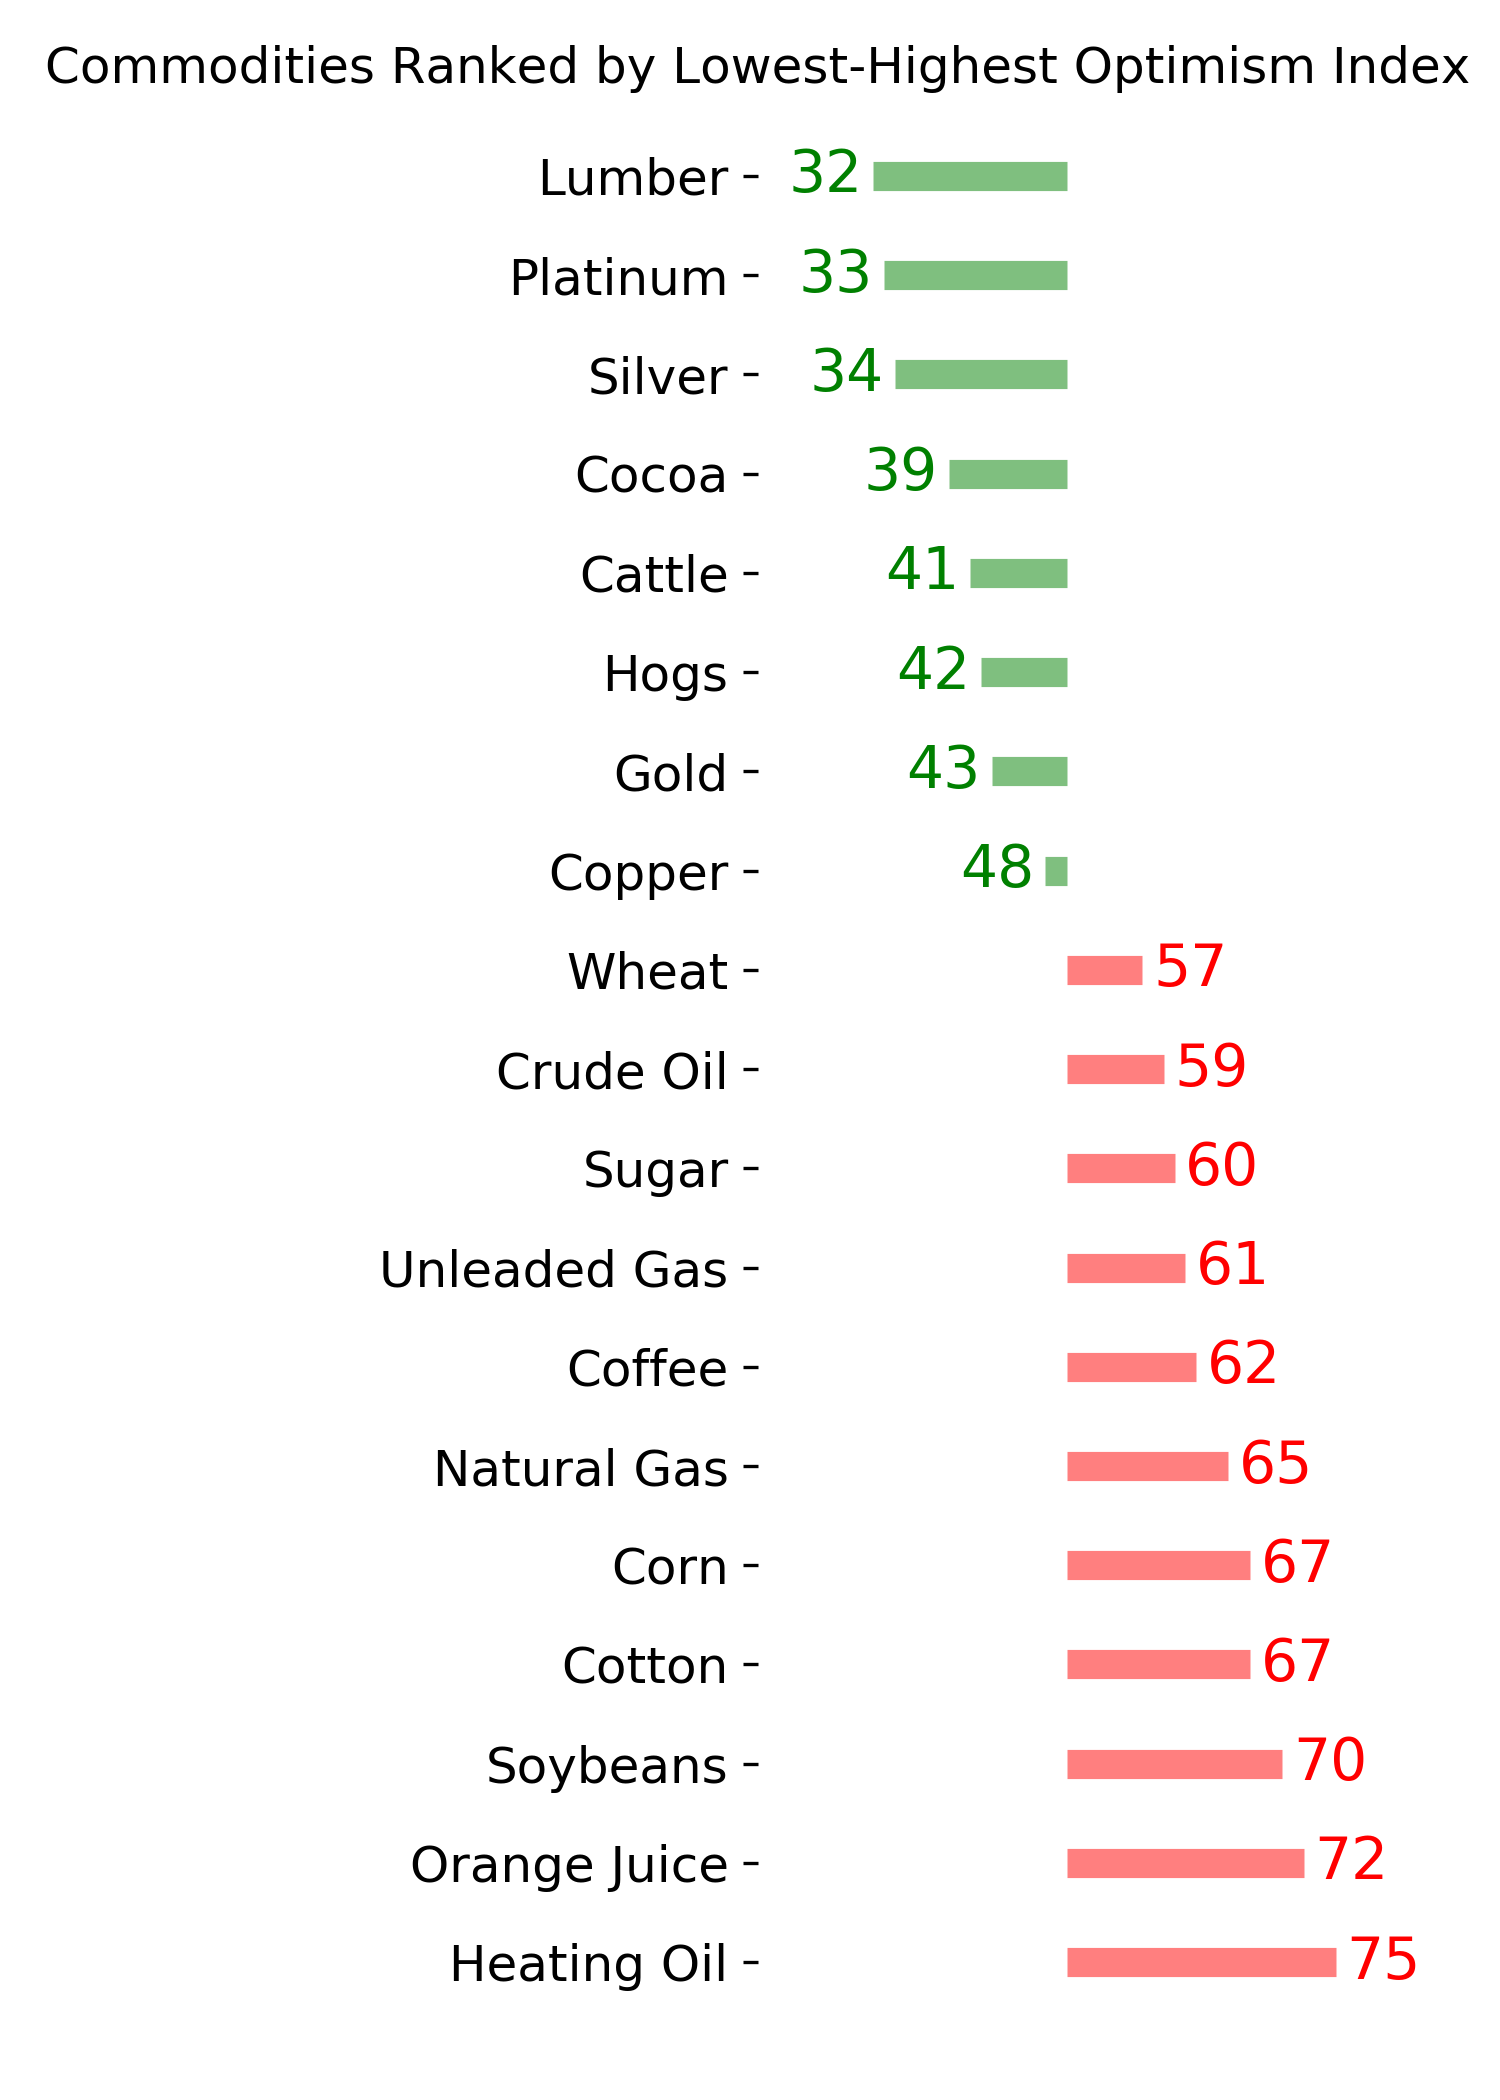
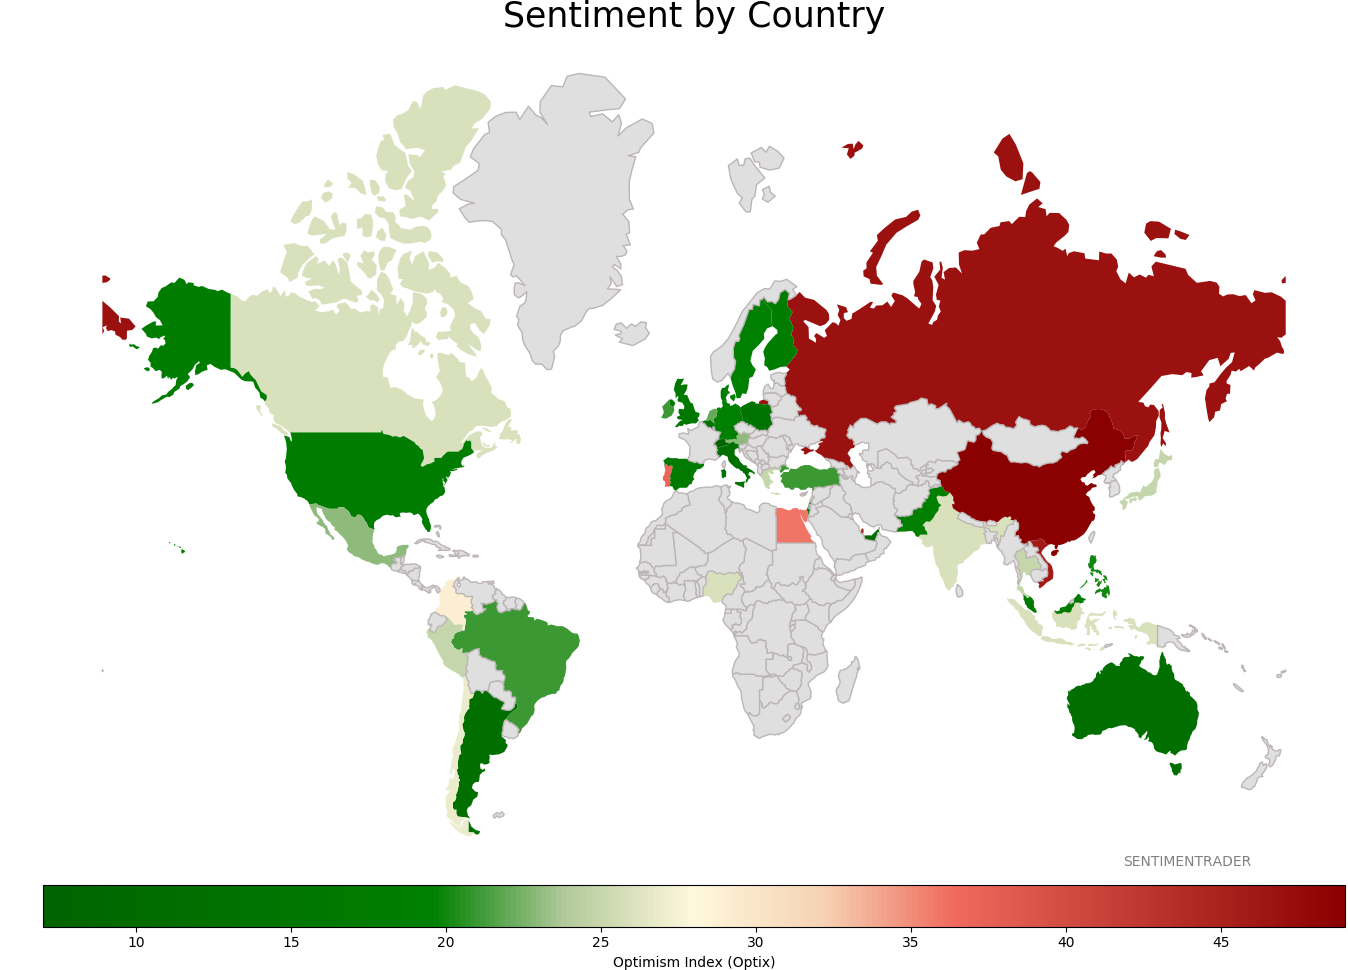
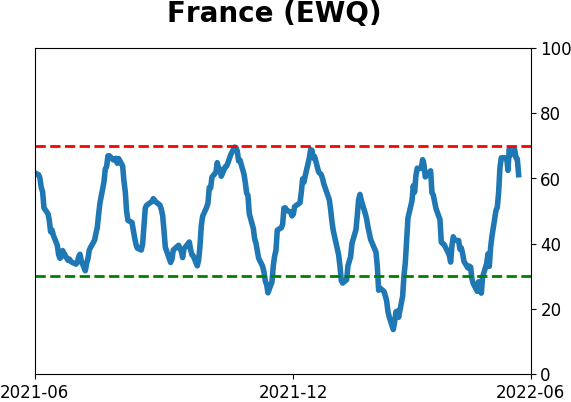
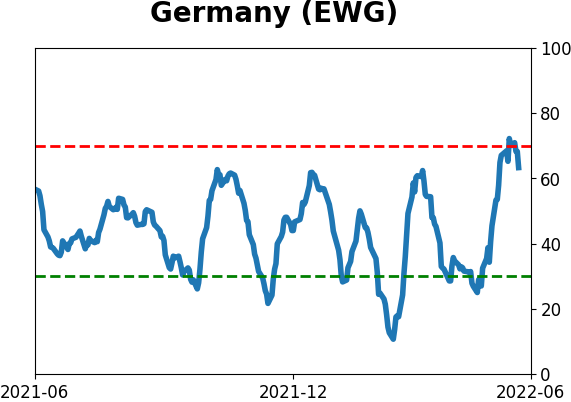
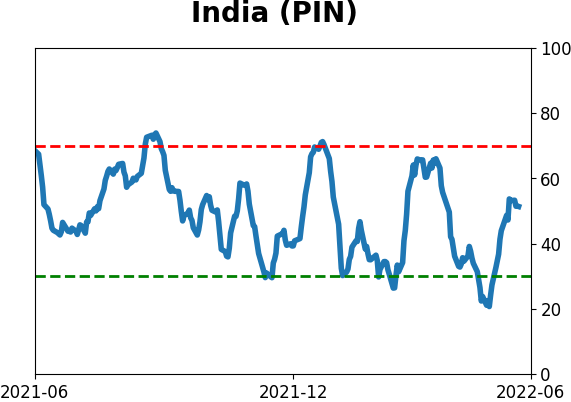
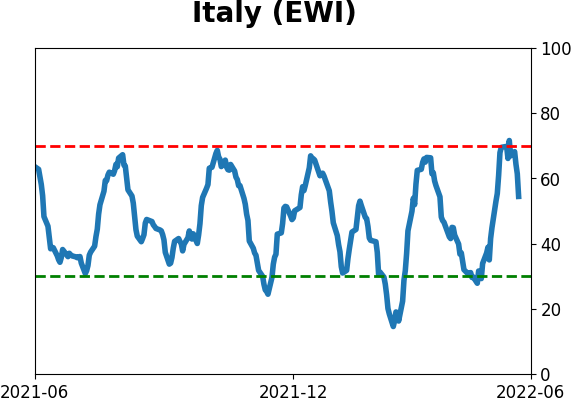
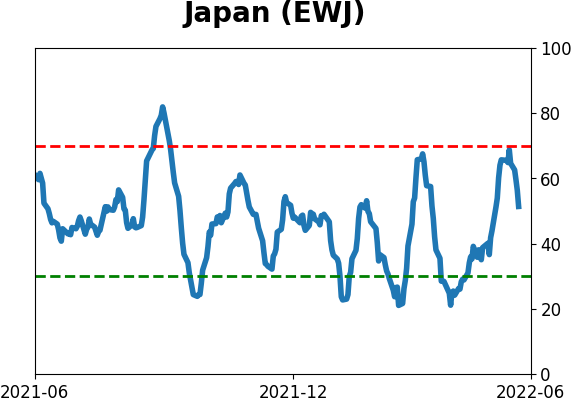
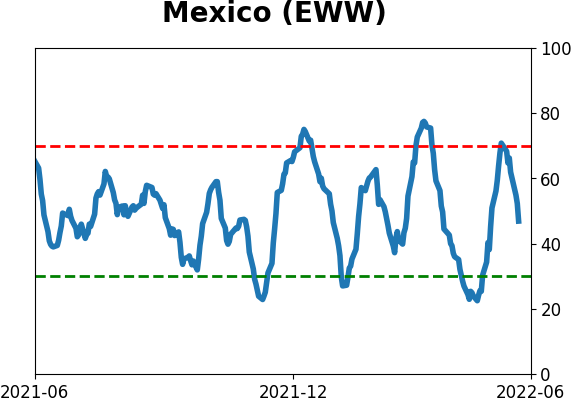
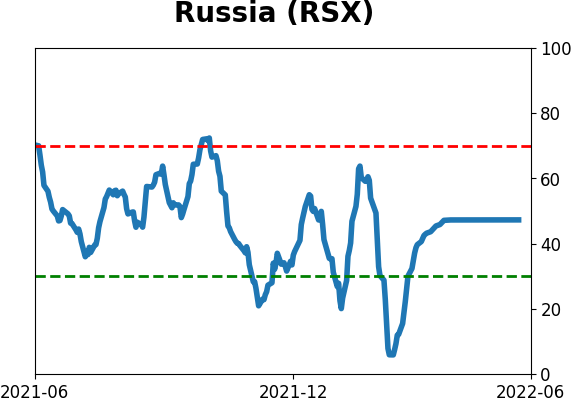
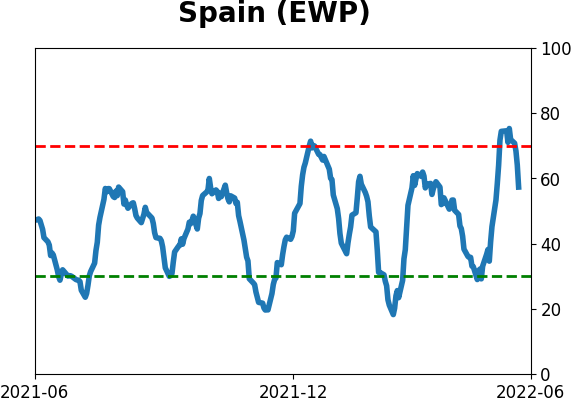
Sentiment Around The World
Optimism Index Thumbnails
|
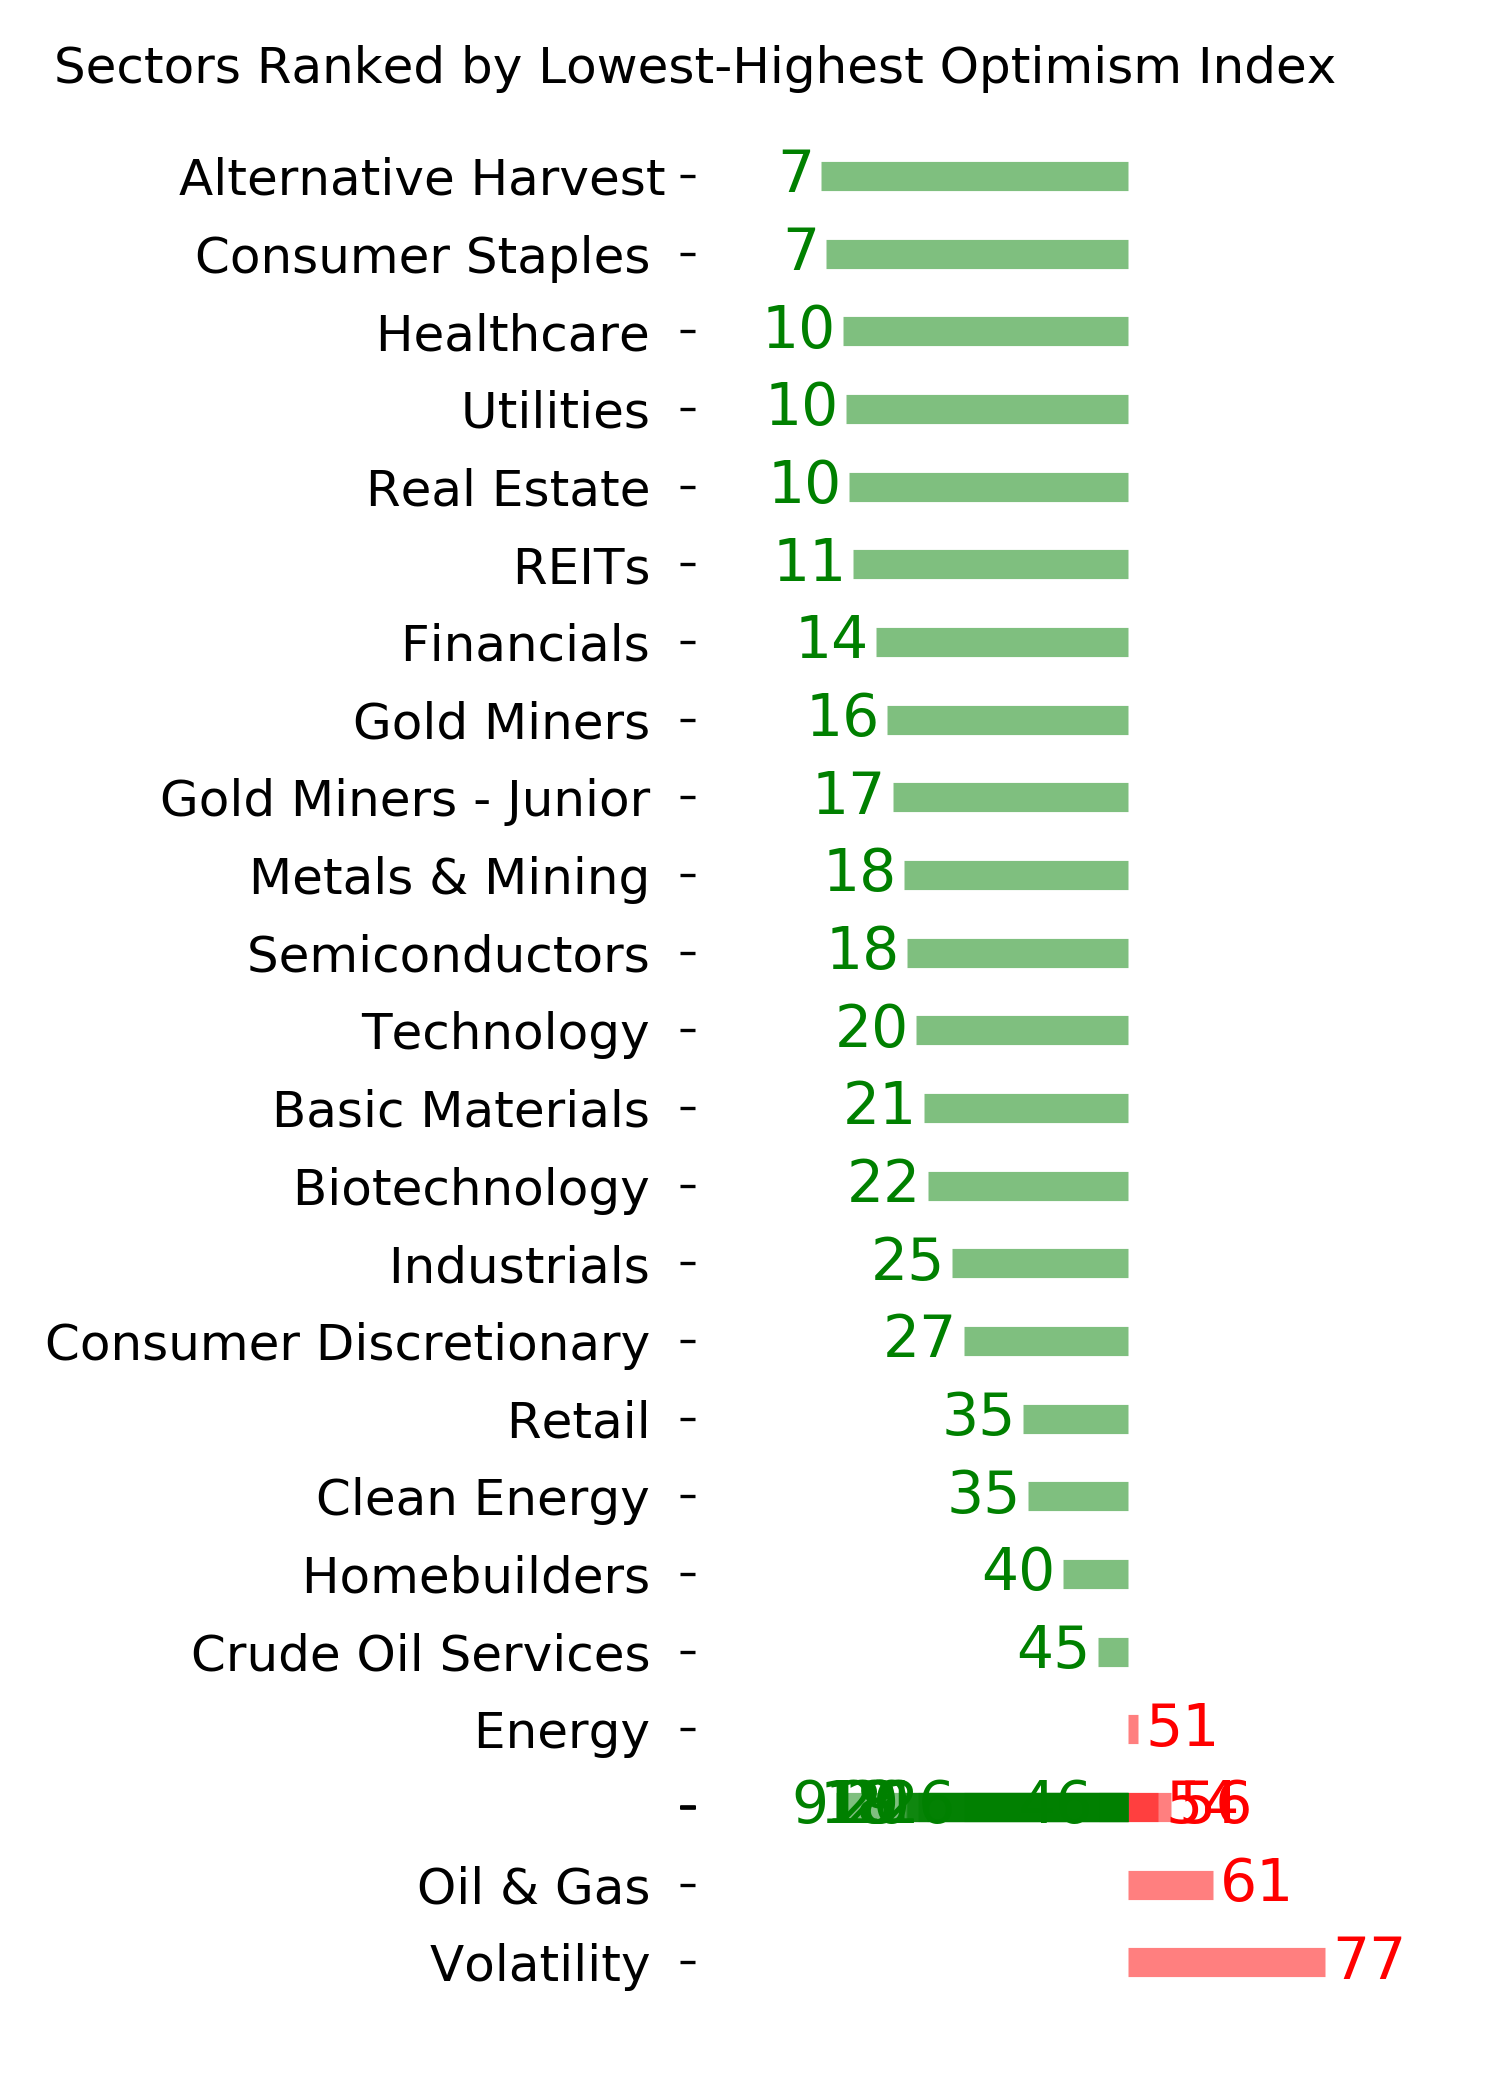
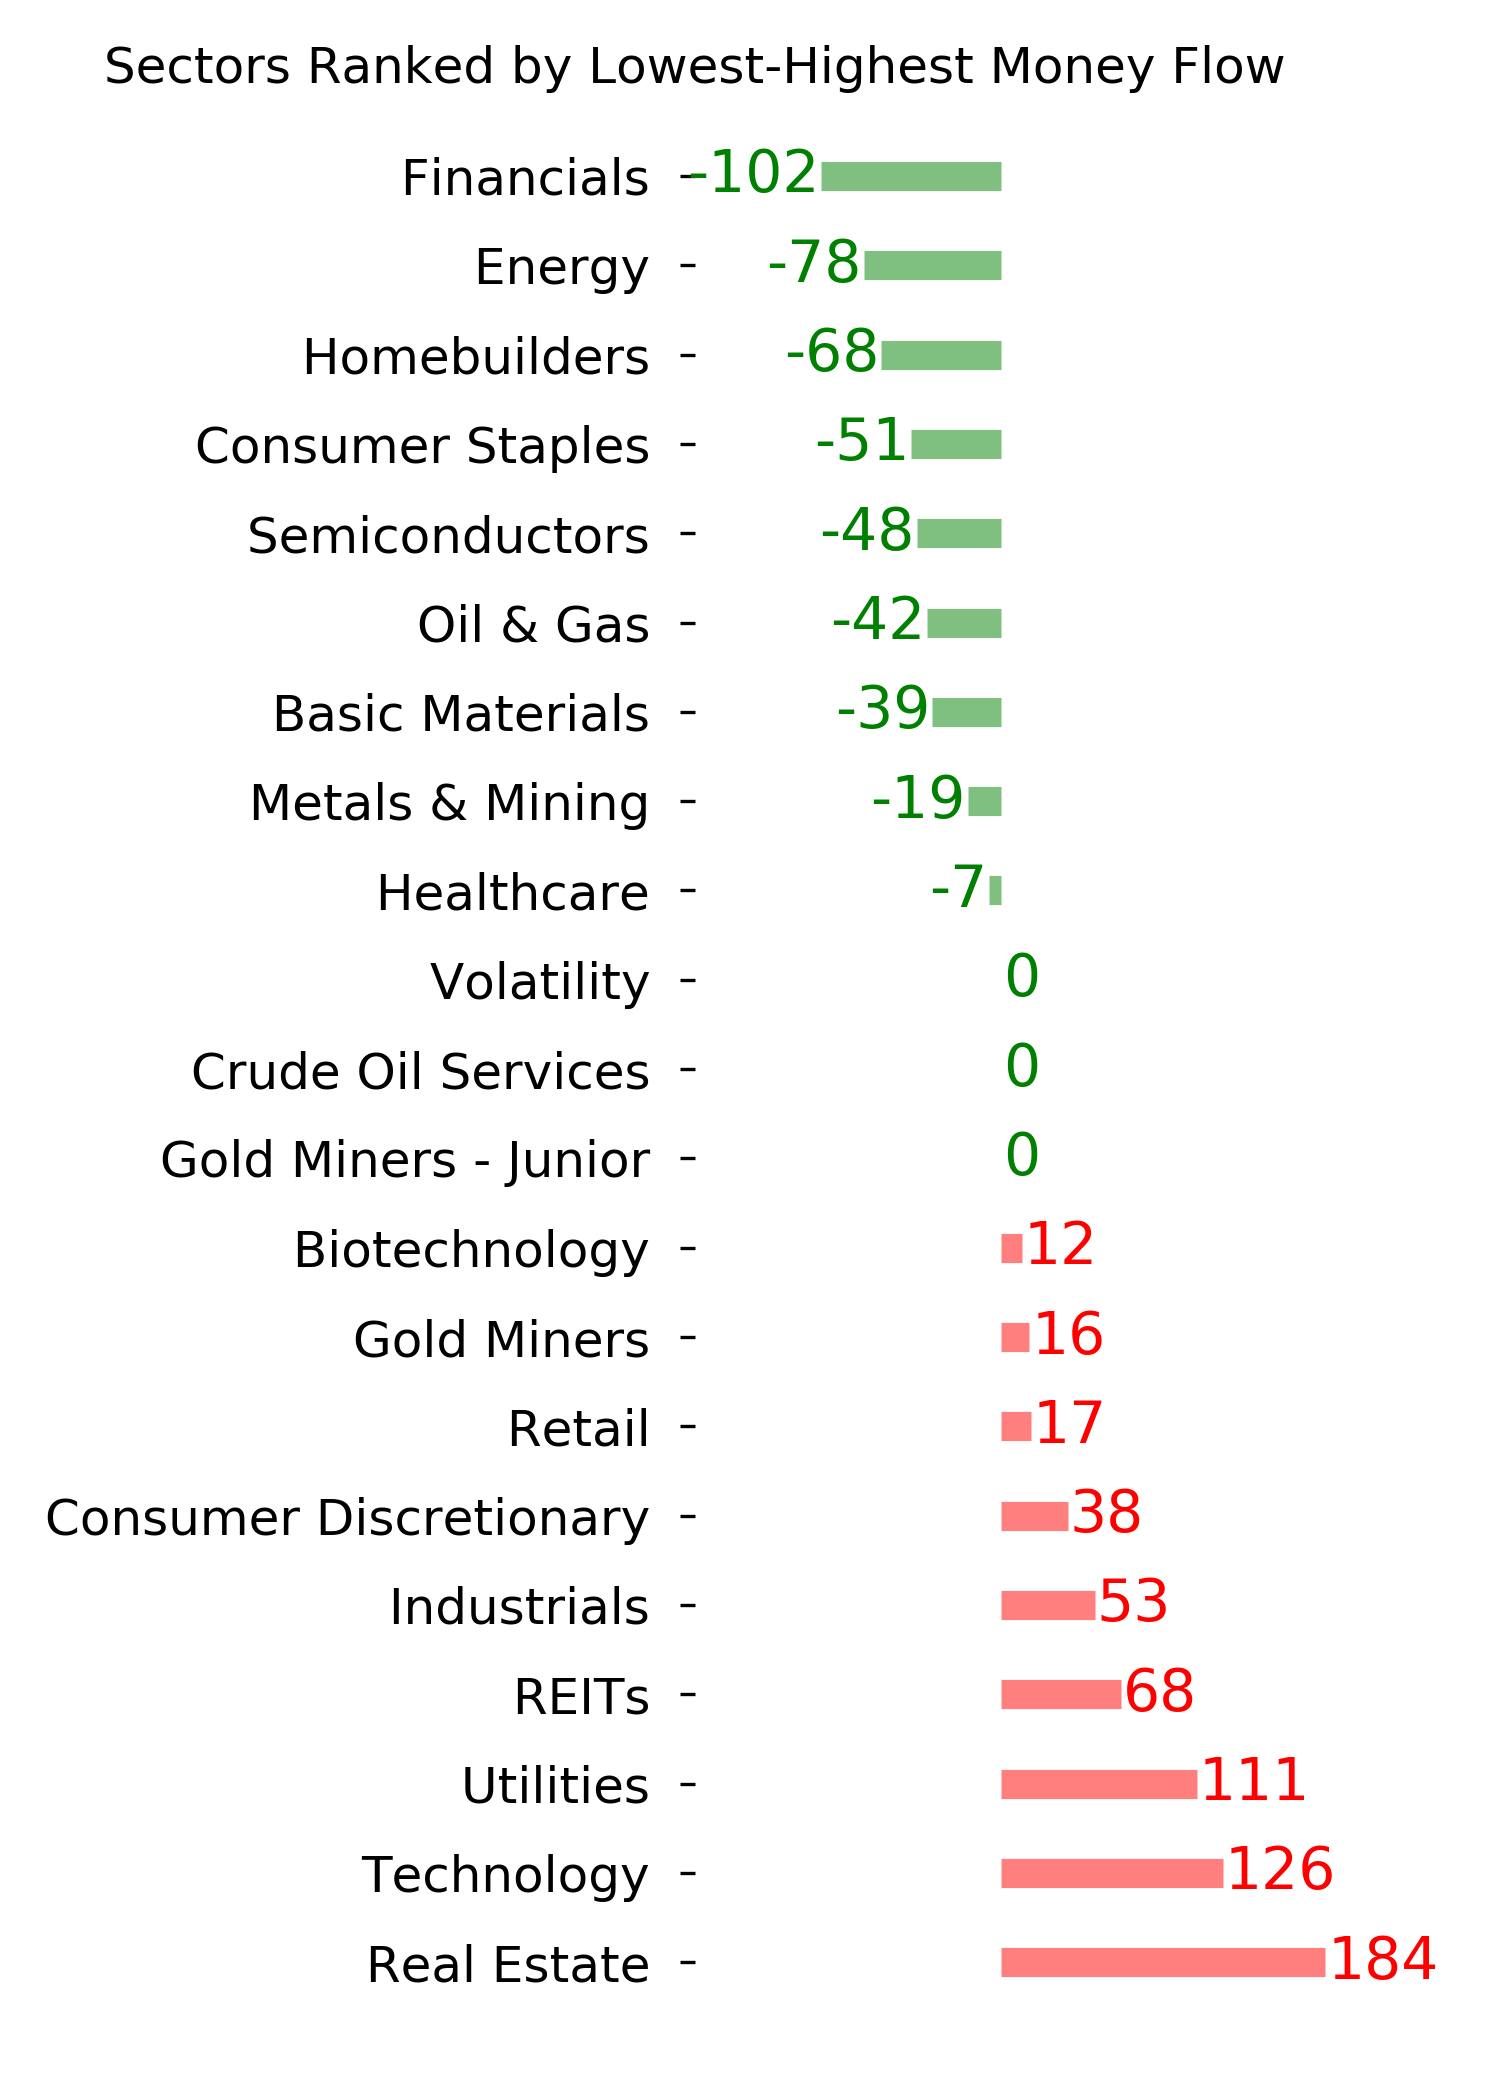
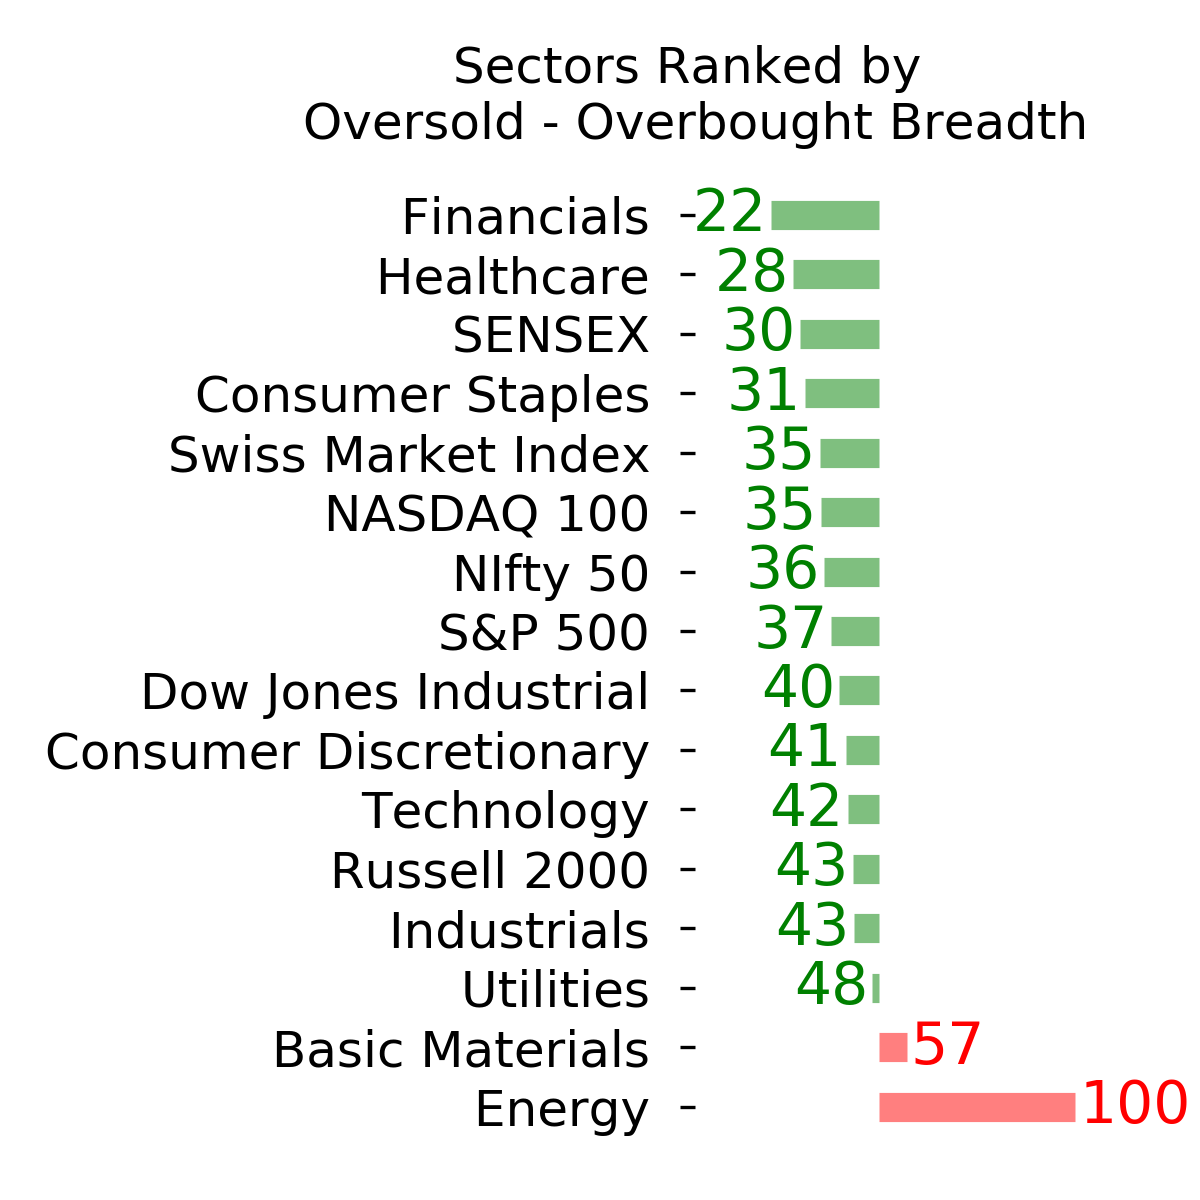
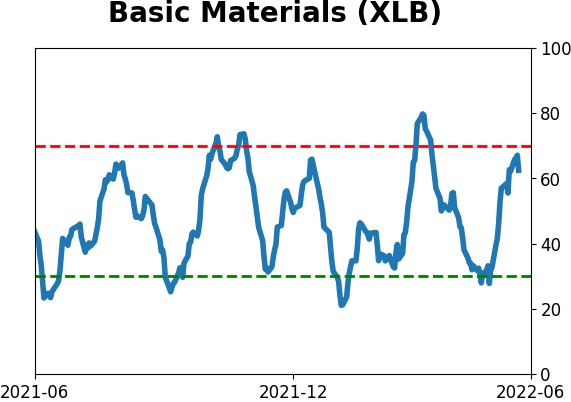
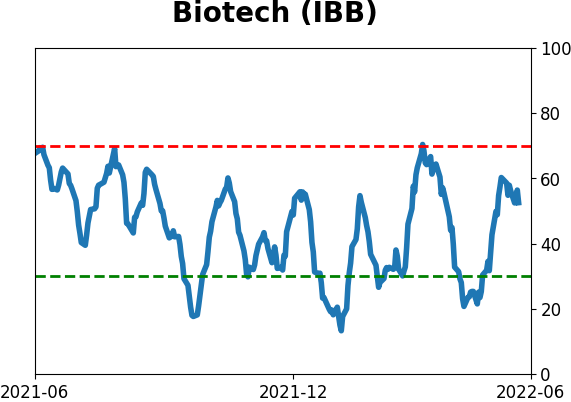
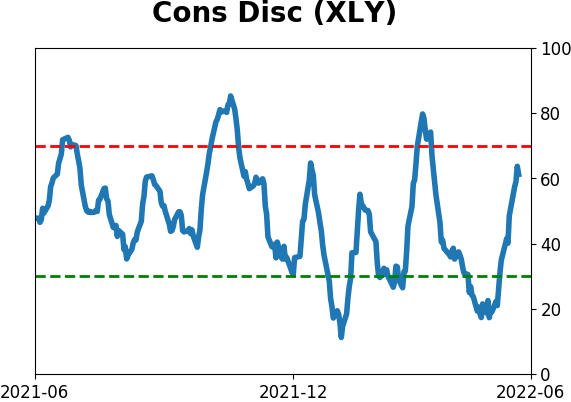
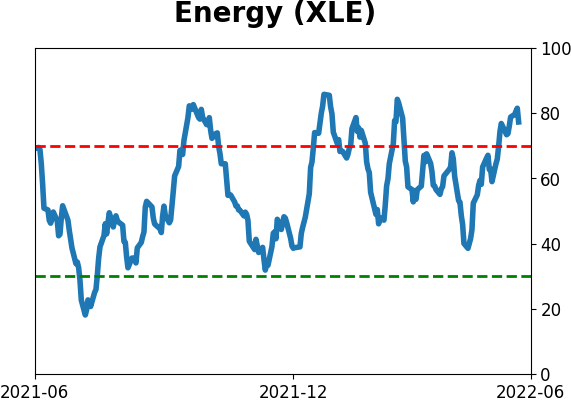
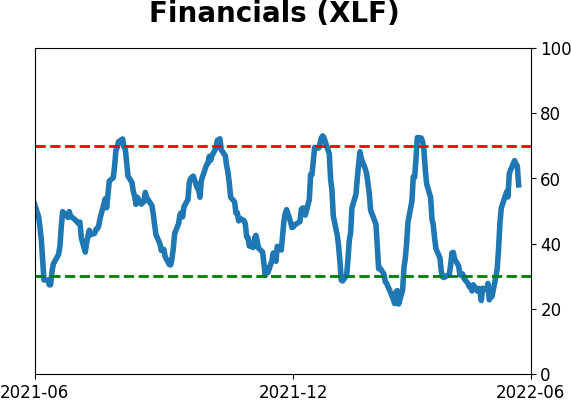
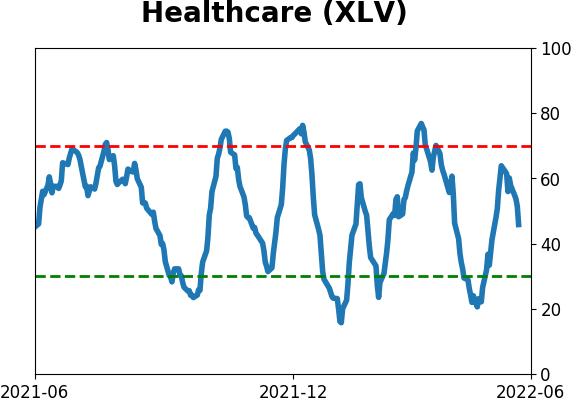
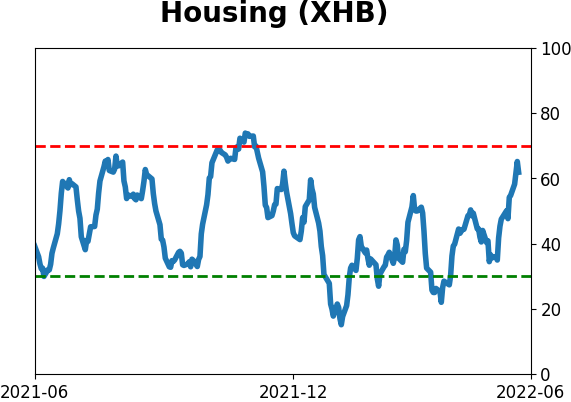
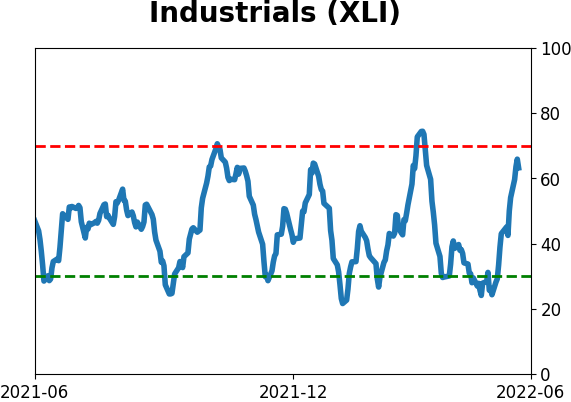
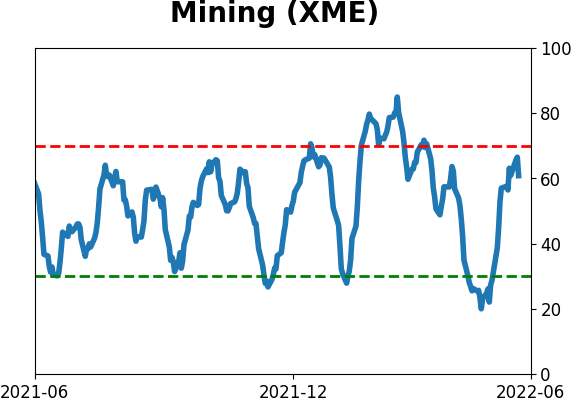
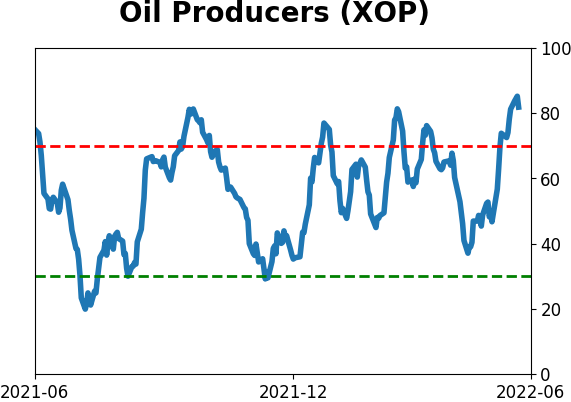
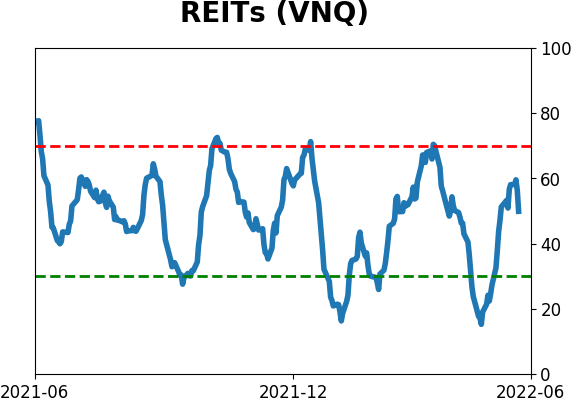
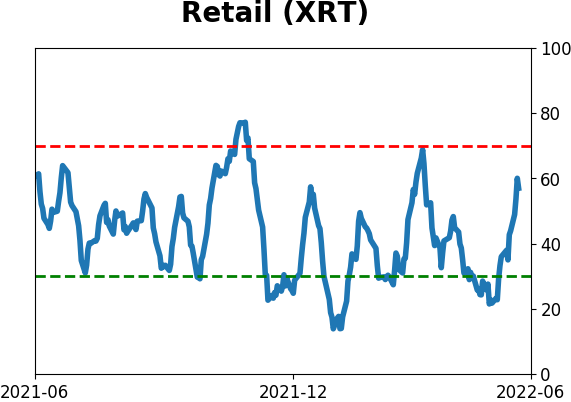
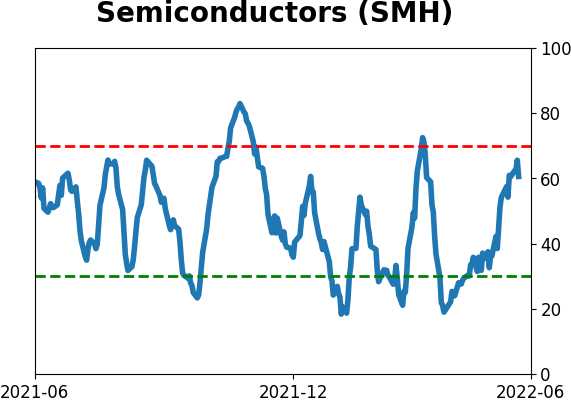
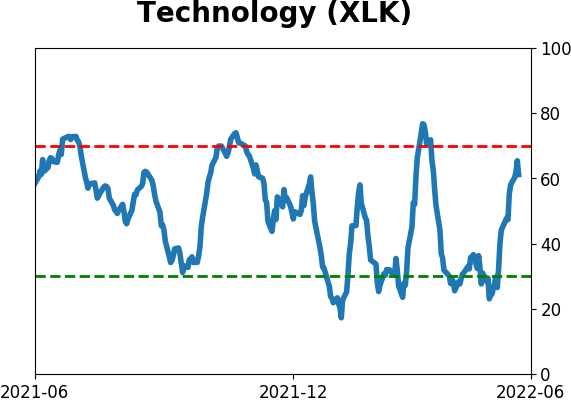
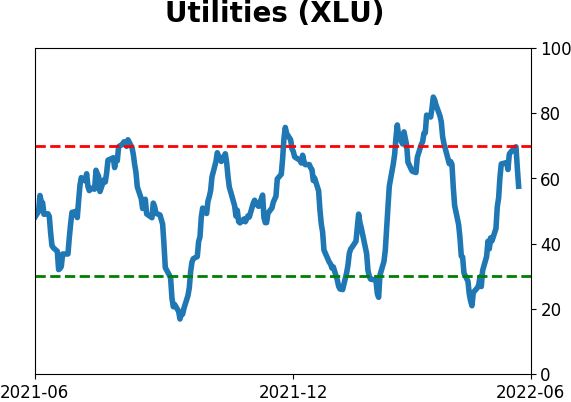
Sector ETF's - 10-Day Moving Average
|
|
|
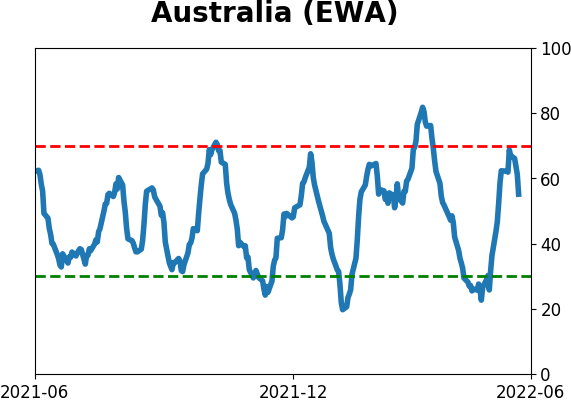
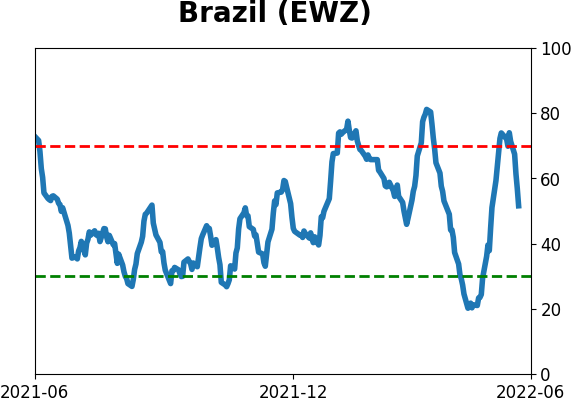
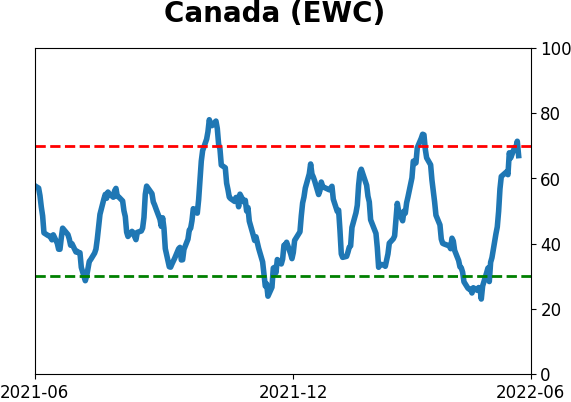
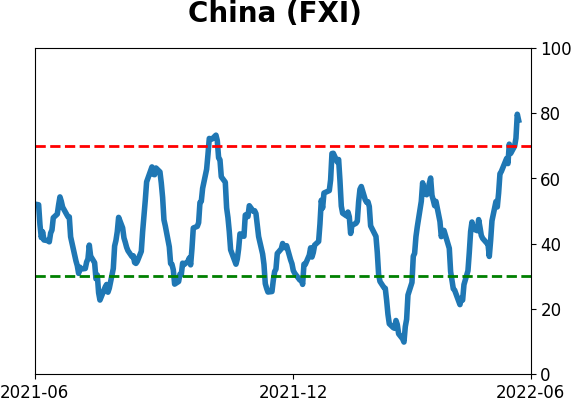
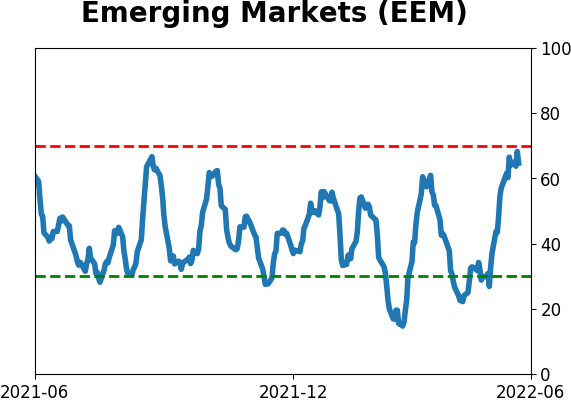
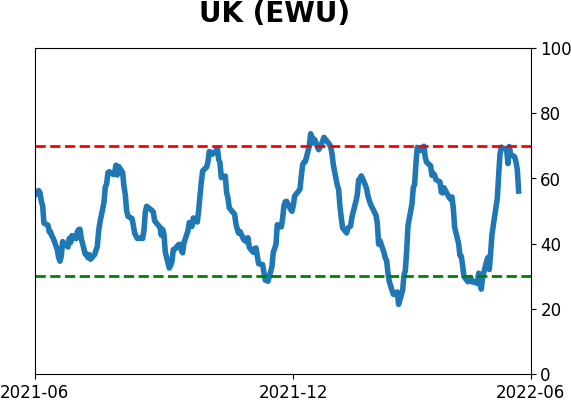
Country ETF's - 10-Day Moving Average
|
|
|
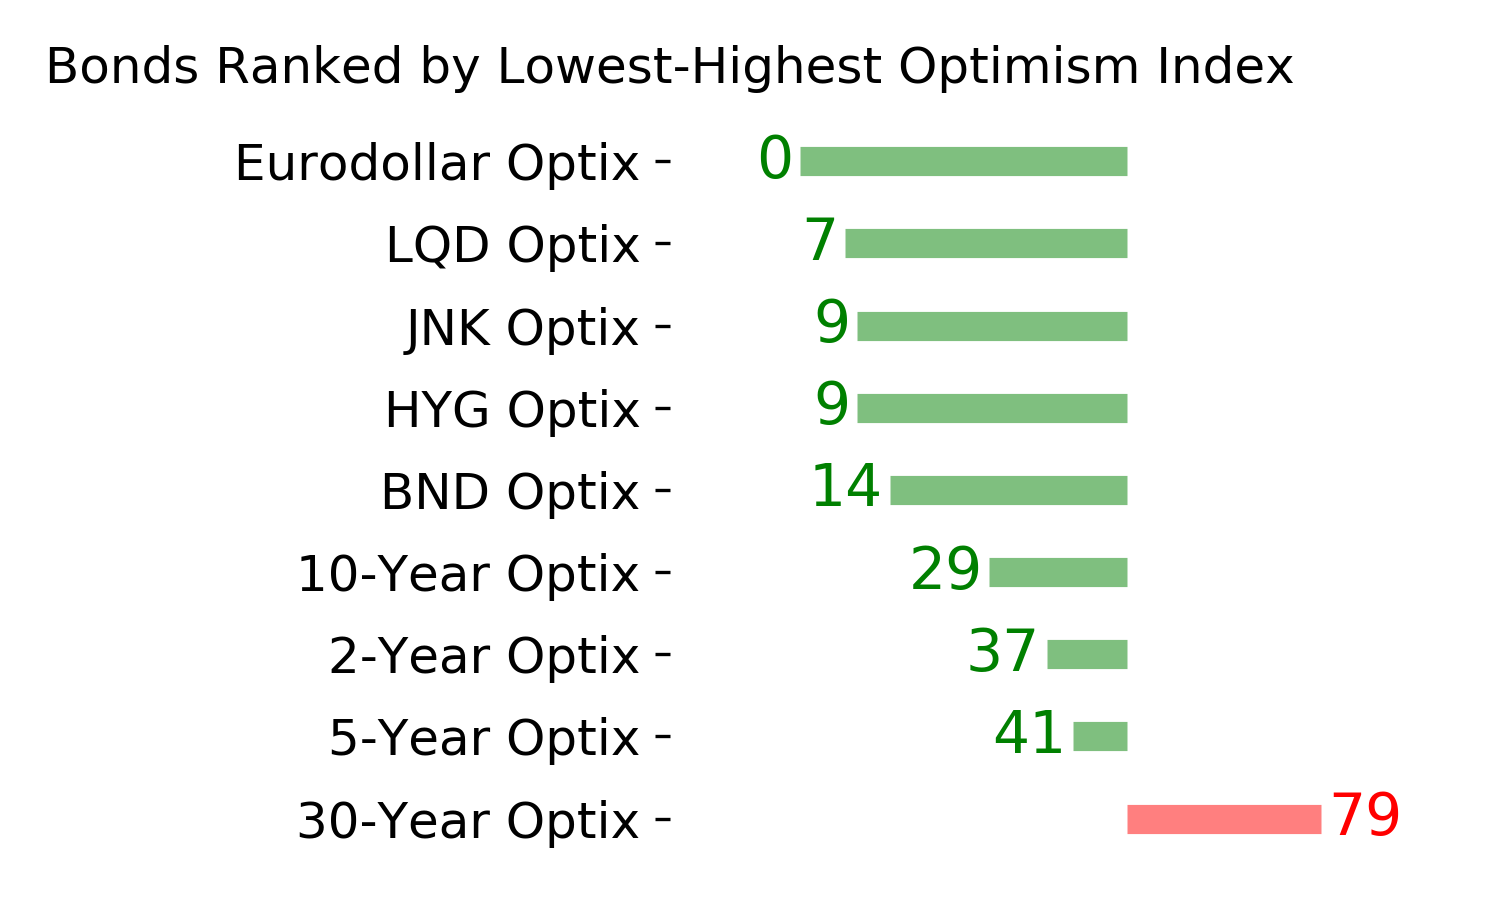
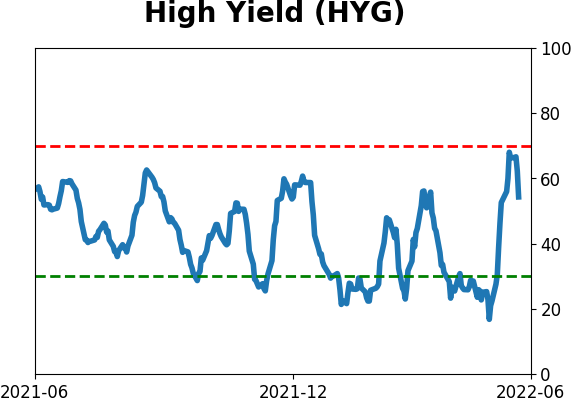
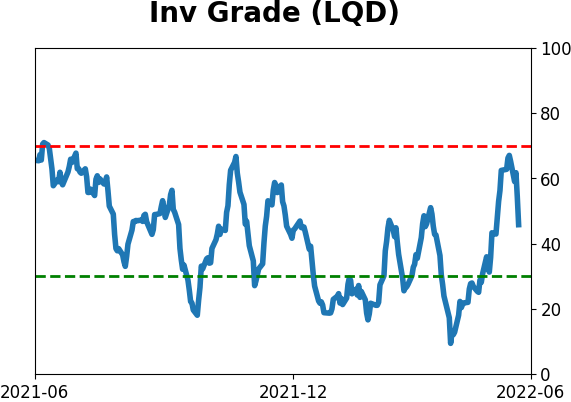
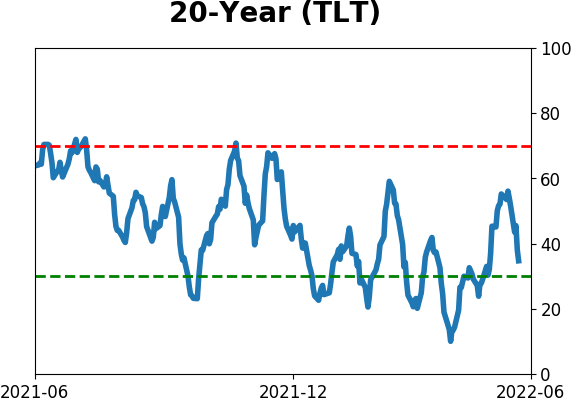
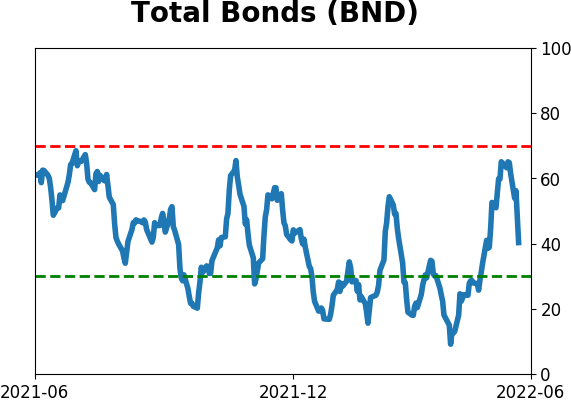
Bond ETF's - 10-Day Moving Average
|
|
|
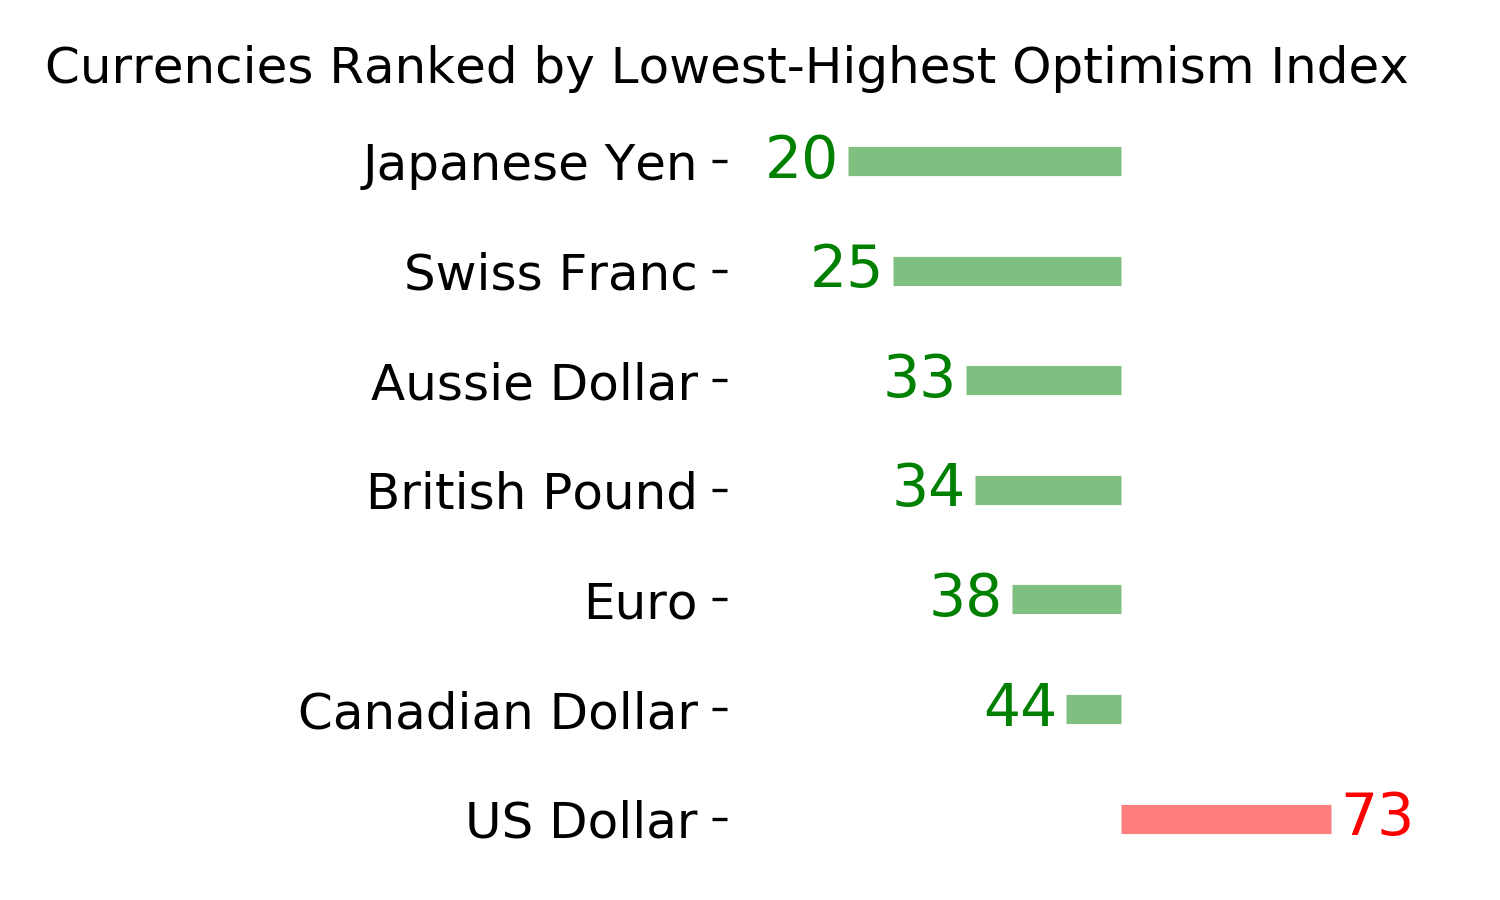
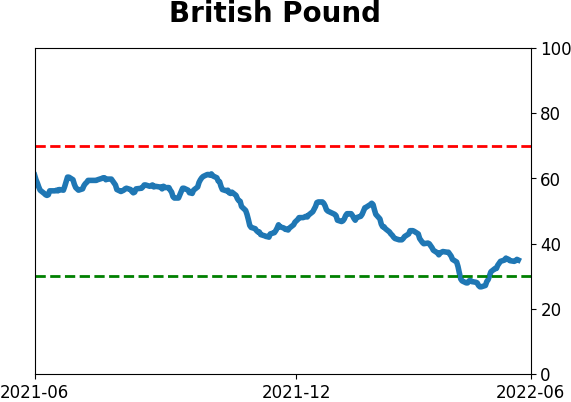
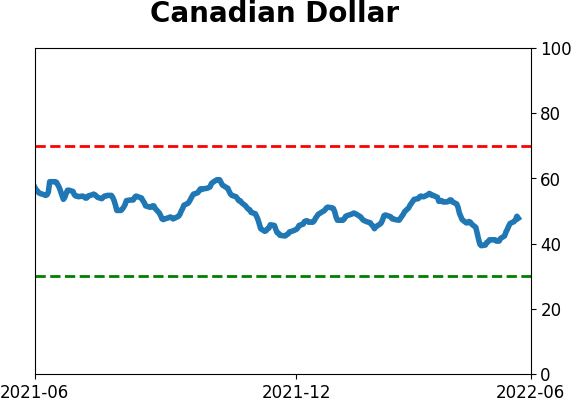
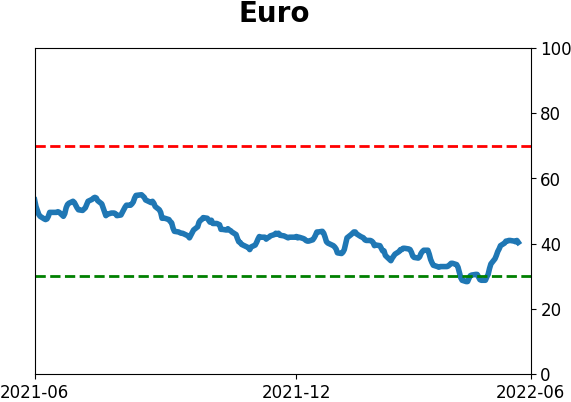
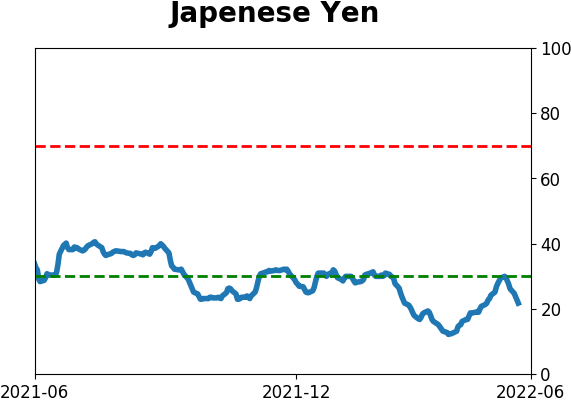
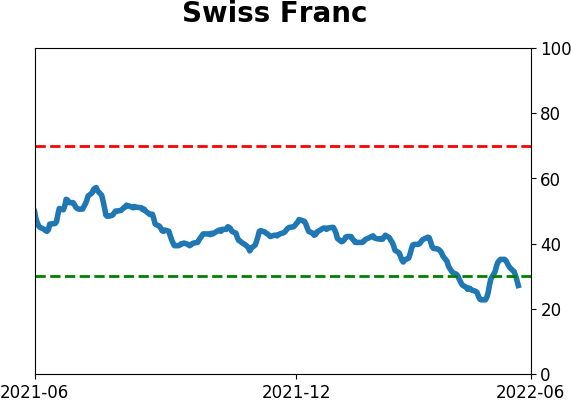
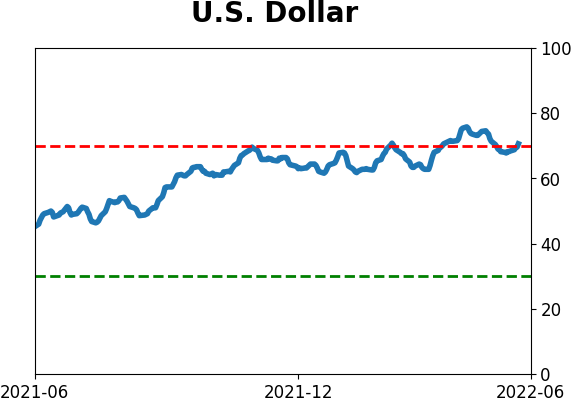
Currency ETF's - 5-Day Moving Average
|
|
|
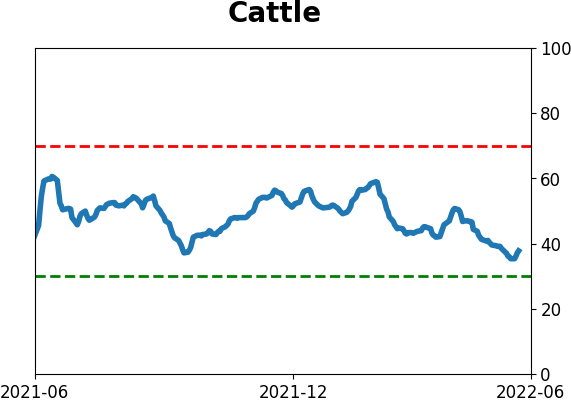
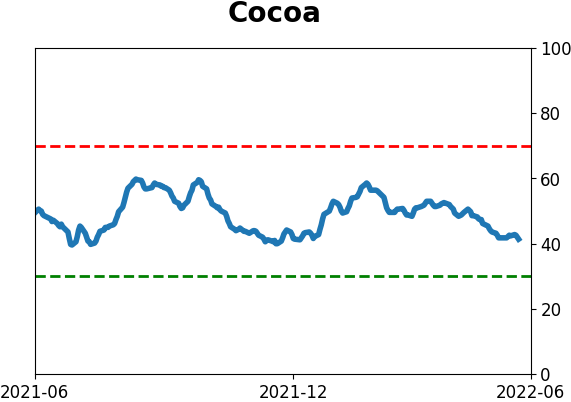
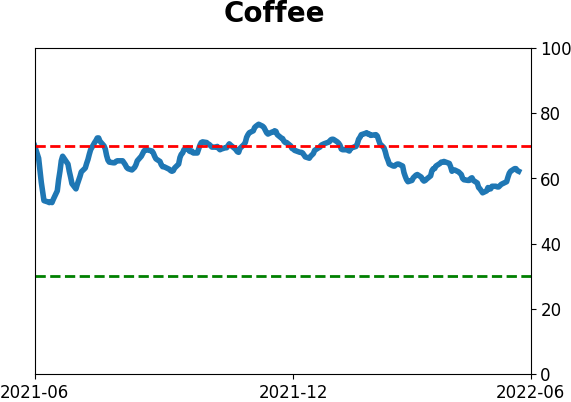
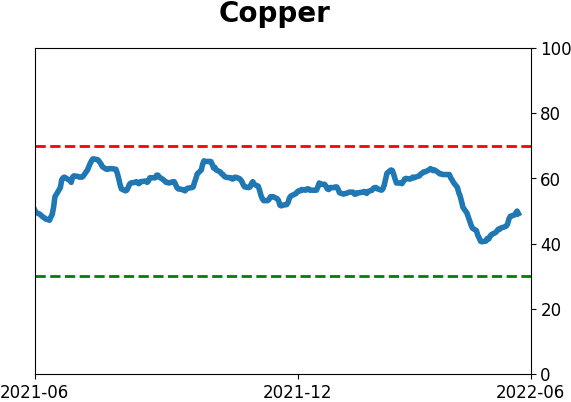
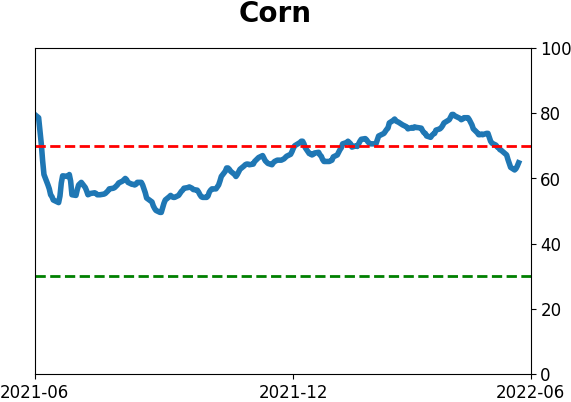
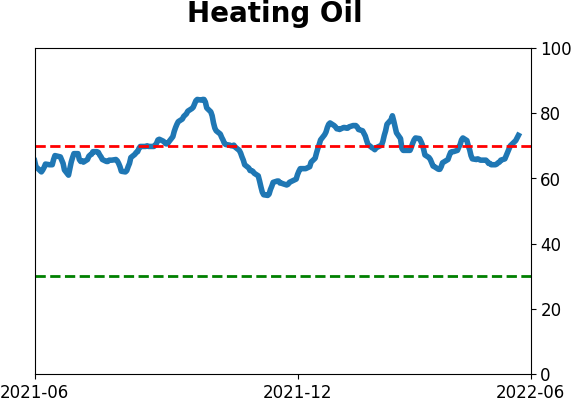
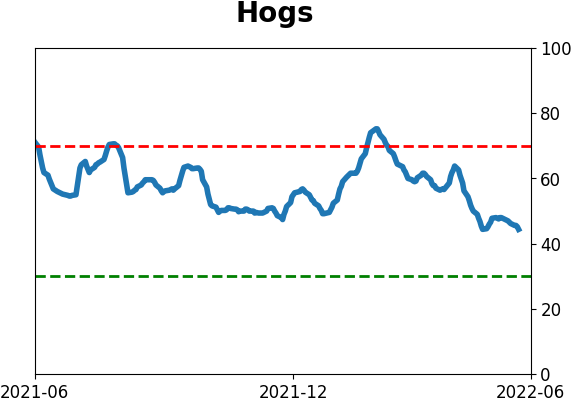
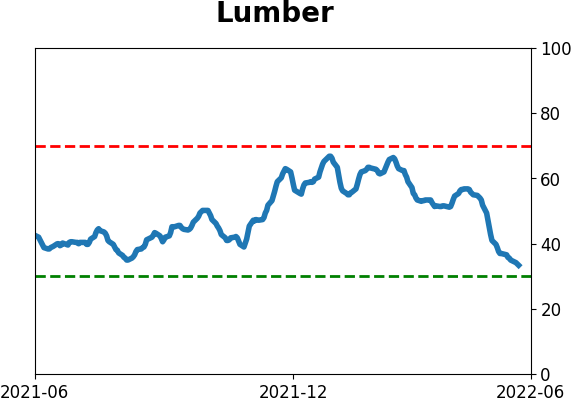
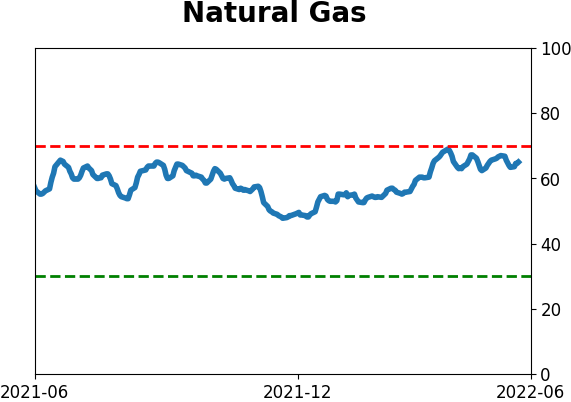
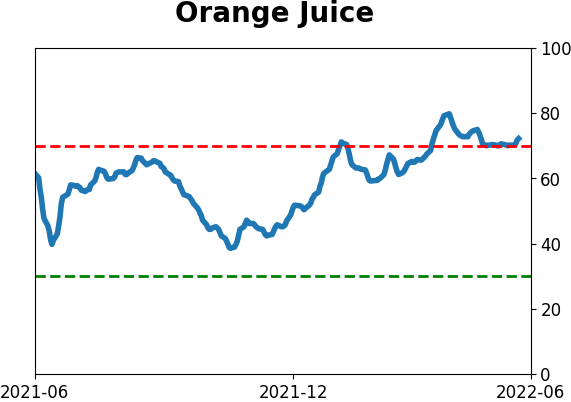
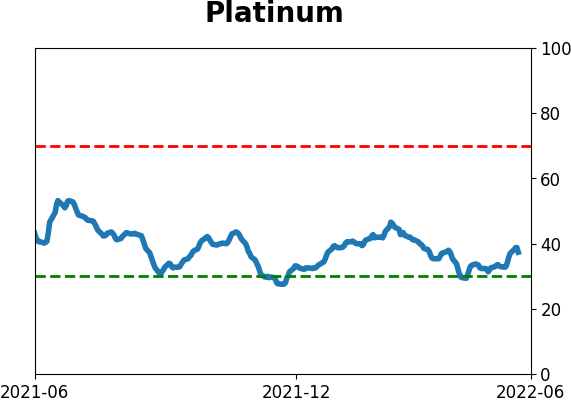
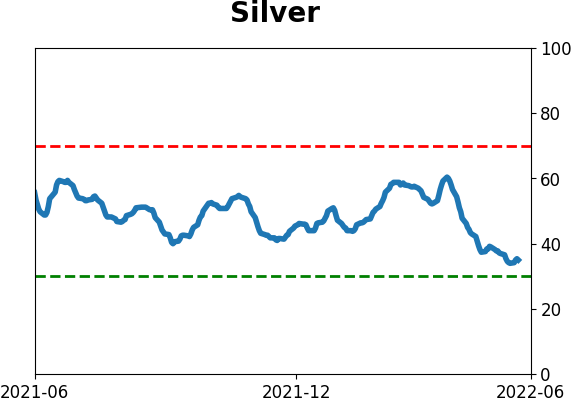
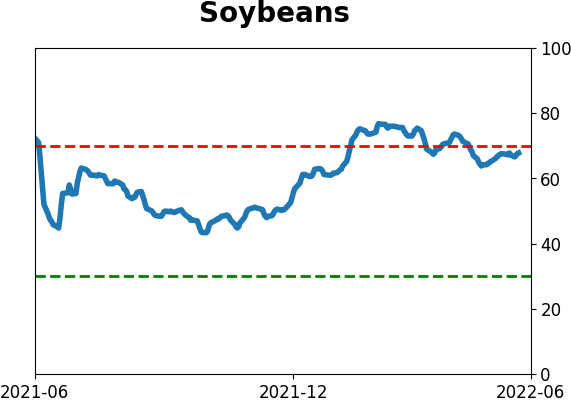
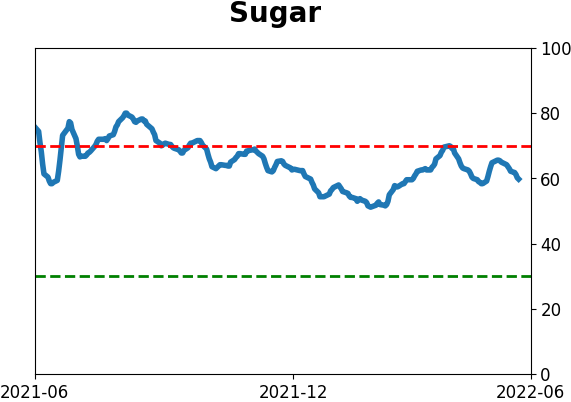
Commodity ETF's - 5-Day Moving Average
|
|