Headlines
|
|
Investors flee, with record sector ETF outflows:
Sentiment toward stocks fell to dramatic lows in May, and updated flows among sector exchange-traded funds show the damage. In May alone, investors pulled more than $10 billion from sector ETFs, a 22-year record. Discretionary, Financial, and Industrial funds have suffered the worst outflows over the past year.
|
Smart / Dumb Money Confidence
|
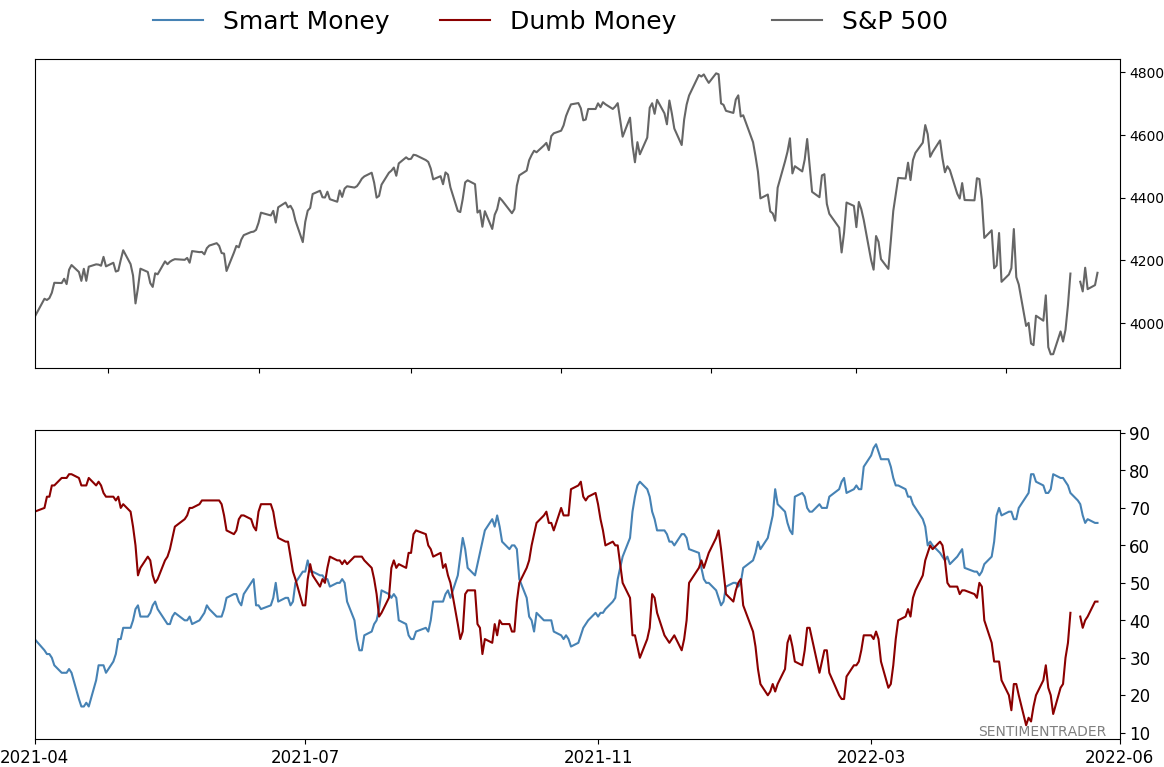
Smart Money Confidence: 66%
Dumb Money Confidence: 45%
|
|
Risk Levels
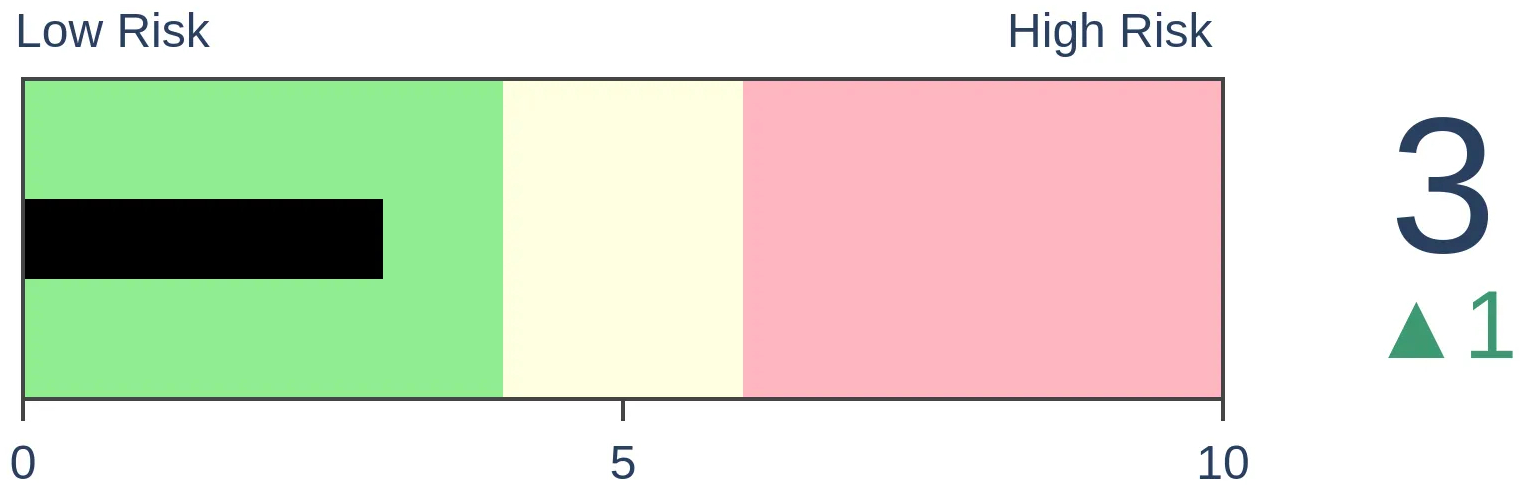
Stocks Short-Term
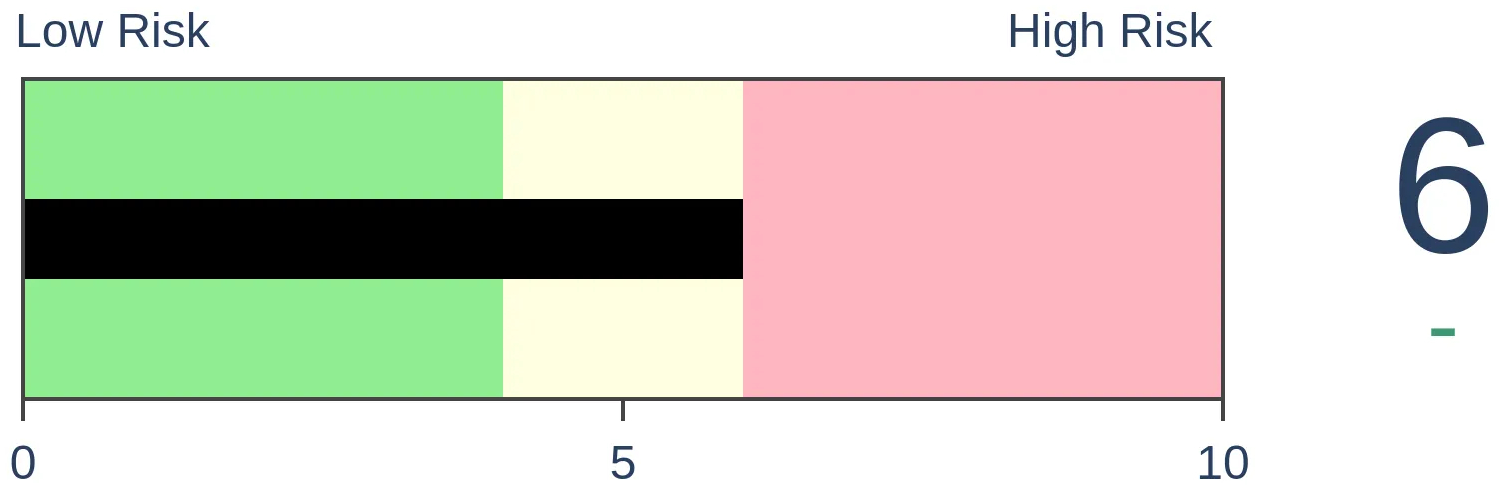
|
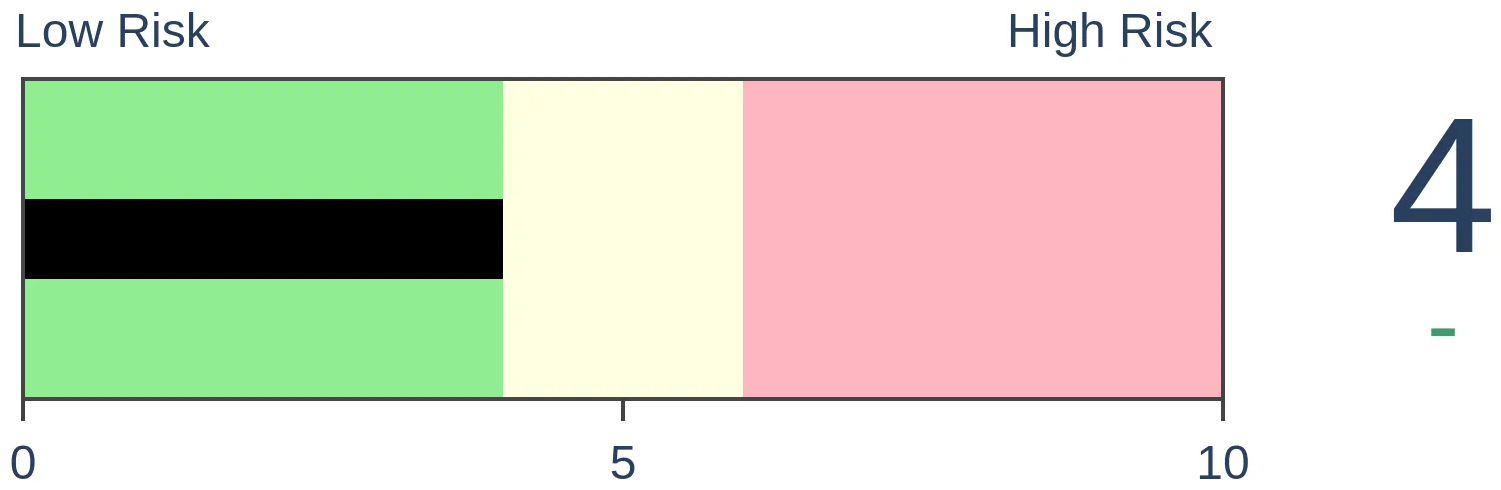
Stocks Medium-Term
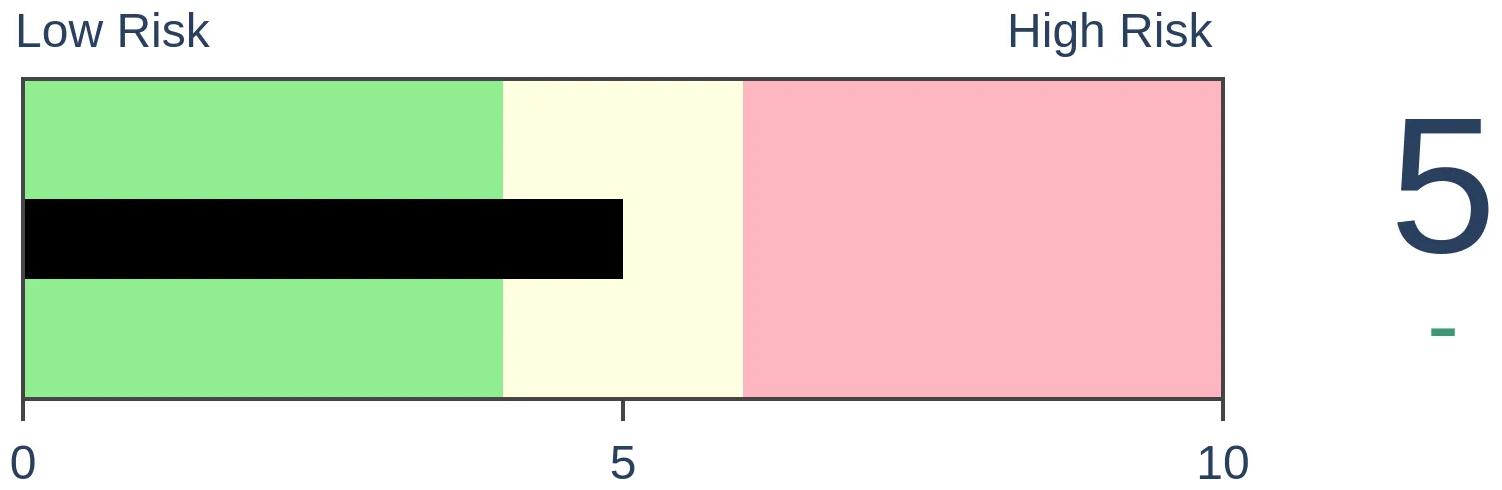
|
|
Bonds
|
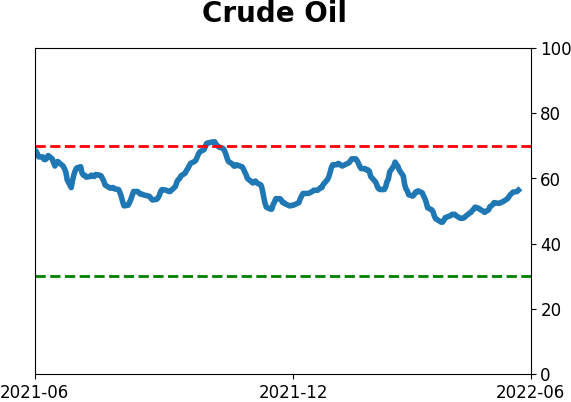
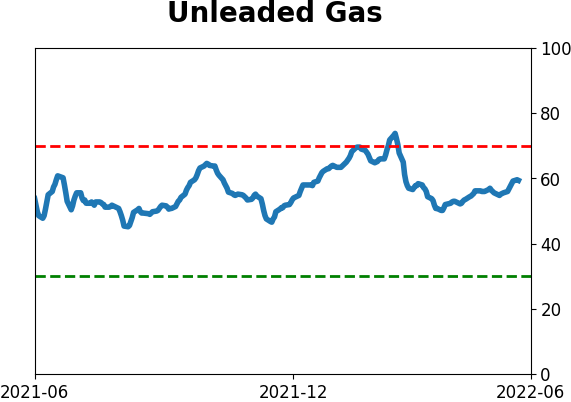
Crude Oil

|
|
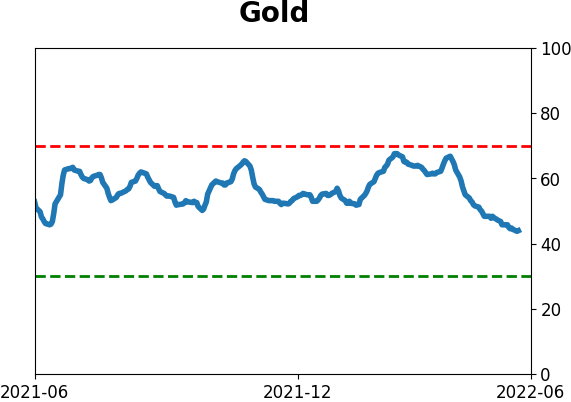
Gold

|
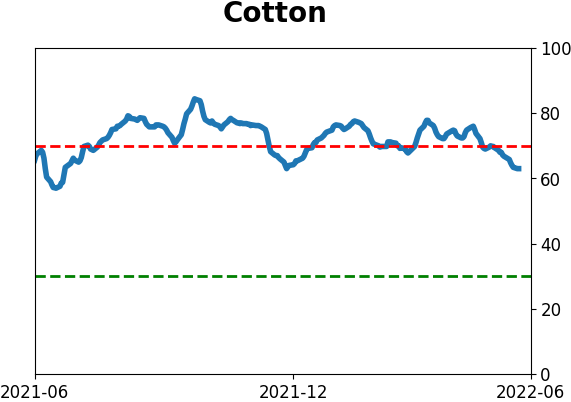
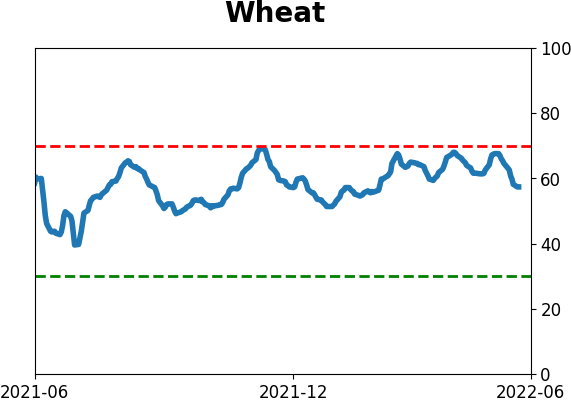
Agriculture
|
|
Research
By Jason Goepfert
BOTTOM LINE
Sentiment toward stocks fell to dramatic lows in May, and updated flows among sector exchange-traded funds show the damage. In May alone, investors pulled more than $10 billion from sector ETFs, a 22-year record. Discretionary, Financial, and Industrial funds have suffered the worst outflows over the past year.
FORECAST / TIMEFRAME
None
|
Key points:
- In May, investors were busy selling sector ETFs, with a record outflow of more than $10 billion
- As a percentage of assets, May's outflow ranked as the 6th-largest in more than 22 years
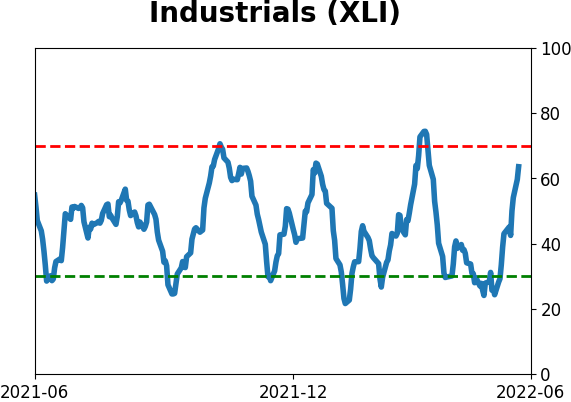
- Discretionary, Financial, and Industrial sectors saw the worst outflows over the past year
A record month for sector outflows
Investors weren't kidding around in May. They got scared - panicked, even - and voted with their feet. There were plenty of signs that sentiment toward stocks (and bonds) was washed out, and those signs keep piling up.
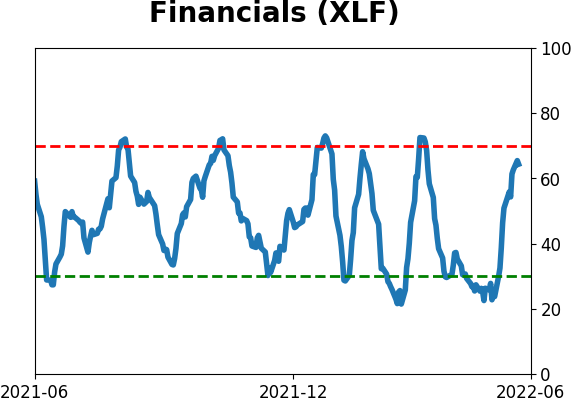
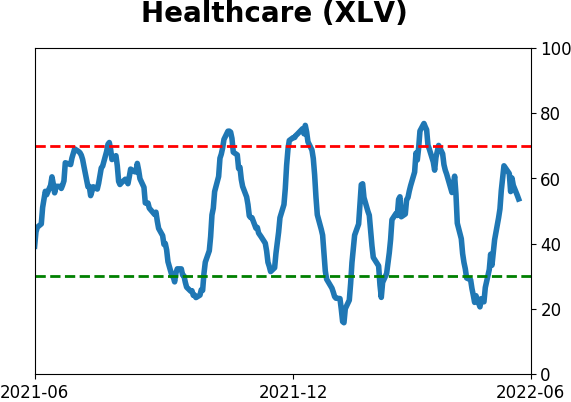
In May alone, investors pulled more than $10 billion from sector ETFs. Few sectors were spared. Financials bore the brunt of the redemptions, with more than $5.2 billion pulled from funds like XLF, VFH, and KRE. Health Care was one of the few to see inflows and the only substantial one.
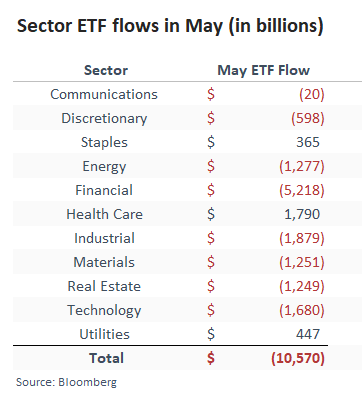
The total outflow of $10.6 billion was the worst since at least the year 2000. No month in over 20 years had seen a more concentrated exodus.
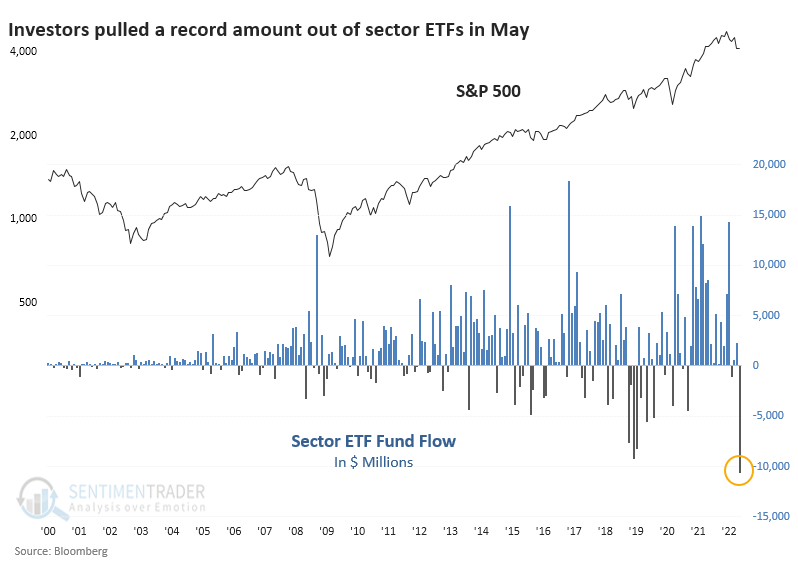
Obviously, markets have grown since 2000, so total assets under management (AUM) have also increased. As a percentage of AUM, May's outflow was still substantial, the 6th-largest out of the past 269 months.
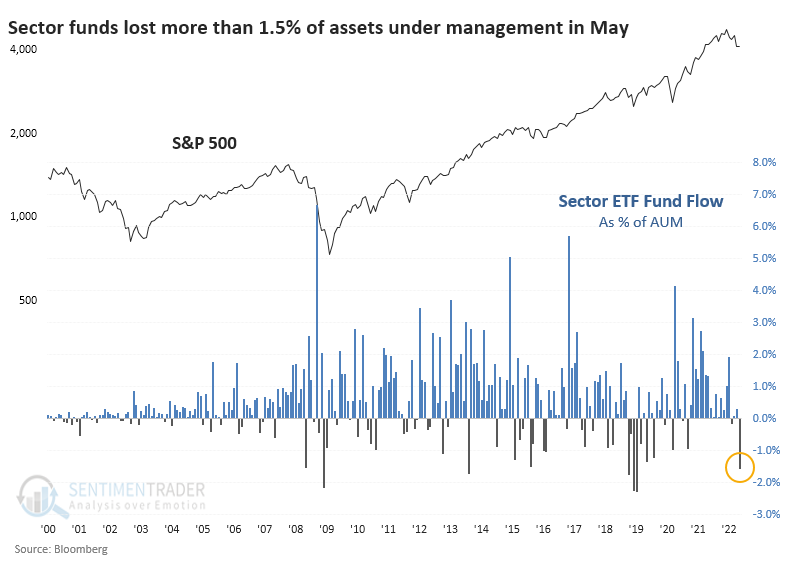
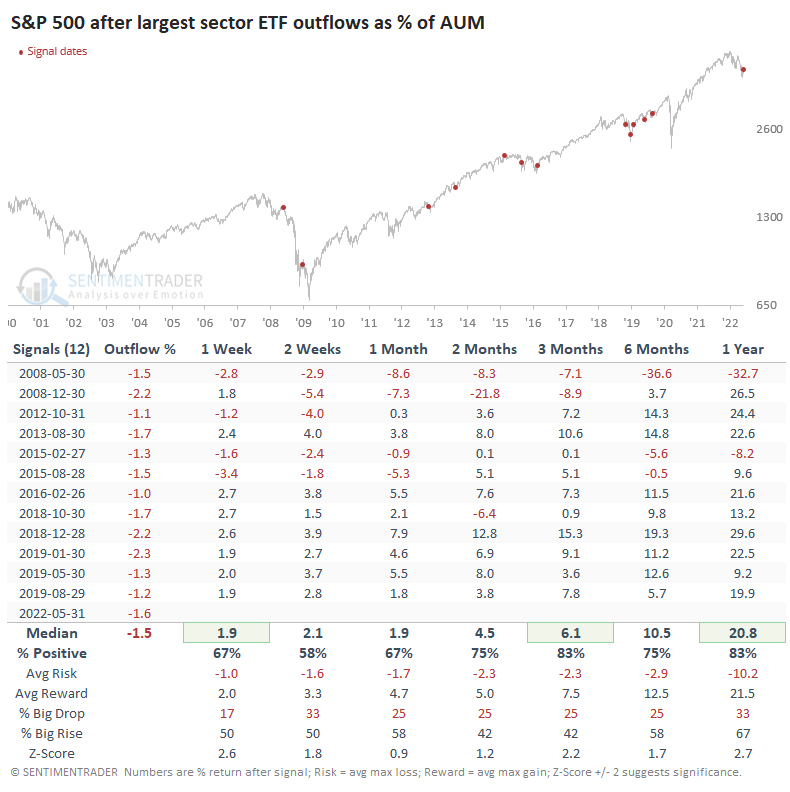
Returns in the S&P 500 were good after other months when investors pulled more than 1% of assets from sector ETFs. While this occurred right before a steep drop in 2008 and before the final plunge in early 2009, other signals saw almost universally positive returns. Of course, that was during a mostly rising market, so it was easier to show a positive return.
Investors sell Discretionary, Financial, and Industrial sectors to historic degrees
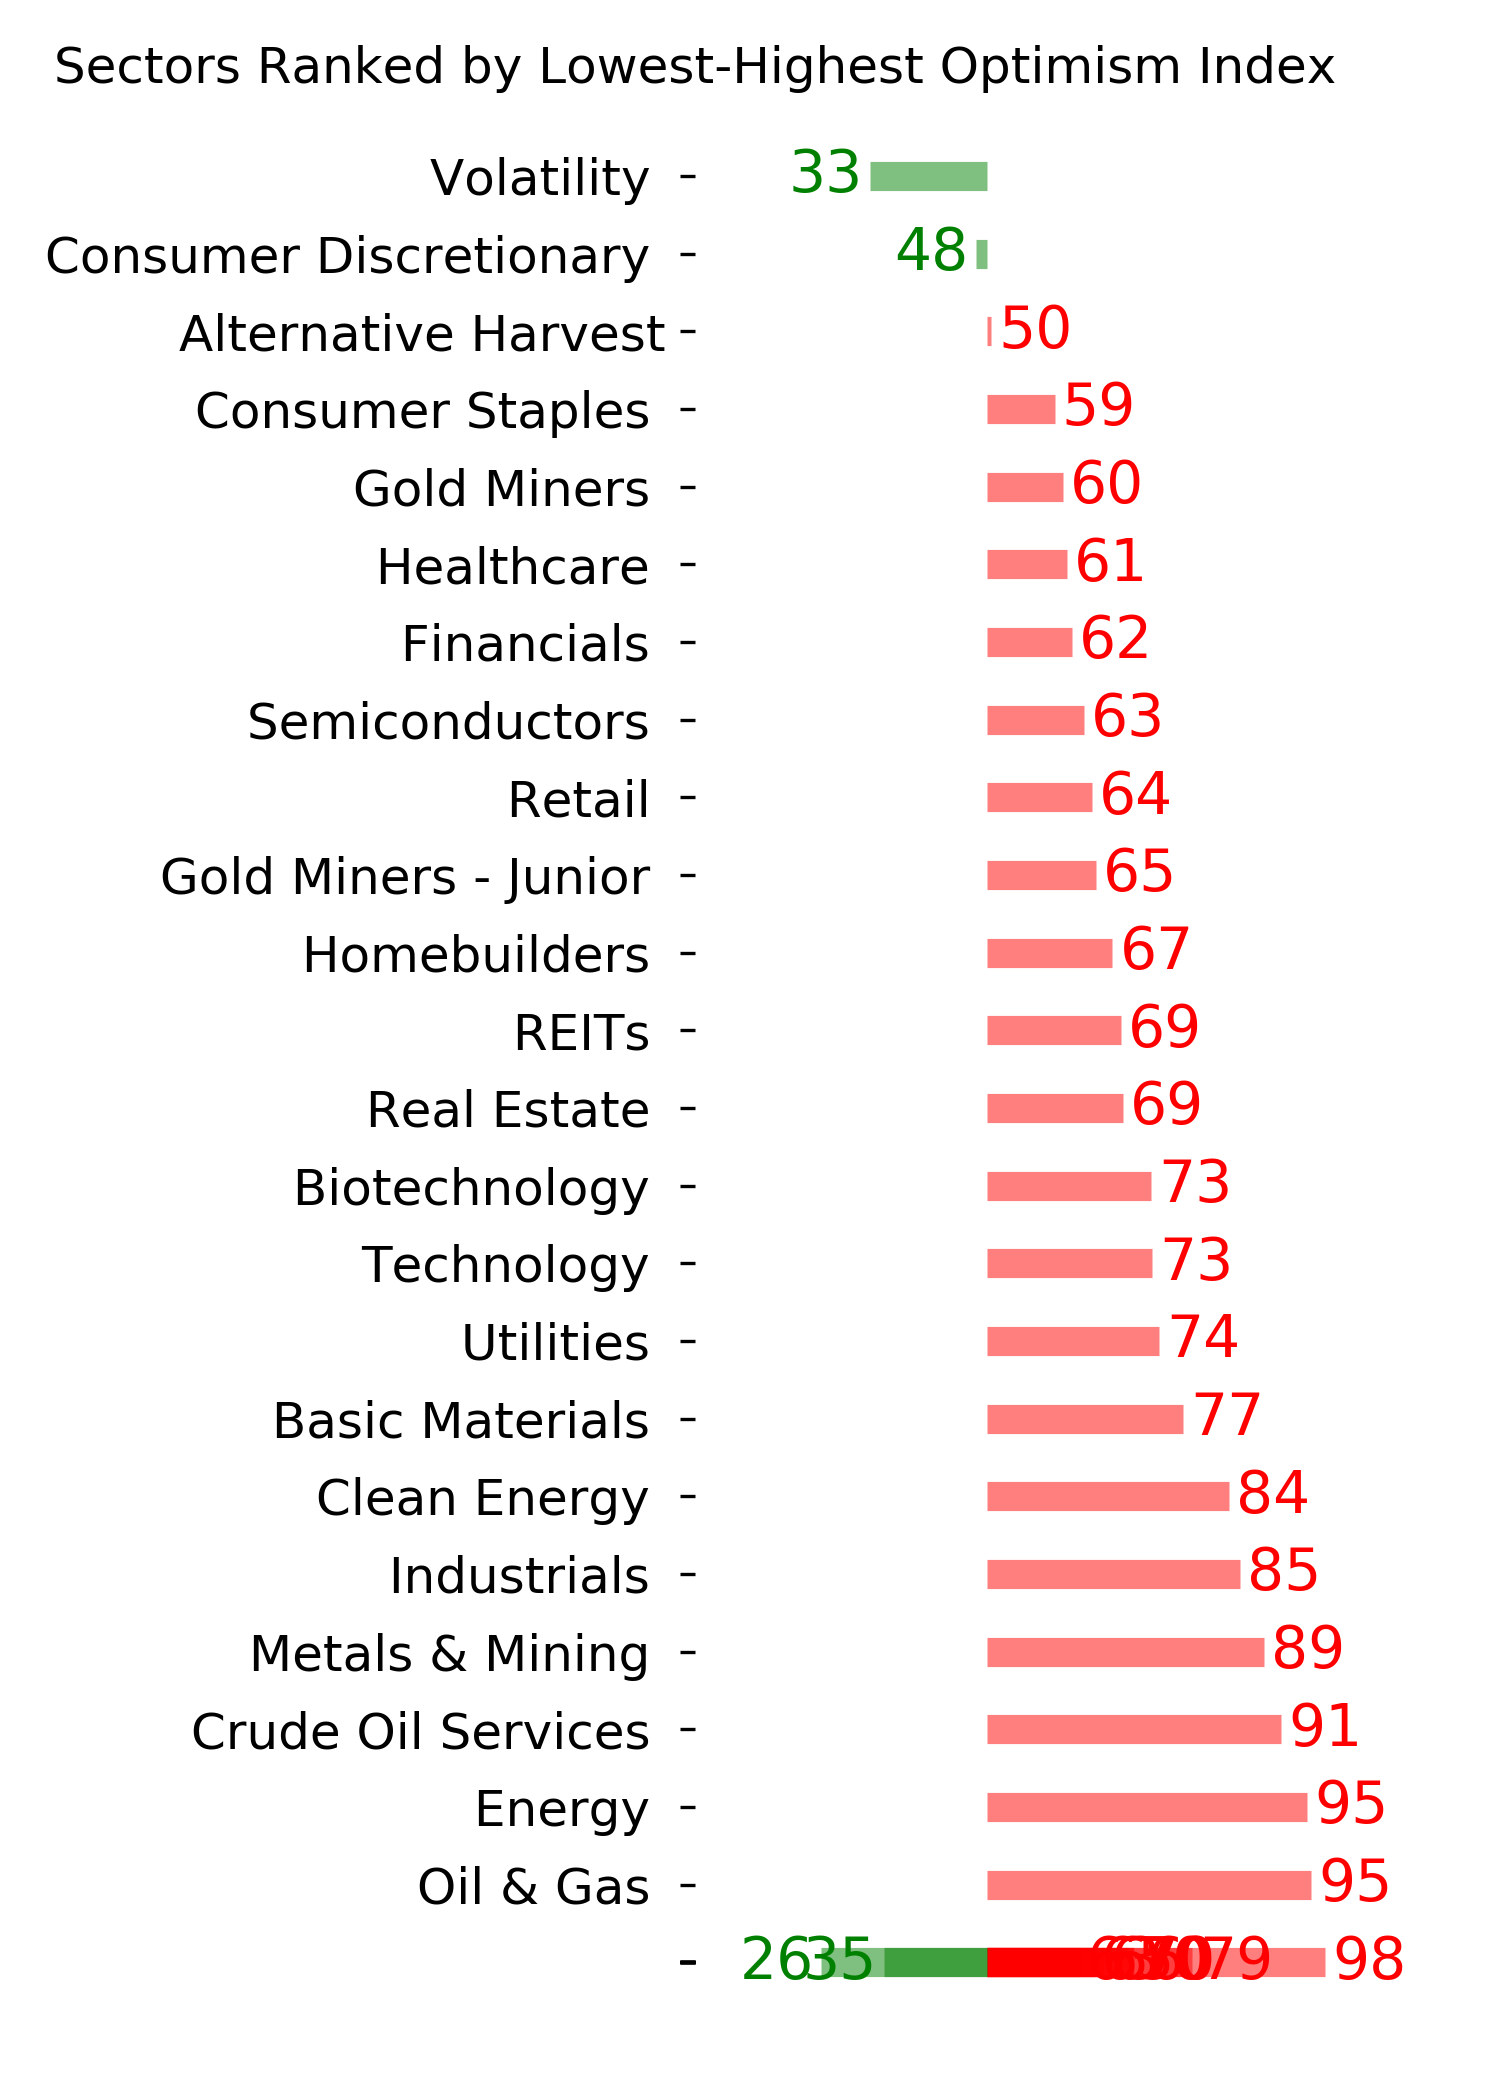
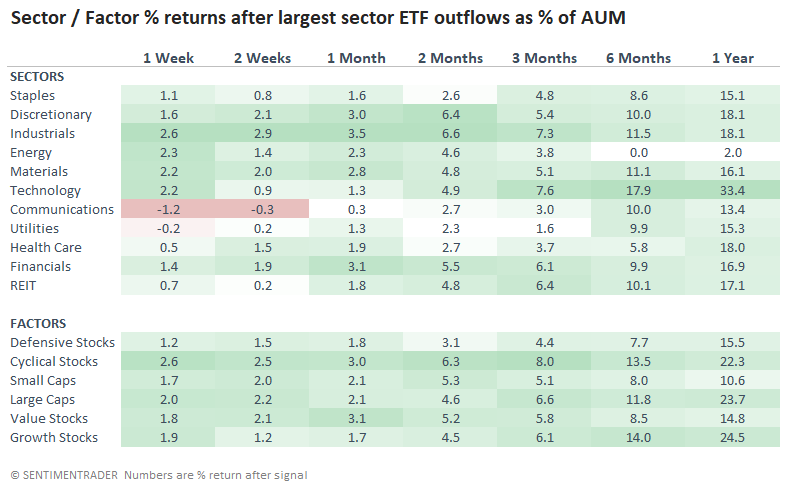
Sector returns after these signals were a sea of green, with the darkest colors (more extreme returns) belonging to some of the higher-beta groups. Technology did well, as did the more general Cyclical, Large-Cap, and Growth factors.
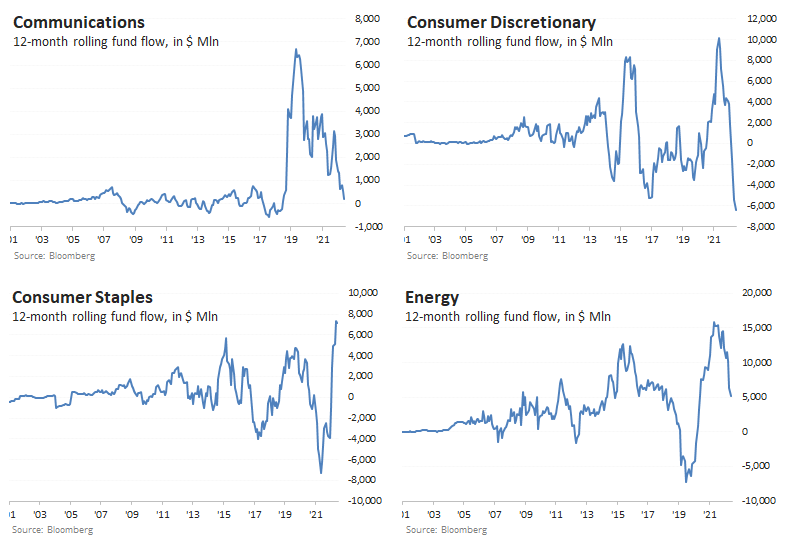
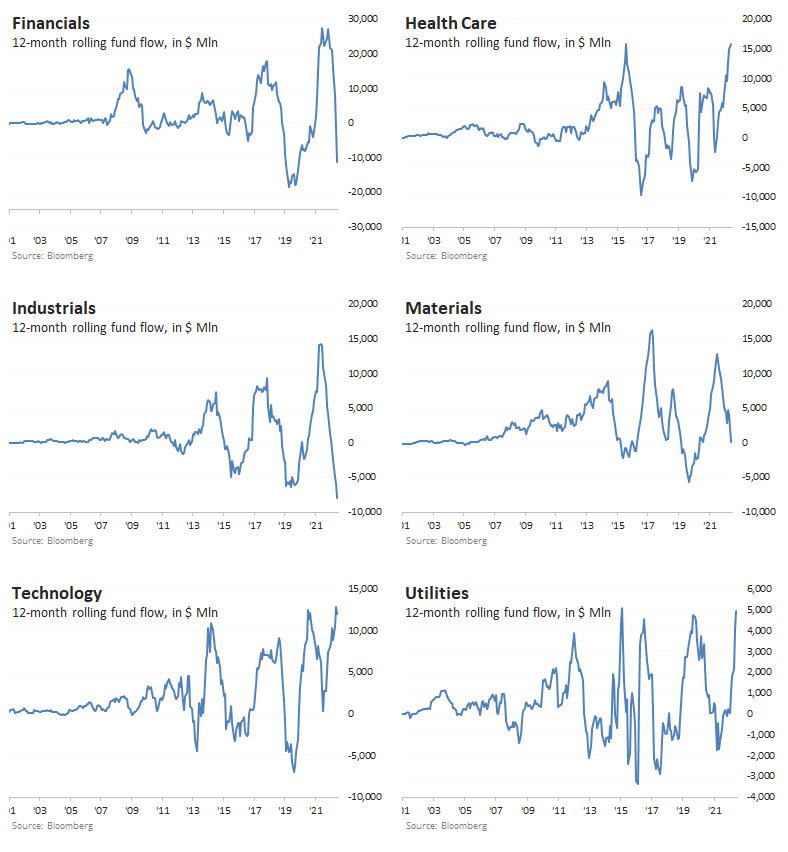
The rolling 12-month flows among the sectors show wild dispersion. Some are at or near 20-year lows (Discretionary, Financials, Industrials - not surprisingly, those heavily influenced by rising rates), while others are at or near the opposite extreme (Staples, Health Care, Technology, Utilities). There is a modest contrary tint to sector ETF flows, with massive outflows being more of a bullish sign than extreme inflows are a bearish one.
What the research tells us...
May finally managed to be a slight reprieve to many investors, as stock and bond markets tried to find a bottom as selling pressure ebbed from historic extremes. During the early part of the month, sentiment stretched to an atrocious level, and it wasn't just in surveys. Investors did what they said they would do, which is to sell. The good part about that is the selling was so heavy that it suggests an extreme. That should help with the idea of a relief rally in the weeks or months ahead.
Indicators at Extremes
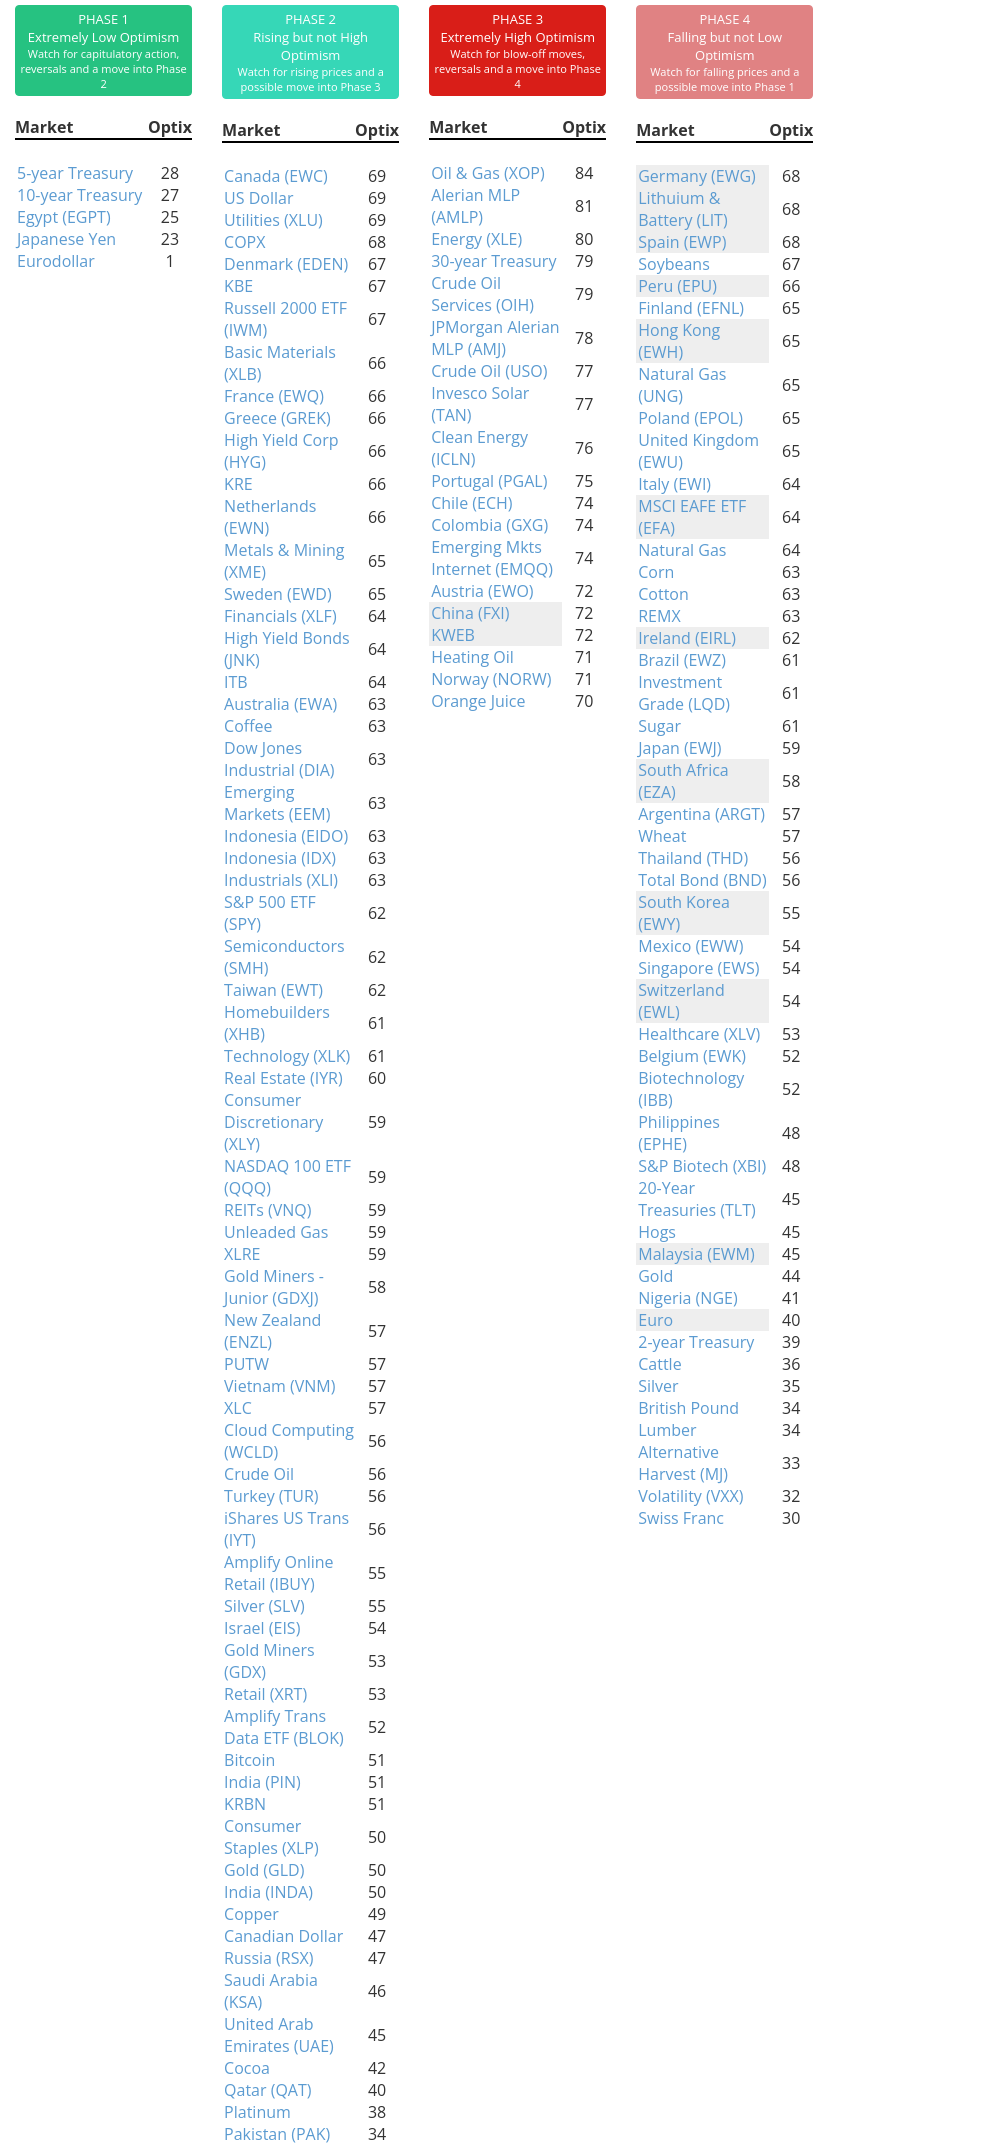
Phase Table
Ranks
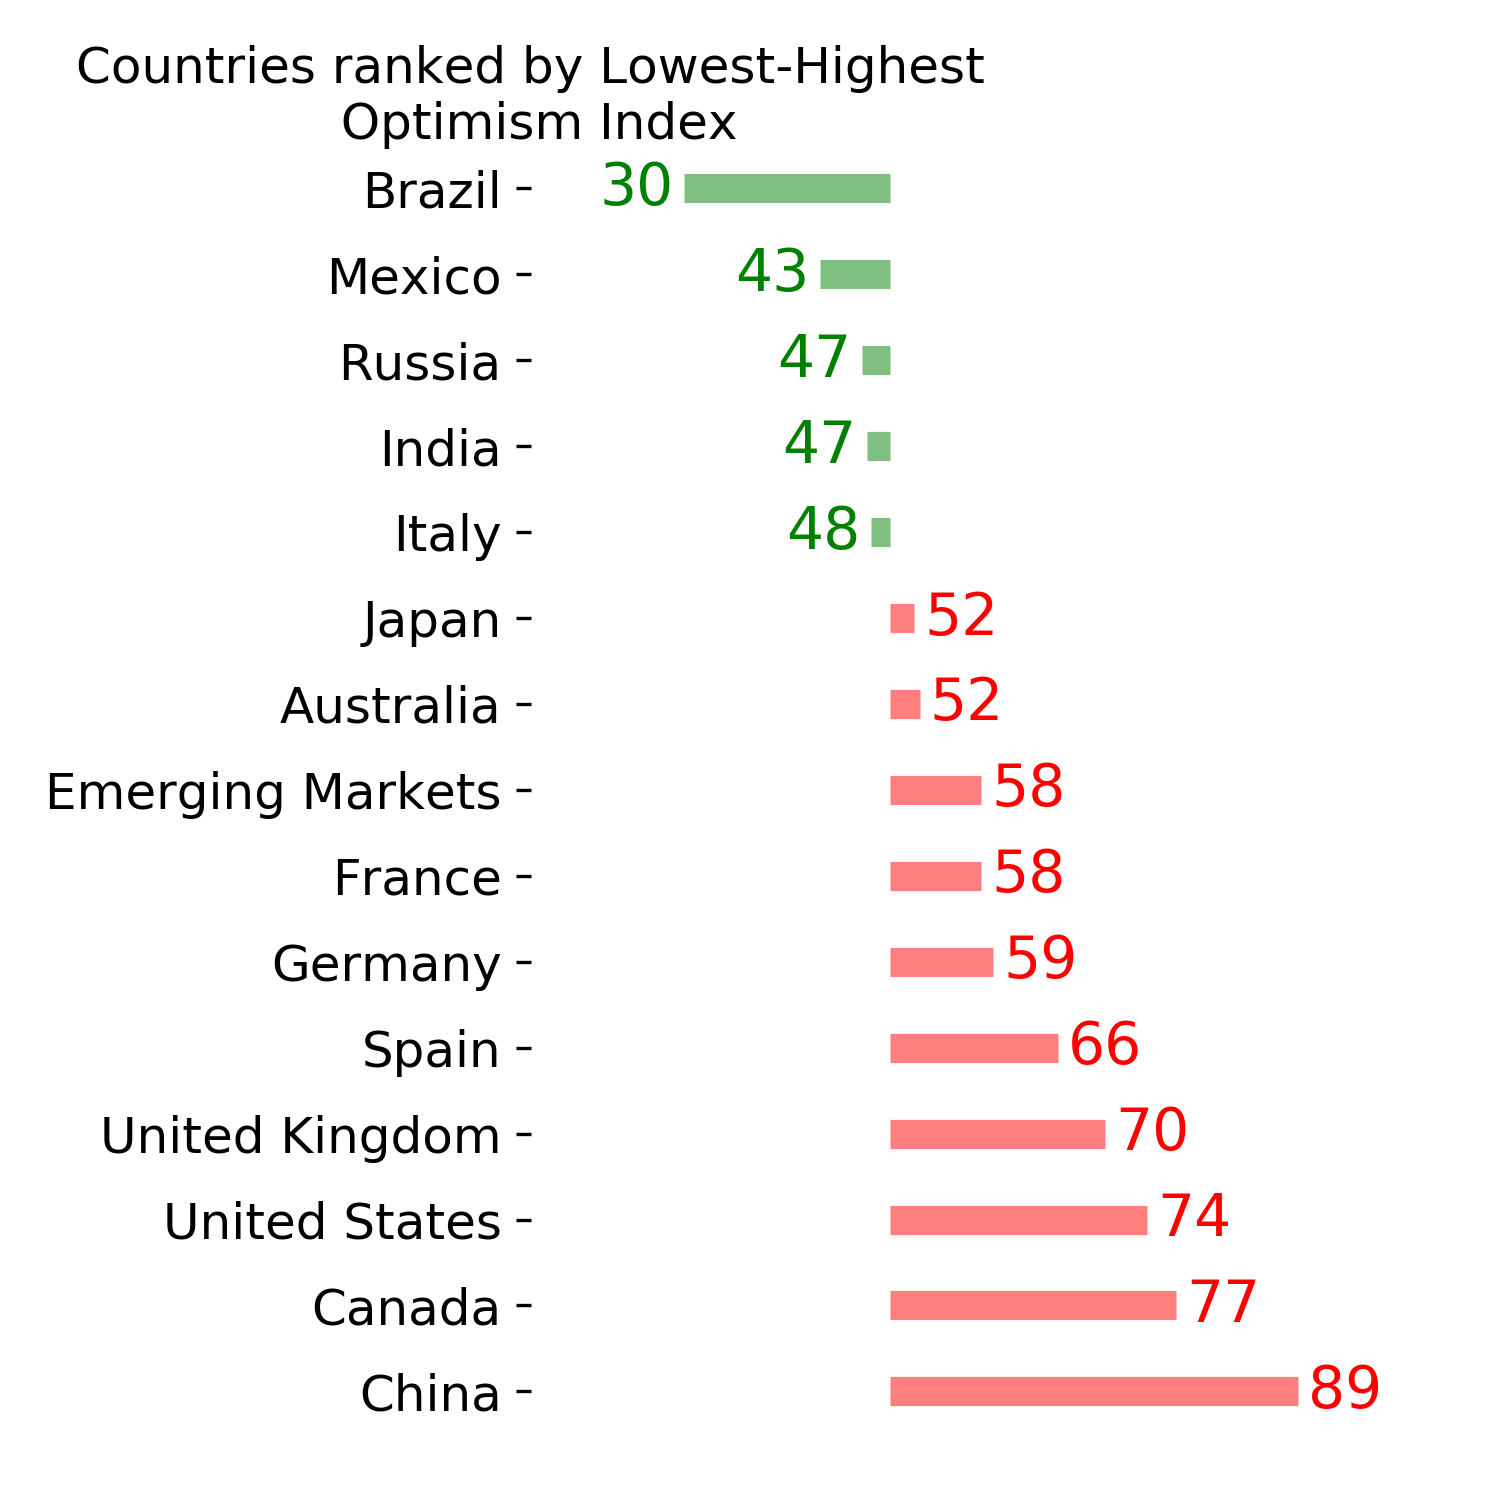
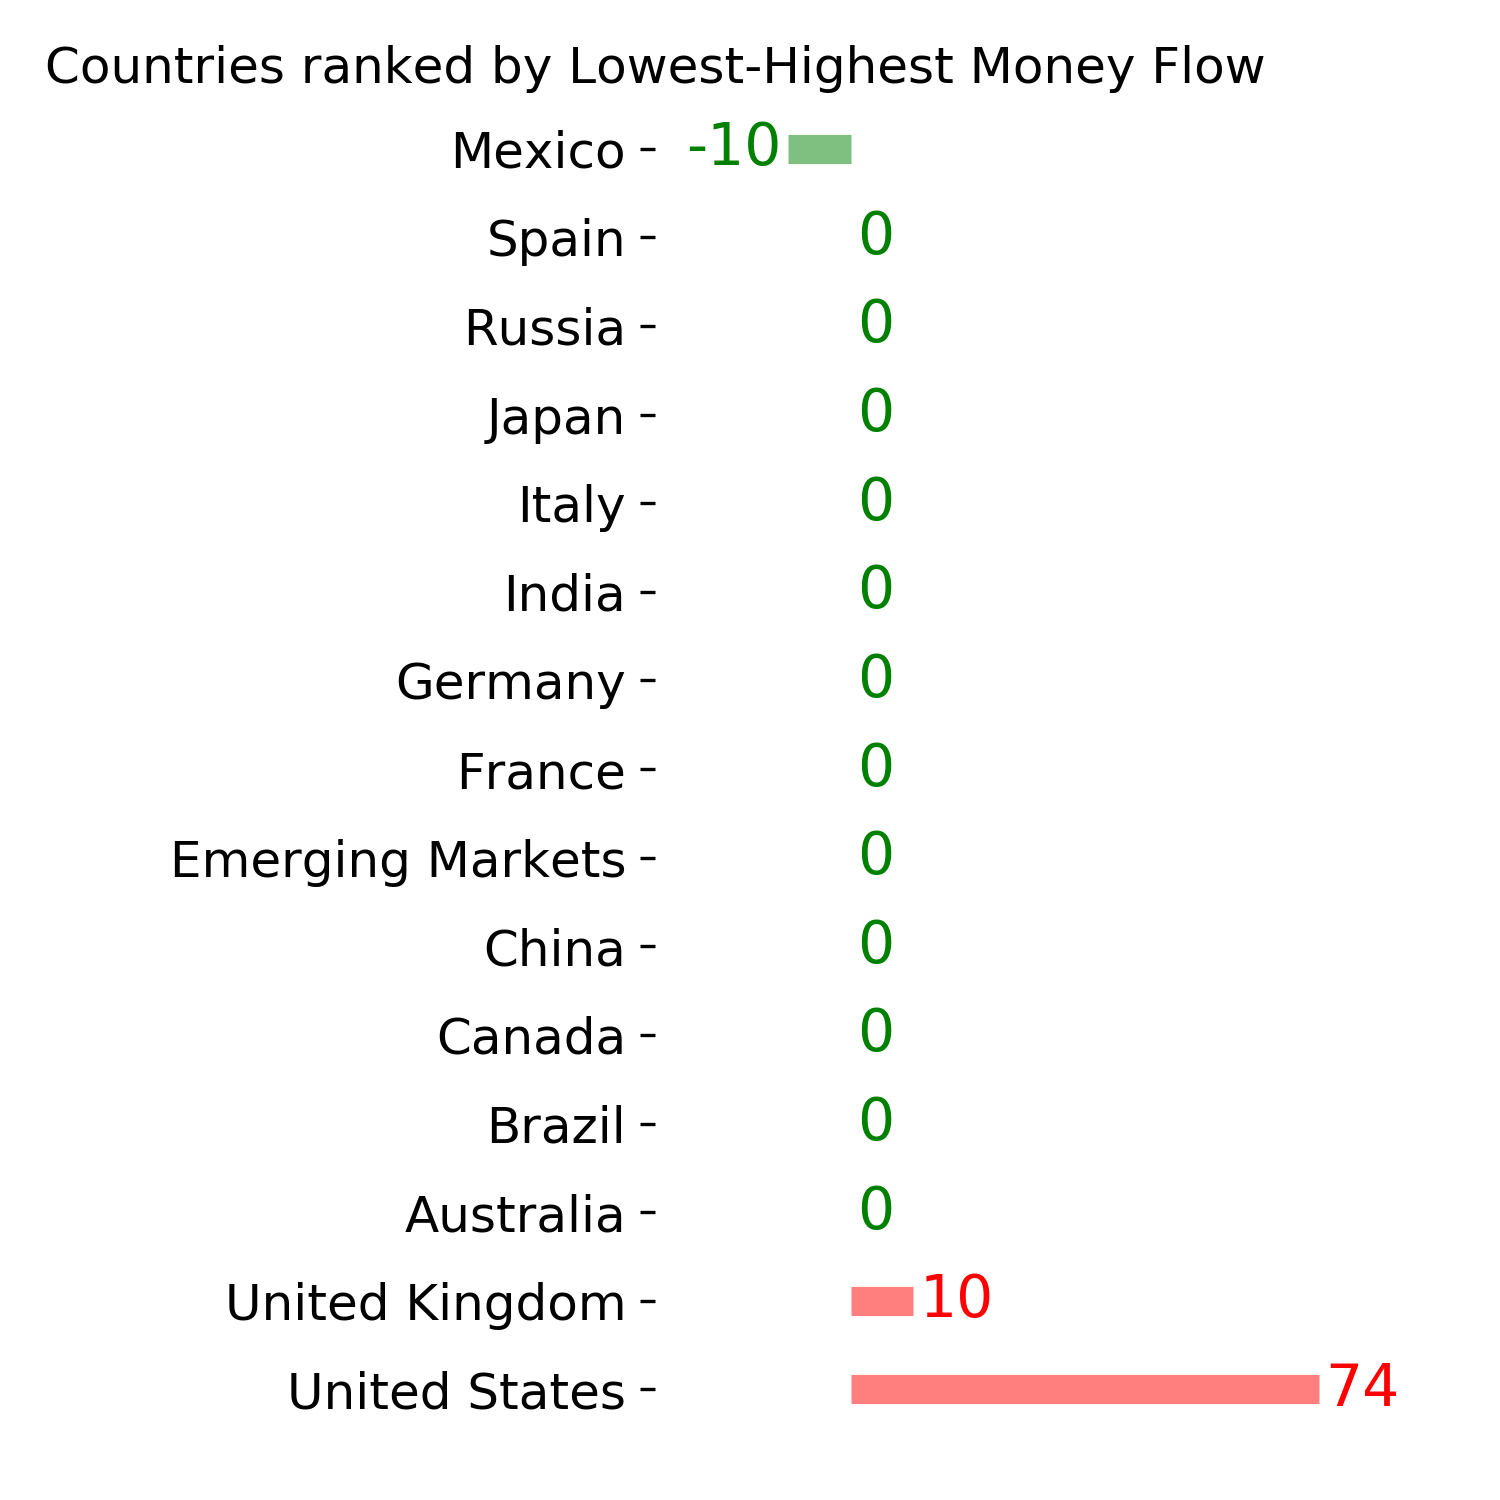
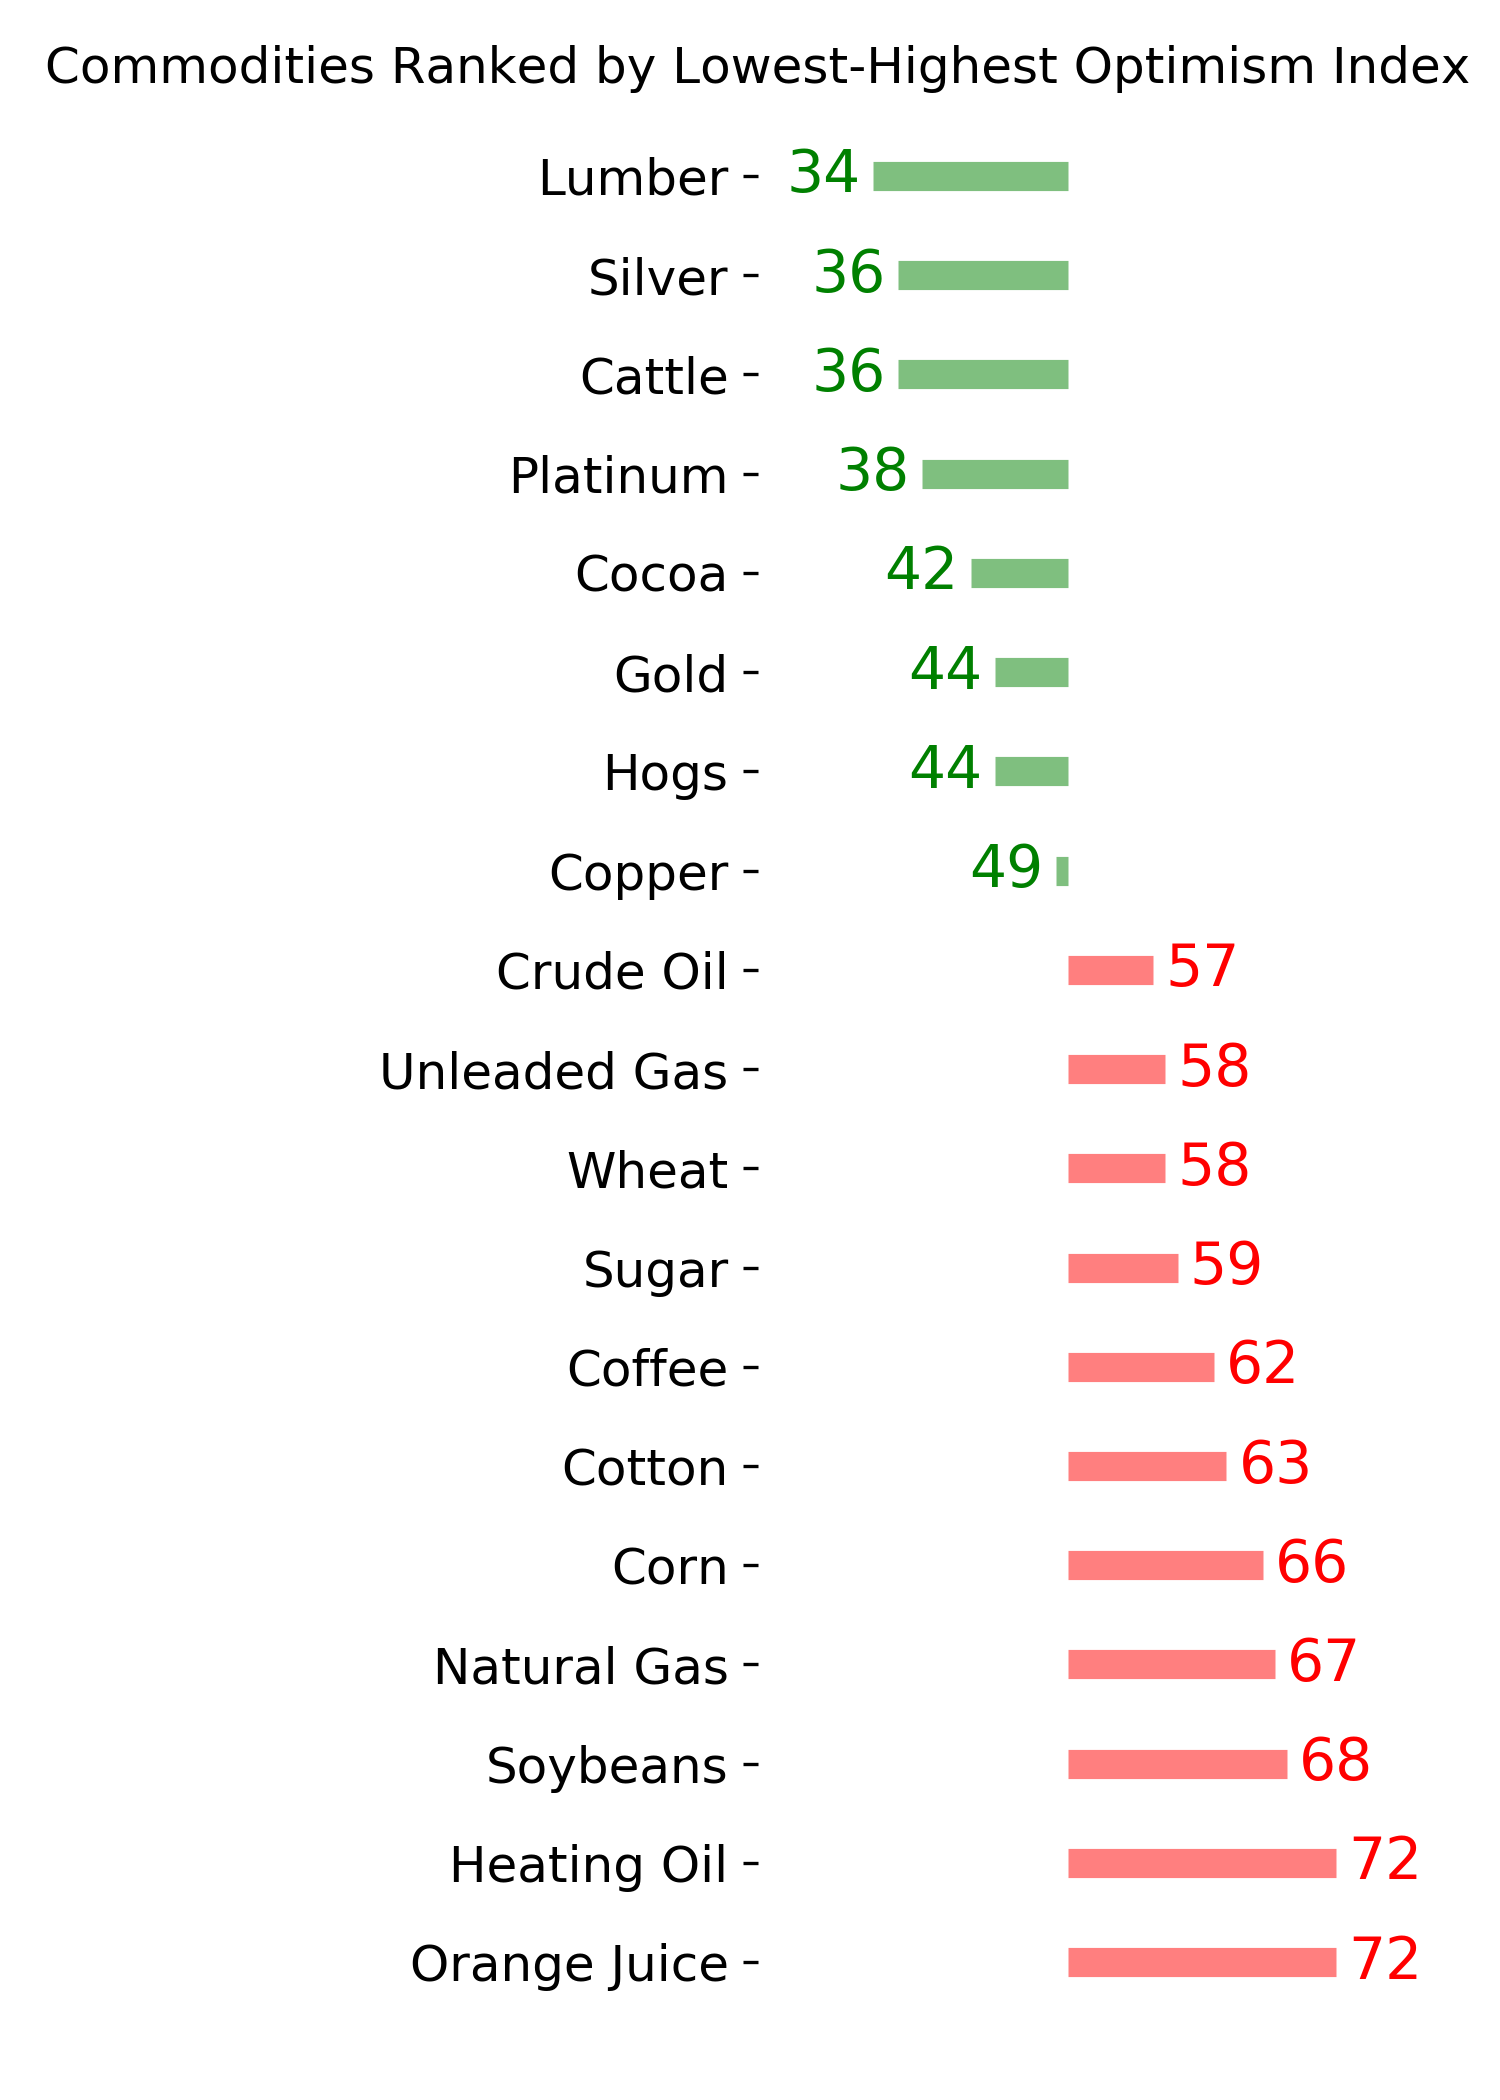
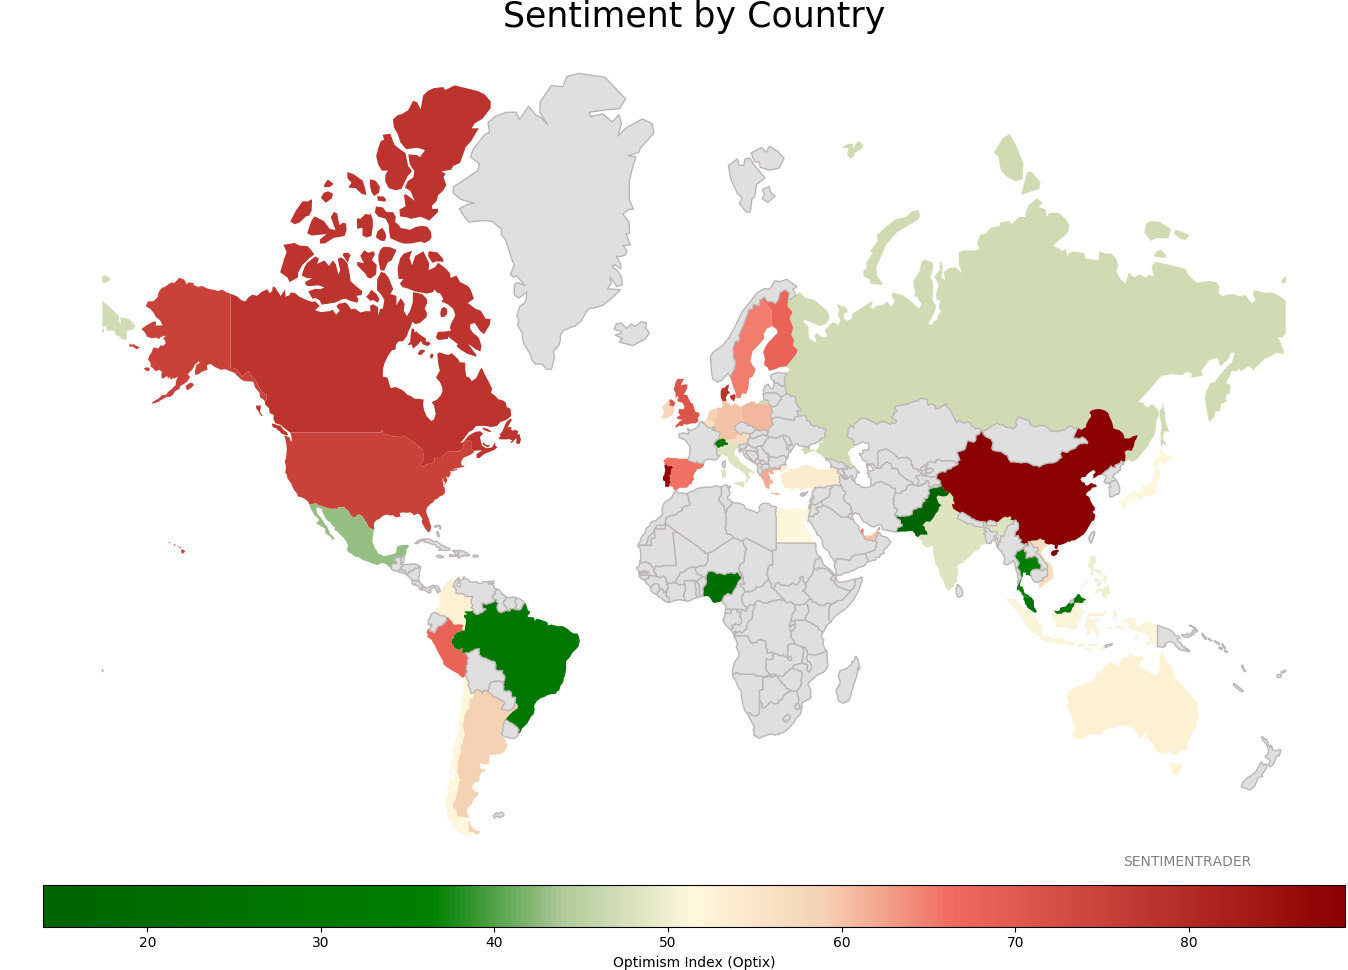
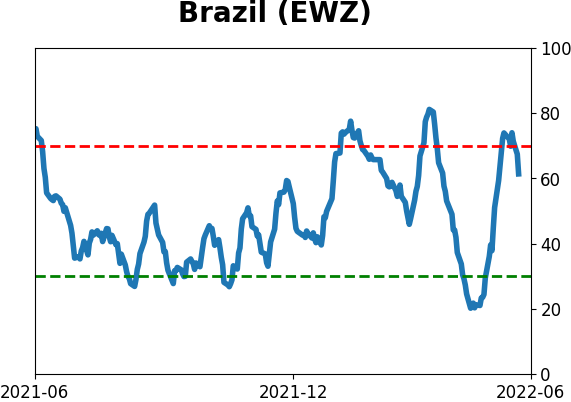
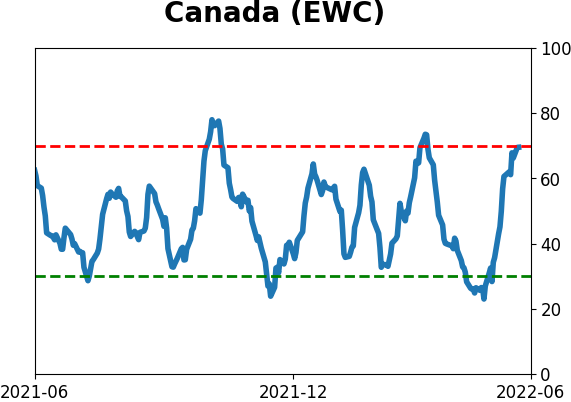
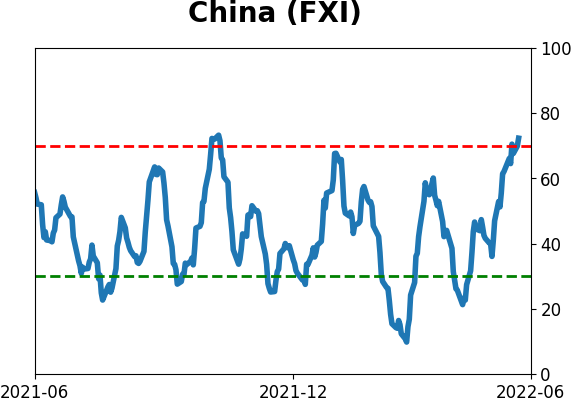
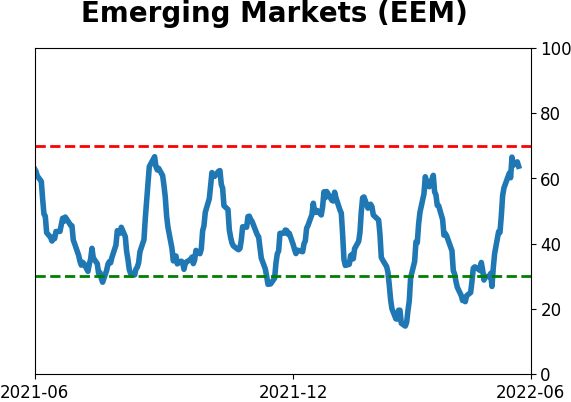
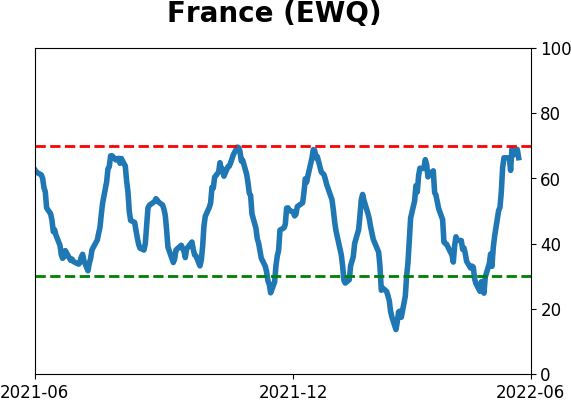
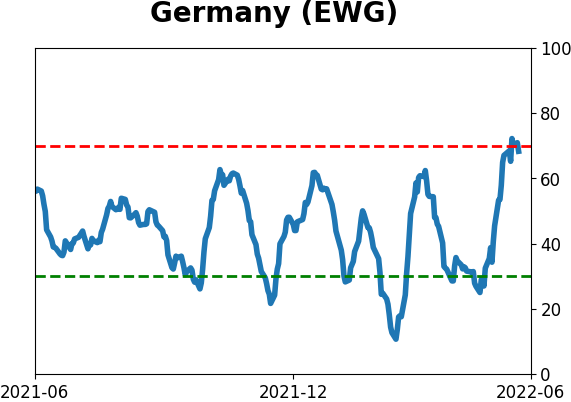
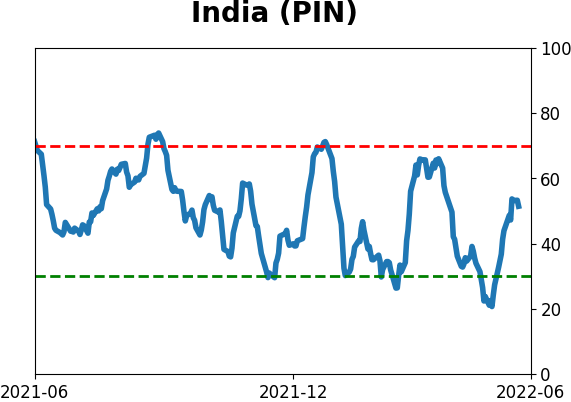
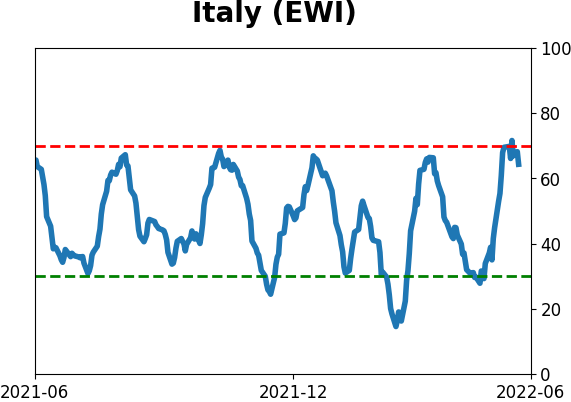
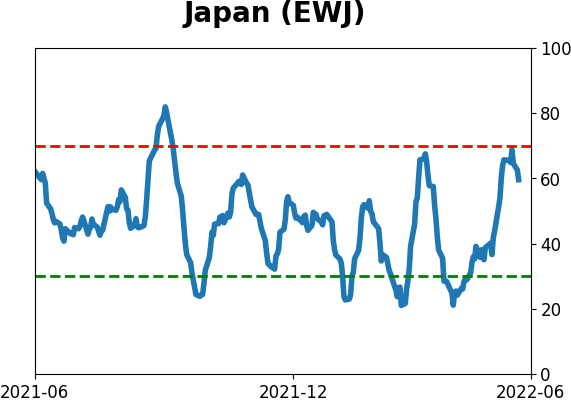
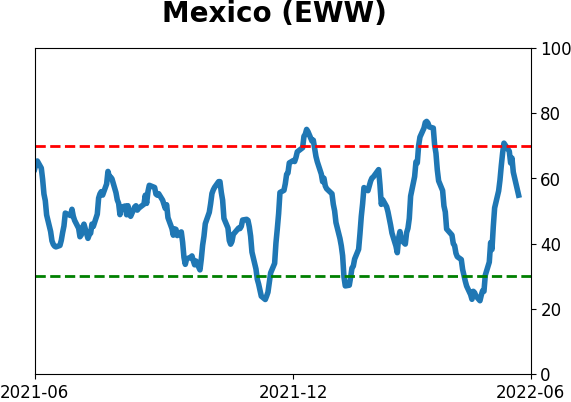
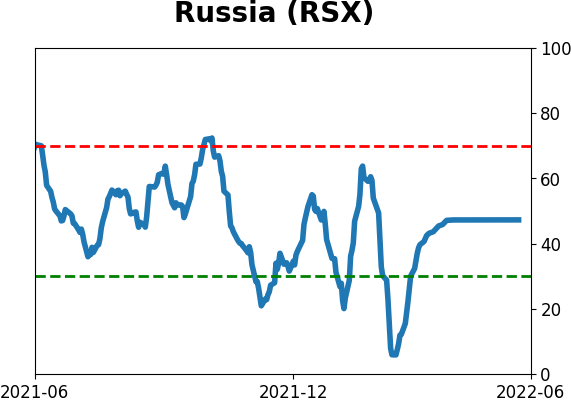
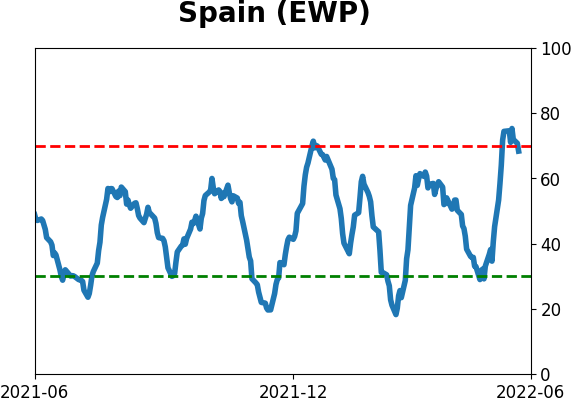
Sentiment Around The World
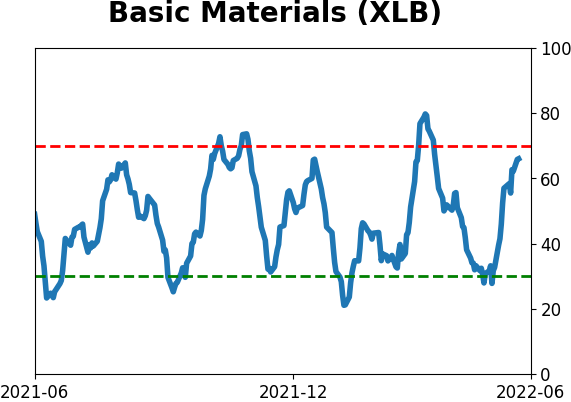
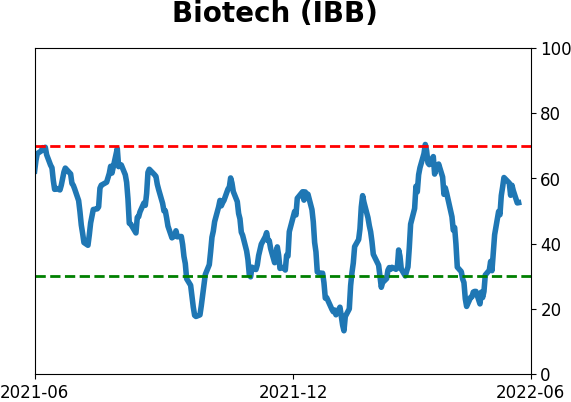
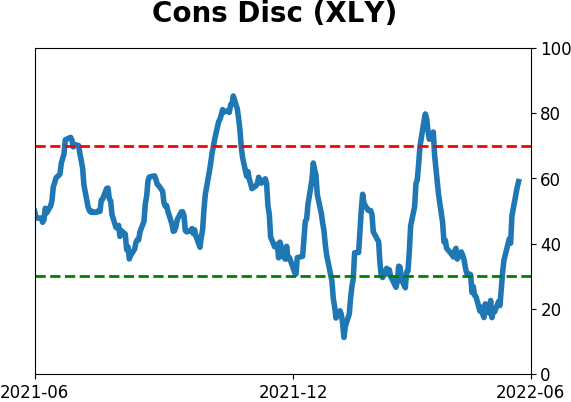
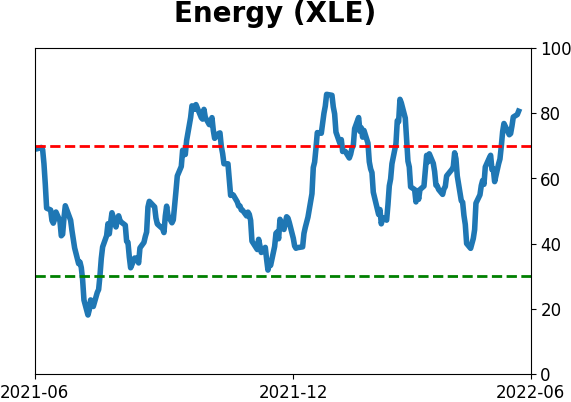
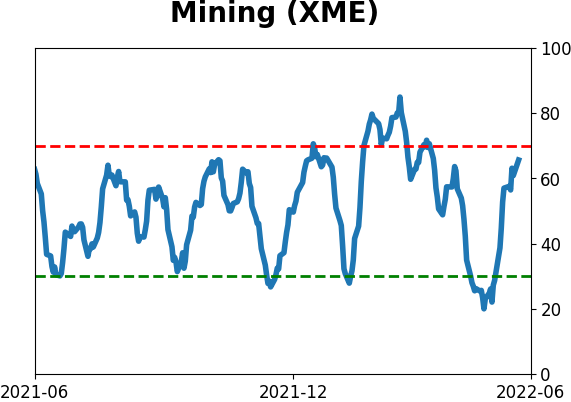
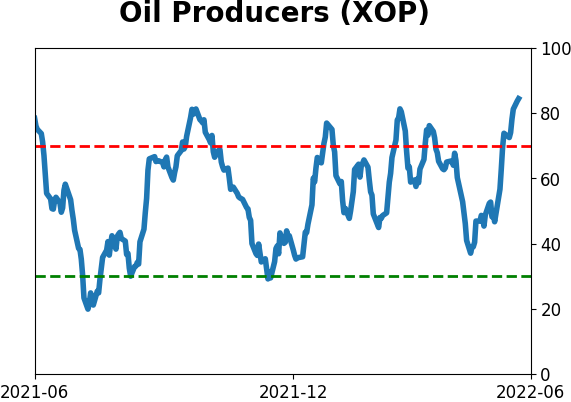
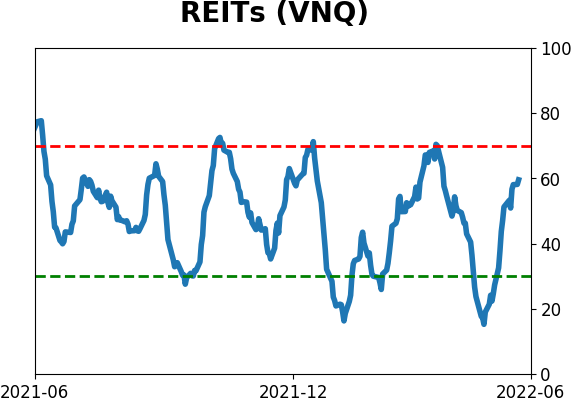
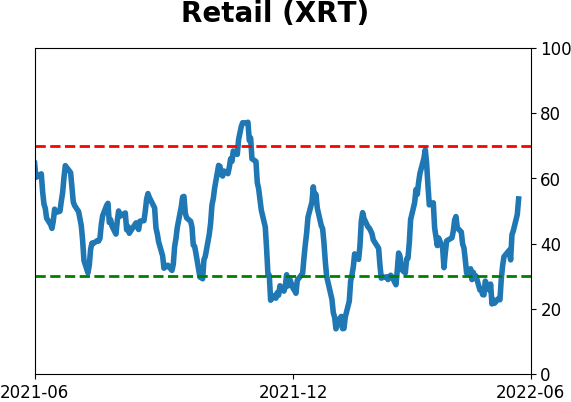
Optimism Index Thumbnails
|
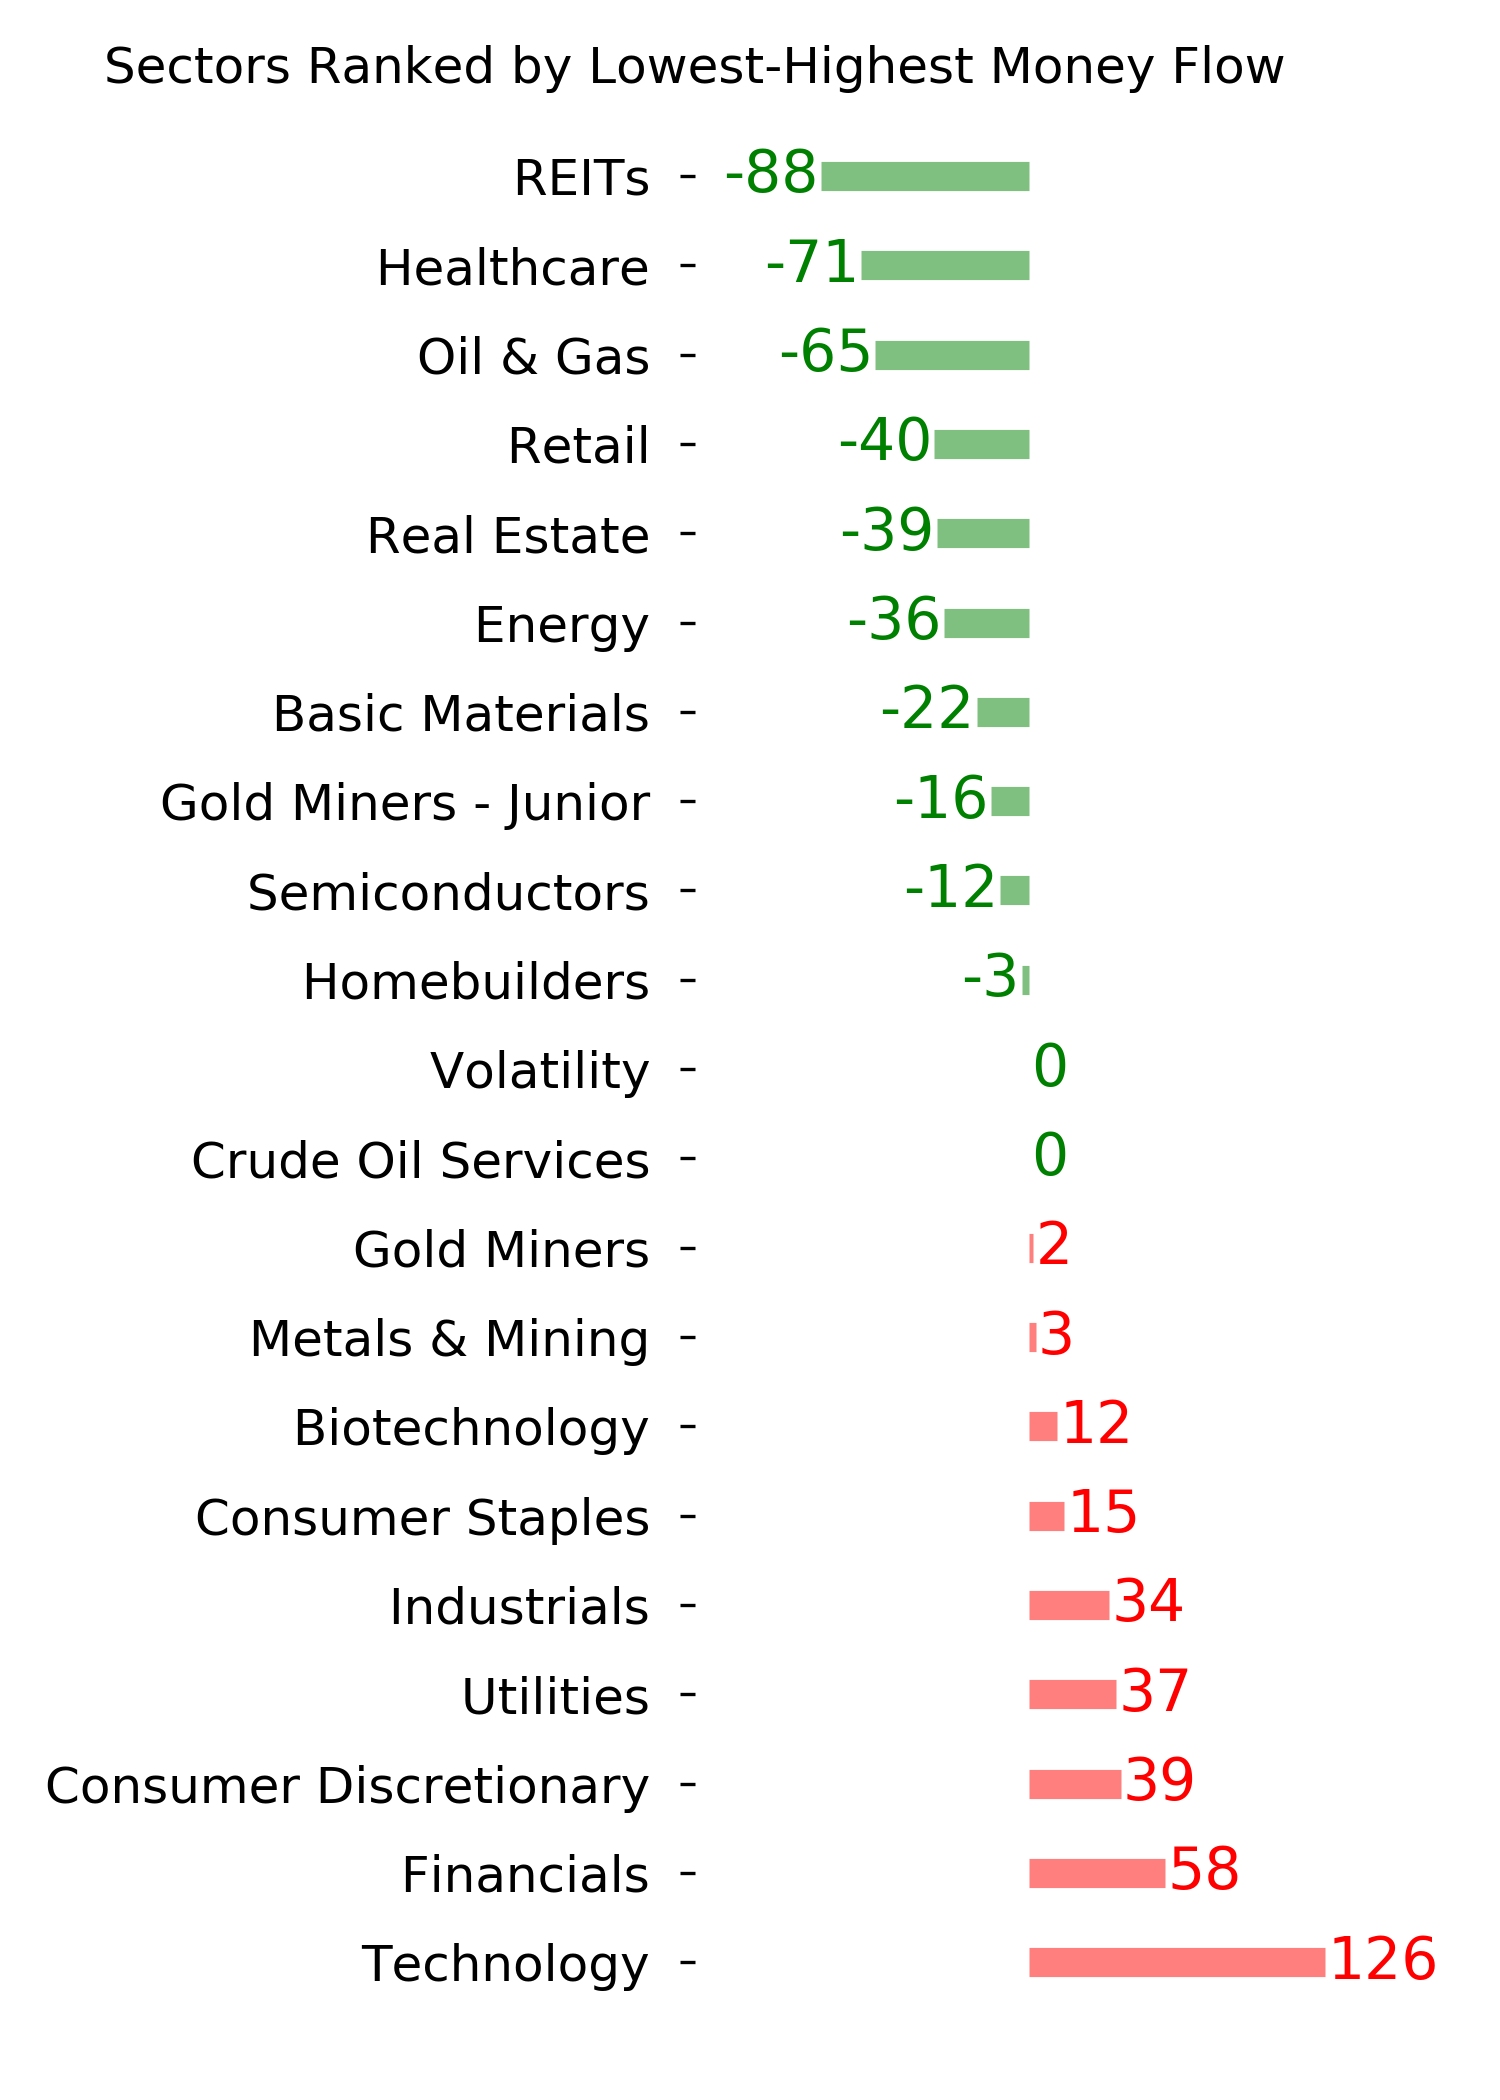
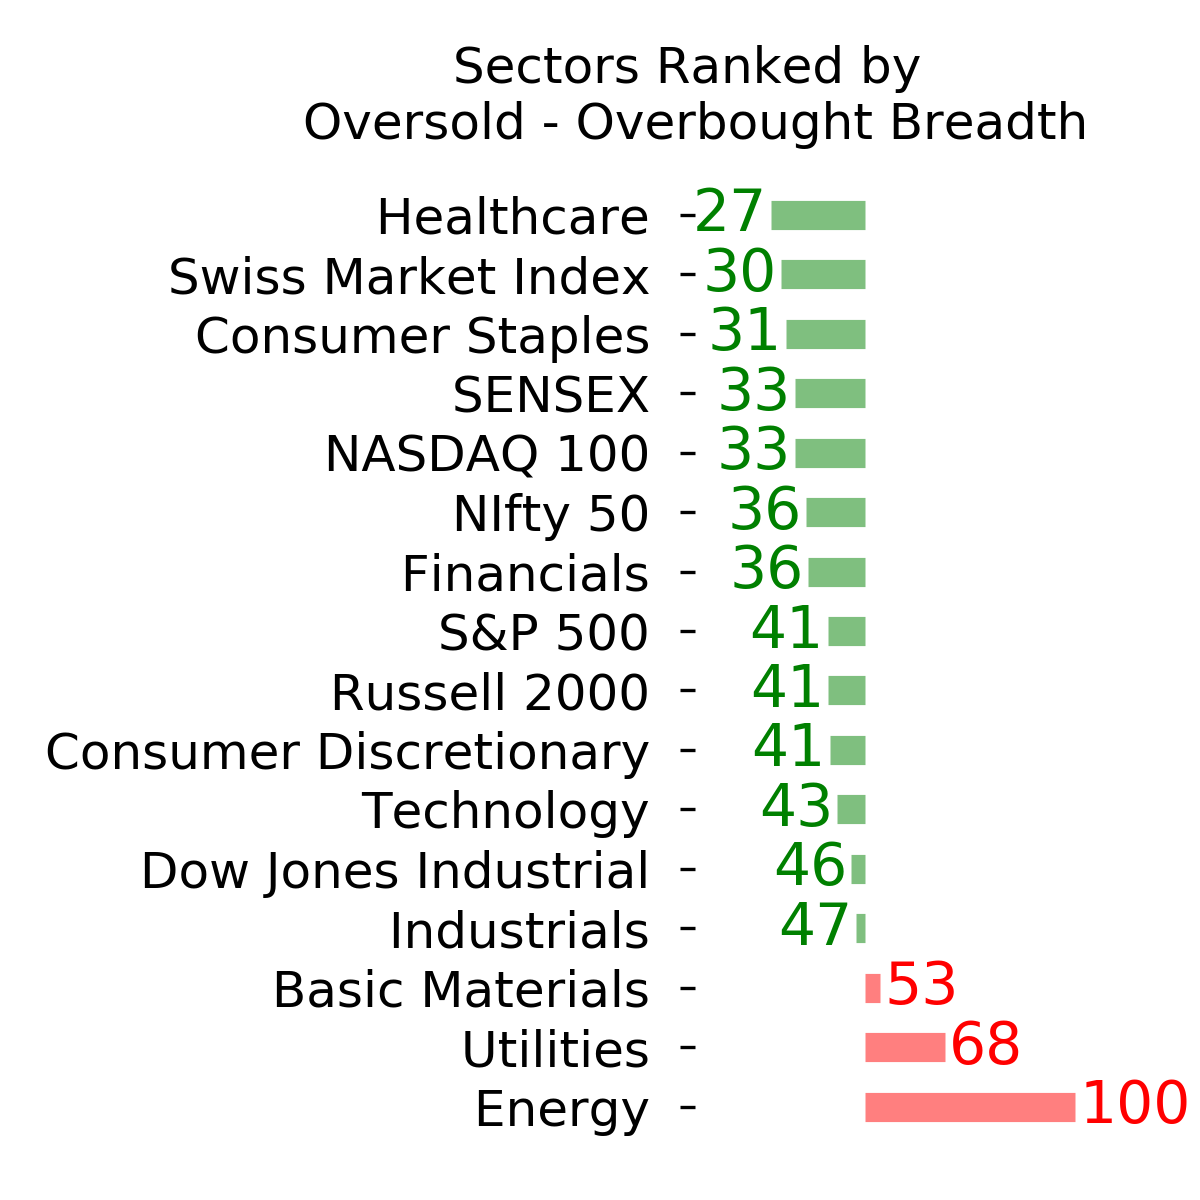
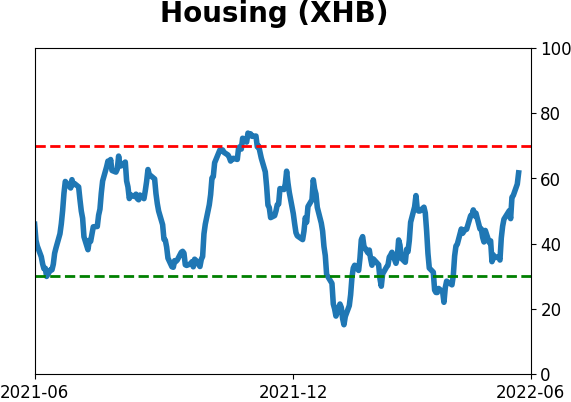
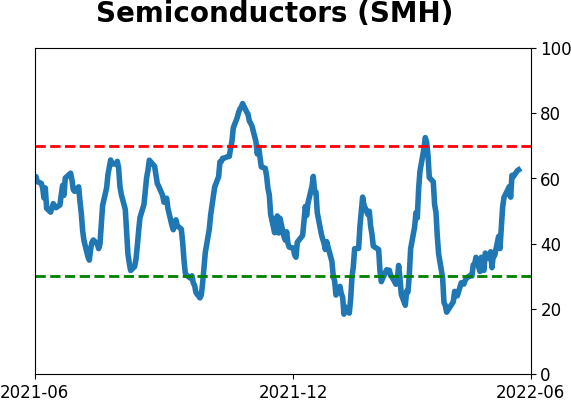
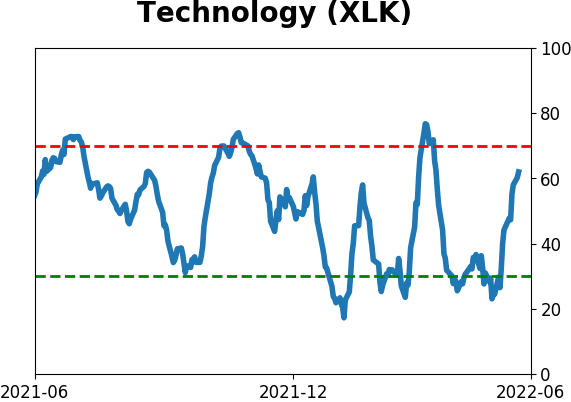
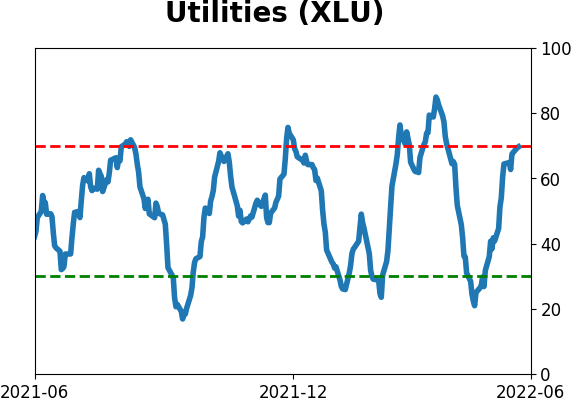
Sector ETF's - 10-Day Moving Average
|
|
|
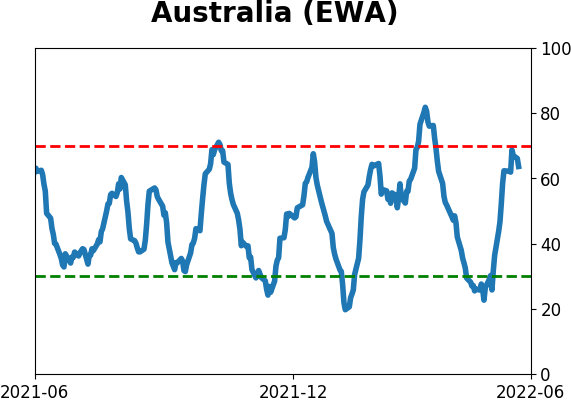
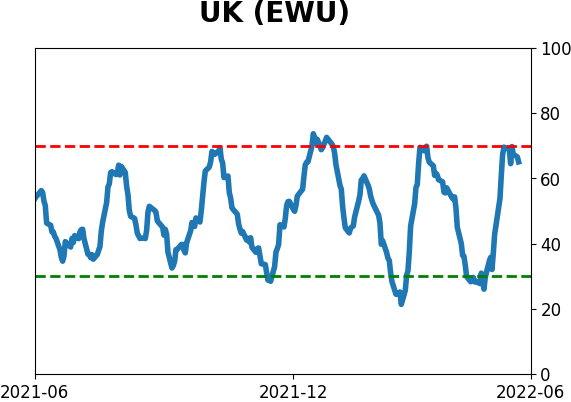
Country ETF's - 10-Day Moving Average
|
|
|
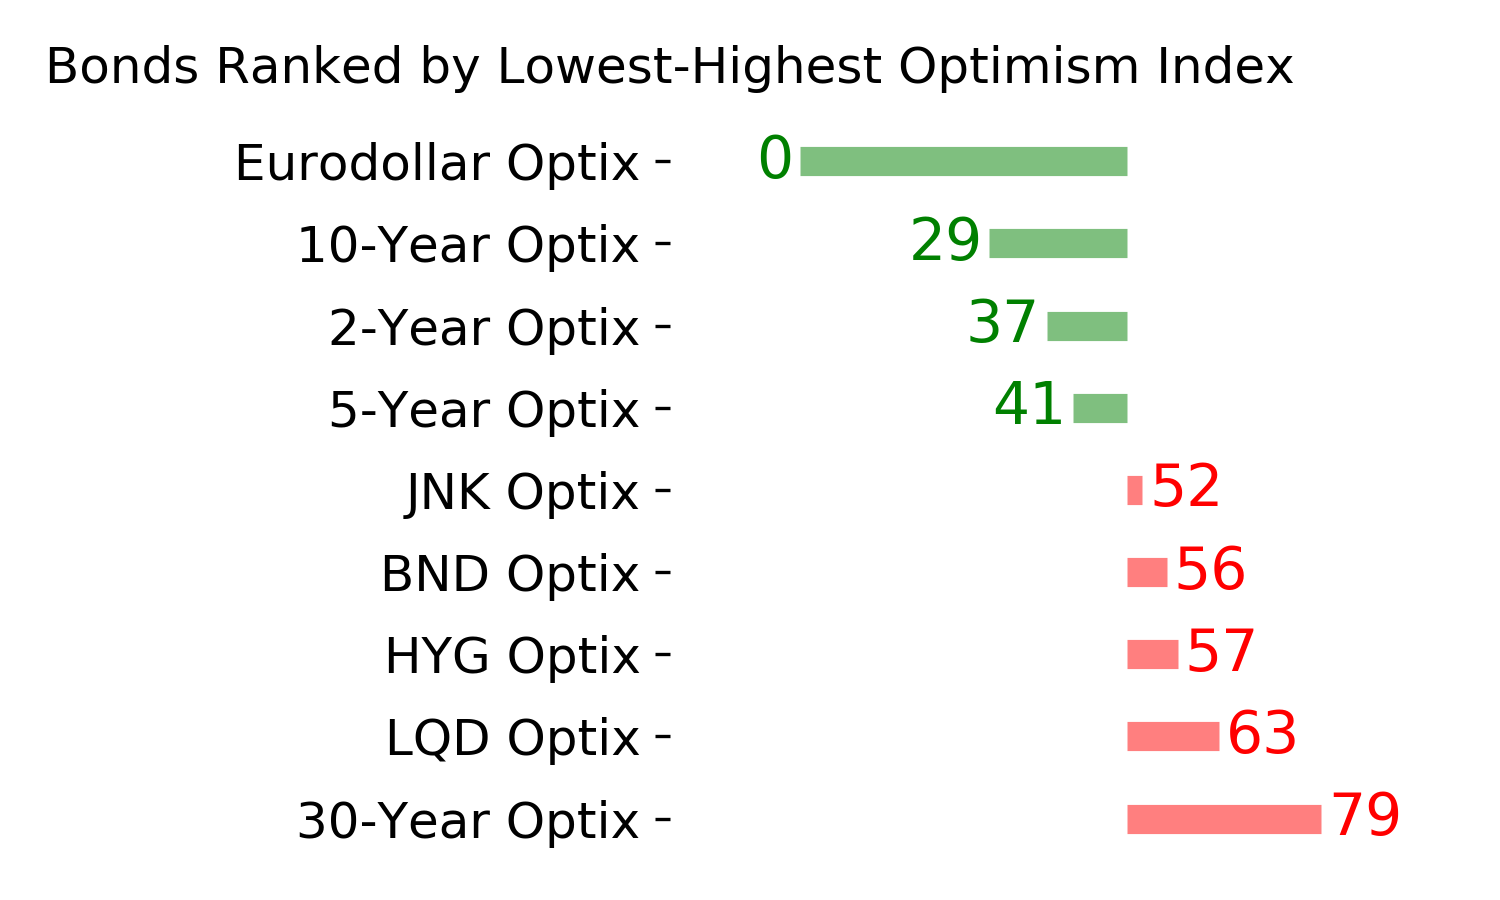
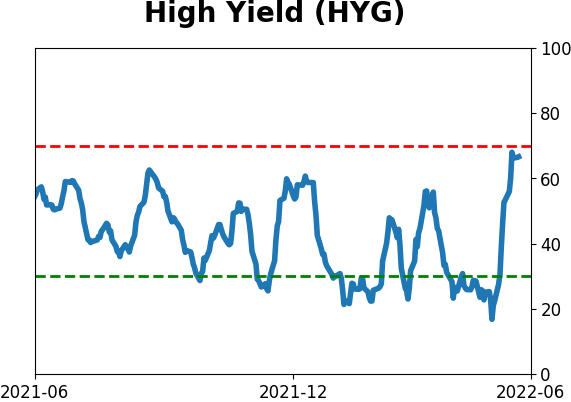
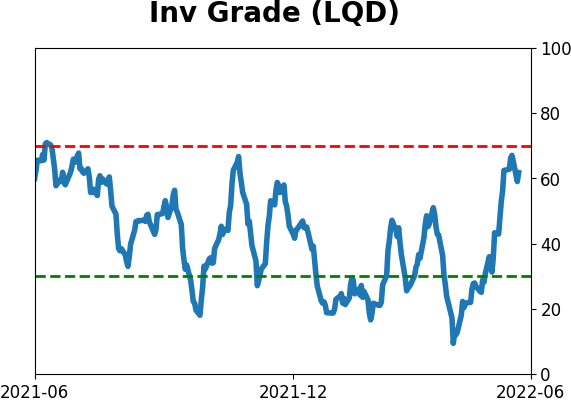
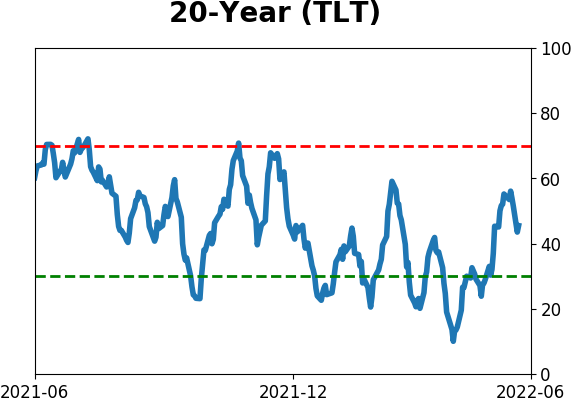
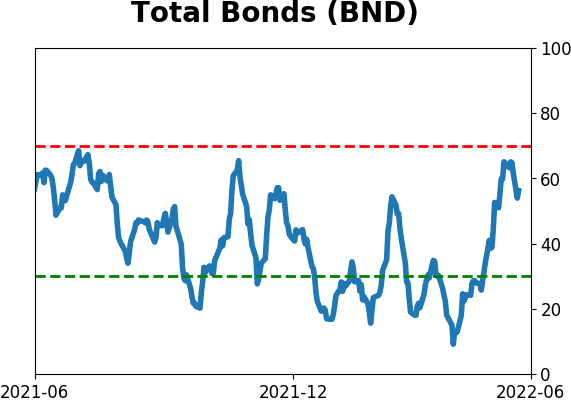
Bond ETF's - 10-Day Moving Average
|
|
|
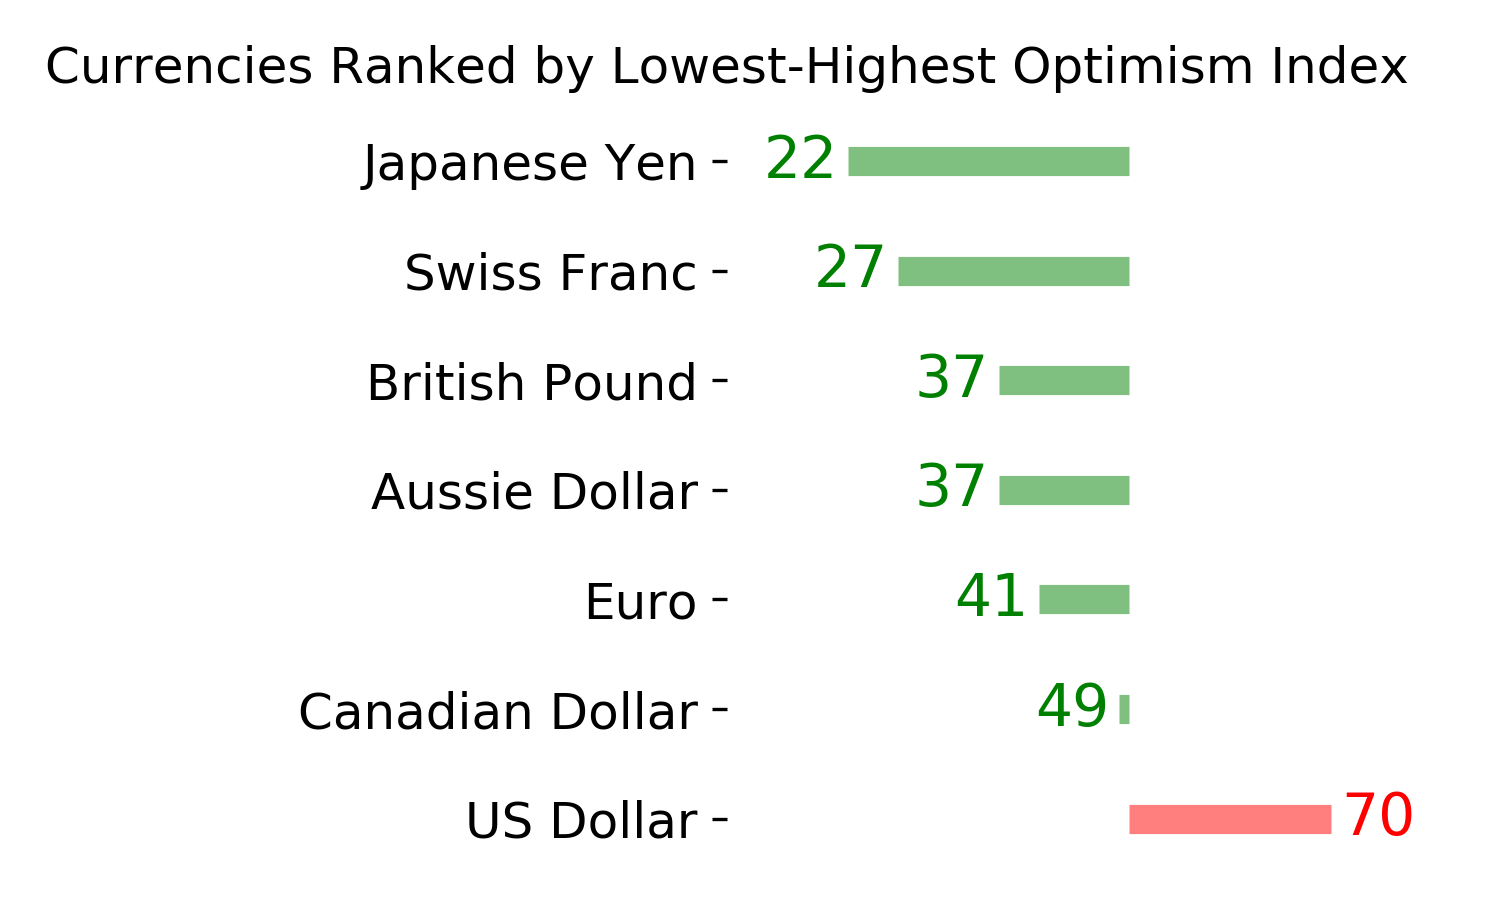
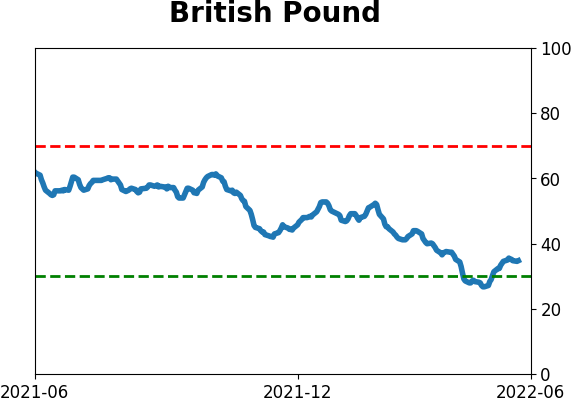
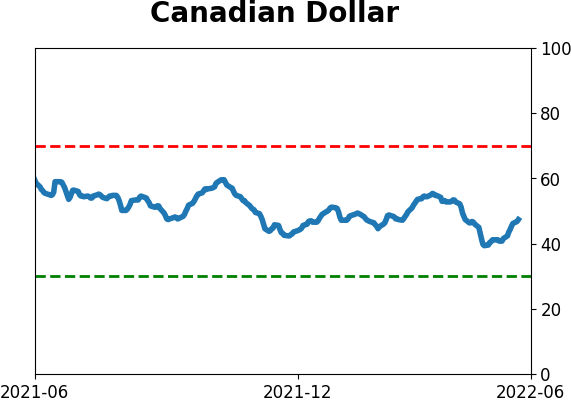
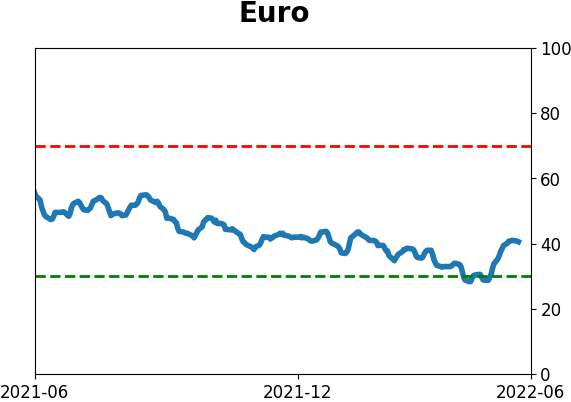
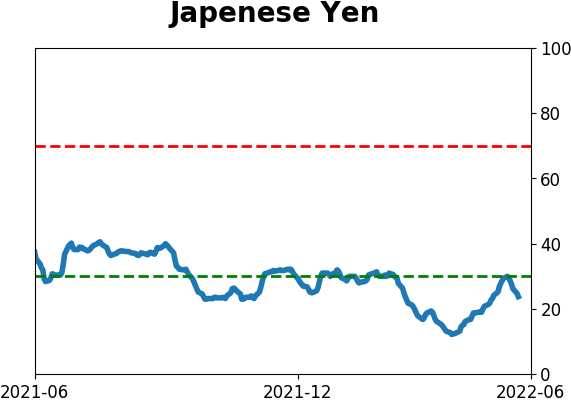
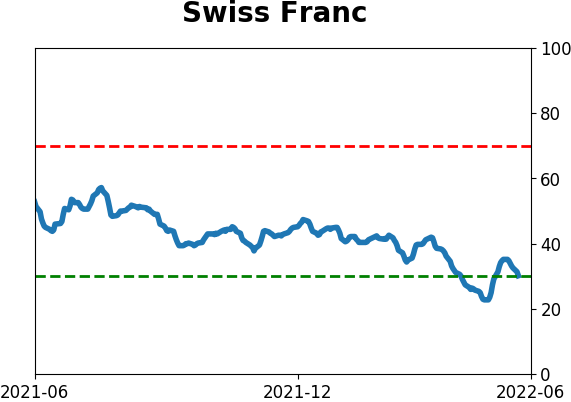
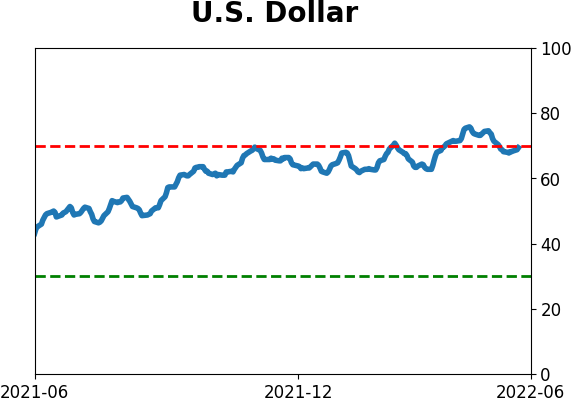
Currency ETF's - 5-Day Moving Average
|
|
|
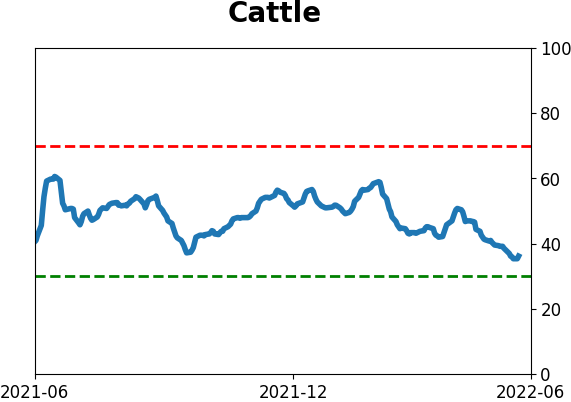
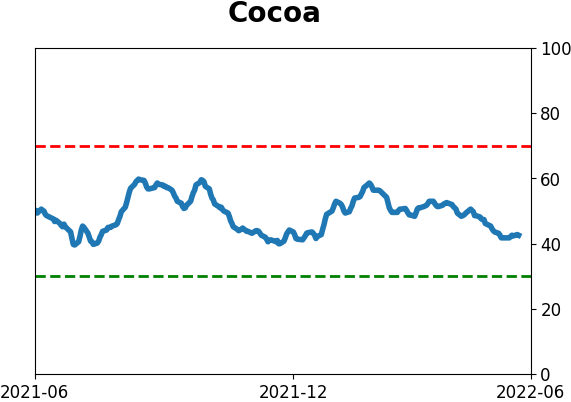
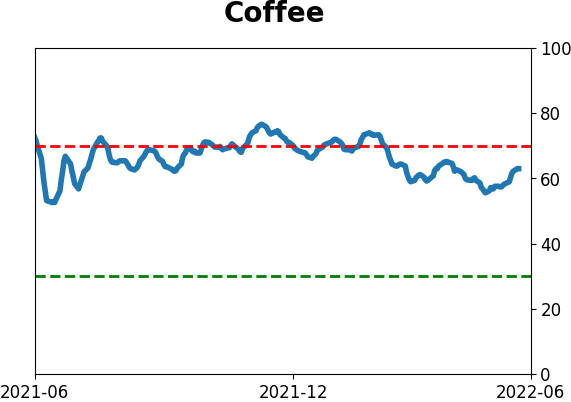
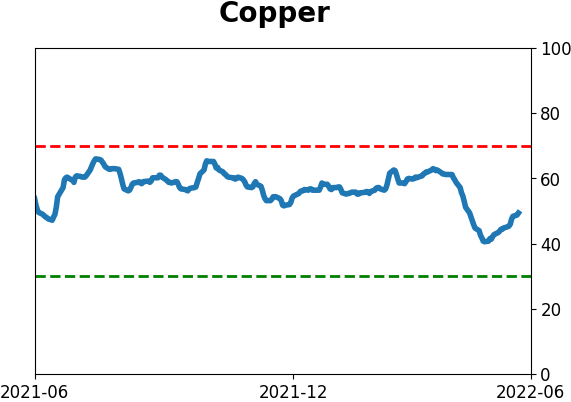
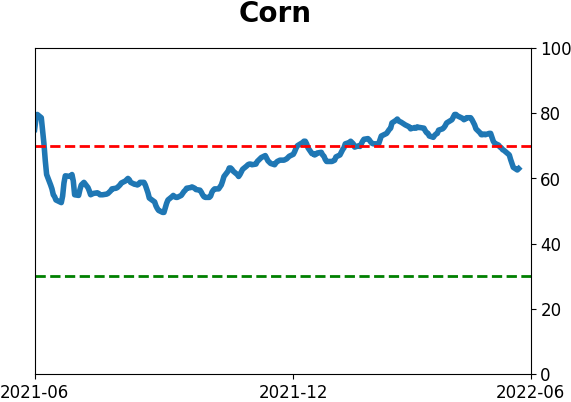
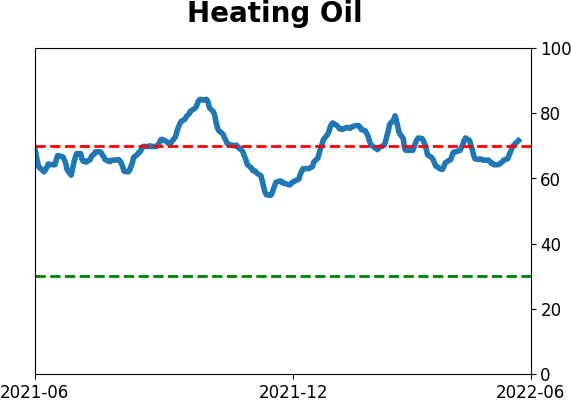
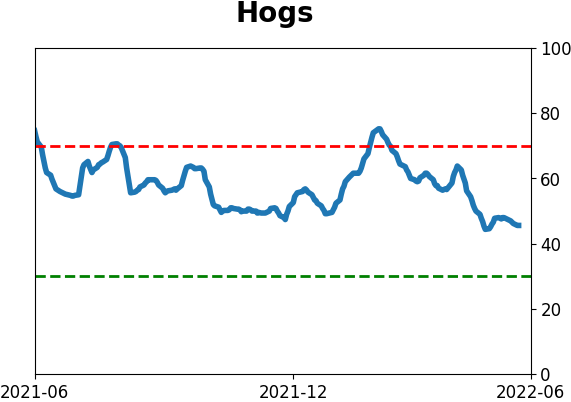
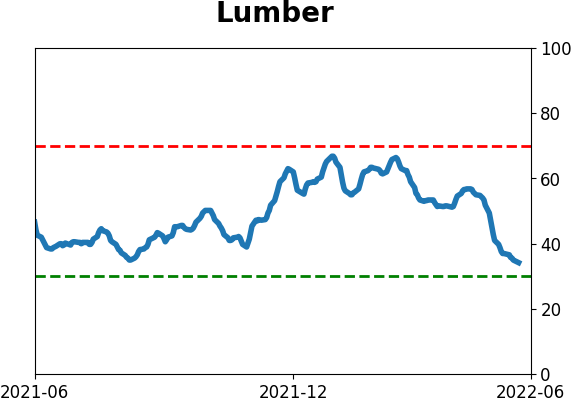
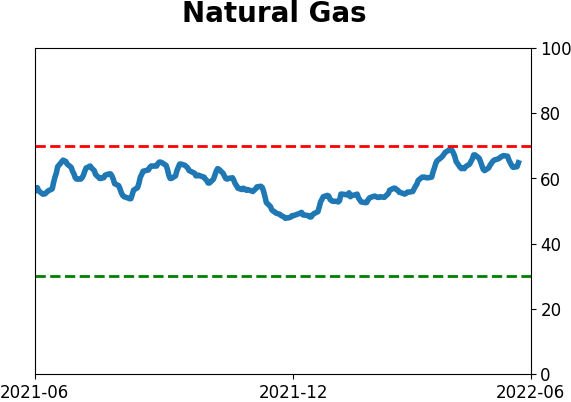
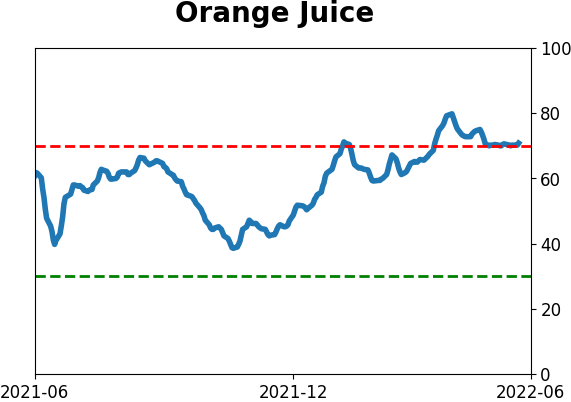
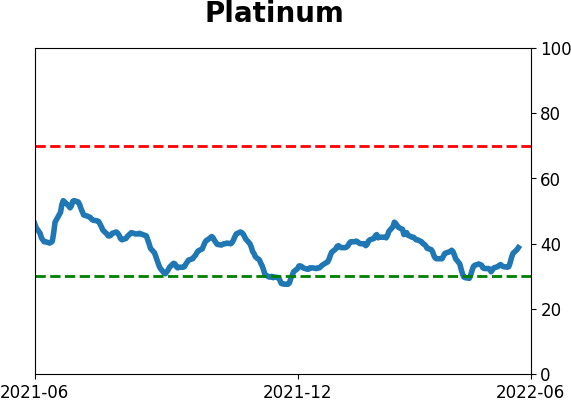
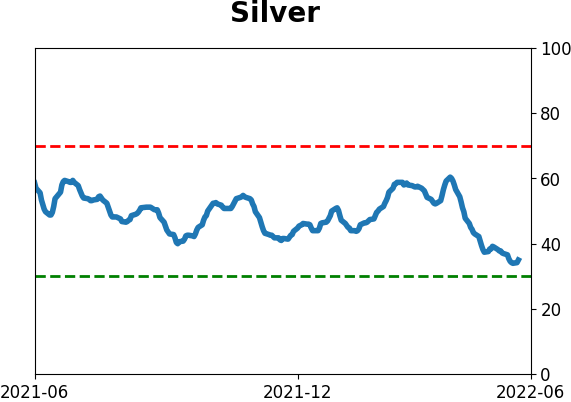
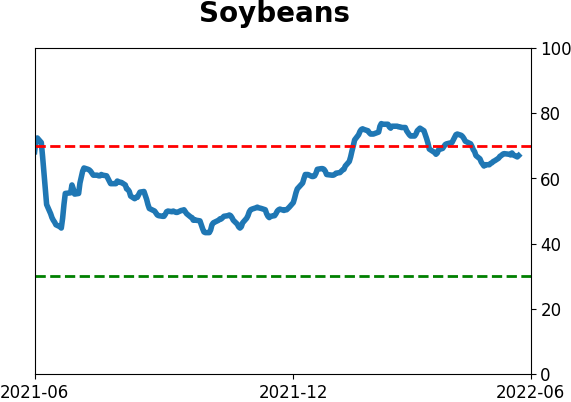
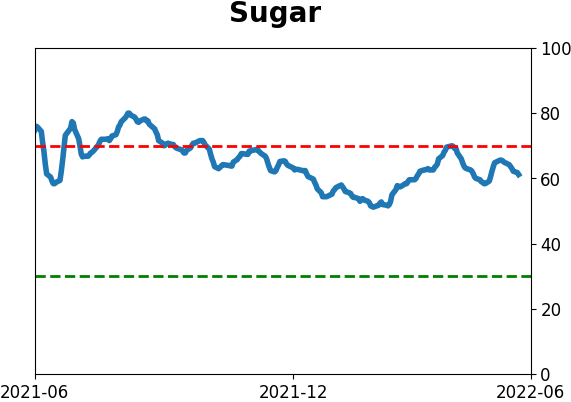
Commodity ETF's - 5-Day Moving Average
|
|