Headlines
|
|
The Probability of a Bear Market is Rising:
The Bear Market Probability model has cycled from below 40% to above 65% in only 11 months, the fastest turnaround ever. It's not high enough to be a pressing concern though future returns decline the higher the model climbs.
Bottom Line:
See the Outlook & Allocations page for more details on these summaries STOCKS: Hold
The speculative frenzy in February is wrung out. Internal dynamics have mostly held up, with some exceptions. Many of our studies still show a mixed to poor short-term view, with medium- and long-term ones turning more positive. BONDS: Hold
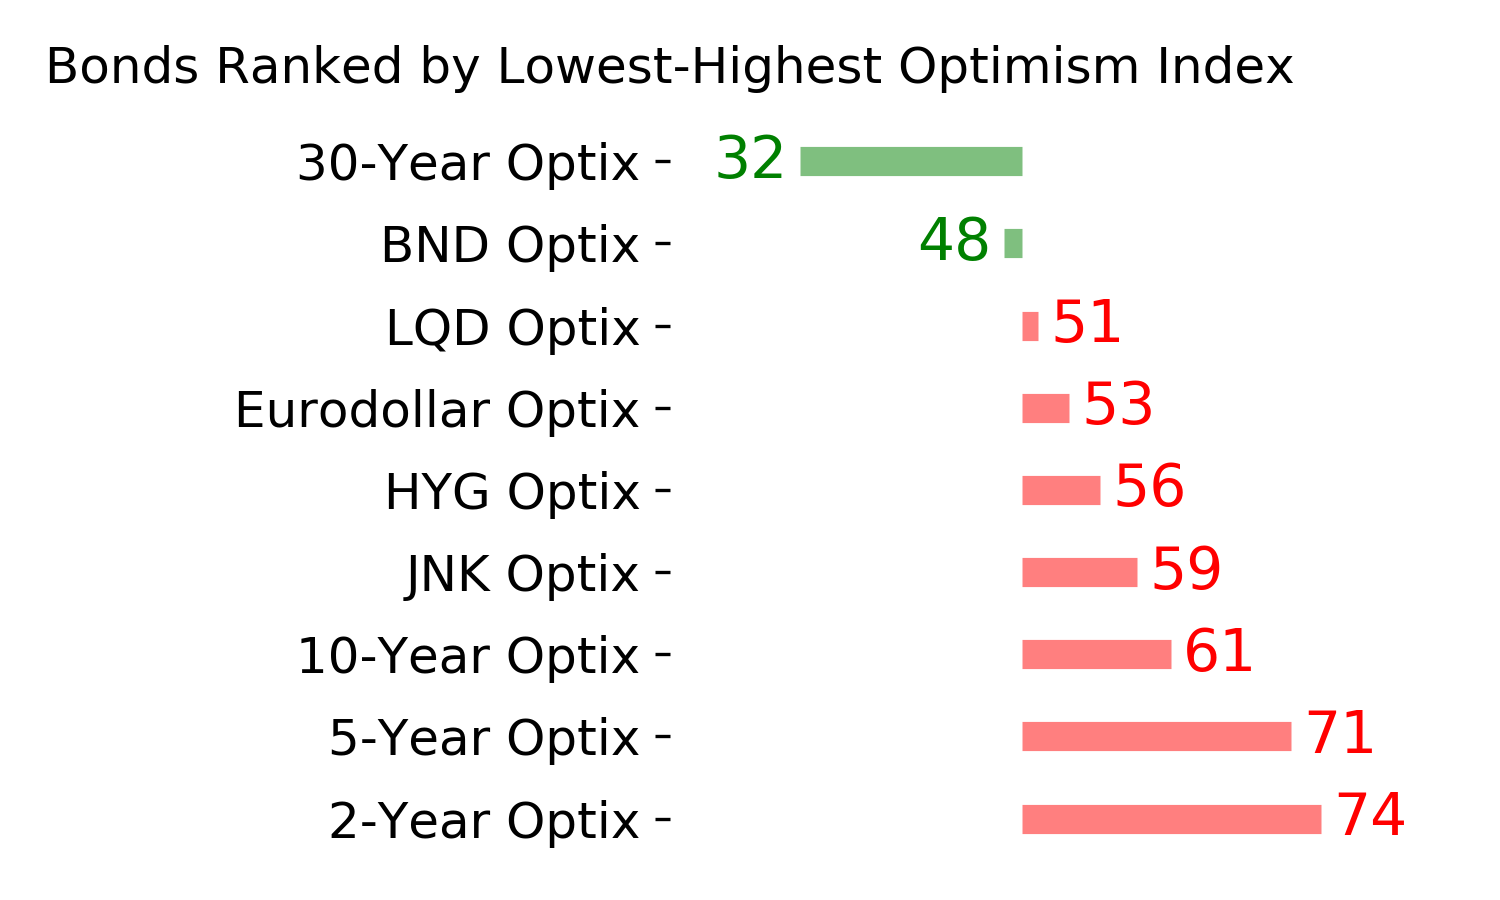
Various parts of the market got hit in March, with the lowest Bond Optimism Index we usually see during healthy environments. After a shaky couple of weeks, the broad bond market has modestly recovered. Not a big edge here either way. GOLD: Hold
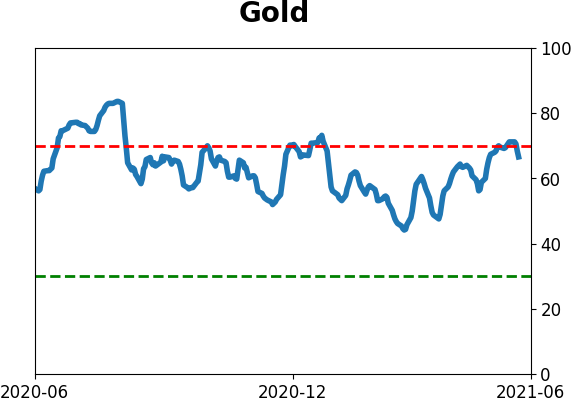
Gold and miners have done very well, recovering above long-term trend lines. The issue is that both have tended to perform poorly after similar situations - will have to wait and see how it plays out.
|
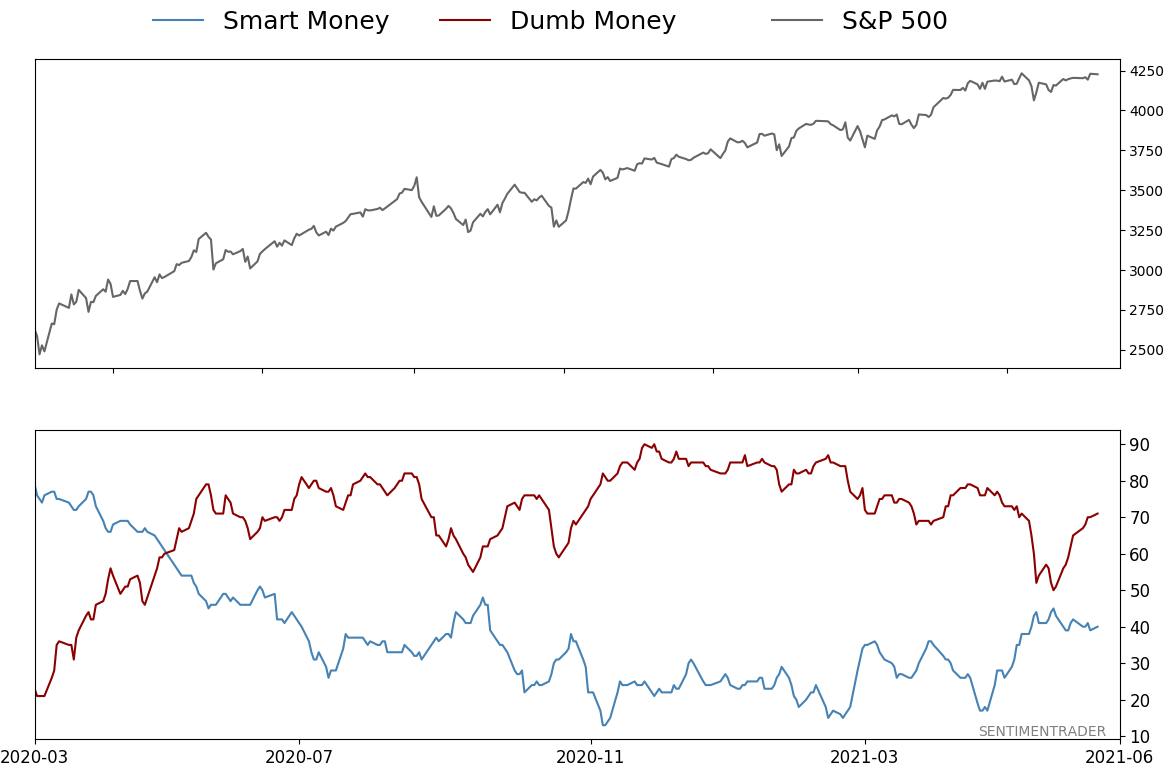
Smart / Dumb Money Confidence
|
Smart Money Confidence: 40%
Dumb Money Confidence: 71%
|
|
Risk Levels
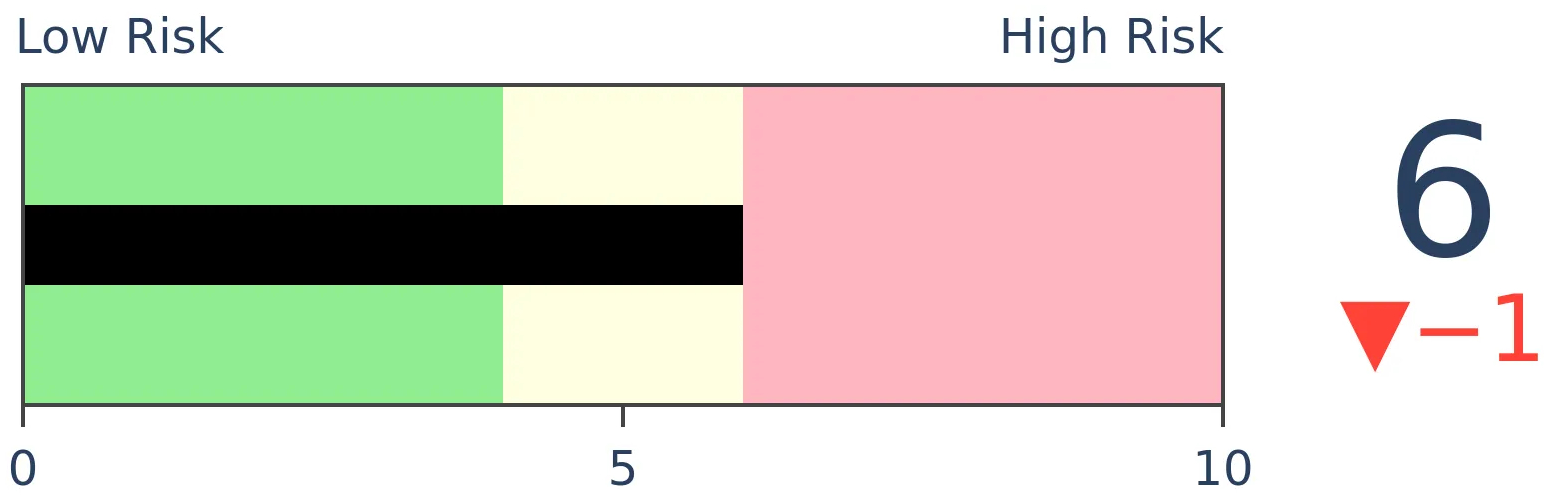
Stocks Short-Term
|
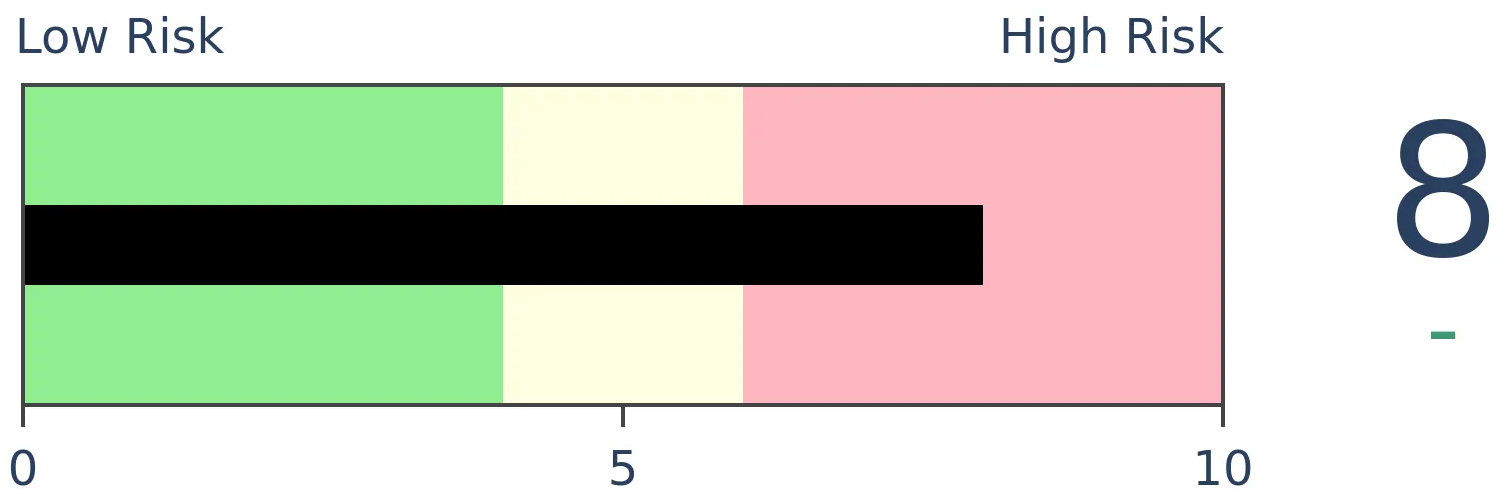
Stocks Medium-Term
|
|
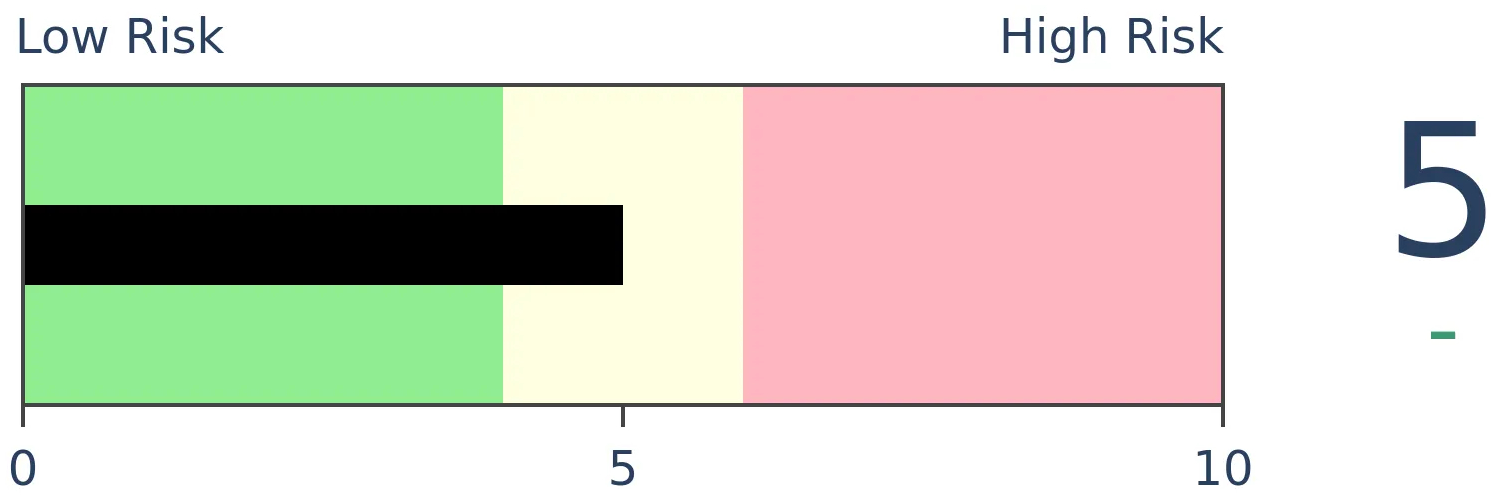
Bonds
|
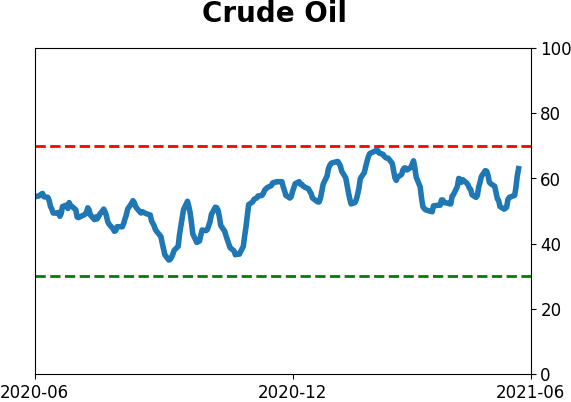
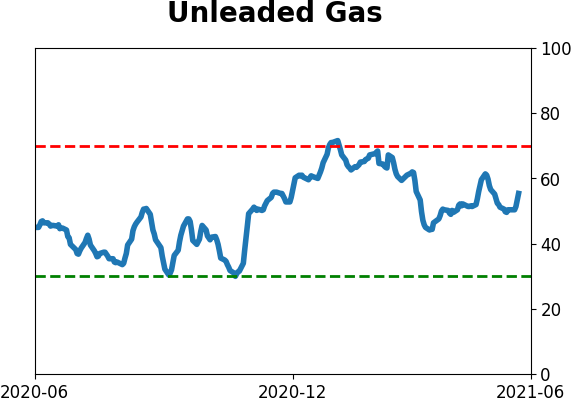
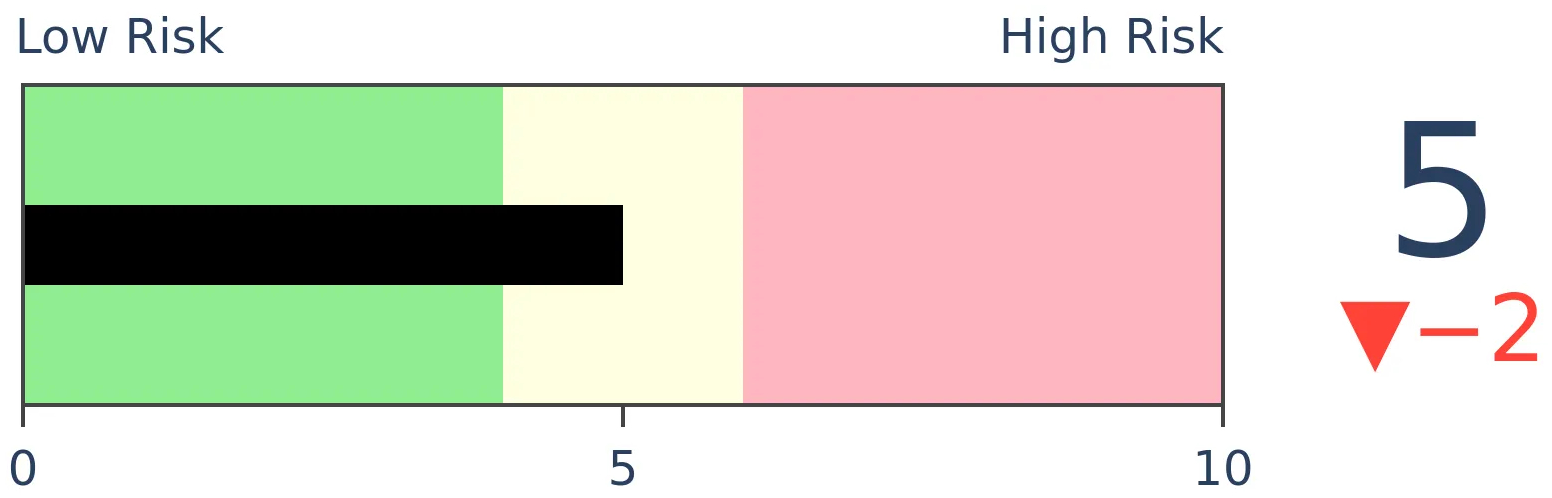
Crude Oil
|
|
Gold
|
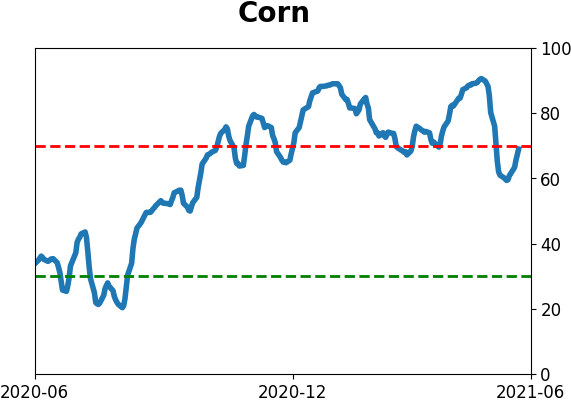
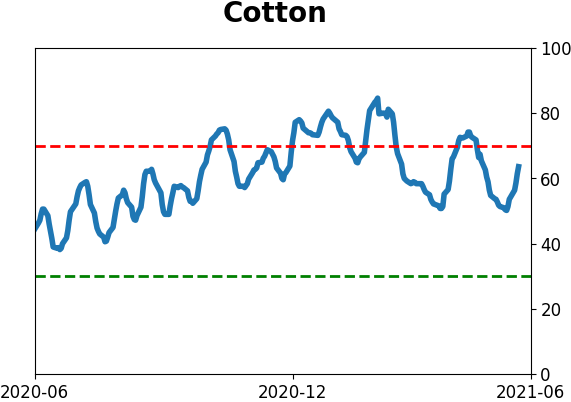
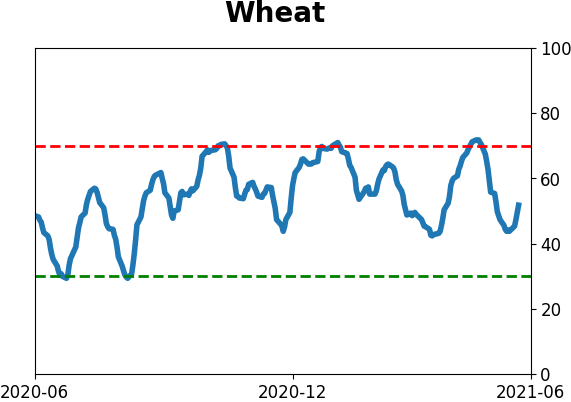
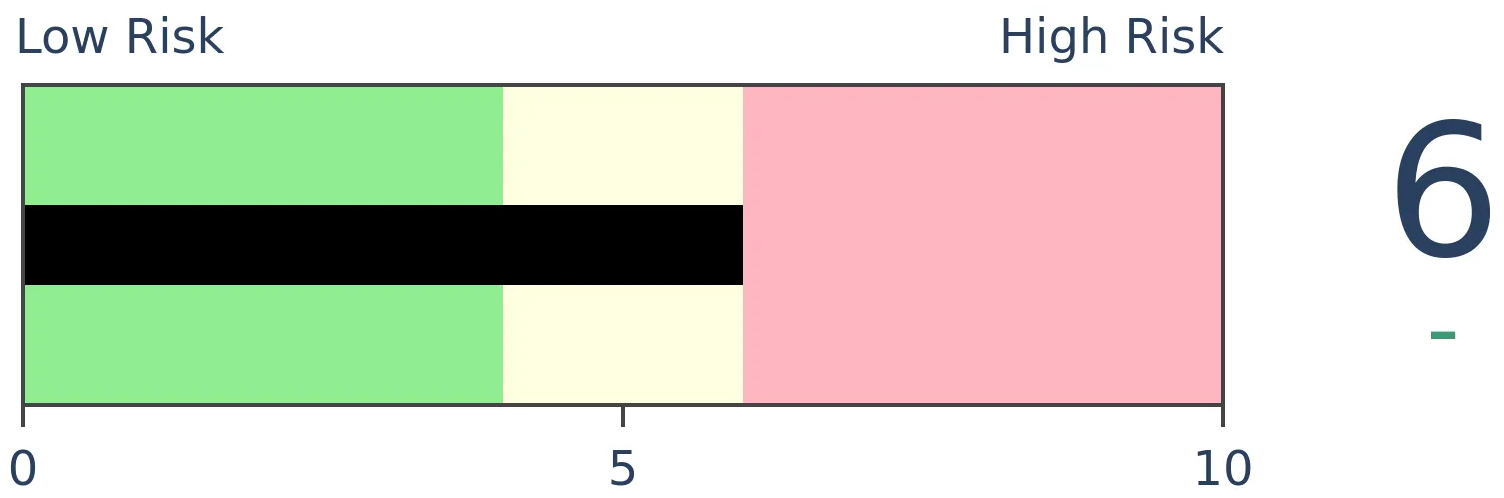
Agriculture

|
|
Research
BOTTOM LINE
The Bear Market Probability model has cycled from below 40% to above 65% in only 11 months, the fastest turnaround ever. It's not high enough to be a pressing concern though future returns decline the higher the model climbs.
FORECAST / TIMEFRAME
None
|
The probability of a new bear market is rising.
Now that data from May have been finalized, the Bear Market Probability model has risen to its highest level since January 2020.
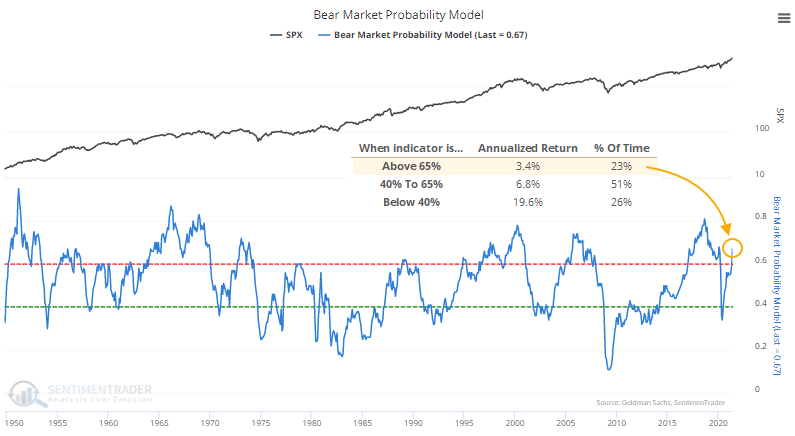
When the model is above this threshold, the S&P 500 has returned an annualized +3.4%. That's not disastrous, but it's well below average and only a sixth of the return when the probability is below 40%. Jay showed earlier that when it drops even further, below 35%, stocks gained almost without exception.
Bear Market Probability is a model outlined by Goldman Sachs using five fundamental inputs:
- The U.S. Unemployment Rate
- ISM Manufacturing Index
- Yield Curve
- Inflation Rate
- P/E Ratio
Each month's reading is ranked versus all other historical readings and assigned a score. The higher the score, the higher the probability of a bear market in the months ahead.
When we looked at this last March, we saw that it was going to plunge below 40%. While it was way too early in 2008, the other signals all preceded gains, and it added another win over the past year.
Let's look at the S&P's future returns when the probability cycles from low to high, from below 40% to above 65%.
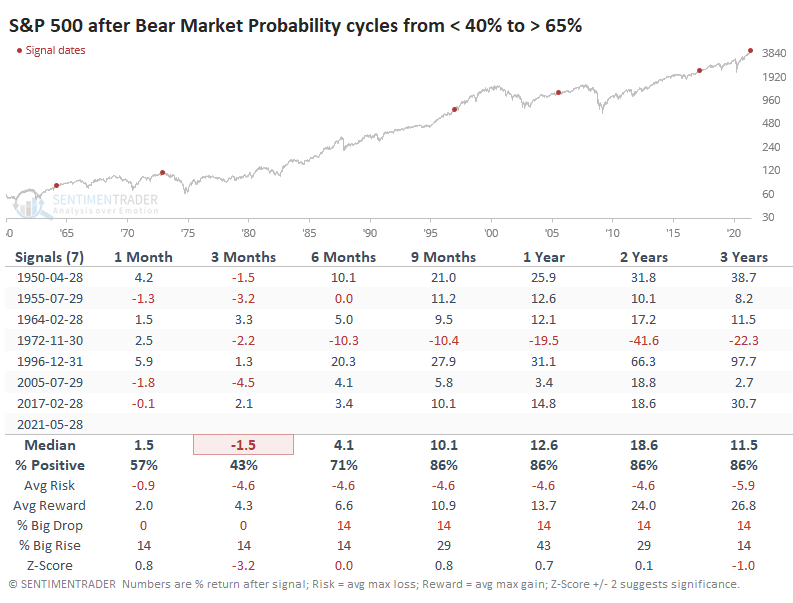
It took Bear Market Probability an average of 28 months to cycle from below 40% to above 65%.
Last year showed us one of the fastest-ever bear markets, then one of the quickest bull markets. So, it's not a big surprise that our current cycle took only 11 months, the shortest one ever. The previous shortest cycle was the one in November 1972 (a cycle of 12 months), which also preceded the biggest failure going forward, for what that's worth.
There isn't a lot in the table above that's concerning. Shorter-term returns were weak, but a couple of them within an already tiny sample bucked that weakness and saw consistent strength. Over the next year, all but two record double-digit gains. It will be a more pressing concern if Bear Market Probability climbs above 70%.
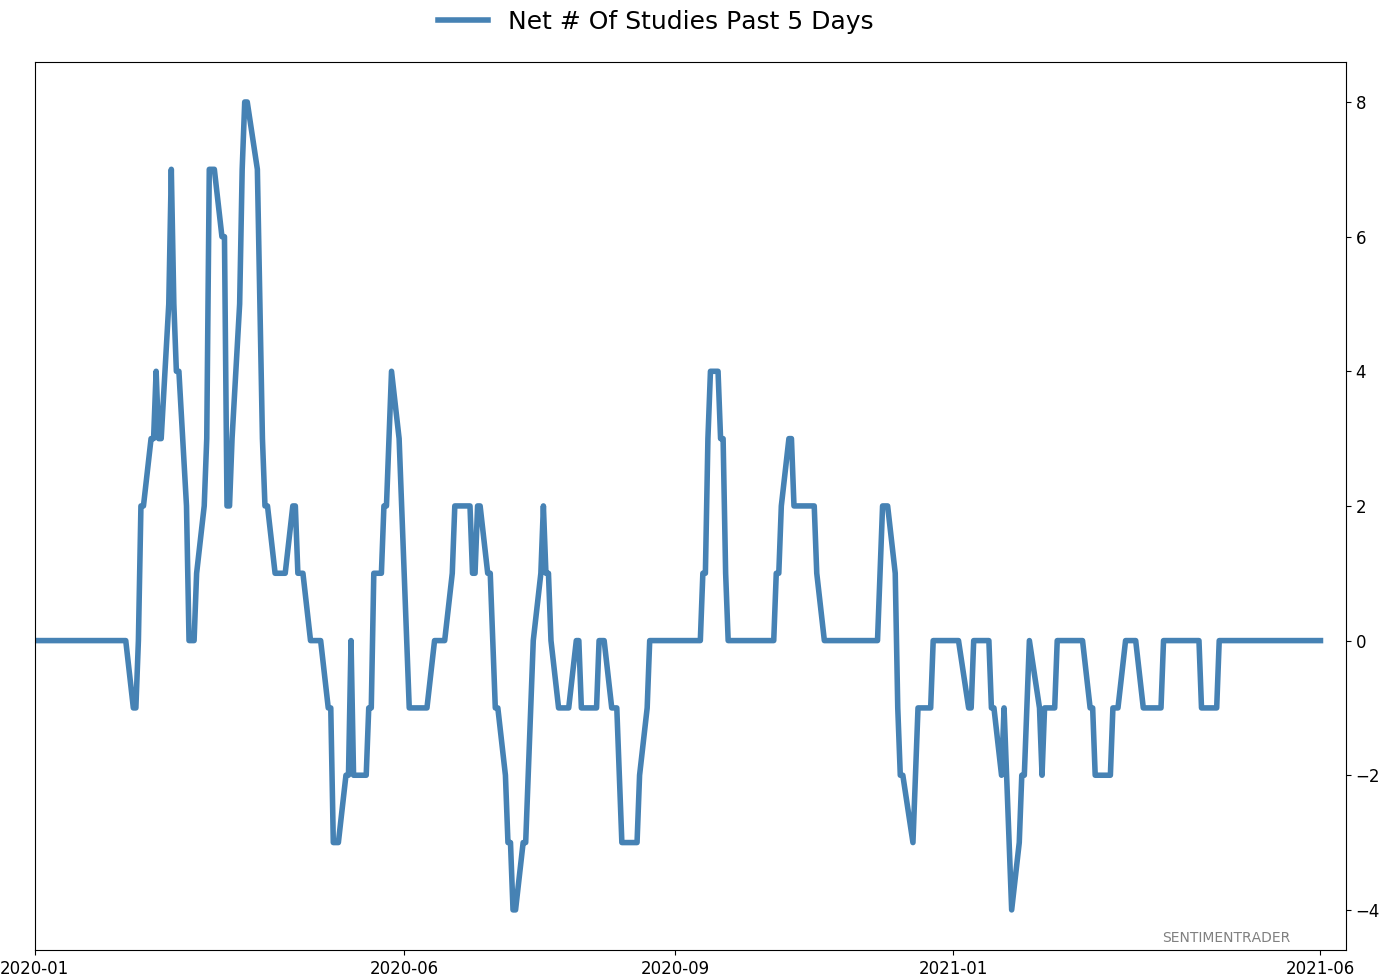
Active Studies
| Time Frame | Bullish | Bearish | | Short-Term | 0 | 0 | | Medium-Term | 1 | 11 | | Long-Term | 11 | 5 |
|
Indicators at Extremes
Portfolio
| Position | Description | Weight % | Added / Reduced | Date | | Stocks | RSP | 4.1 | Added 4.1% | 2021-05-19 | | Bonds | 23.9% BND, 6.9% SCHP | 30.7 | Reduced 7.1% | 2021-05-19 | | Commodities | GCC | 2.6 | Reduced 2.1%
| 2020-09-04 | | Precious Metals | GDX | 5.6 | Reduced 4.2% | 2021-05-19 | | Special Situations | 4.3% XLE, 2.2% PSCE | 7.6 | Reduced 5.6% | 2021-04-22 | | Cash | | 49.4 | | |
|
Updates (Changes made today are underlined)
Much of our momentum and trend work has remained positive for several months, with some scattered exceptions. Almost all sentiment-related work has shown a poor risk/reward ratio for stocks, especially as speculation drove to record highs in exuberance in February. Much of that has worn off, and most of our models are back toward neutral levels. There isn't much to be excited about here. The same goes for bonds and even gold. Gold has been performing well lately and is back above long-term trend lines. The issue is that it has a poor record of holding onto gains when attempting a long-term trend change like this, so we'll take a wait-and-see approach. RETURN YTD: 10.1% 2020: 8.1%, 2019: 12.6%, 2018: 0.6%, 2017: 3.8%, 2016: 17.1%, 2015: 9.2%, 2014: 14.5%, 2013: 2.2%, 2012: 10.8%, 2011: 16.5%, 2010: 15.3%, 2009: 23.9%, 2008: 16.2%, 2007: 7.8%
|
|
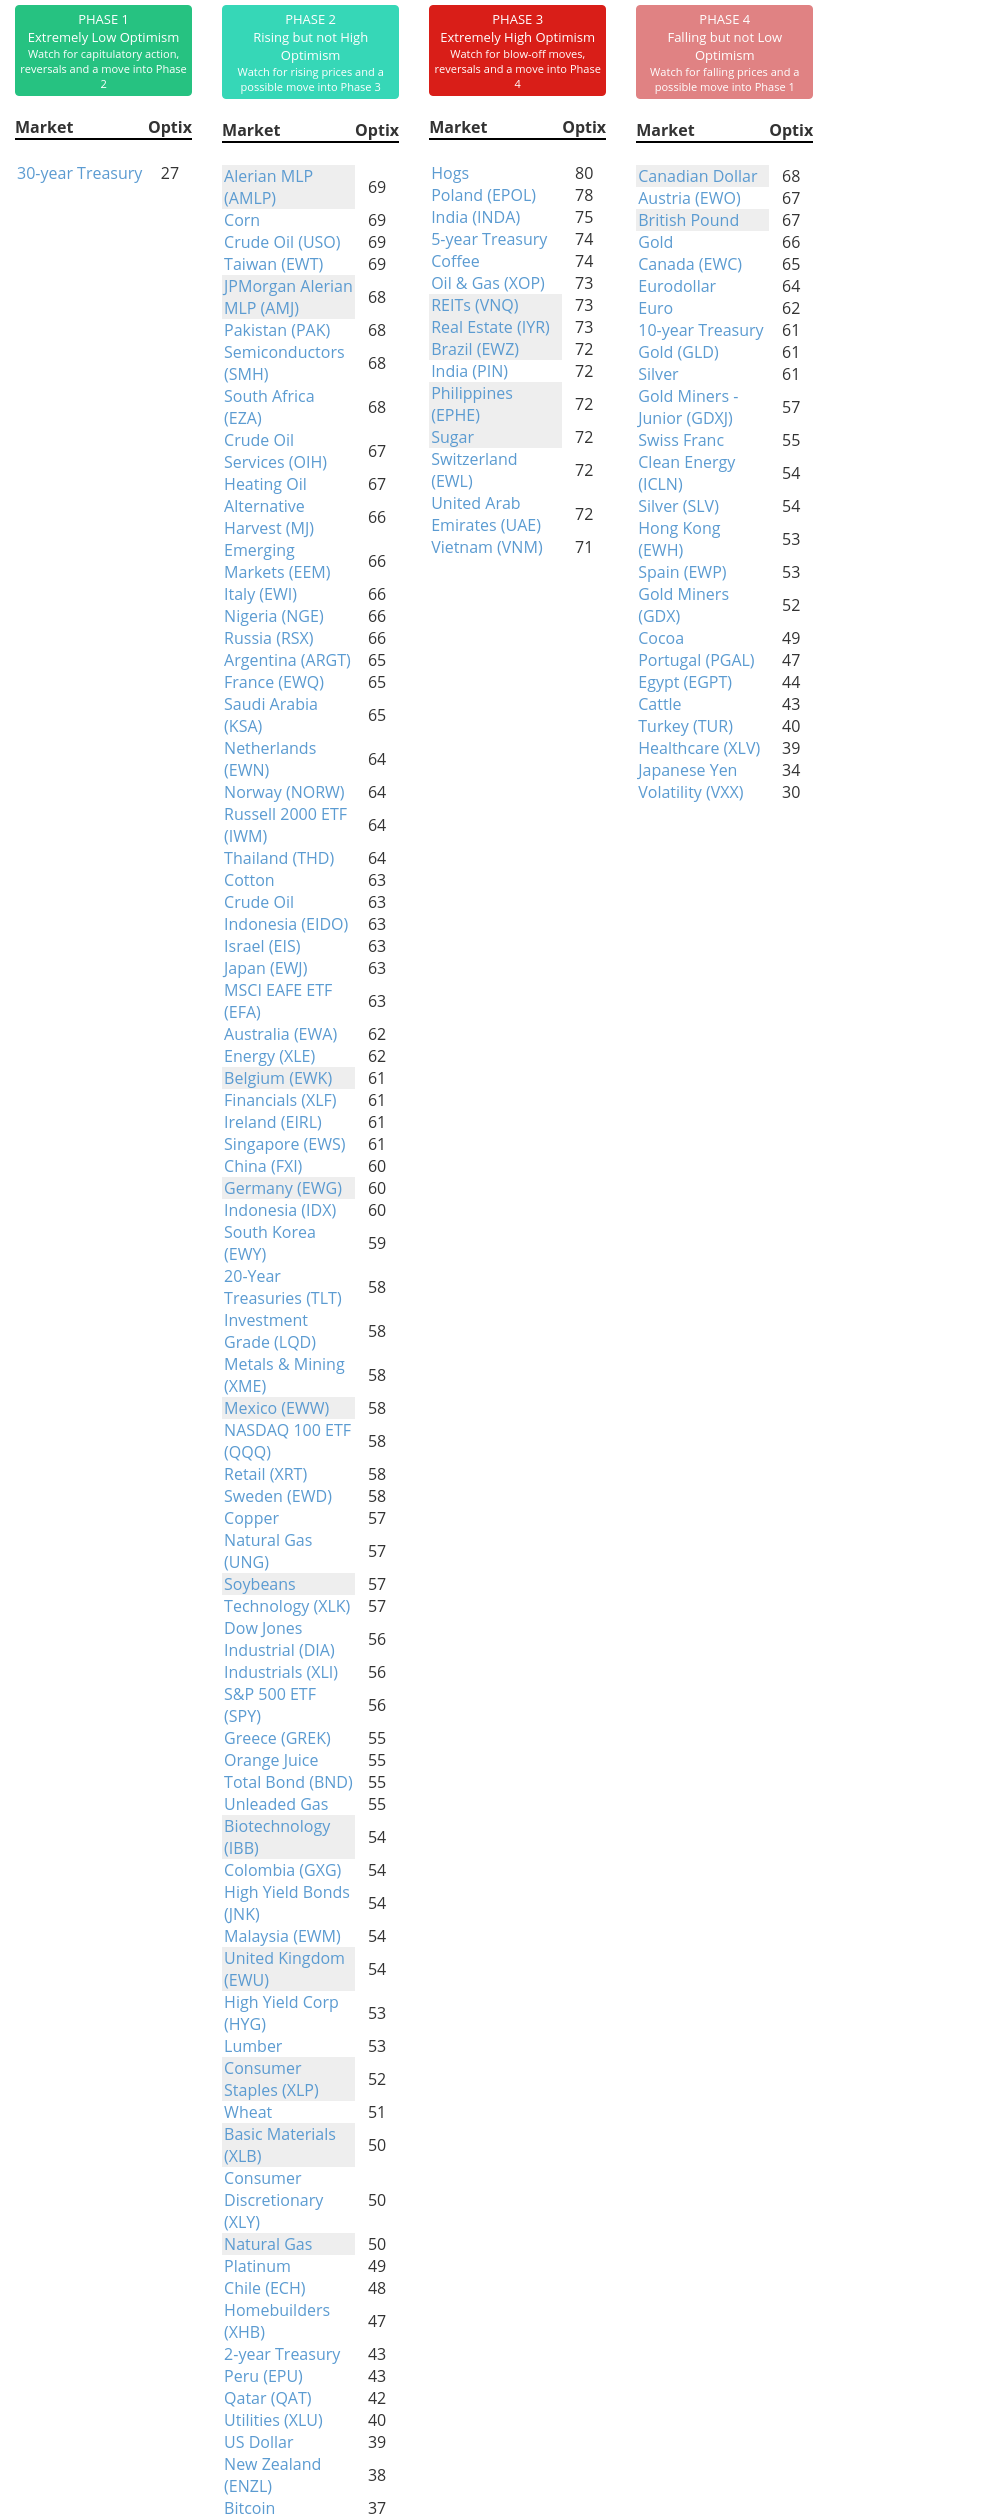
Phase Table
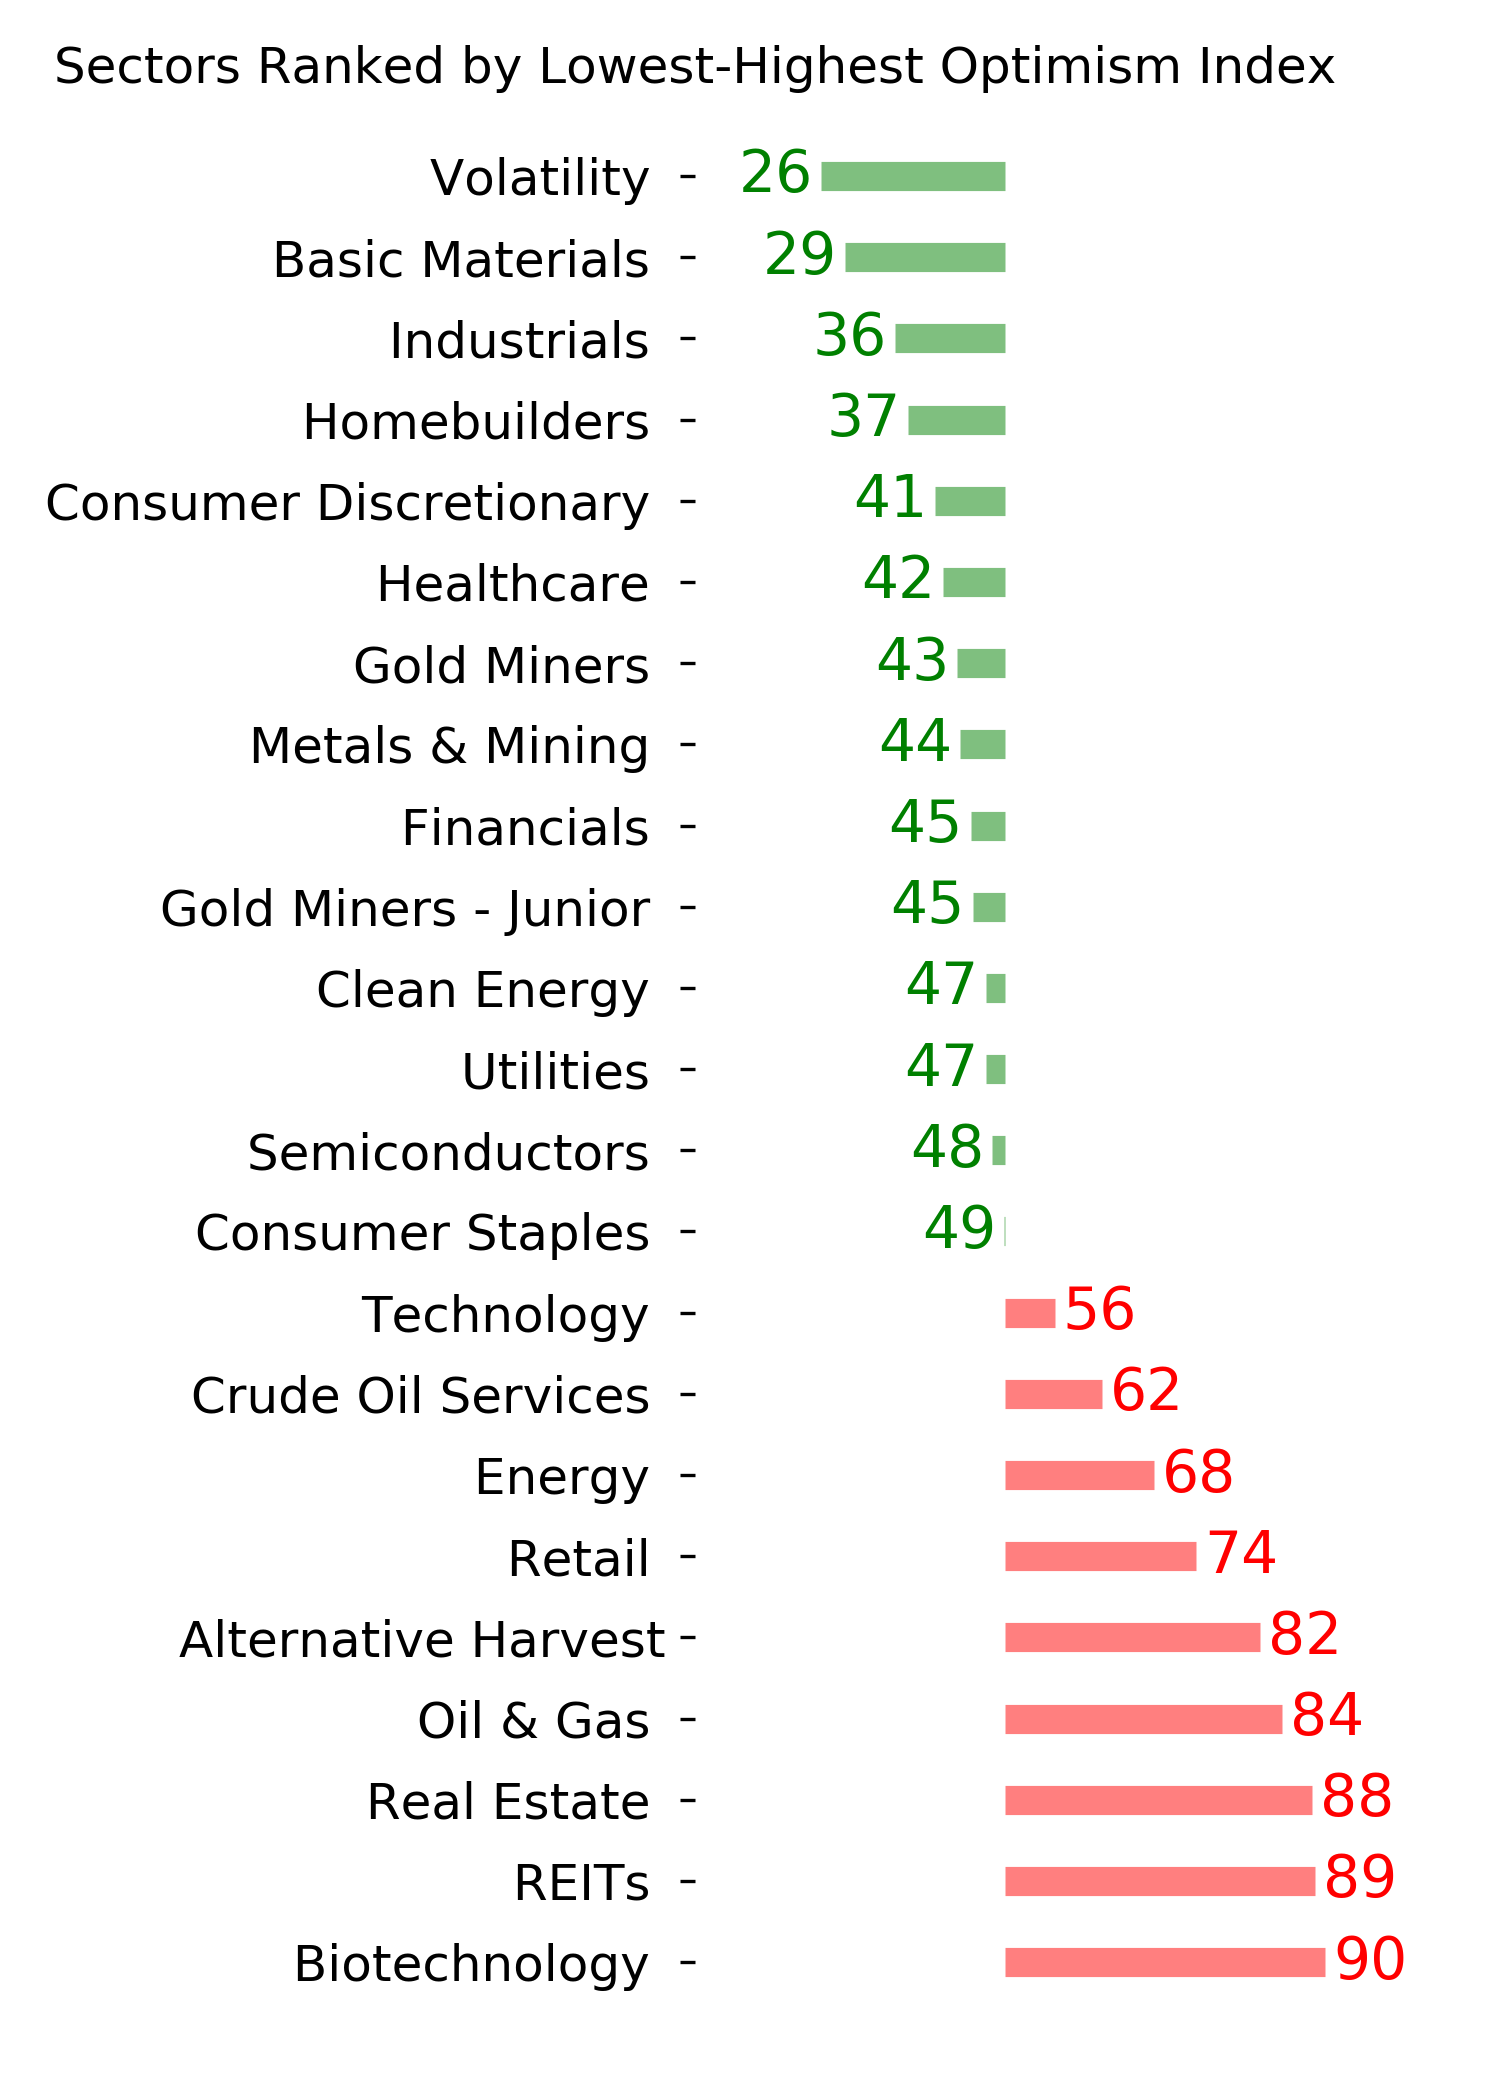
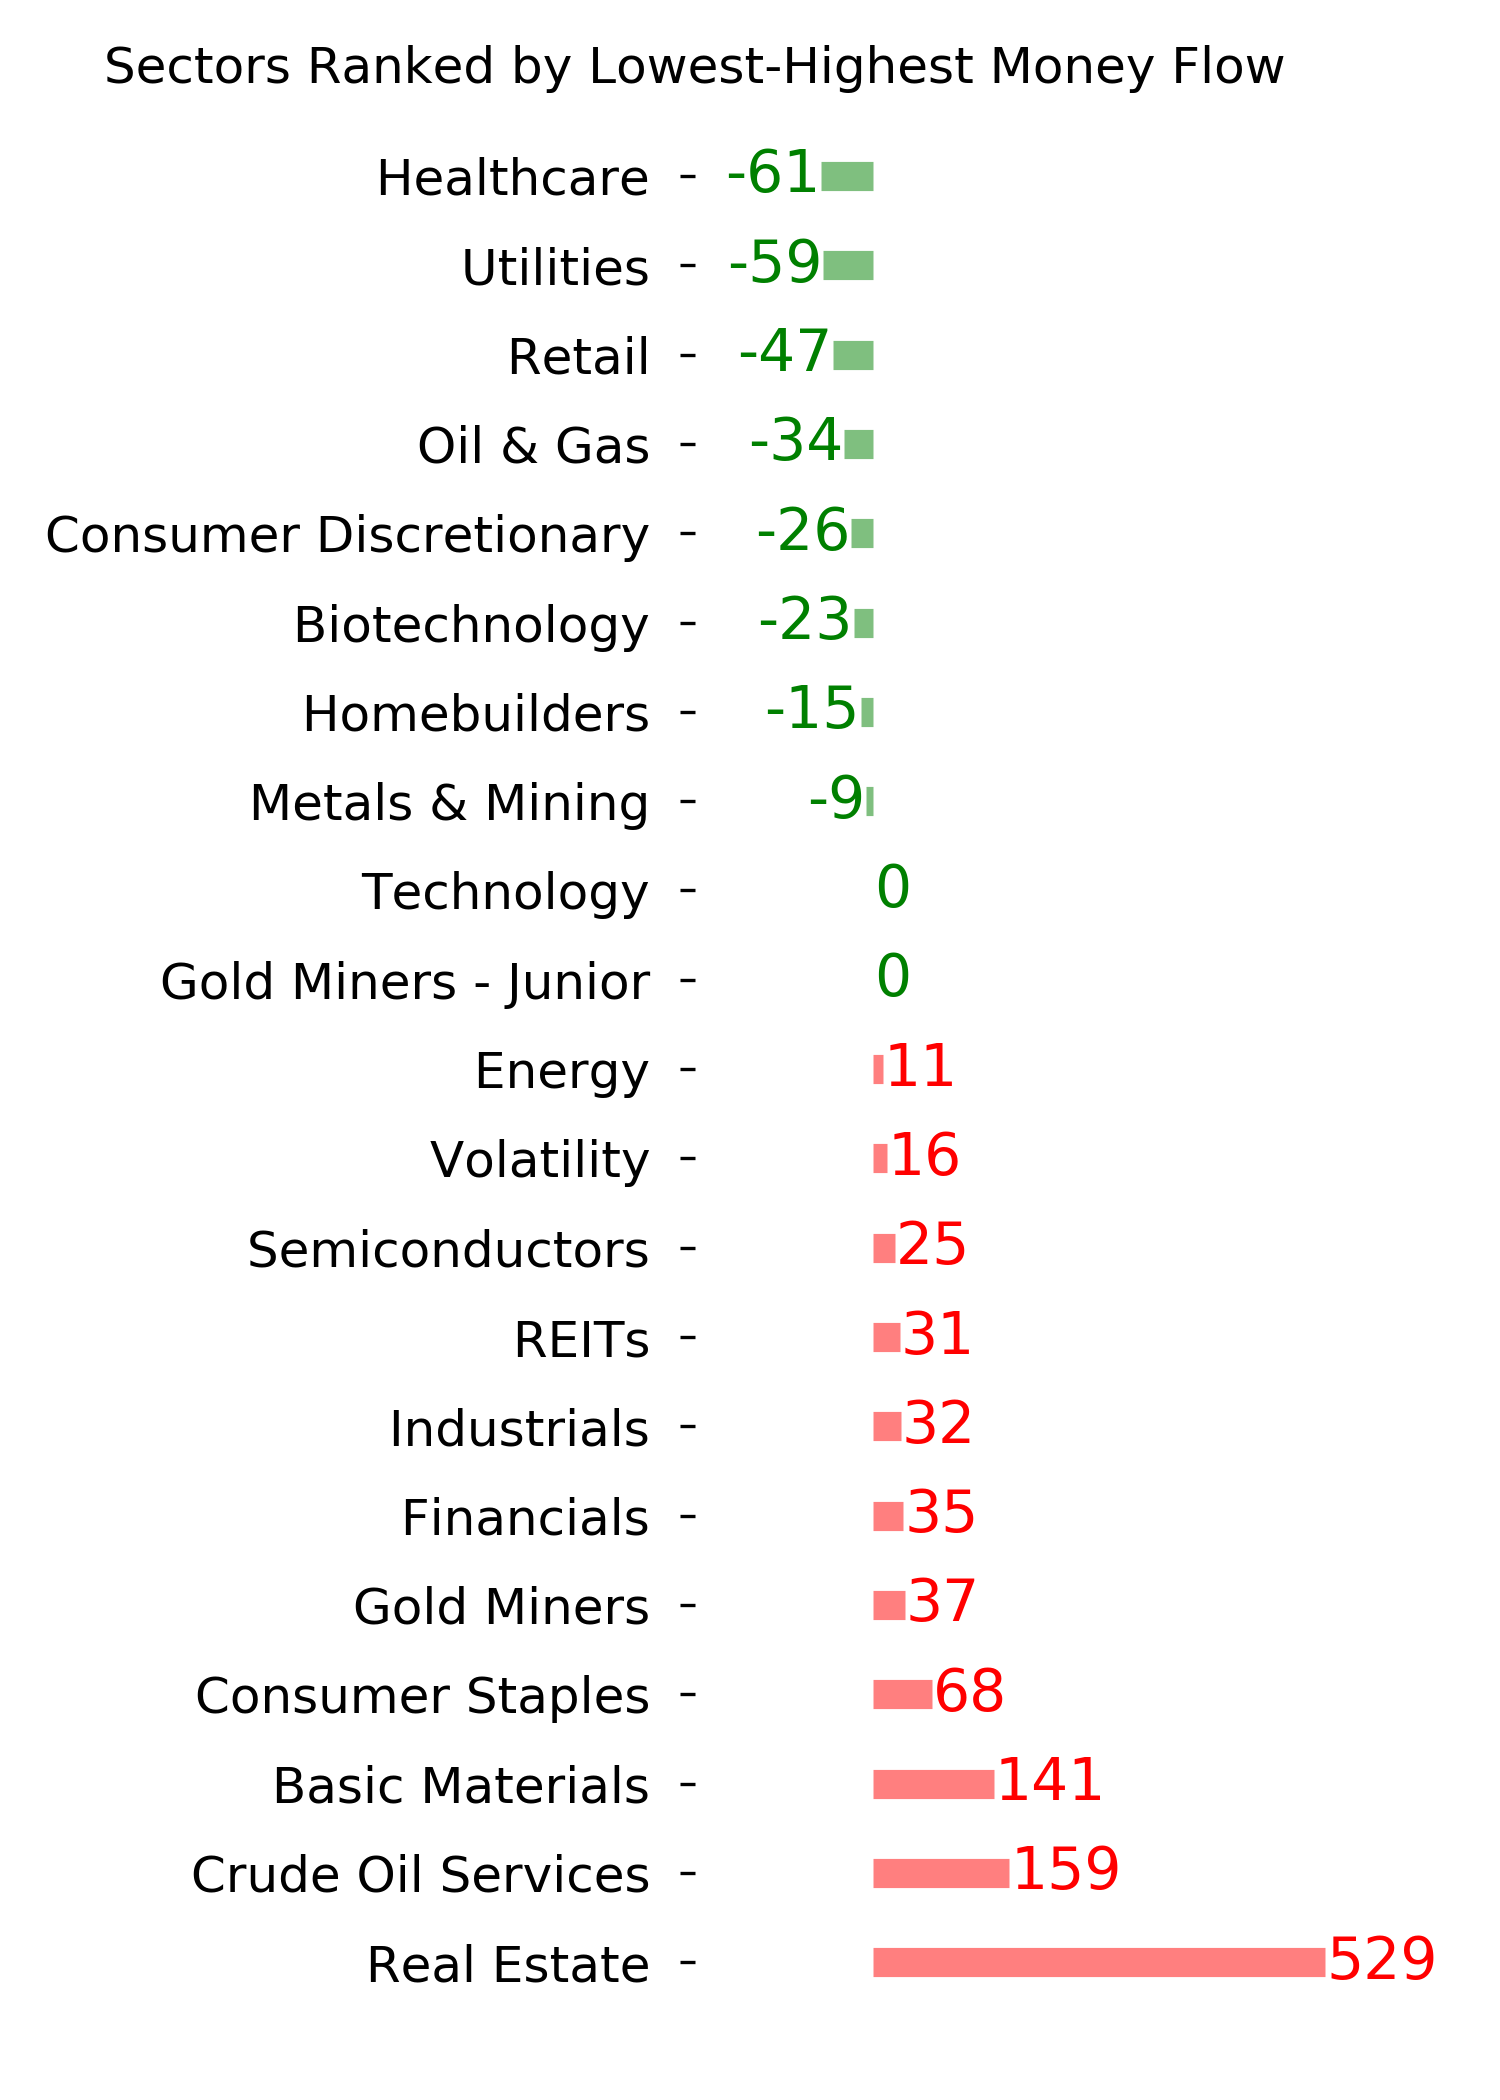
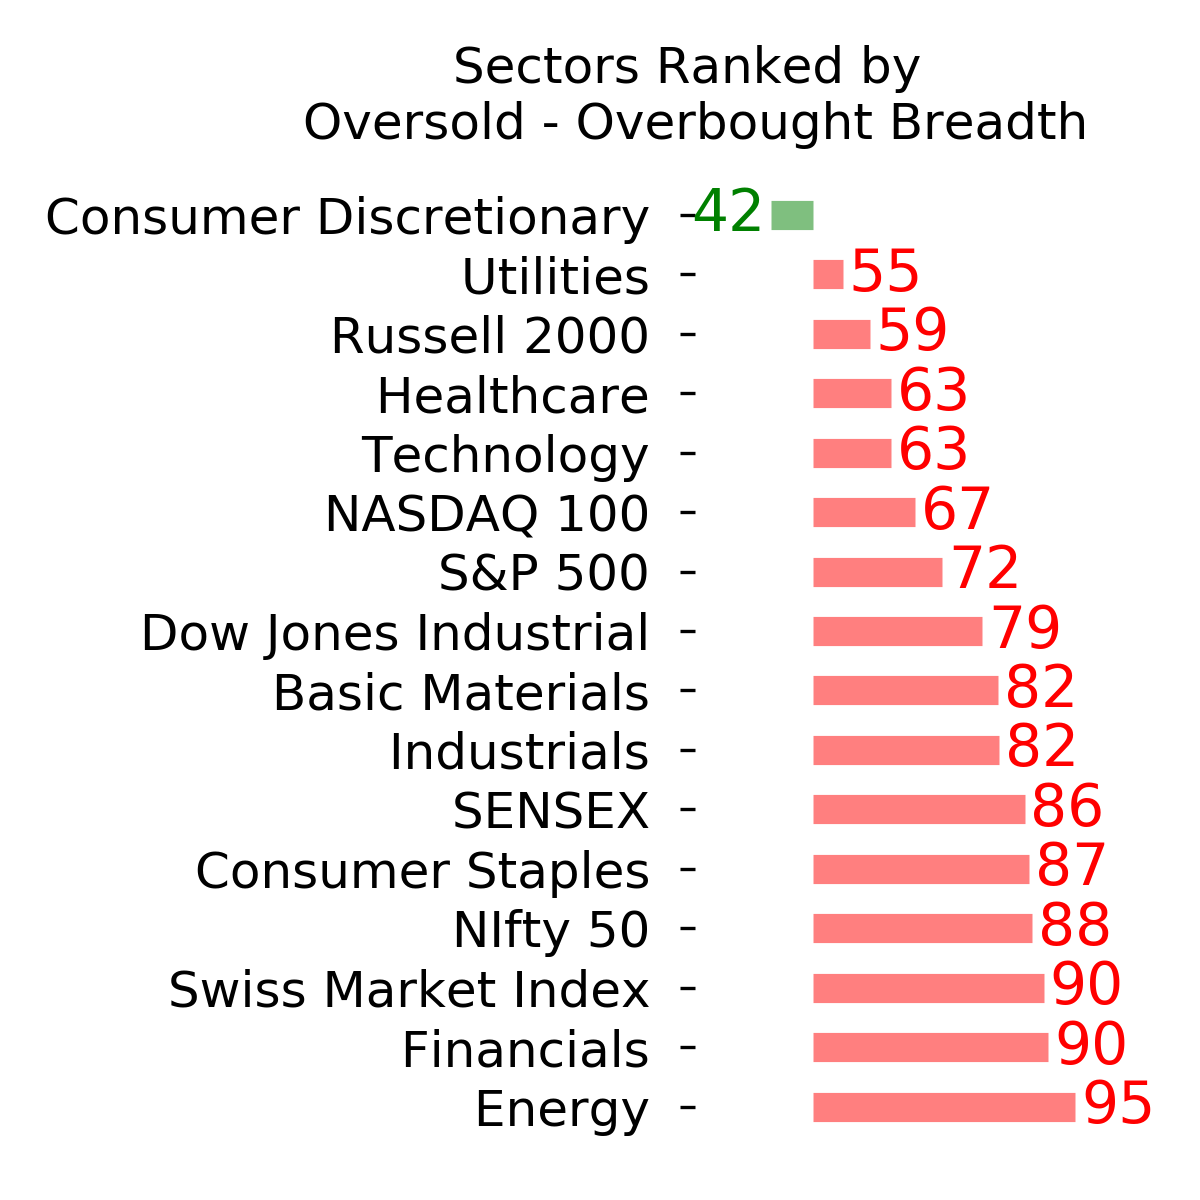
Ranks
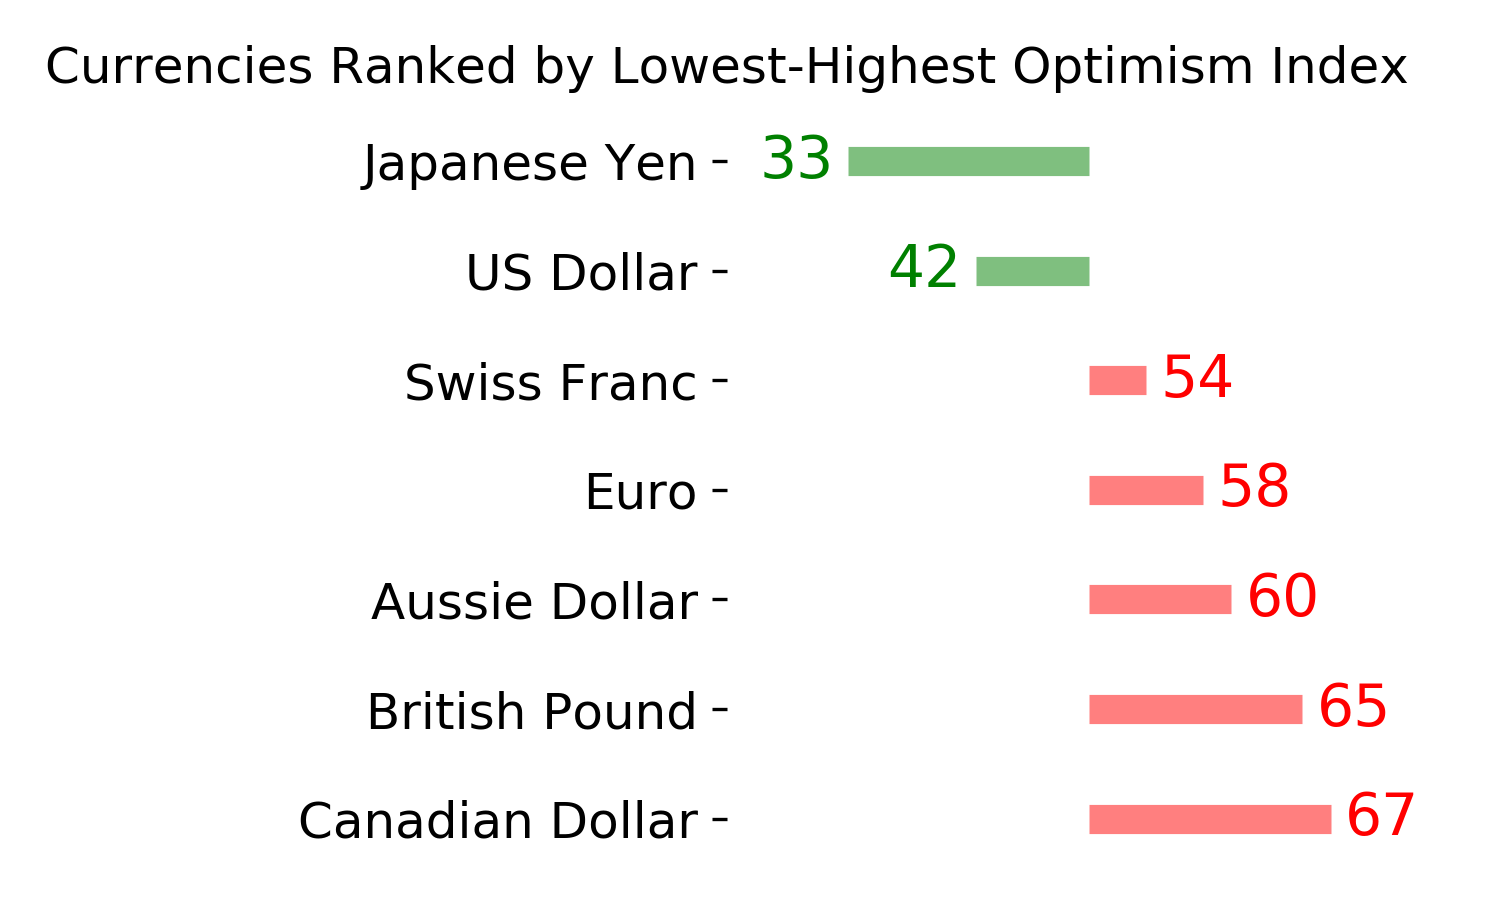
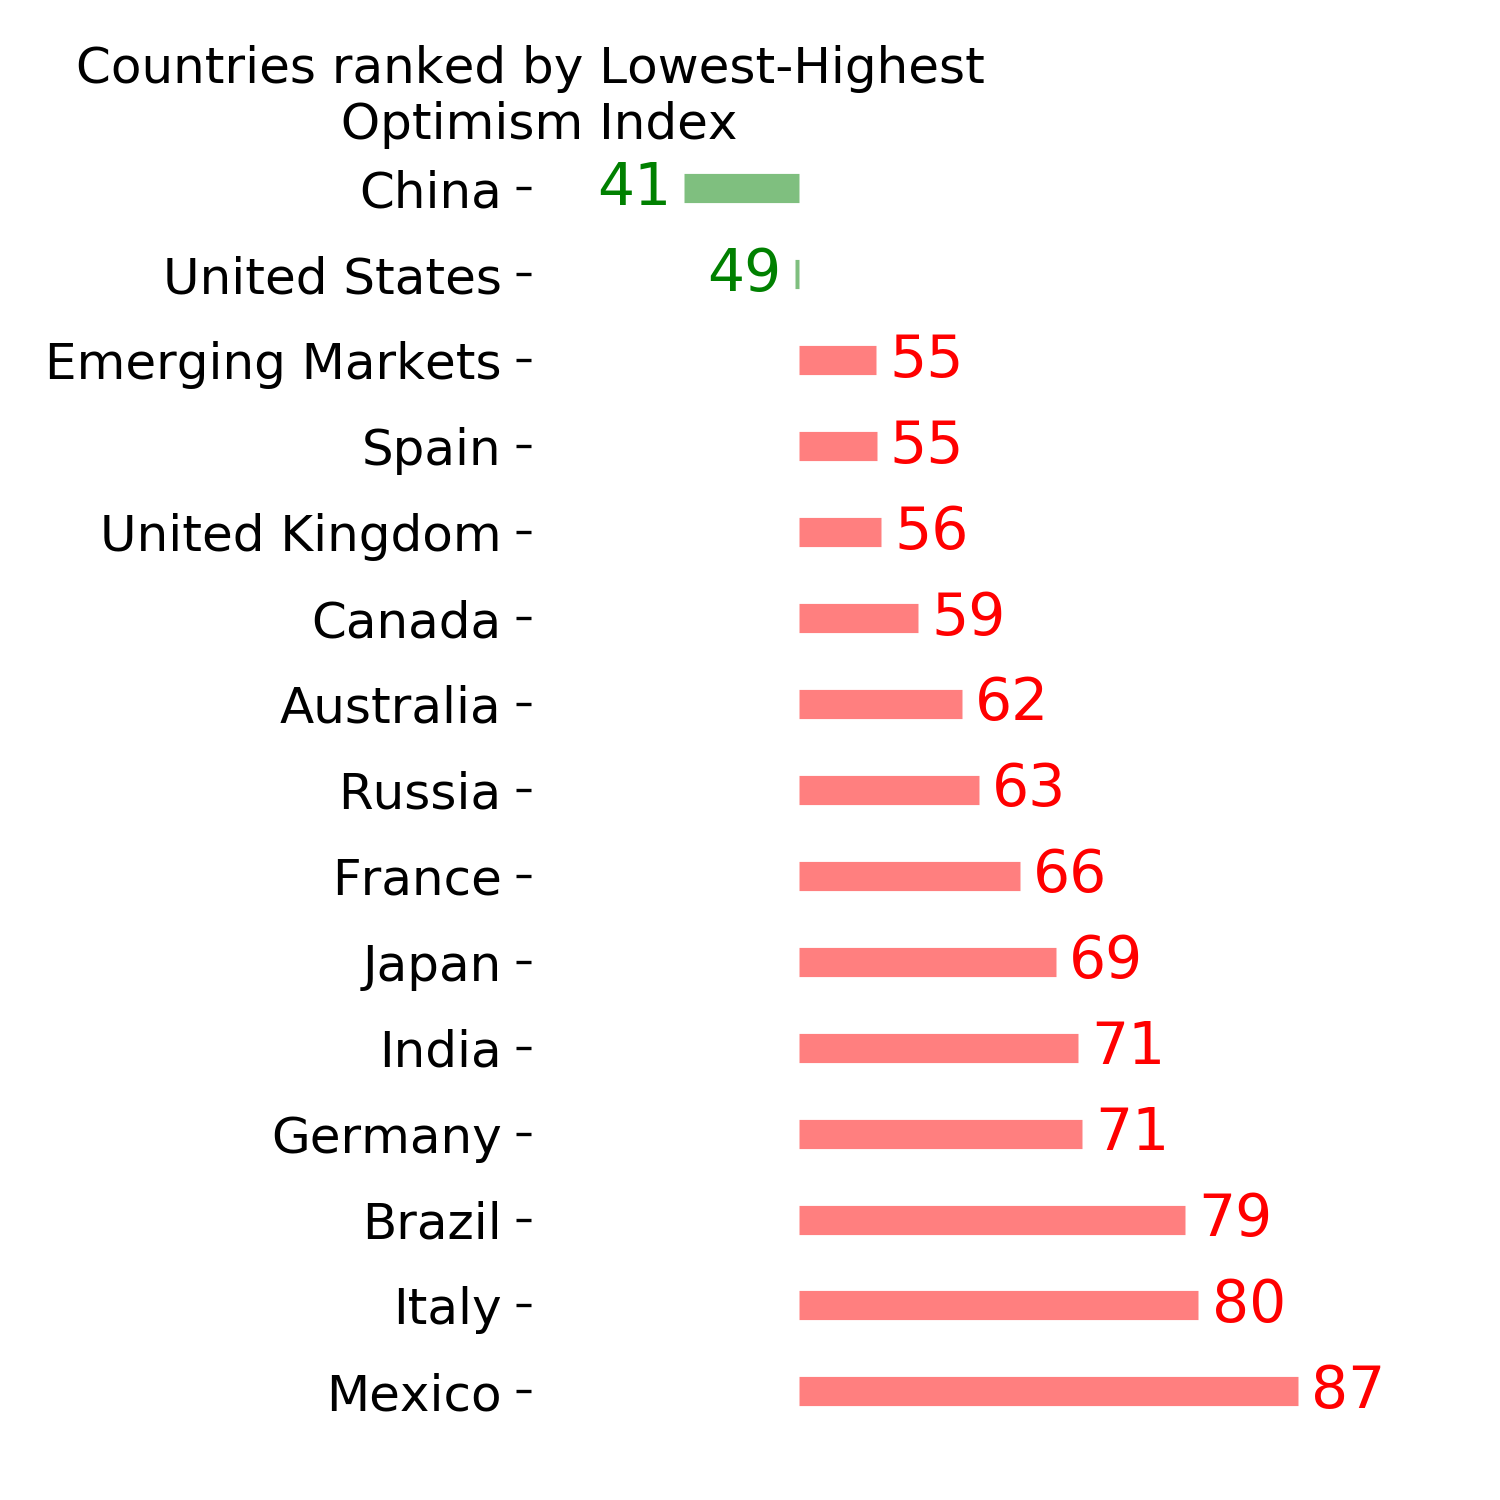
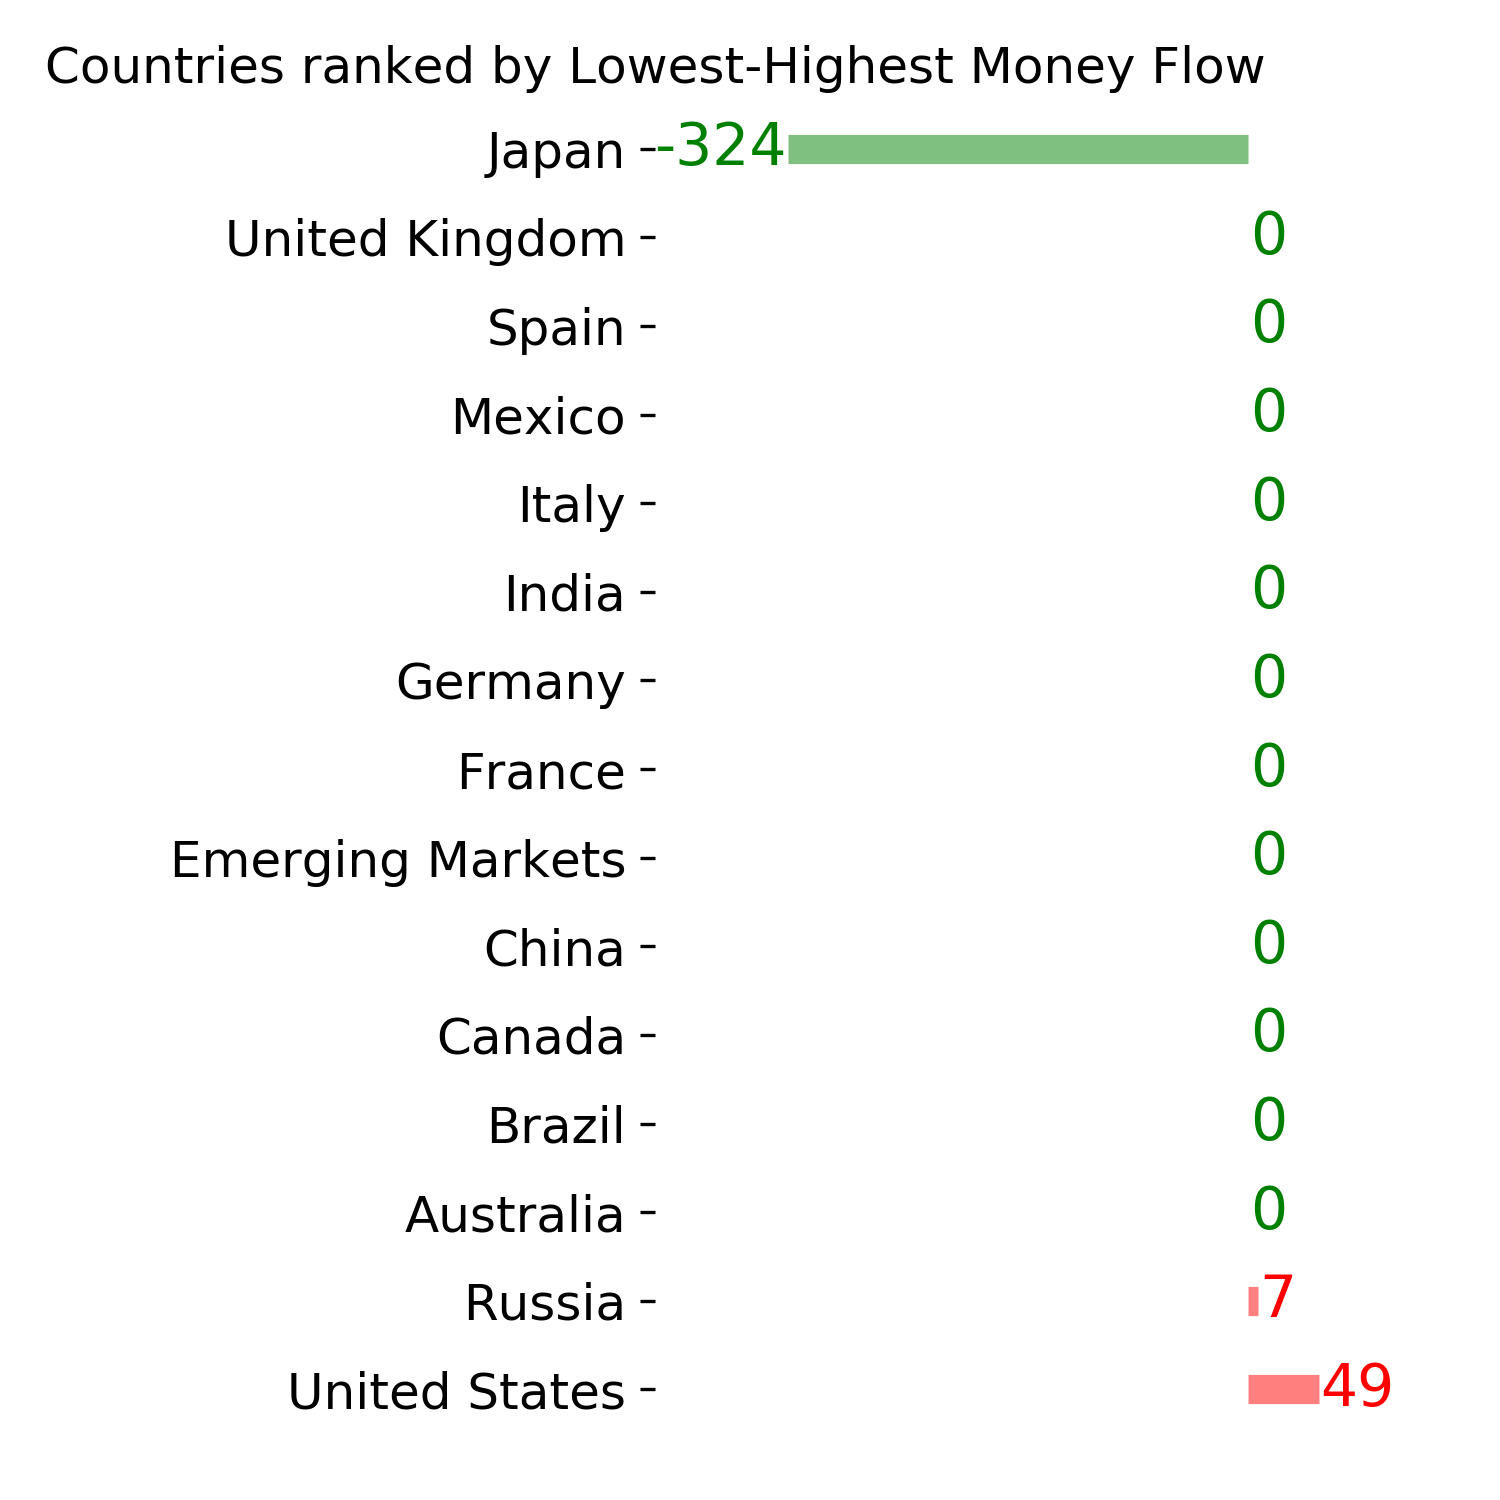
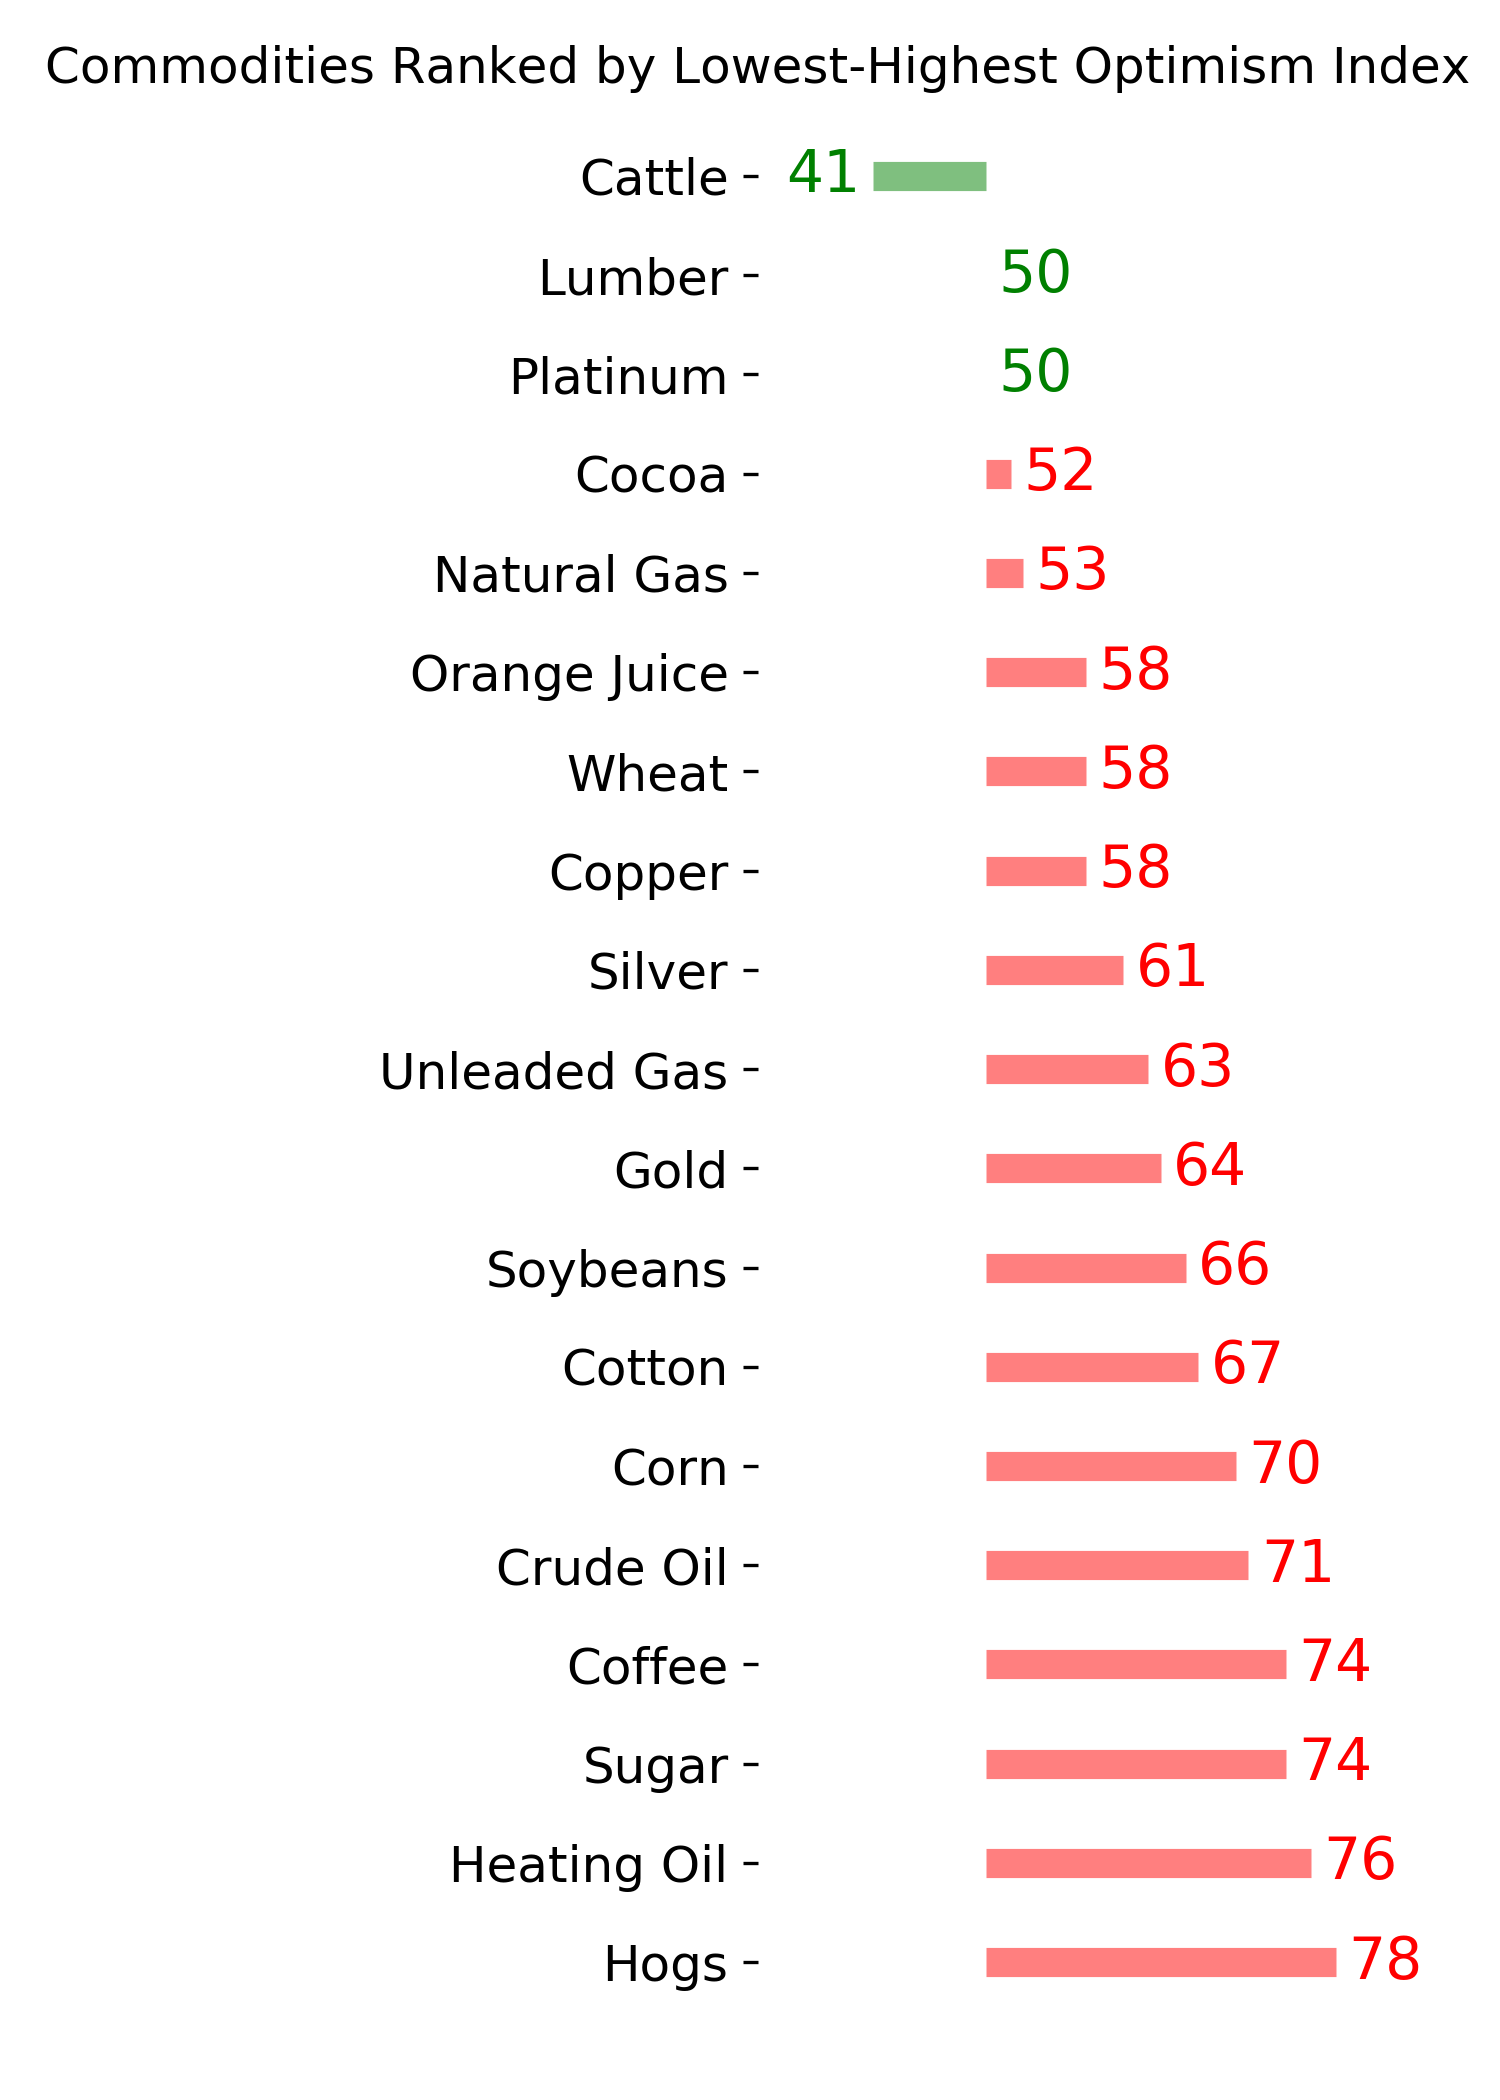
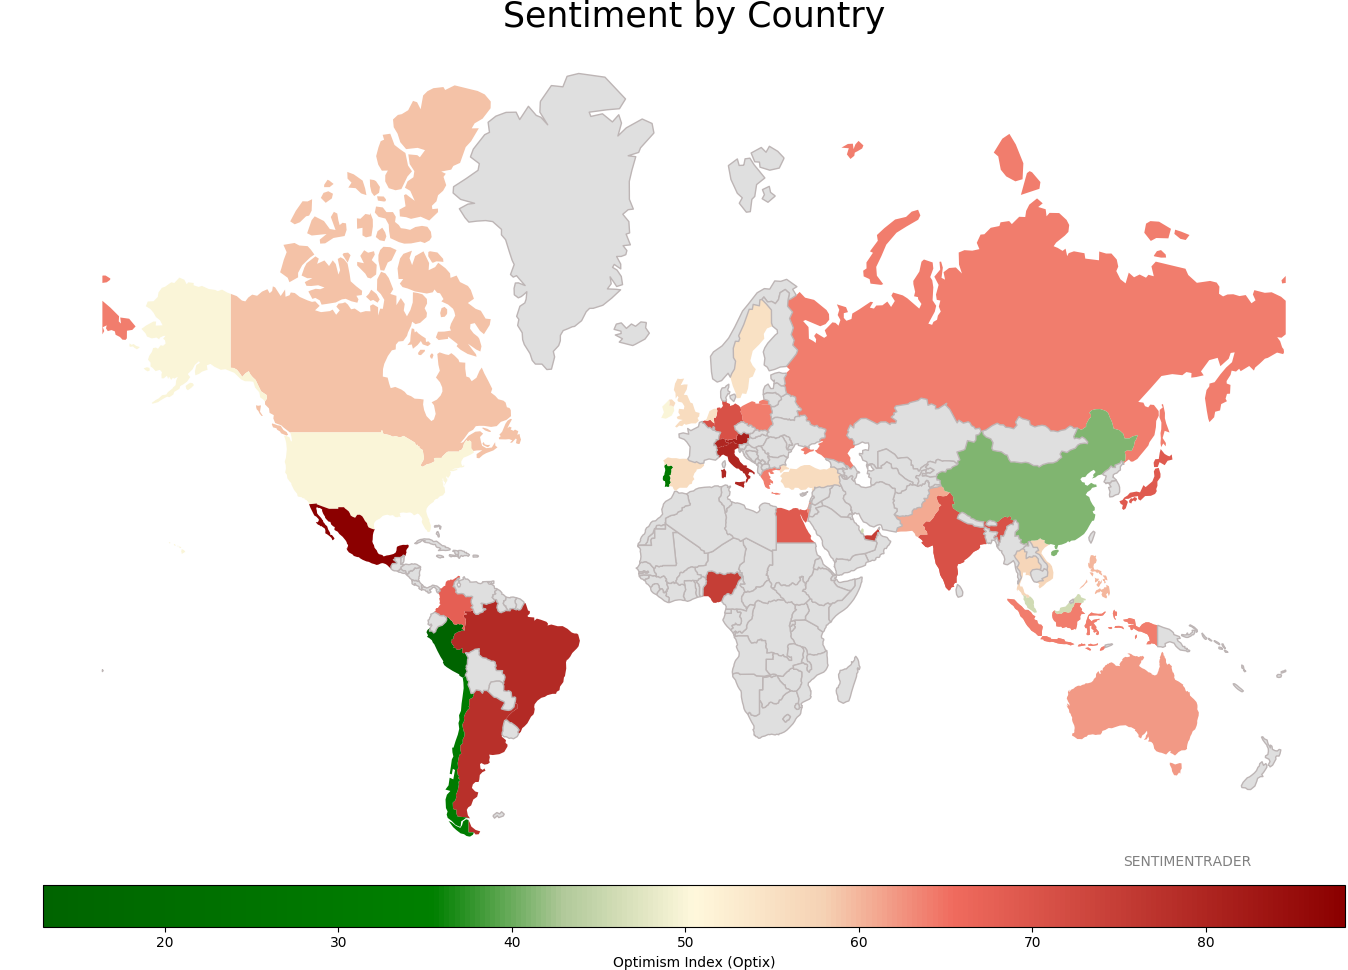
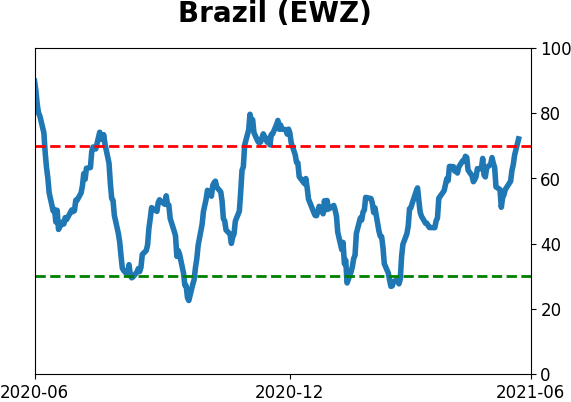
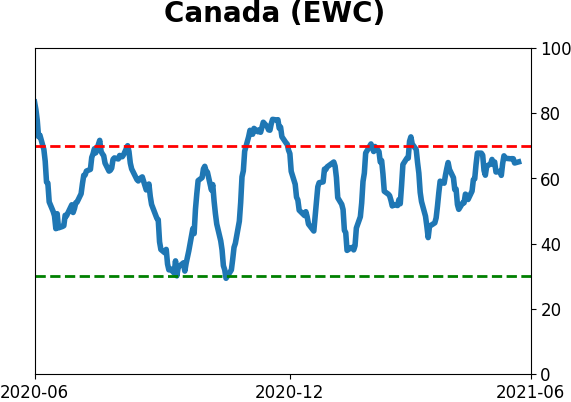
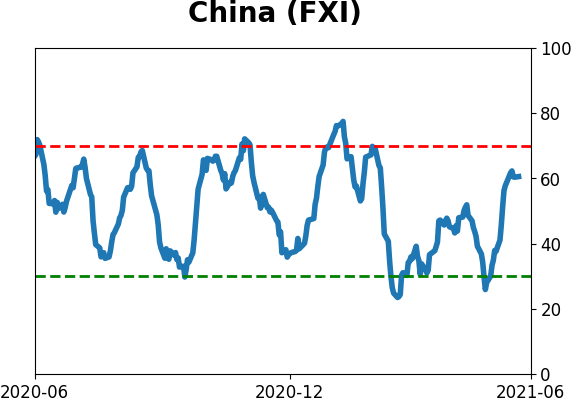
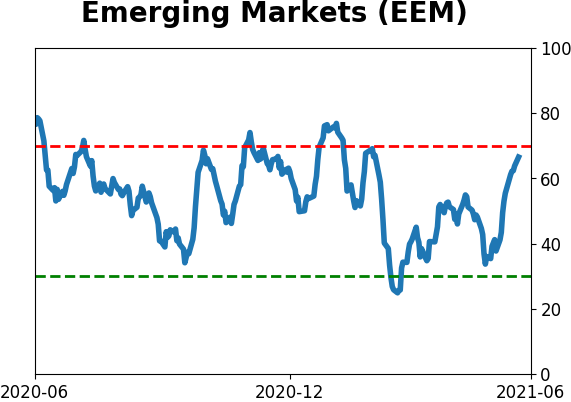
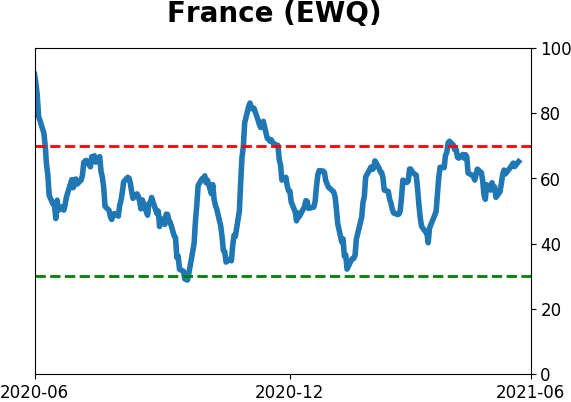
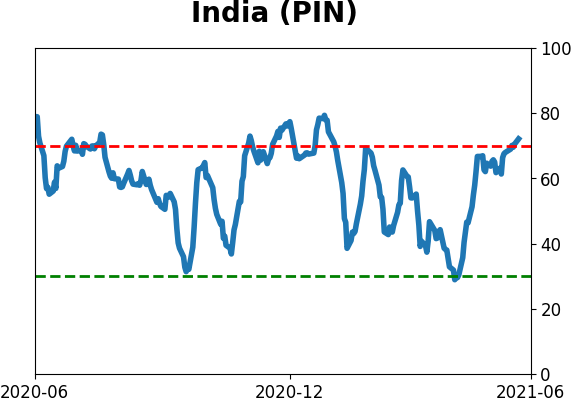
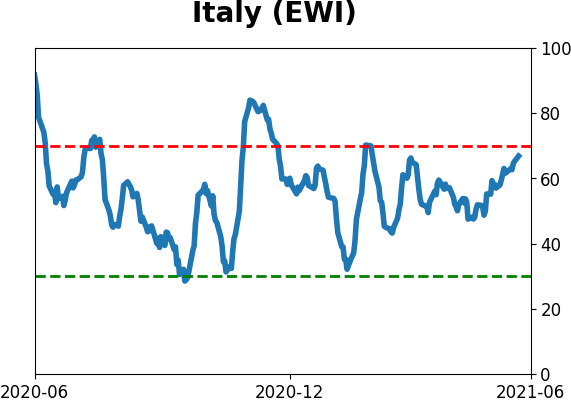
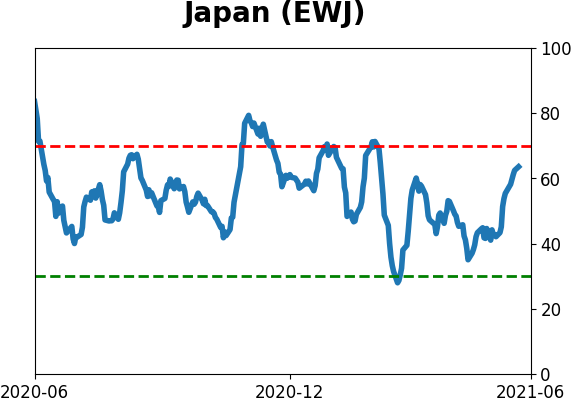
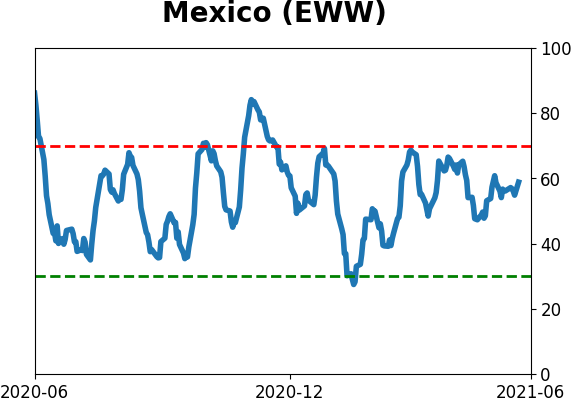
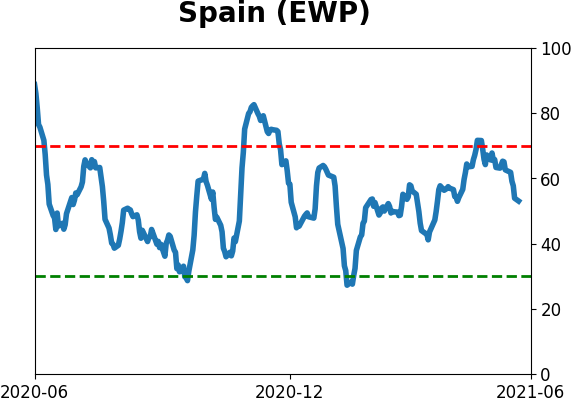
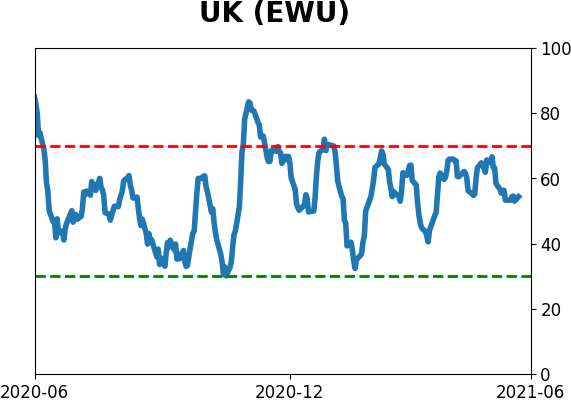
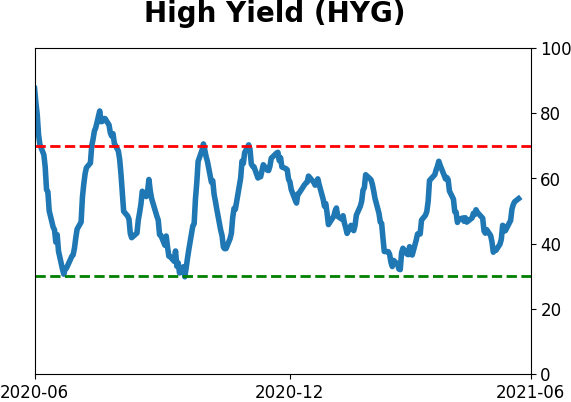
Sentiment Around The World
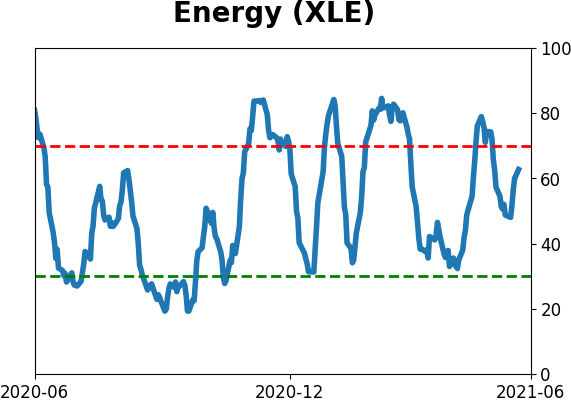
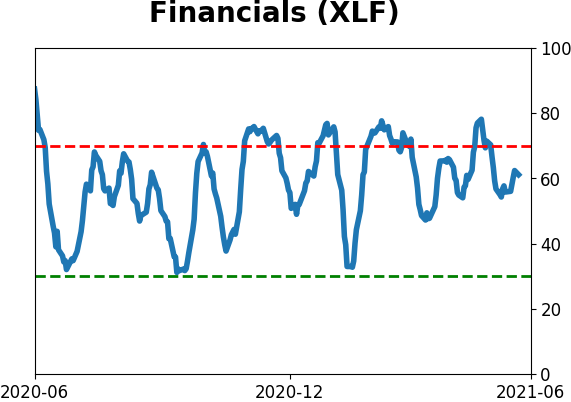
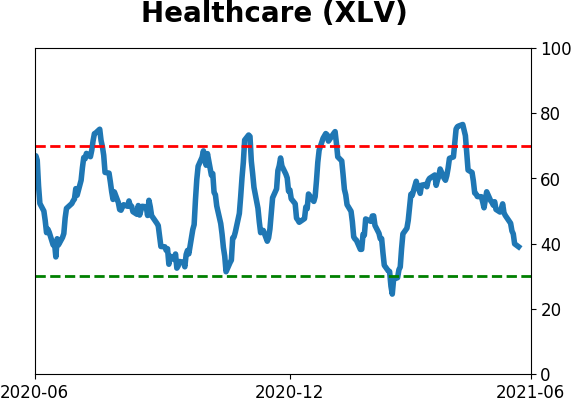
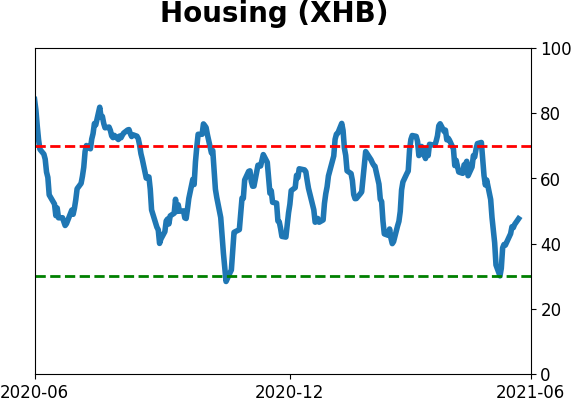
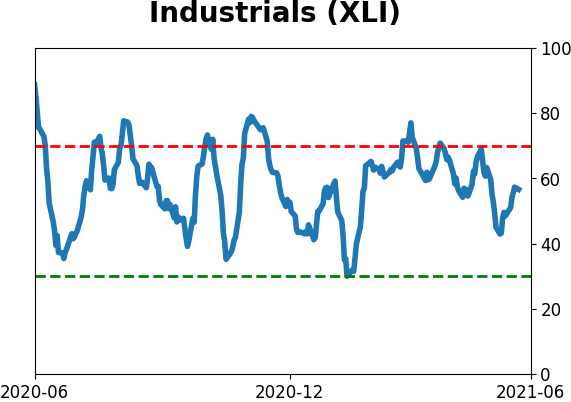
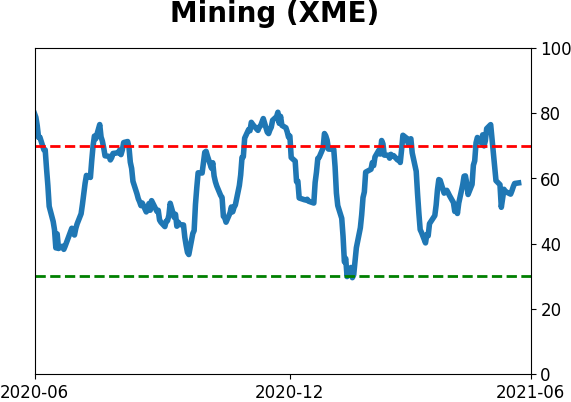
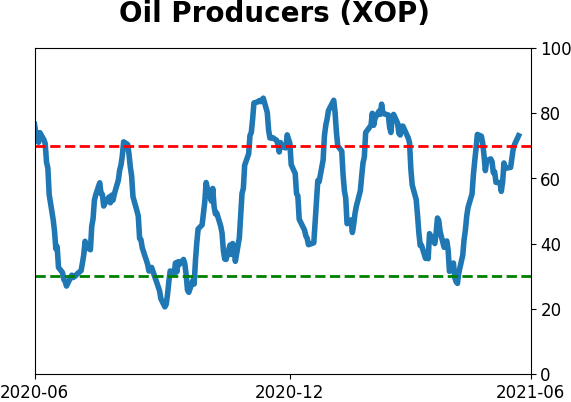
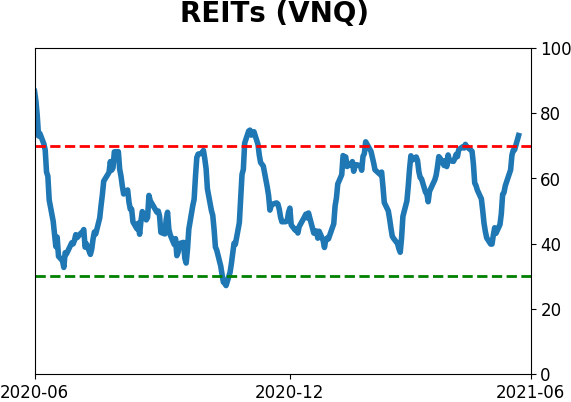
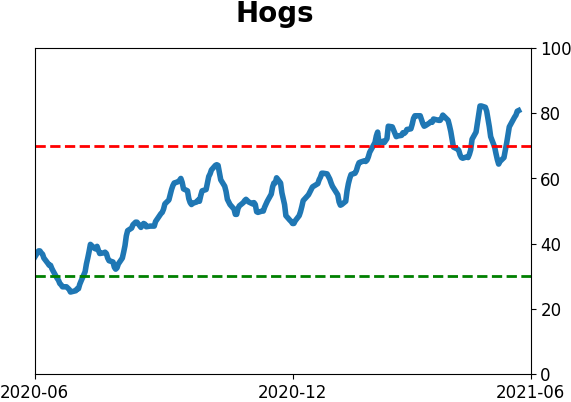
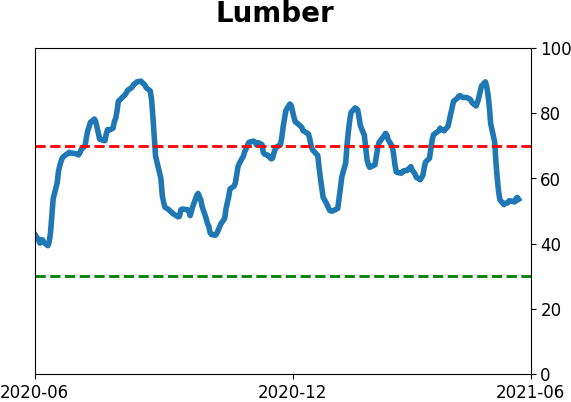
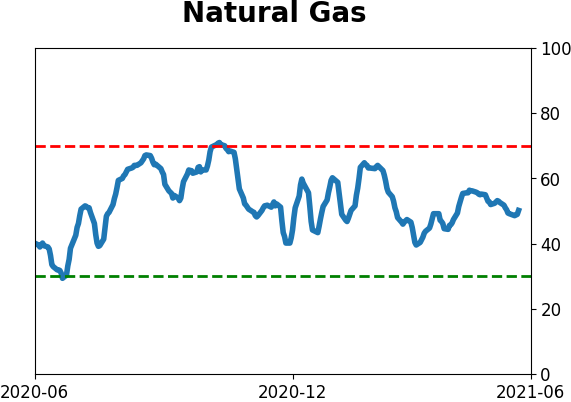
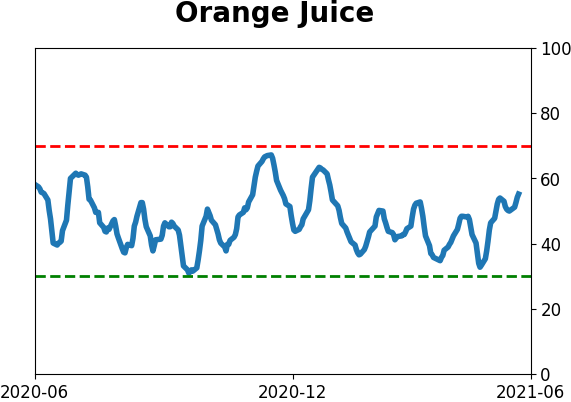
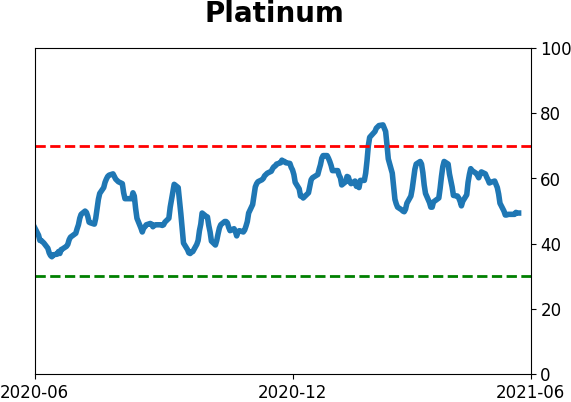
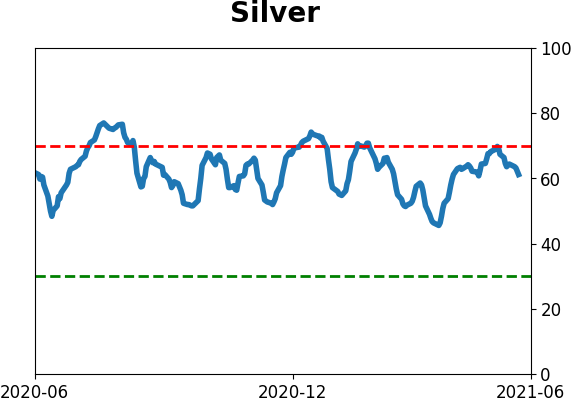
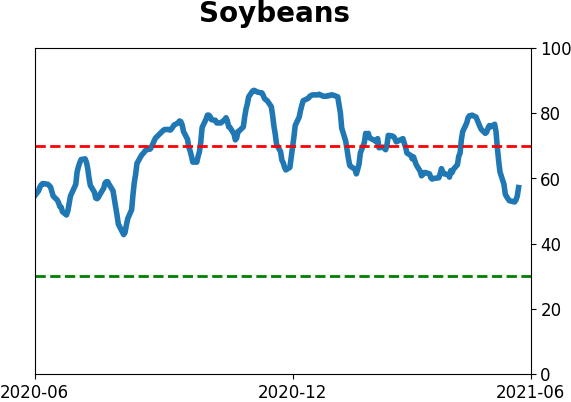
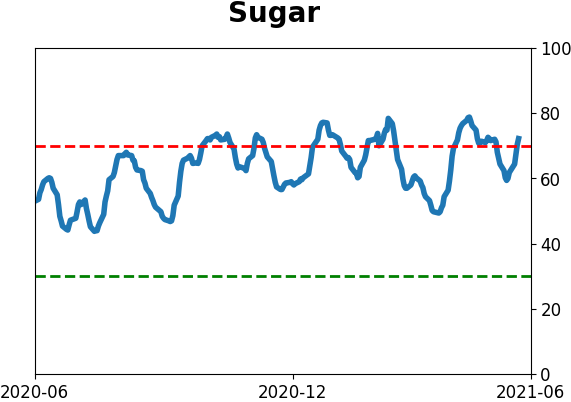
Optimism Index Thumbnails
|
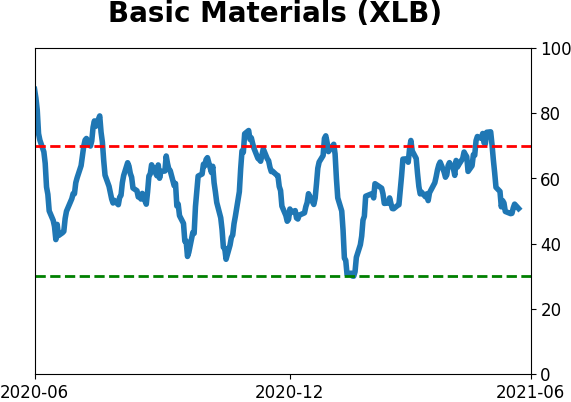
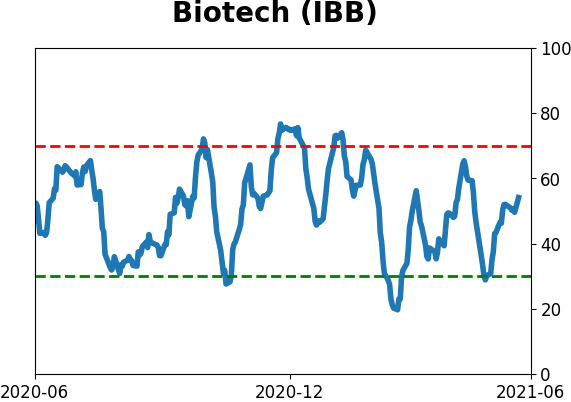
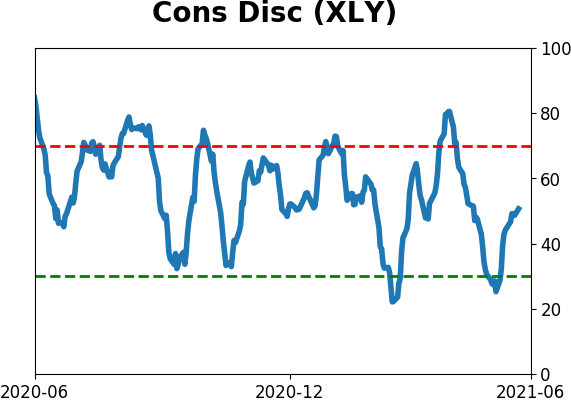
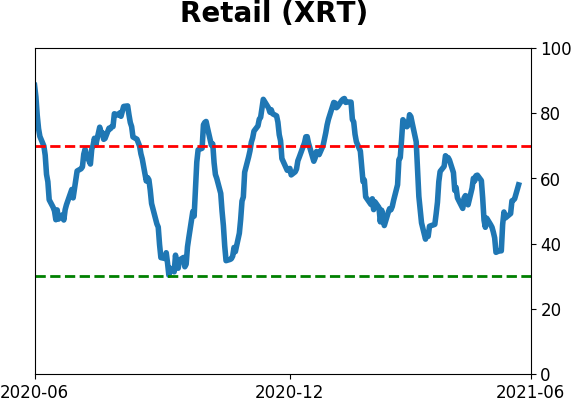
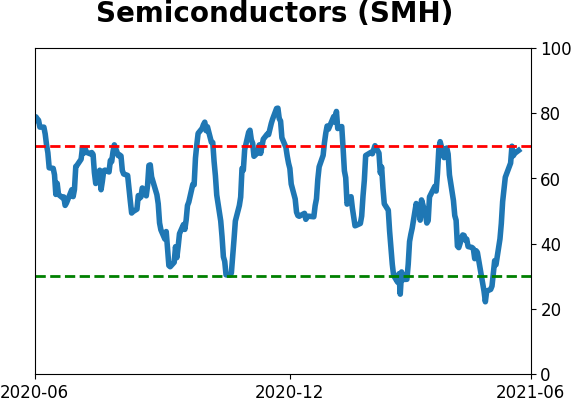
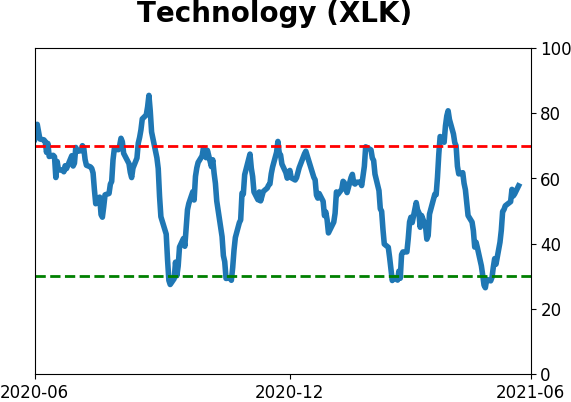
Sector ETF's - 10-Day Moving Average
|
|
|
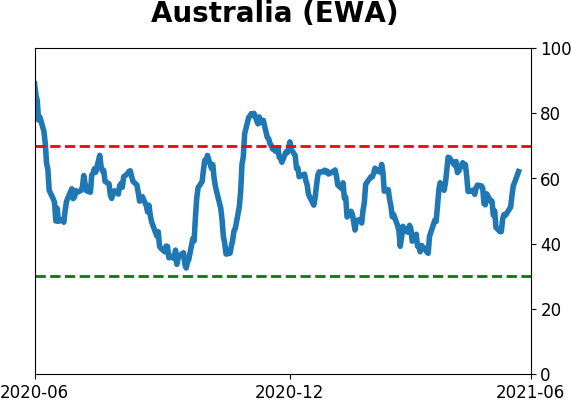
Country ETF's - 10-Day Moving Average
|
|
|
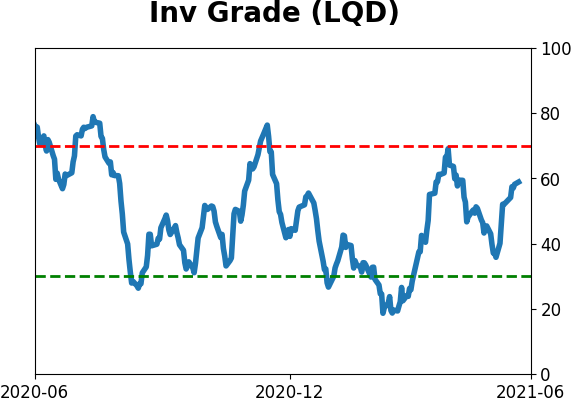
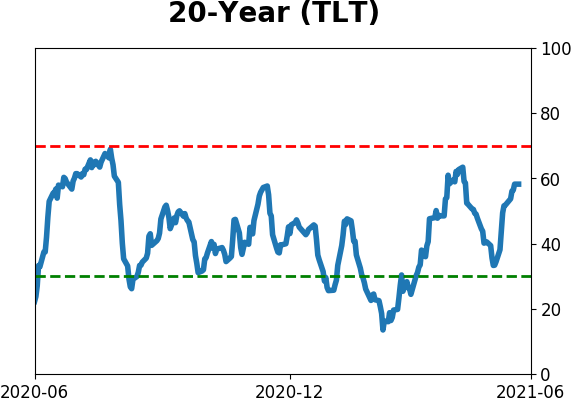
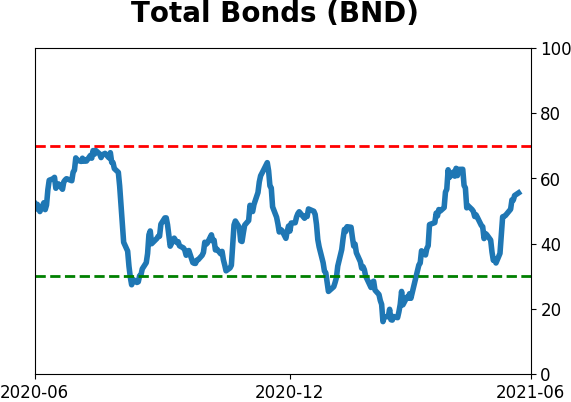
Bond ETF's - 10-Day Moving Average
|
|
|
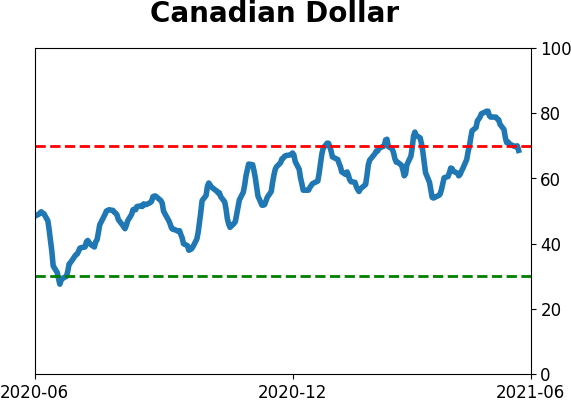
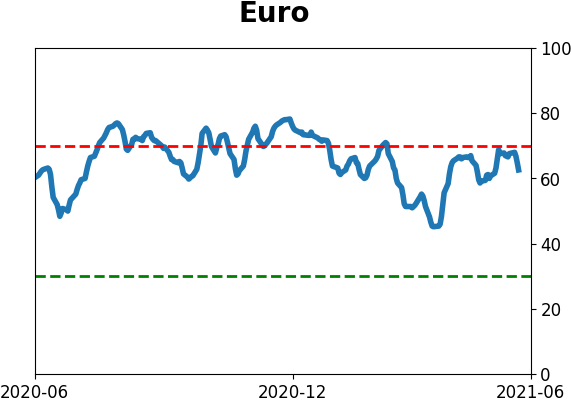
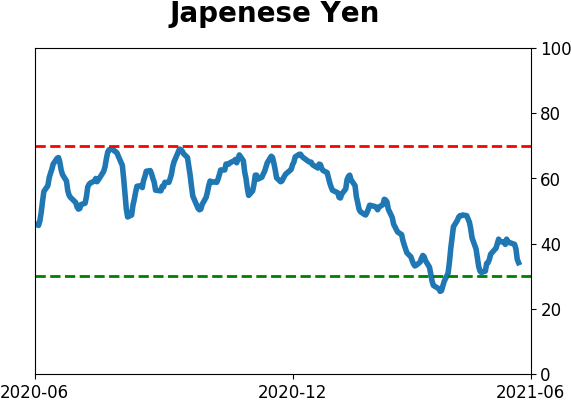
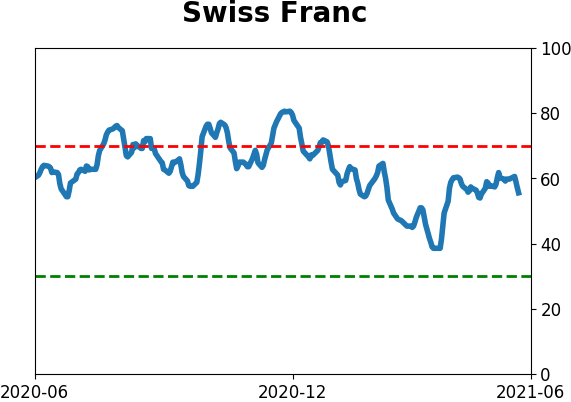
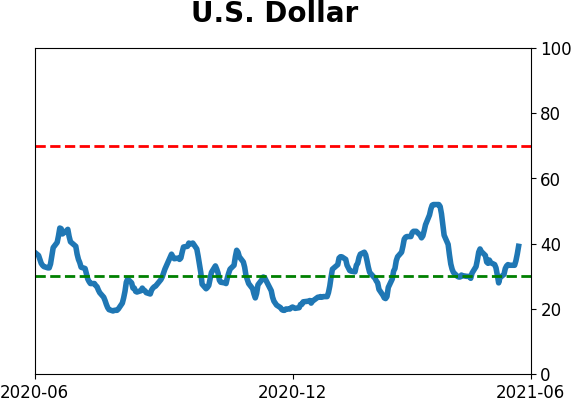
Currency ETF's - 5-Day Moving Average
|
|
|
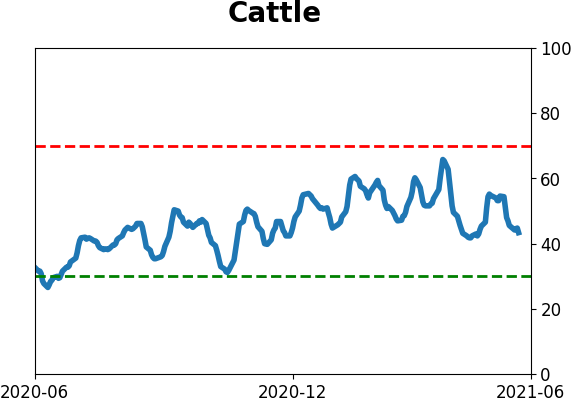
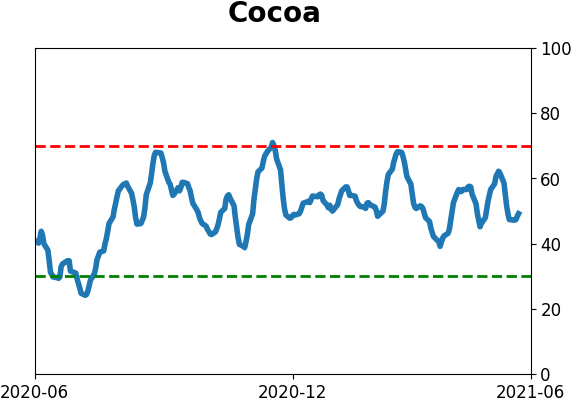
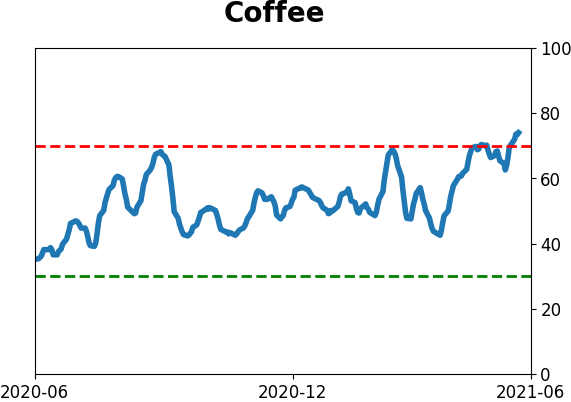
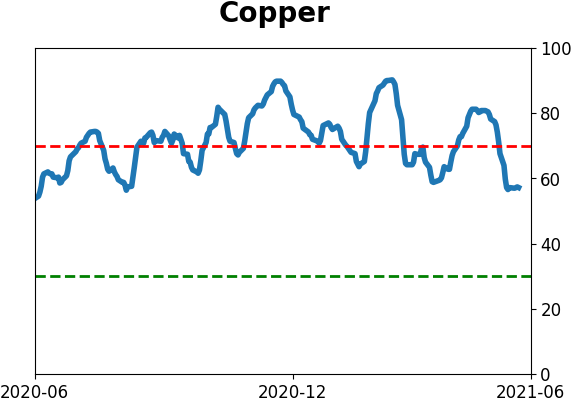
Commodity ETF's - 5-Day Moving Average
|
|