Headlines
|
|
On the cusp of a bull market, many stocks still stuck in bear mode:
The S&P 500 is on the cusp of a new bull market, defined by a 20% rally off a 52-week low. But nearly a third of its stocks are still stuck in bear markets, a high level compared to other rallies since 1928. Rallies with a lack of participation like this have tended to under-perform "better" rallies, especially in the short term.
|
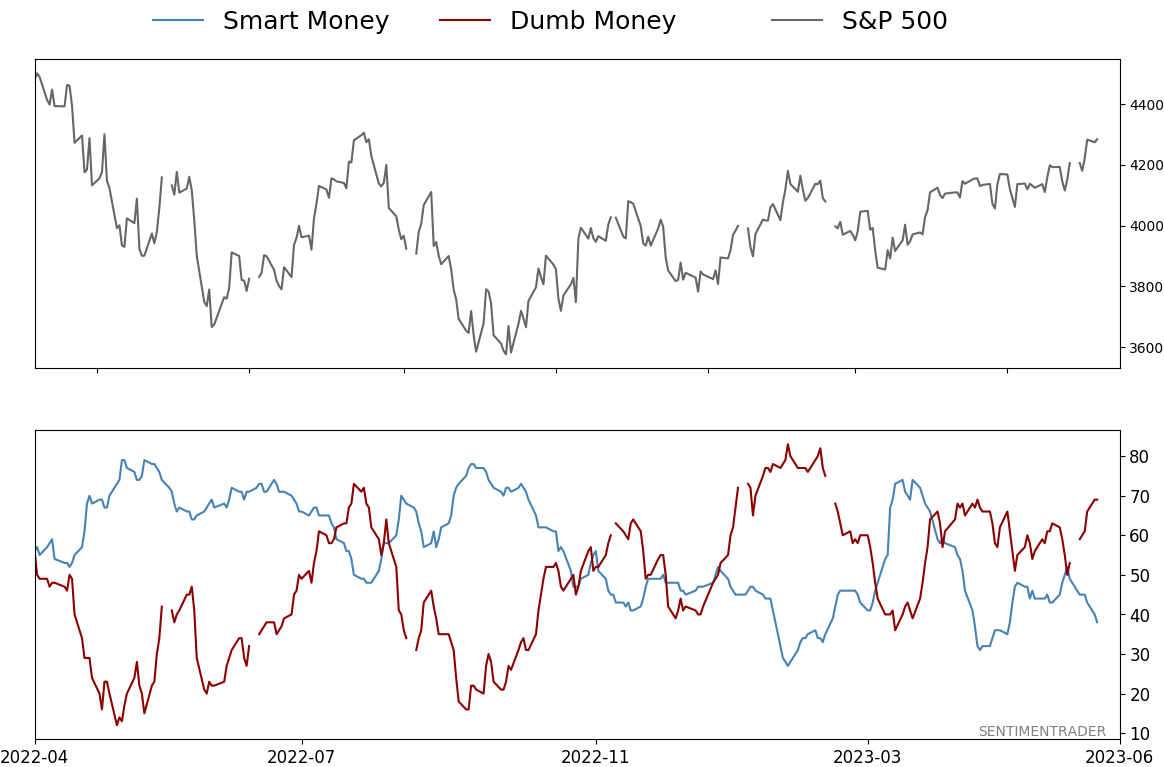
Smart / Dumb Money Confidence
|
Smart Money Confidence: 38%
Dumb Money Confidence: 69%
|
|
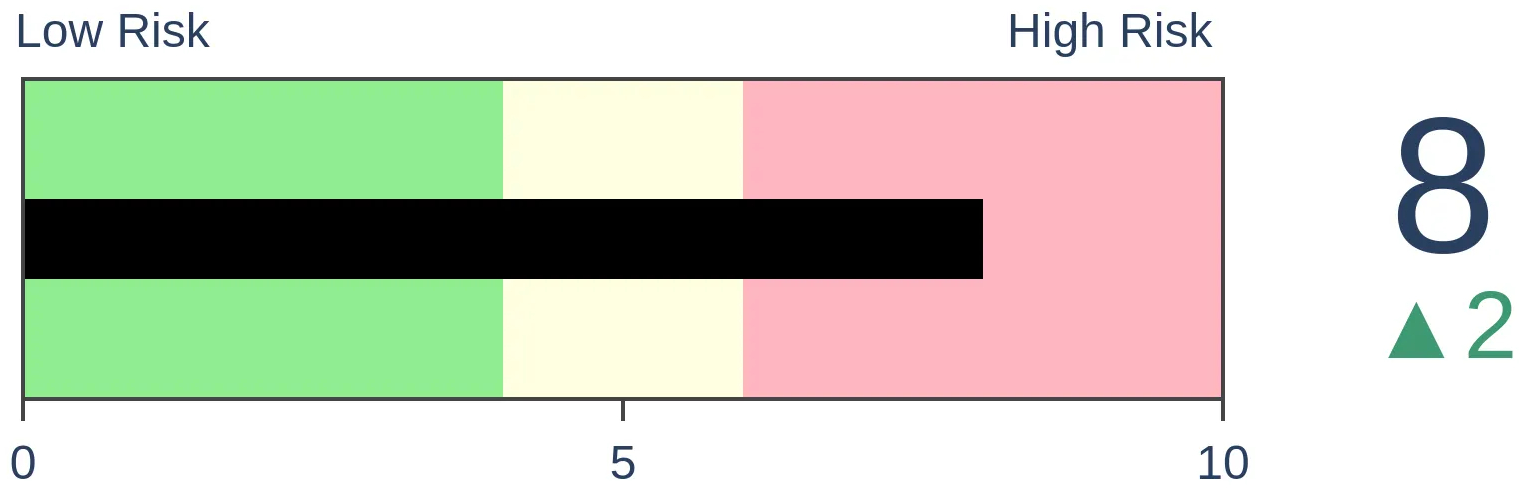
Risk Levels
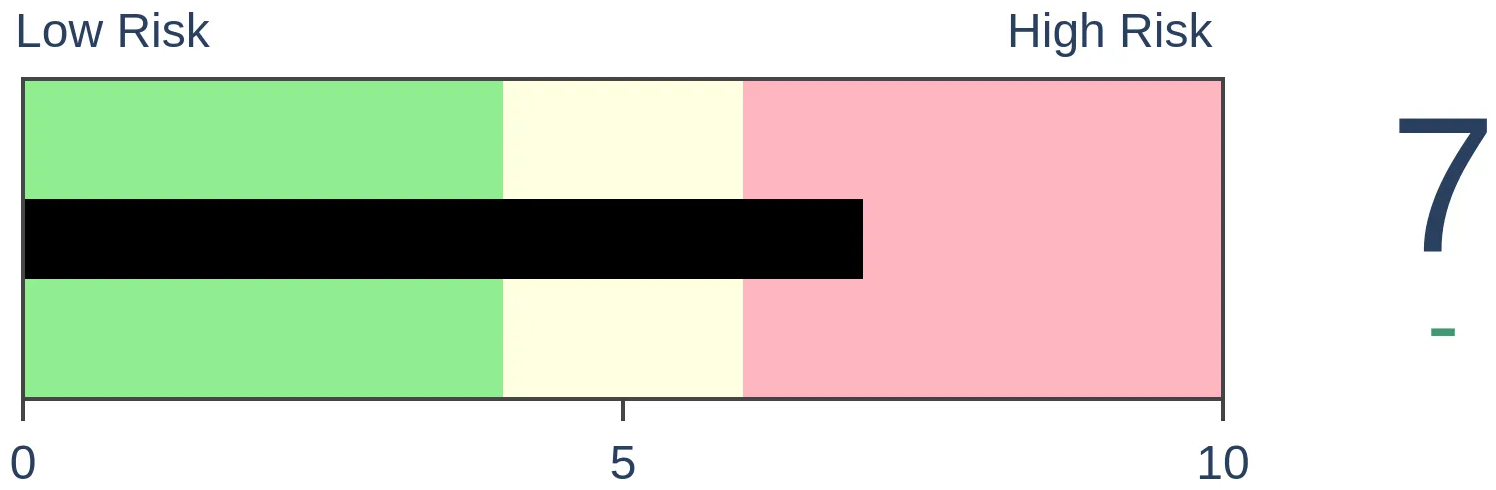
Stocks Short-Term
|
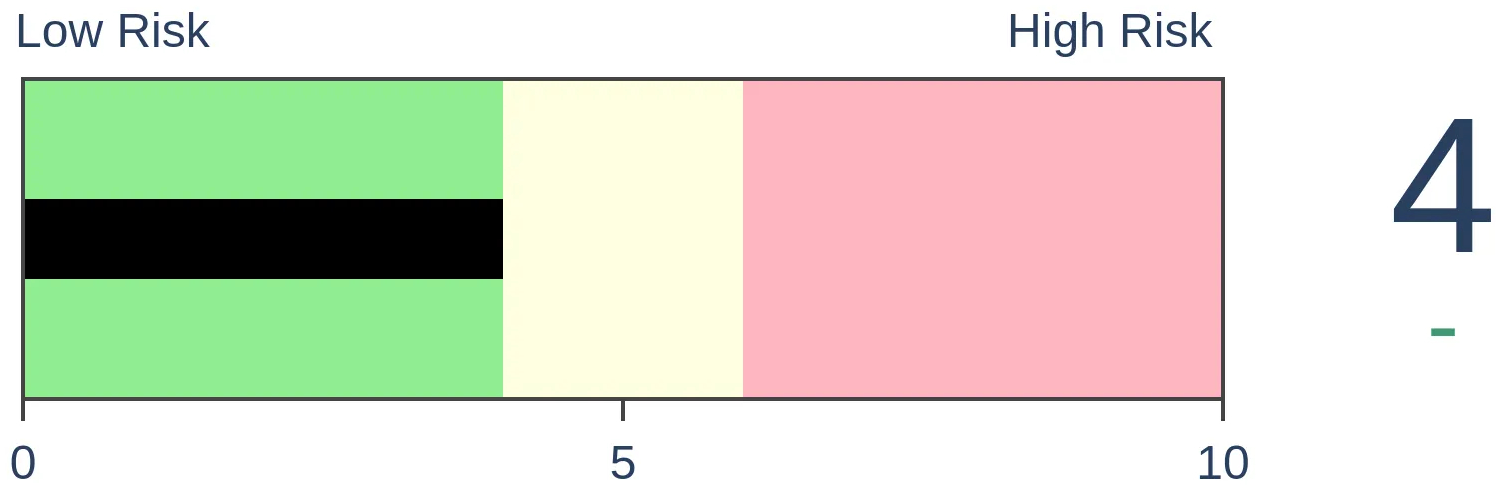
Stocks Medium-Term
|
|
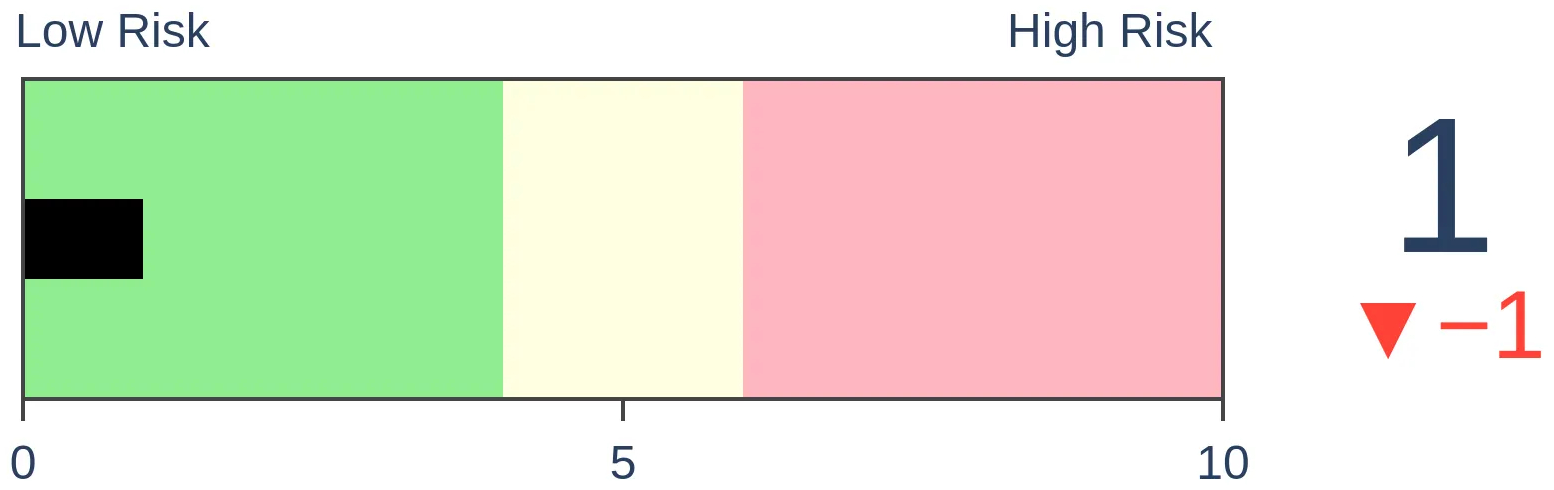
Bonds
|
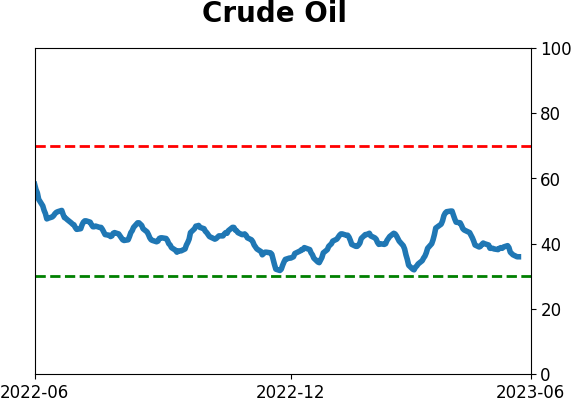
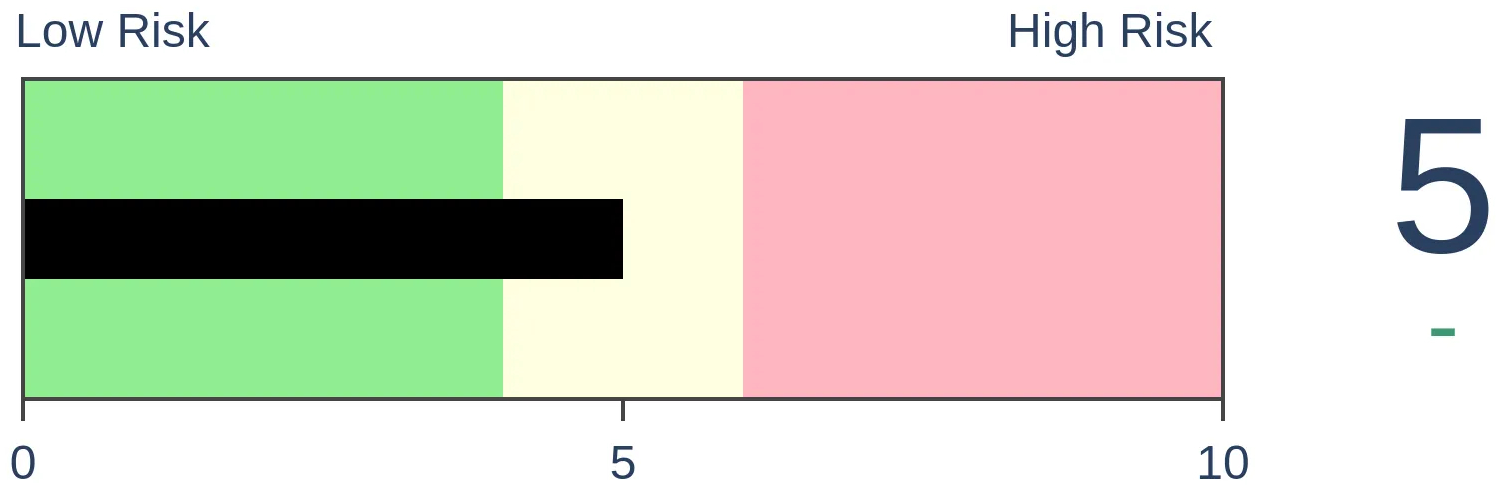
Crude Oil

|
|
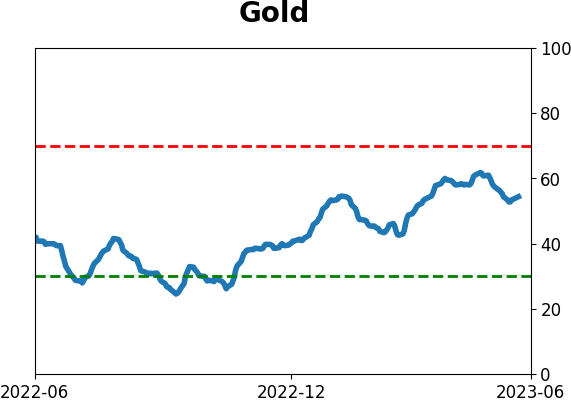
Gold
|
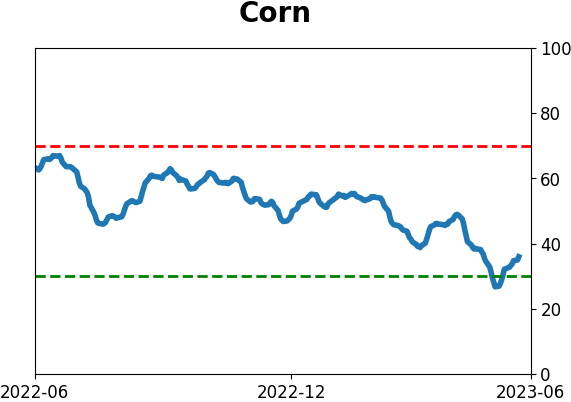
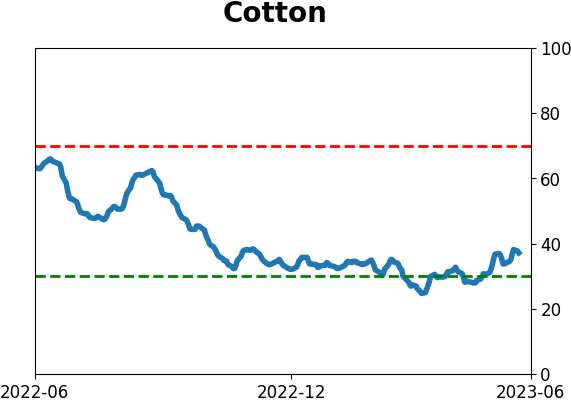
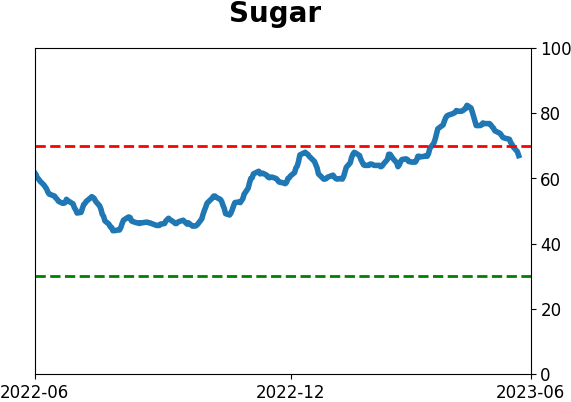
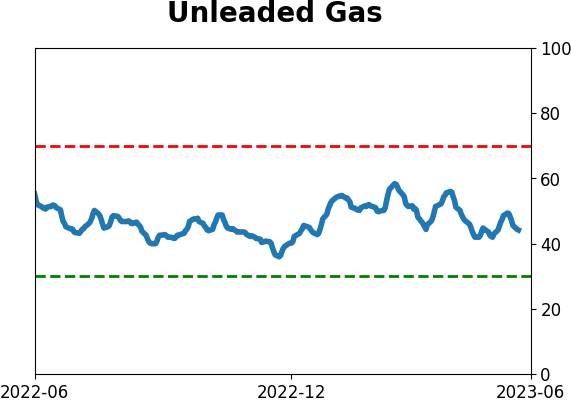
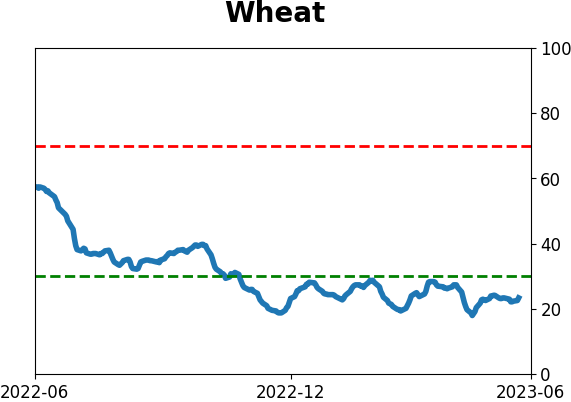
Agriculture
|
|
Research
By Jason Goepfert
BOTTOM LINE
The S&P 500 is on the cusp of a new bull market, defined by a 20% rally off a 52-week low. But nearly a third of its stocks are still stuck in bear markets, a high level compared to other rallies since 1928. Rallies with a lack of participation like this have tended to under-perform "better" rallies, especially in the short term.
FORECAST / TIMEFRAME
None
|
Key points:
- The S&P 500 has rallied (almost) 20% from its latest 52-week low
- Despite the recovery, nearly a third of stocks in the index are still in bear markets
- Similar behavior preceded weak short-term returns, especially compared to "better" rallies
Despite a big rally in the index, many stocks are still in bear markets
The most benchmarked index in the world has embarked on a new bull market, but nearly a third of its stocks are still mired in bear market territory.
A few qualifiers:
- We're rounding up a 19.5% or more rally from a 52-week low in the S&P 500 to call it a bull market
- It had to have gone at least 6 months without a 20% rally from a low
- A bear market is considered at least a 20% decline from a 52-week high
- These are accepted definitions regardless of their logic, so semantic police need not complain
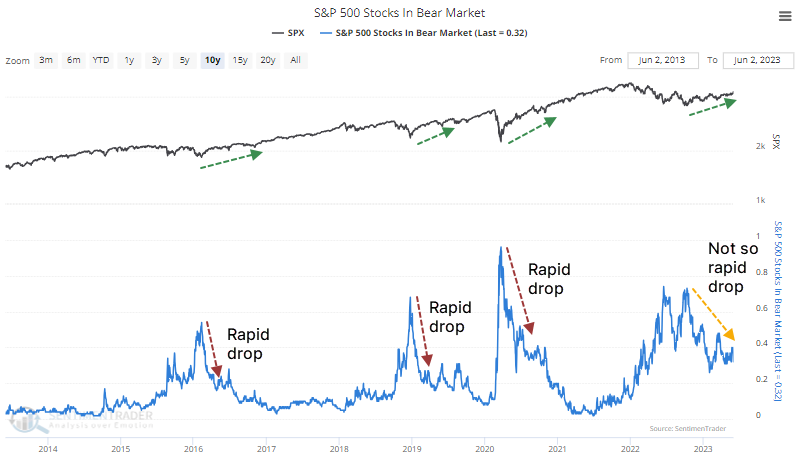
The S&P is on the cusp of rallying 20% from its most recent 52-week low, which was more than six months ago. Yet there has only been a slow, steady drip of stocks within the index that have recovered to within 20% of their latest 52-week high. This is a striking change in behavior from other rallies over the past decade when there was broad buying interest and a quick decline in the percentage of stocks stuck in a bear market.
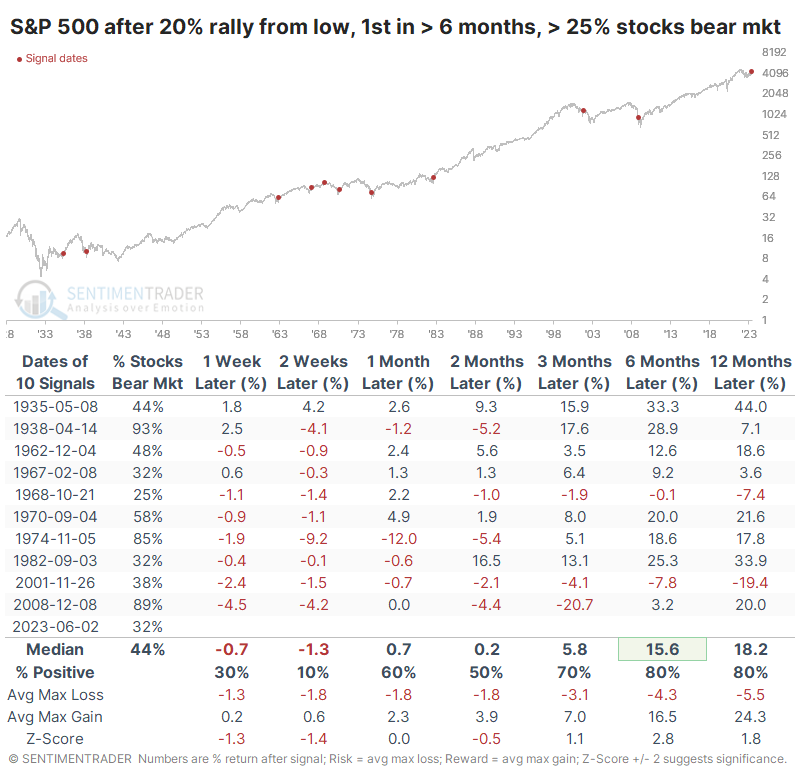
The table below shows similar environments since 1928. These are times when the S&P rallied 20% (okay, 19.5% or more, rounded) from a low, but at least a quarter of its stocks were still in bear markets.
Over the short term, the index declined almost every time. The drag of stocks still mired in bear markets proved too much for the index, at least for a while. But over the next three months, the S&P was higher 7 of the 10 times, and six to twelve months later, 8 times, and with excellent median returns.
The biggest sustained losses occurred in 1968 when this triggered as the S&P was at a new high (not the case now), and in 2001, which was just a purely failed signal.
We like to look at counter-examples if possible, especially if a study is inconclusive or the sample size is especially small. So, the table below shows the opposite conditions when the S&P entered a new bull market, but fewer than 25% of stocks were in bear markets. These are times when investors pushed up more stocks, and most had recovered to within striking distance of new highs.
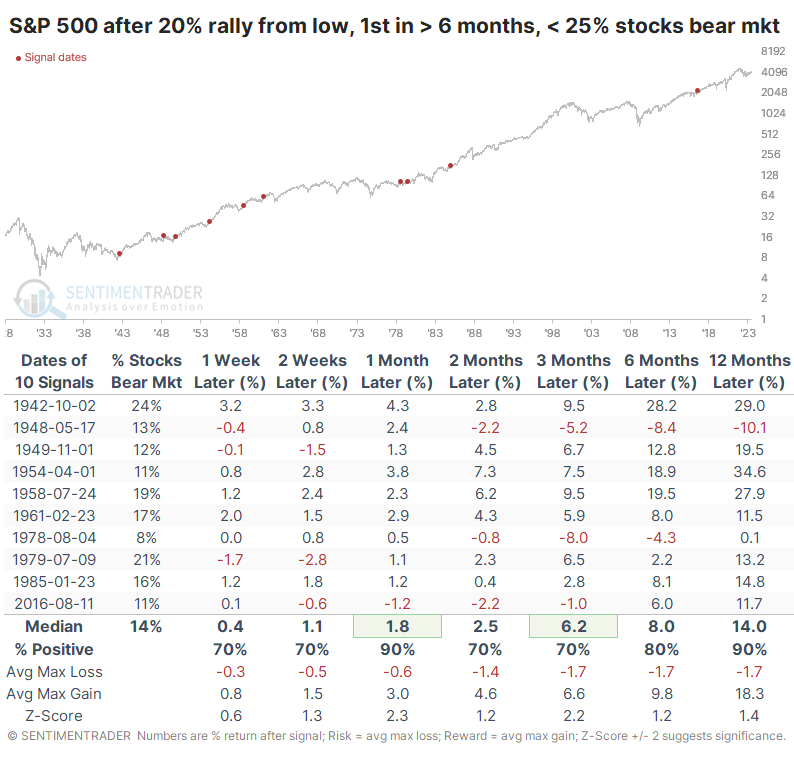
These instances were much better for forward returns, at least shorter-term. Over the next month, the S&P continued higher after 9 of the 10 signals, and the sole loser was small. The index was mostly able to continue higher longer-term as well, with only a single loss over the next year, which was reversed soon afterward.
What the research tells us...
There has been more and more of a chorus boo-hooing a lack of participation in the latest push of this rally. There is some merit to the detractions, as more participation has a lot of historical support, leading to better and more sustained rallies. But it's not quite that simple. There are times when a lack of participation means that there are more stocks for value-seeking investors to buy instead of chasing all of them trading well off their lows. According to this study, the potential new bull market is being led by a handful of powerful large stocks, which seems to be a concern for the short-term at most.
Indicators at Extremes
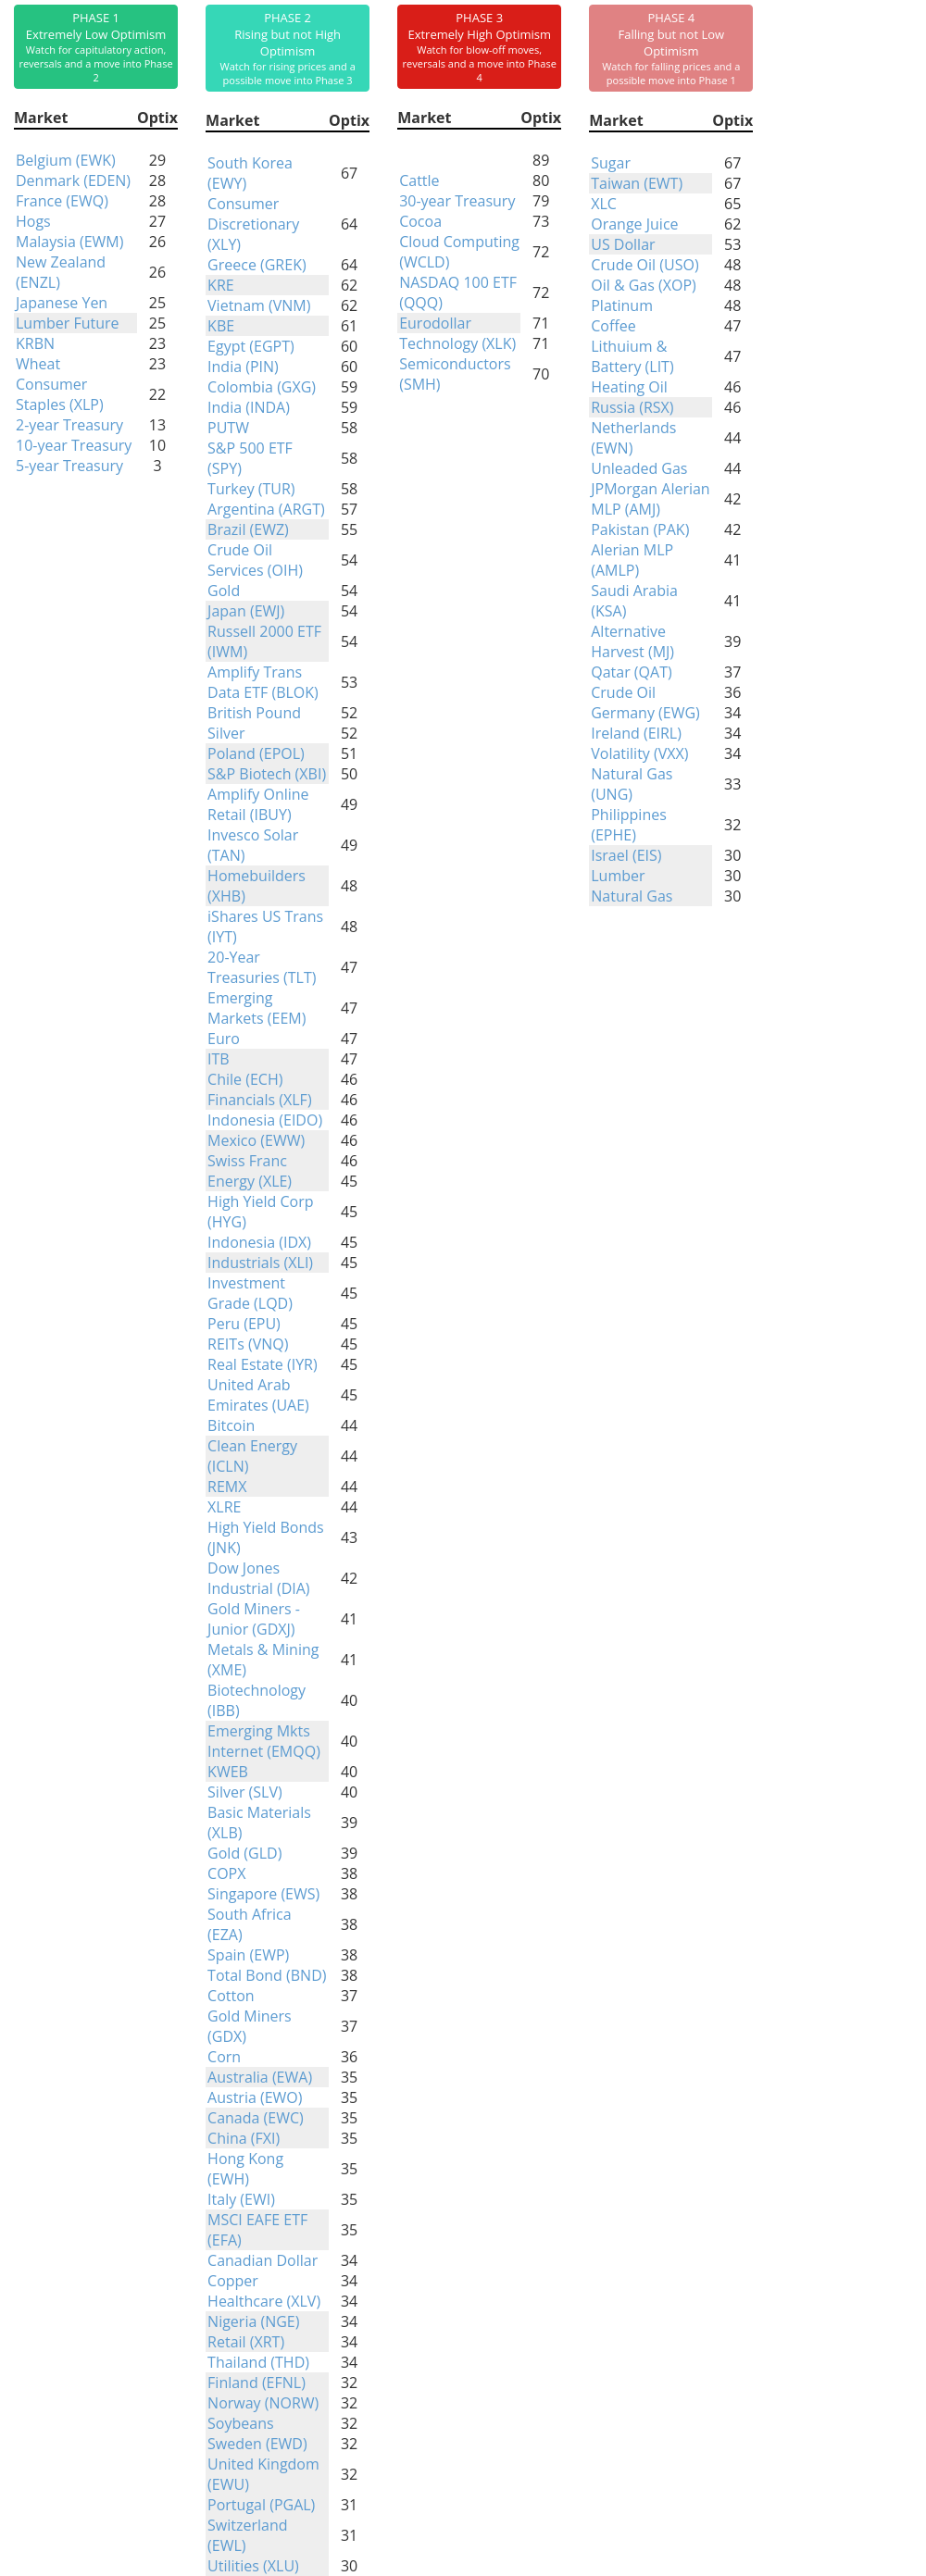
Phase Table
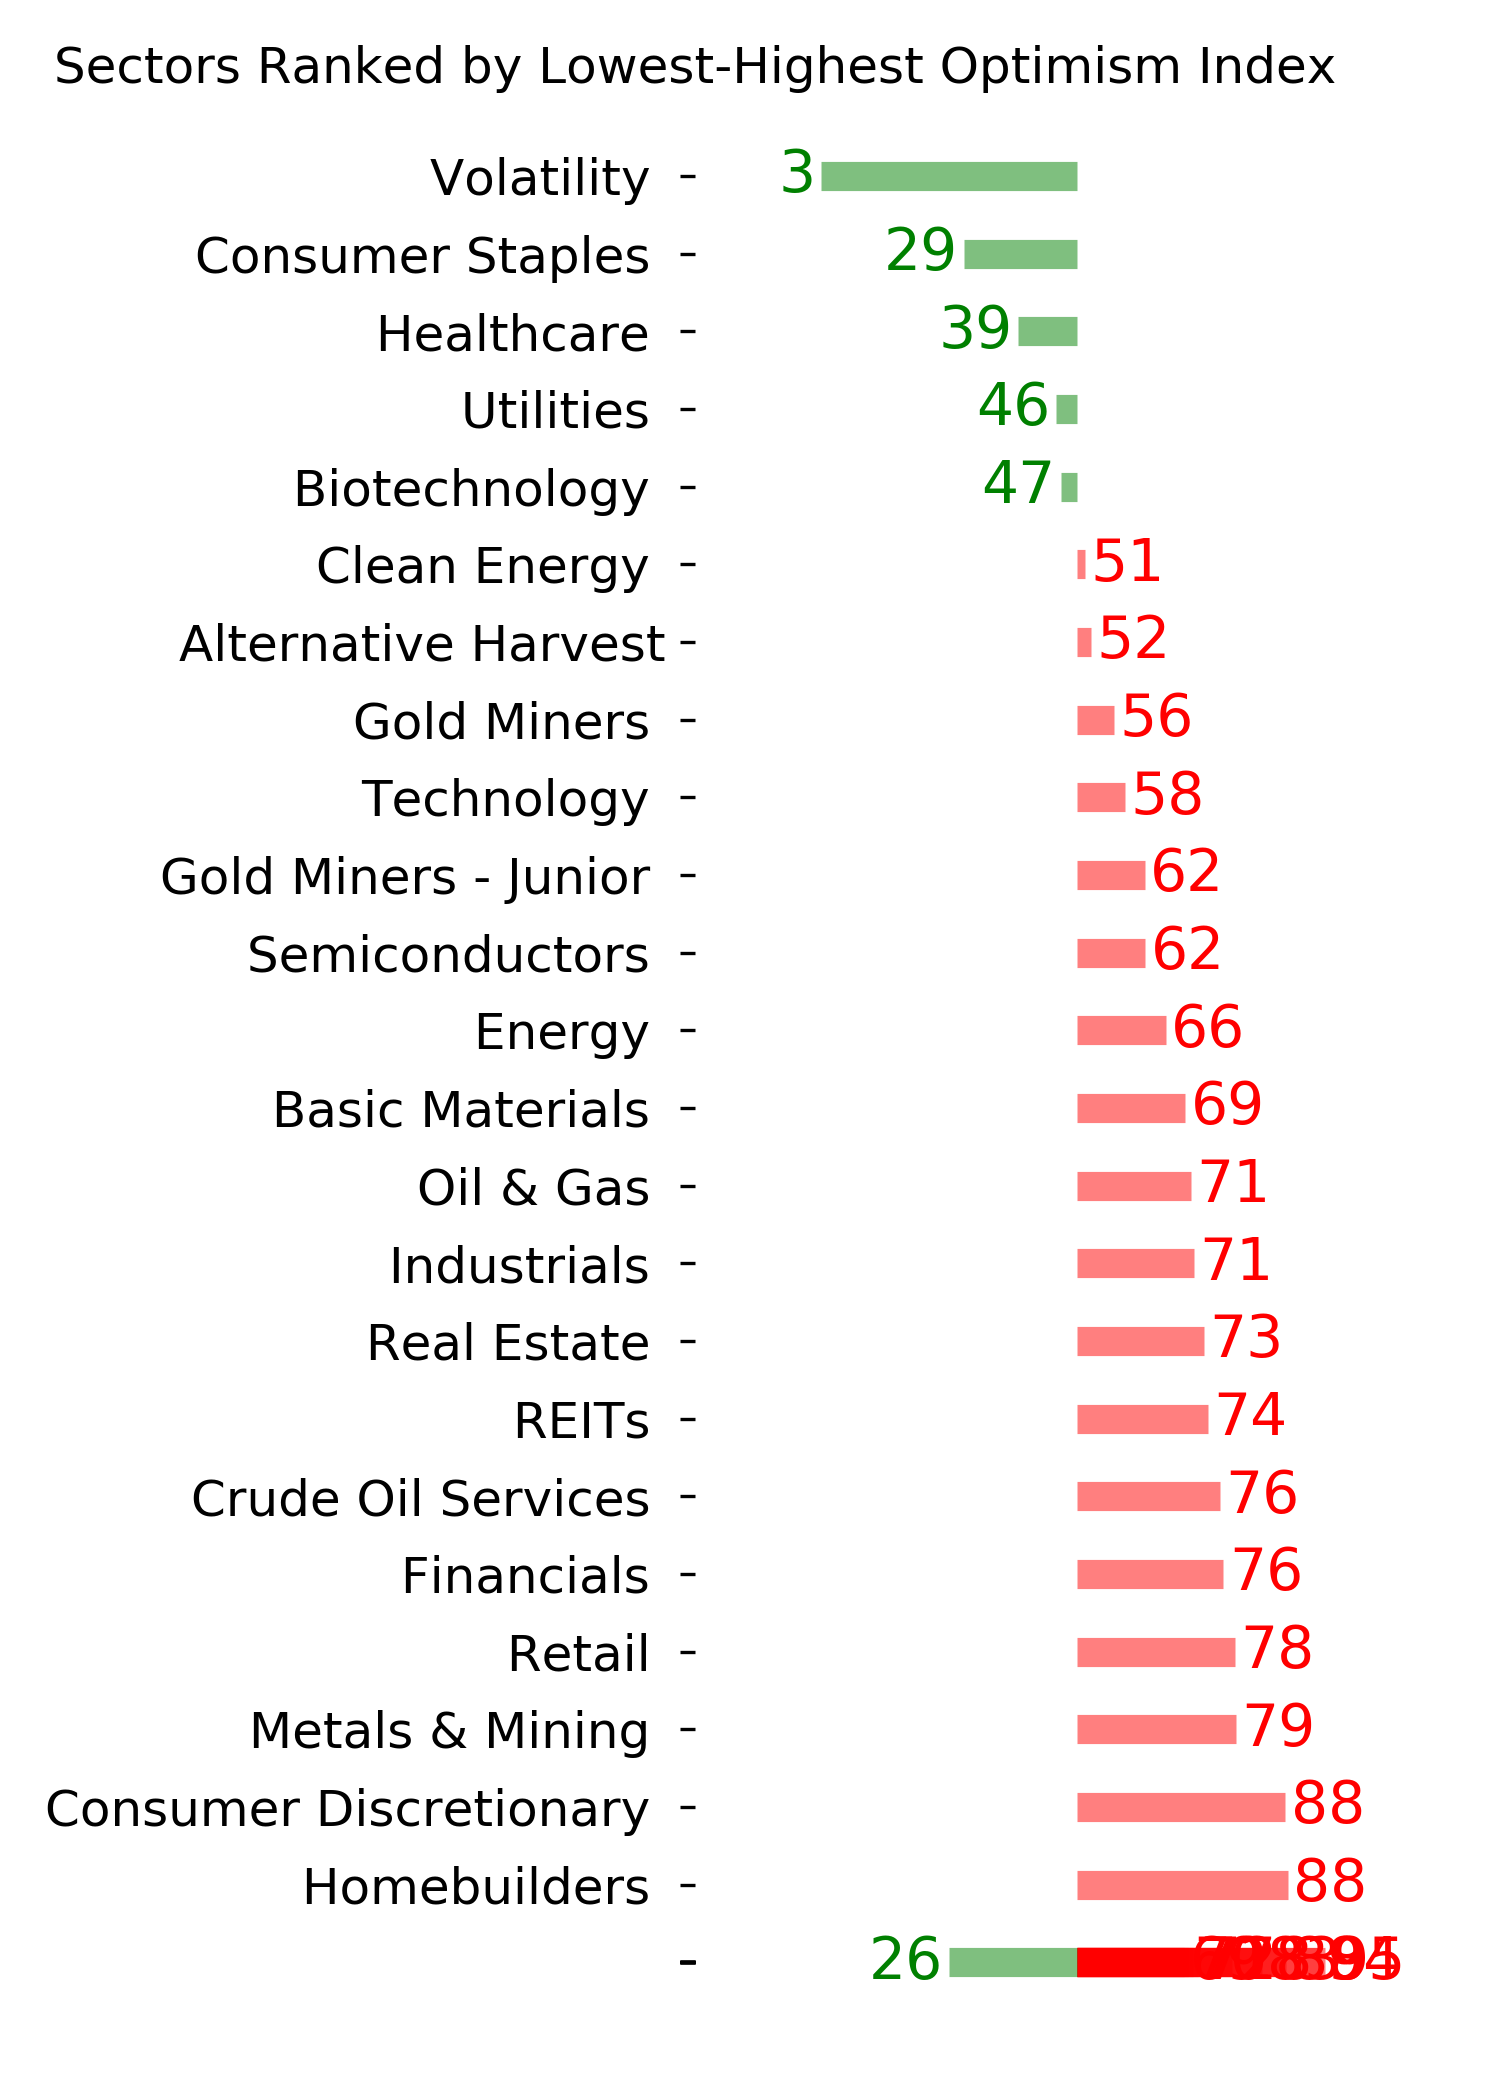
Ranks
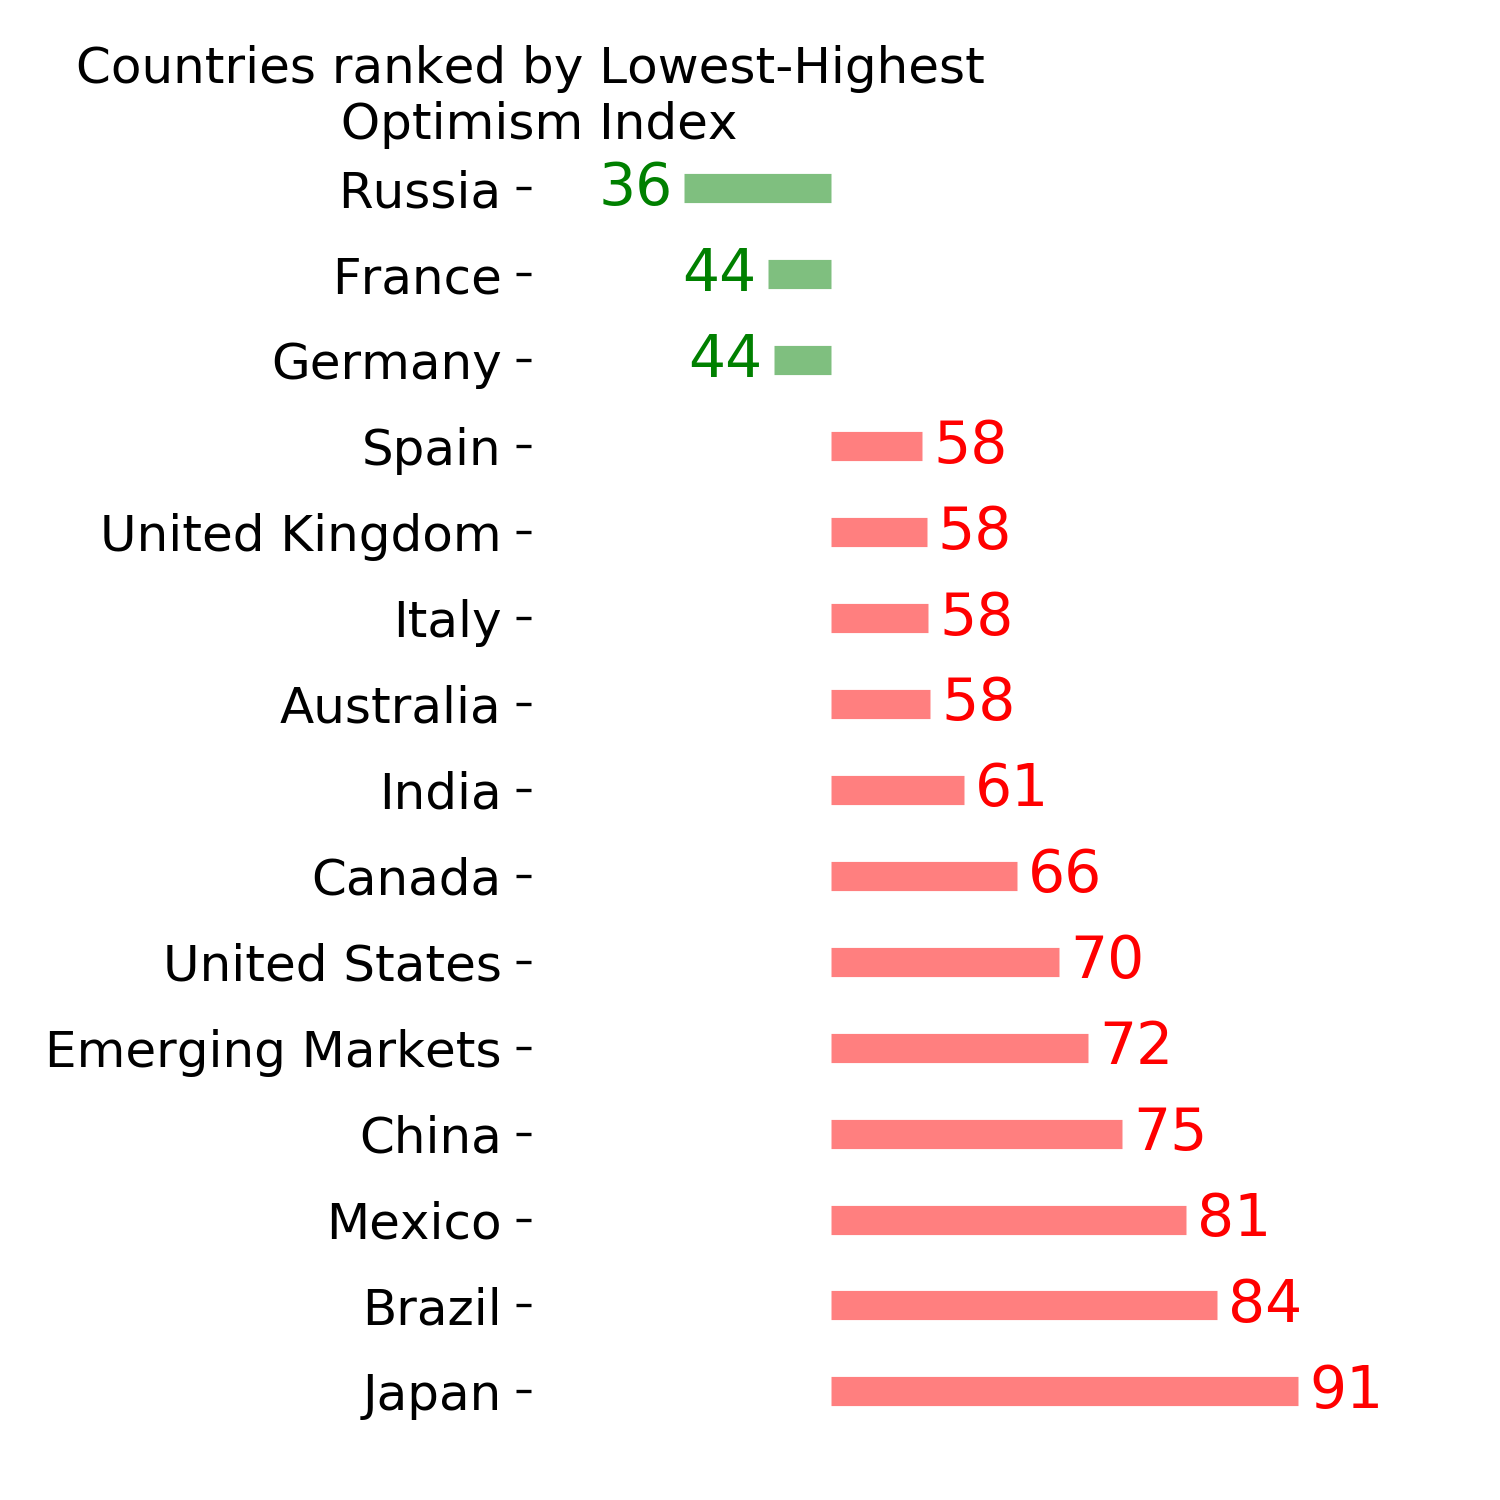
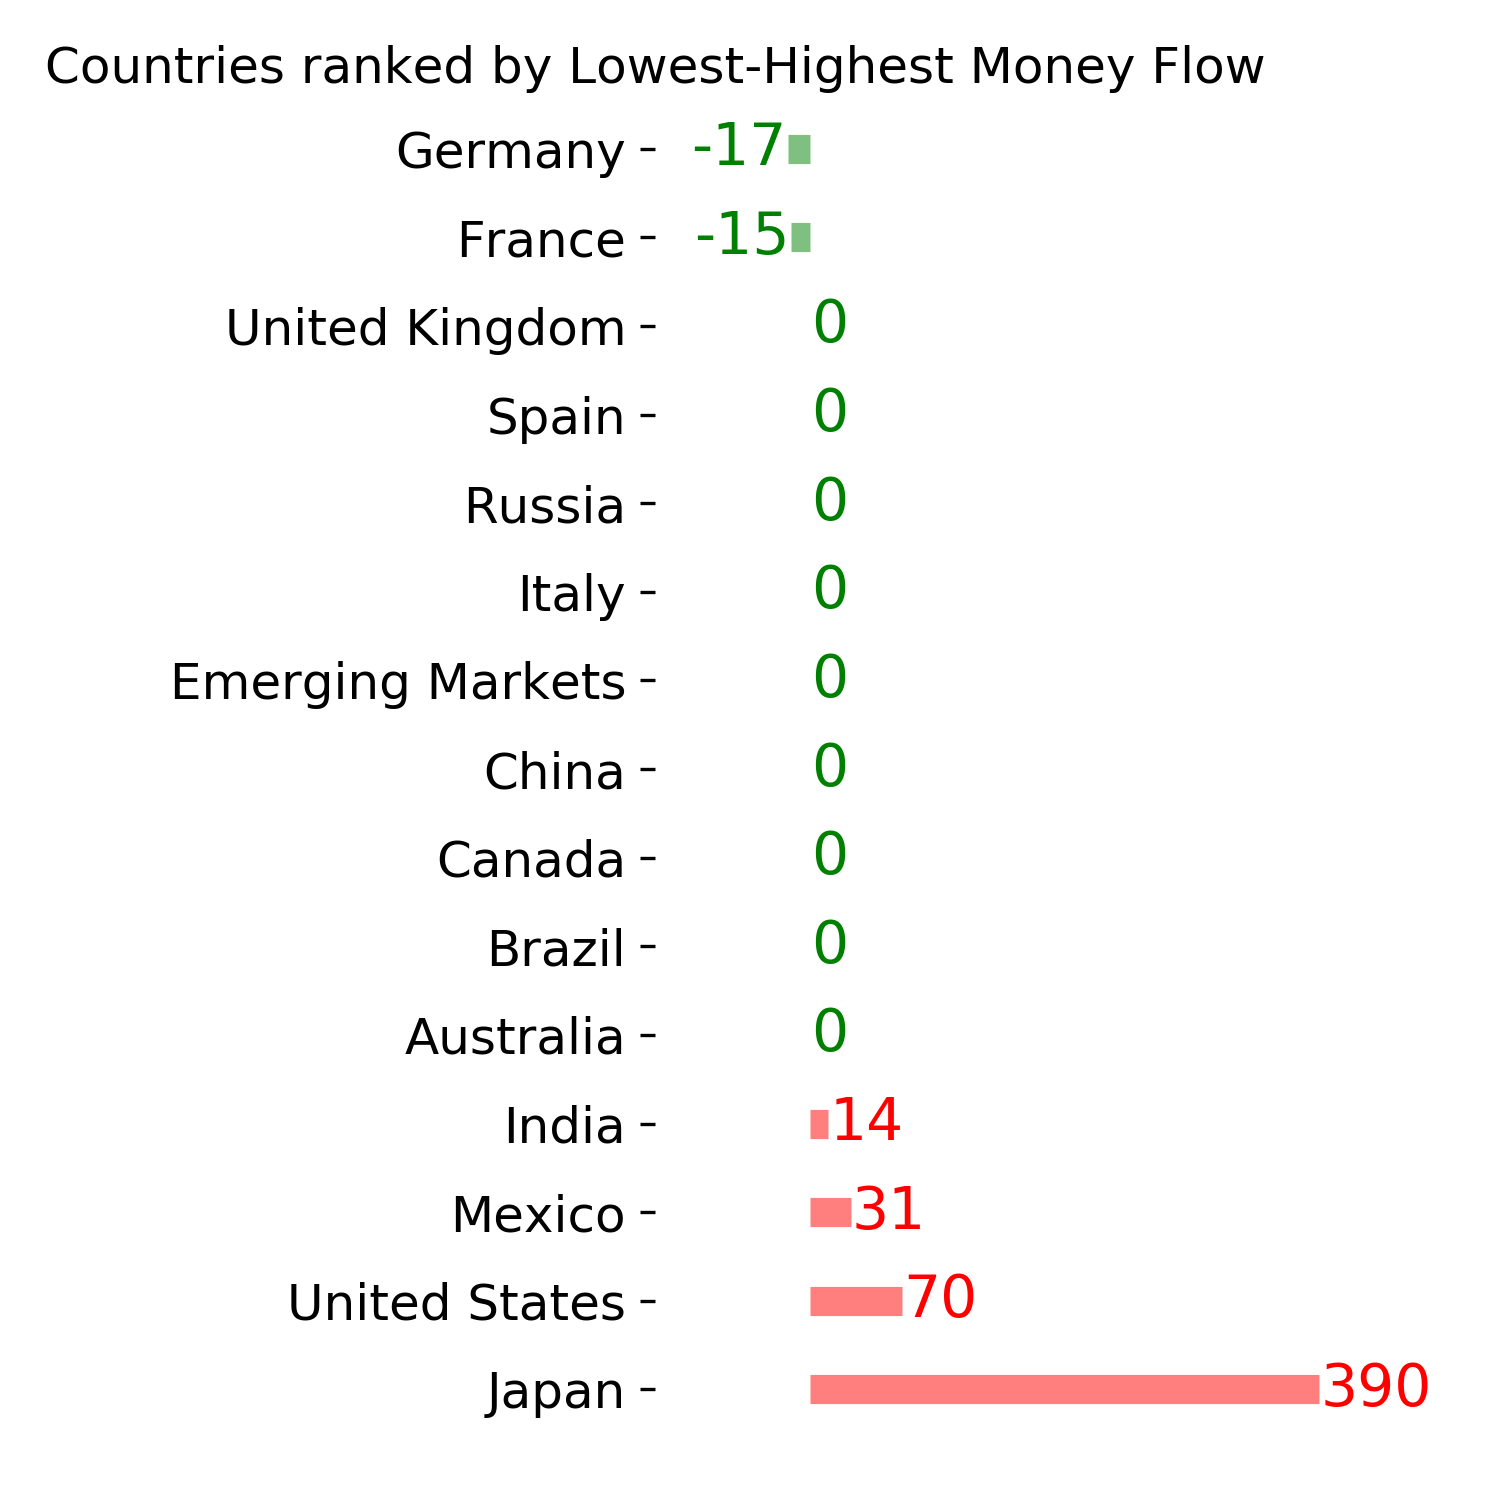
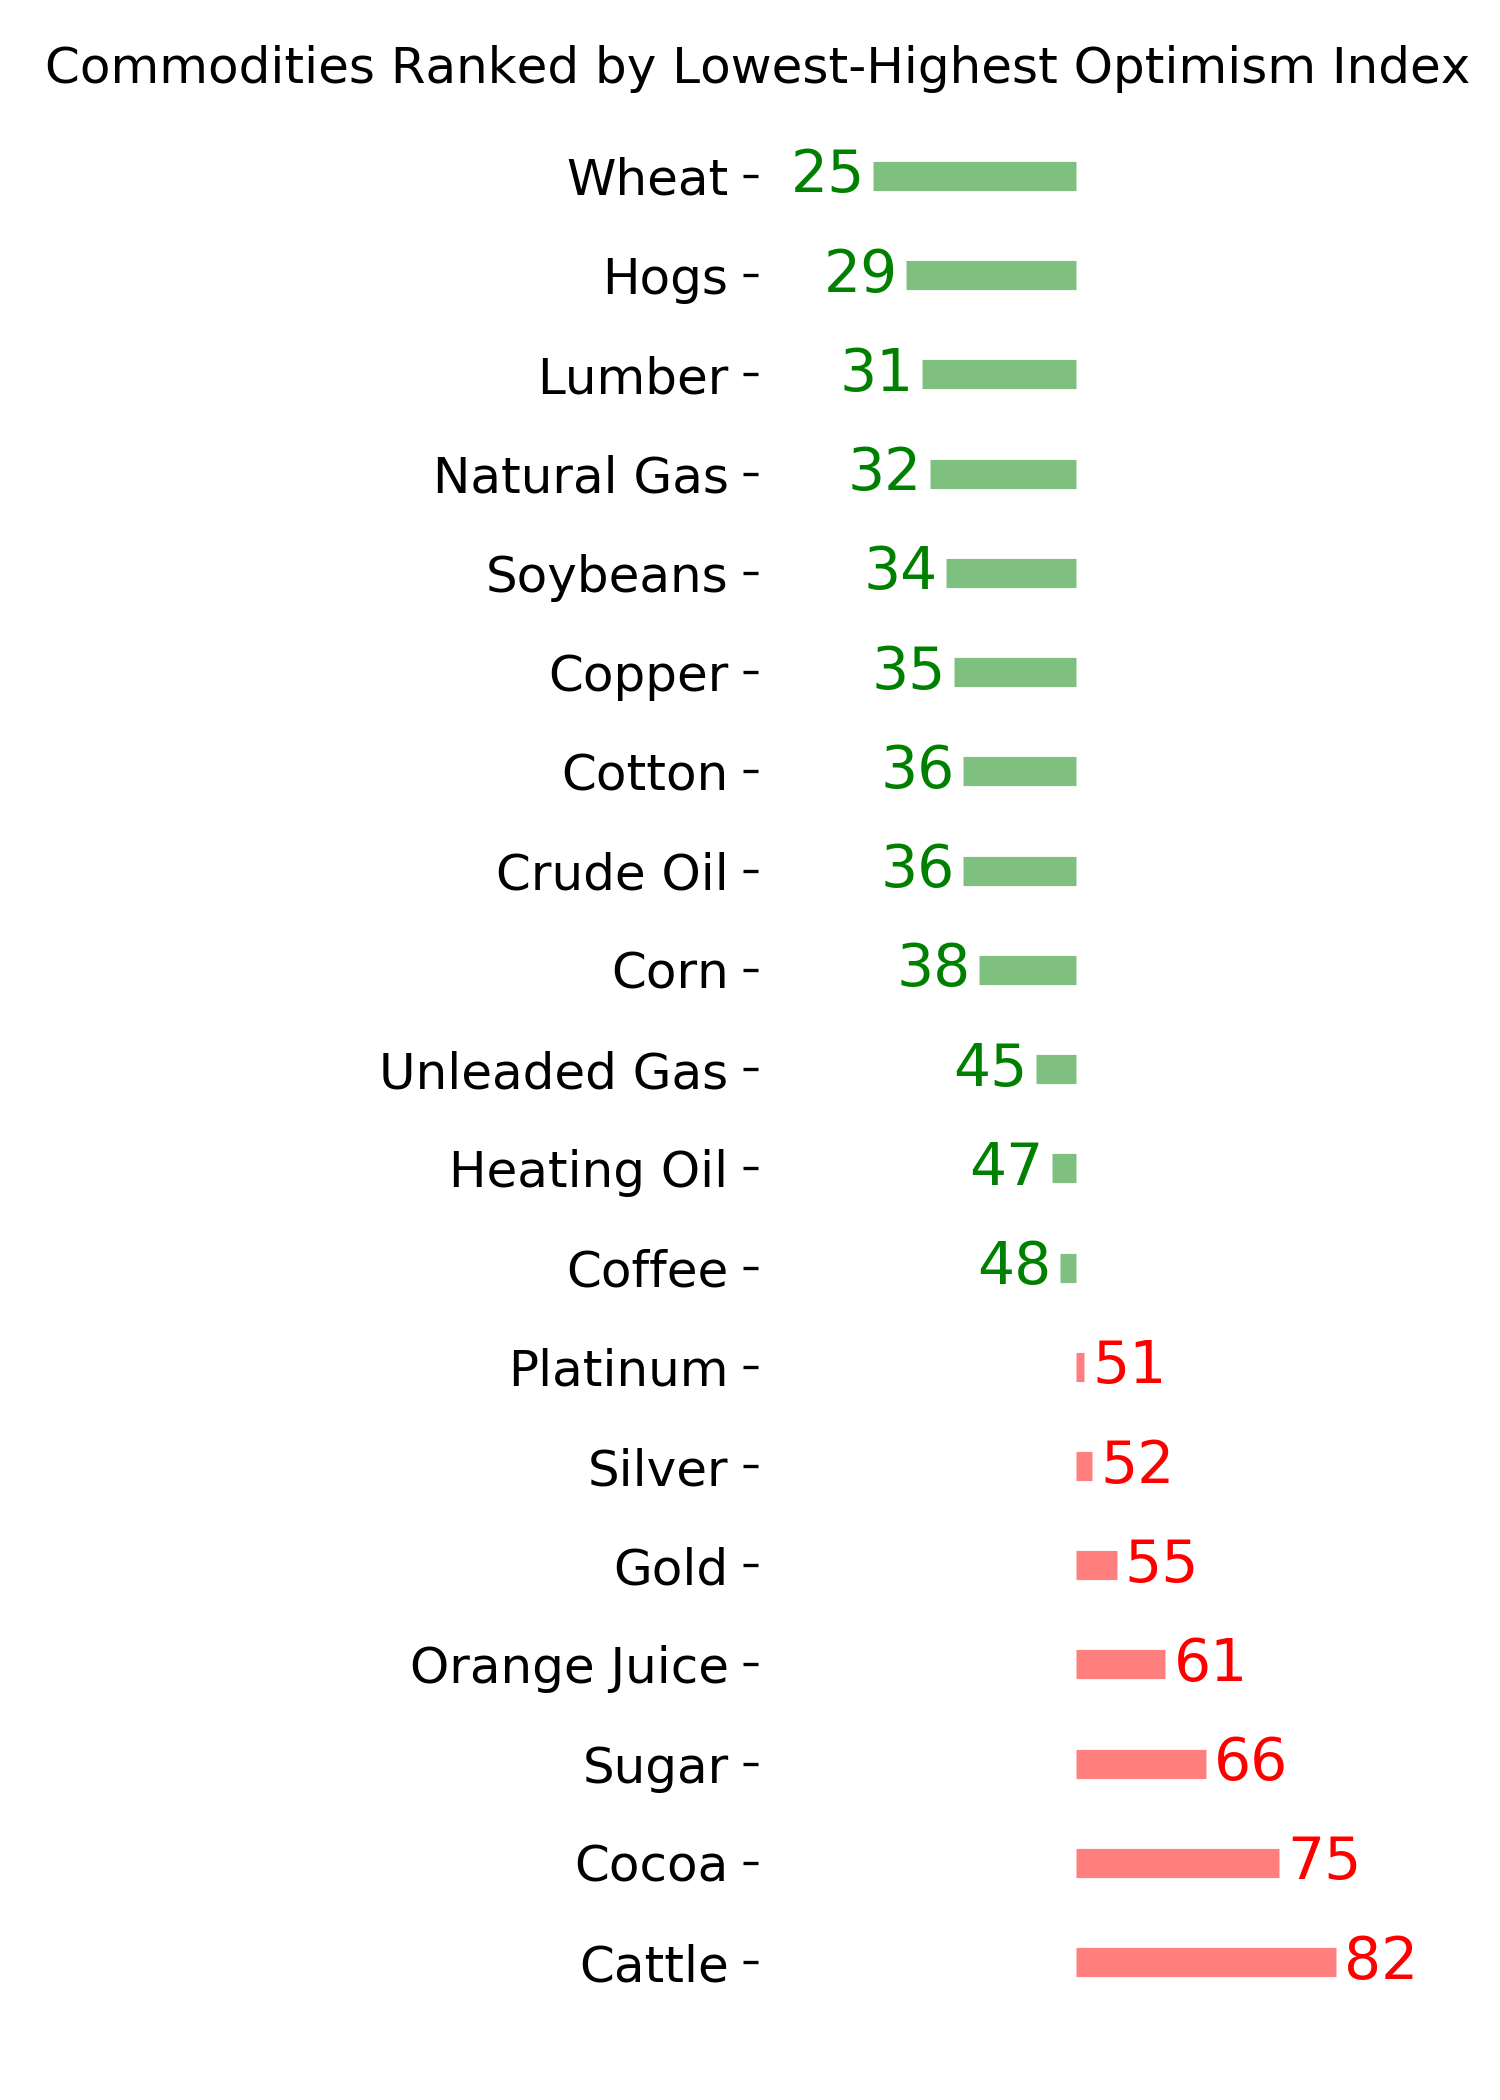
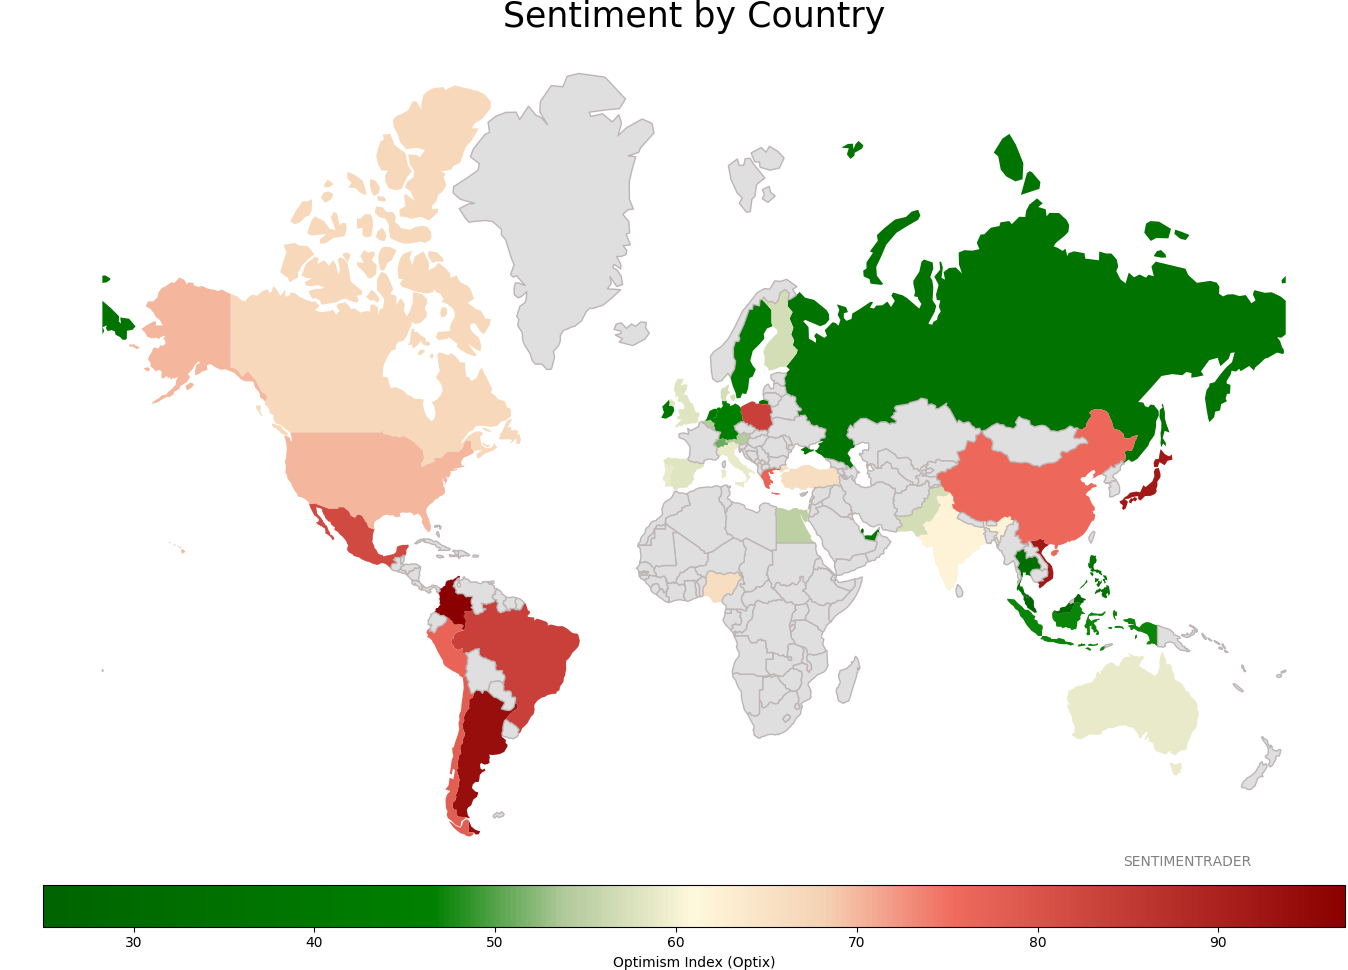
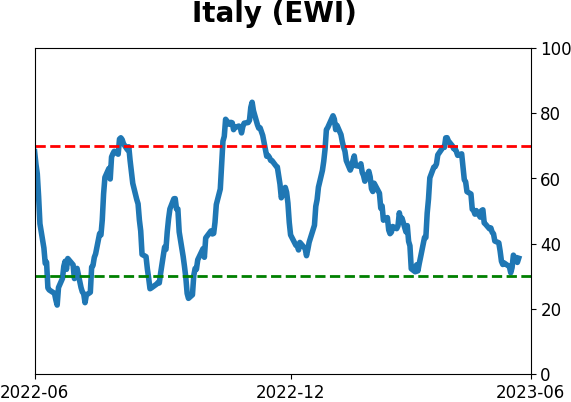
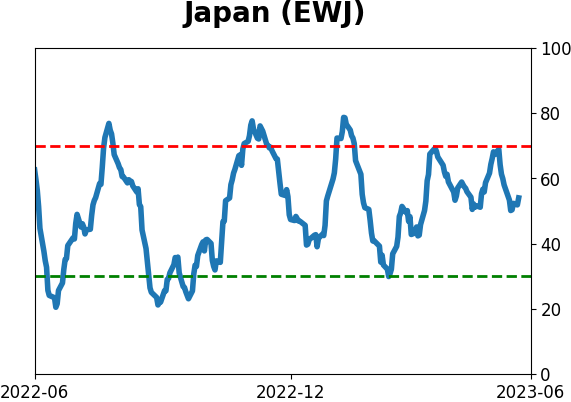
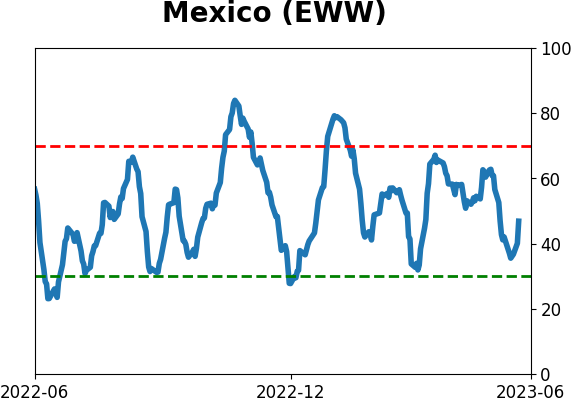
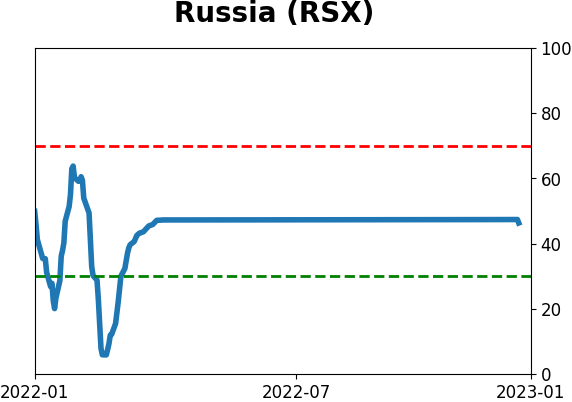
Sentiment Around The World
Optimism Index Thumbnails
|
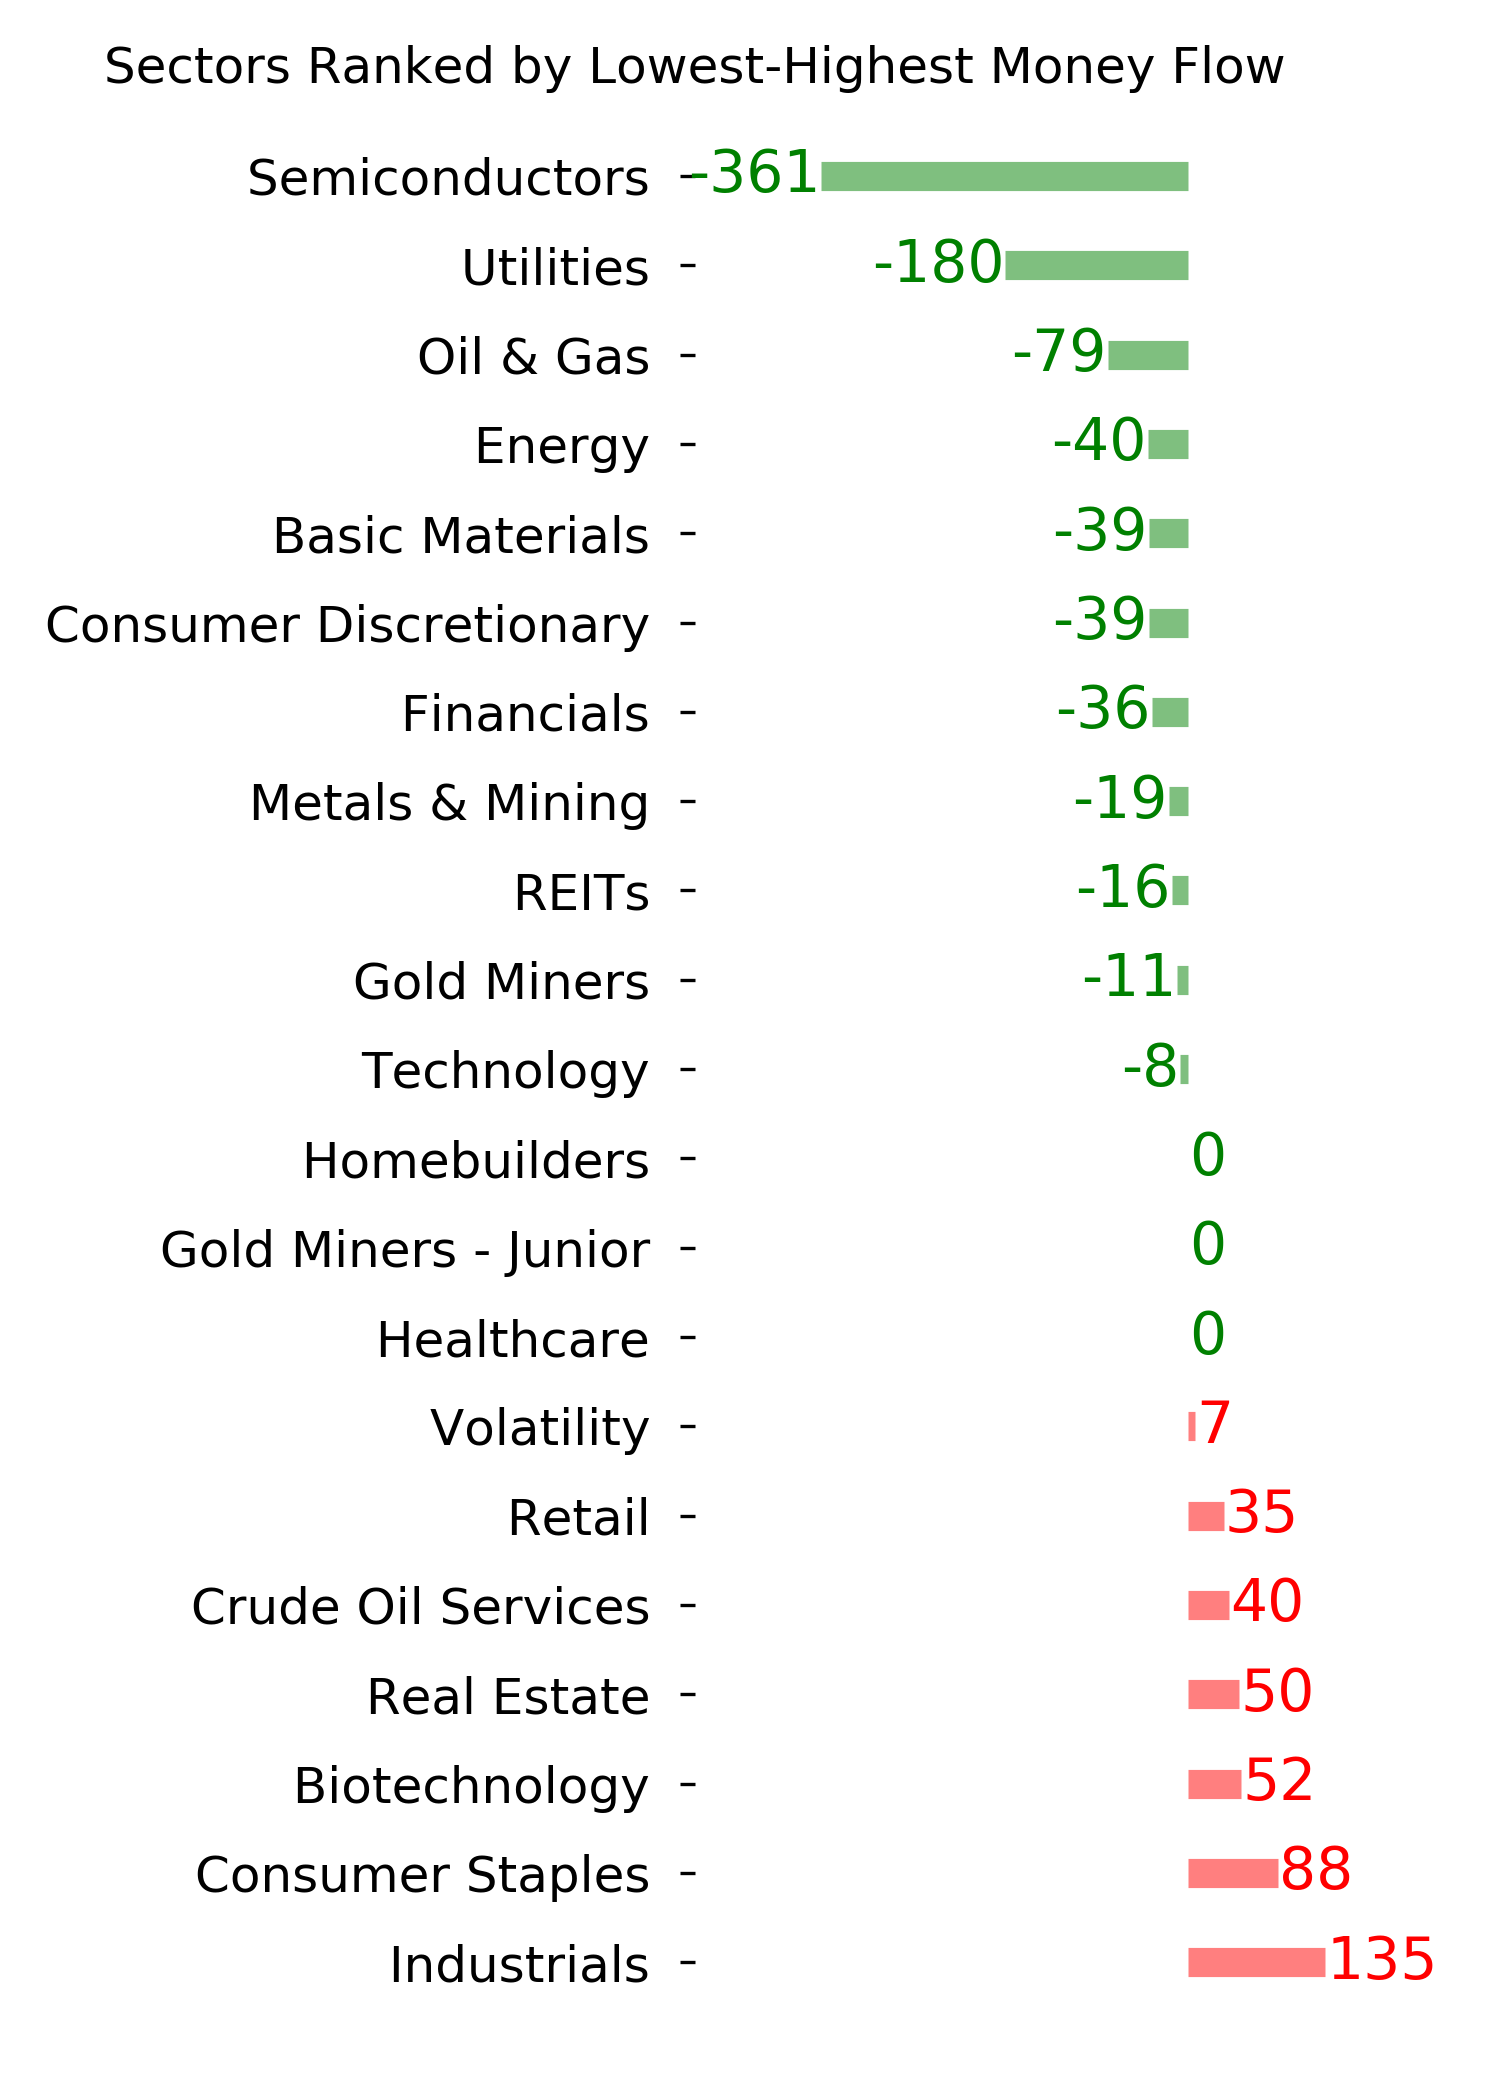
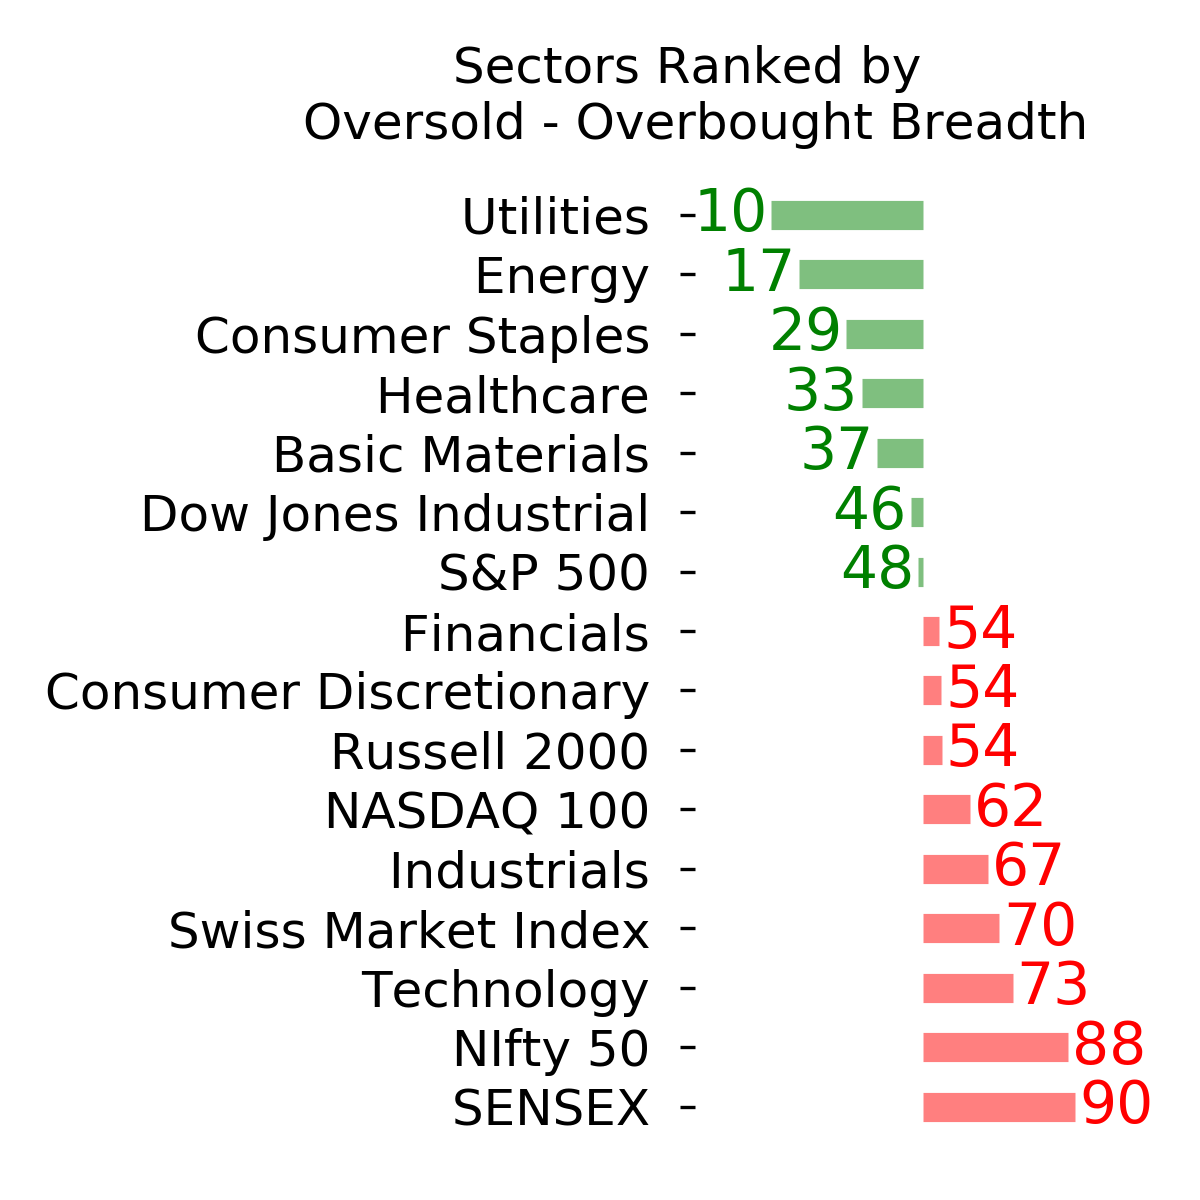
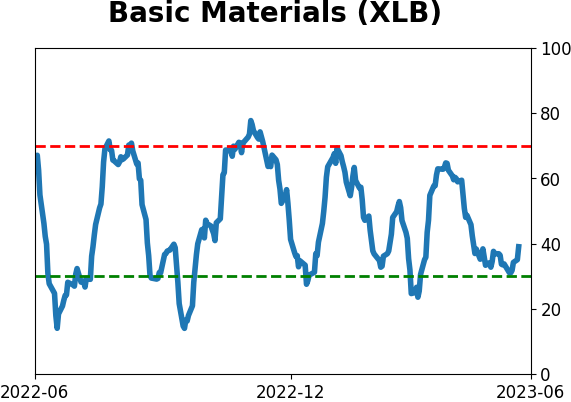
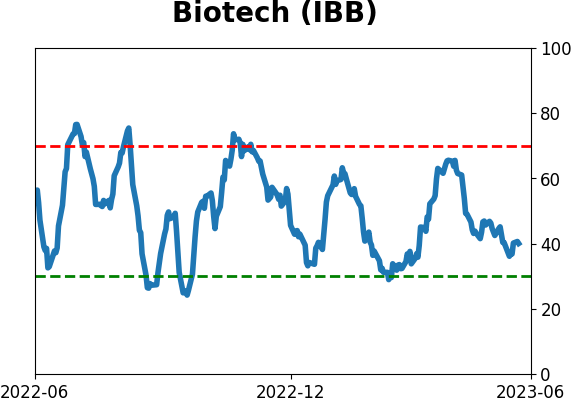
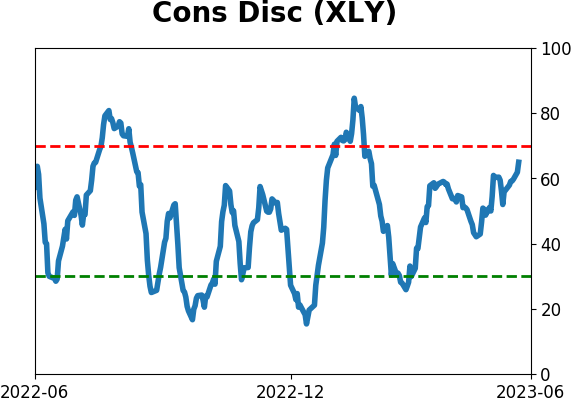
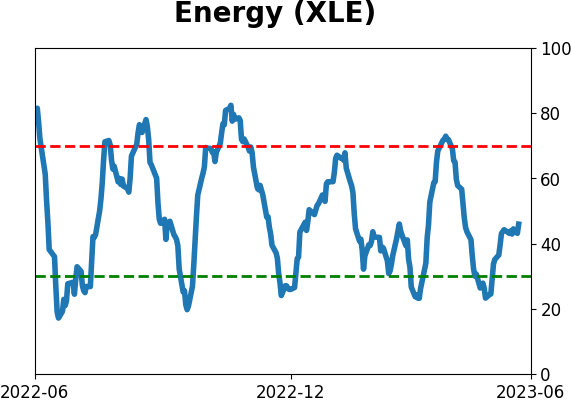
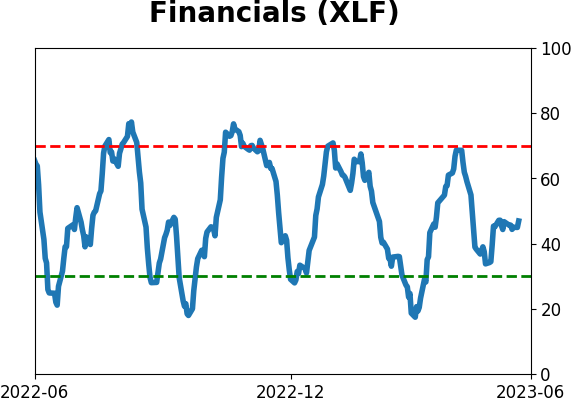
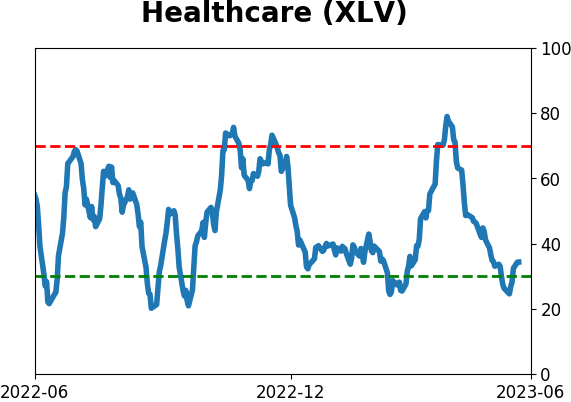
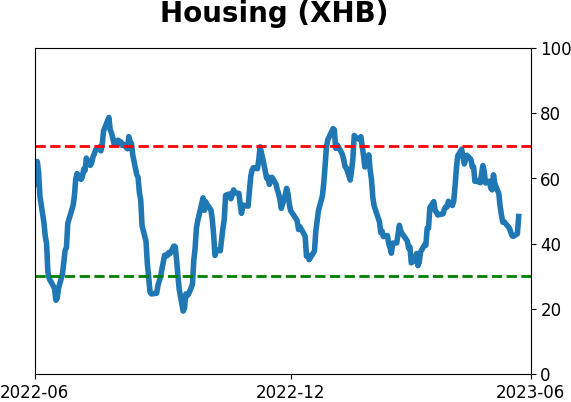
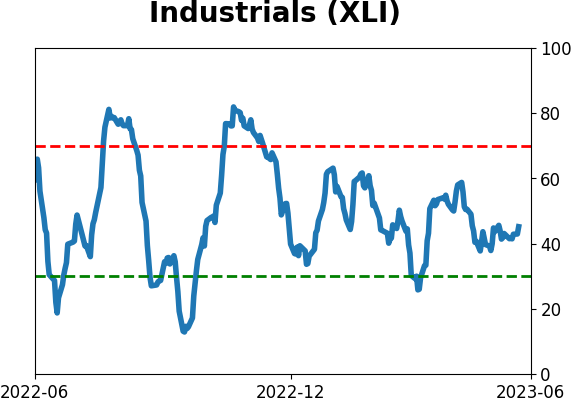
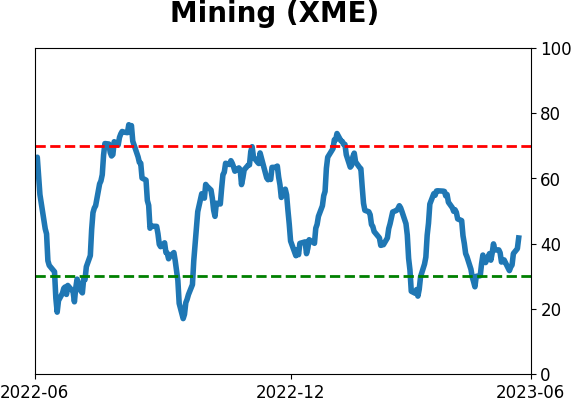
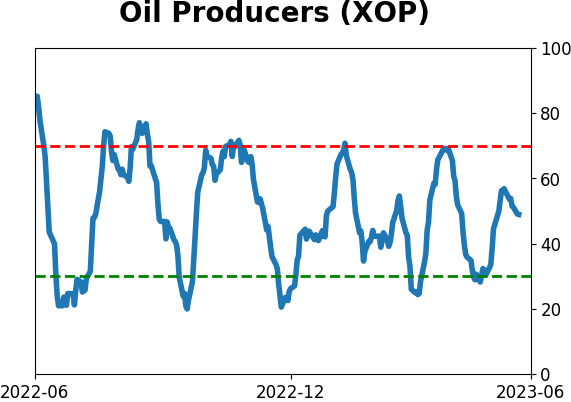
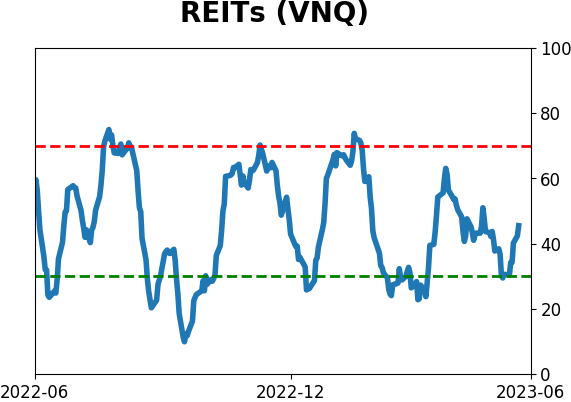
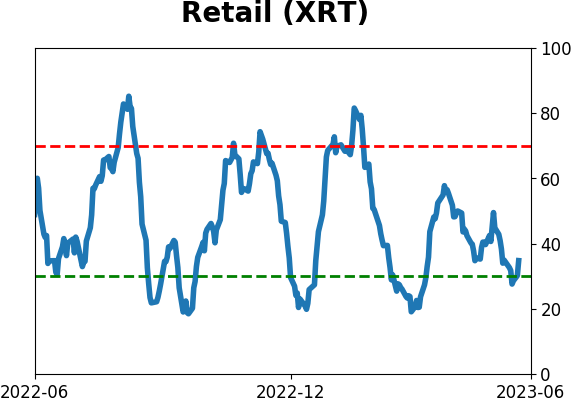
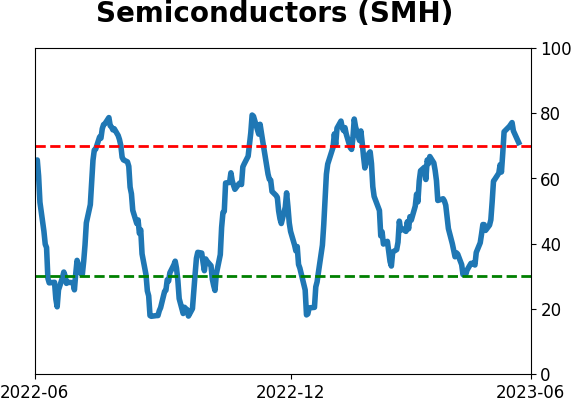
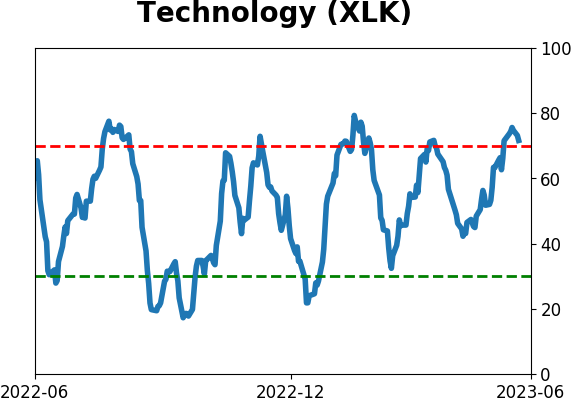
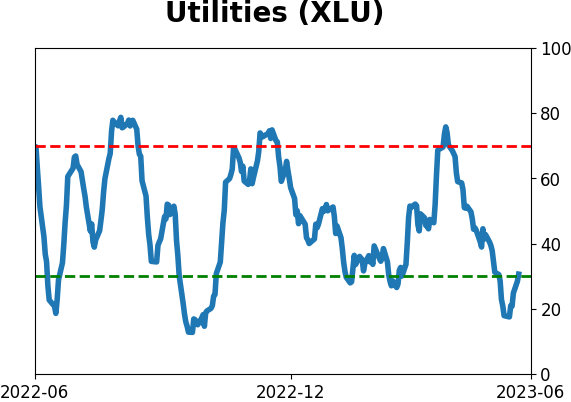
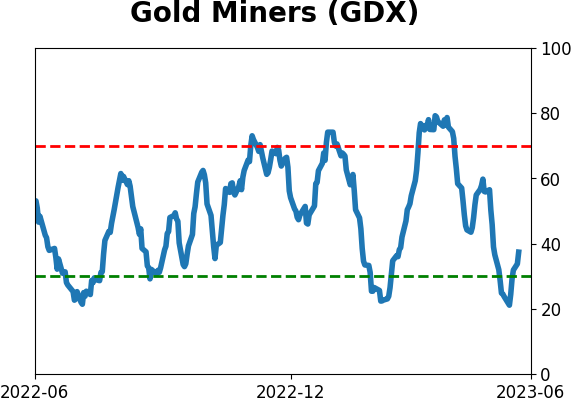
Sector ETF's - 10-Day Moving Average
|
|
|
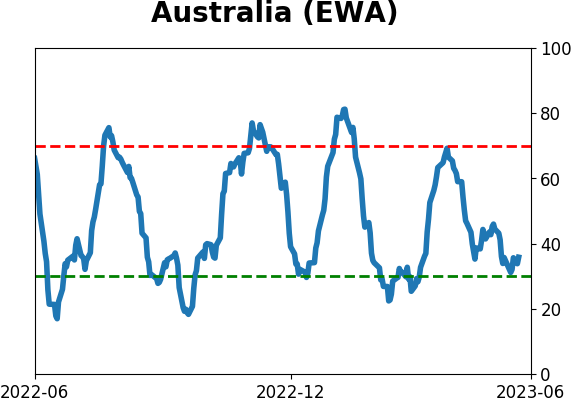
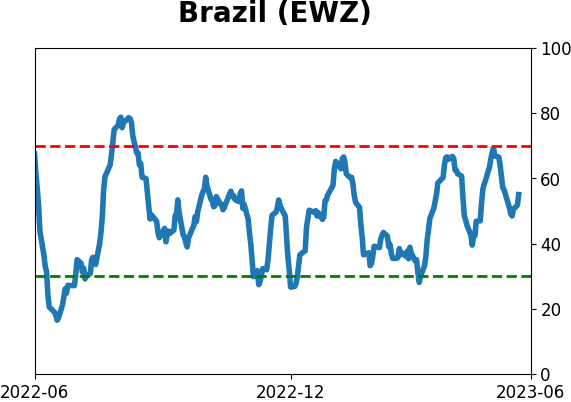
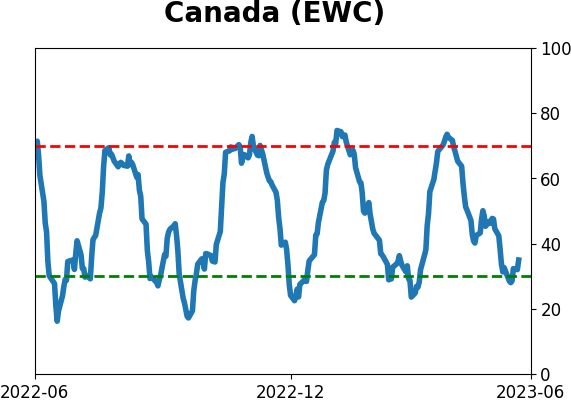
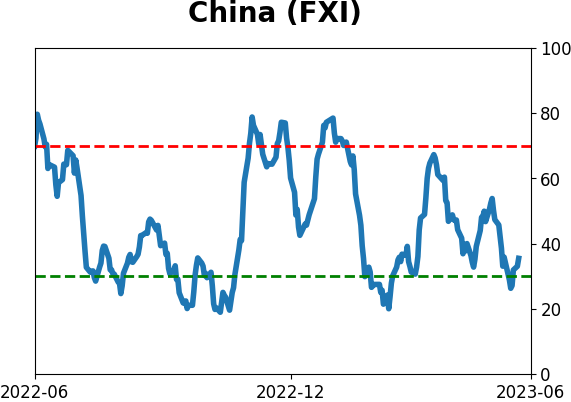
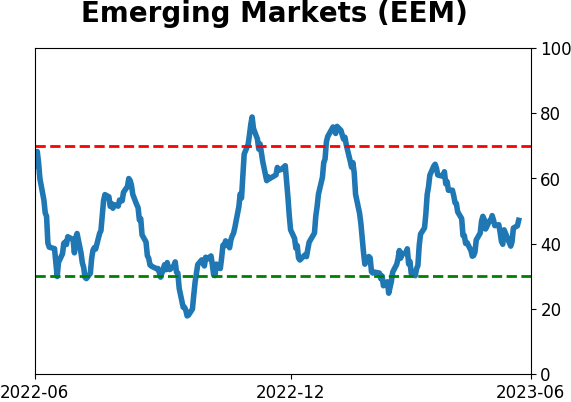
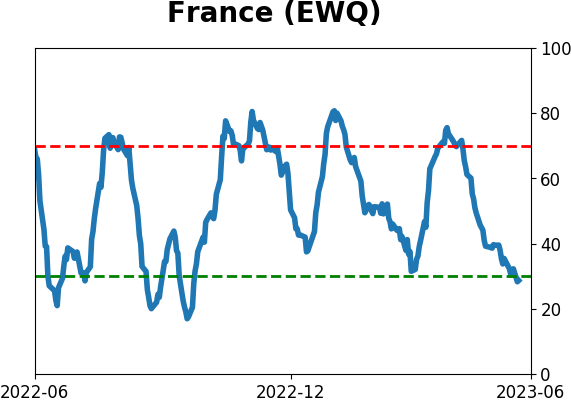
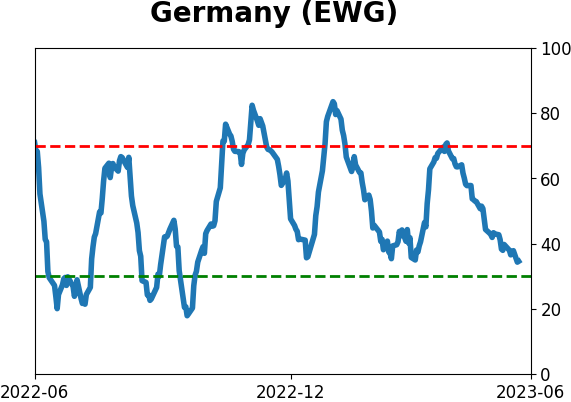
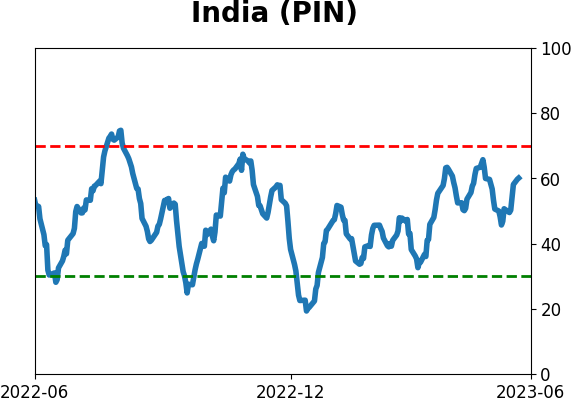
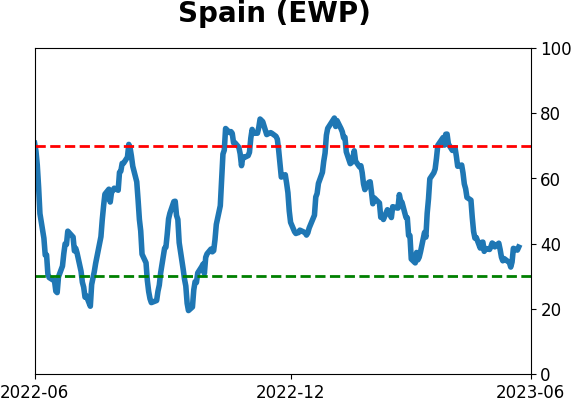
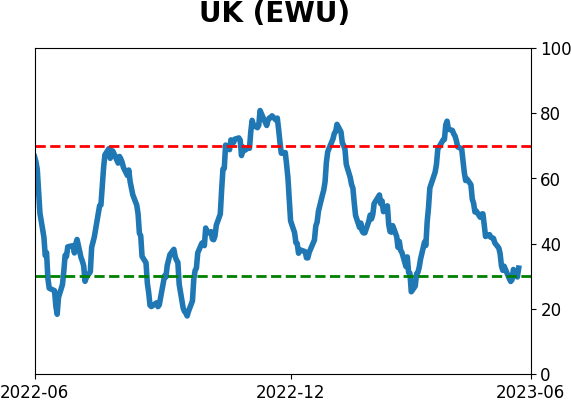
Country ETF's - 10-Day Moving Average
|
|
|
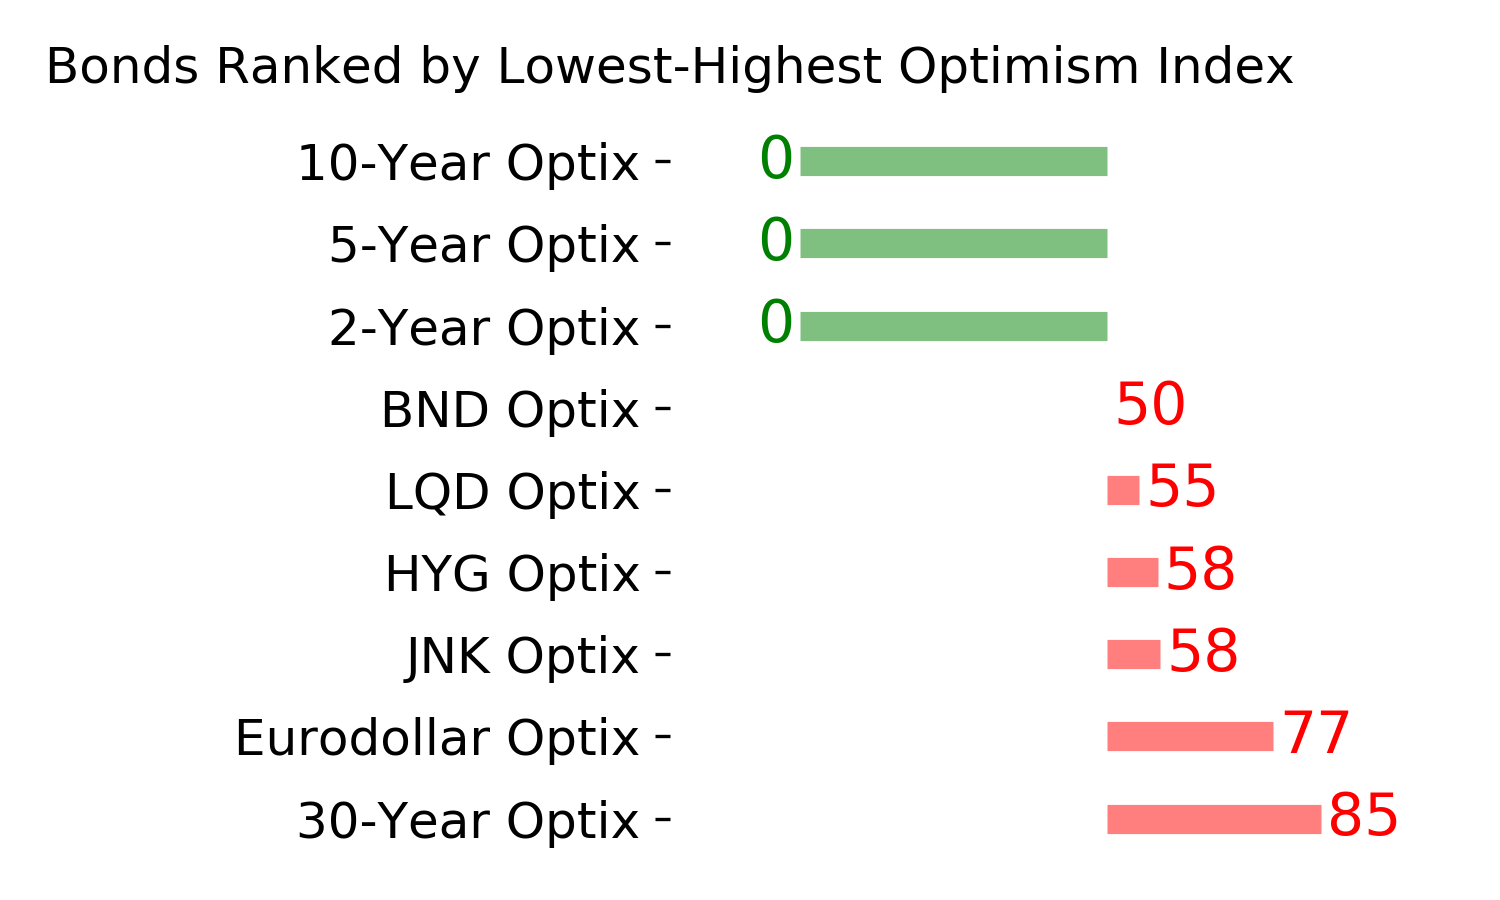
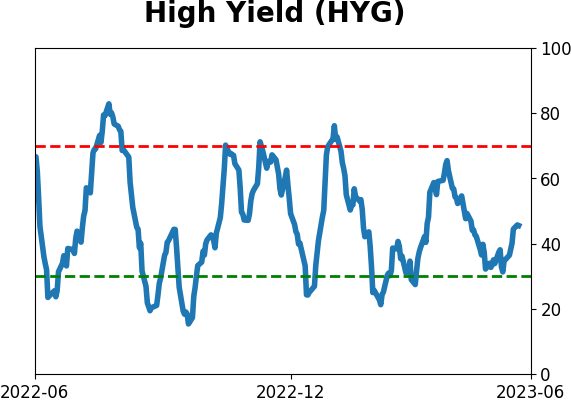
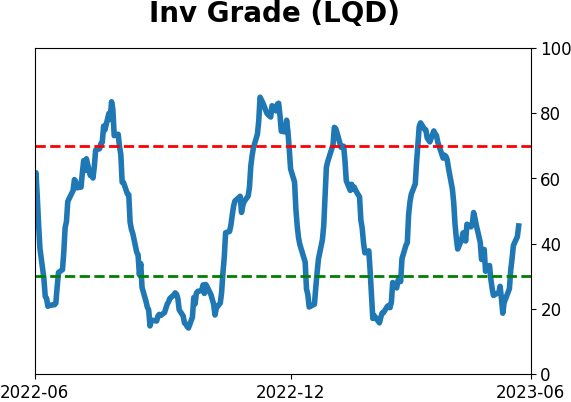
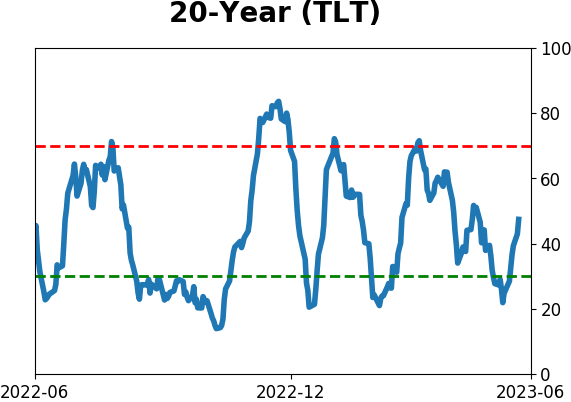
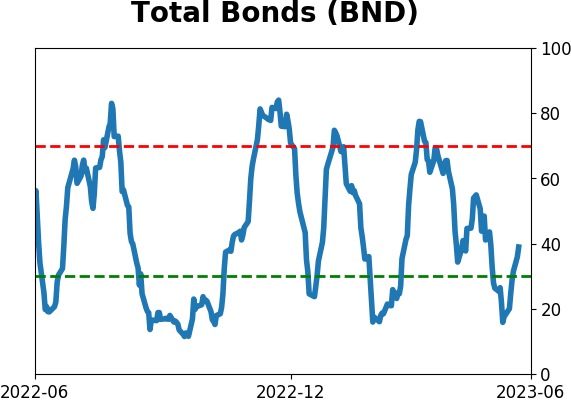
Bond ETF's - 10-Day Moving Average
|
|
|
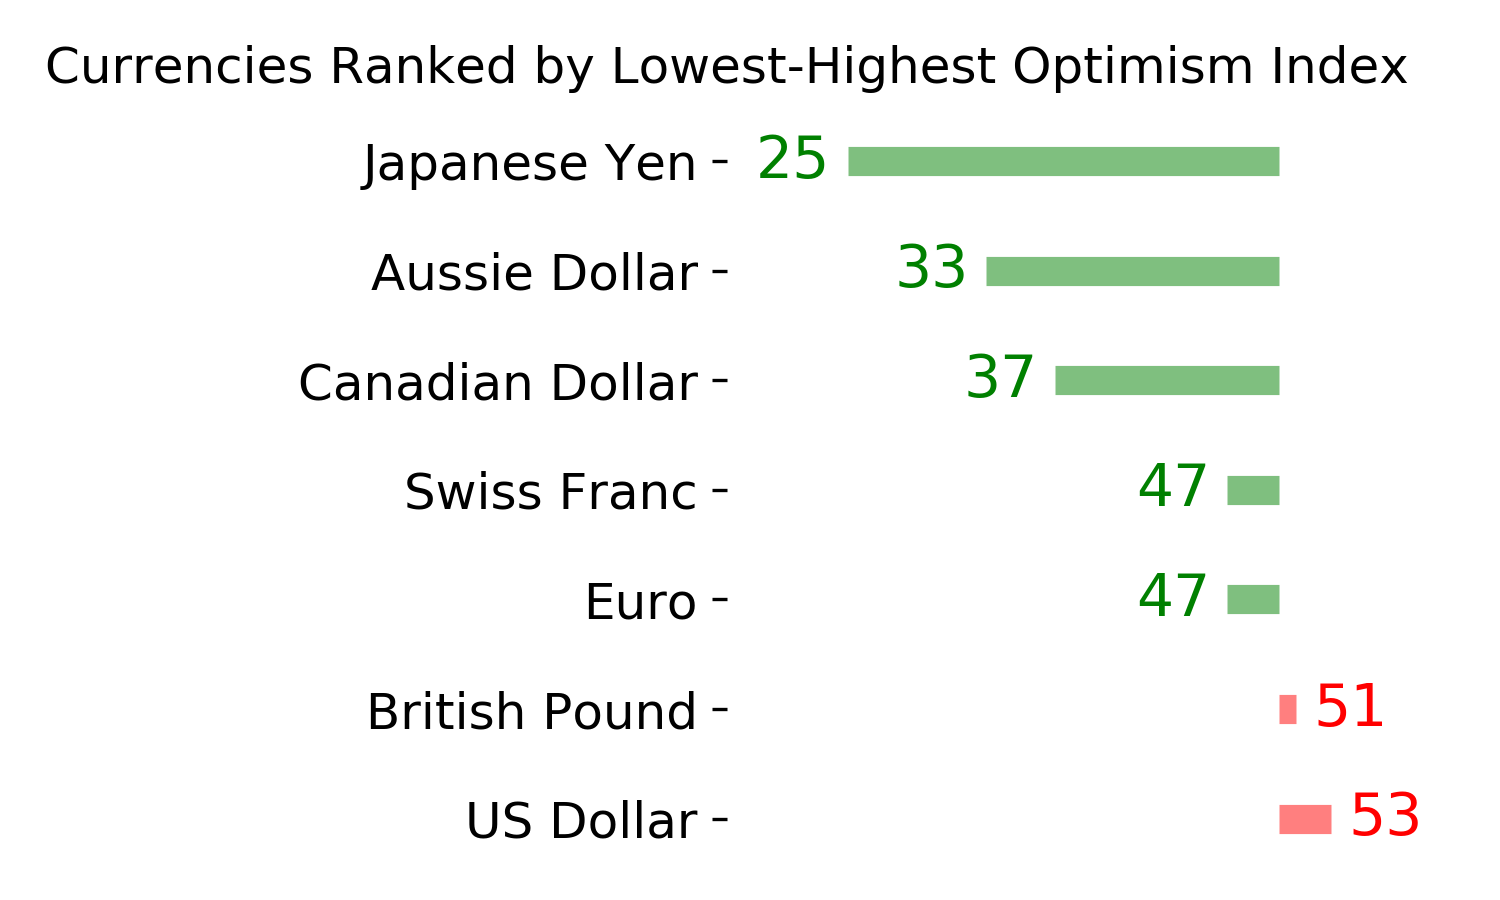
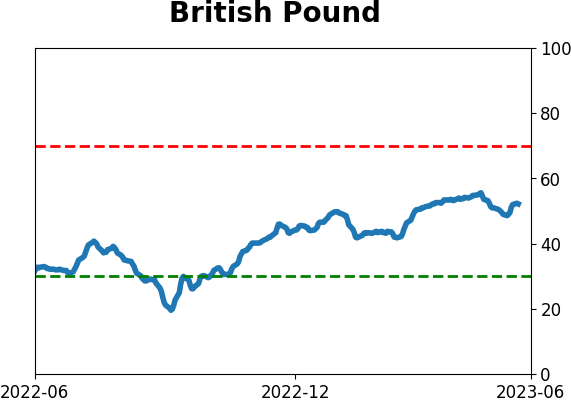
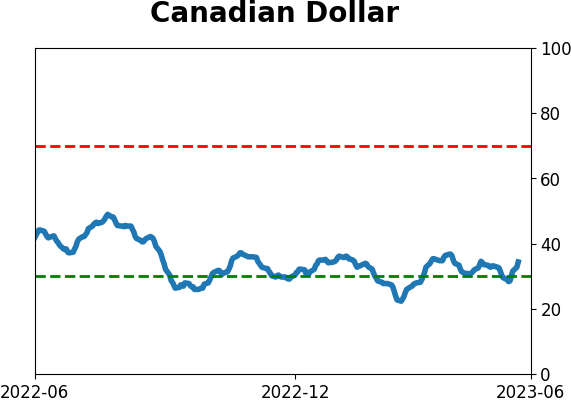
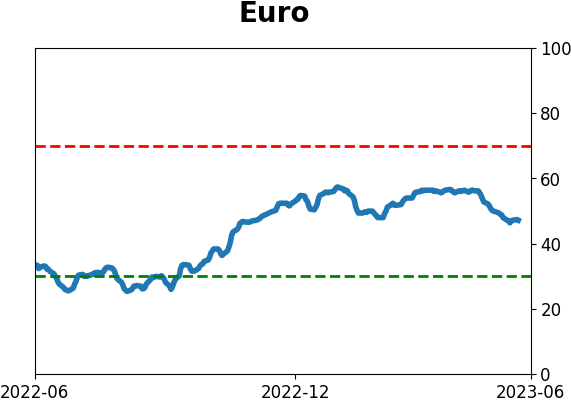
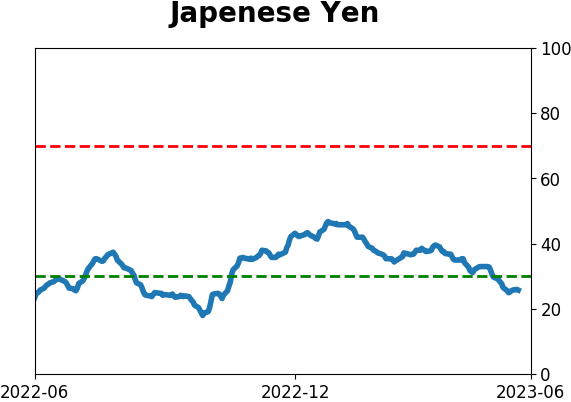
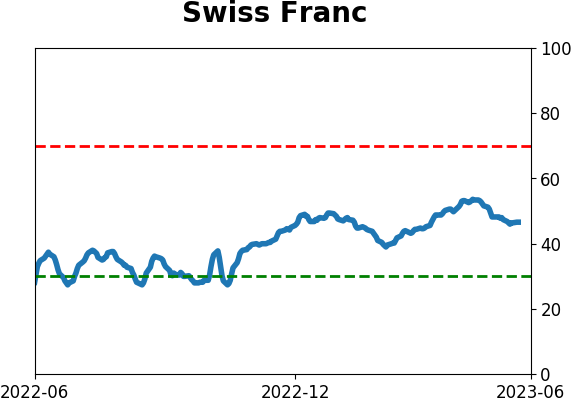
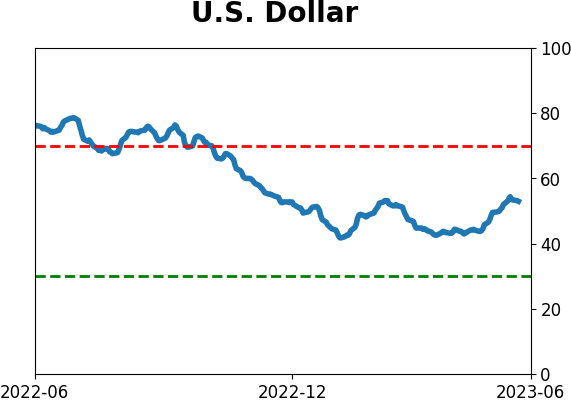
Currency ETF's - 5-Day Moving Average
|
|
|
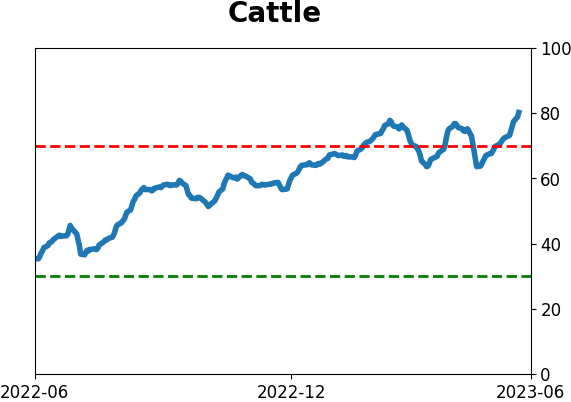
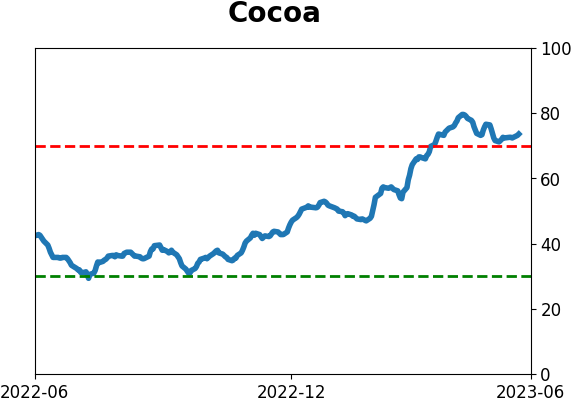
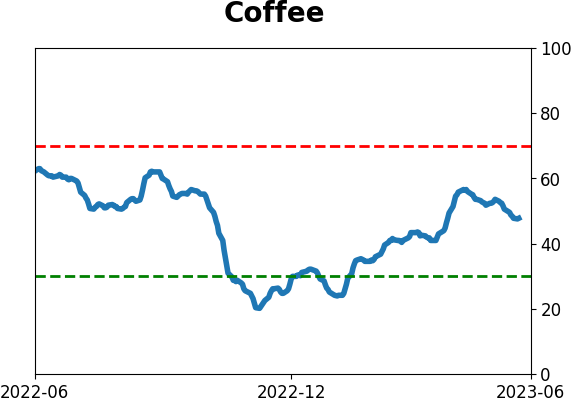
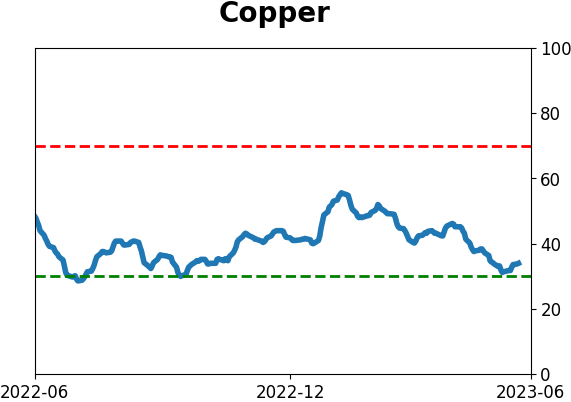
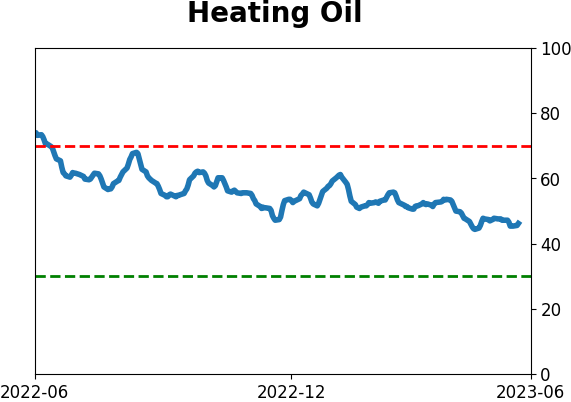
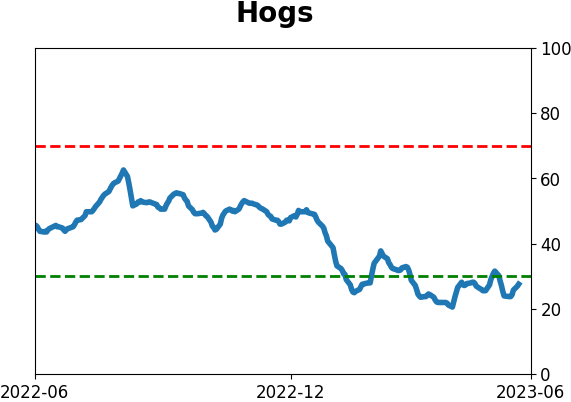
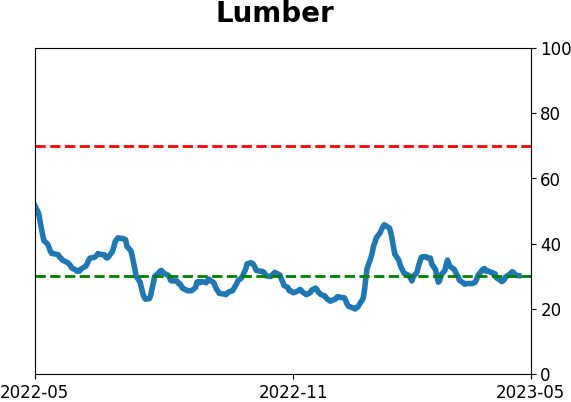
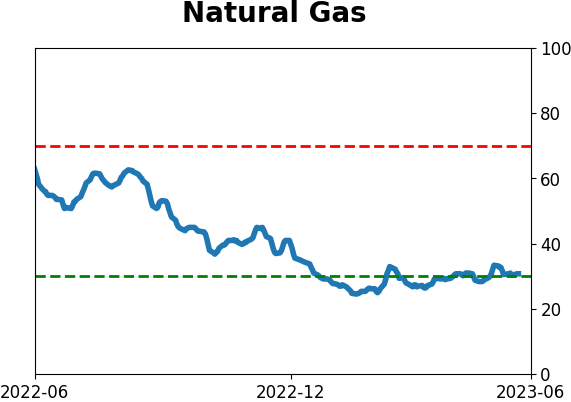
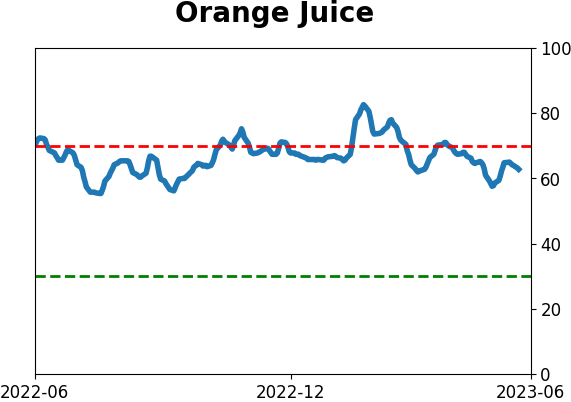
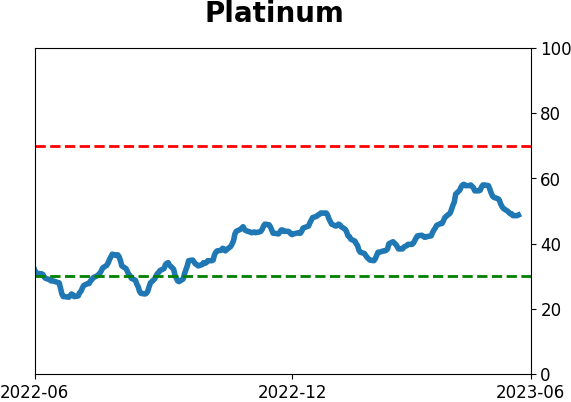
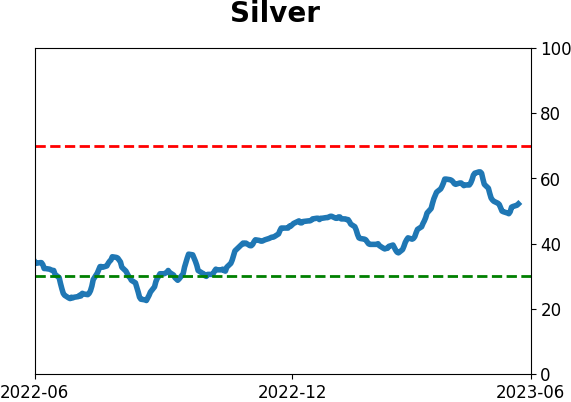
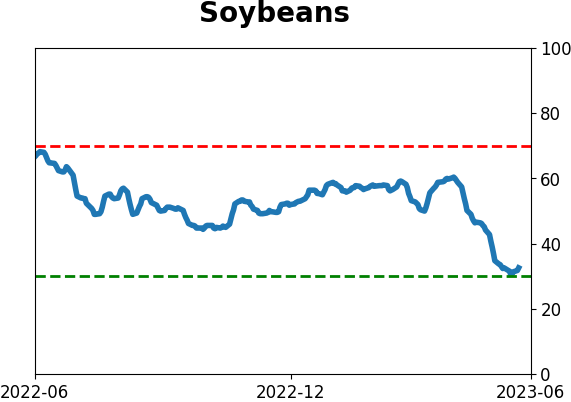
Commodity ETF's - 5-Day Moving Average
|
|