Daily Report for 06-03-2022

| View/Print a PDF version of this Report |
Headlines
|
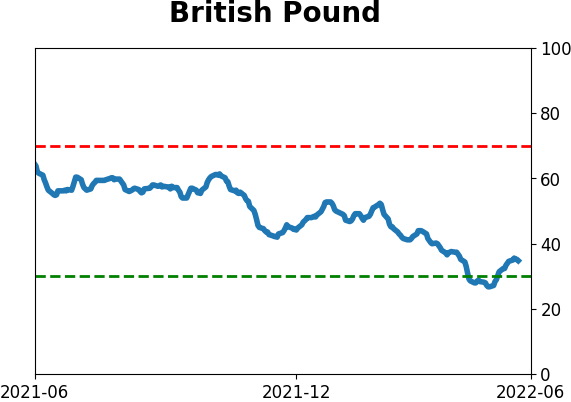
The latest Commitments of Traders report was released, covering positions through Tuesday: The 3-Year Min/Max Screen shows that "smart money" commercial hedgers established only one new multi-year extreme in positioning this week, a large net long position in DJIA futures. The Backtest Engine shows that when hedgers held more than a third of DJIA open interest net long, the Dow Industrials Average rose over the next three months after 51 out of 57 signals, averaging +6.7%. This move helped push hedgers to net long exposure in major equity index contracts above $13 billion. During the past 12 years, this has been an exceptionally positive sign, but it has become less reliable lately. The only other market showing a notable move is the British pound, where hedgers just started to reduce a massive net long position. This typically happens as the pound is bottoming. |
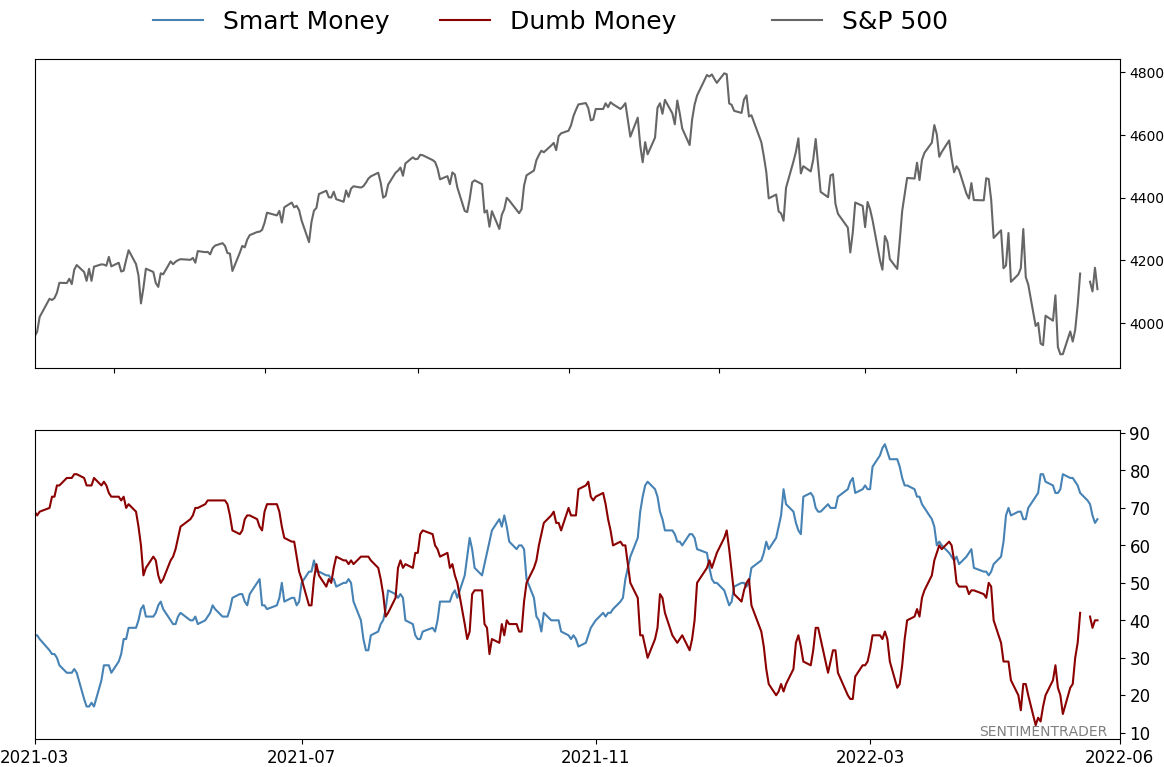
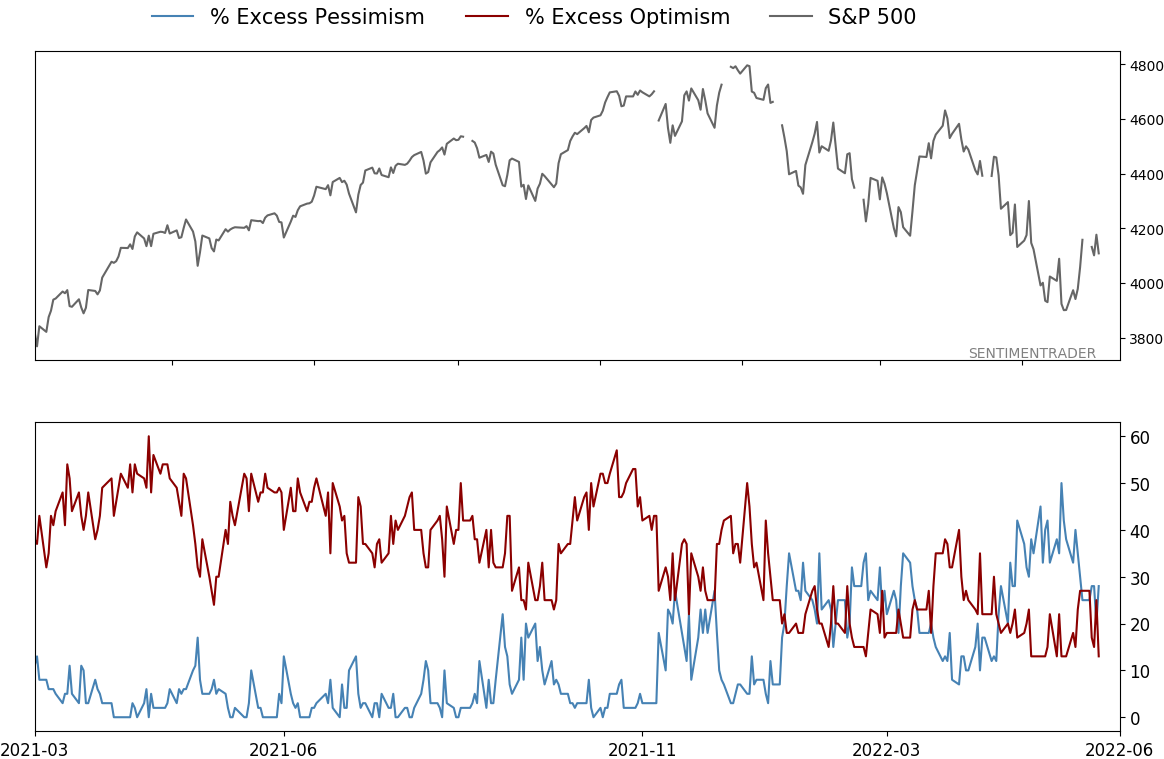
Smart / Dumb Money Confidence
|
|
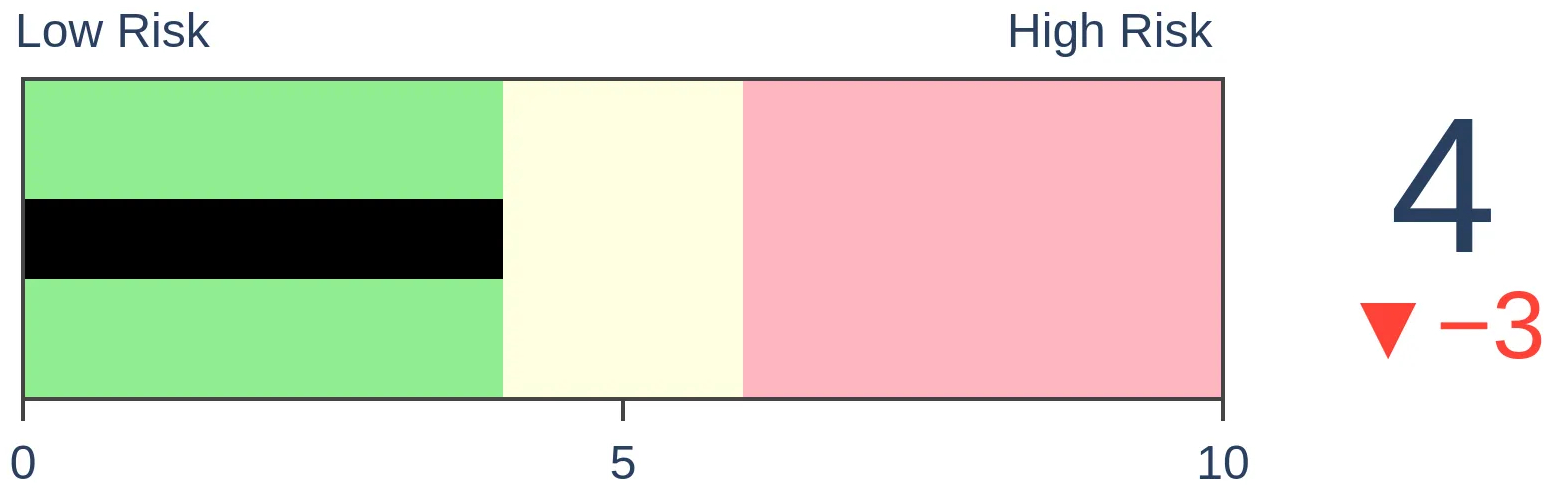
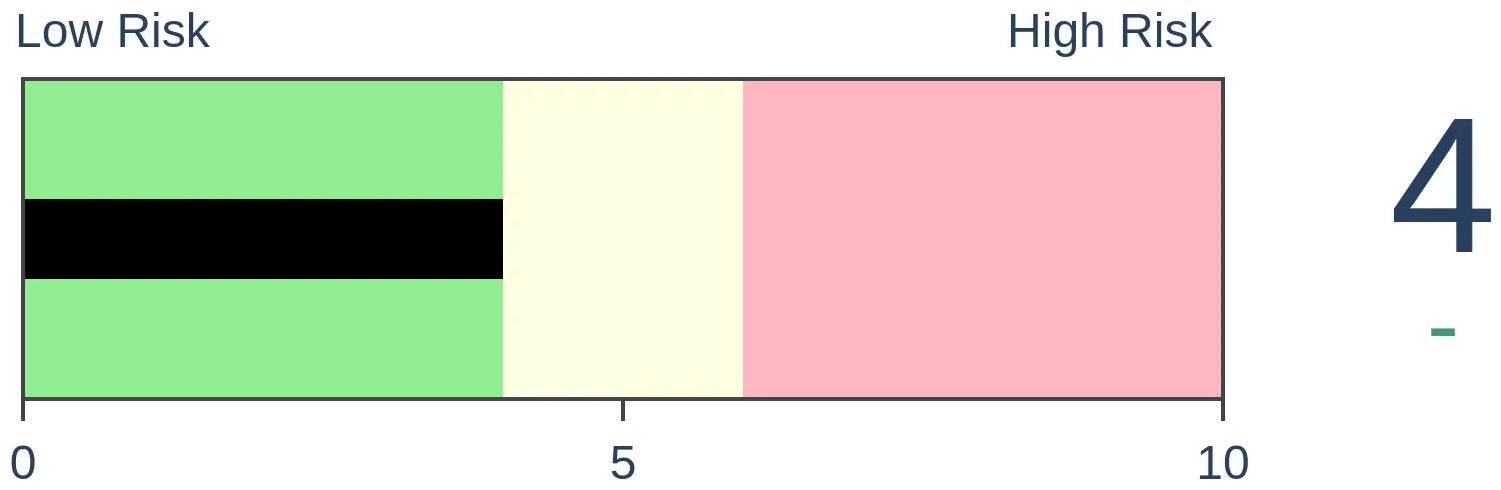
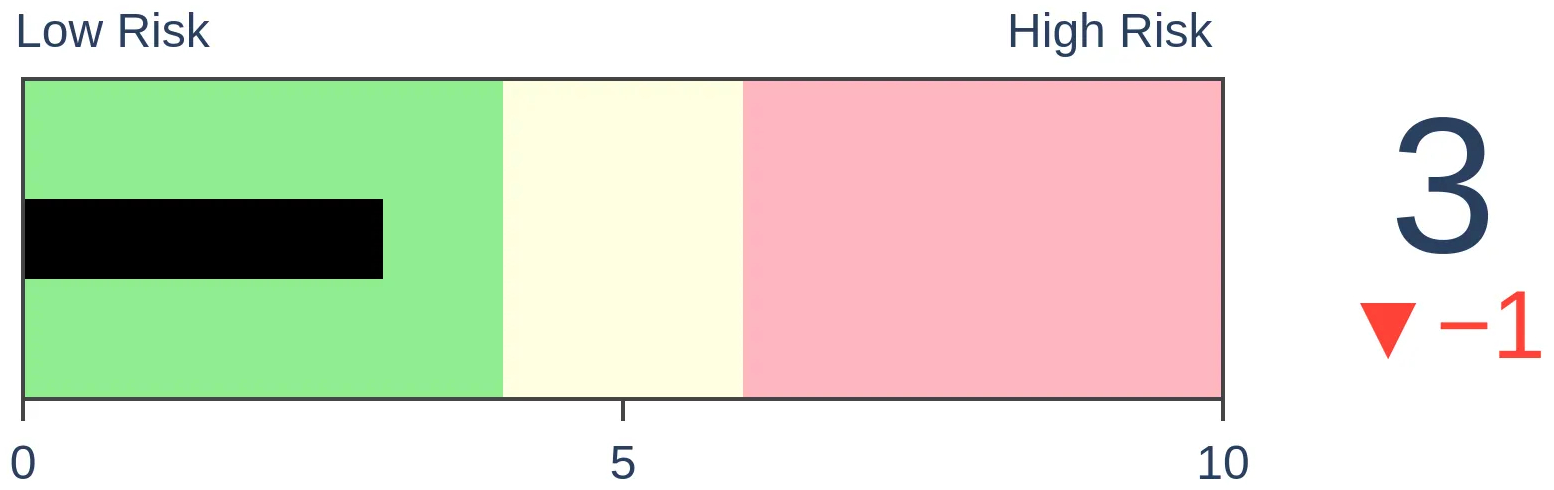
Risk Levels
|
|

|


Indicators at Extremes
|
|
|
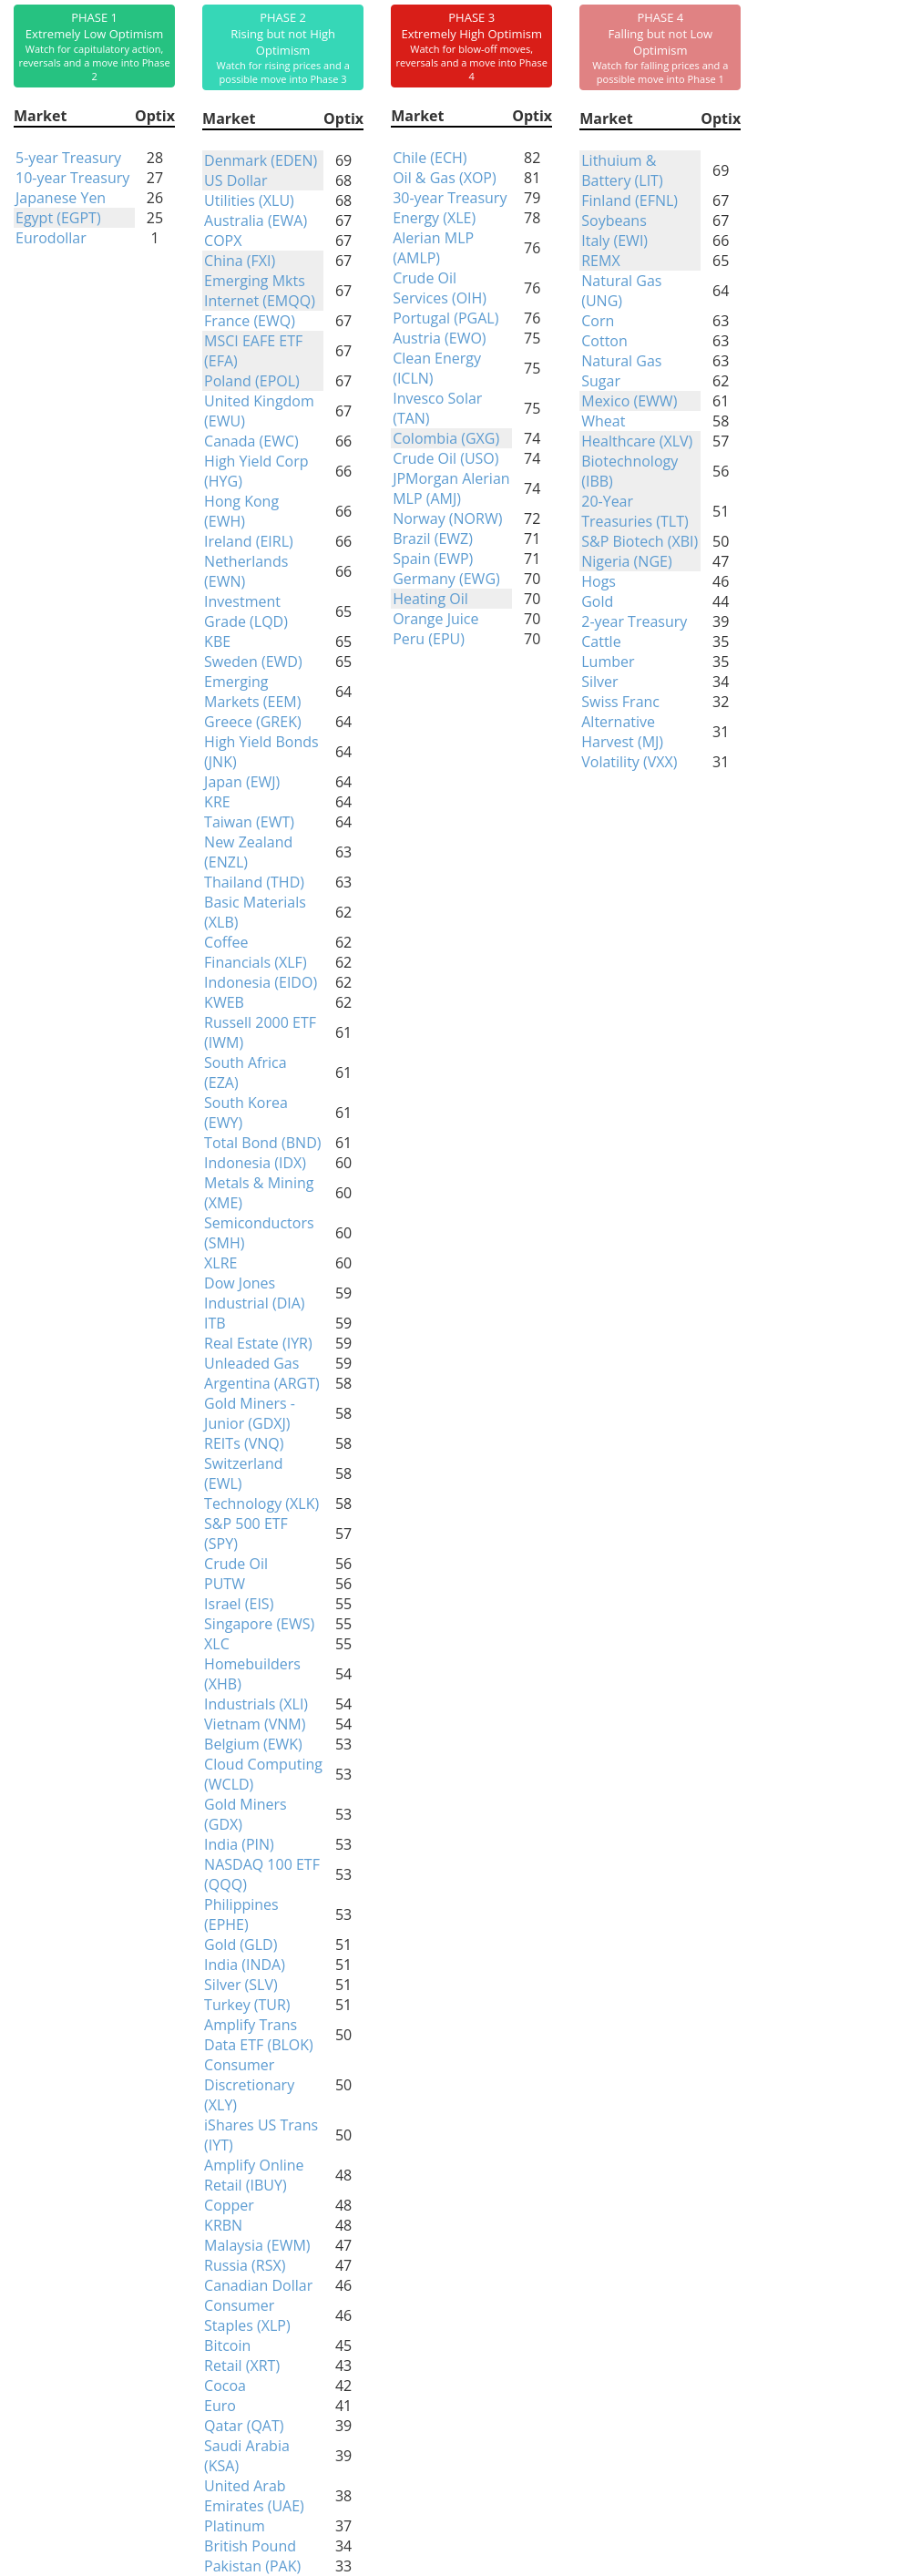
Phase Table
|
|
|
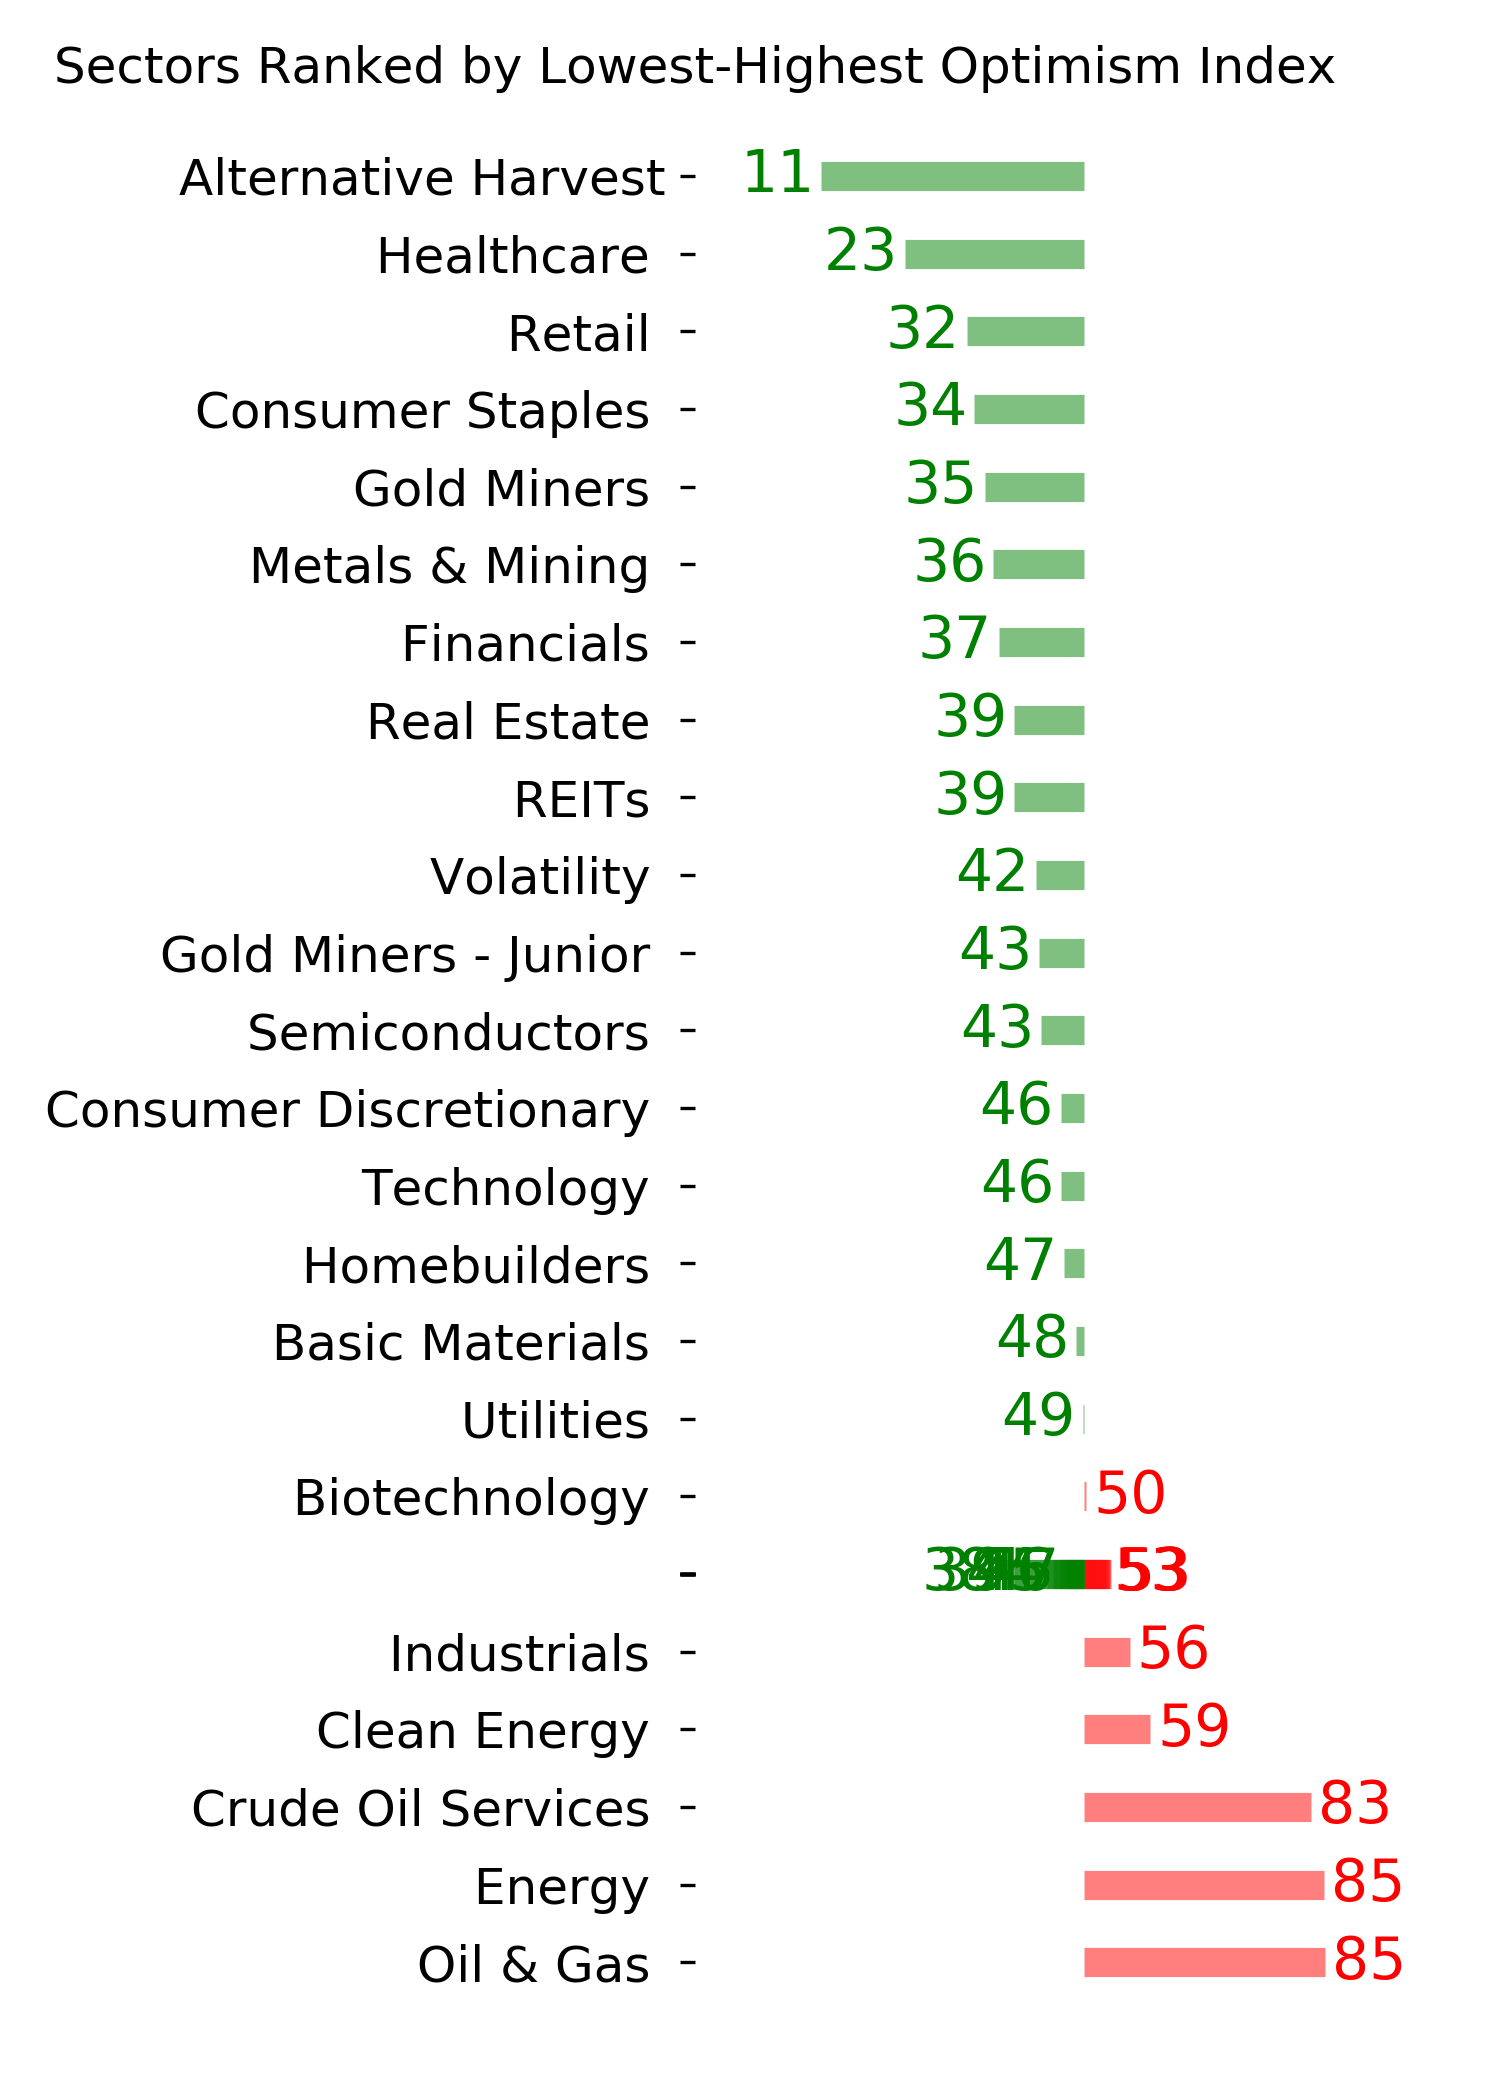
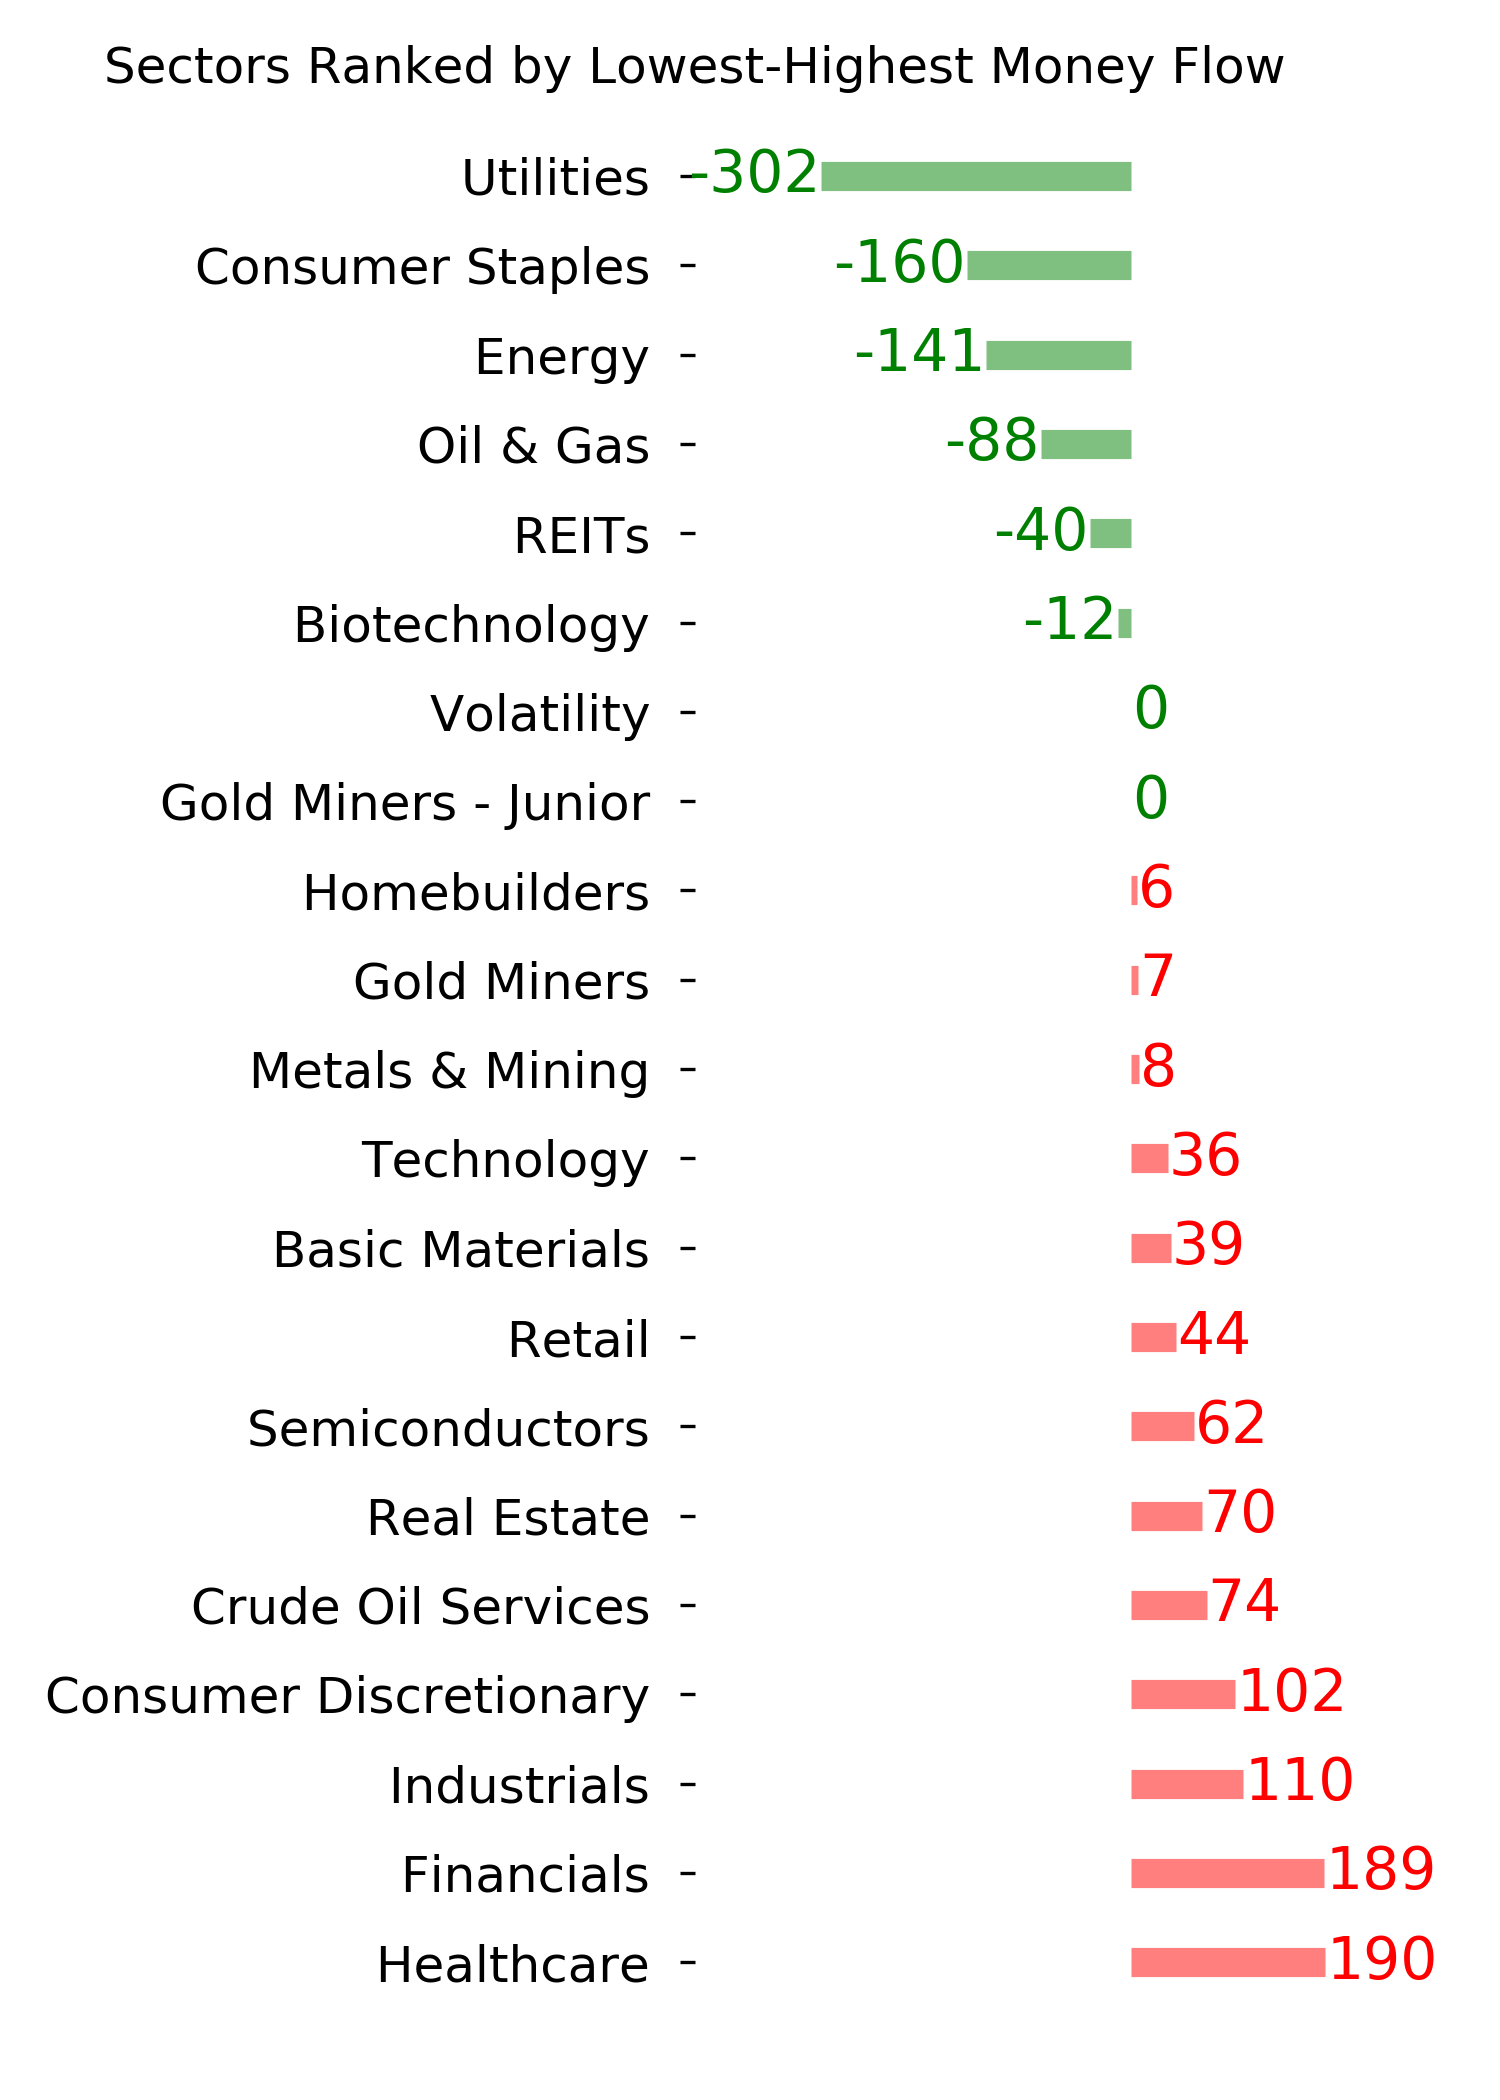
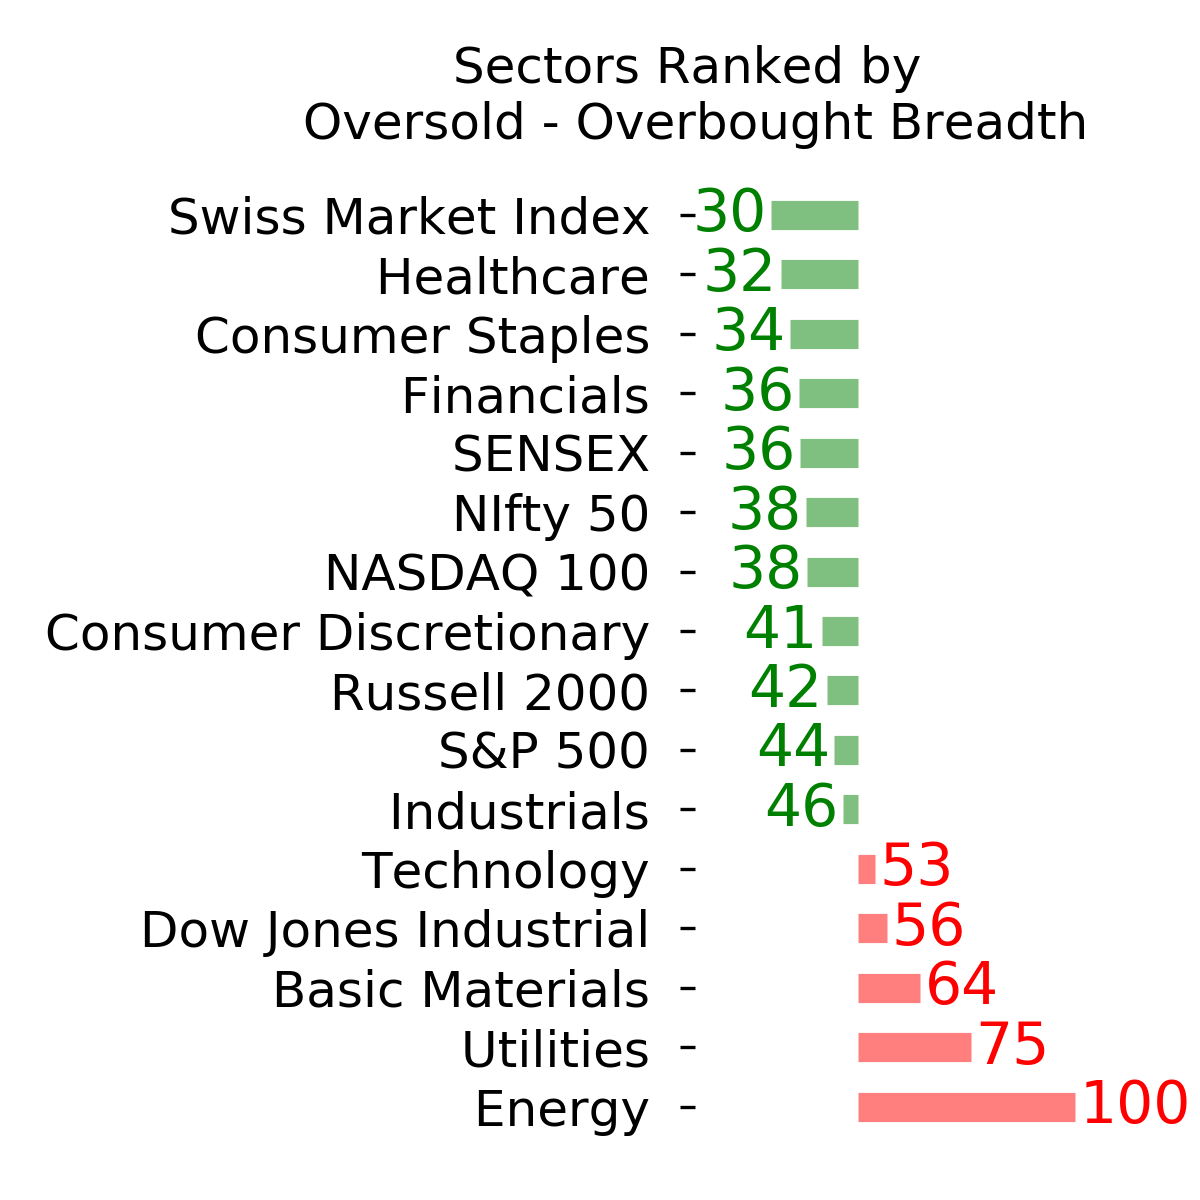
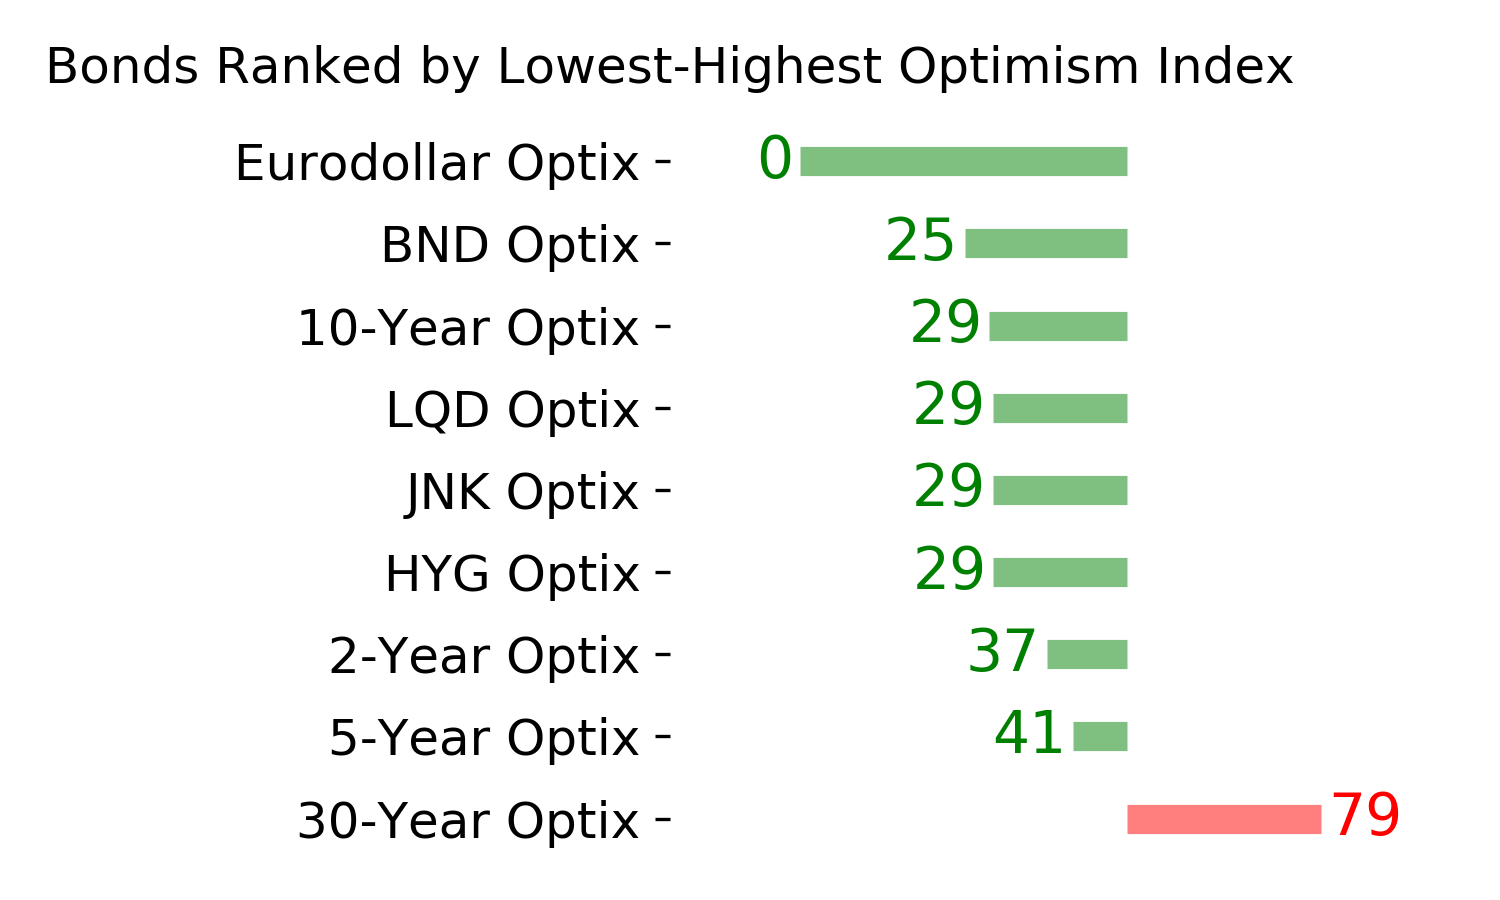
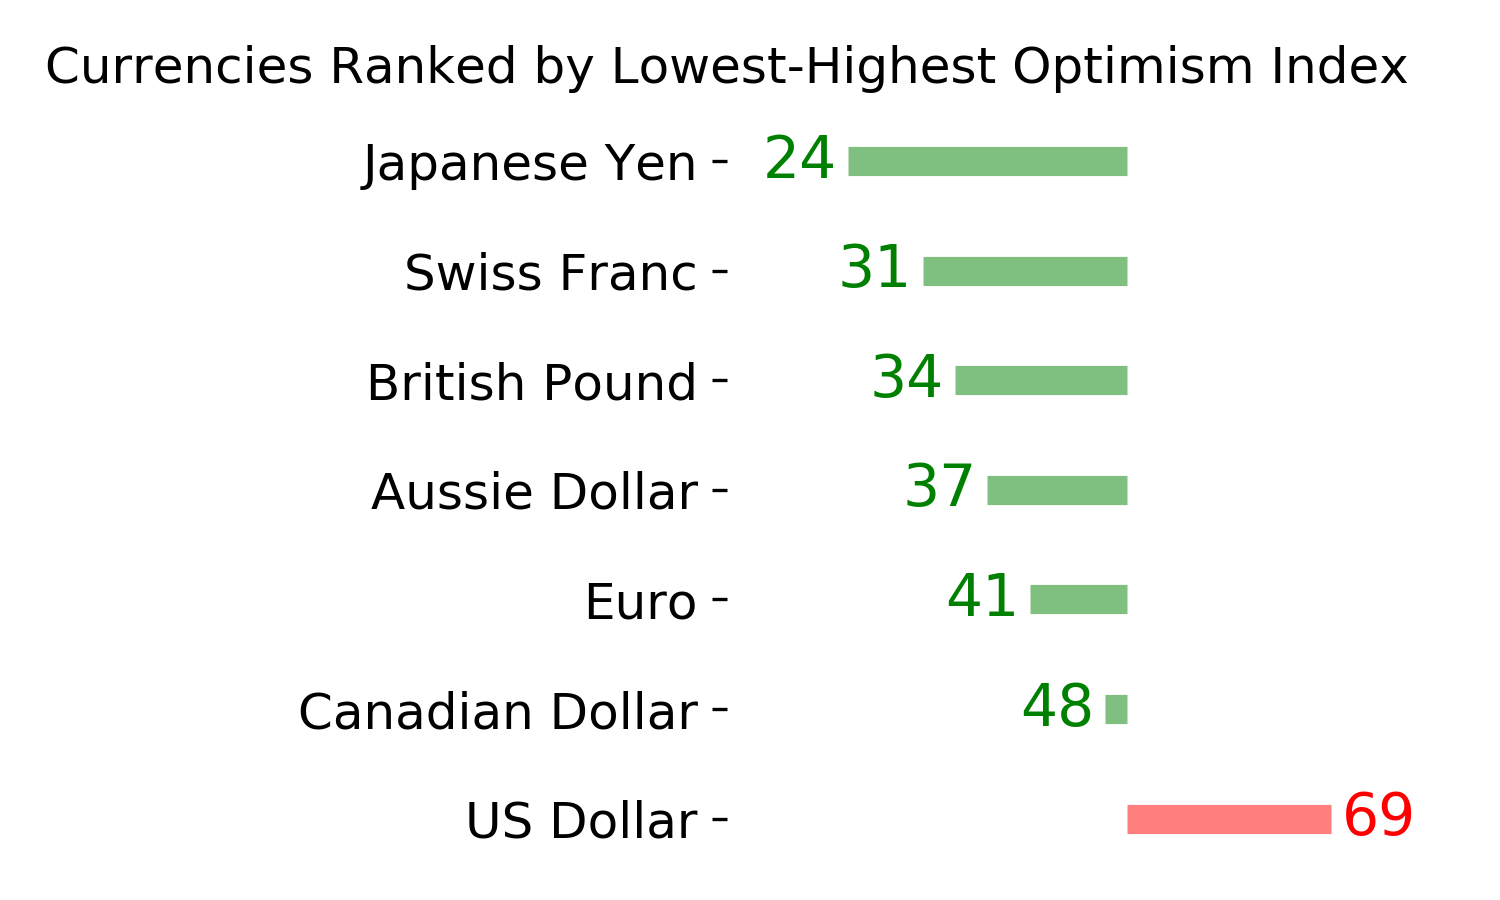
Ranks
|
|
|
|
|
|
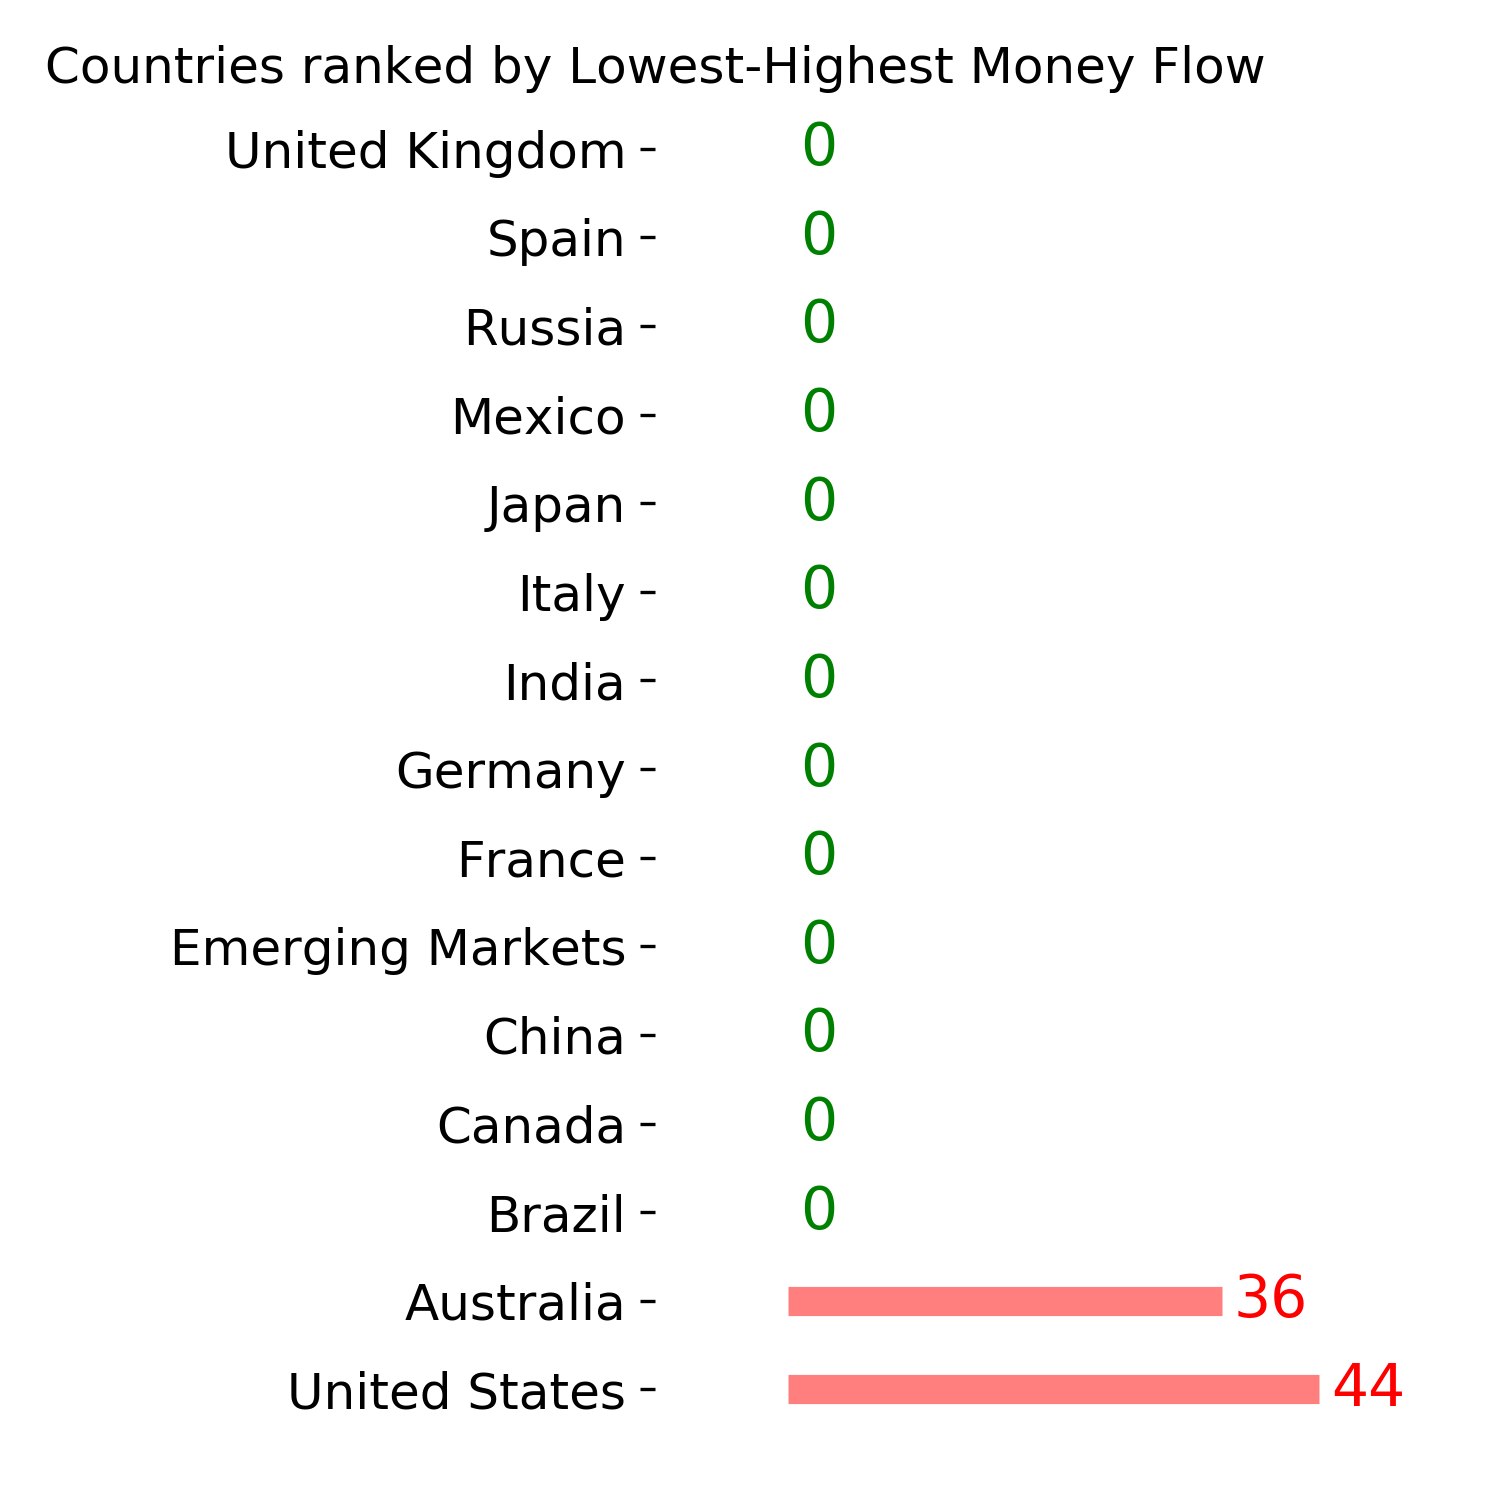
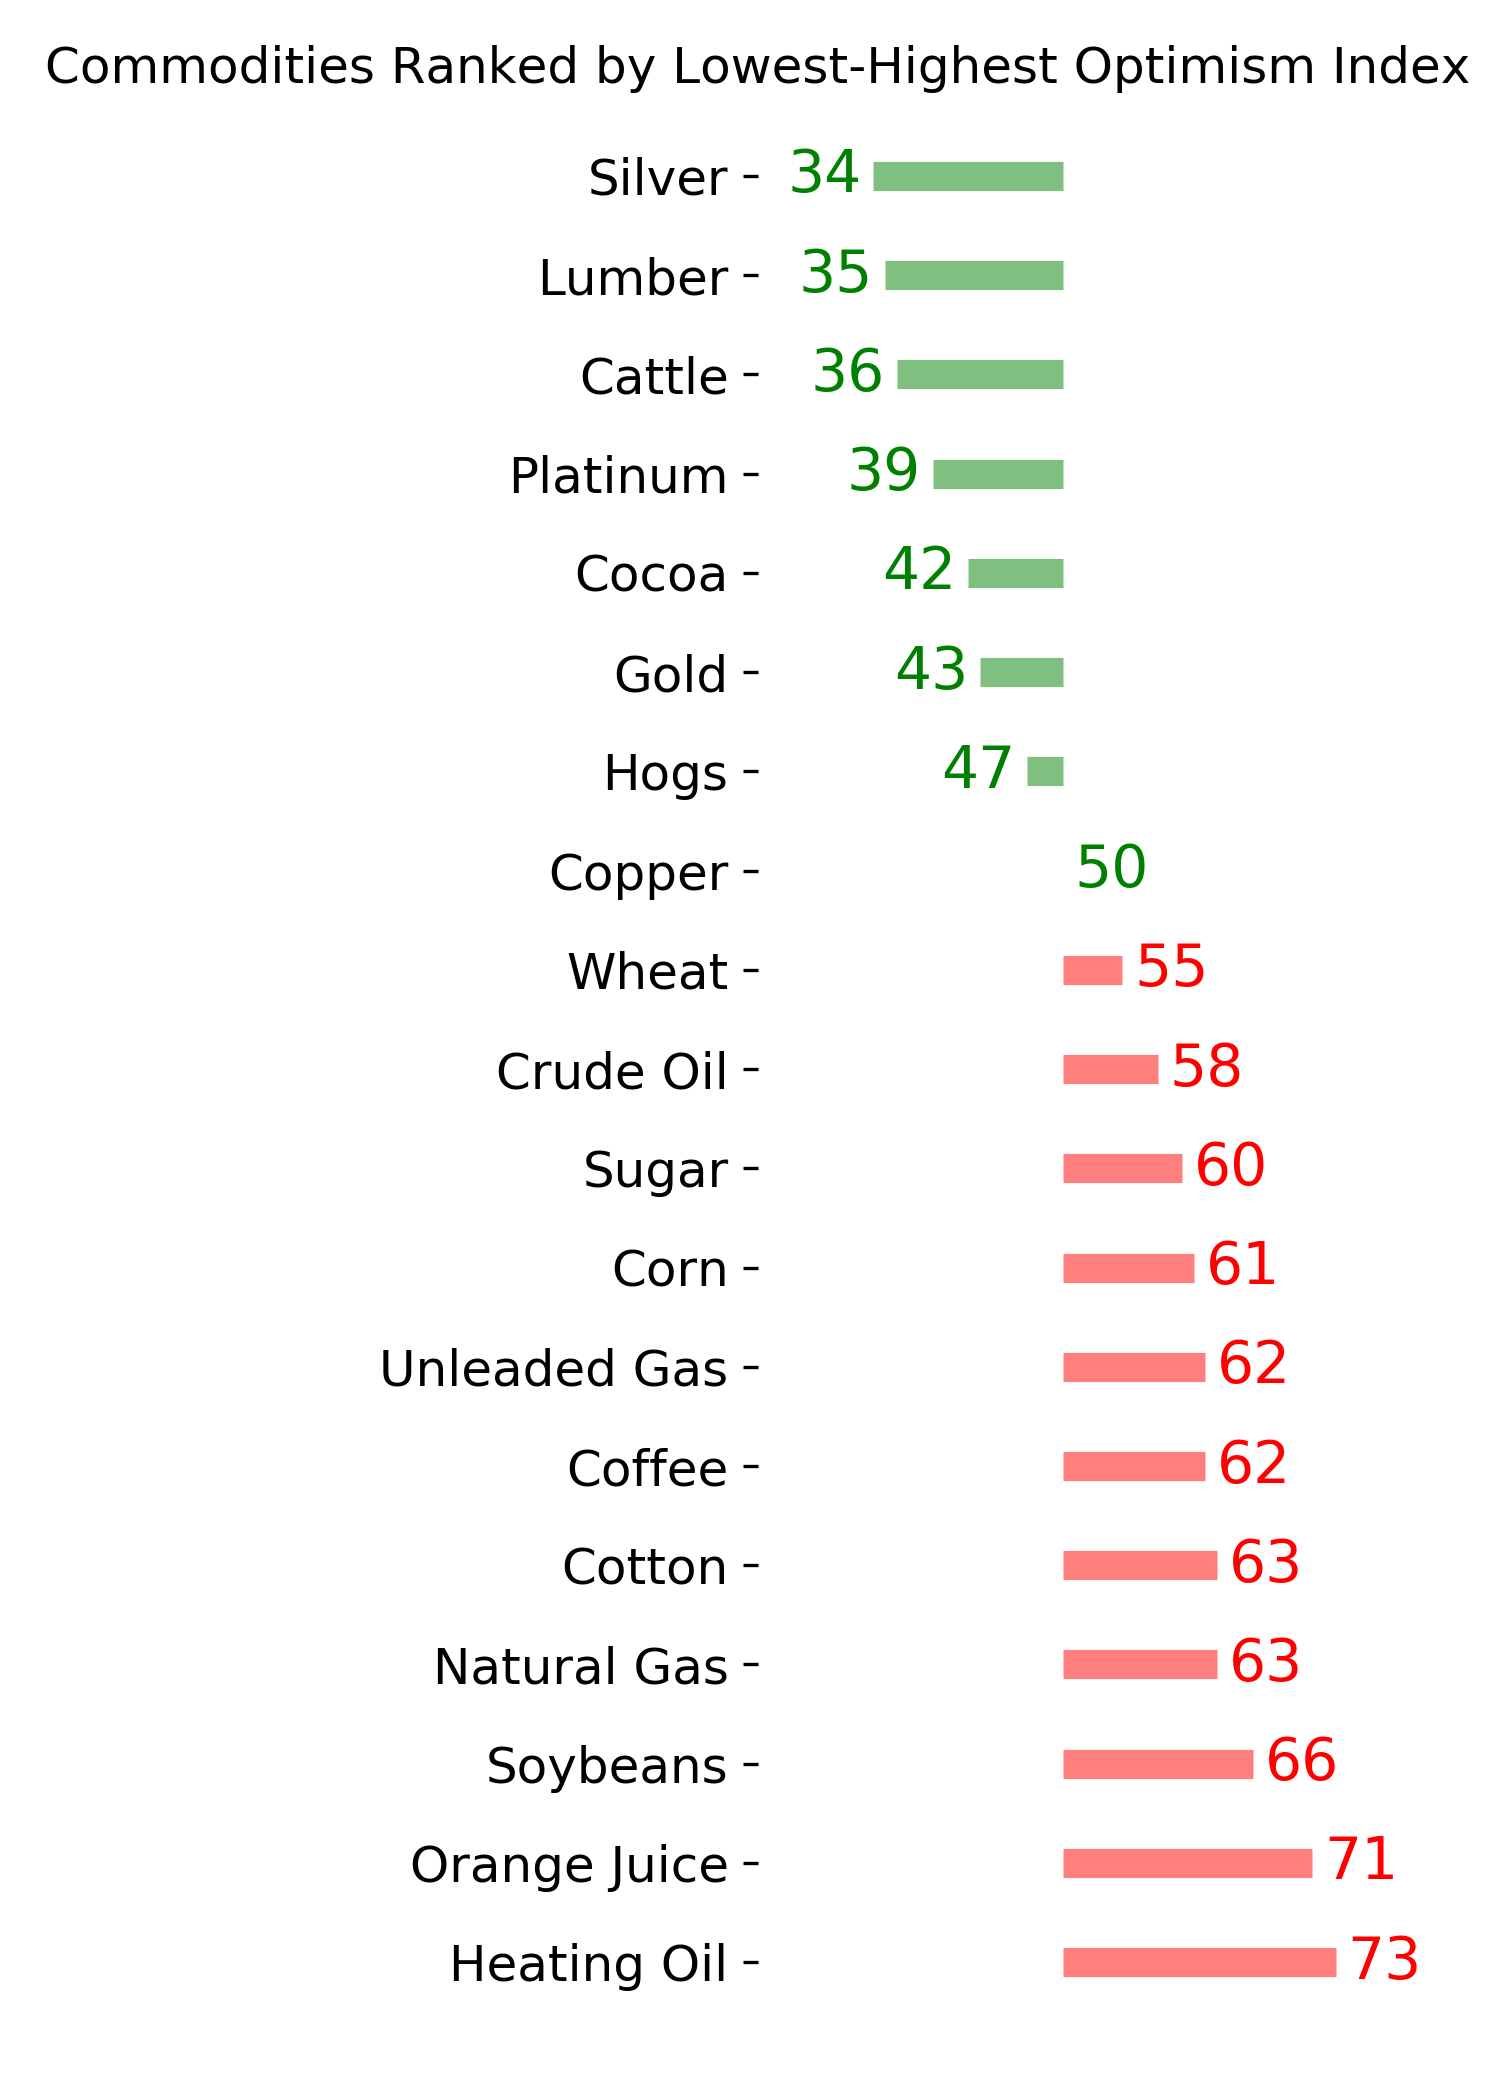
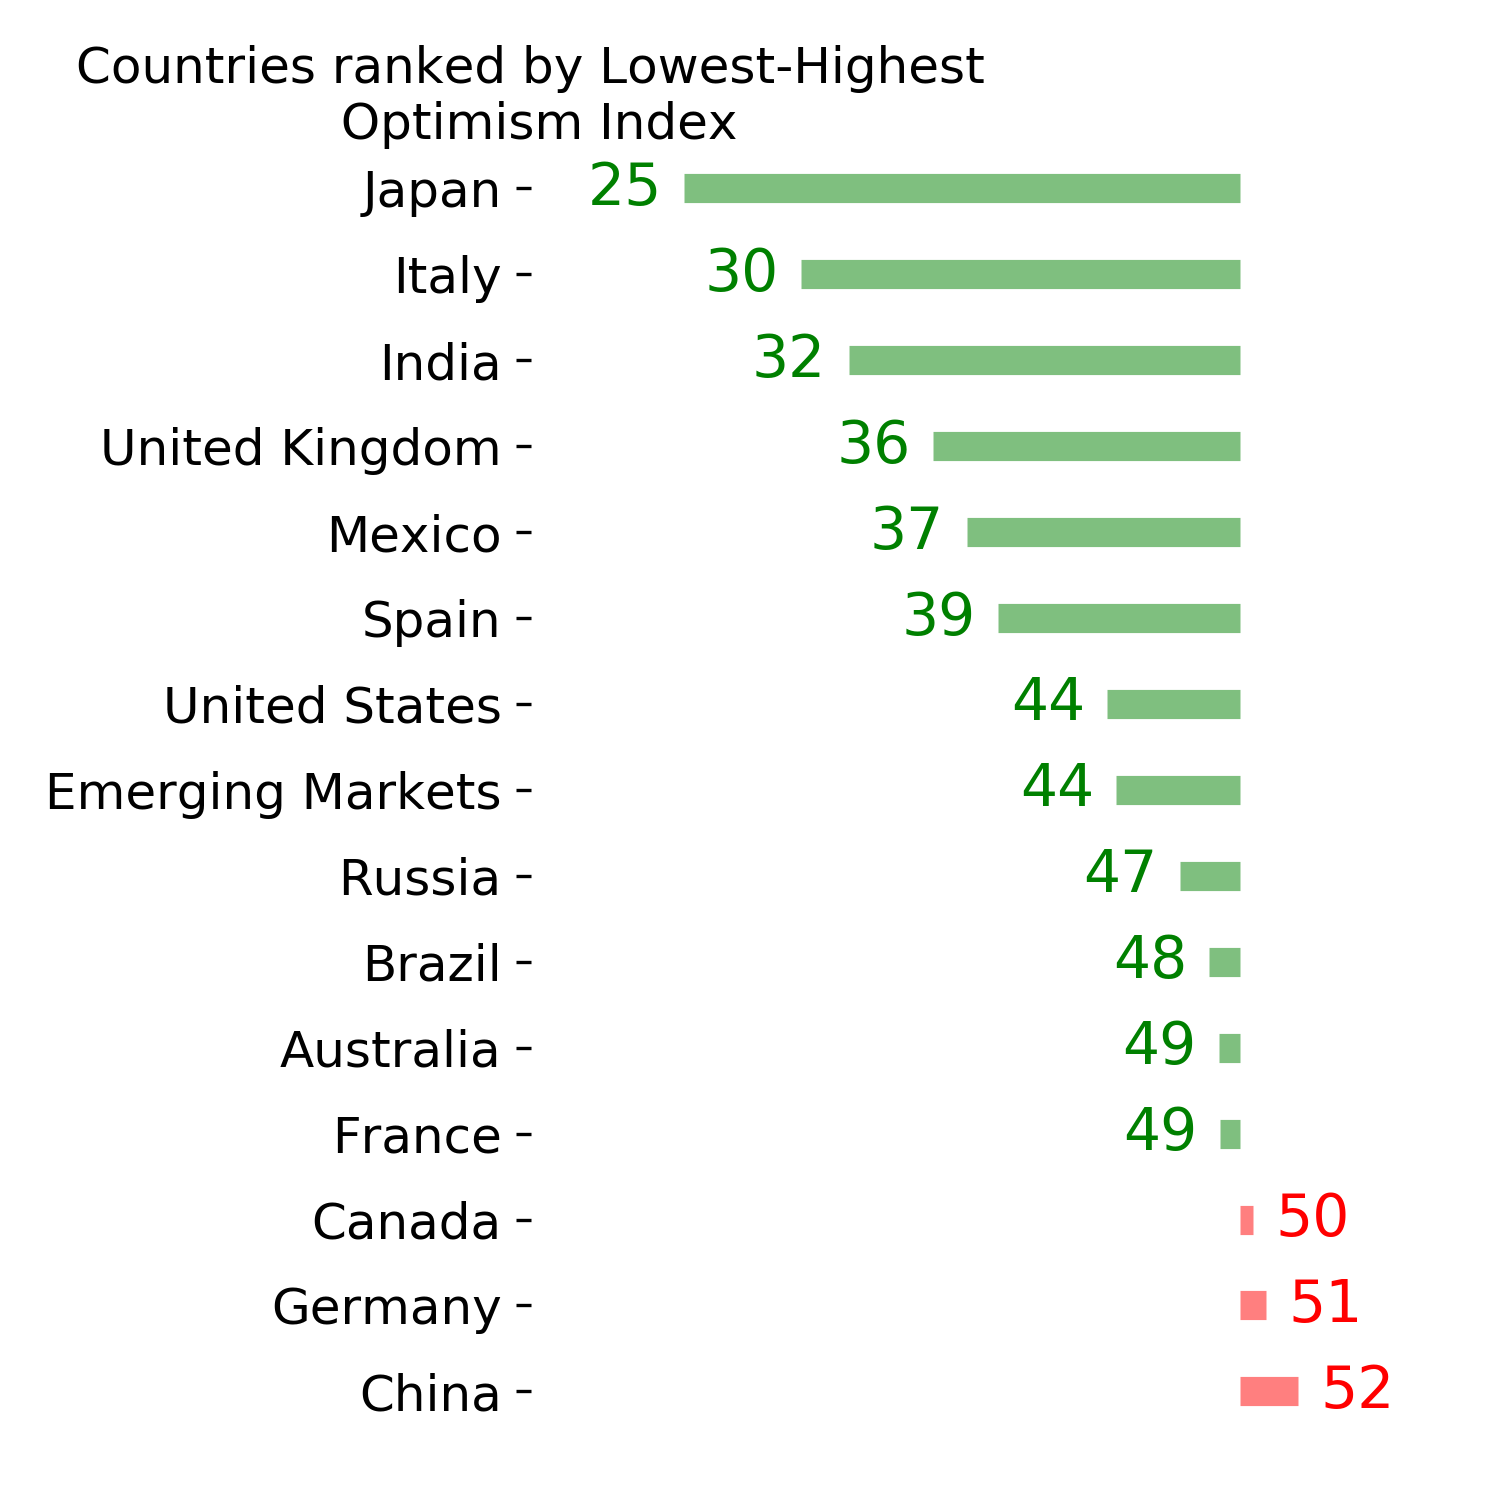
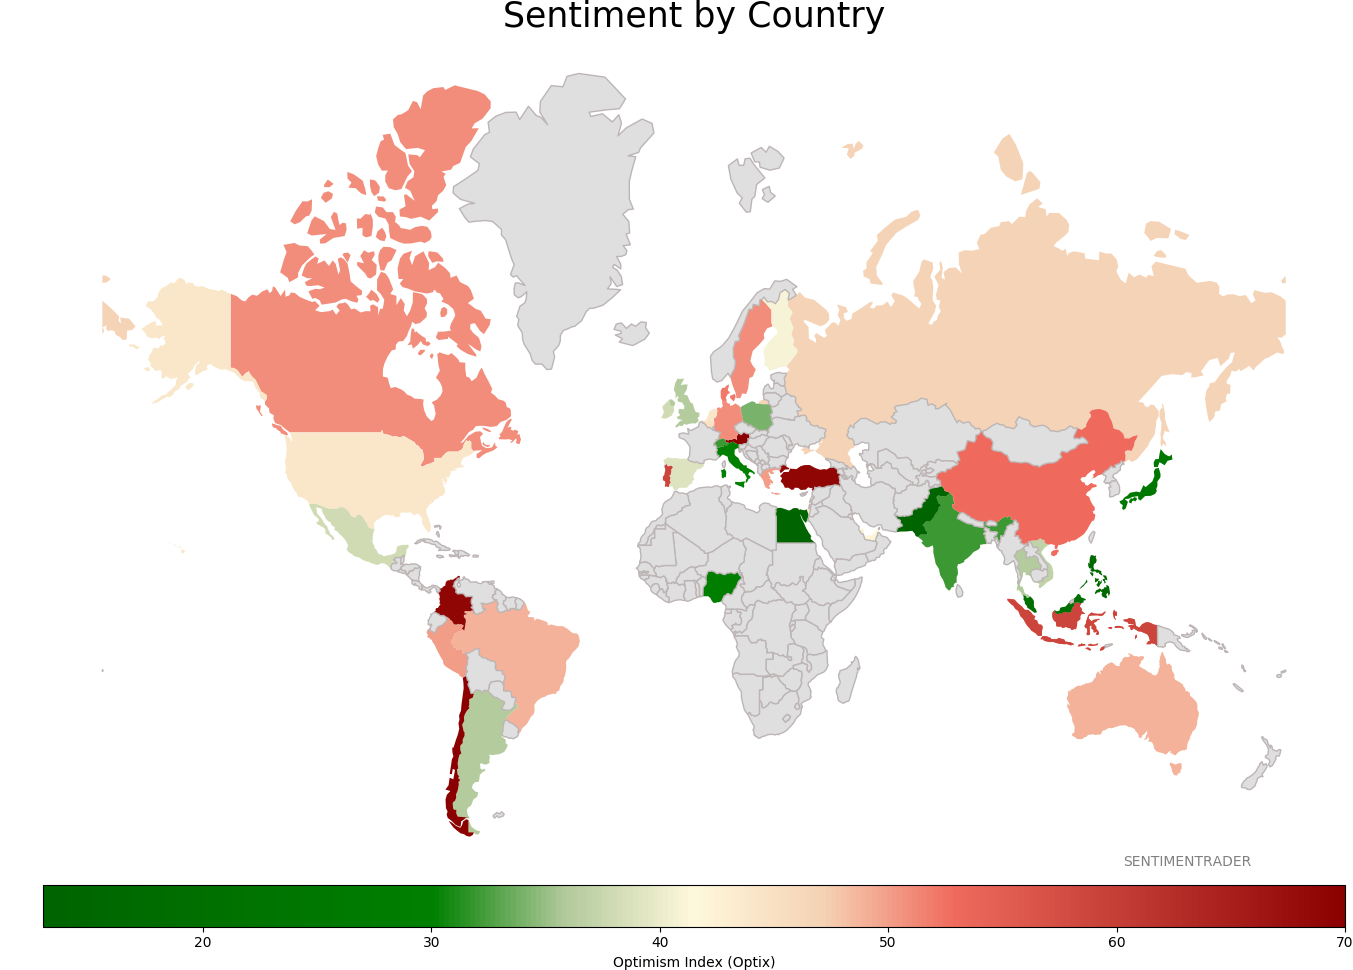
Sentiment Around The World
|
|
|
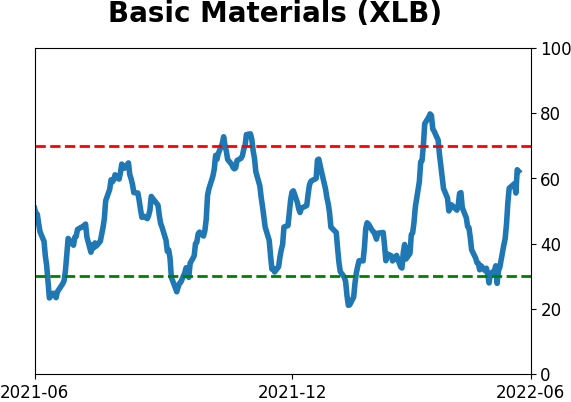
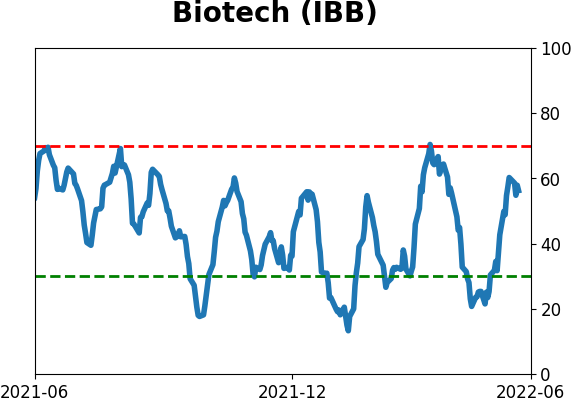
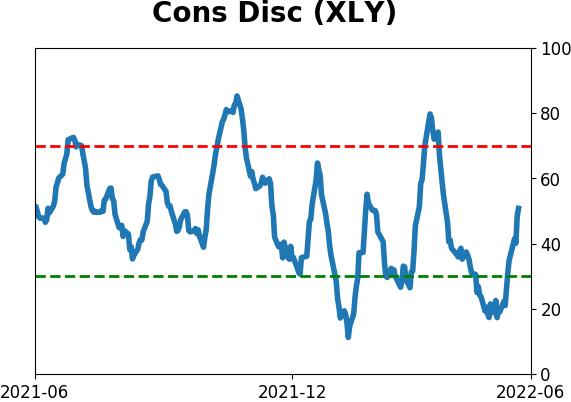
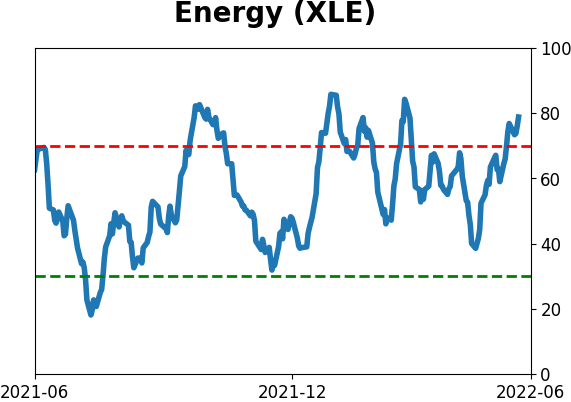
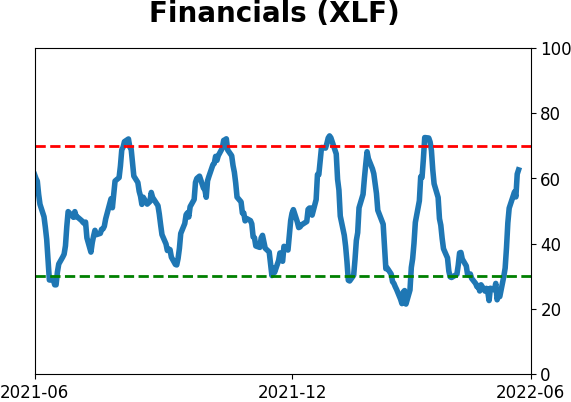
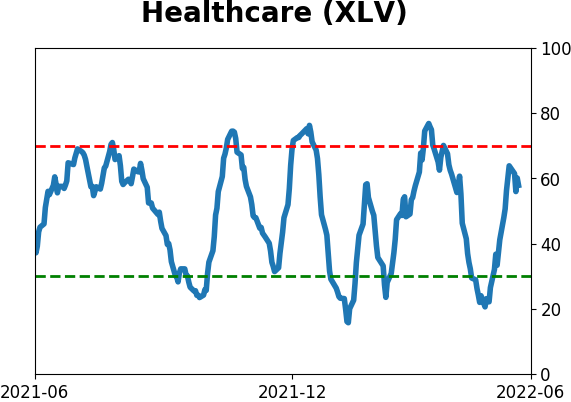
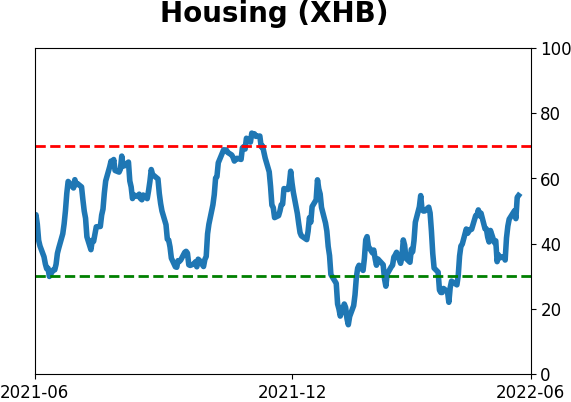
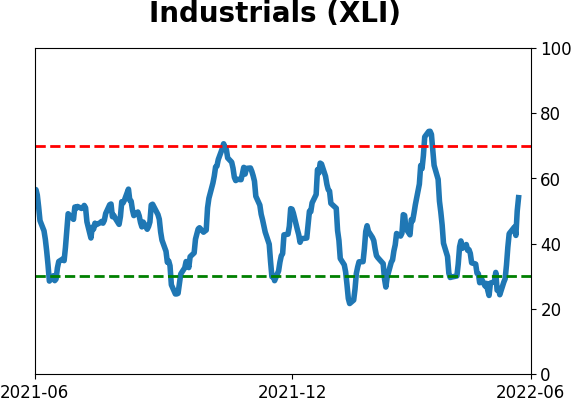
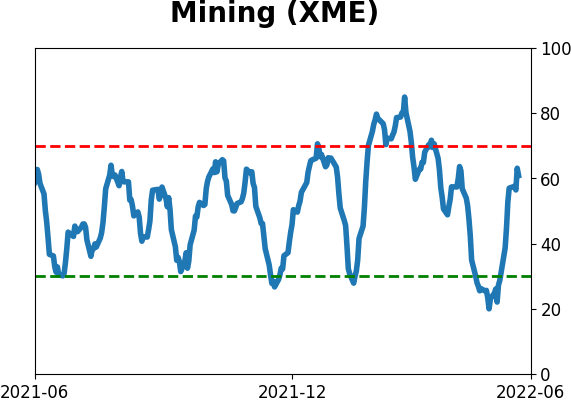
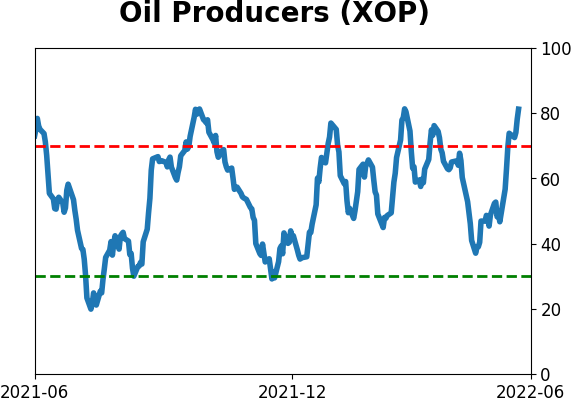
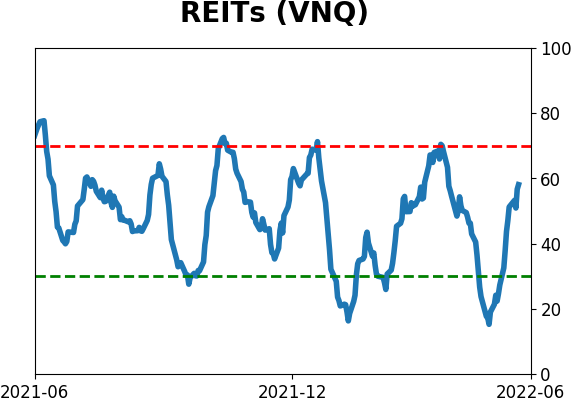
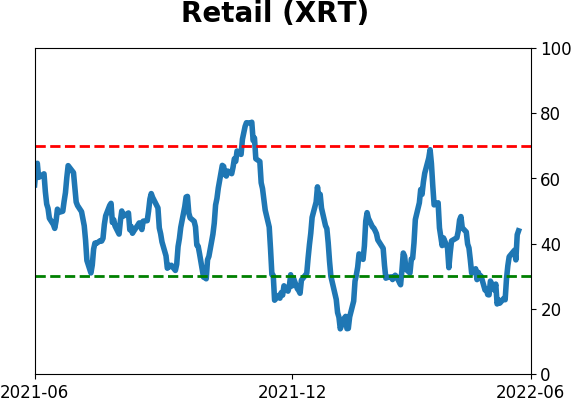
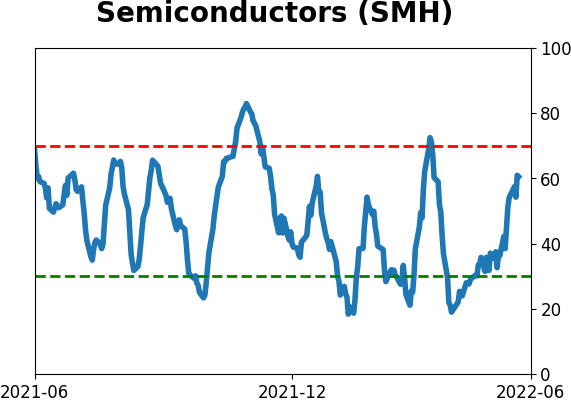
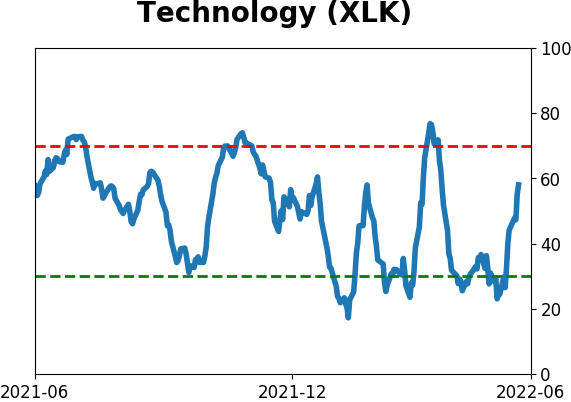
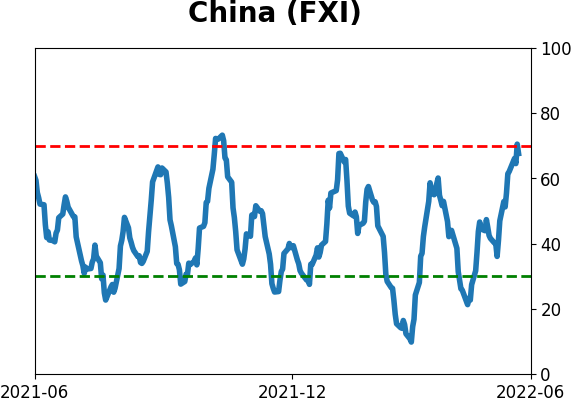
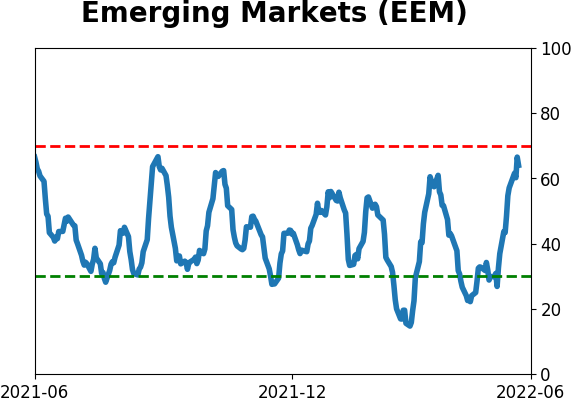
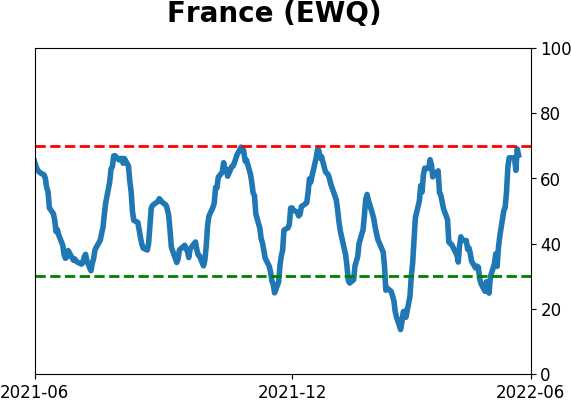
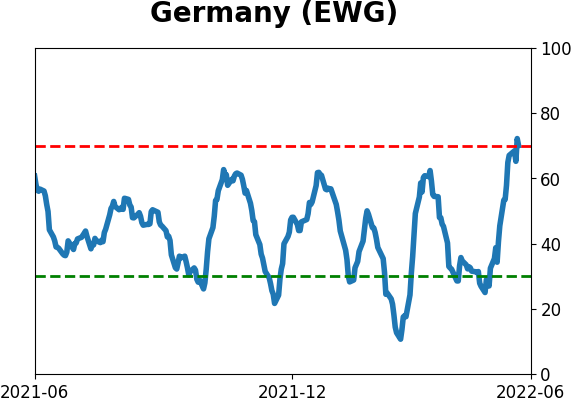
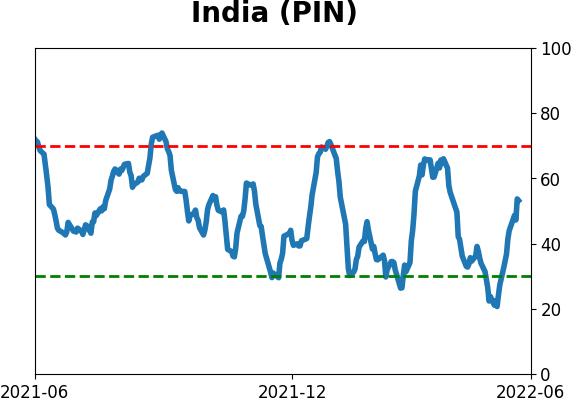
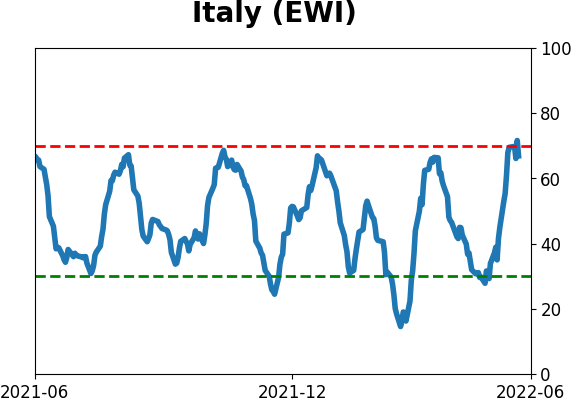
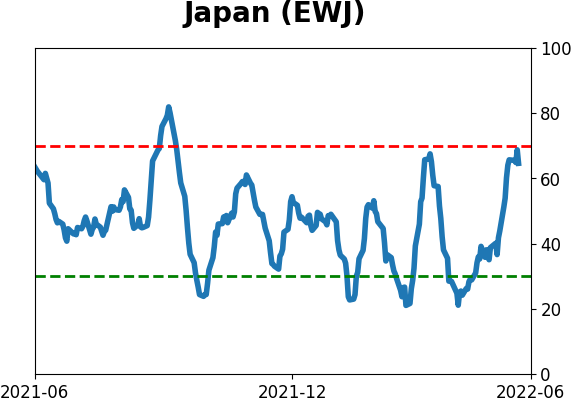
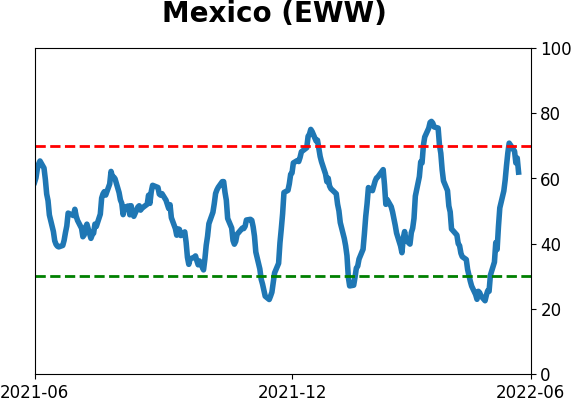
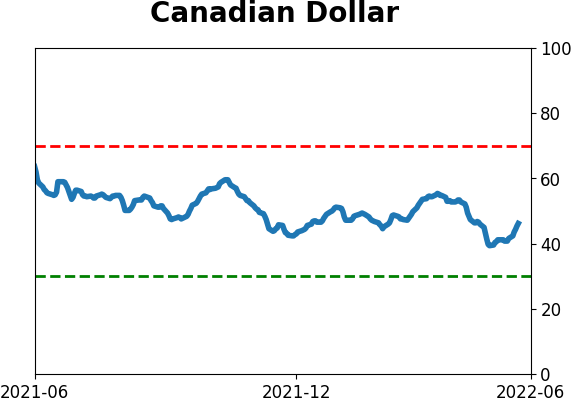
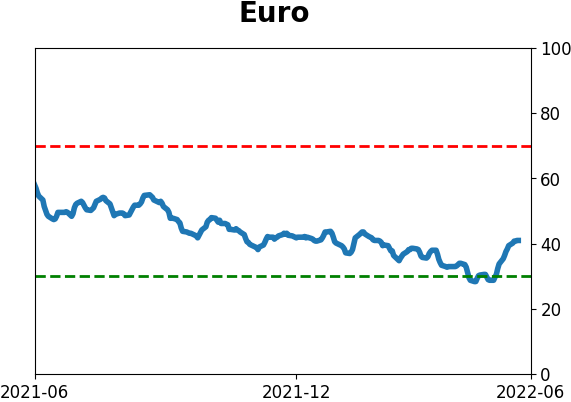
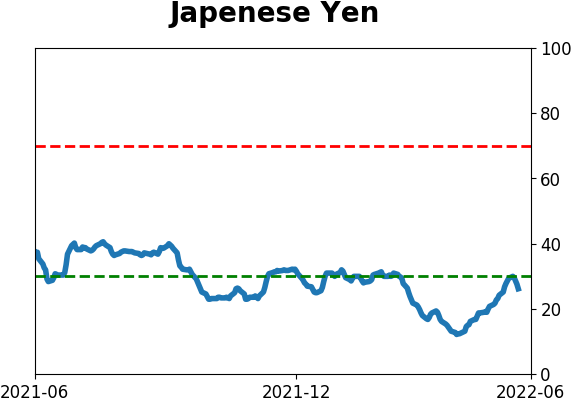
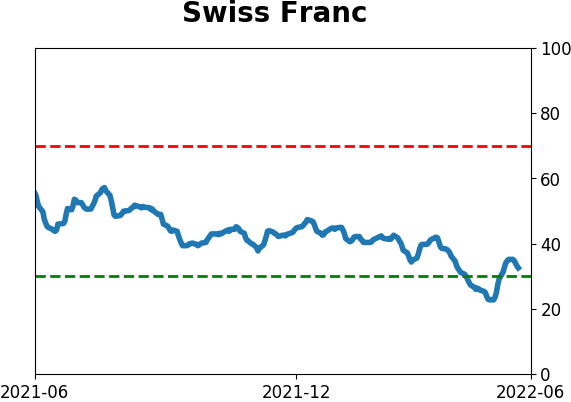
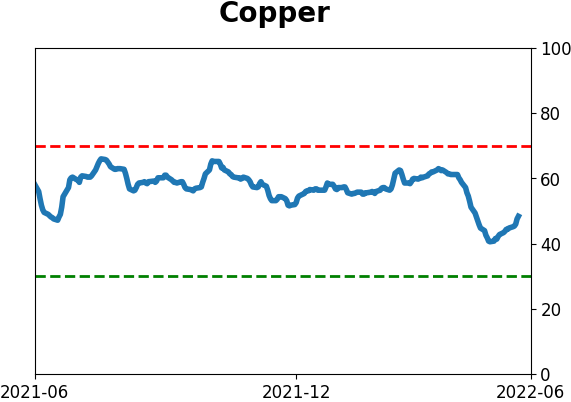
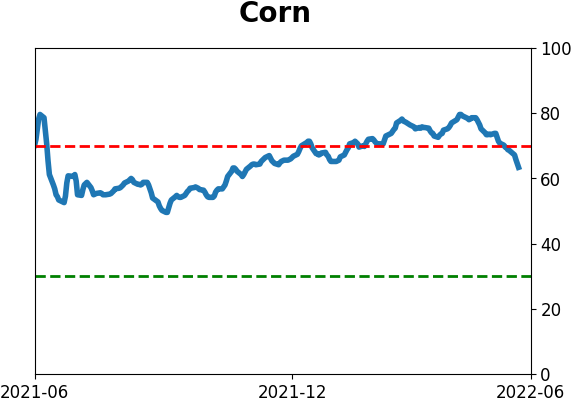
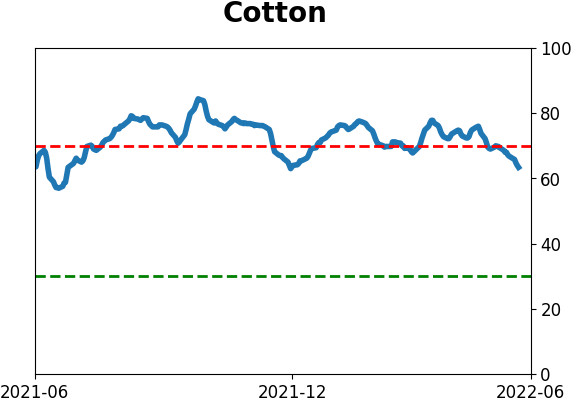
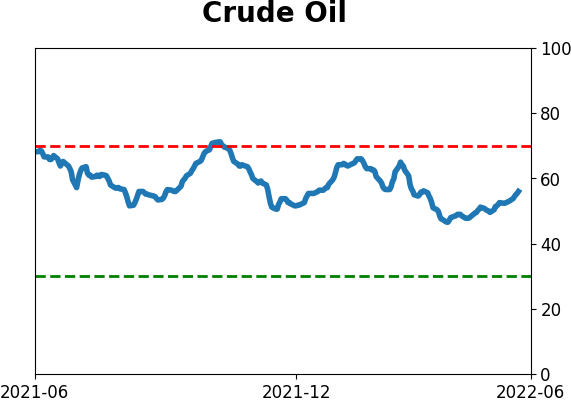
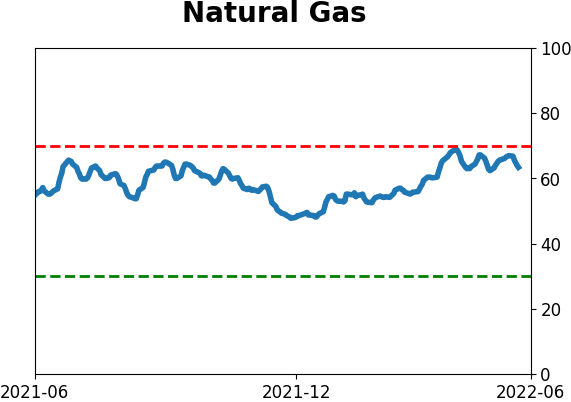
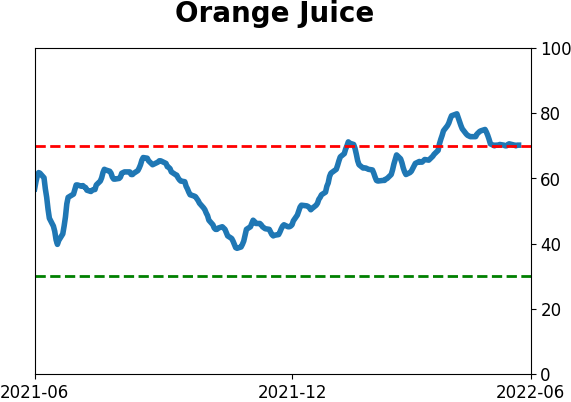
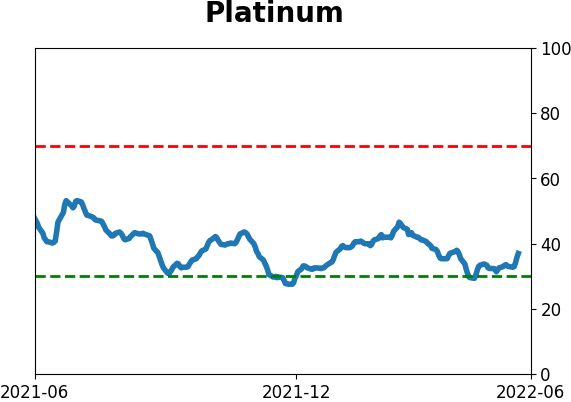
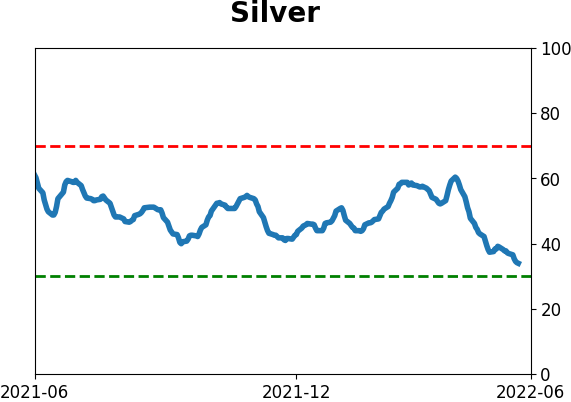
Optimism Index Thumbnails
|
|
|
|
|
|
|
|
|
|
|
|
|
|
|
|
|
|
|
|
|