Headlines
|
|
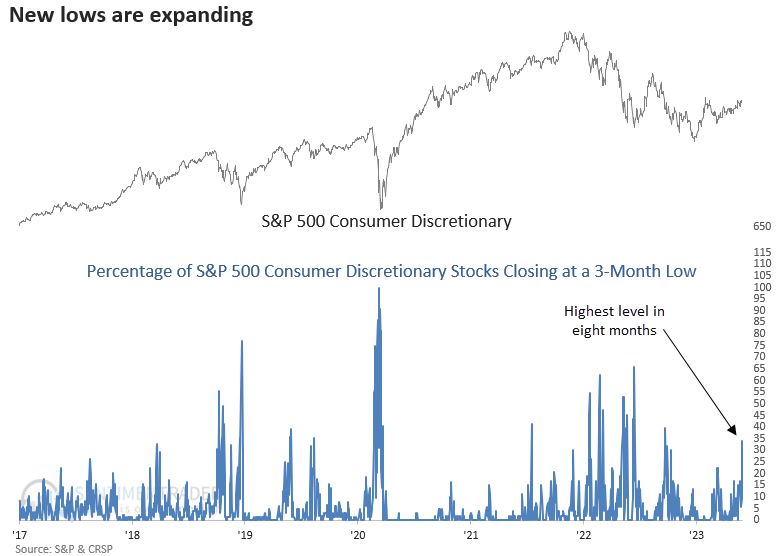
New lows are expanding in the Consumer Discretionary sector :
The percentage of 3-month lows in the Consumer Discretionary sector surged to the highest level in more than eight months, exceeding 30%. The increase in lows occurred within ten days of an index high. Similar conditions suggest the sector could be at risk of a corrective phase over the summer.
|
Smart / Dumb Money Confidence
|
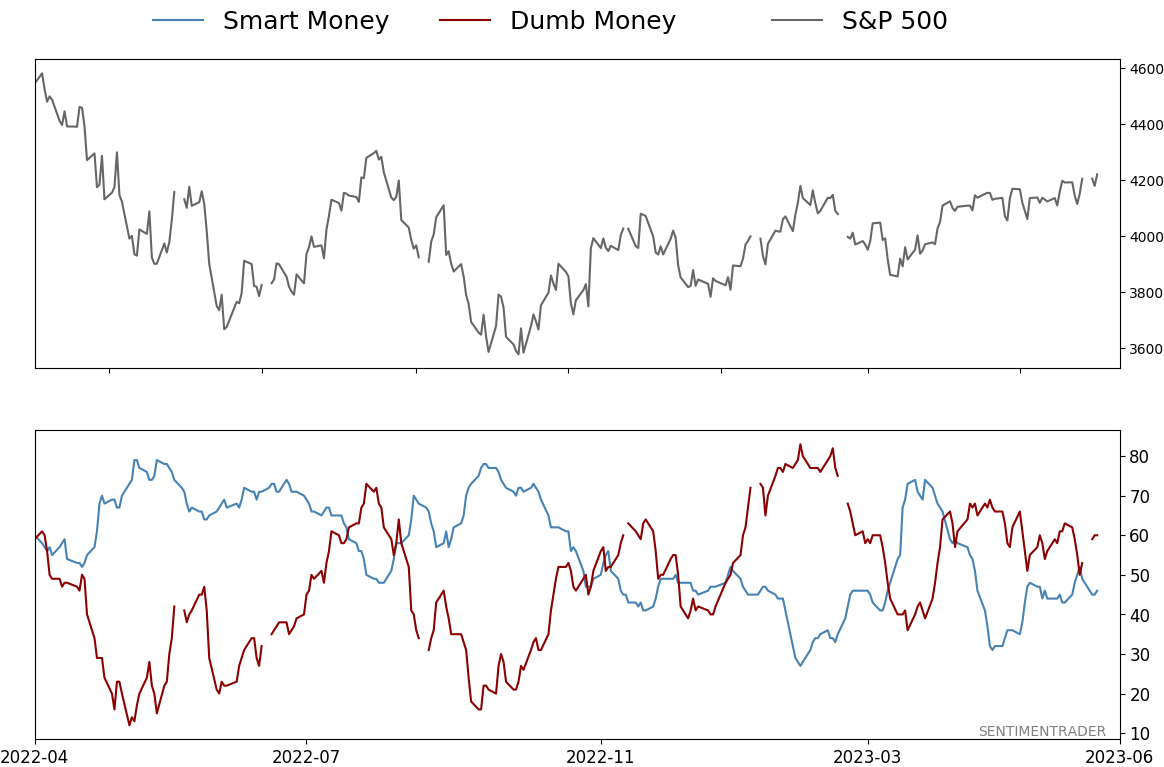
Smart Money Confidence: 46%
Dumb Money Confidence: 60%
|
|
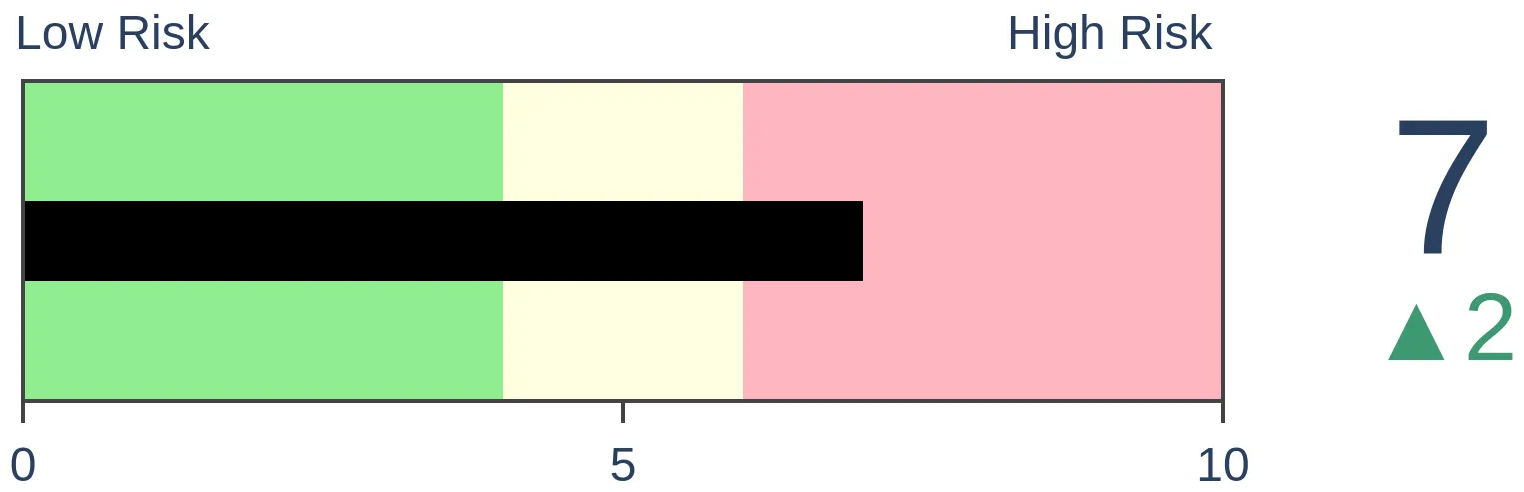
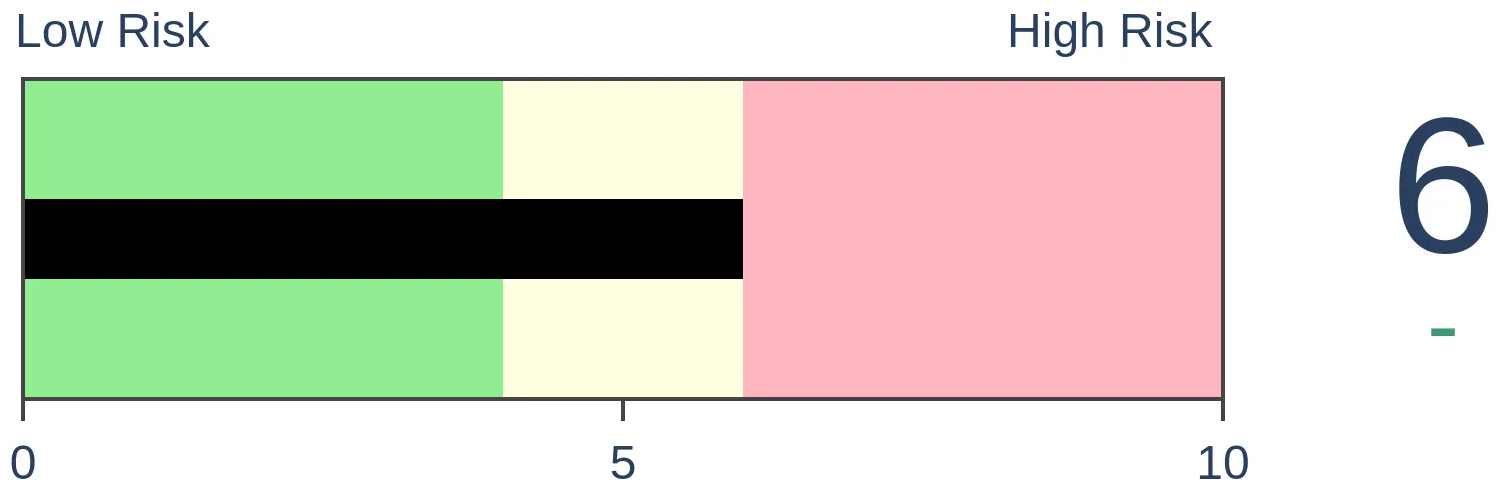
Risk Levels
Stocks Short-Term
|
Stocks Medium-Term
|
|
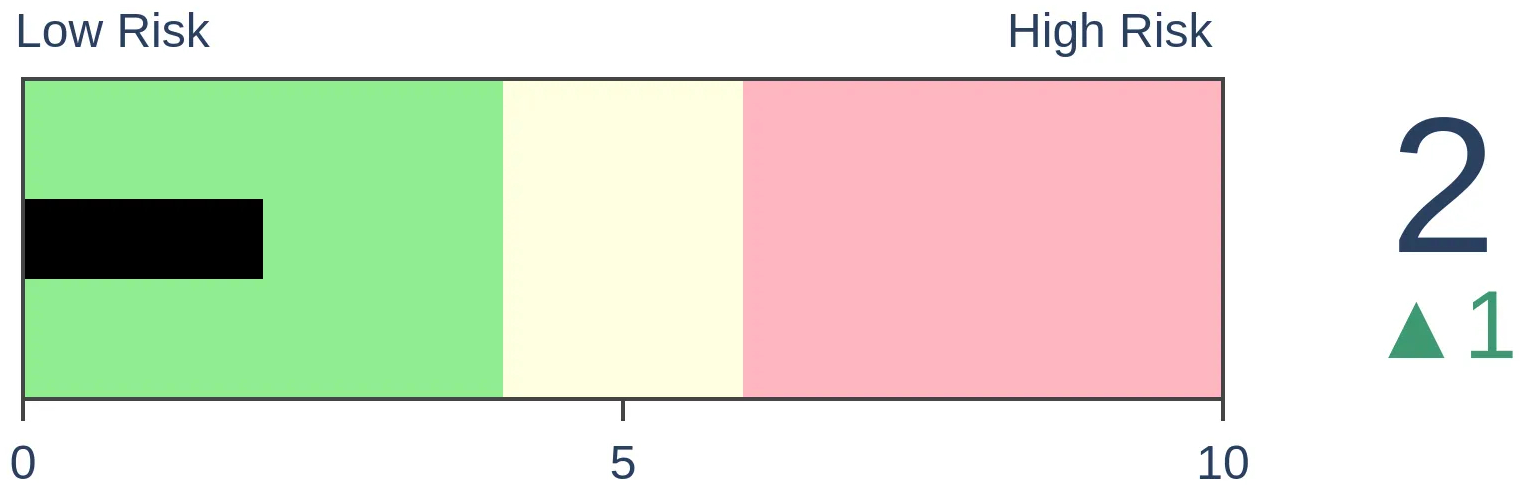
Bonds
|
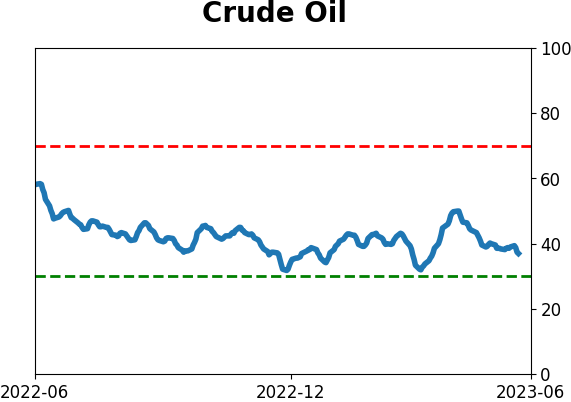
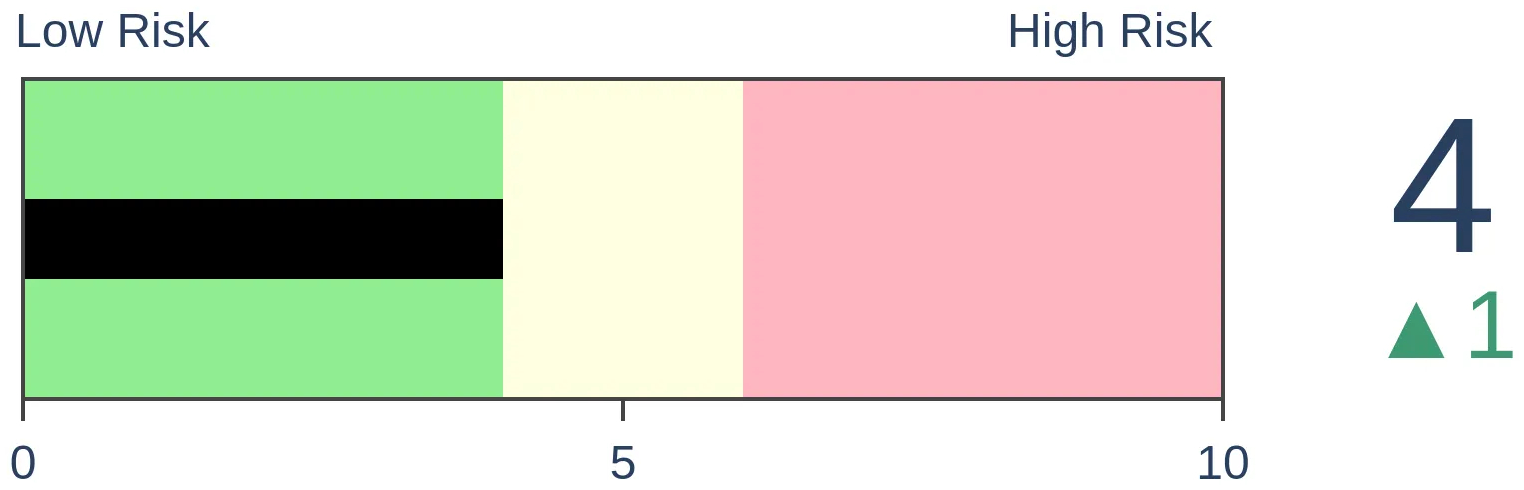
Crude Oil
|
|
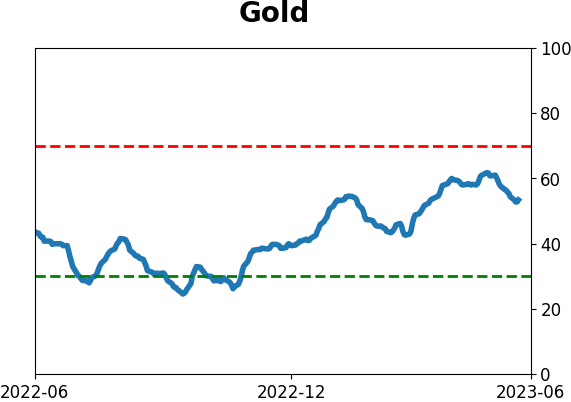
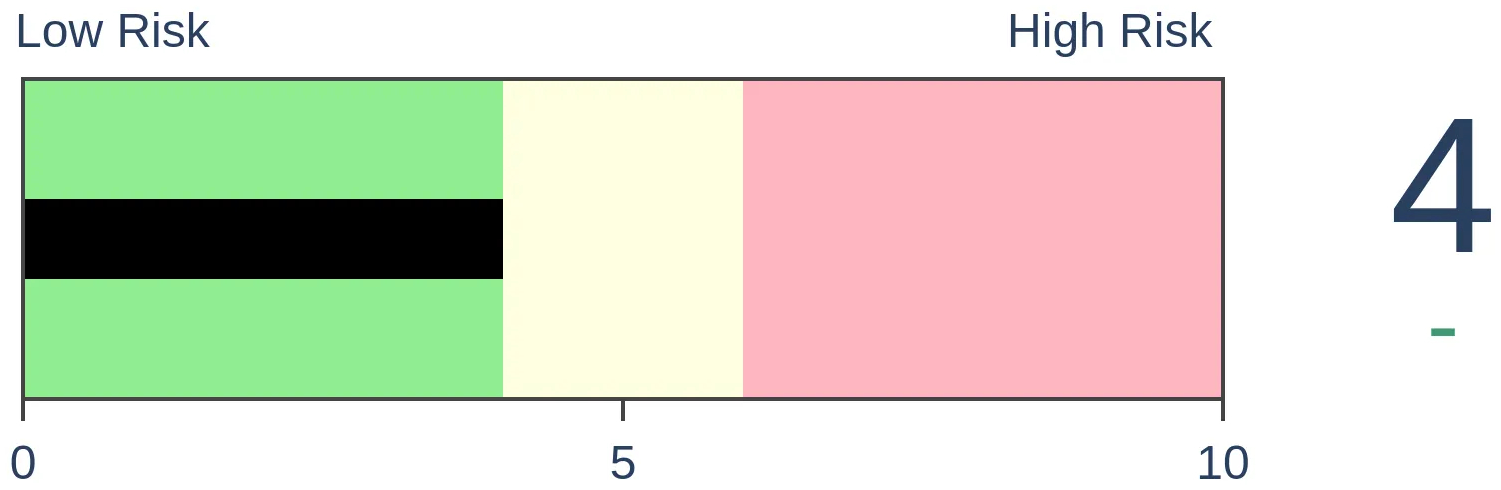
Gold
|
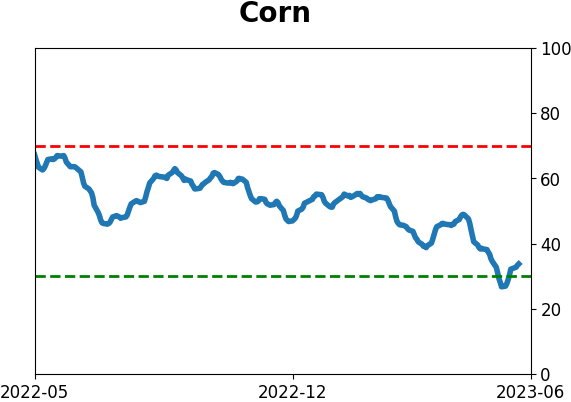
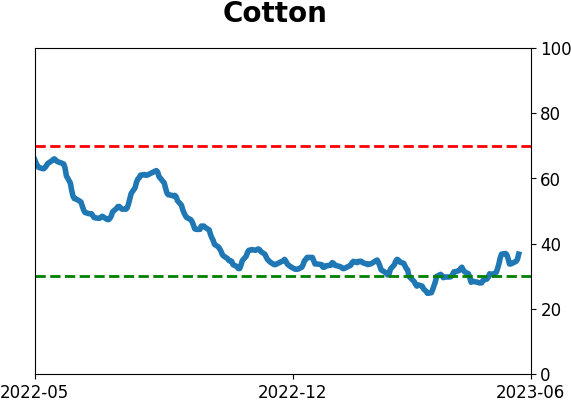
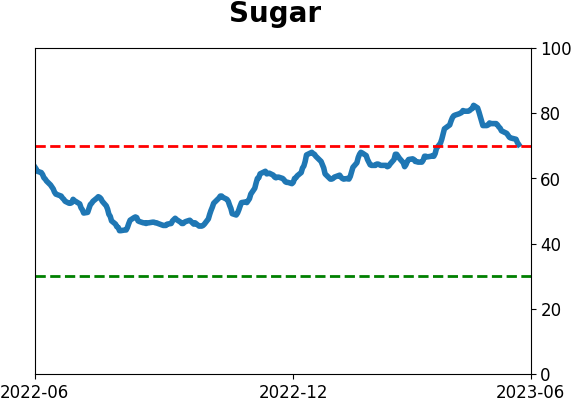
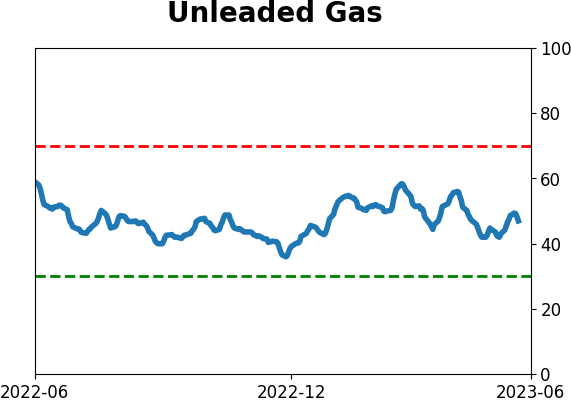
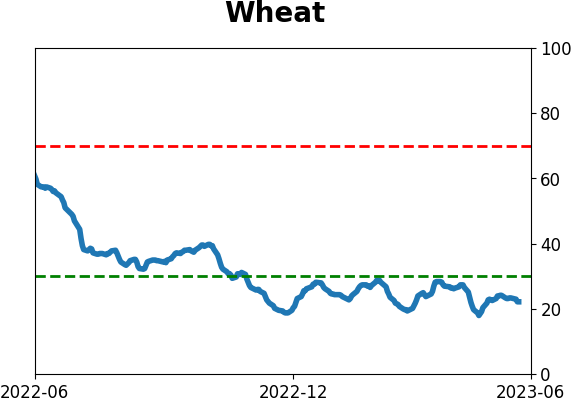
Agriculture
|
|
Research
By Dean Christians
BOTTOM LINE
The percentage of 3-month lows in the Consumer Discretionary sector surged to the highest level in more than eight months, exceeding 30%. The increase in lows occurred within ten days of an index high. Similar conditions suggest the sector could be at risk of a corrective phase over the summer.
FORECAST / TIMEFRAME
None
|
Key points:
- The percentage of 3-month lows in the Discretionary sector exceeded 30% within ten days of a high
- Similar expansions in 3-month lows near a high preceded negative returns a month later
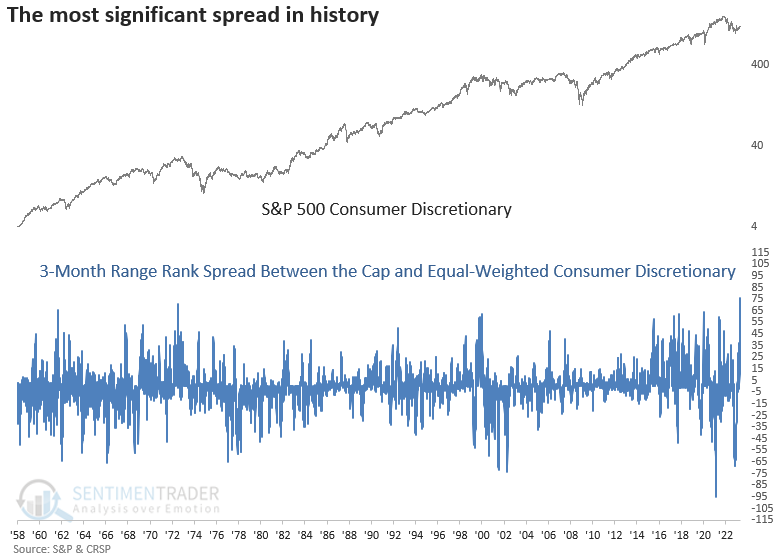
- The cap and equal-weighted Discretionary sectors are diverging by the most significant amount in history
New lows are one of the most critical market breadth indicators to monitor
The percentage of 3-month lows for stocks in the S&P 500 Consumer Discretionary sector increased to 33% on Wednesday. The expansion in new lows occurred one trading session after a 1-month high in the sector, which has only happened two other times in history.
The expansion in new lows so close to a high provides additional evidence of a split market whereby cap-weighted indexes say one thing, as stocks within the index say something else. Sometimes the divergence leads to a corrective phase, while other times, it resolves itself via a catch-up trade by the laggards.
To capture a larger sample size, I lowered the threshold for new lows from 33% to 30% and increased the days since high condition to ten sessions.
Similar expansions in new lows near a high preceded negative returns
When the percentage of 3-month lows expands above 30% within ten days of a high, the S&P 500 Consumer Discretionary sector struggles. Over the next month, the sector was lower 71% of the time. The two and three-month horizons suggest a stagnant environment over the summer.
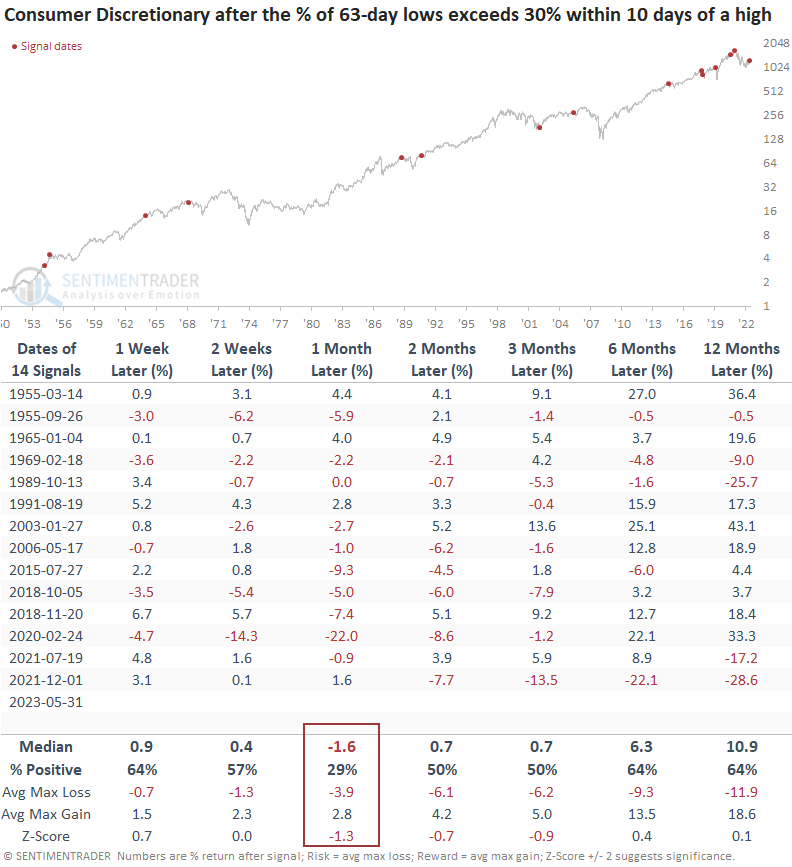
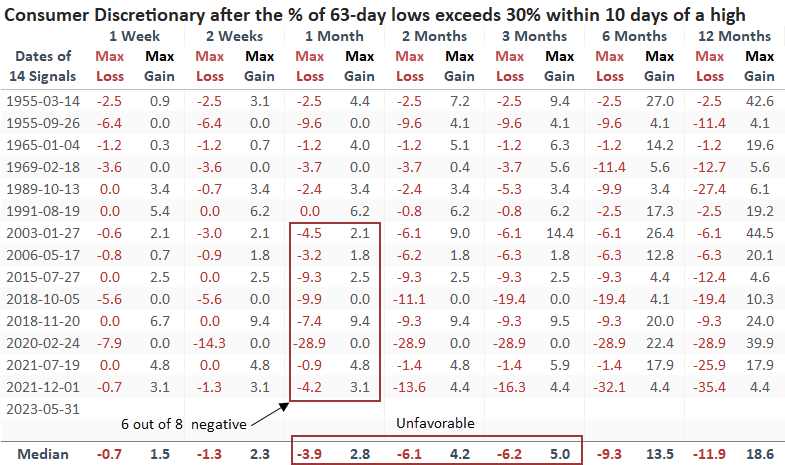
The max loss exceeds the max gain in six out of the last eight precedents. And the median max loss exceeds the median max gain from one to three months later.
Why are 3-month lows expanding
The average stock within the Consumer Discretionary sector is doing much worse than the cap-weighted index would have you believe. When I measure the range over the last three months, the cap-weighted index ranks in the 91st percentile. That means today's close exceeds 91% of all closing prices over the previous three months. In contrast, the equal-weighted Discretionary index closed in the 15th percentile. So, the range divergence is significant.
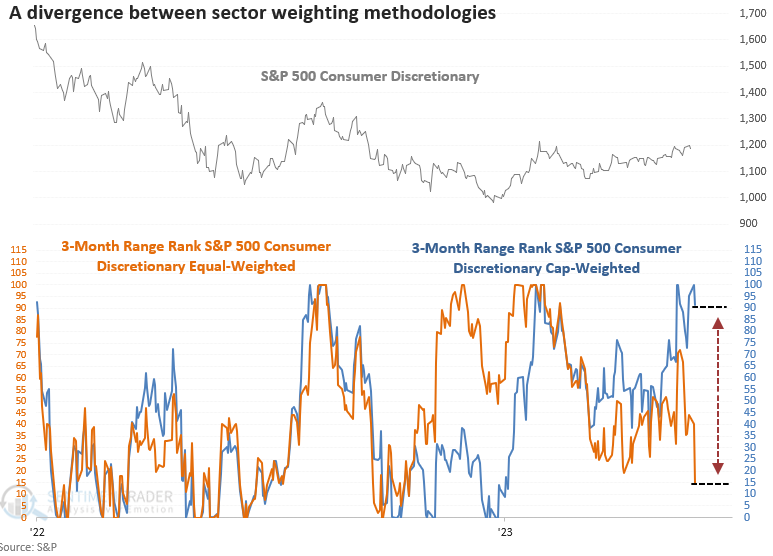
Suppose I measure the difference between the 3-month range rank for the cap and equal-weighted Discretionary indexes. In that case, the spread exceeded 76%, the highest level in history.
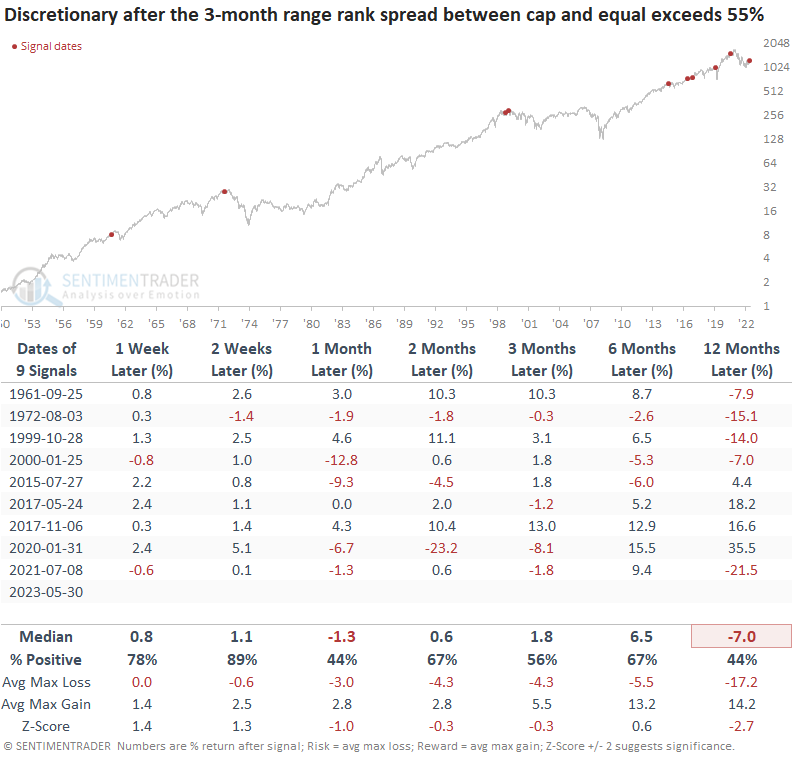
We get a mixed message when the range rank spread exceeds 55%. In the near term, the cap-weighted index could rally over the next few weeks. However, a month later, it was negative. Most divergences have occurred since 2015, capturing the impact of Telsa and Amazon.
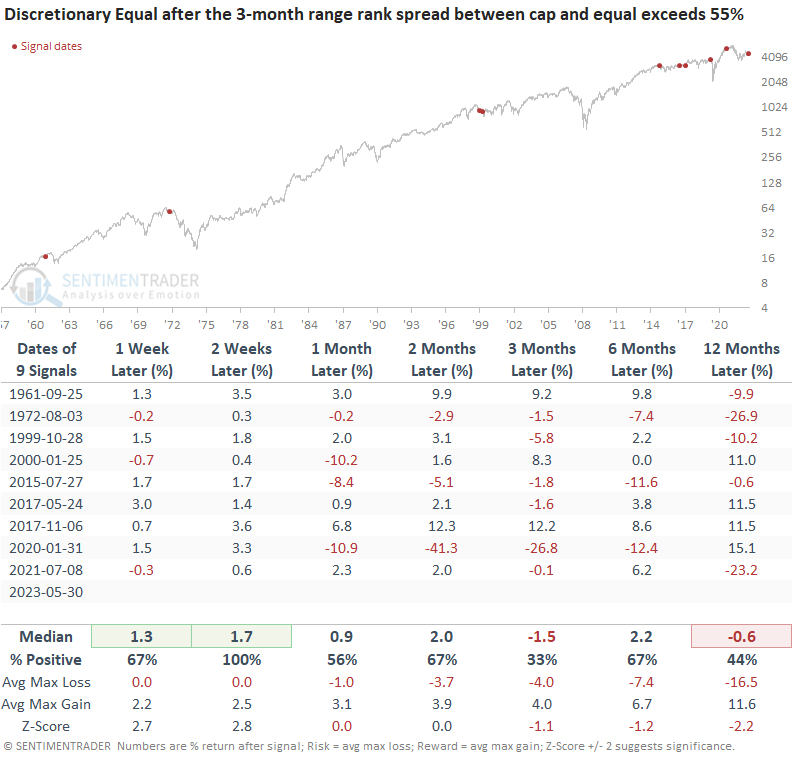
The equal-weighted Consumer Discretionary sector shows somewhat similar results-a near-term rally followed by lackluster results over a medium-term horizon.
What the research tells us...
New lows are a critical breadth-based indicator to monitor in bull or bear phases. Typically, an expansion in lows is an unwelcome development, which is why the TCTM Composite Risk Warning Model contains several components that incorporate this type of indicator. With the percentage of S&P 500 Consumer Discretionary sector stocks registering a 3-month low exceeding 30% within ten days of a high, the sector is at risk of a corrective phase over the next month and potentially flat returns this summer. Over the last three months, the price range between the cap and equal-weighted Discretionary indexes reached a historic level, indicating a split market with a mixed outlook.
Indicators at Extremes
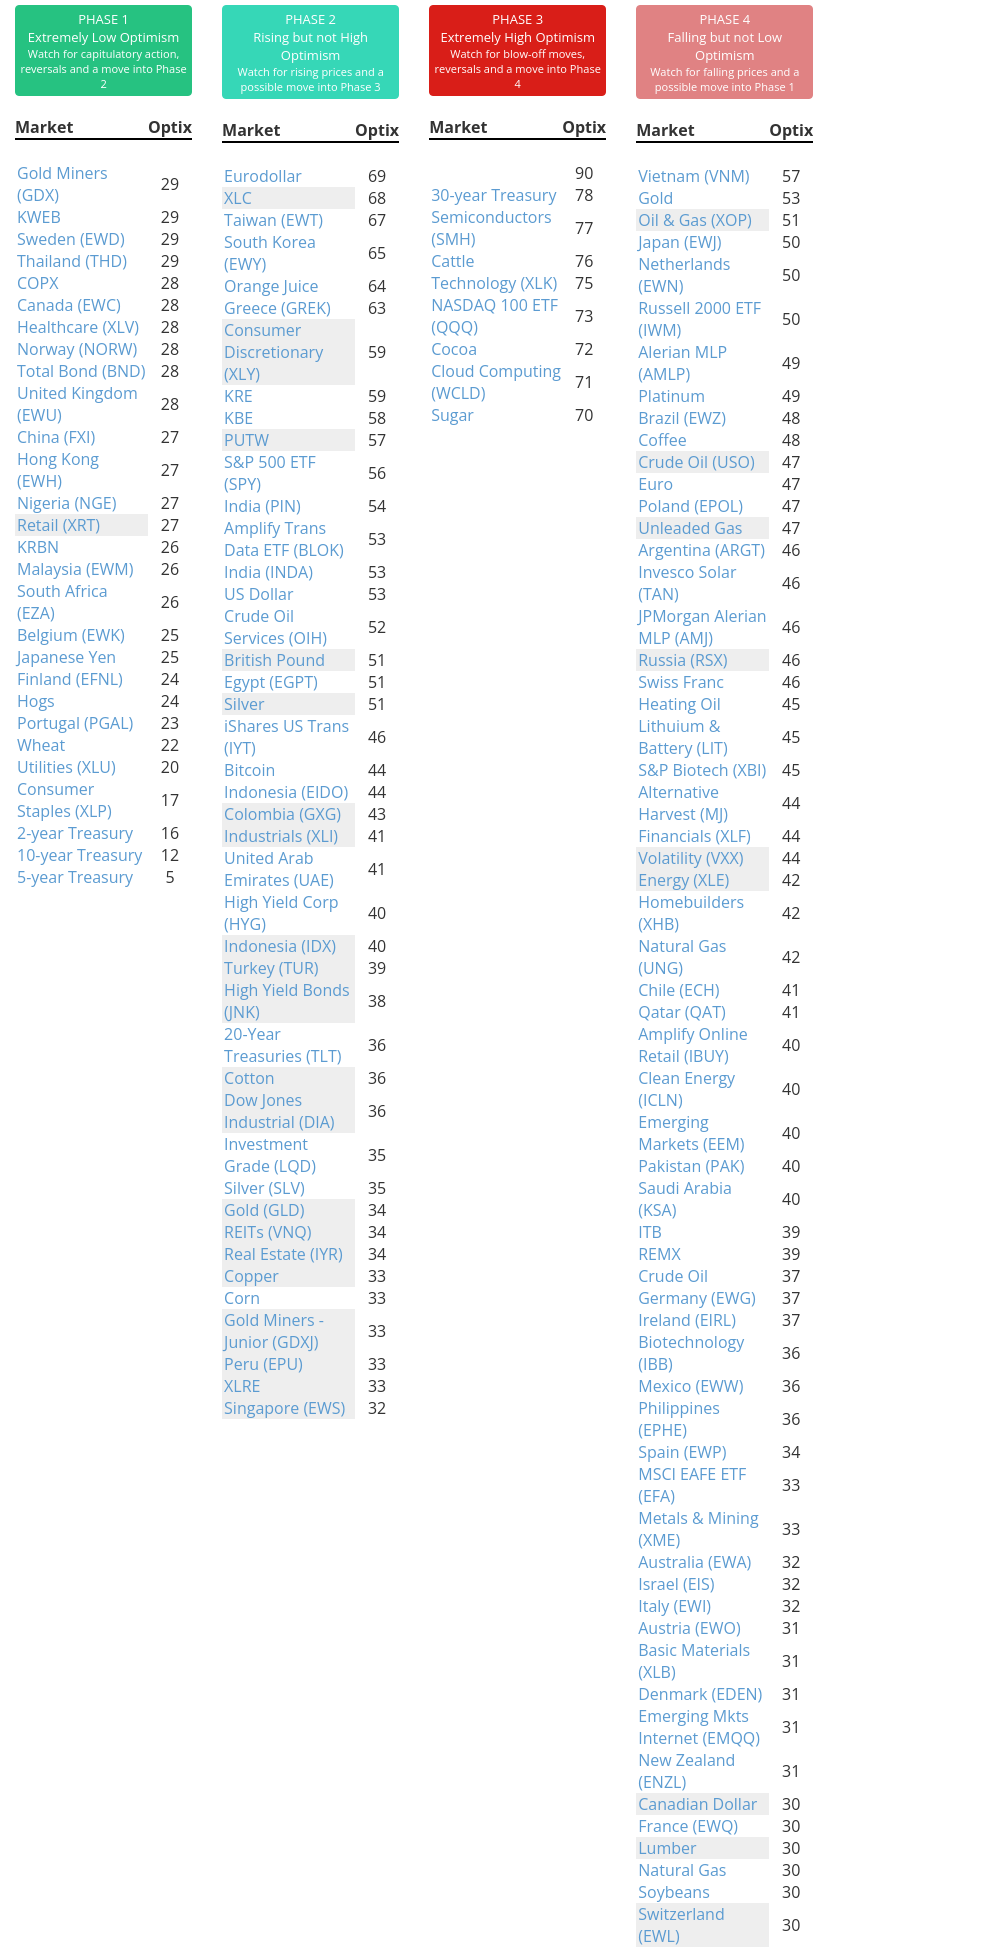
Phase Table
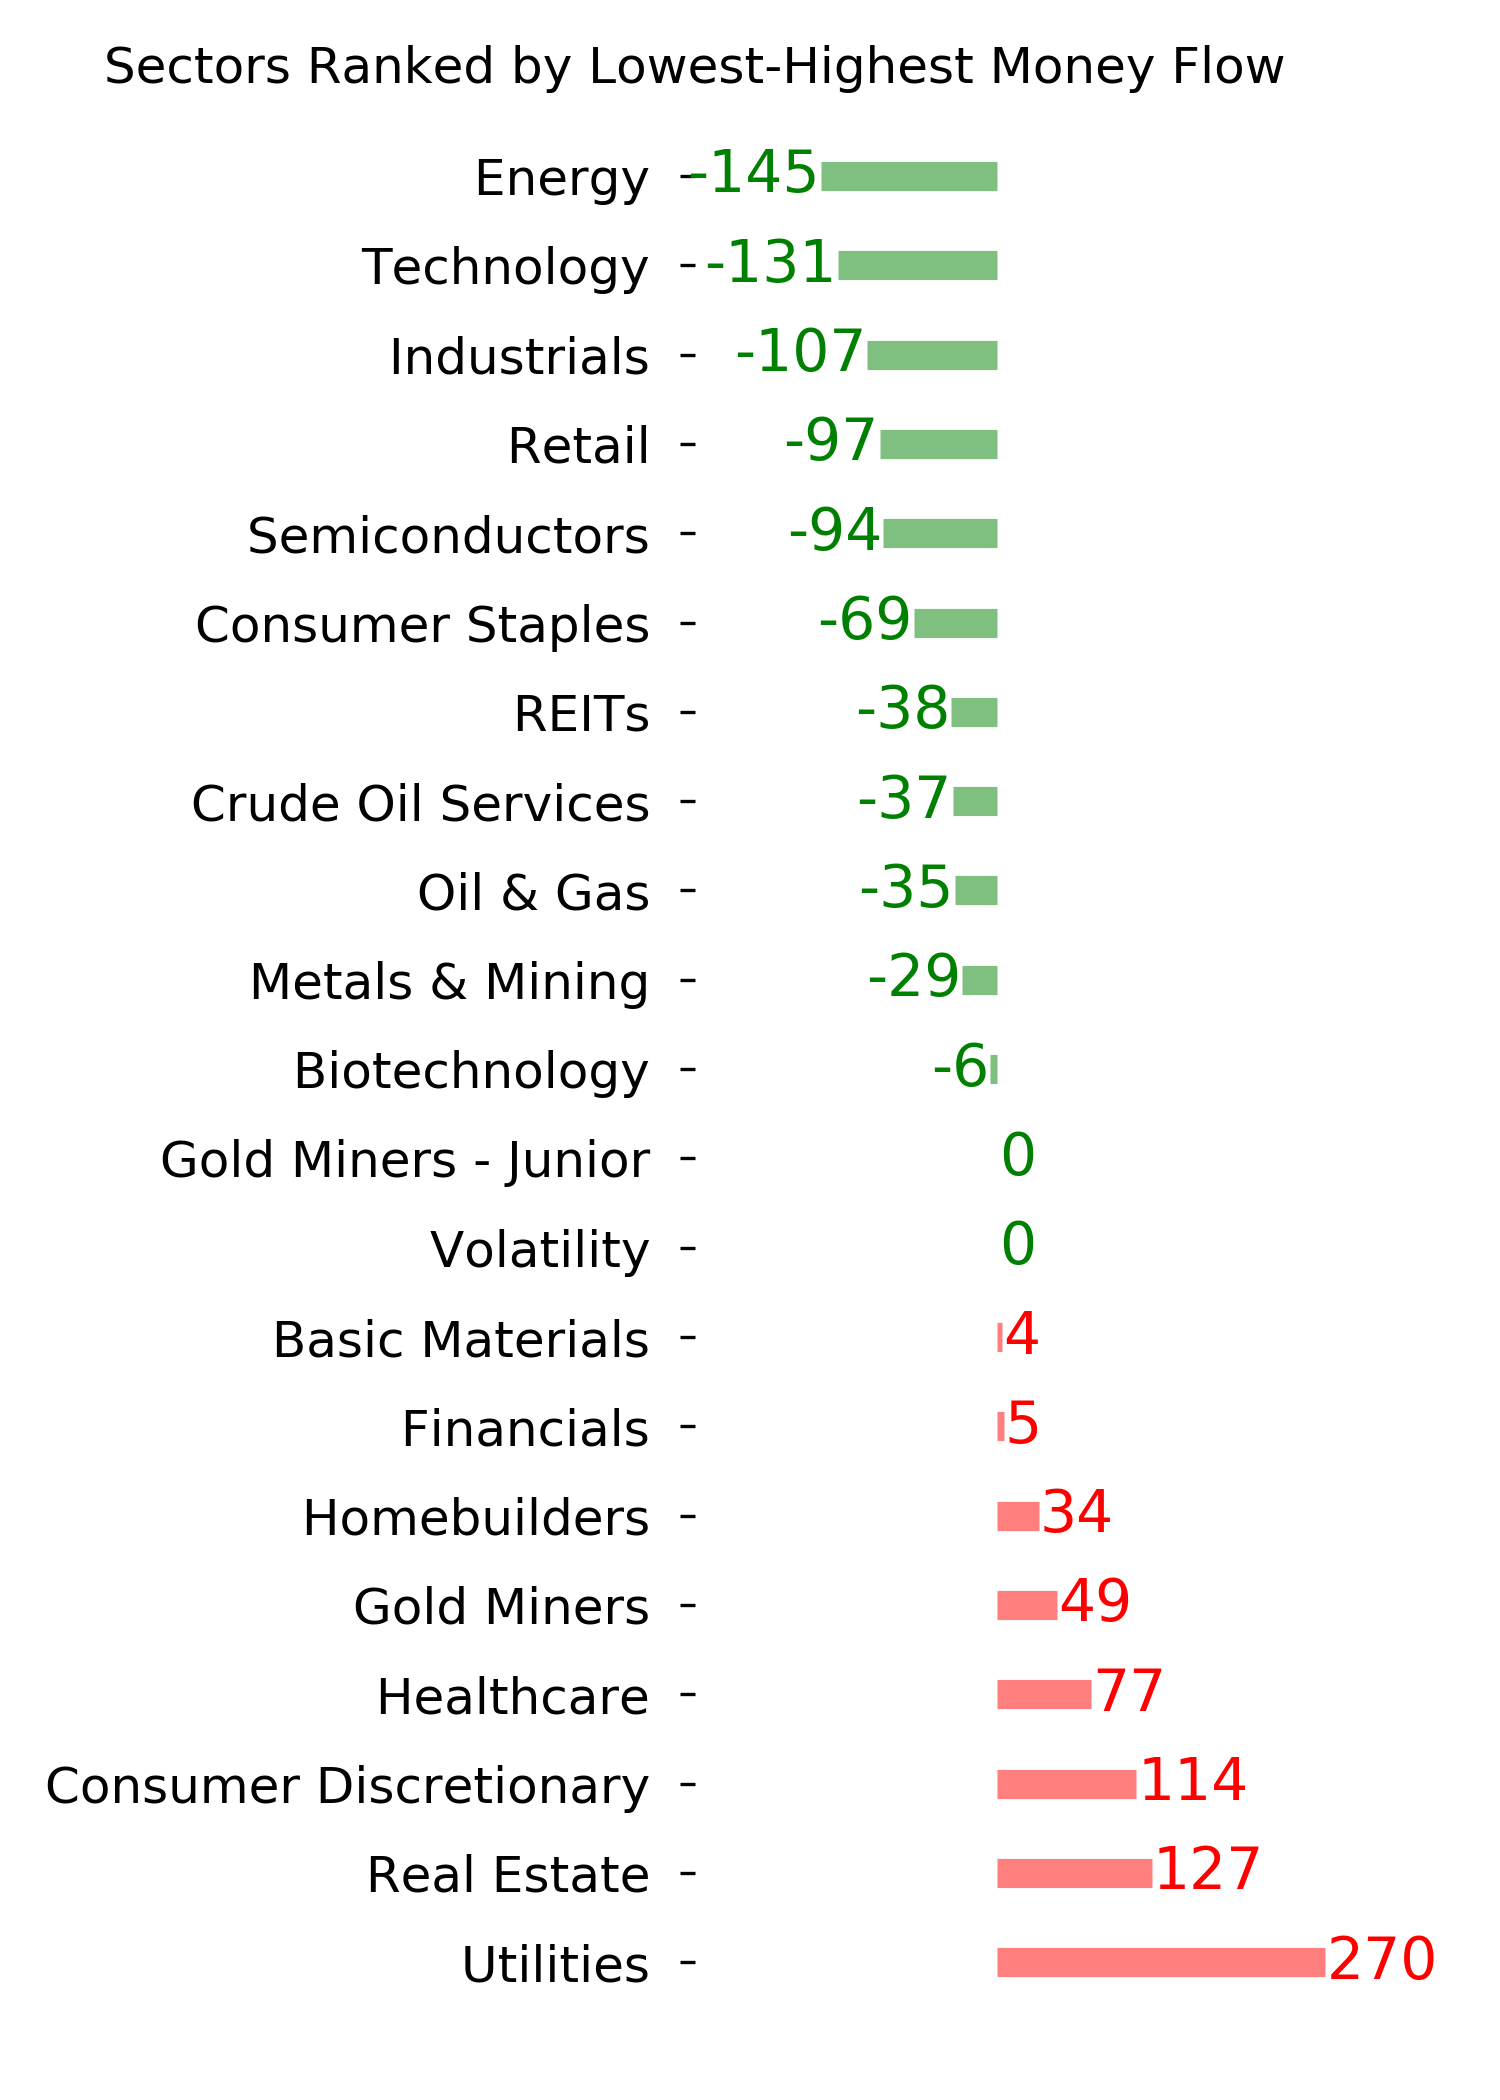
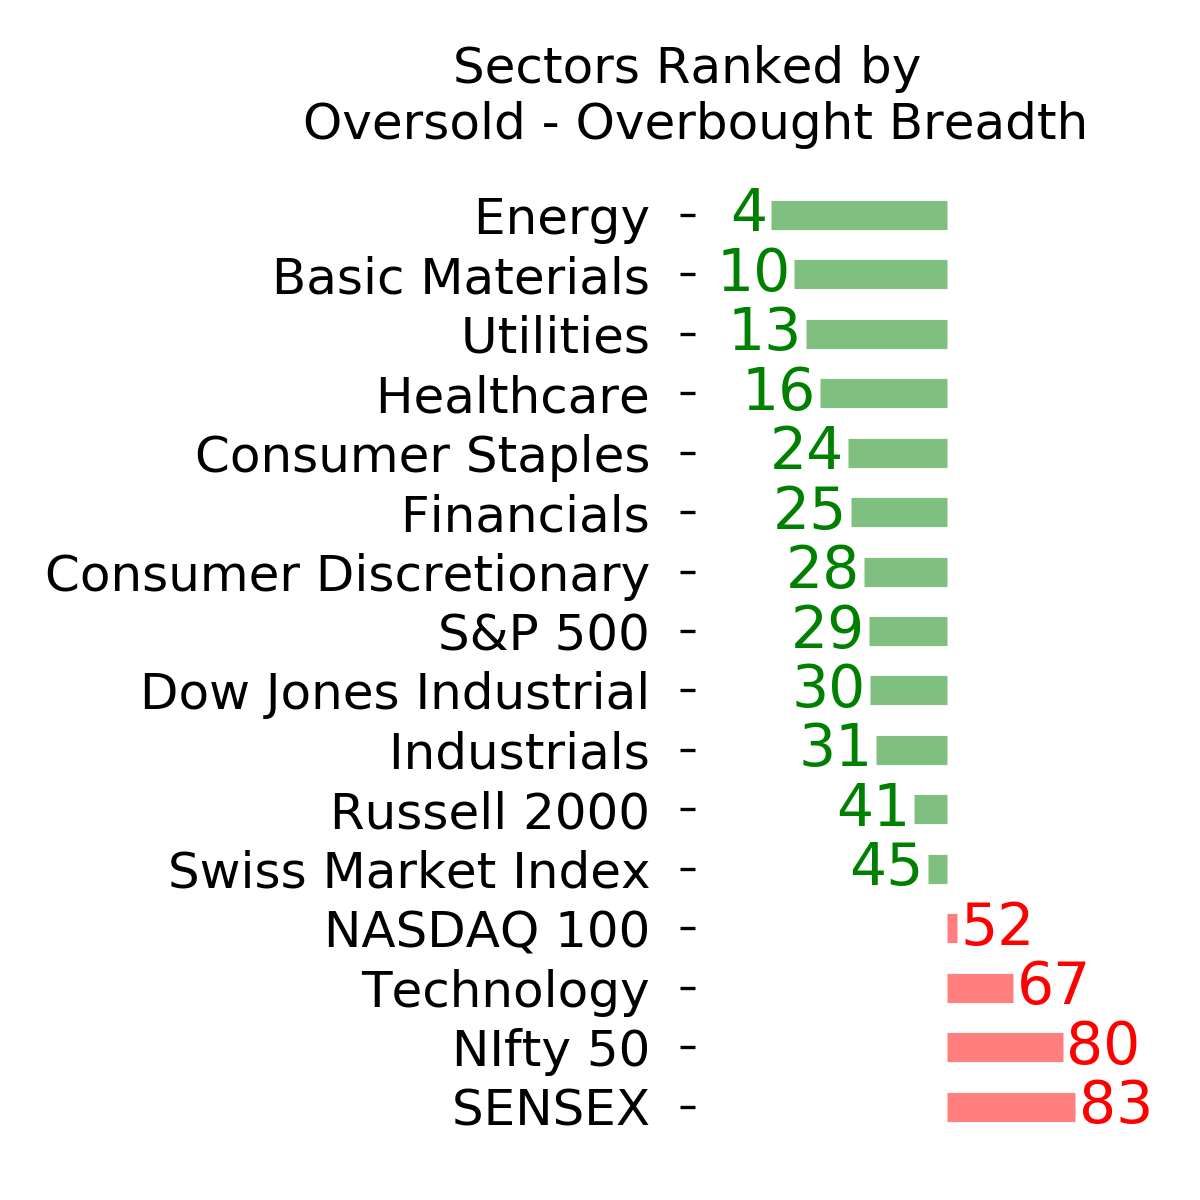
Ranks
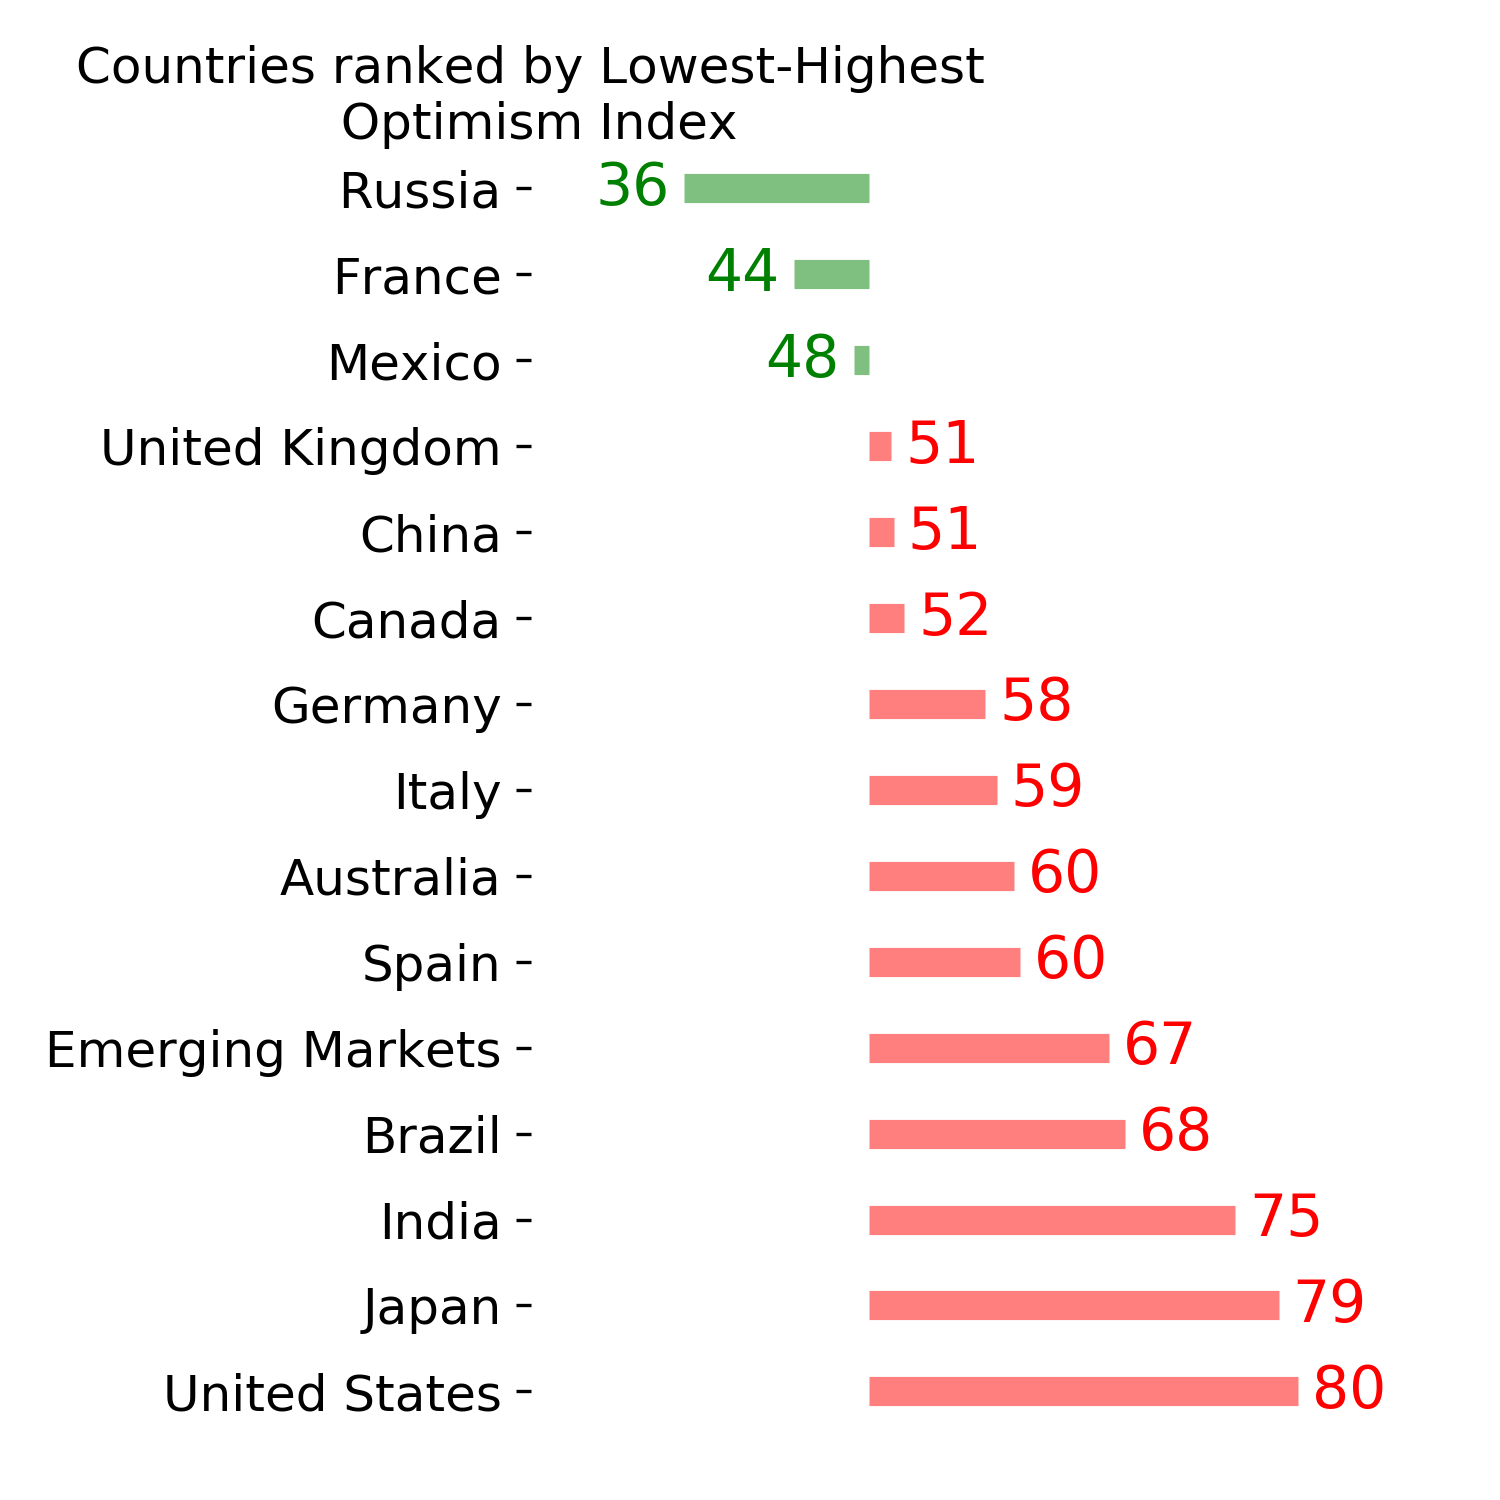
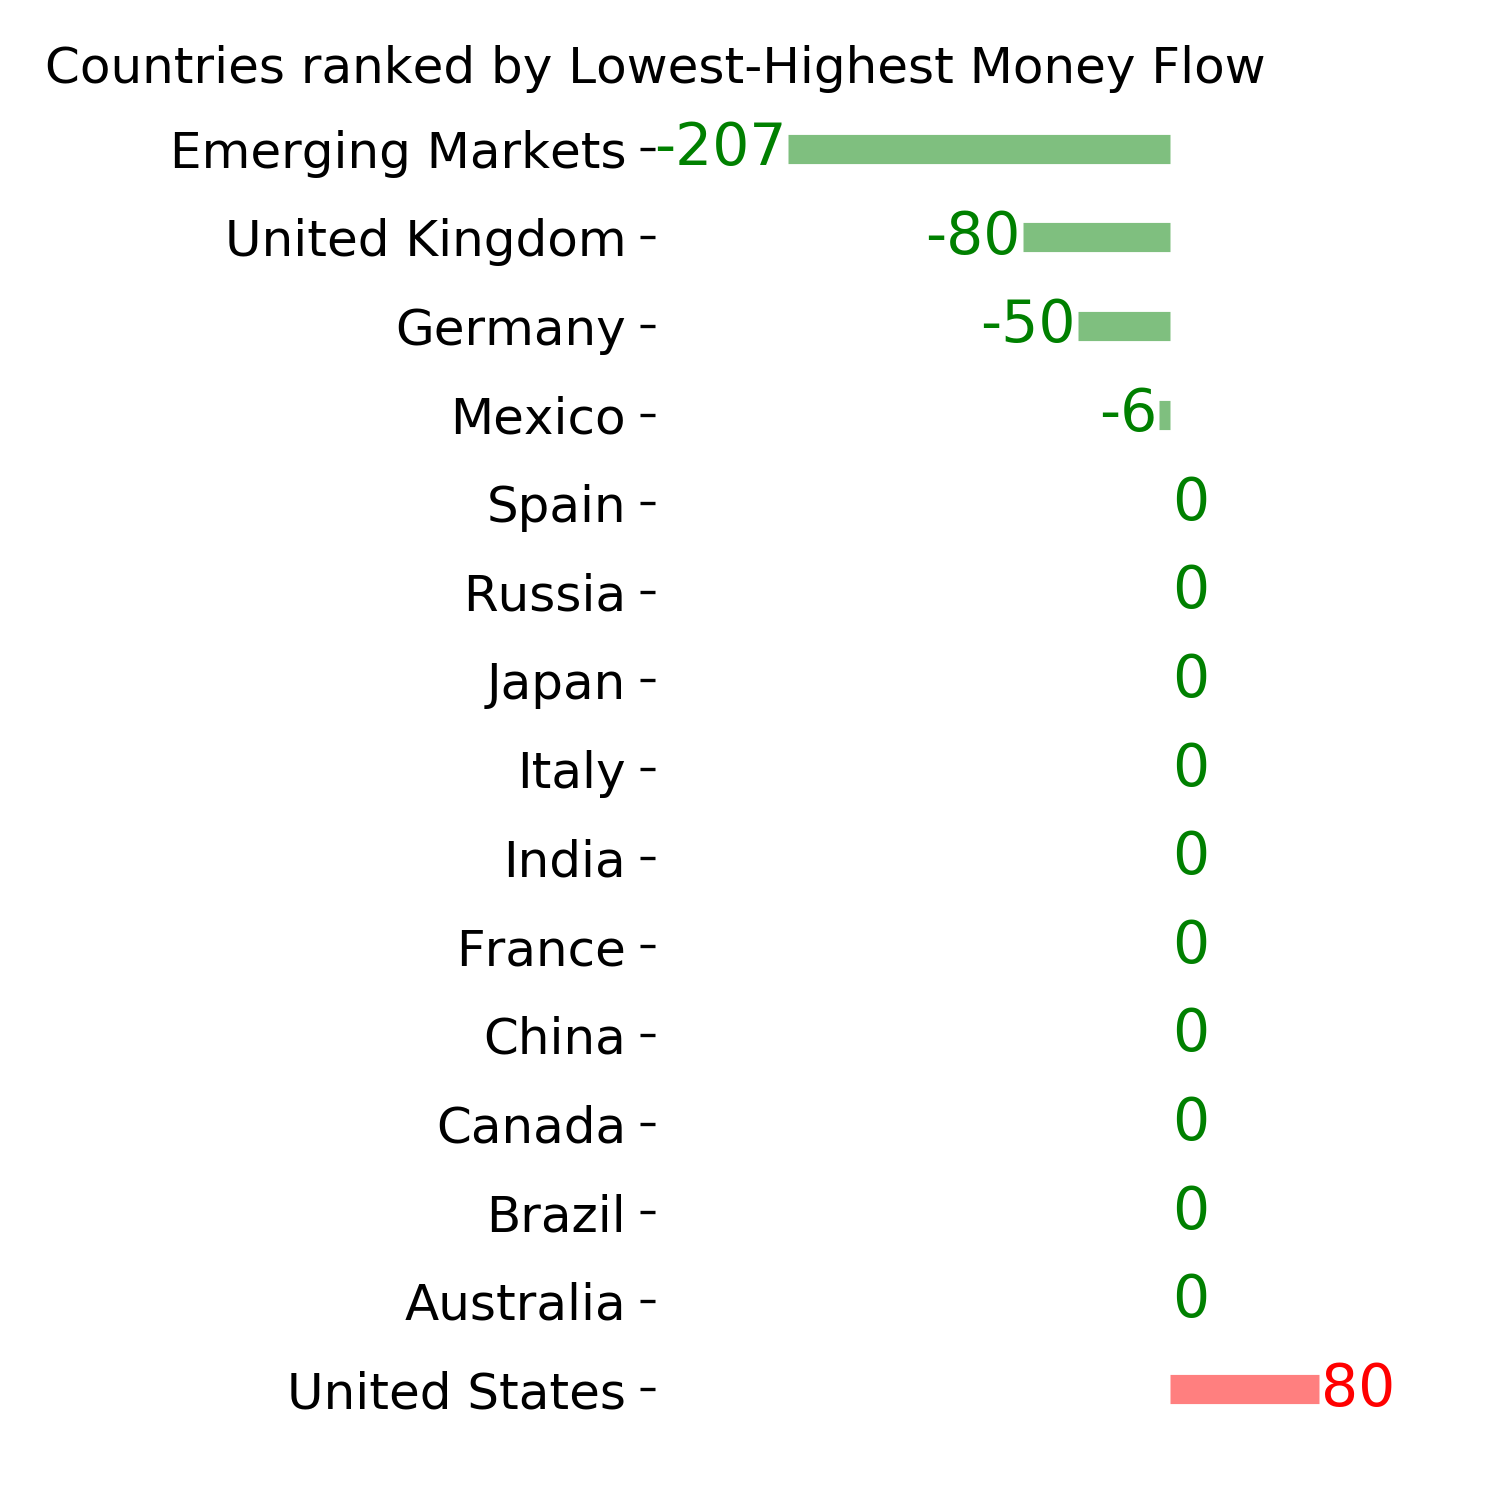
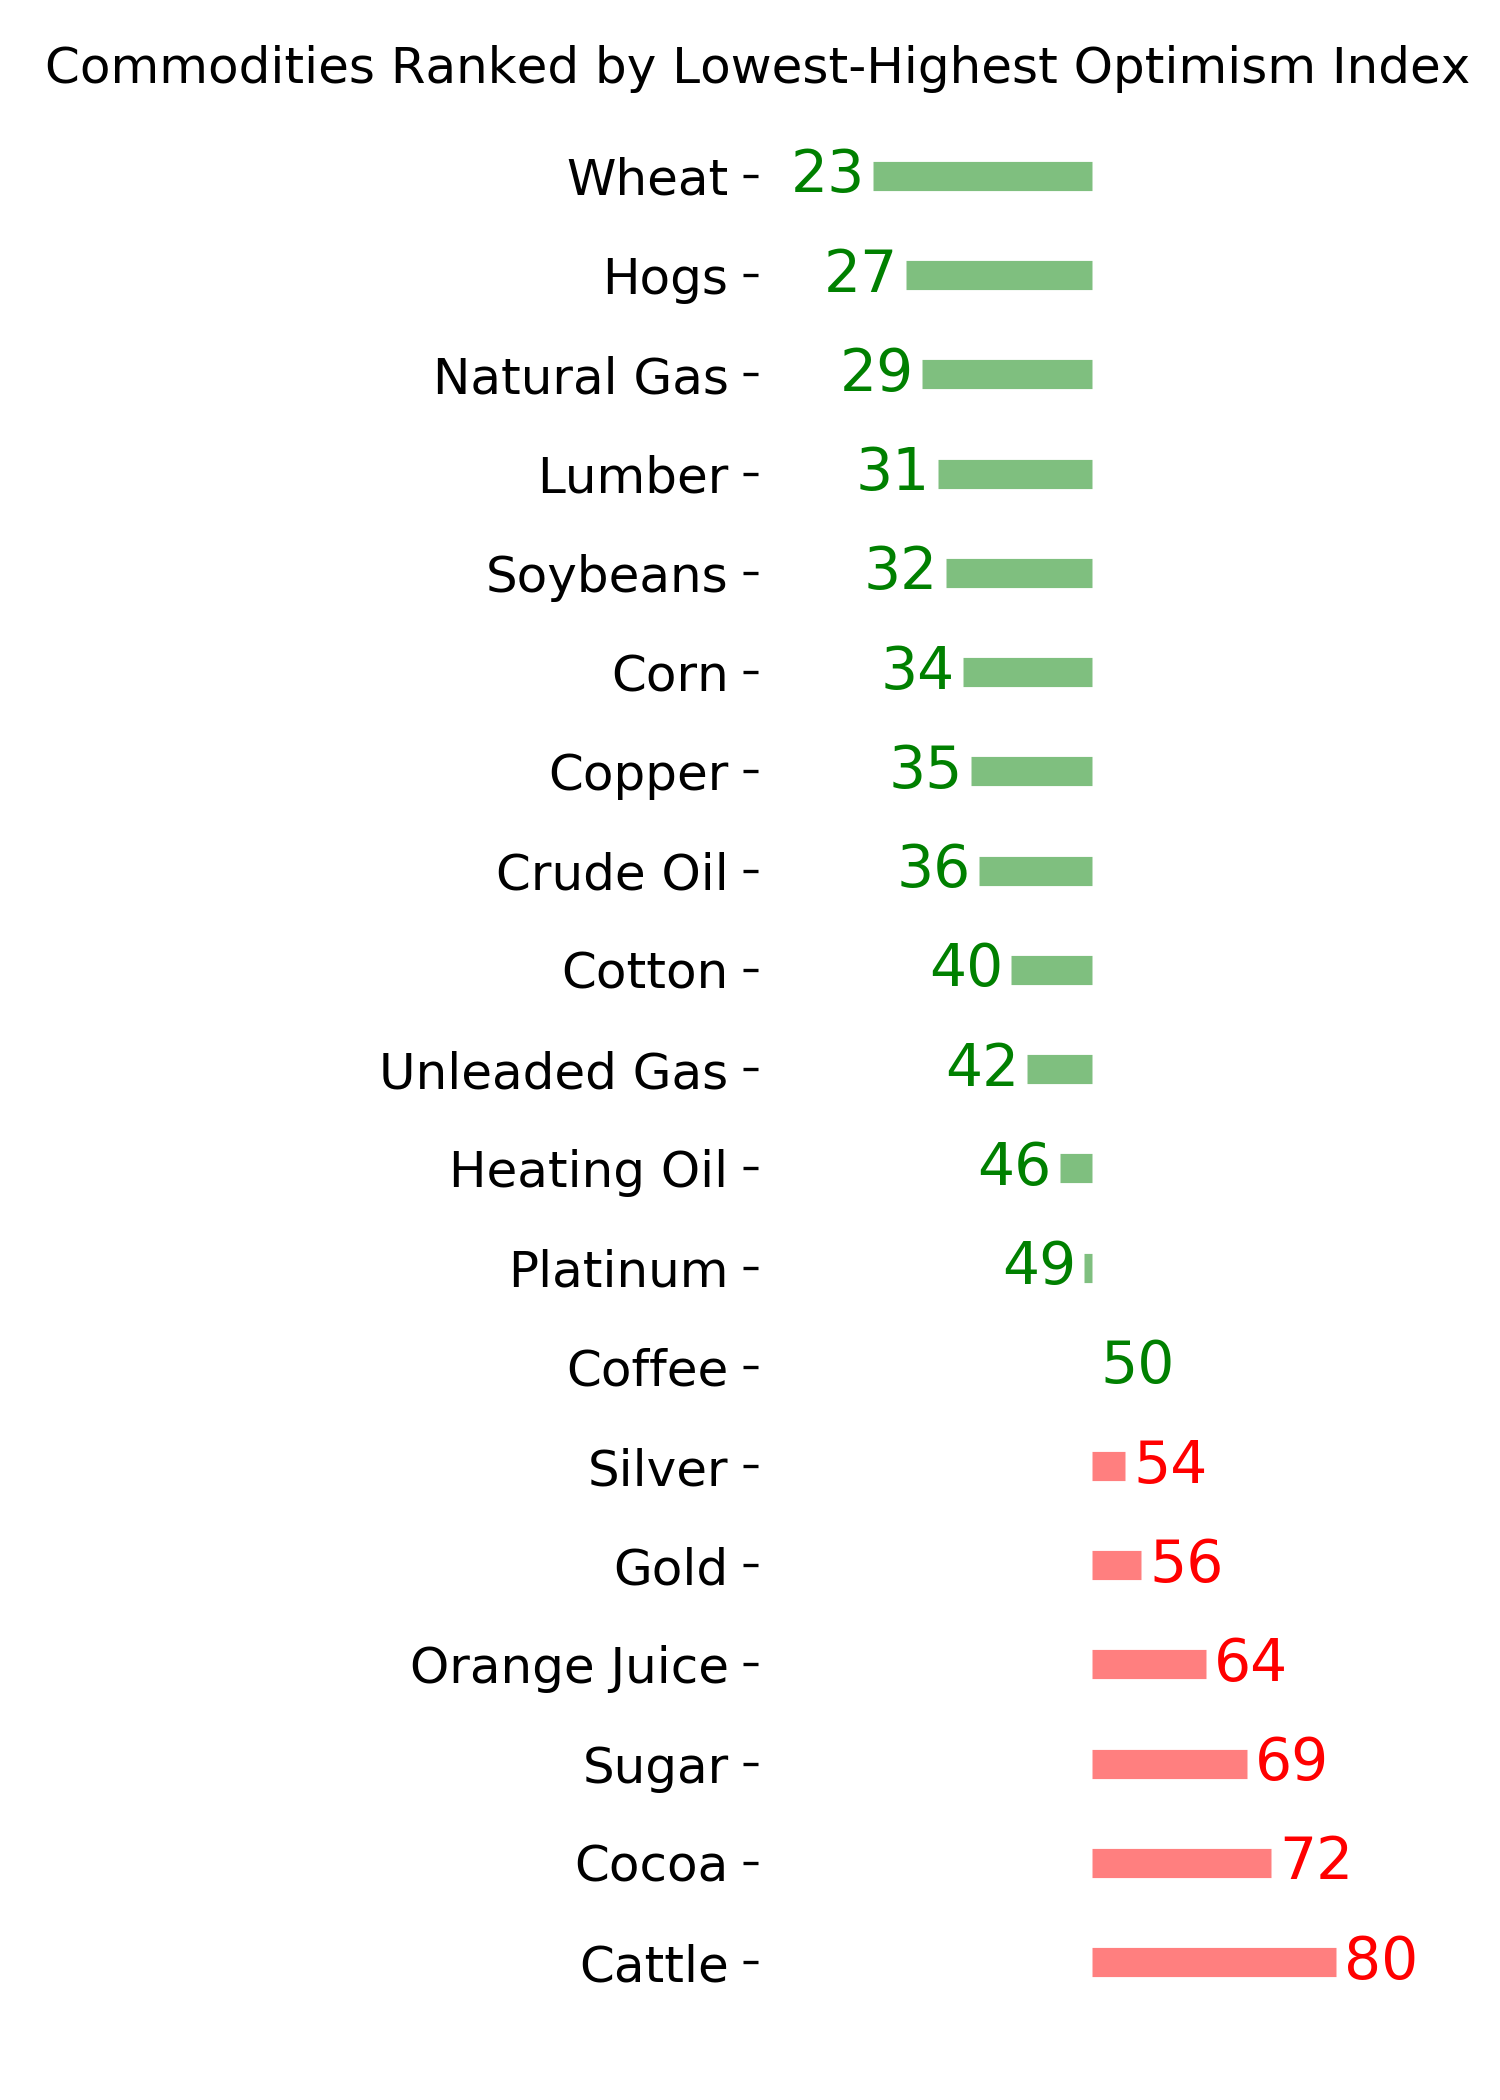
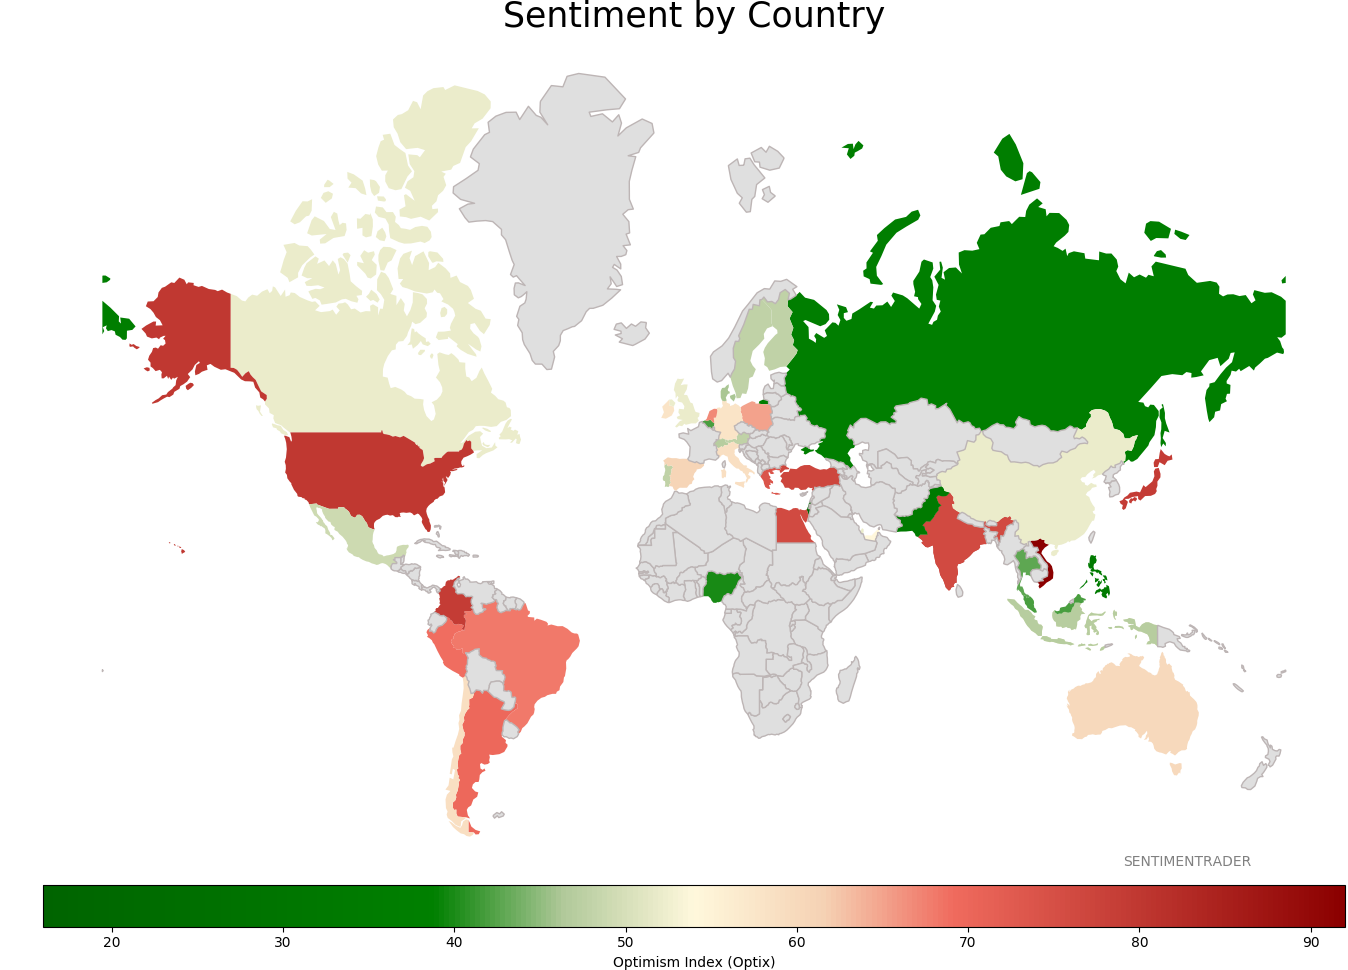
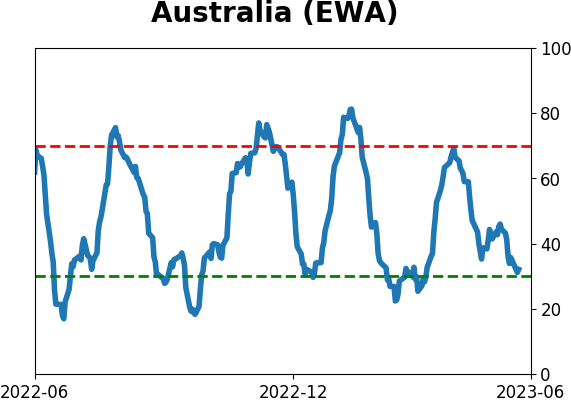
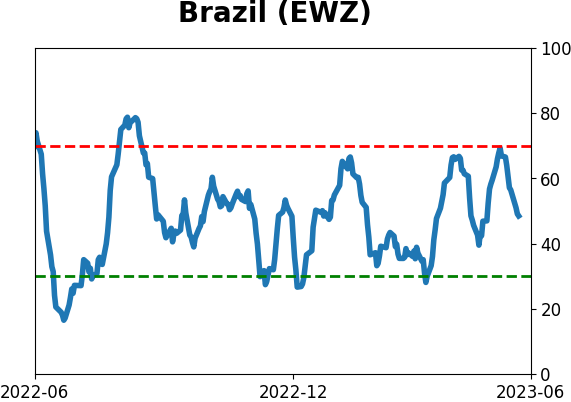
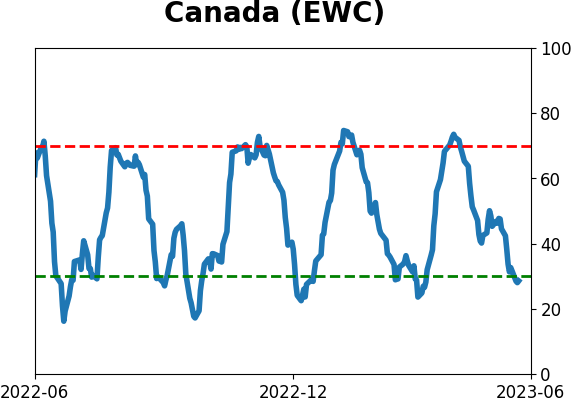
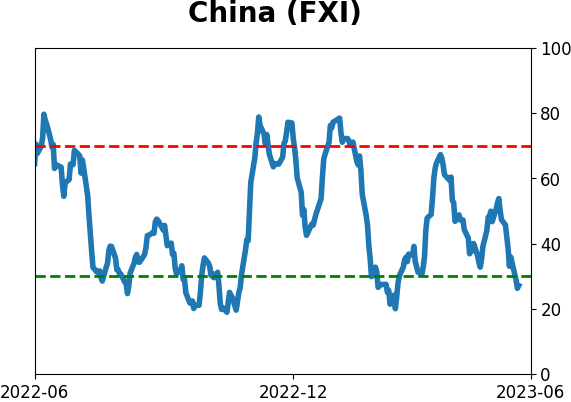
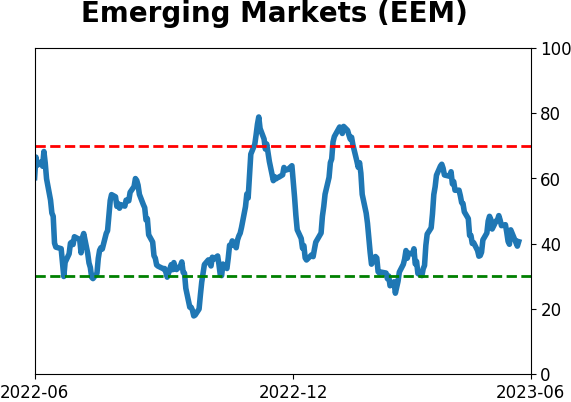
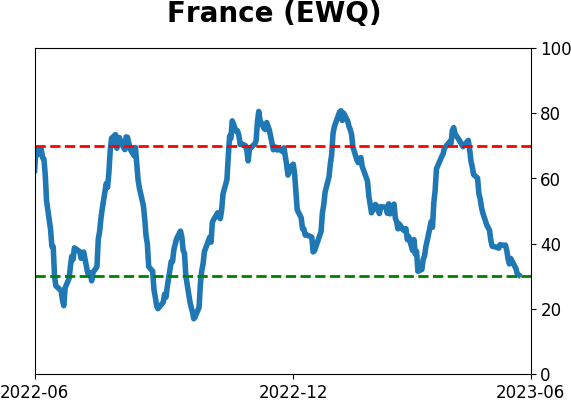
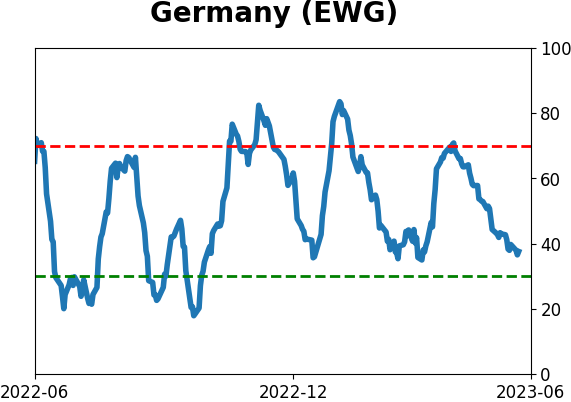
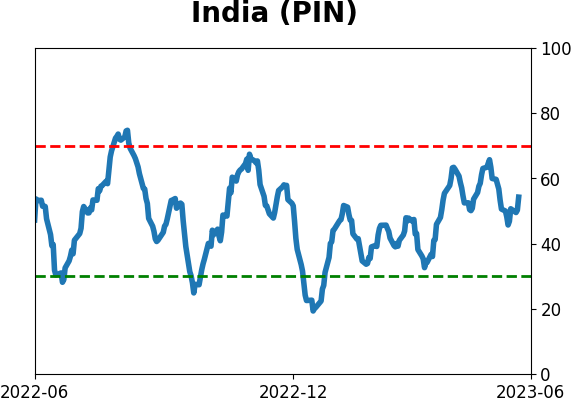
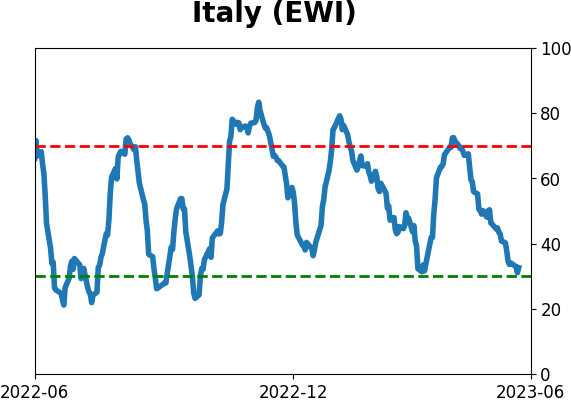
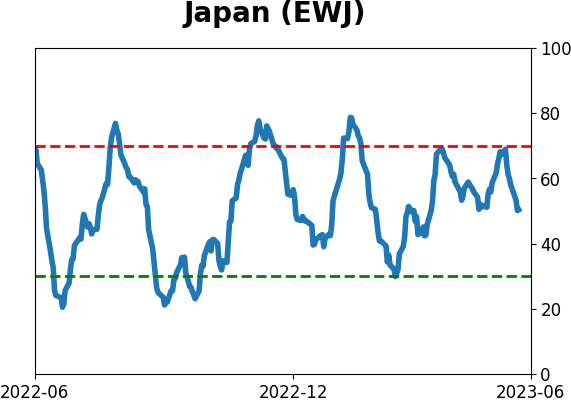
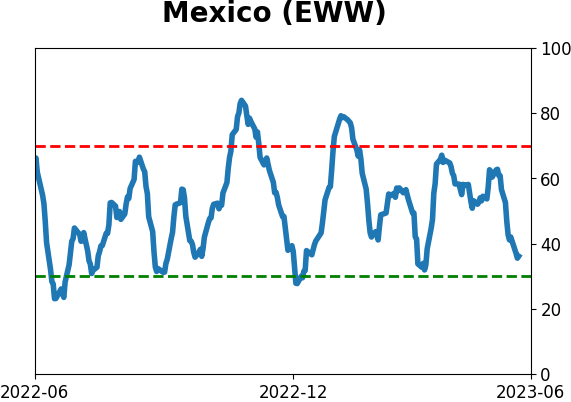
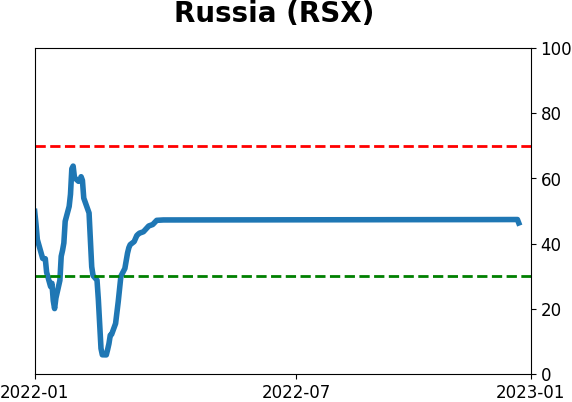
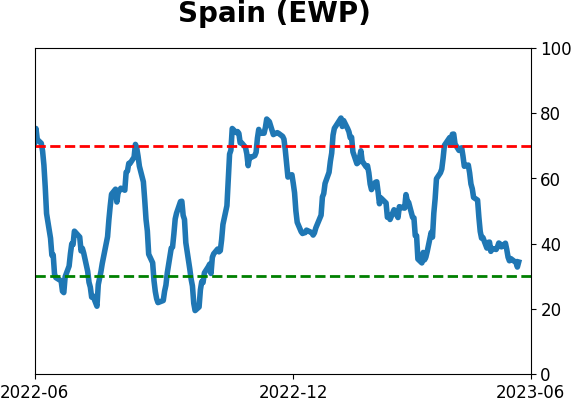
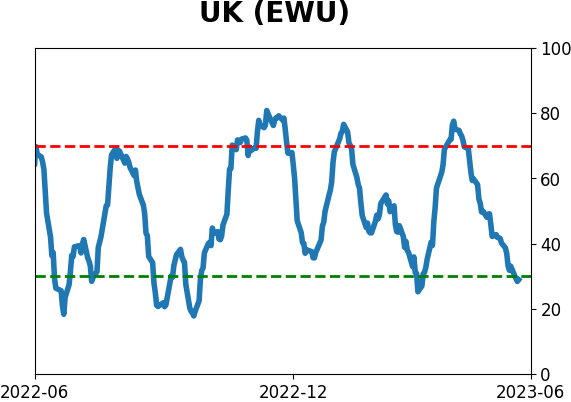
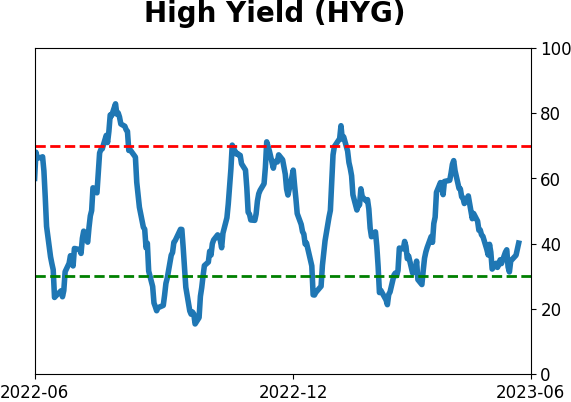
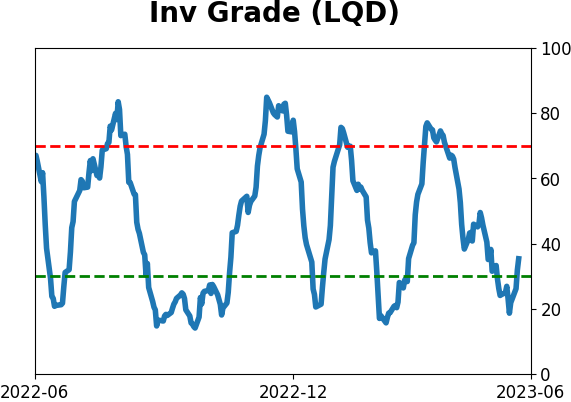
Sentiment Around The World
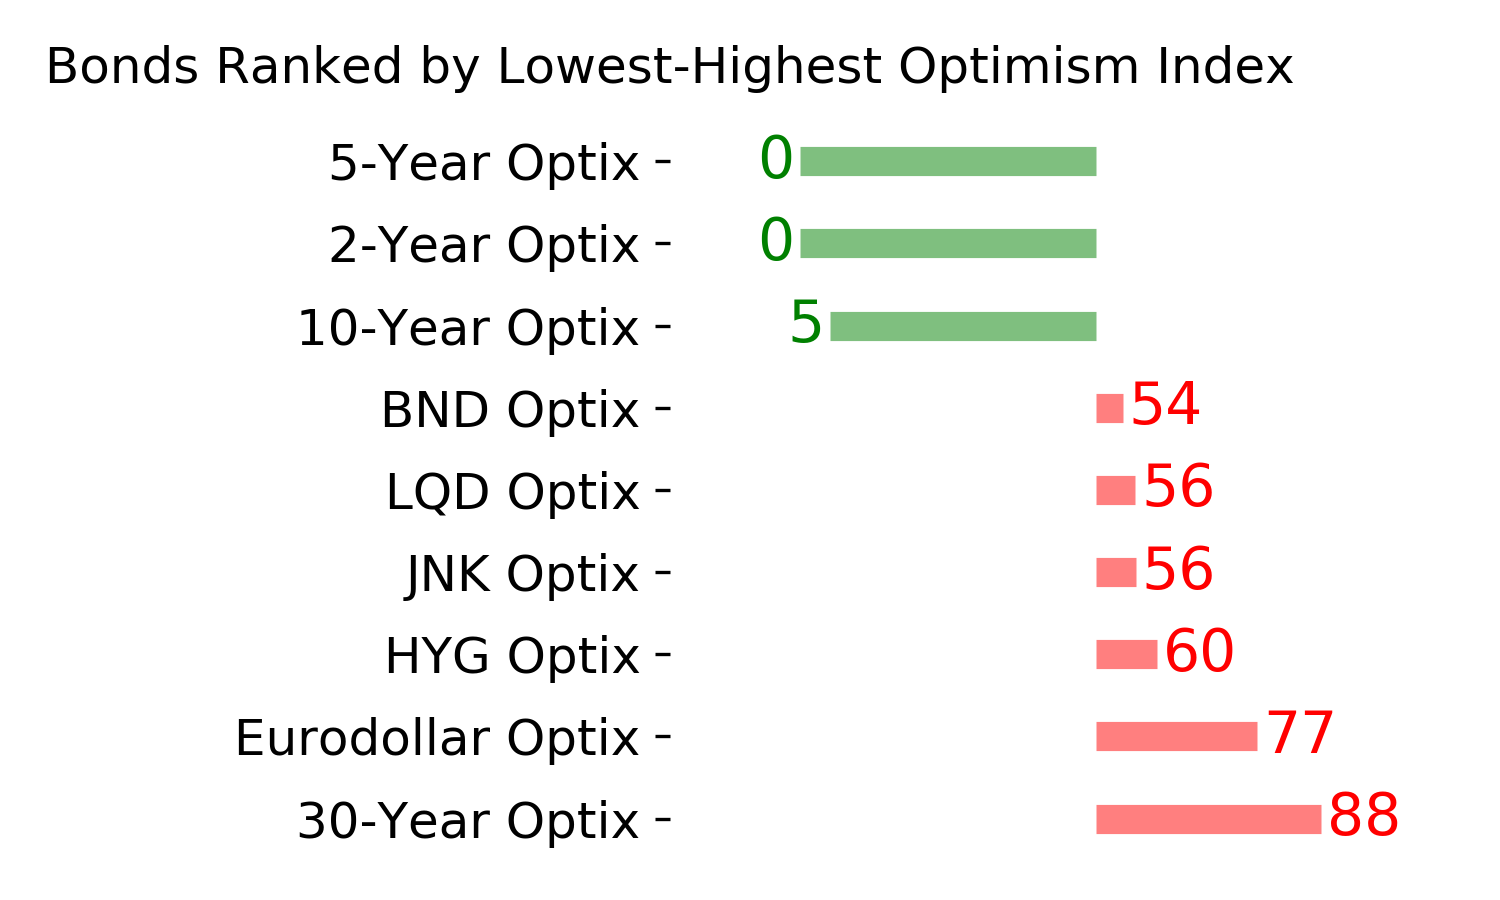
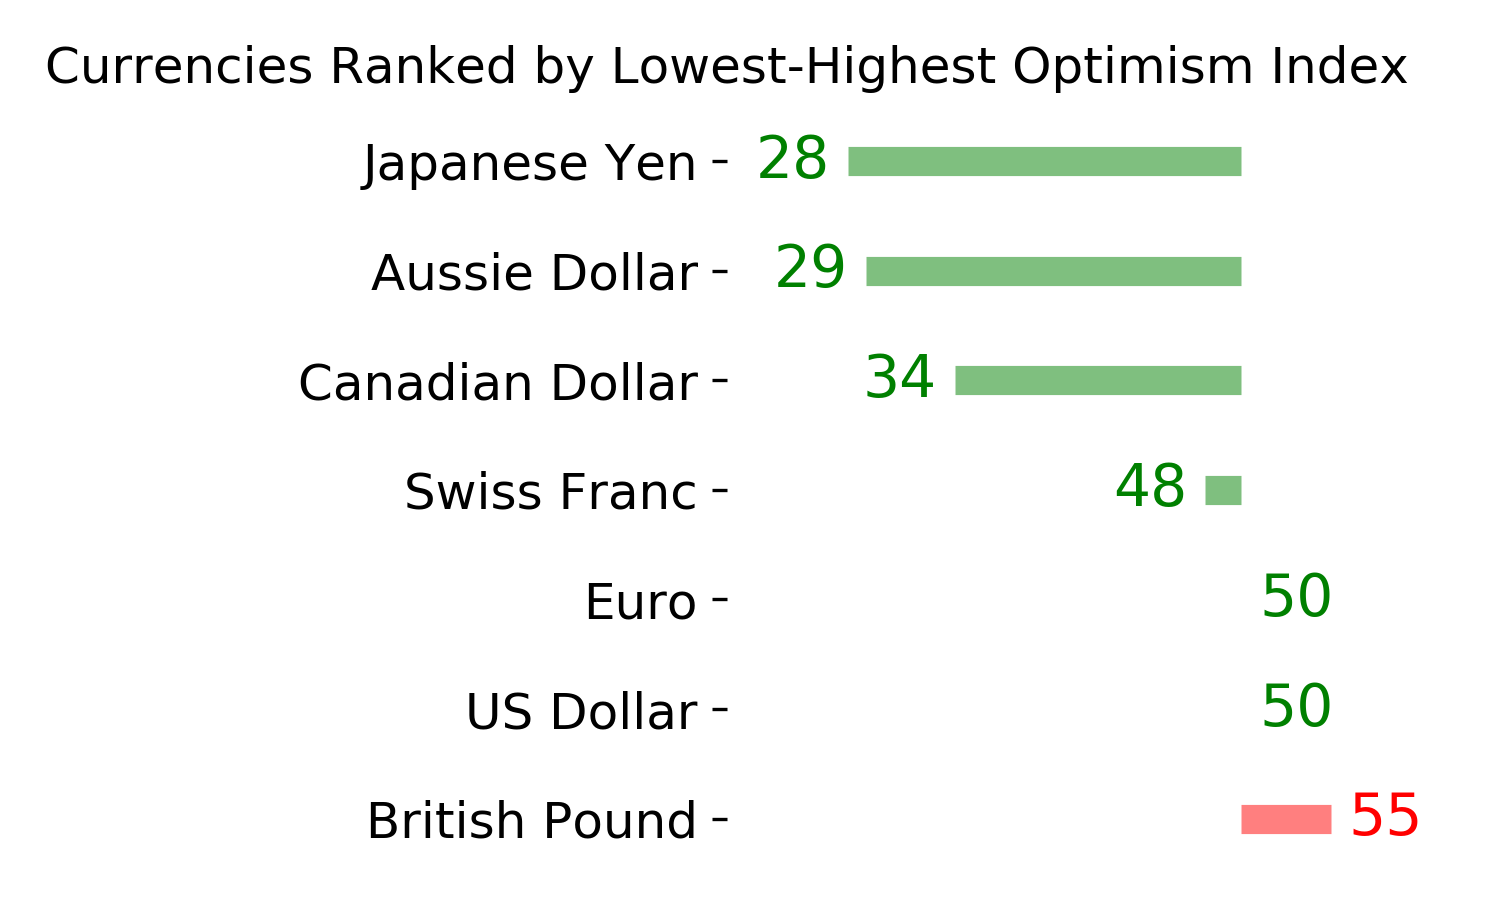
Optimism Index Thumbnails
|
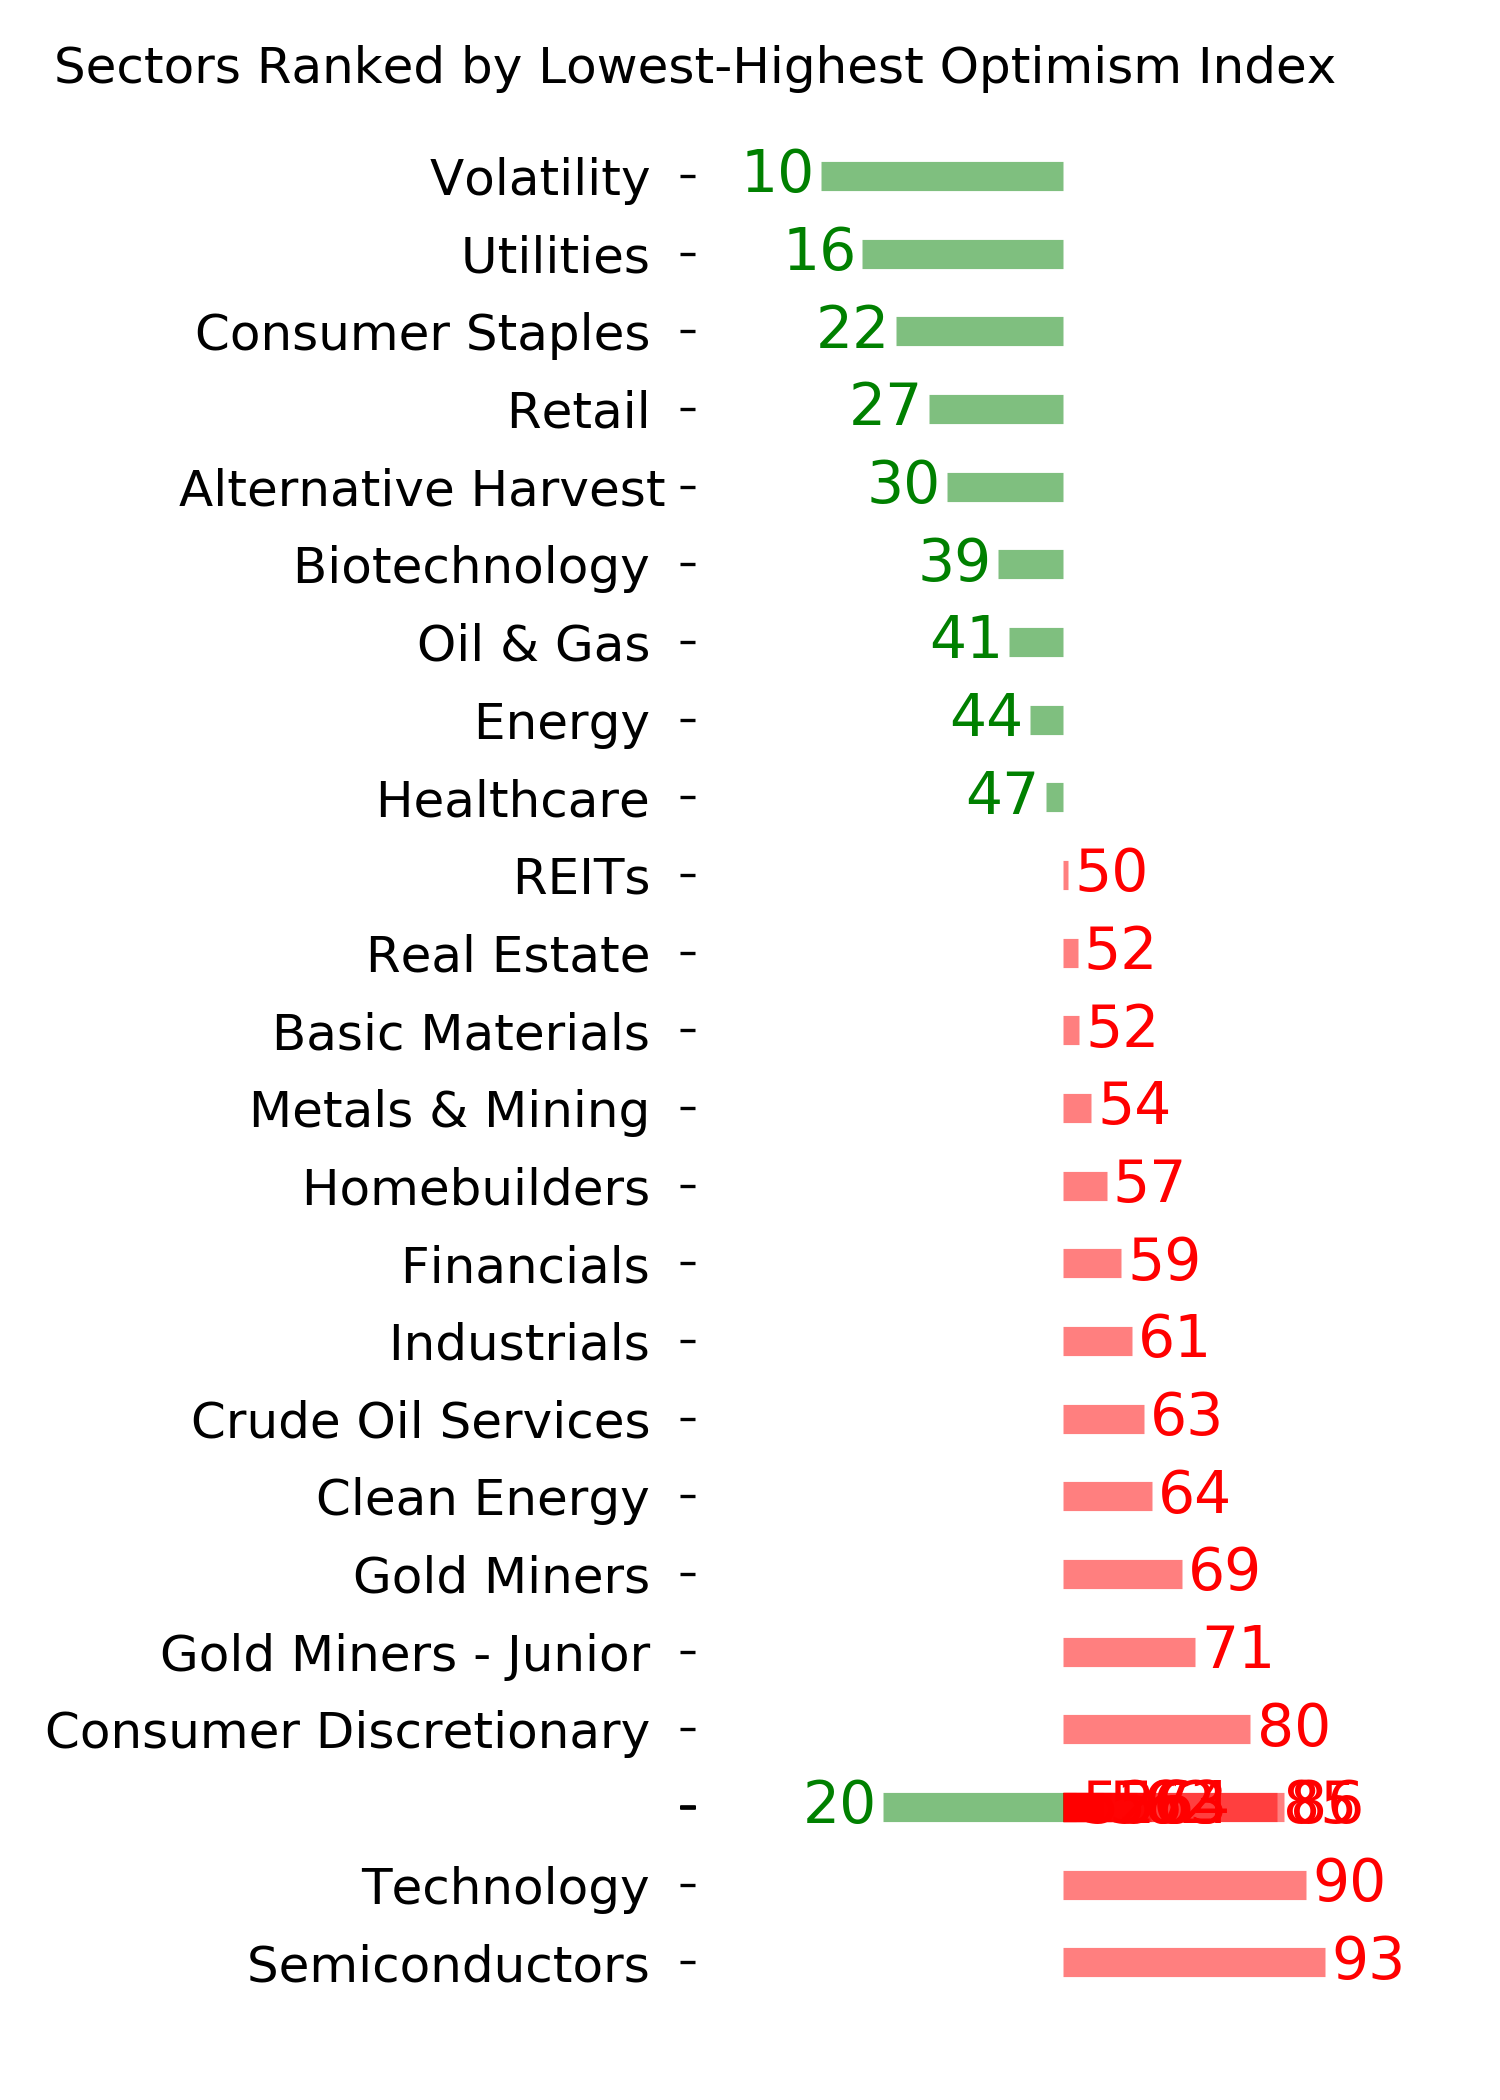
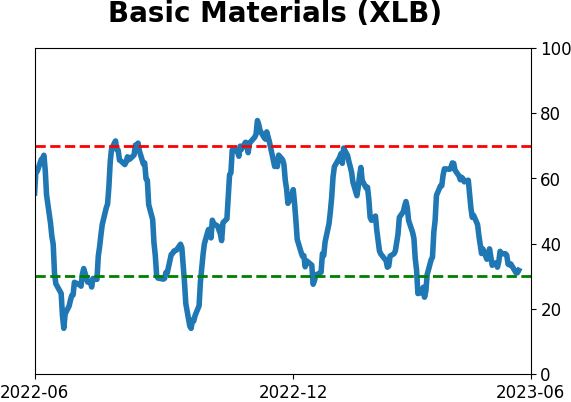
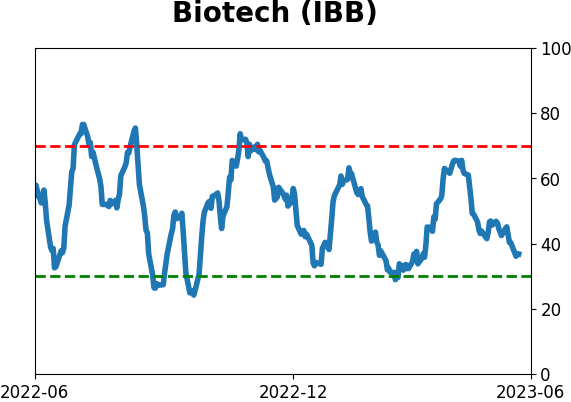
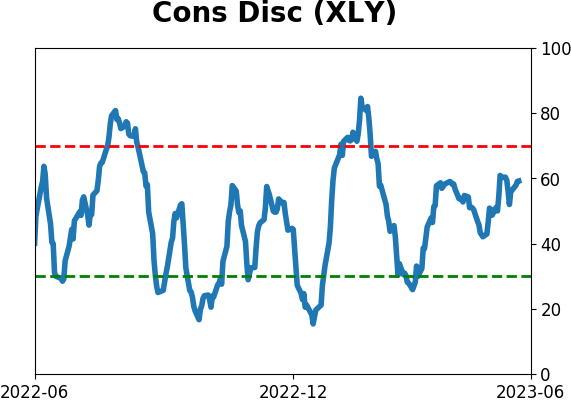
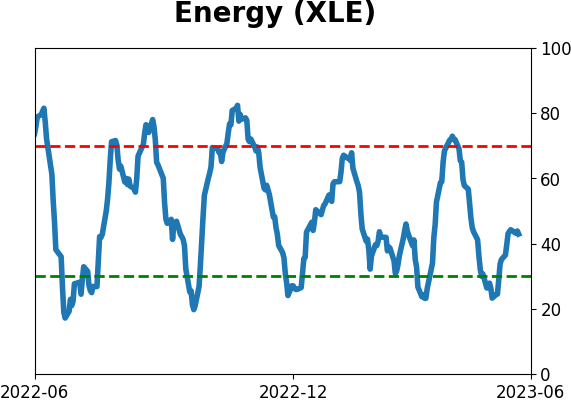
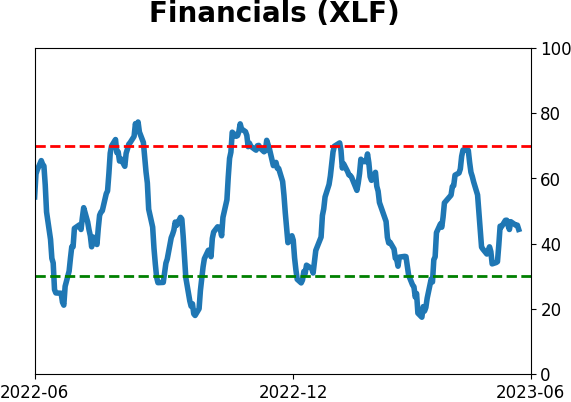
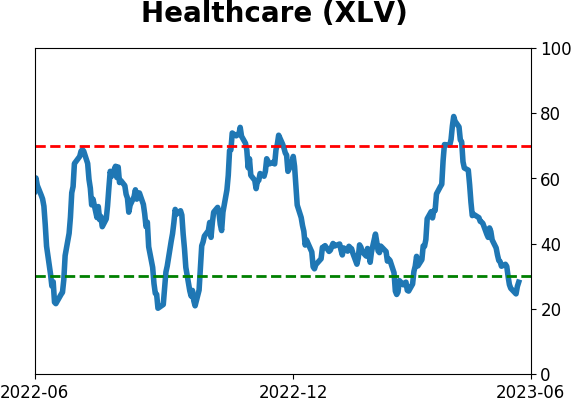
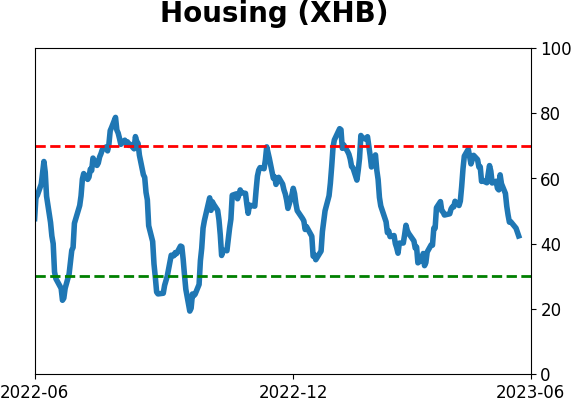
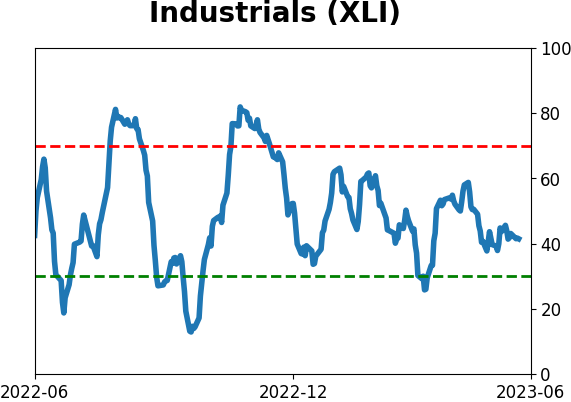
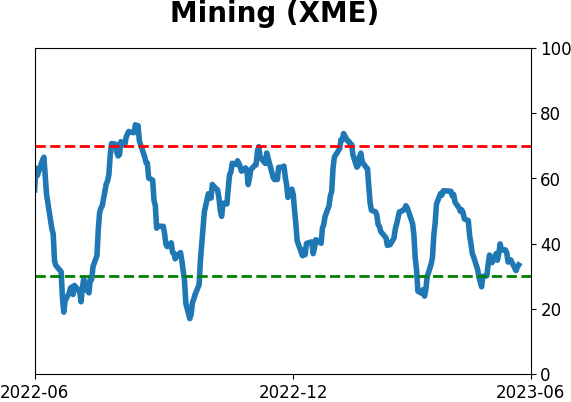
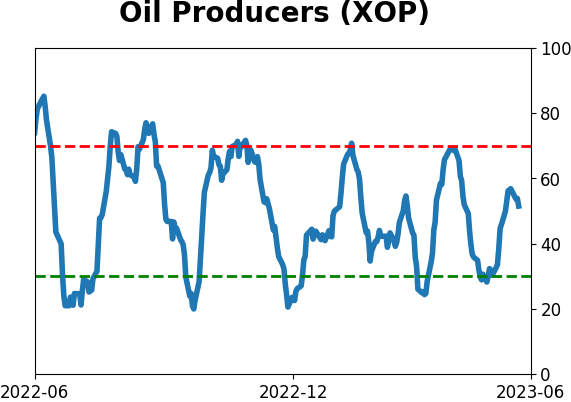
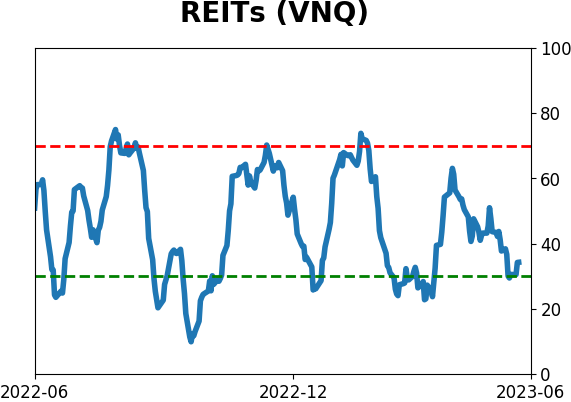
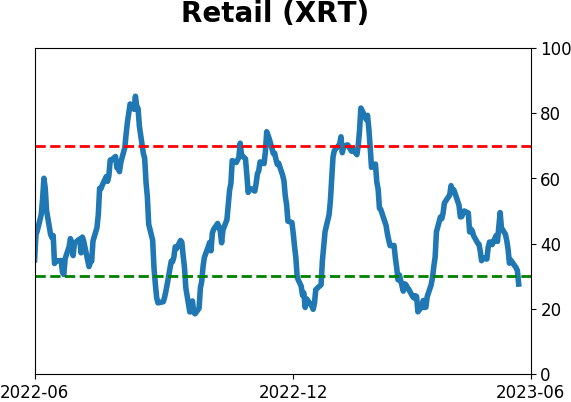
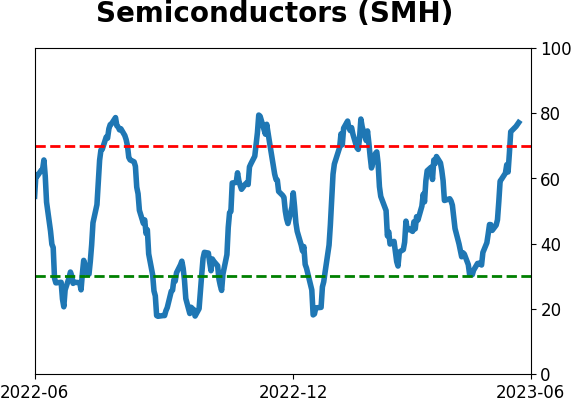
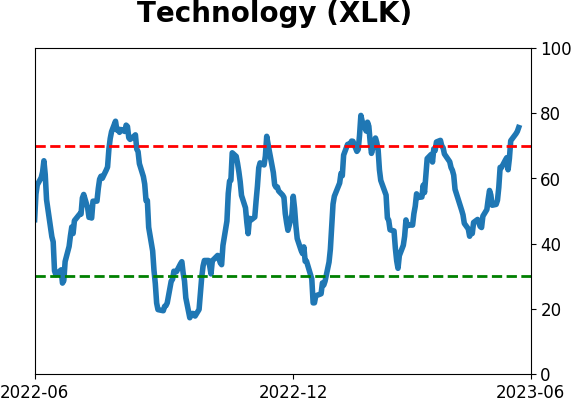
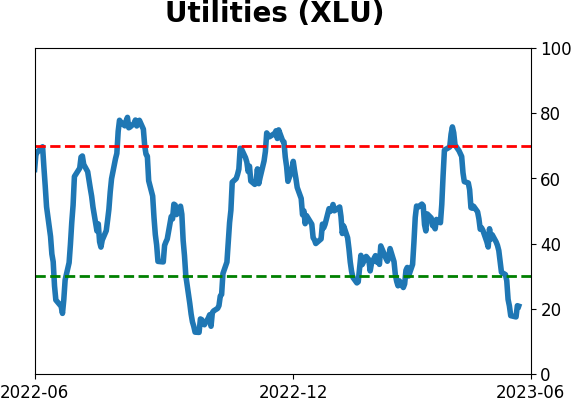
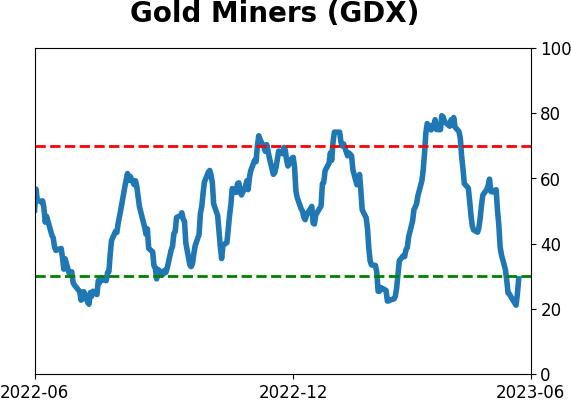
Sector ETF's - 10-Day Moving Average
|
|
|
Country ETF's - 10-Day Moving Average
|
|
|
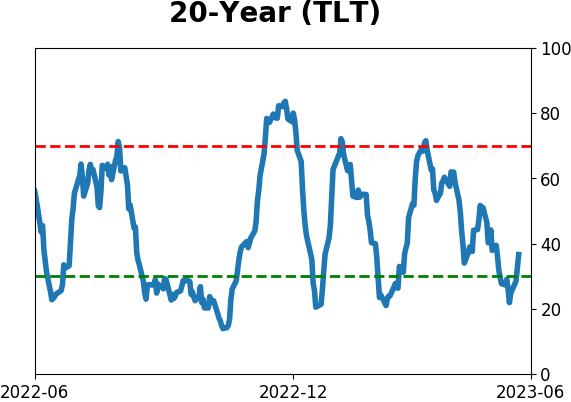
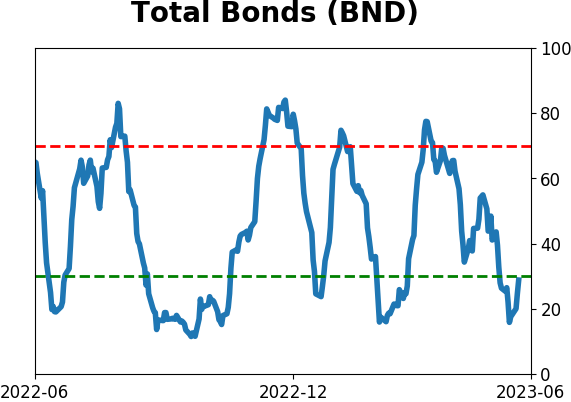
Bond ETF's - 10-Day Moving Average
|
|
|
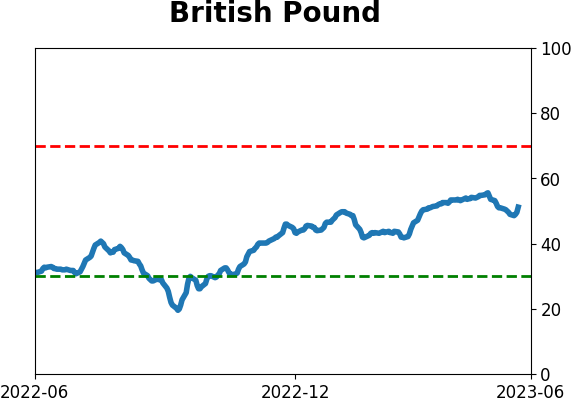
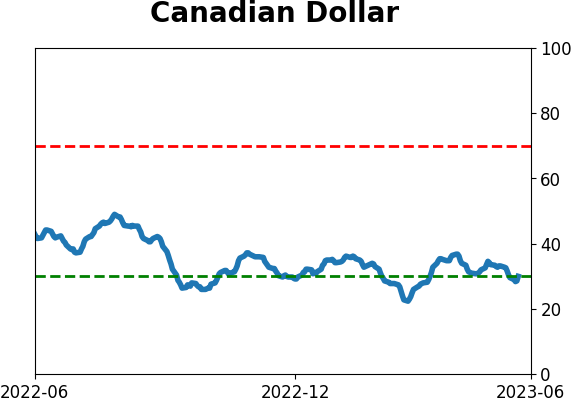
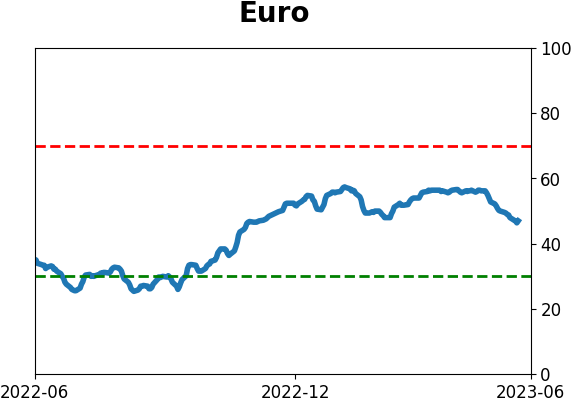
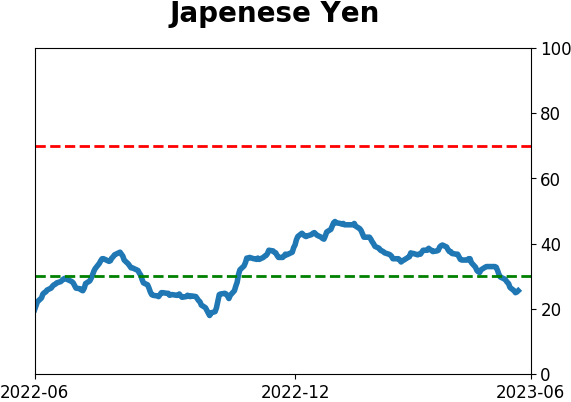
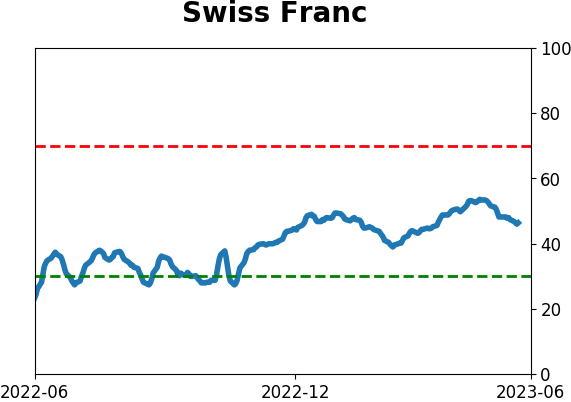
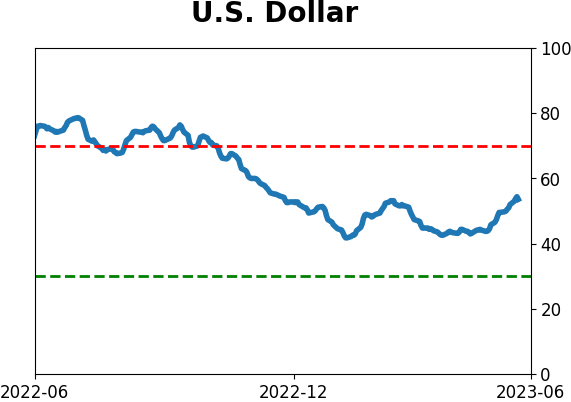
Currency ETF's - 5-Day Moving Average
|
|
|
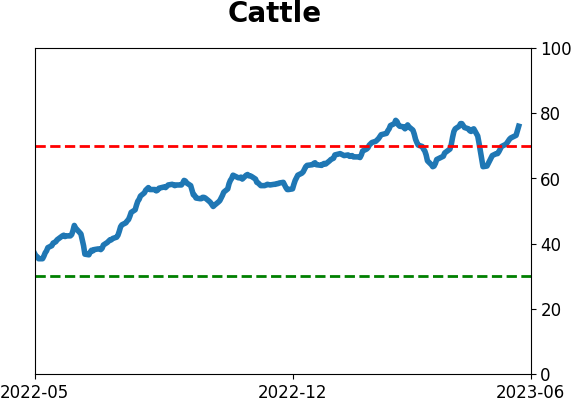
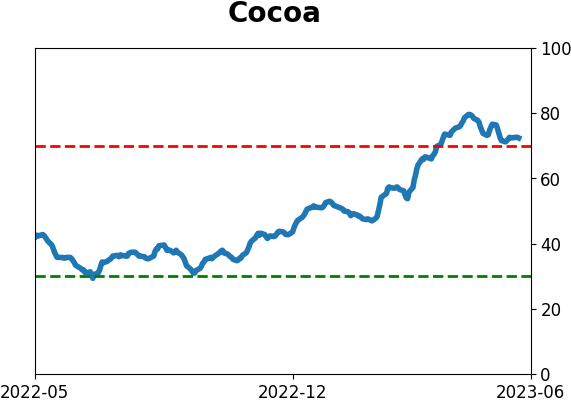
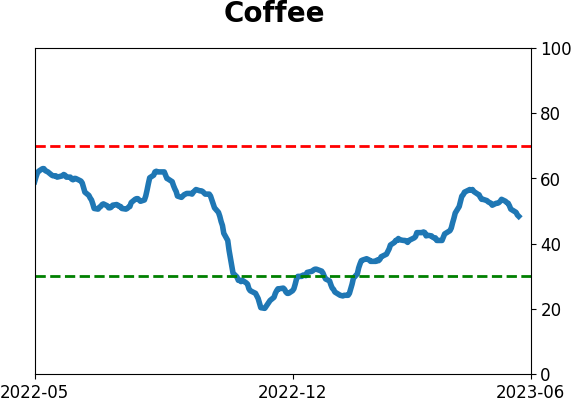
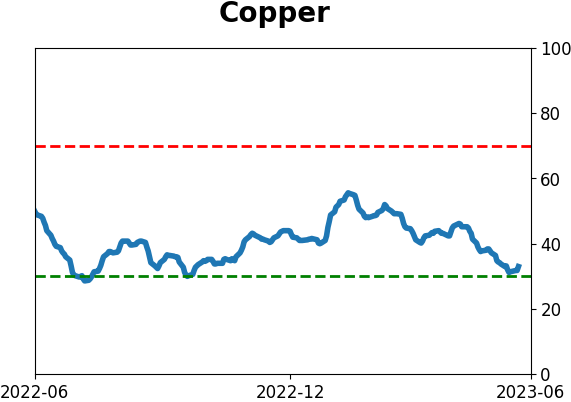
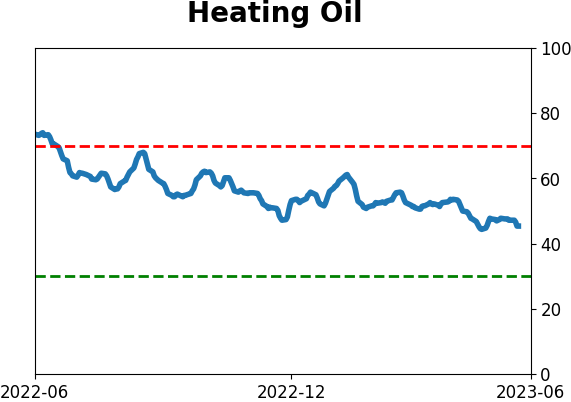
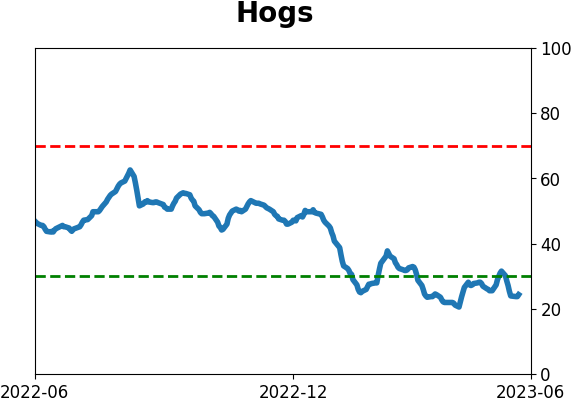
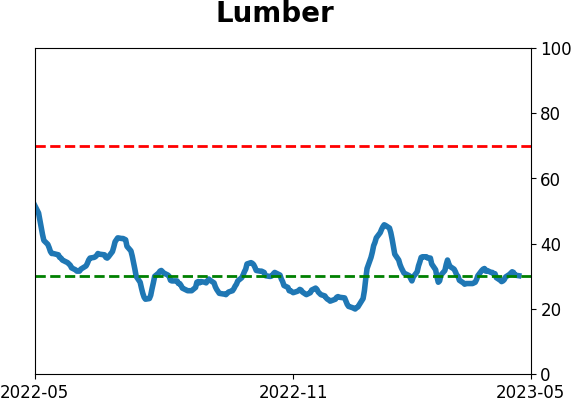
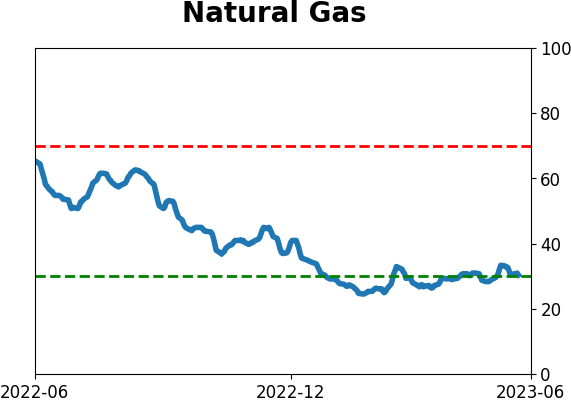
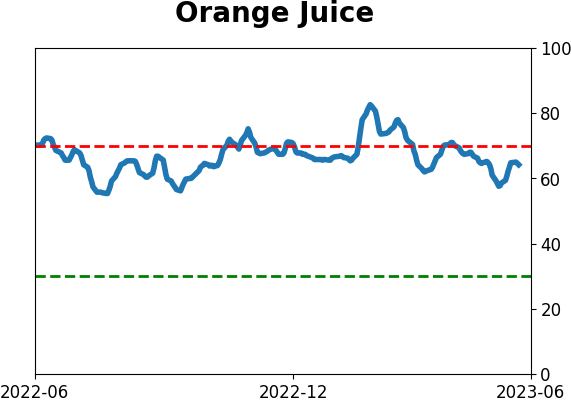
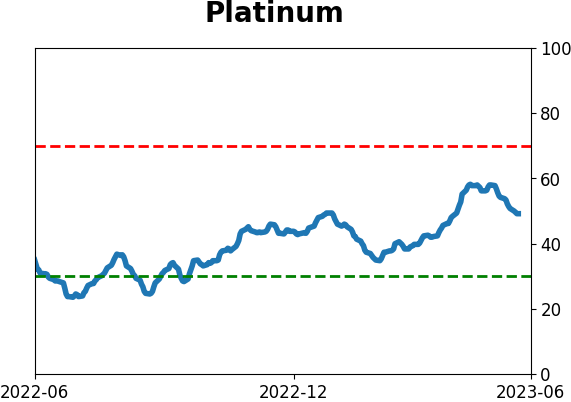
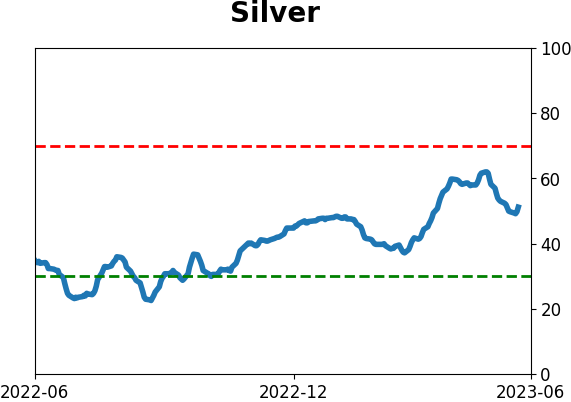
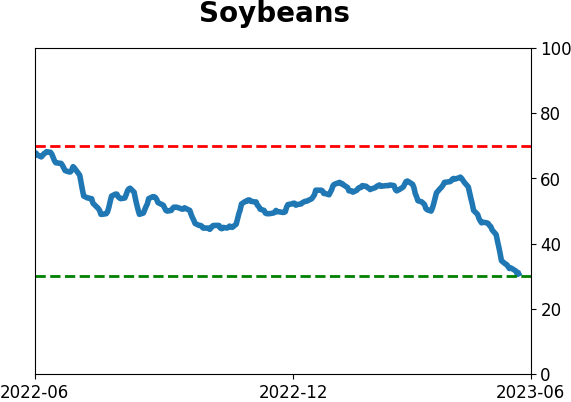
Commodity ETF's - 5-Day Moving Average
|
|