Headlines
|
|
This year's 100-day depression:
The S&P 500 has suffered one of the worst 100-day starts to a year in its history. Other years with a high positive correlation to the past 100 days have typically seen a bounce about now. The poor start has weighed on sentiment, with historically low 100-day readings. Both argue for a relief rally.
|
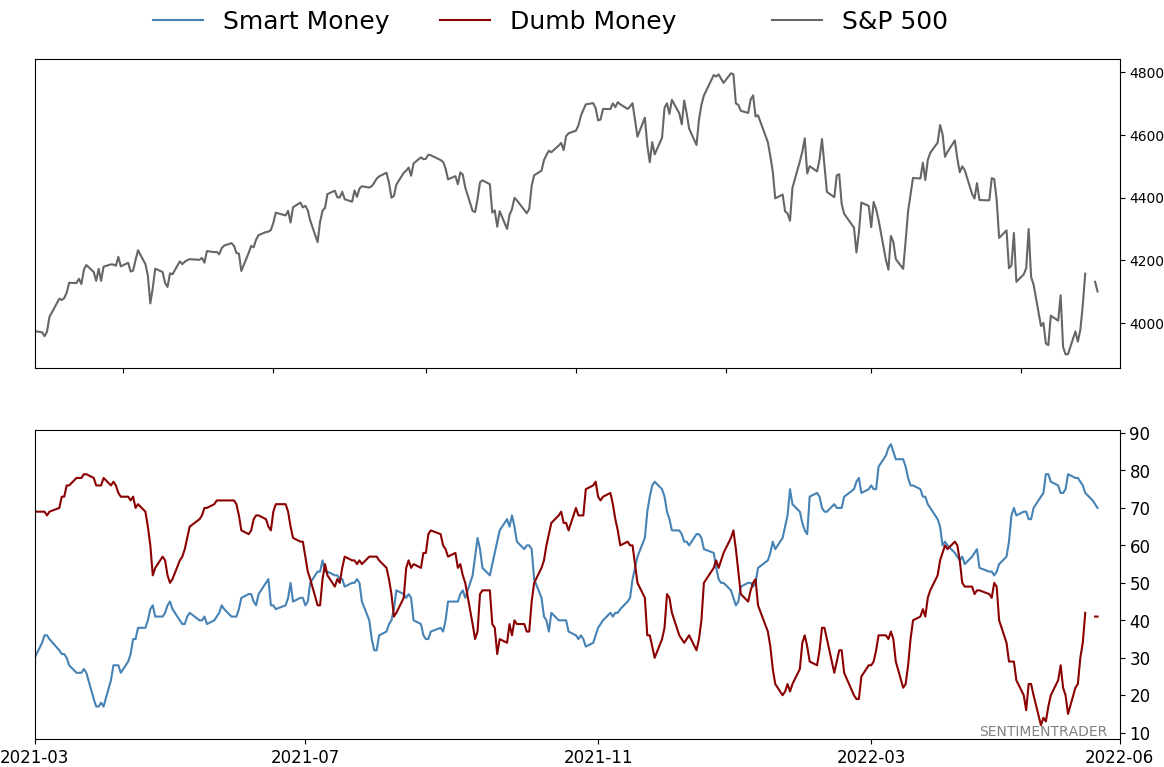
Smart / Dumb Money Confidence
|
Smart Money Confidence: 70%
Dumb Money Confidence: 41%
|
|
Risk Levels
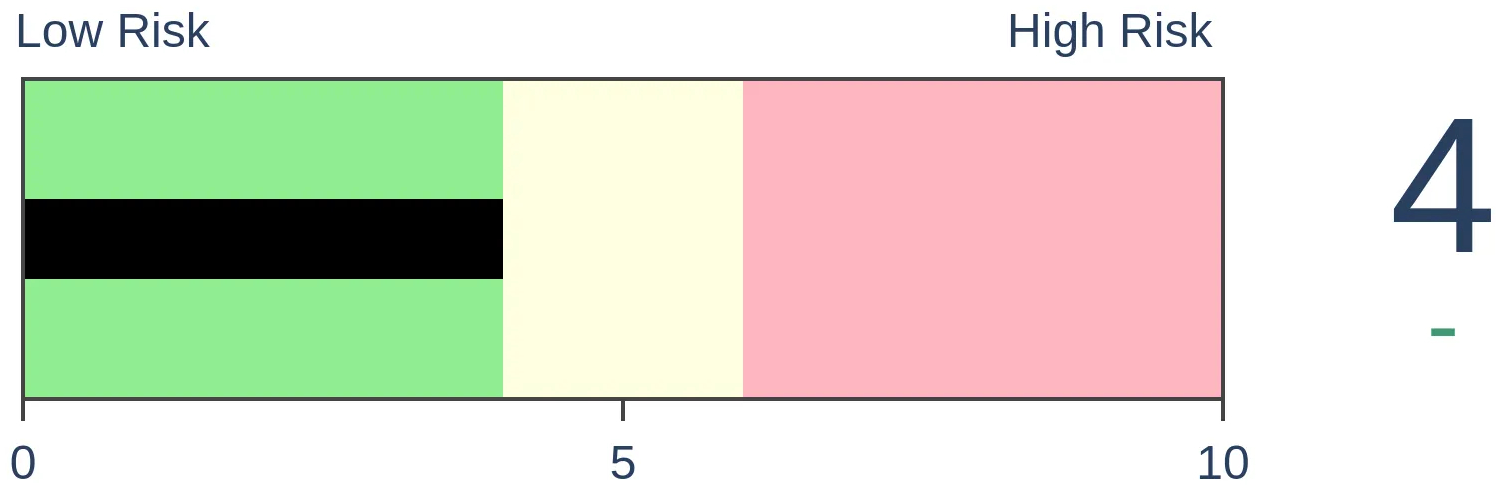
Stocks Short-Term

|
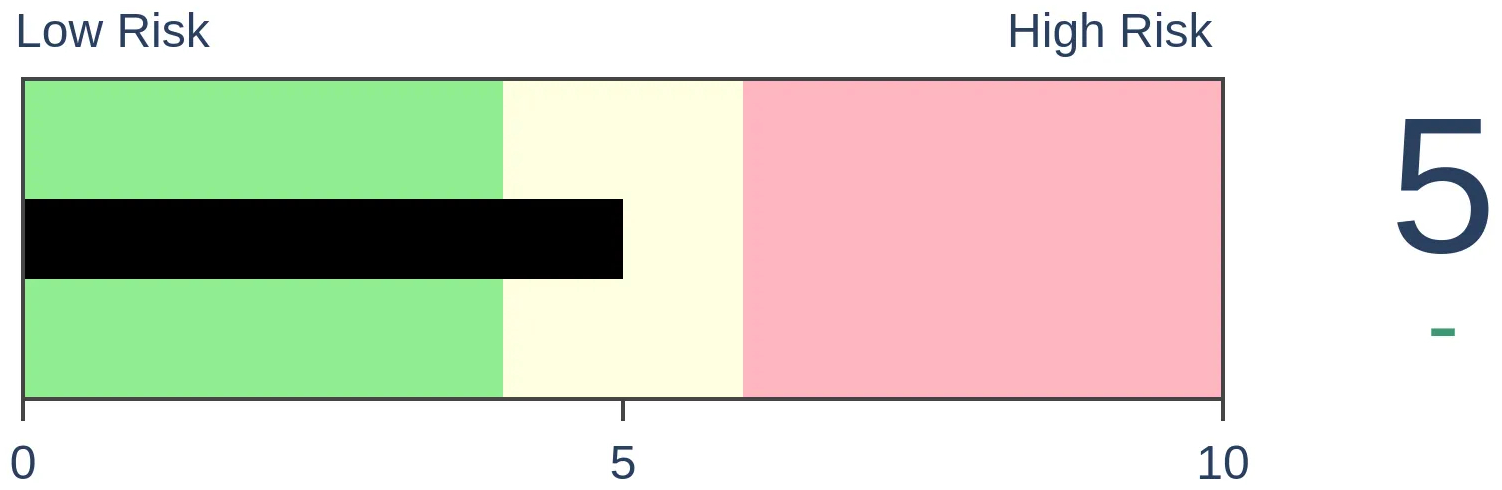
Stocks Medium-Term

|
|
Bonds

|
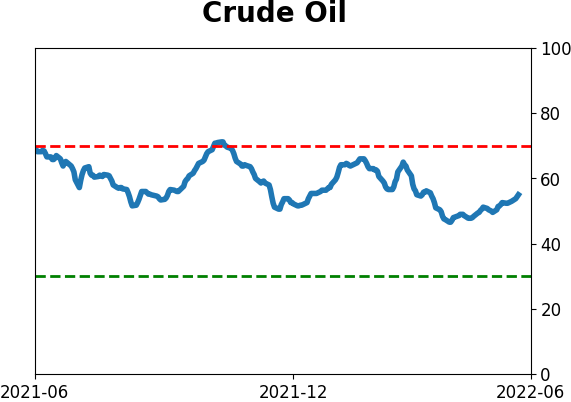
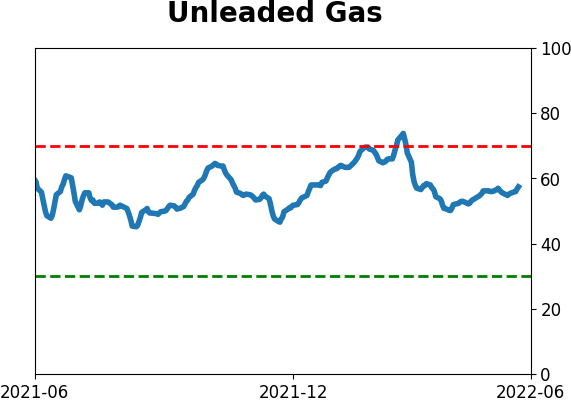
Crude Oil
|
|
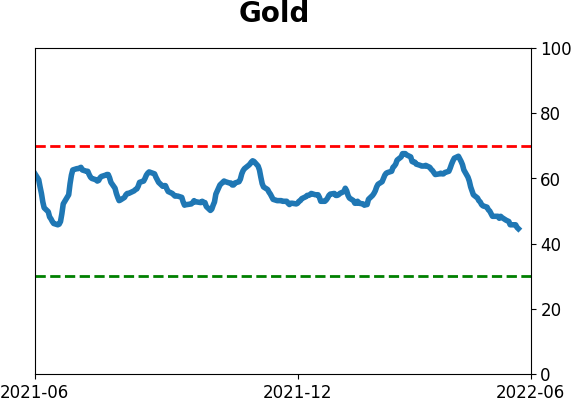
Gold
|
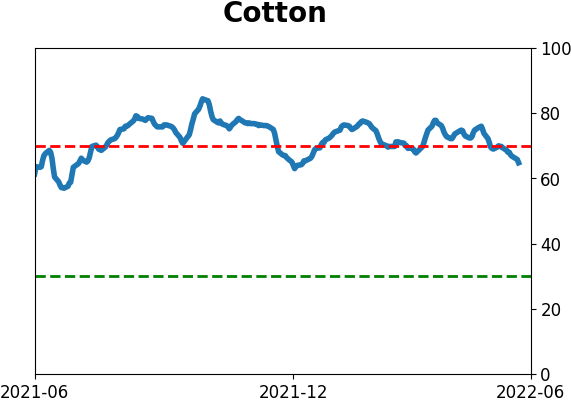
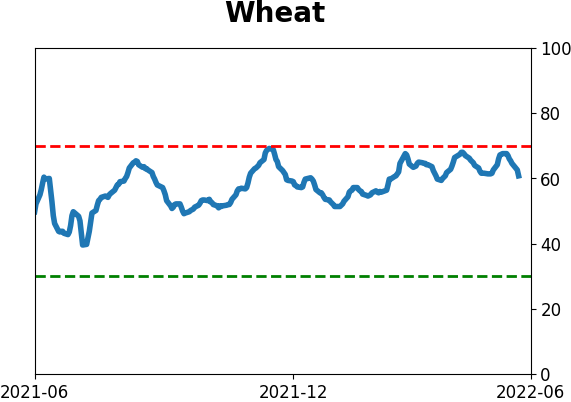
Agriculture

|
|
Research
By Jason Goepfert
BOTTOM LINE
The S&P 500 has suffered one of the worst 100-day starts to a year in its history. Other years with a high positive correlation to the past 100 days have typically seen a bounce about now. The poor start has weighed on sentiment, with historically low 100-day readings. Both argue for a relief rally.
FORECAST / TIMEFRAME
None
|
Key points:
- The years with the most similar 100-day starts to a year typically bottom about now
- Almost all the years saw the S&P 500 rally over the next 1-2 months at least
- The poor 100-day stretch has pushed sentiment indicators to one of their lowest levels in years or even decades
A woeful 100 days
U.S. presidents are often judged on what they accomplished in their first 100 days. Good thing stocks aren't because it's been one of the worst in history.
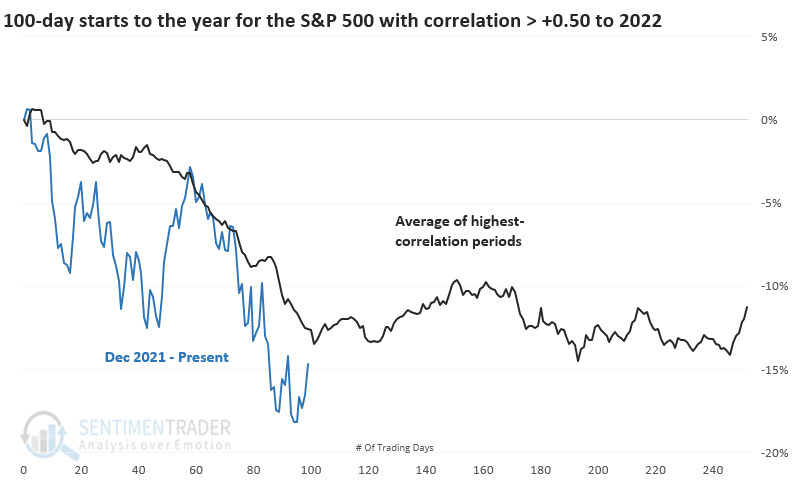
Even after a multi-day surge, the S&P 500 has tracked along with its worst starts ever. It's hard to find poorer "first 100 days," but there have been 15 years that showed a correlation higher than +0.5 (on a scale of -1.0 to +1.0). It's interesting that - on average - those other years formed multi-month bottoms right about when we did this year.
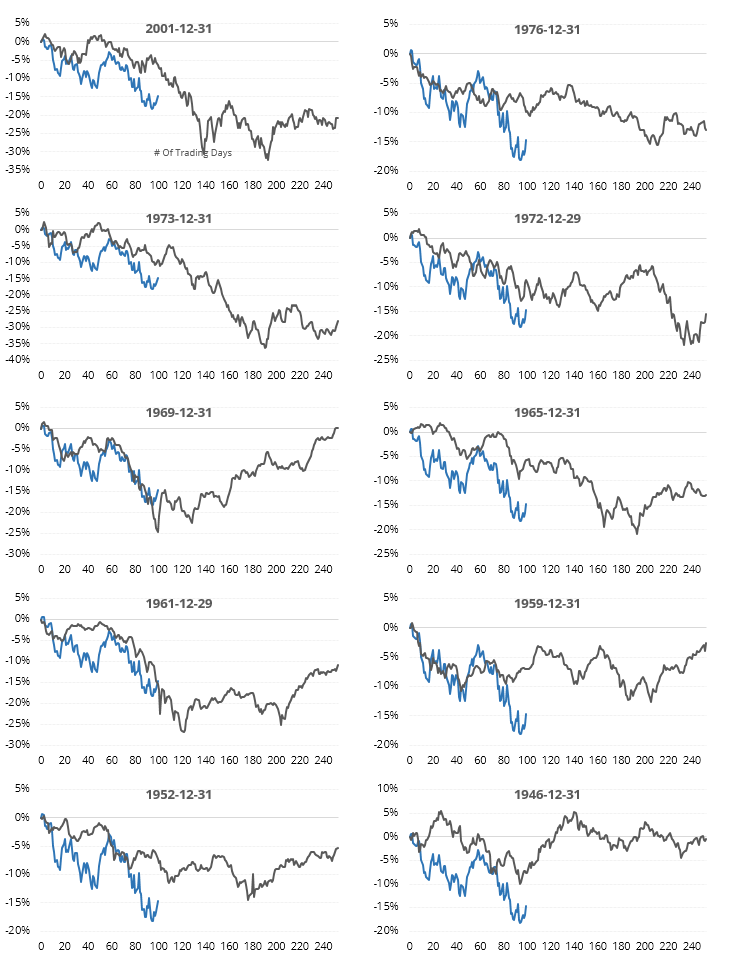
The ten most recent precedents are below. The S&P enjoyed at least a short-term low right about now in almost all the years, with 2002 being the most egregious exception. That was just a relentless meltdown.
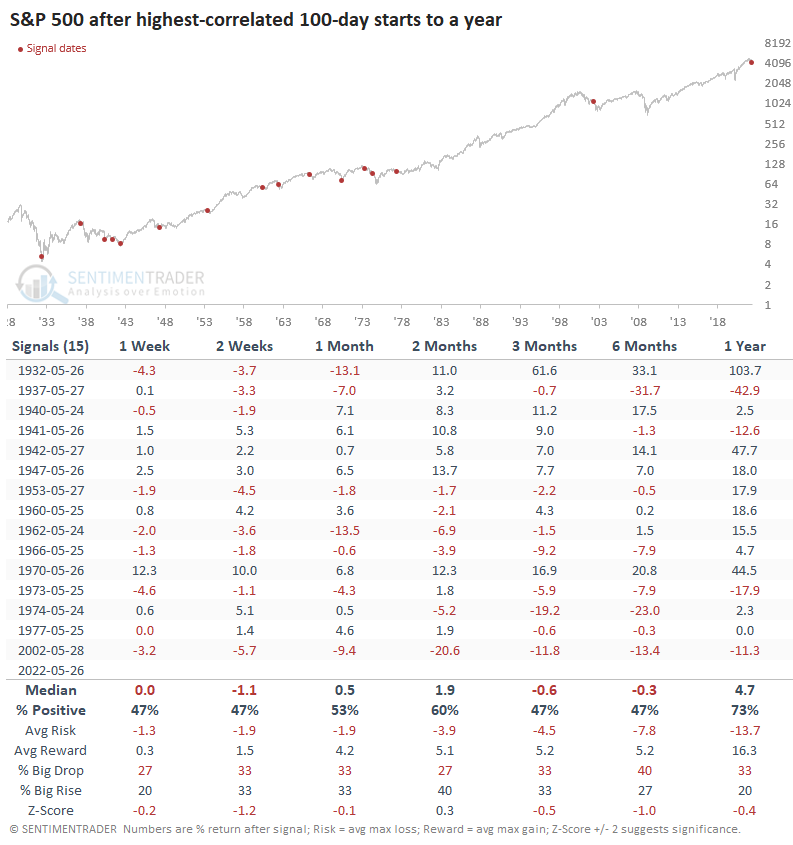
Even though the analogs looked constructive, they were inconsistent in how much and how long prices rallied. Starting at the 100-day mark, the S&P's future returns were mixed, with some bad losses. Of the 15 signals, 4 preceded double-digit losses over the next 6-12 months, so not a great ratio. The best risk/reward was over the next 1-2 months.
The poor hundred days has weighed on sentiment
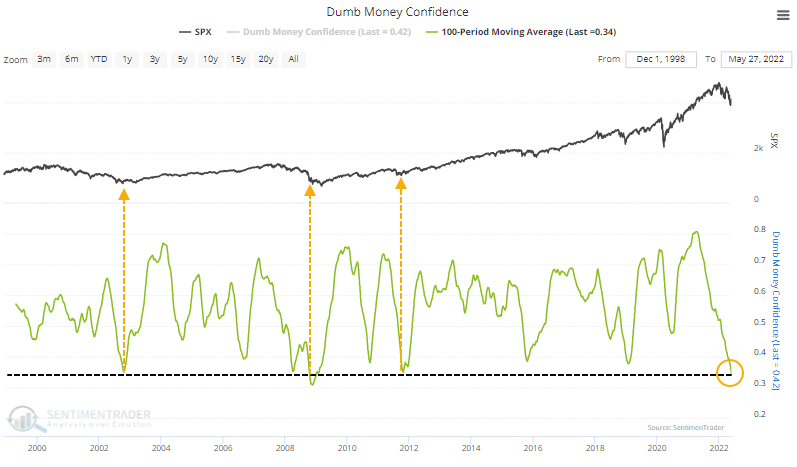
The poor showing has undoubtedly had an impact on sentiment. The 100-day average of Dumb Money Confidence just dropped to its 2nd-lowest level since we began calculating it more than 22 years ago. It got a bit lower after the signal in October 2008.
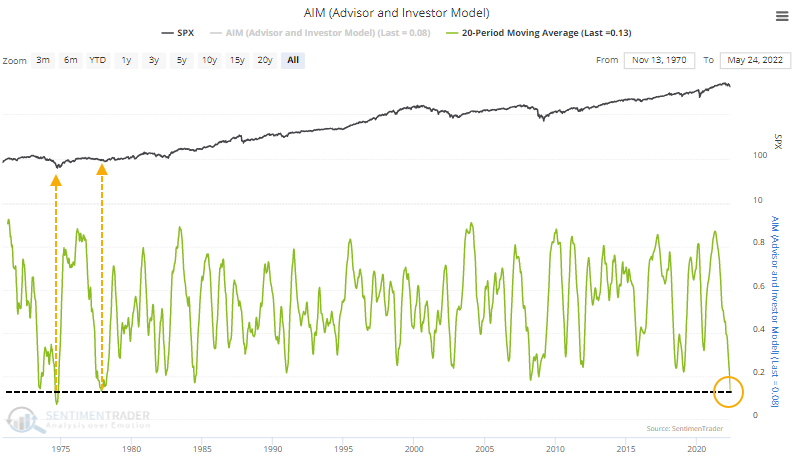
We've all heard of the depression in investor sentiment surveys like the one from AAII. But it's not just them. Surveys across investor groups are showing similar pessimism. The 20-week average of the AIM Model has dropped to its lowest level since the 1970s.
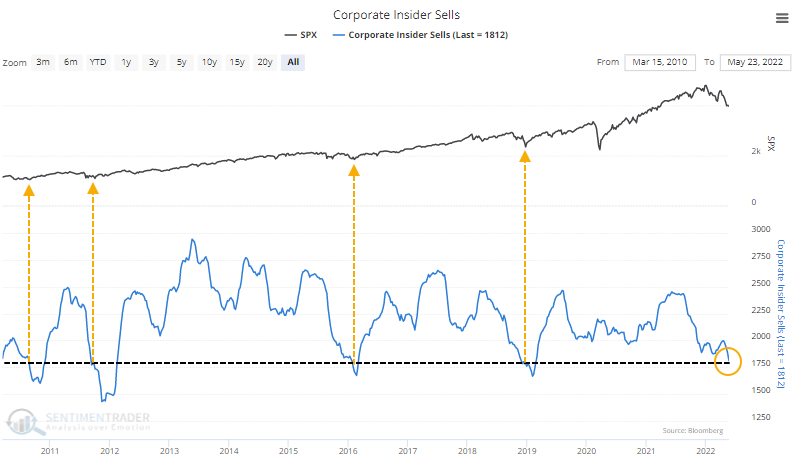
One of the few populations that has not been selling is corporate insiders. The number of officers, directors, and other insiders among S&P 500 companies that had an open market sale over the past six months has dried up to one of the lowest levels of the past 12 years.
What the research tells us...
There is almost always a tight relationship between price action and investors' expectations that the action will continue in the same direction. The historically bad start to 2022 has significantly impacted sentiment readings over the past 100 days. When looked at over that time frame, many indicators are registering multi-year or even multi-decade extremes. Based on that and the other years that had the most similar starts to a year, it suggests those investors could finally get some relief over multiple weeks or months.
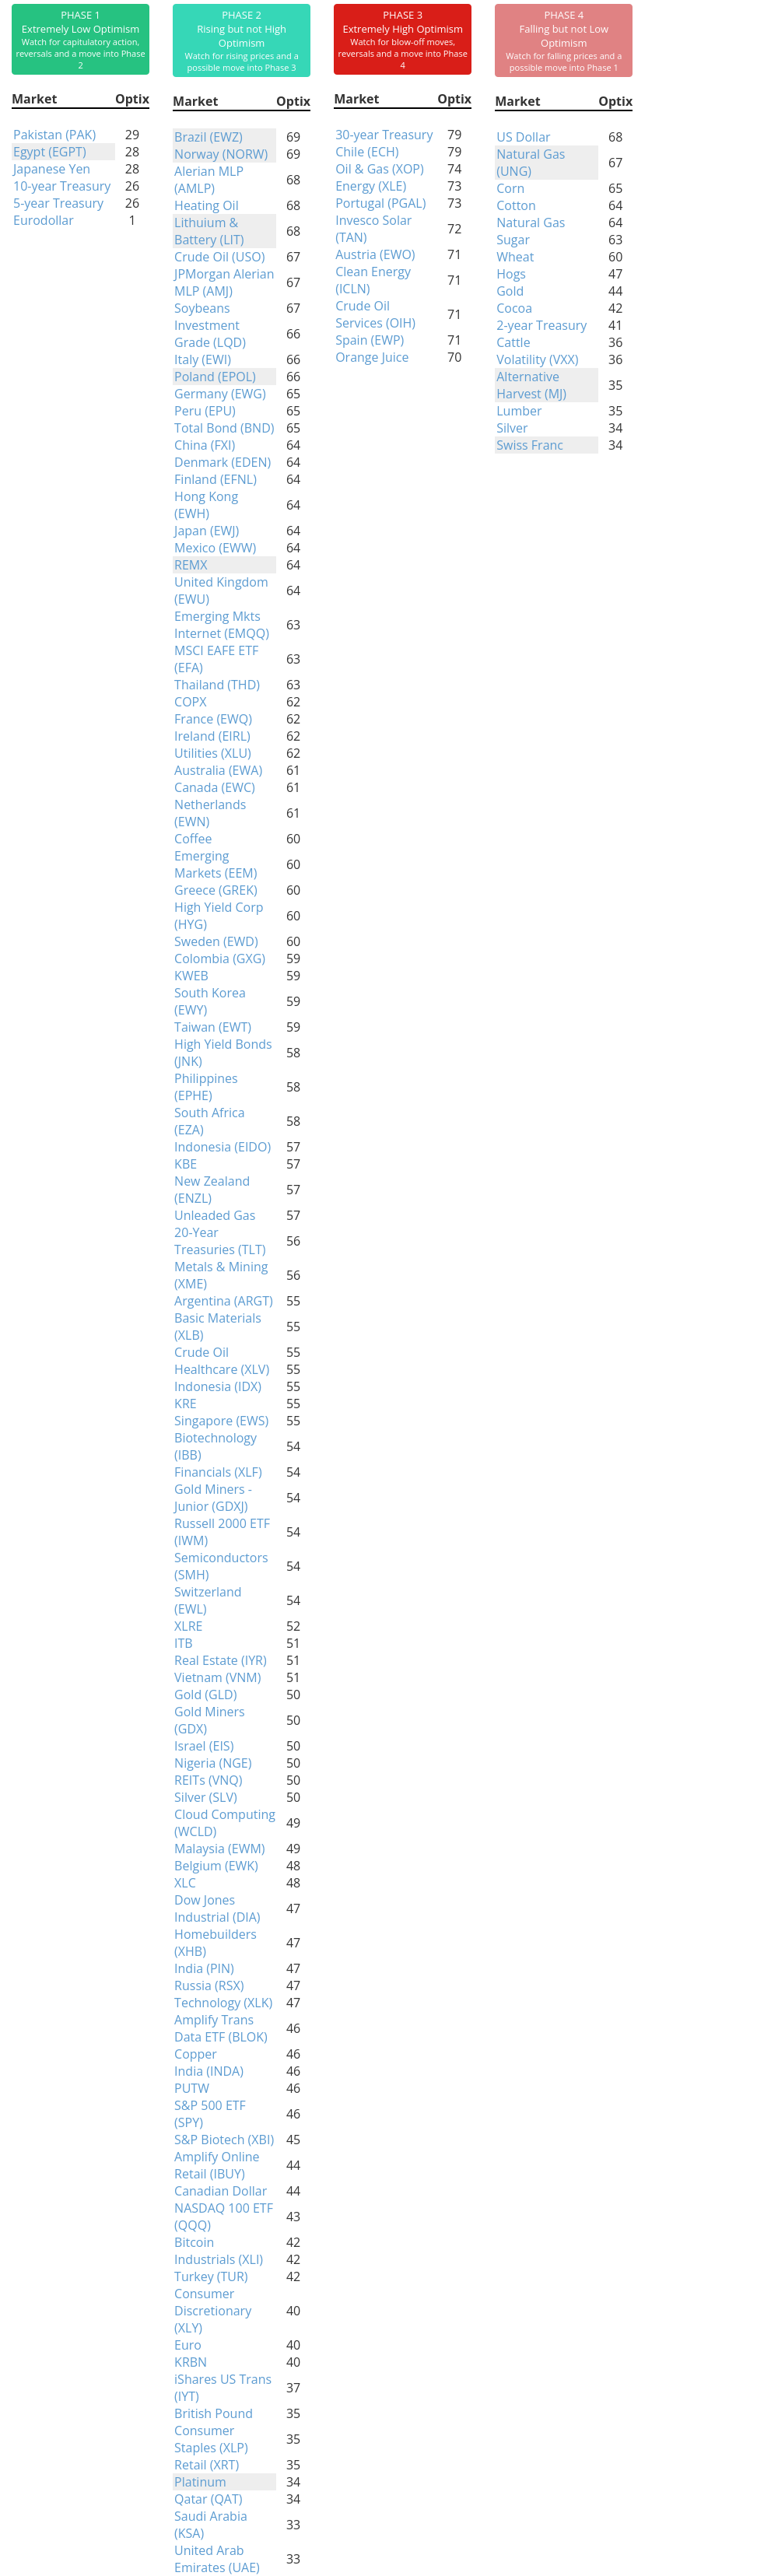
Indicators at Extremes
Phase Table
Ranks
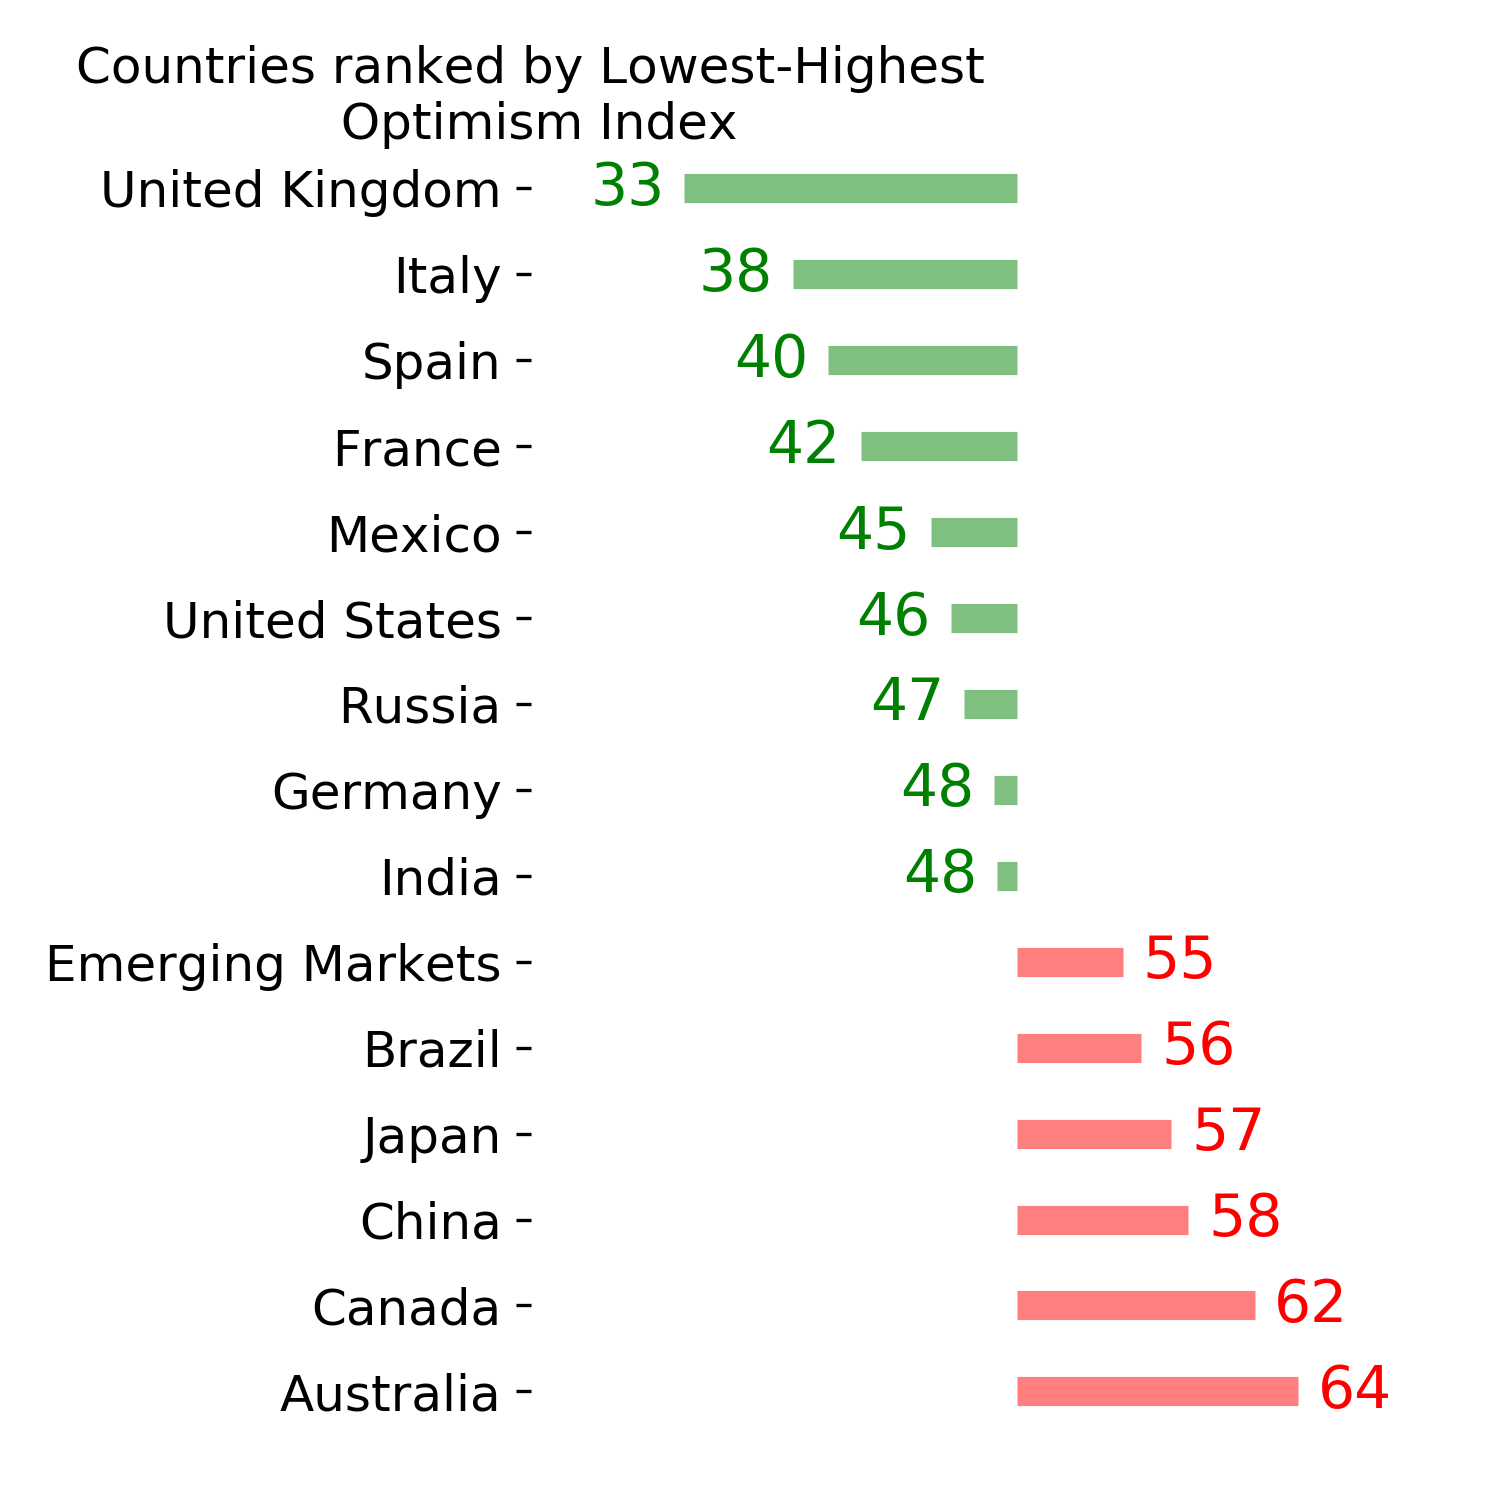
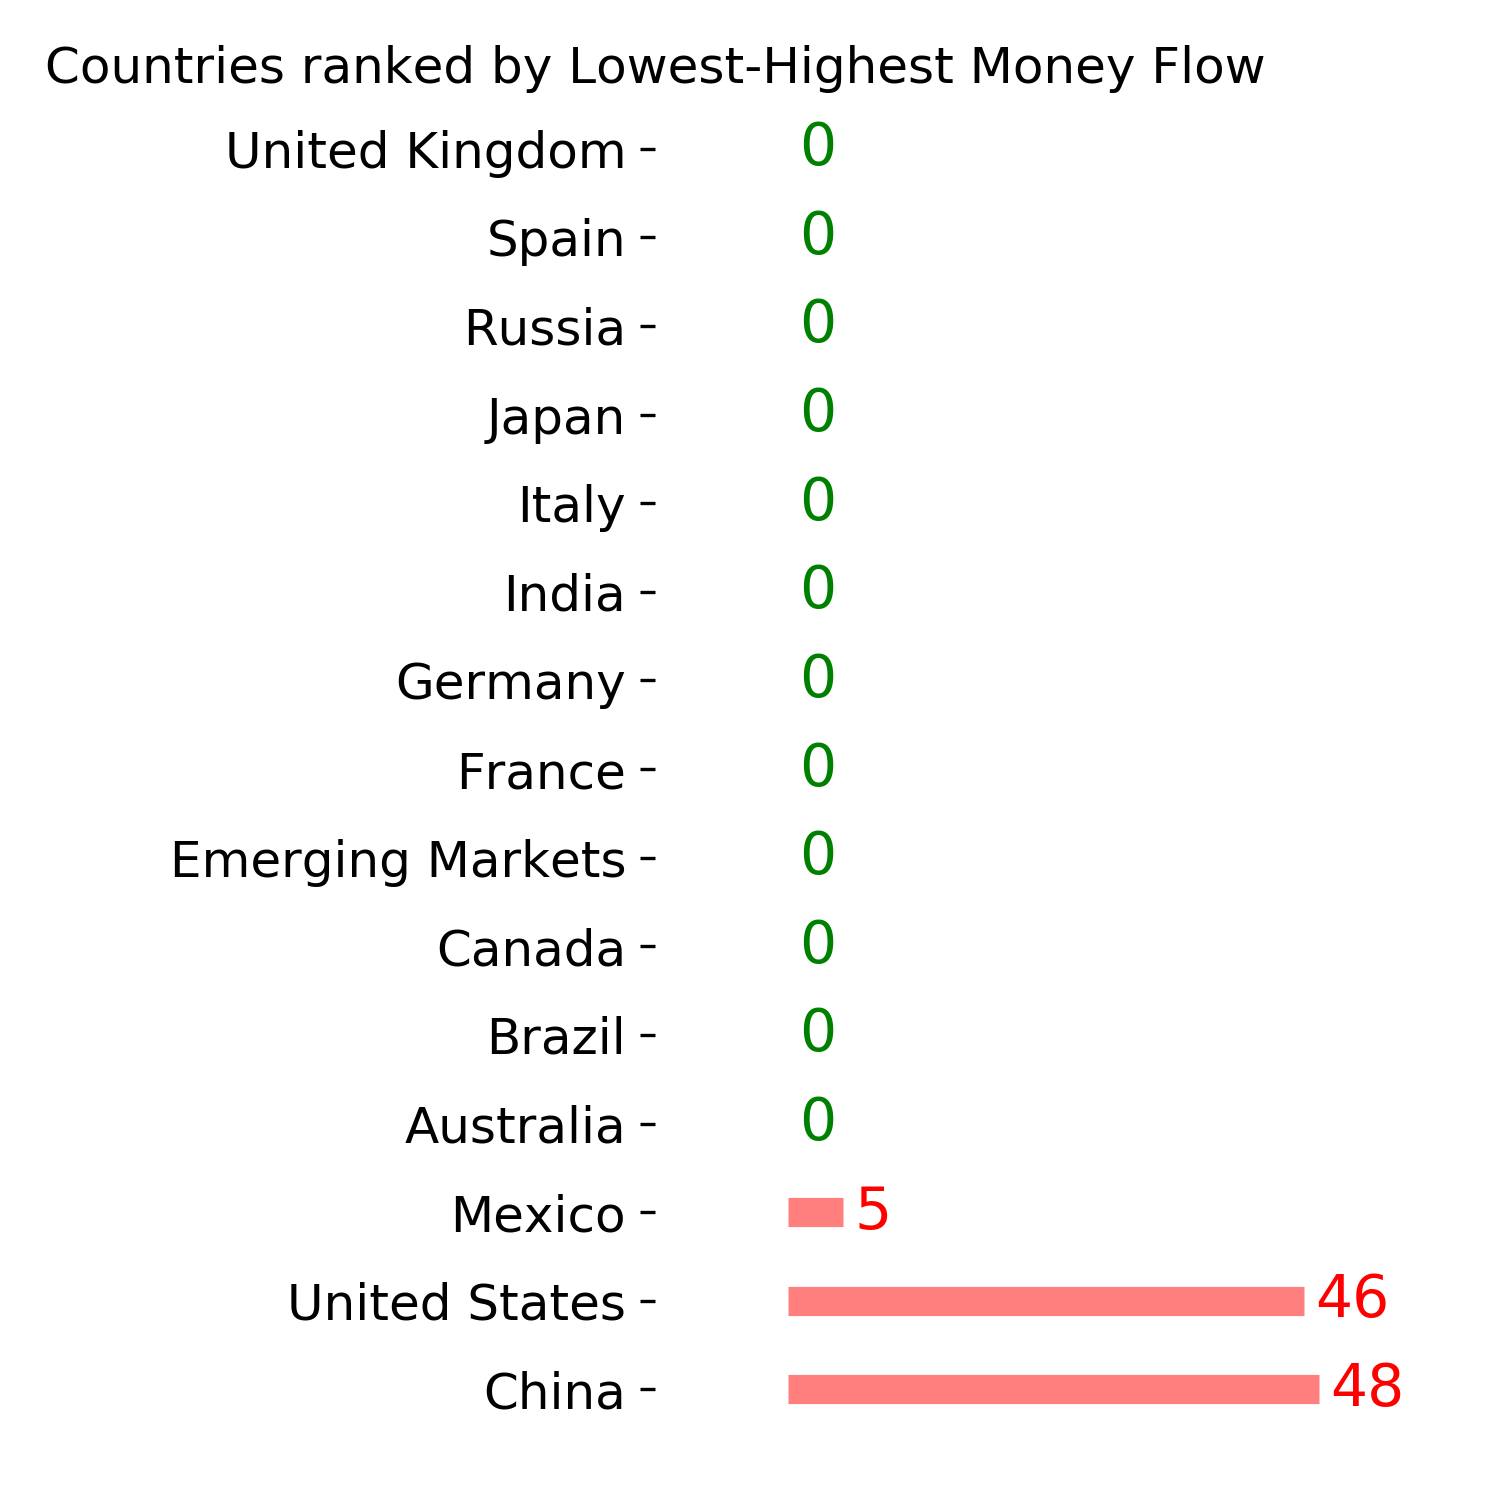
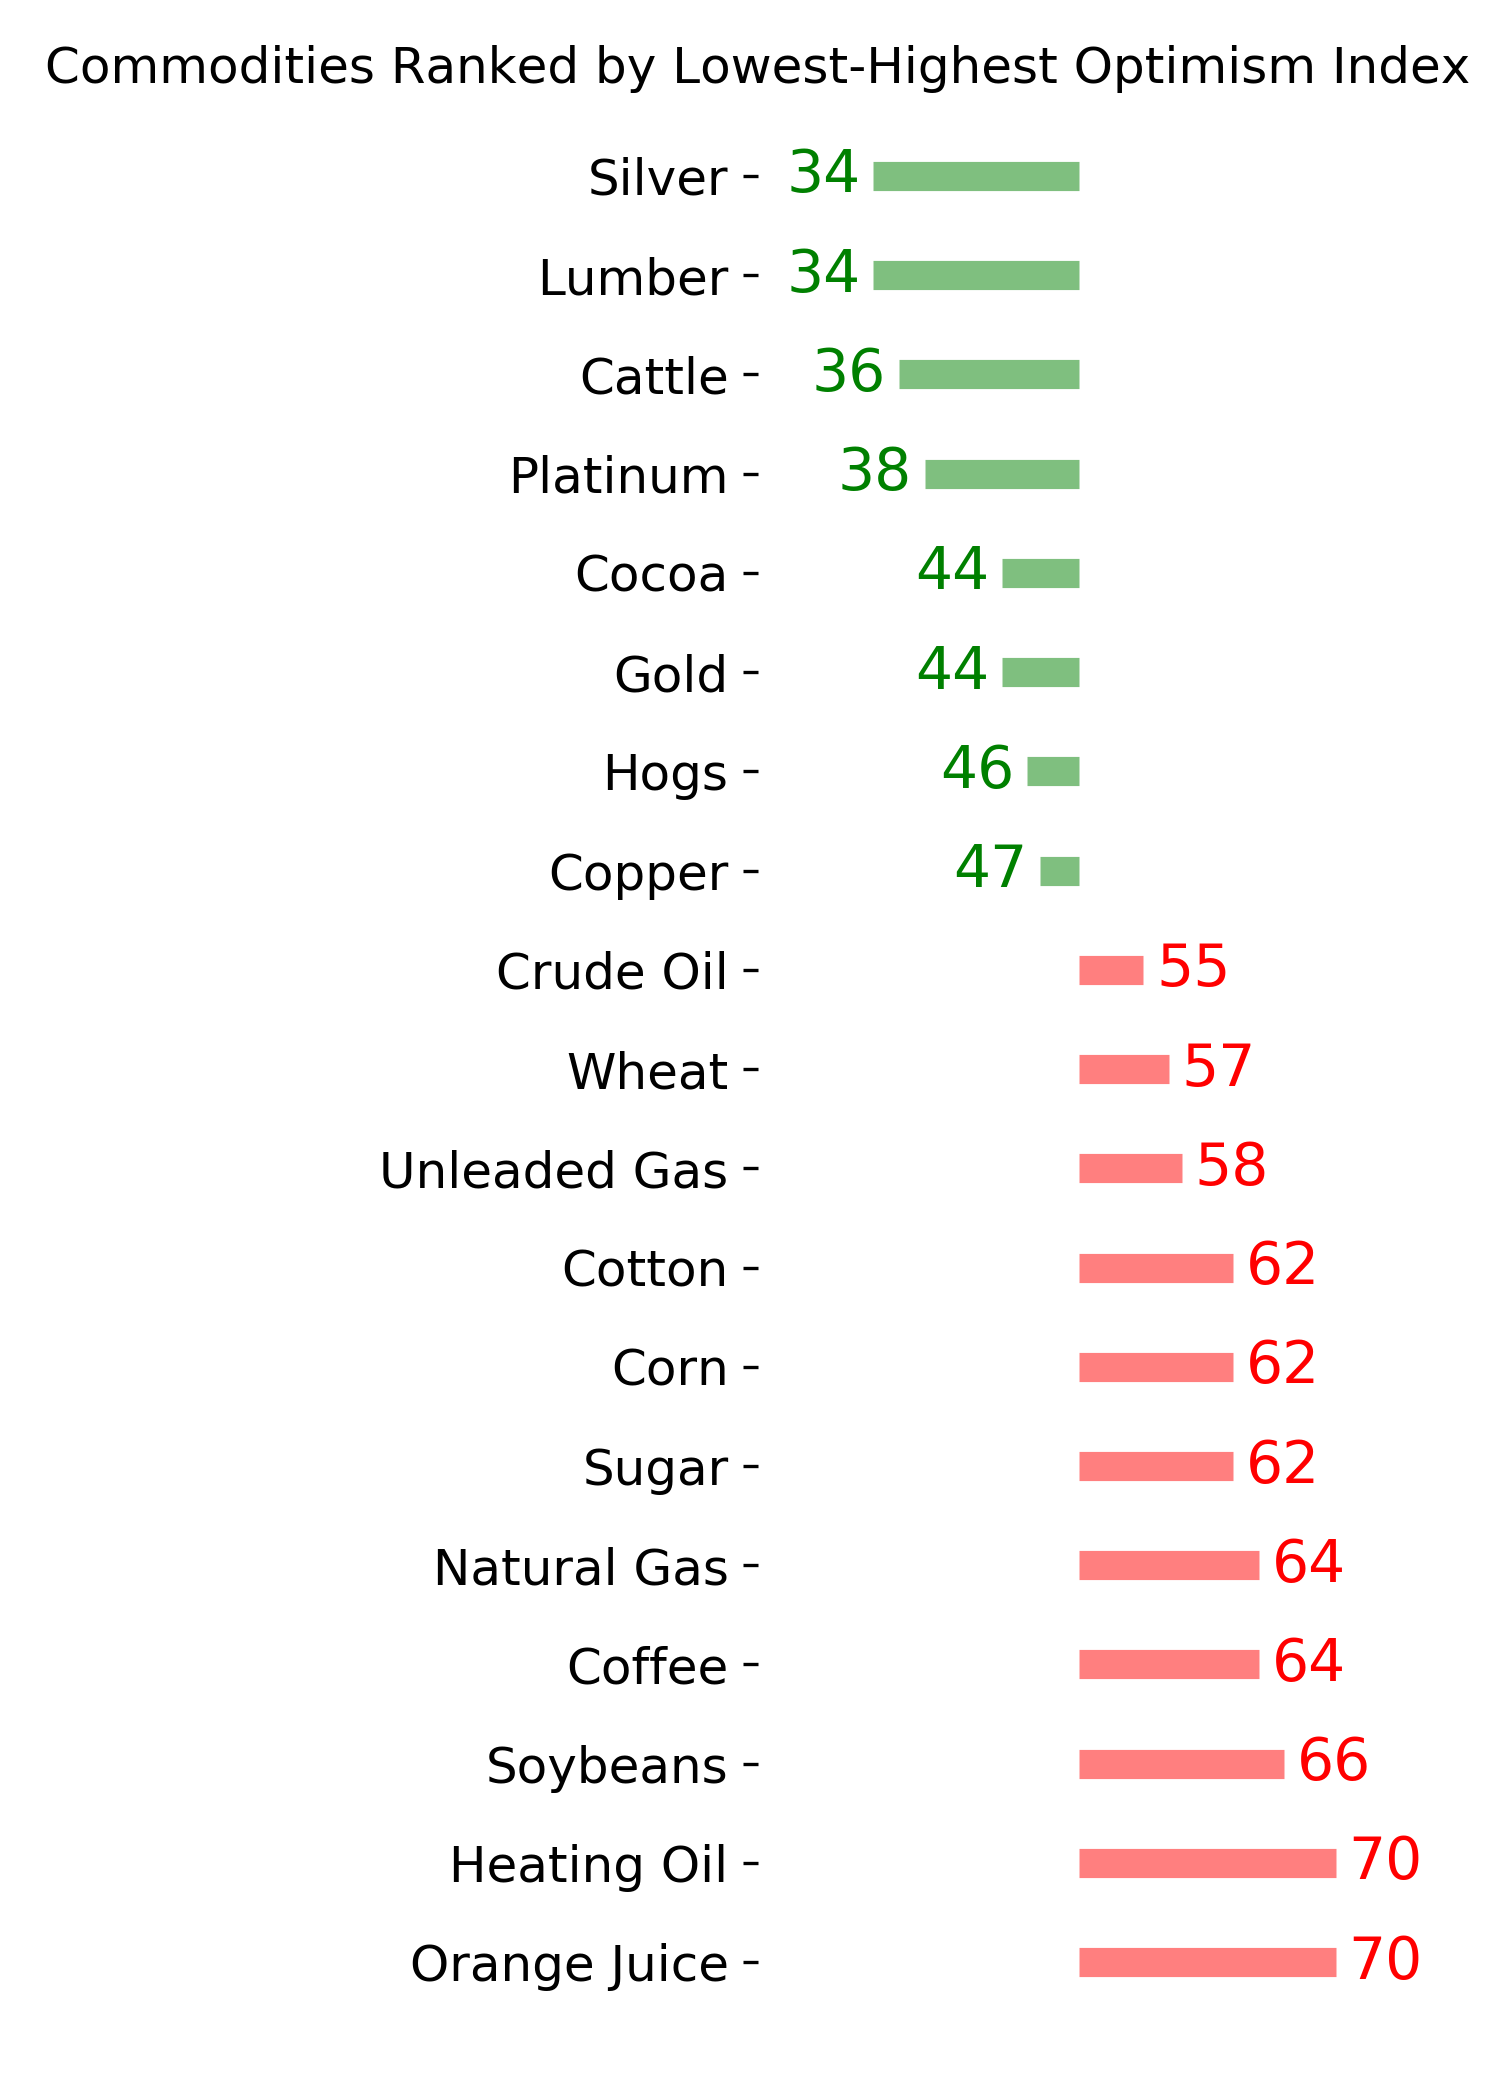
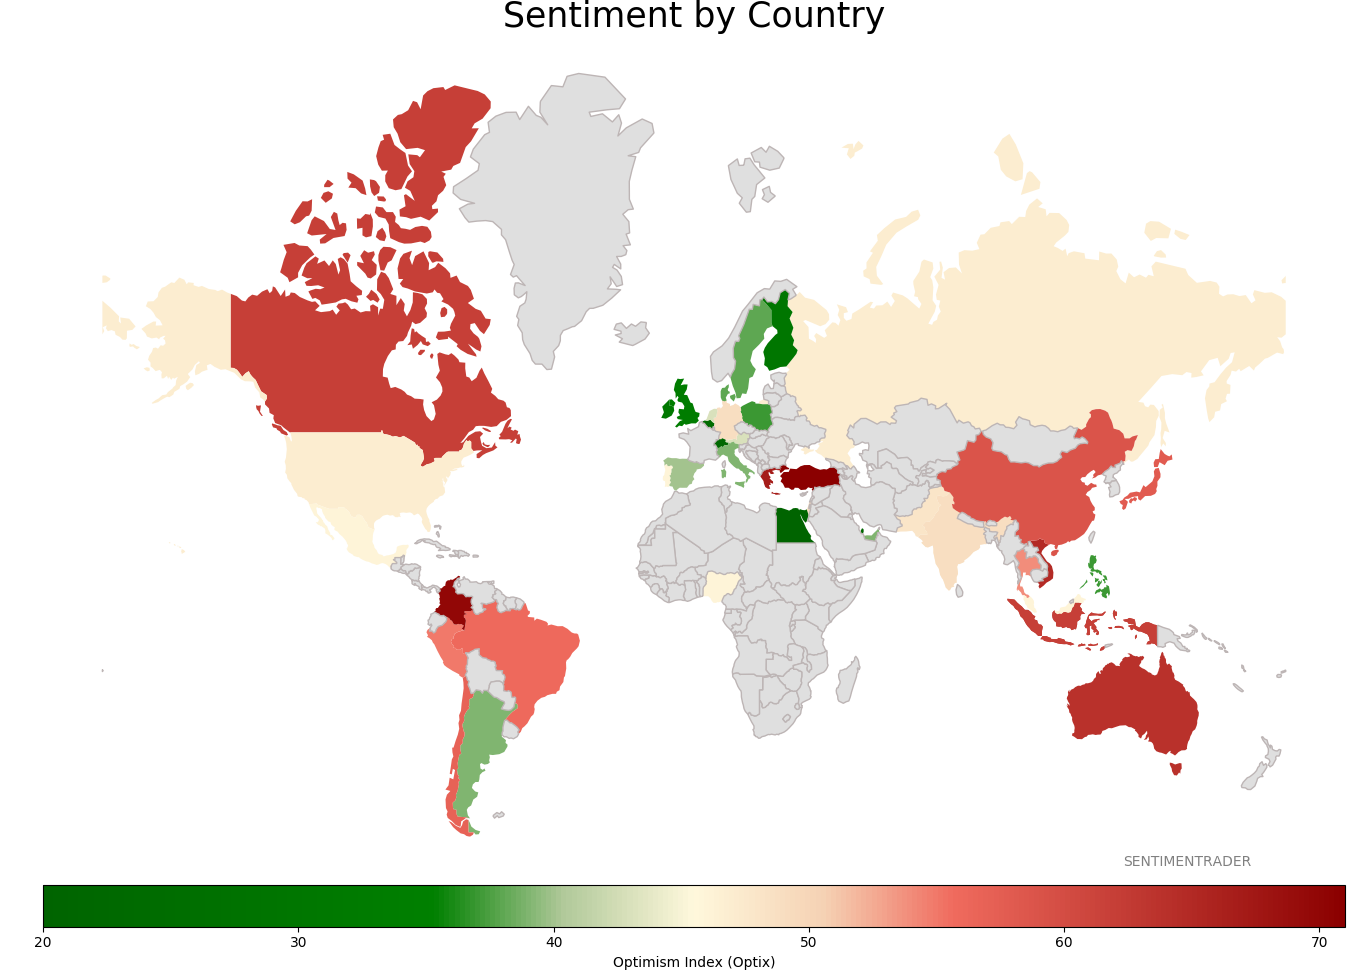
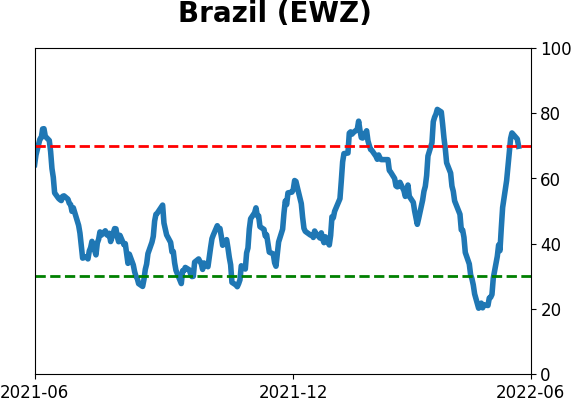
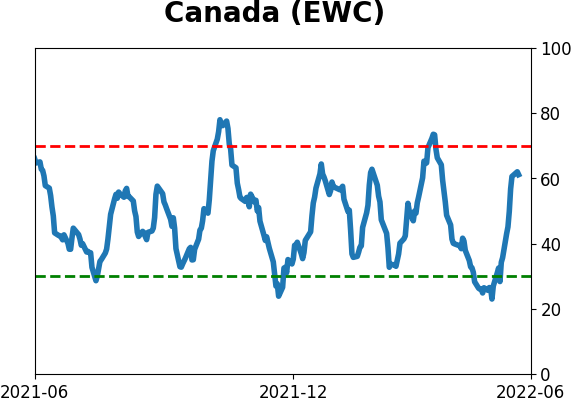
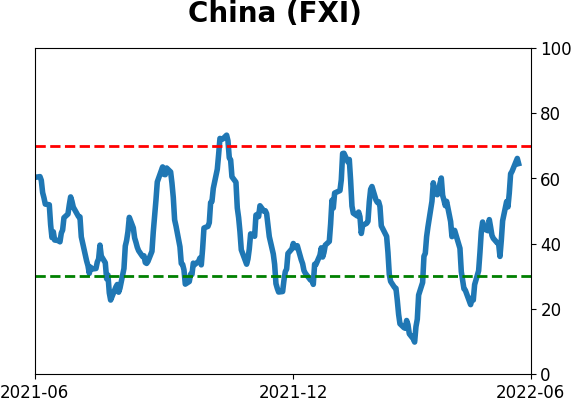
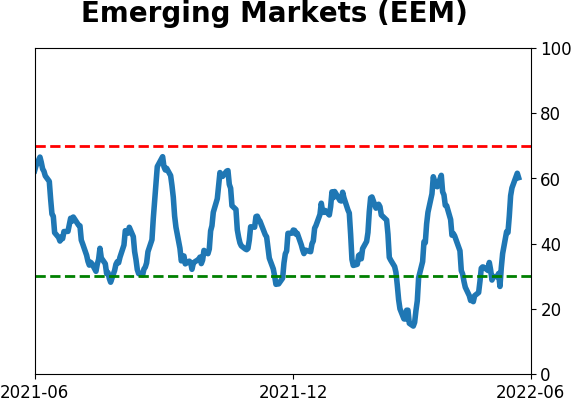
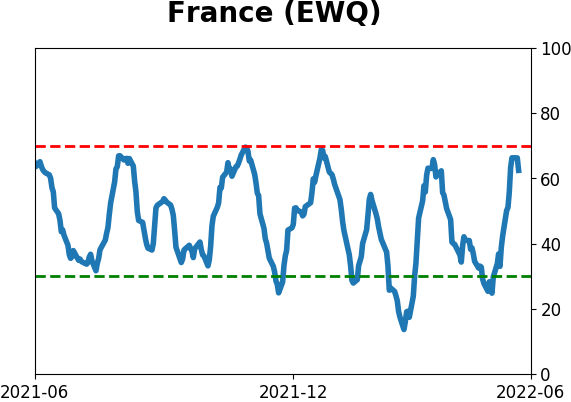
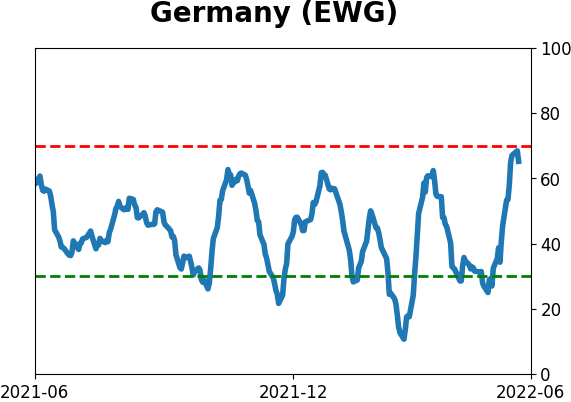
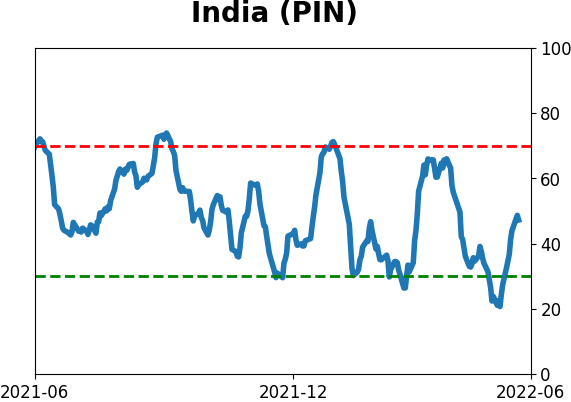
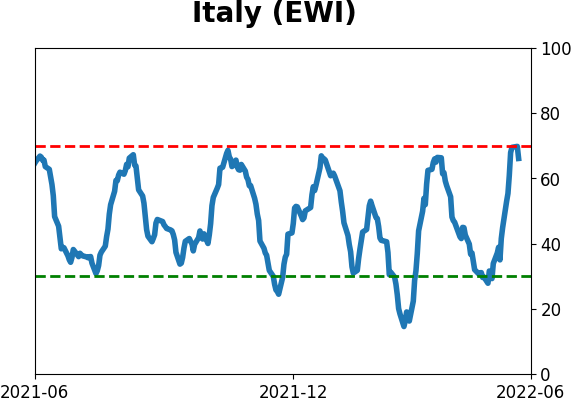
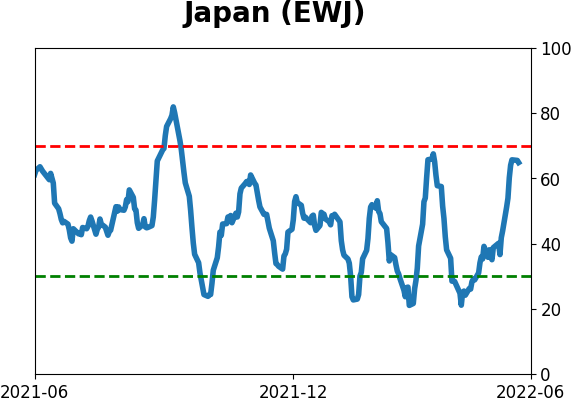
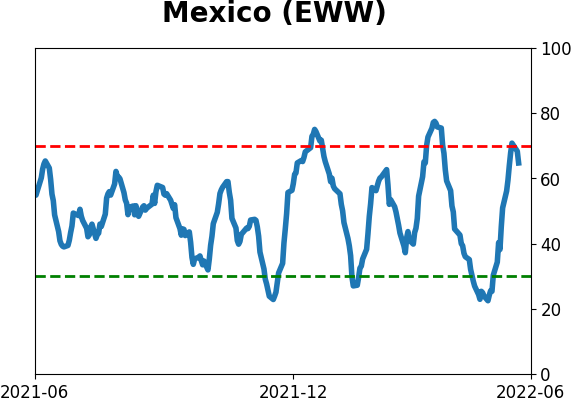
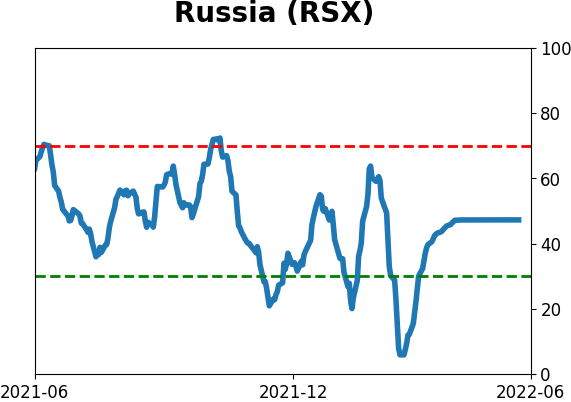
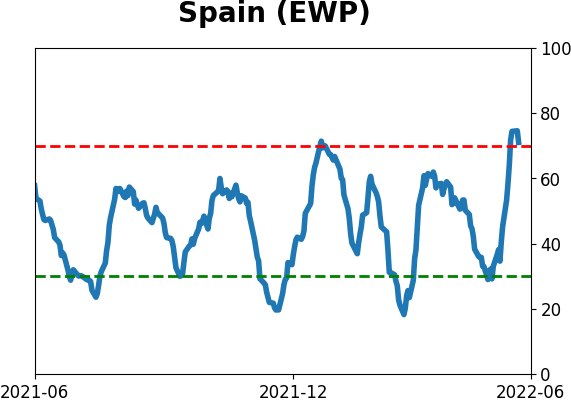
Sentiment Around The World
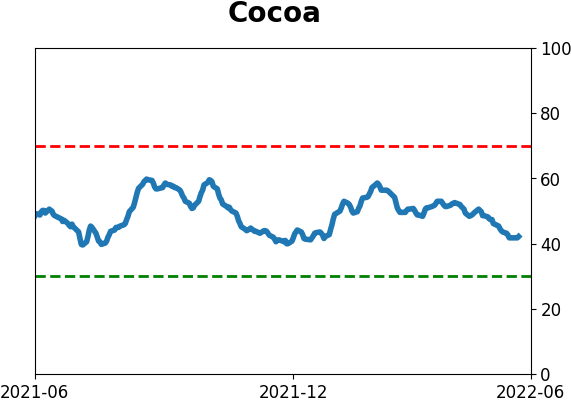
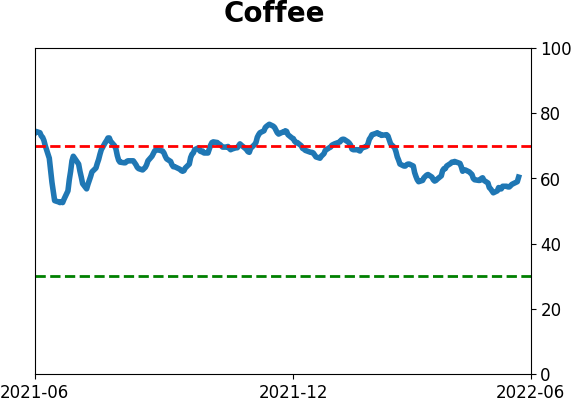
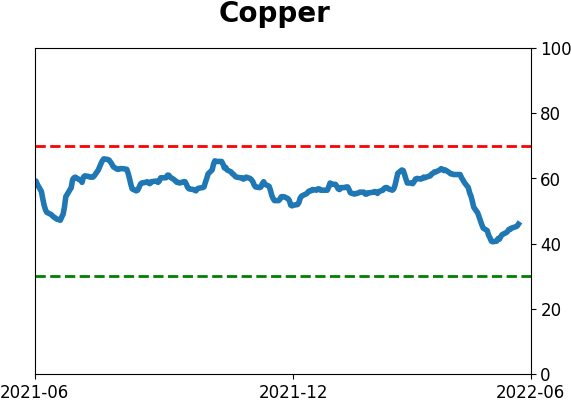
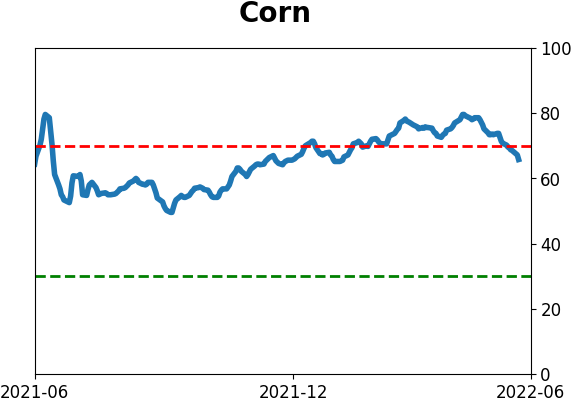
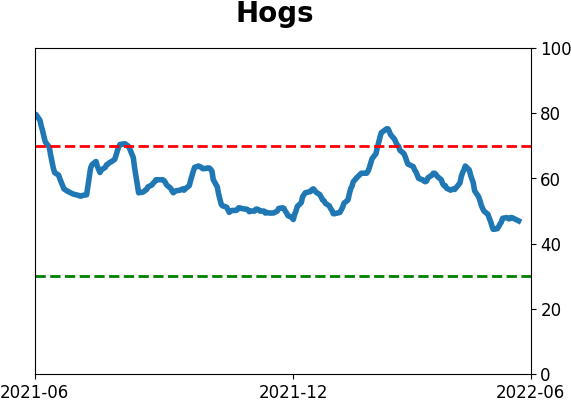
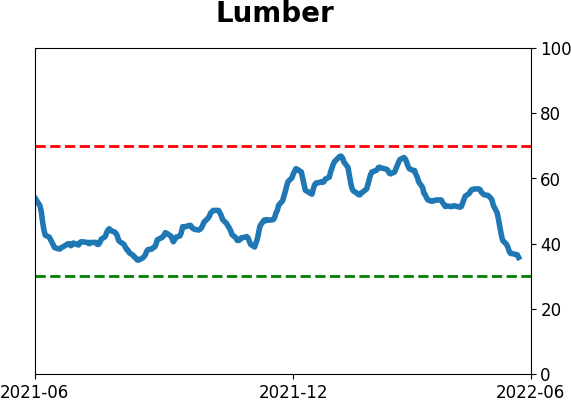
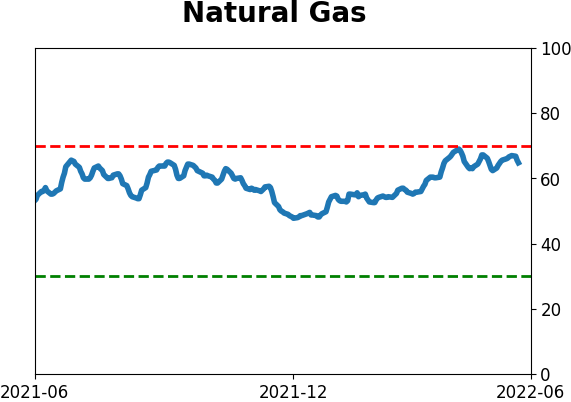
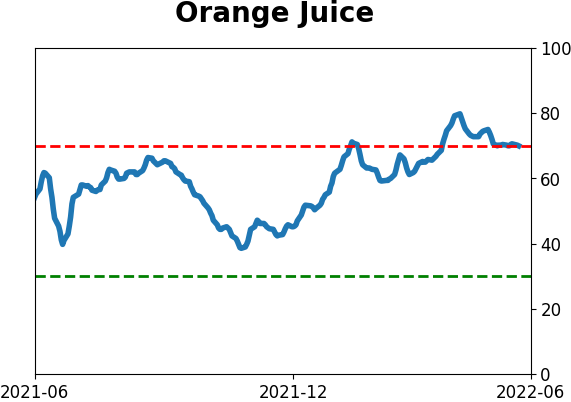
Optimism Index Thumbnails
|
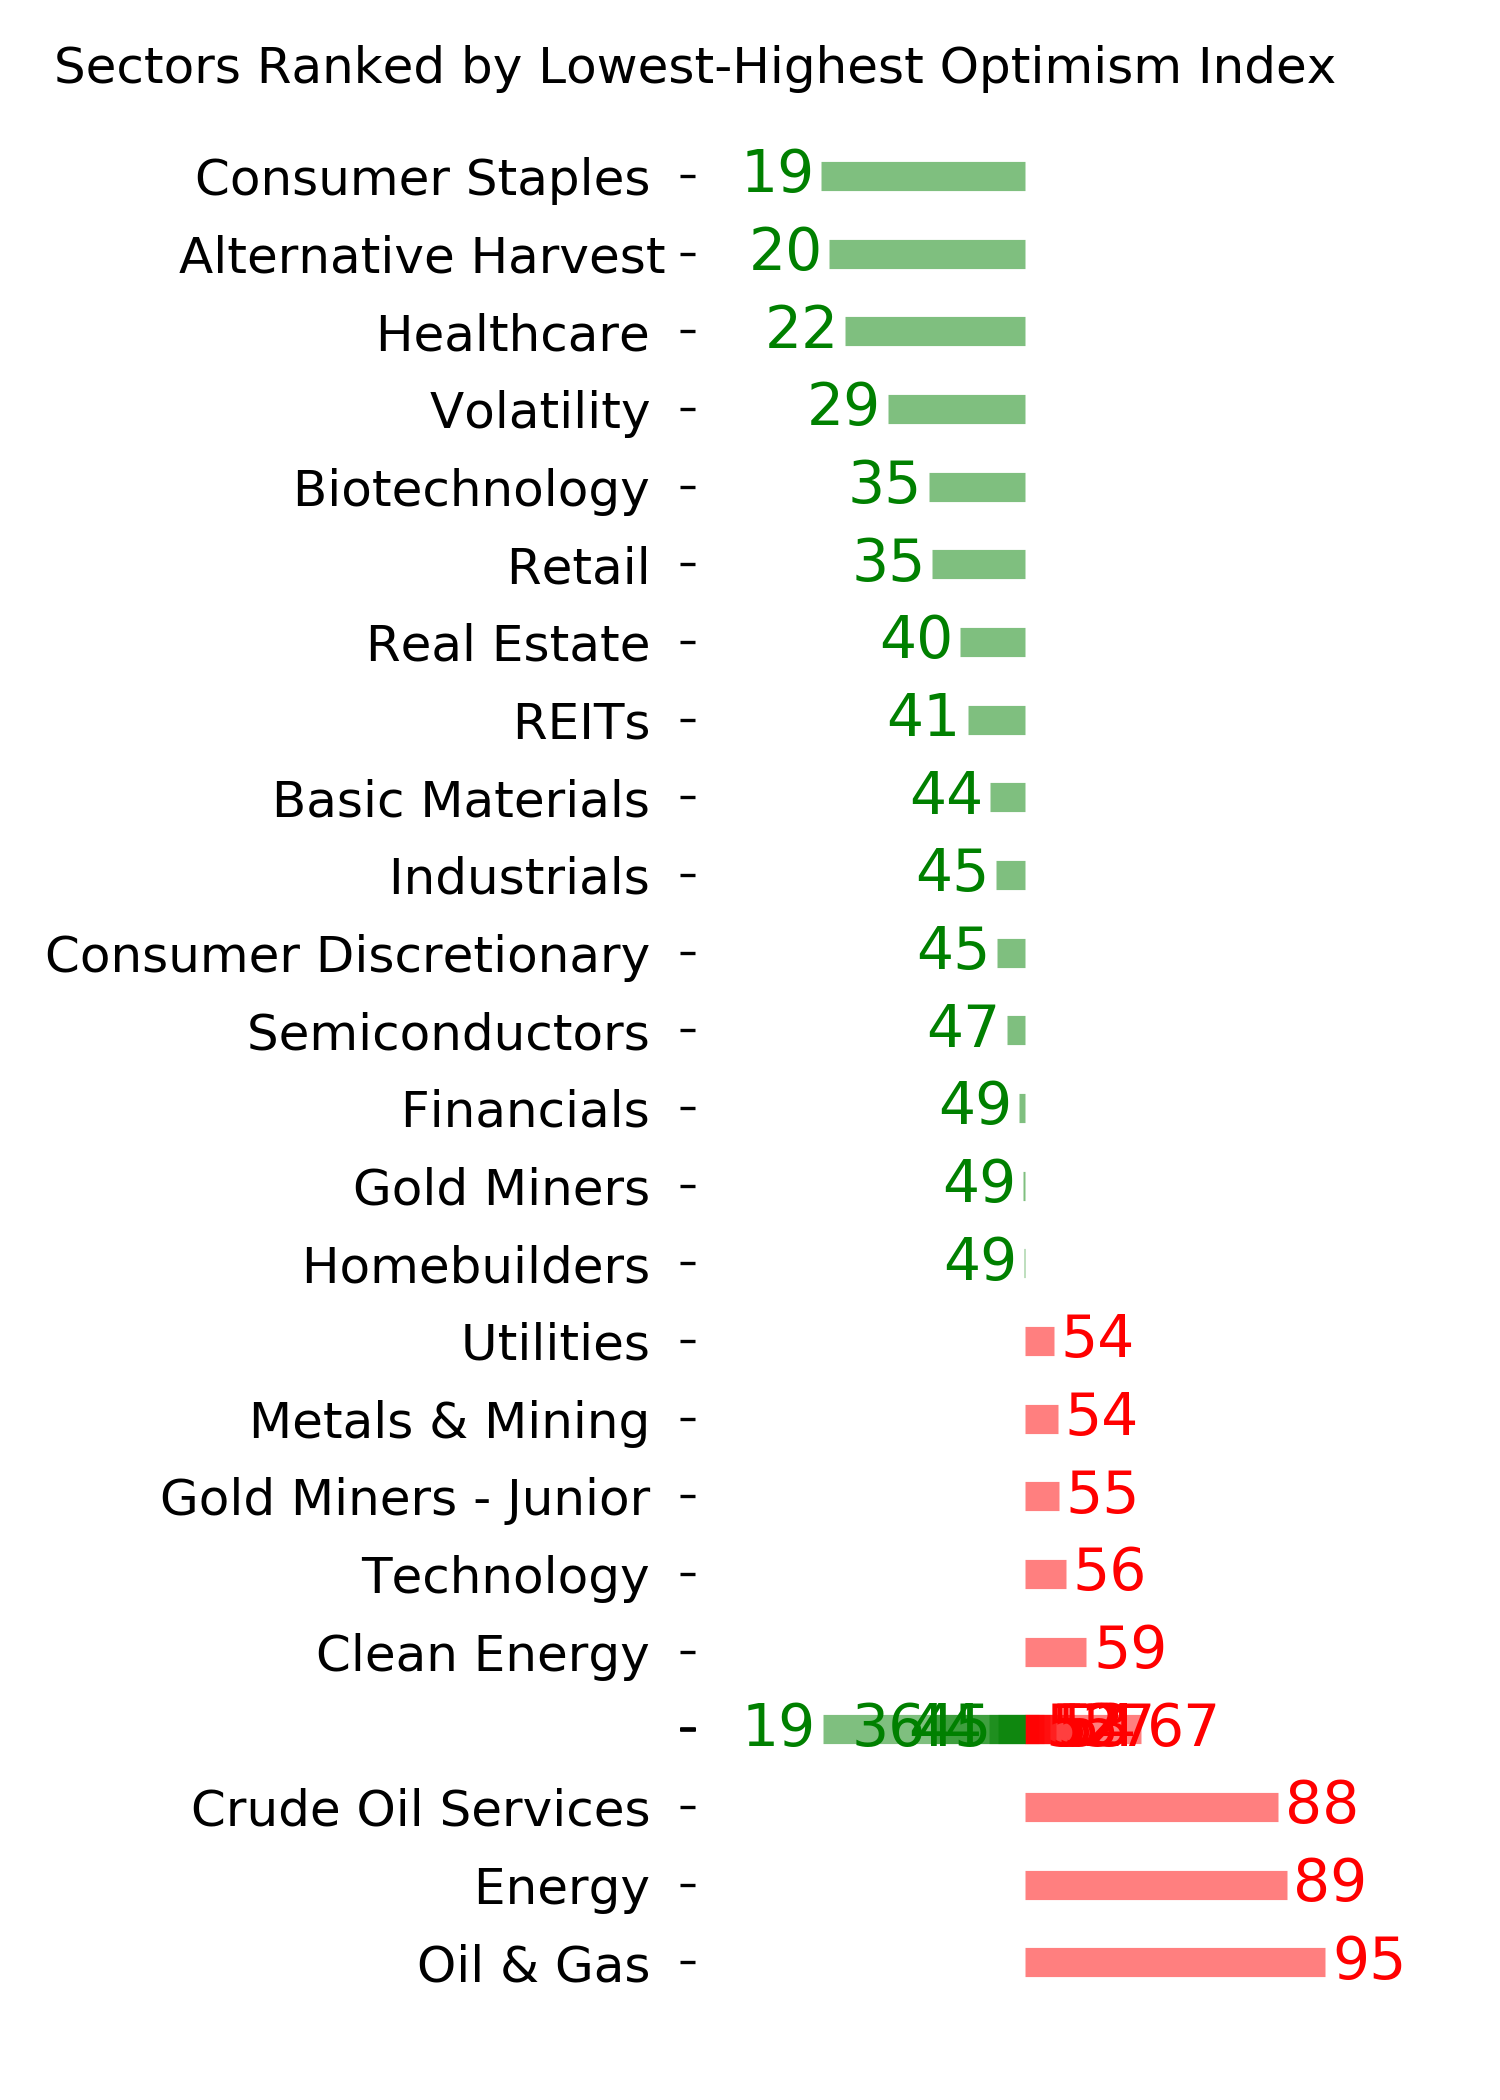
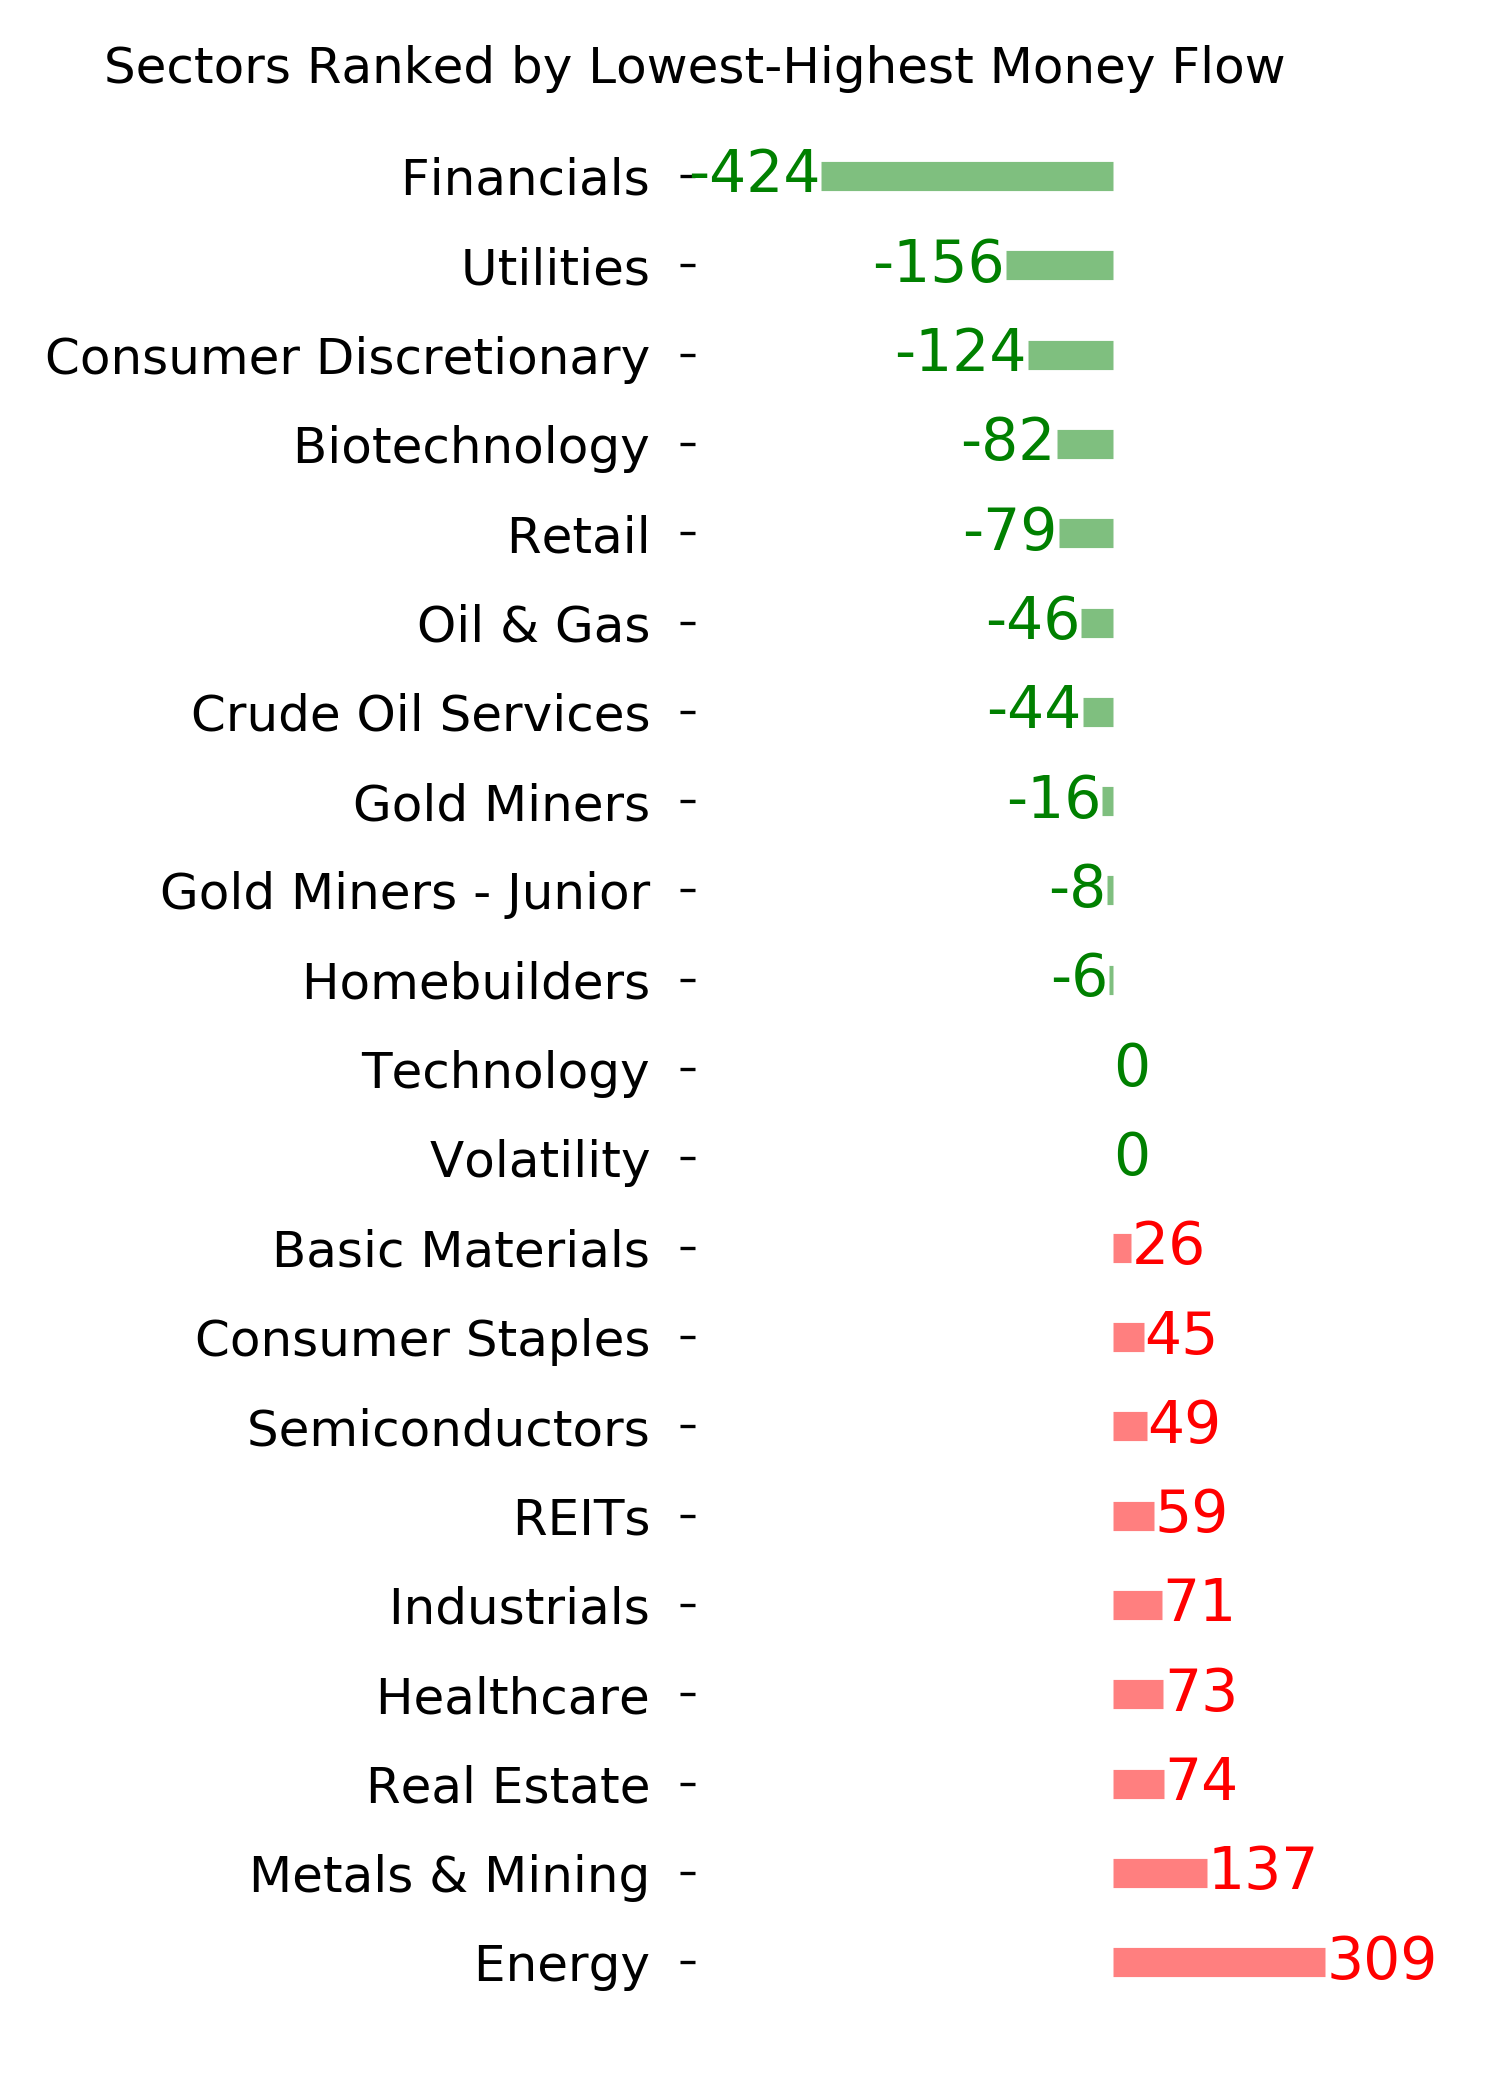
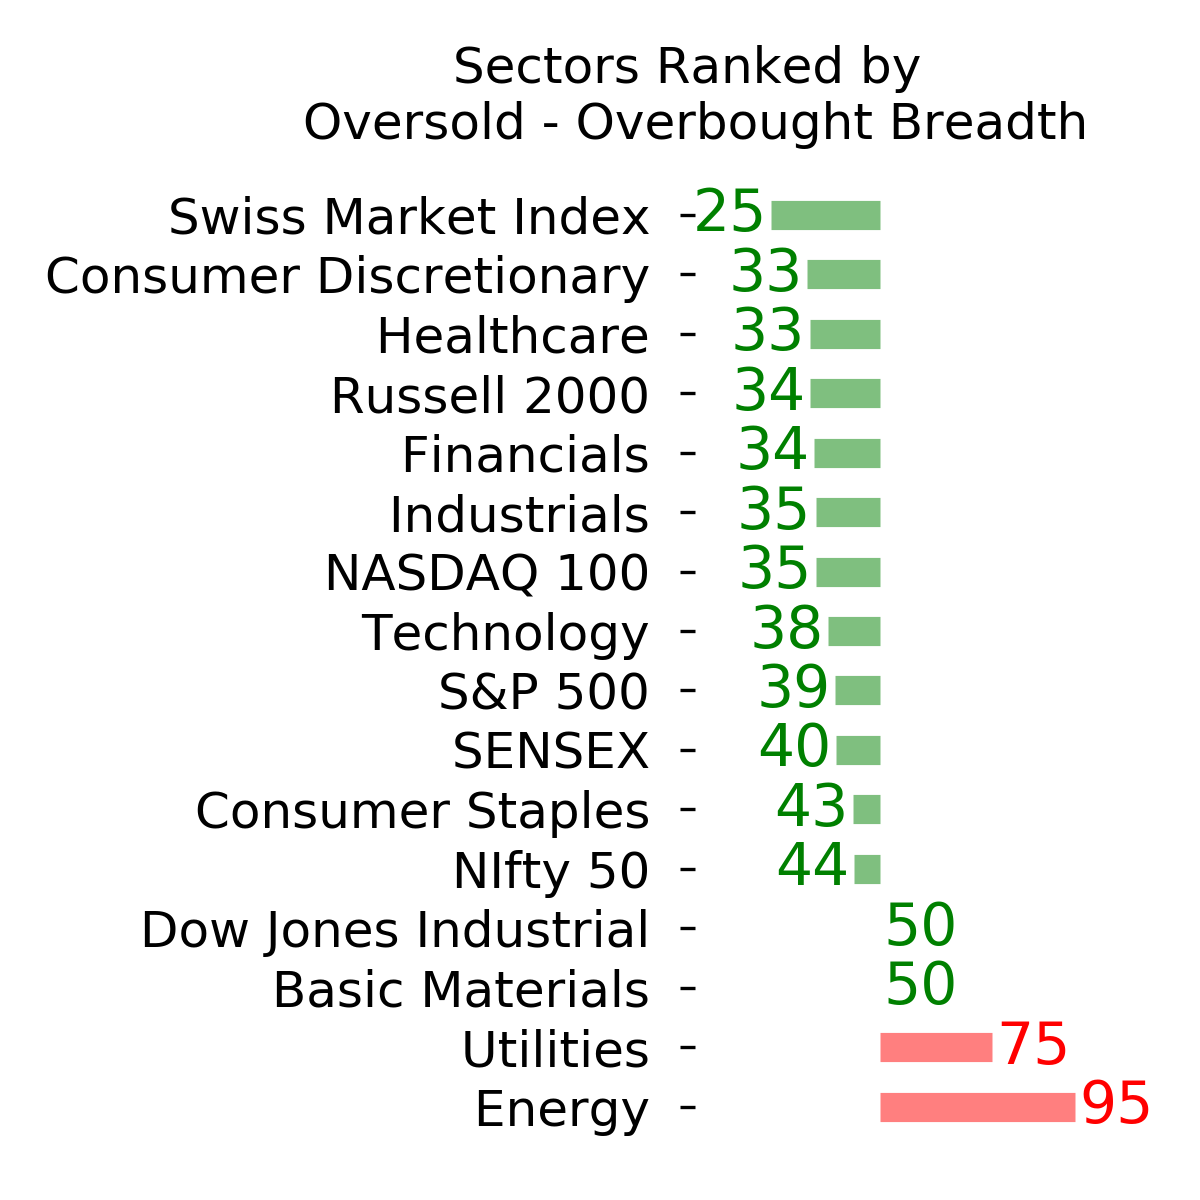
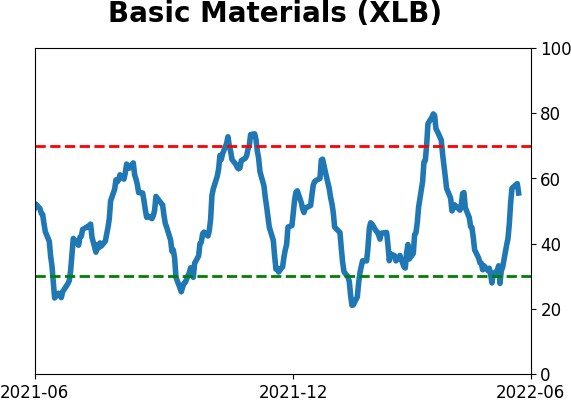
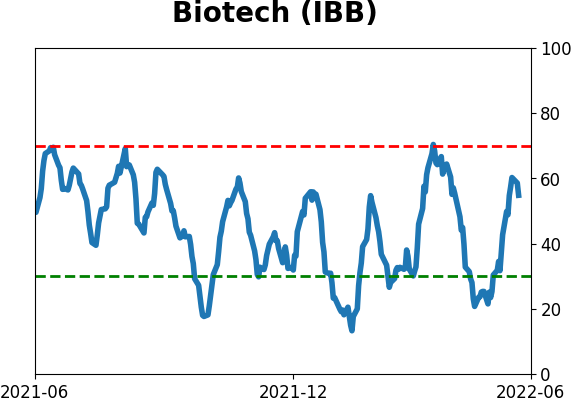
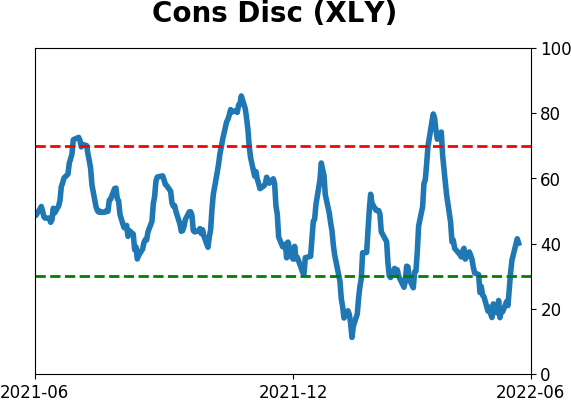
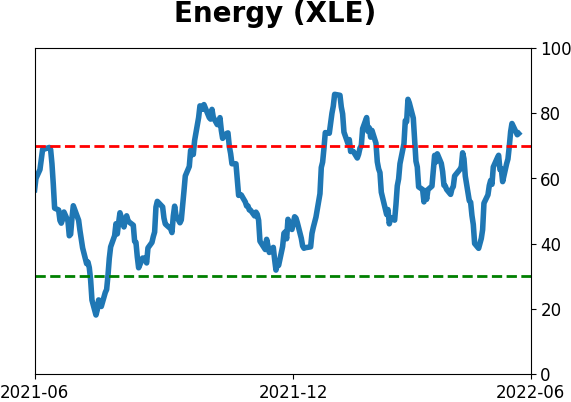
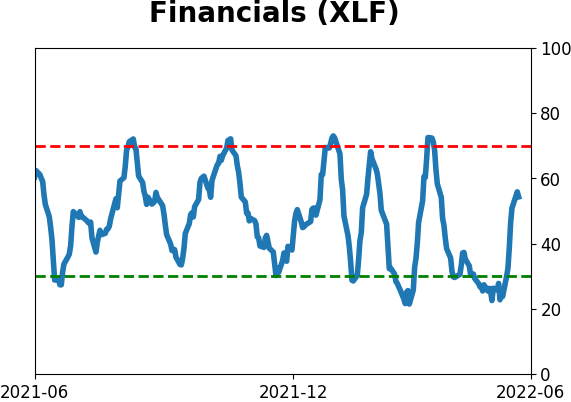
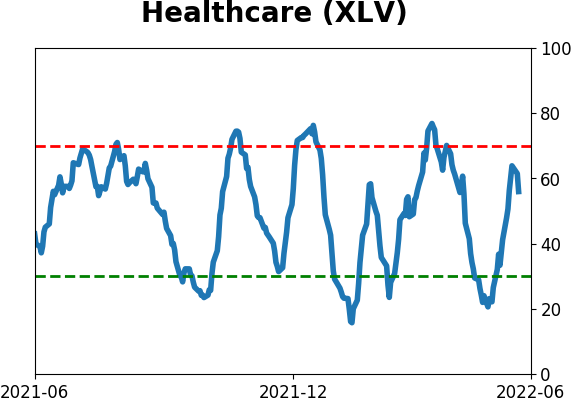
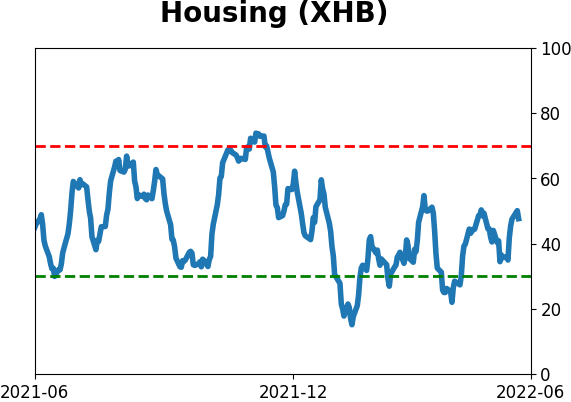
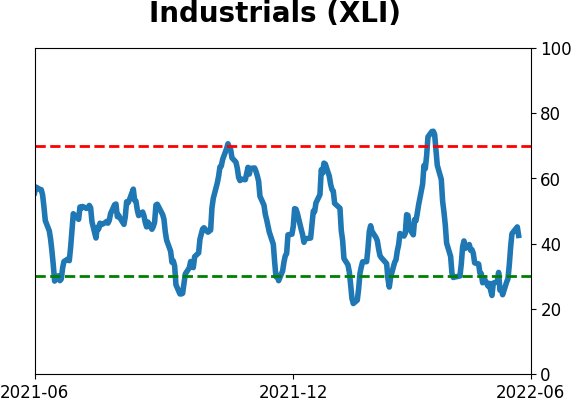
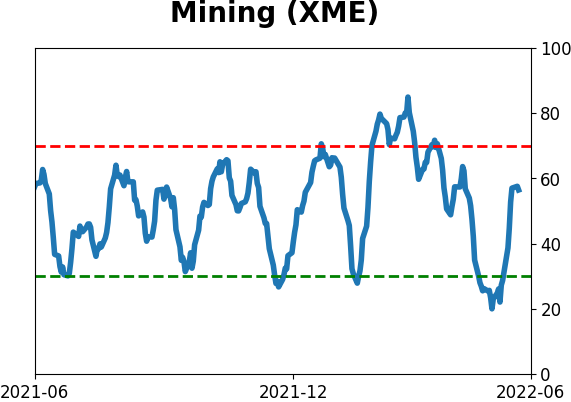
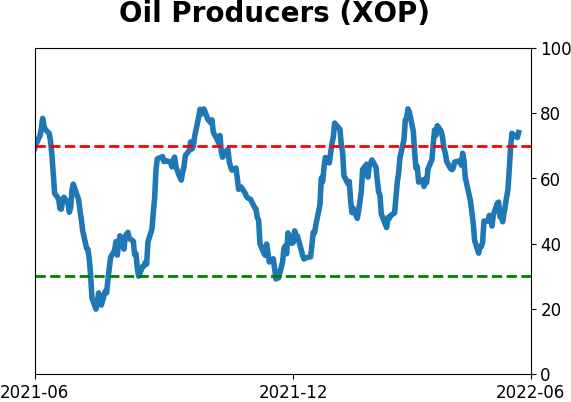
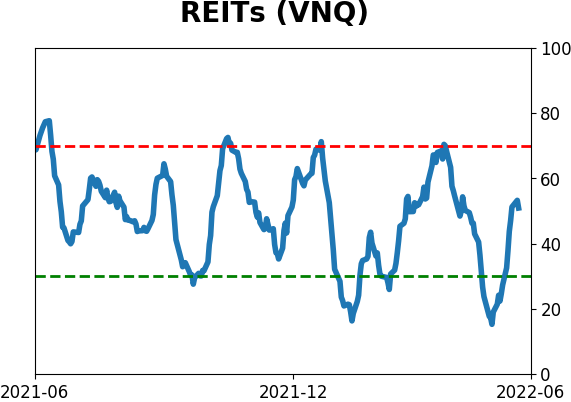
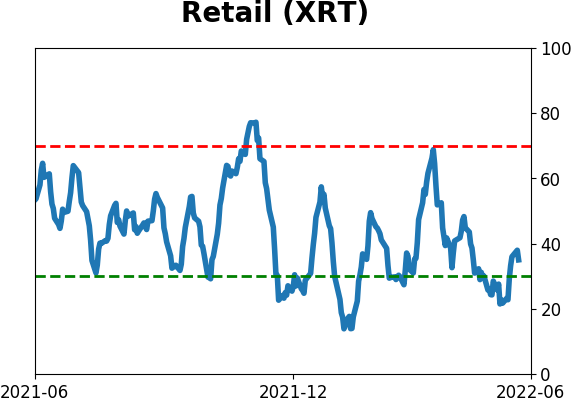
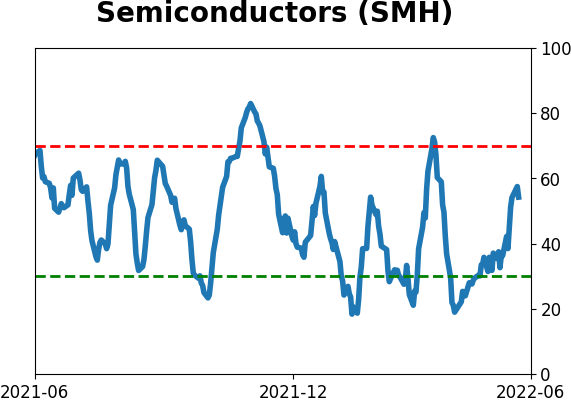
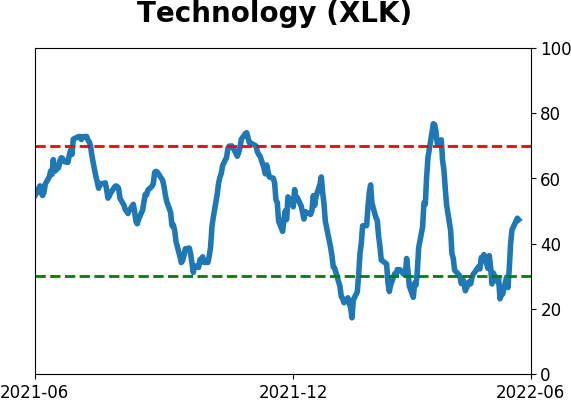
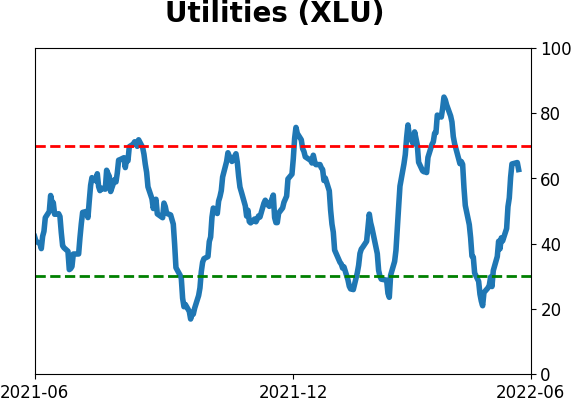
Sector ETF's - 10-Day Moving Average
|
|
|
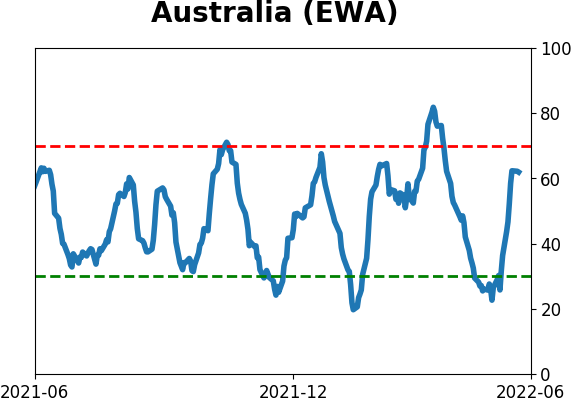
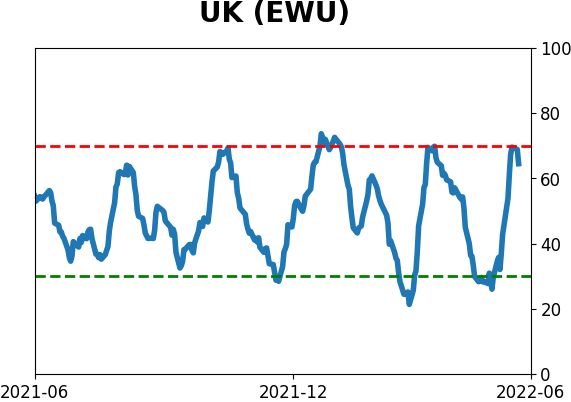
Country ETF's - 10-Day Moving Average
|
|
|
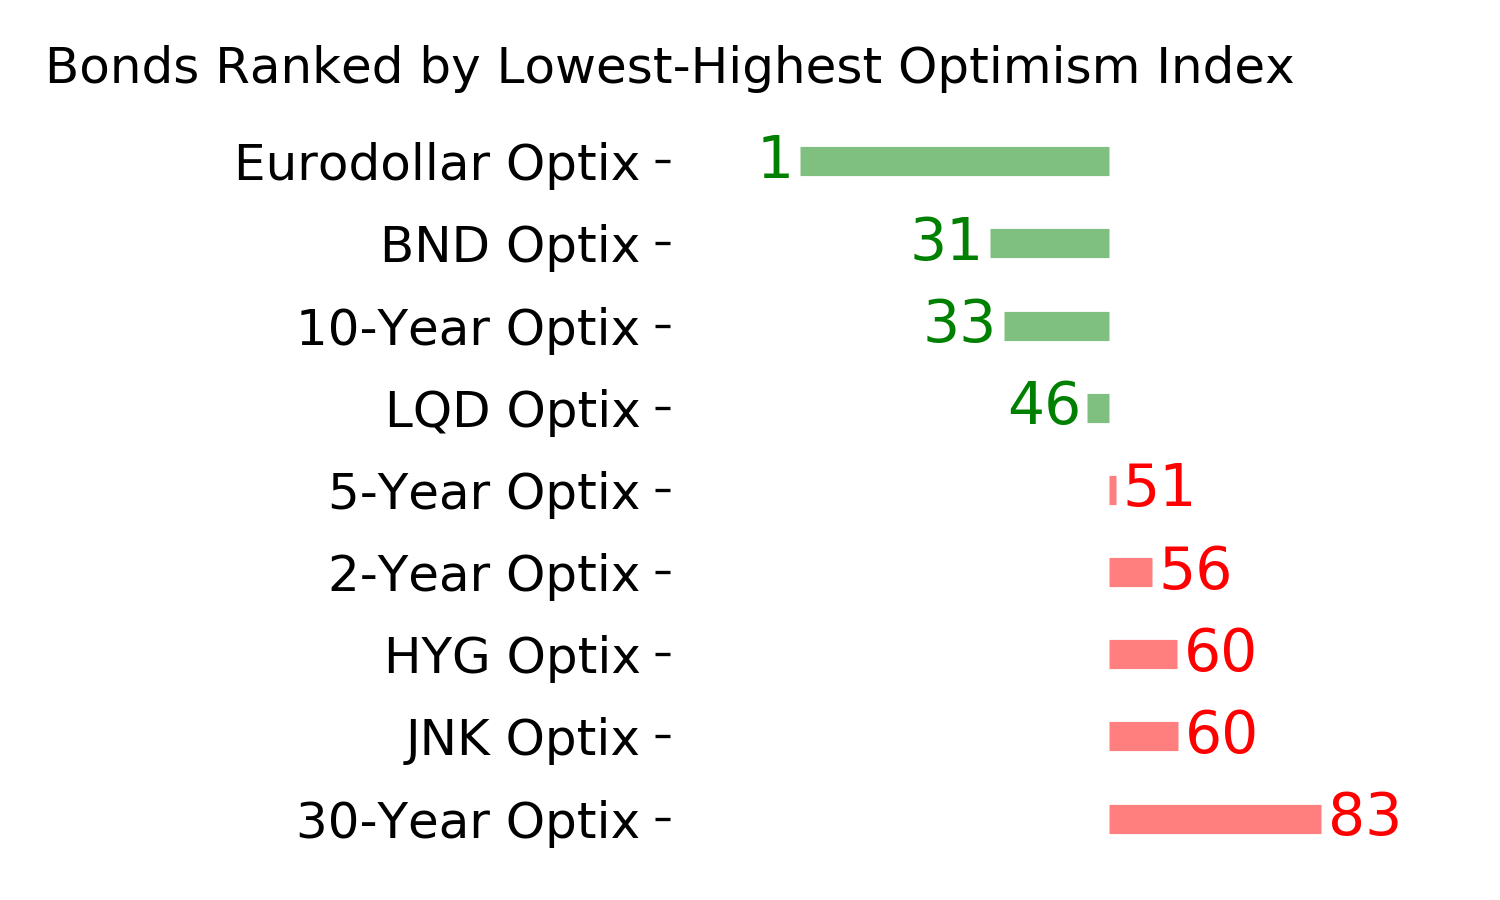
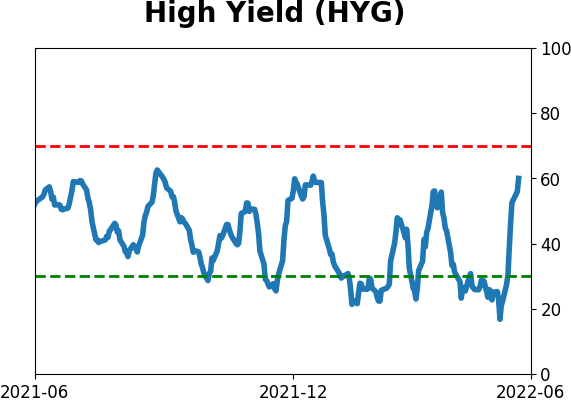
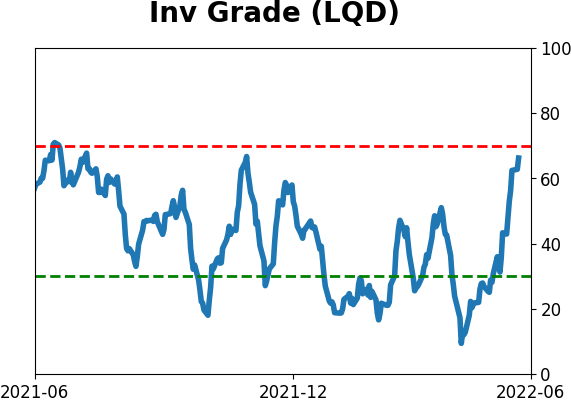
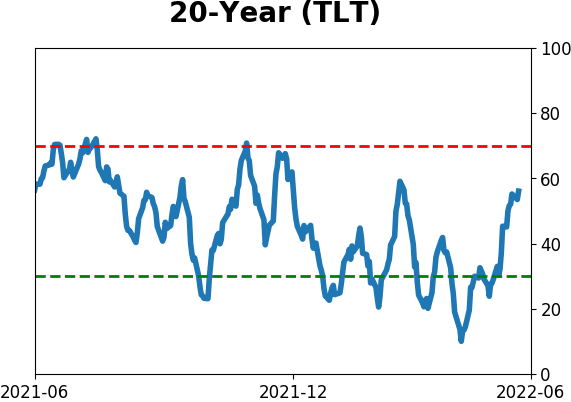
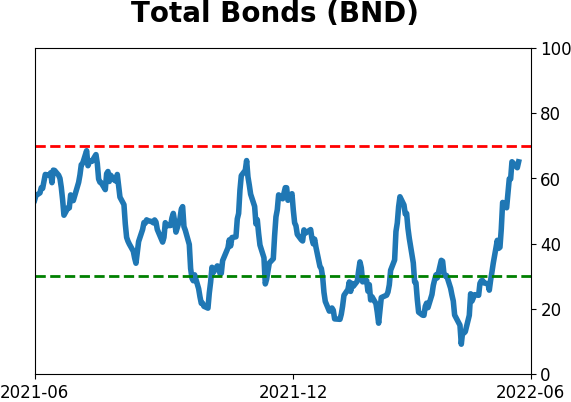
Bond ETF's - 10-Day Moving Average
|
|
|
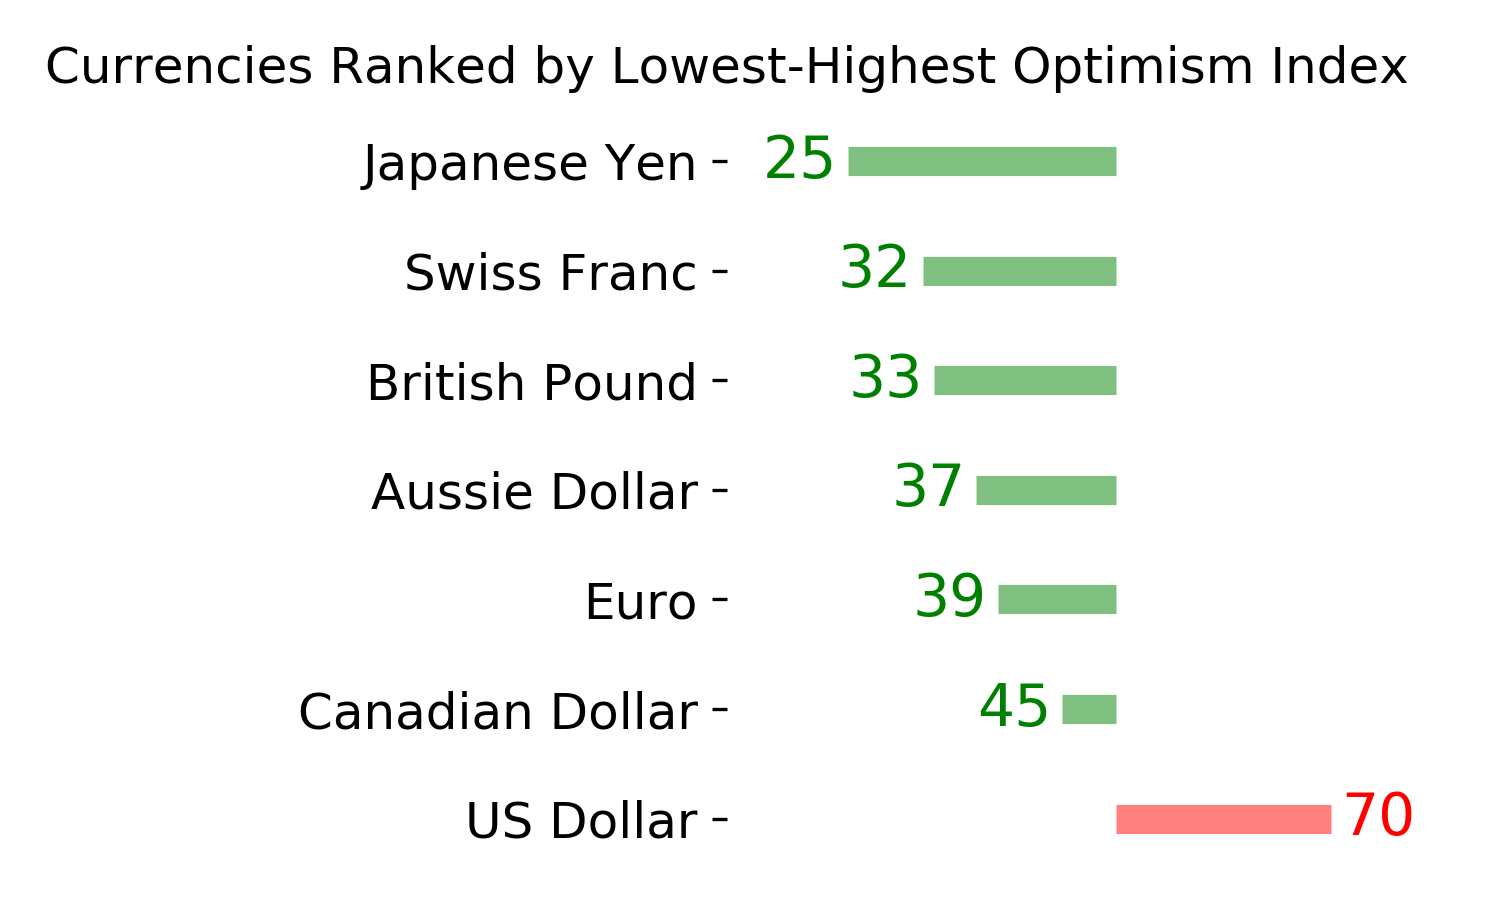
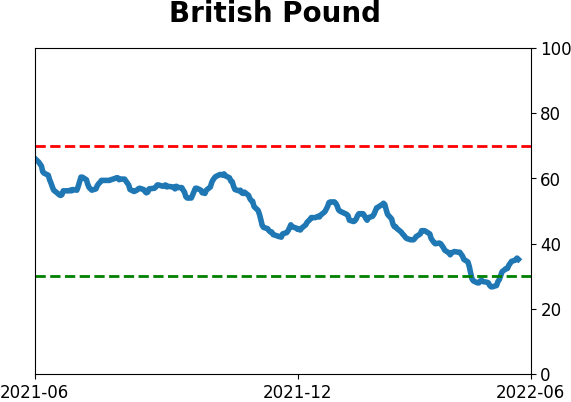
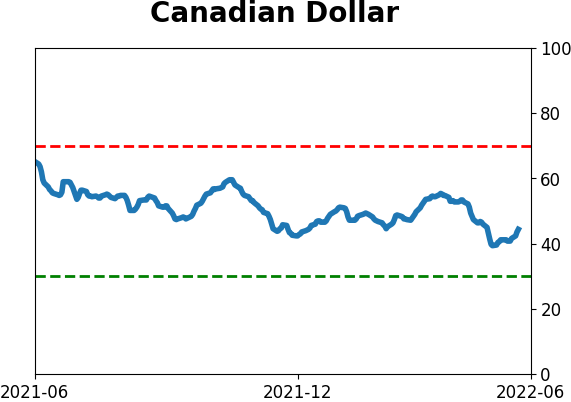
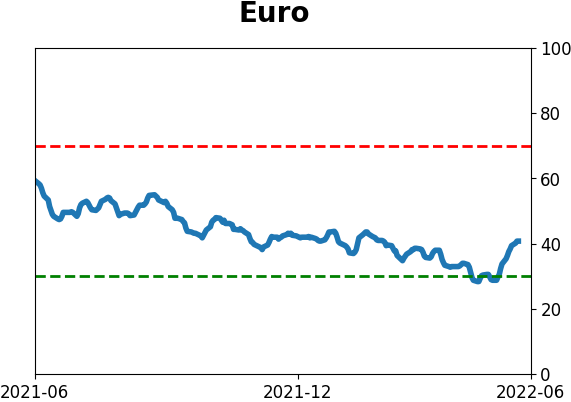
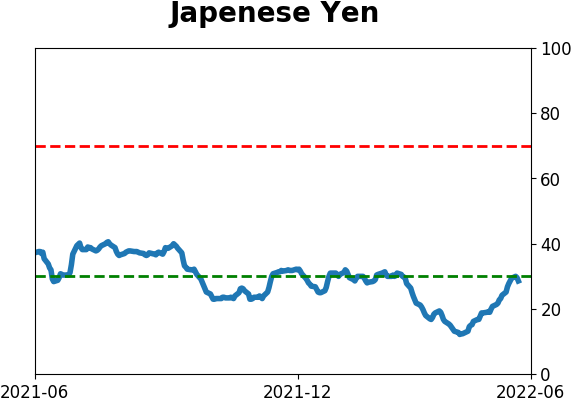
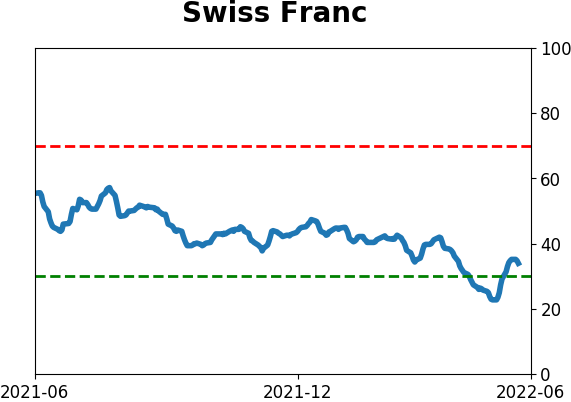
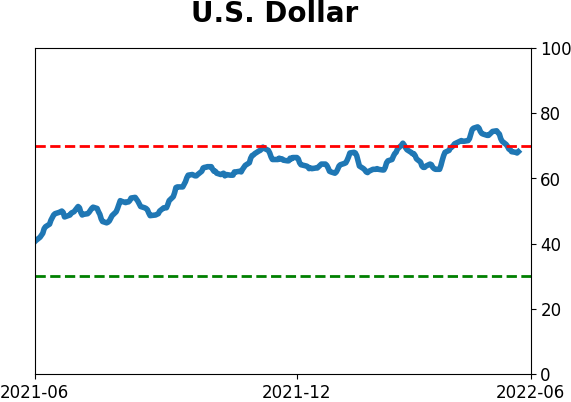
Currency ETF's - 5-Day Moving Average
|
|
|
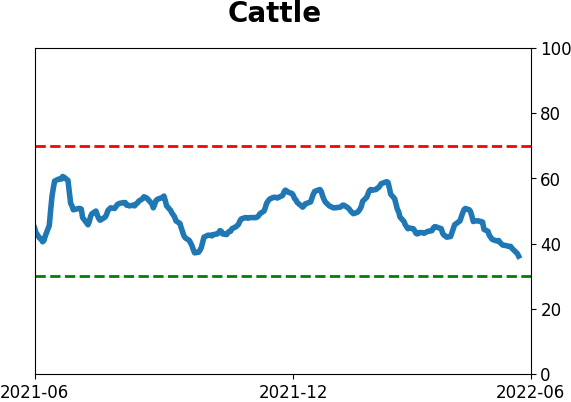
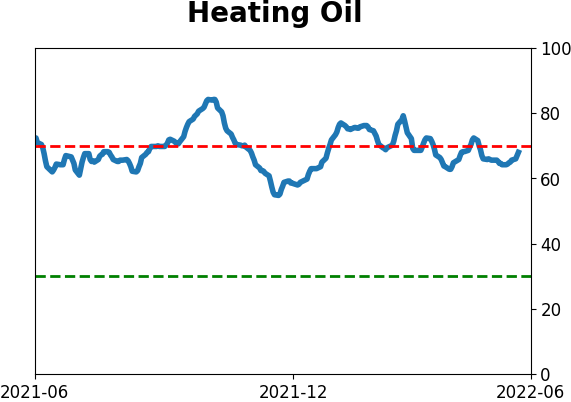
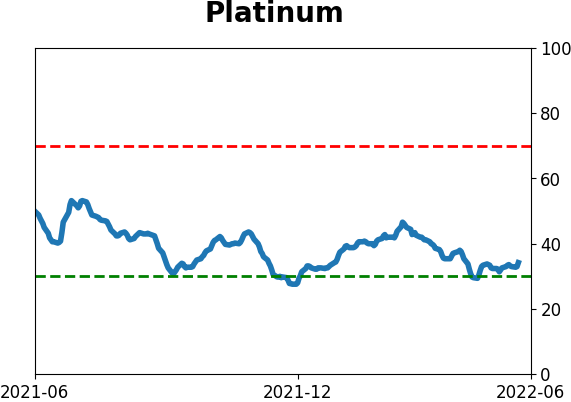
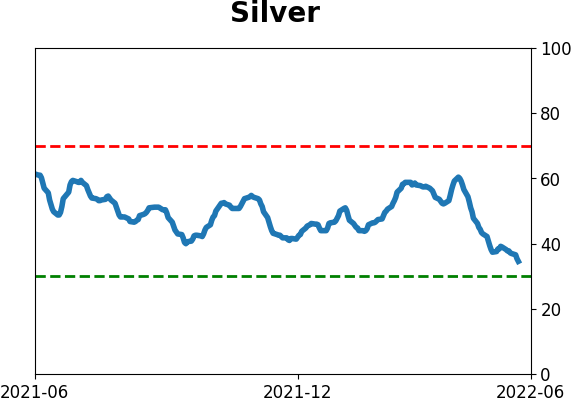
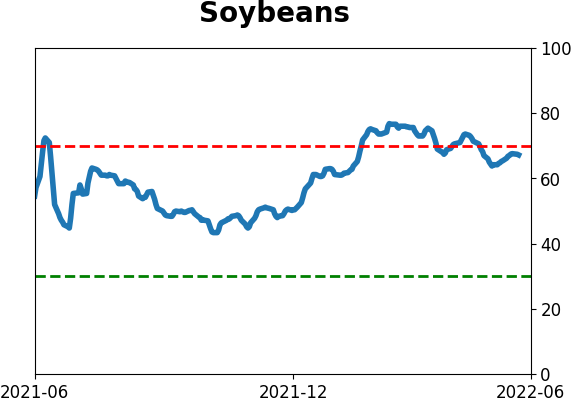
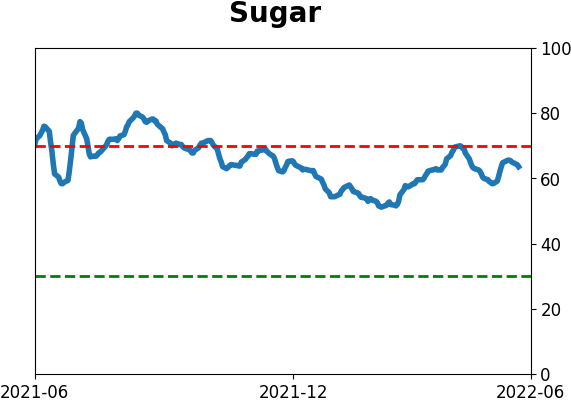
Commodity ETF's - 5-Day Moving Average
|
|