Headlines
|
|
As stocks rally, investors don't do what's expected:
Over a nearly two-week period, the S&P 500 rallied well, but models of investor behavior diverged from their typical pattern. Smart Money Confidence increased along with stocks, while Dumb Money Confidence receded. Similar behavior preceded mostly higher S&P returns, but the losses were significant.
|
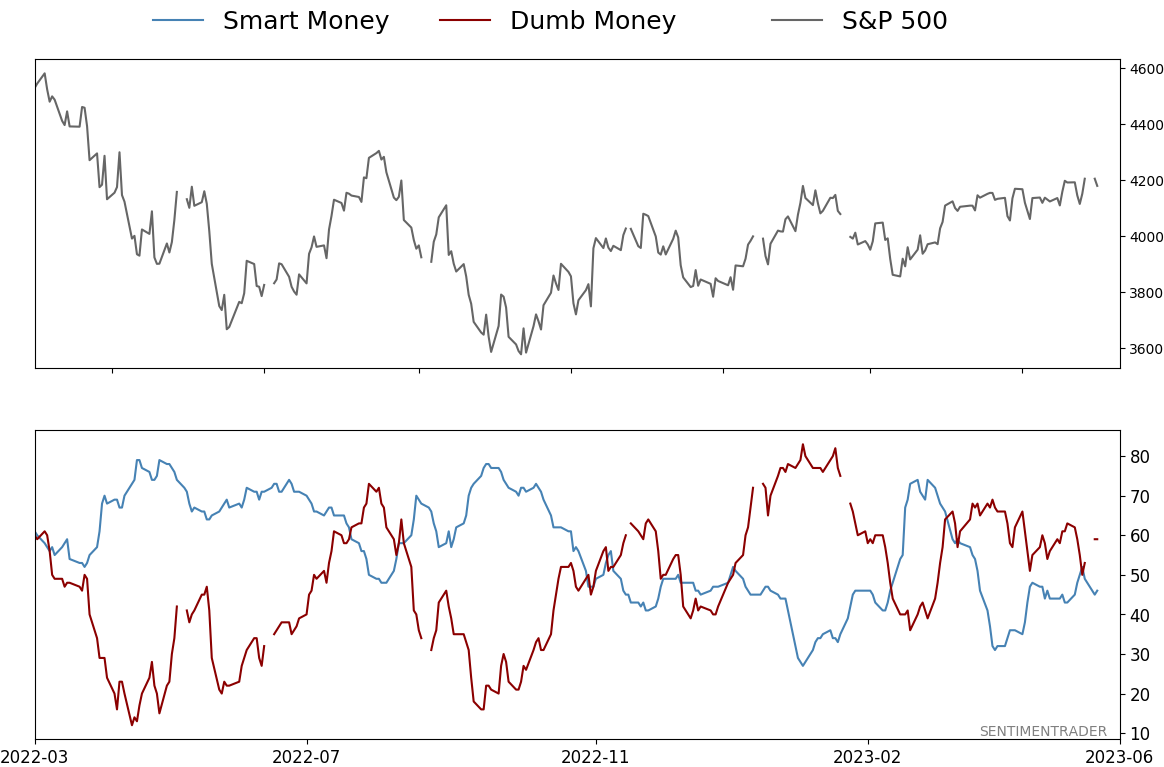
Smart / Dumb Money Confidence
|
Smart Money Confidence: 46%
Dumb Money Confidence: 59%
|
|
Risk Levels
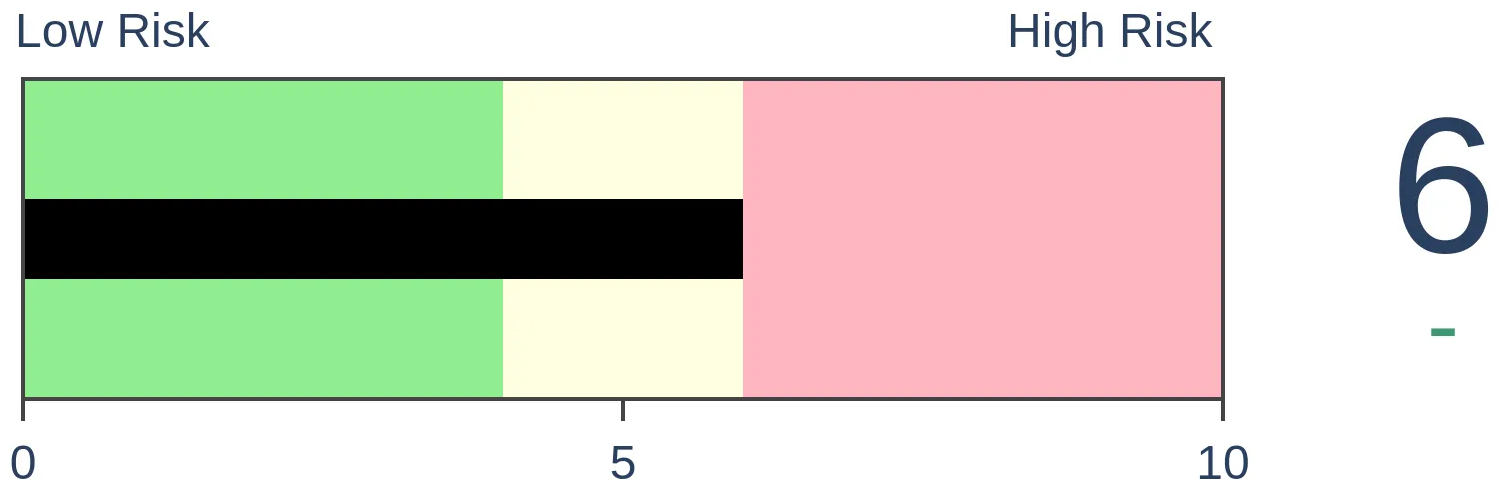
Stocks Short-Term
|
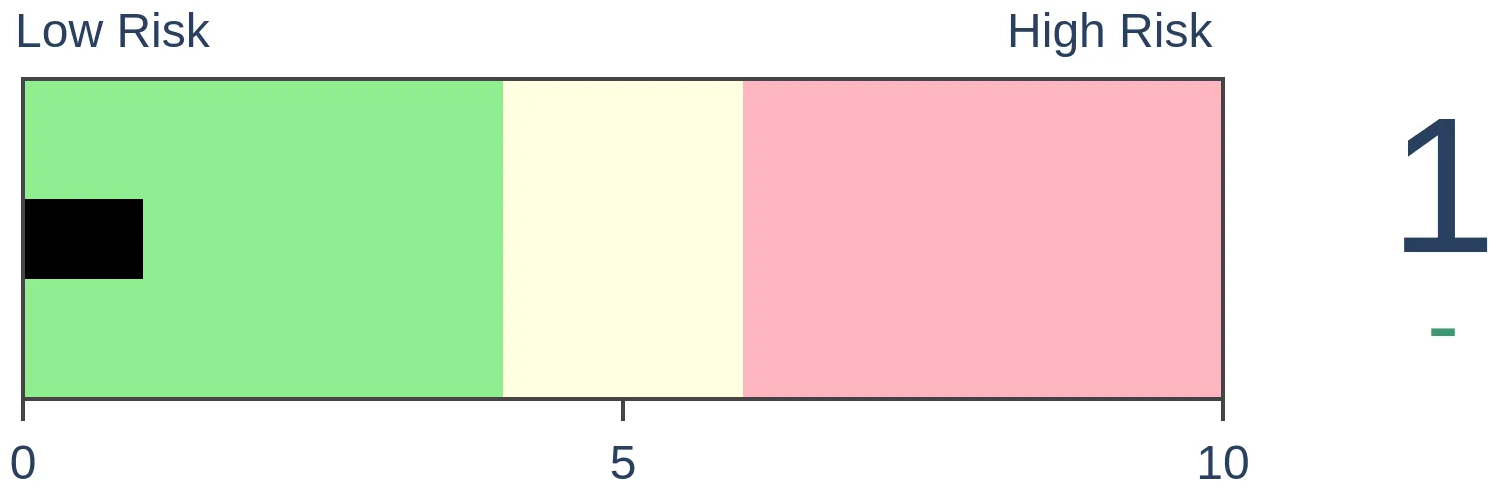
Stocks Medium-Term
|
|
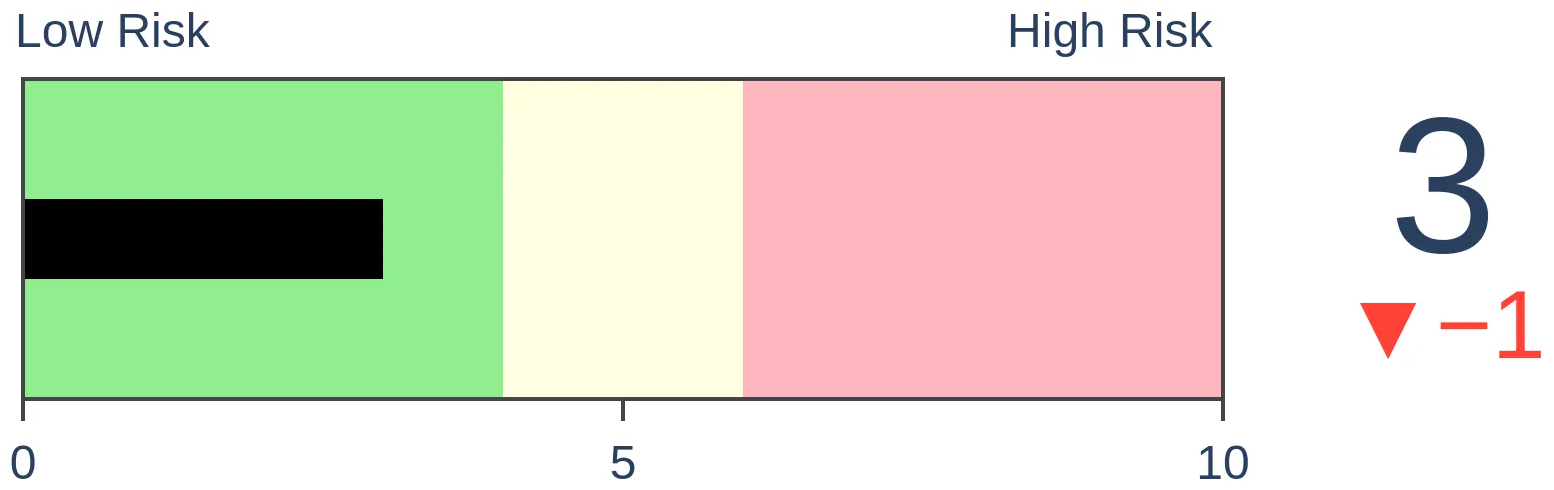
Bonds
|
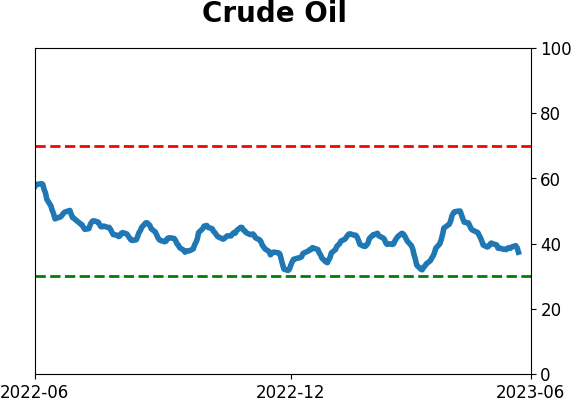
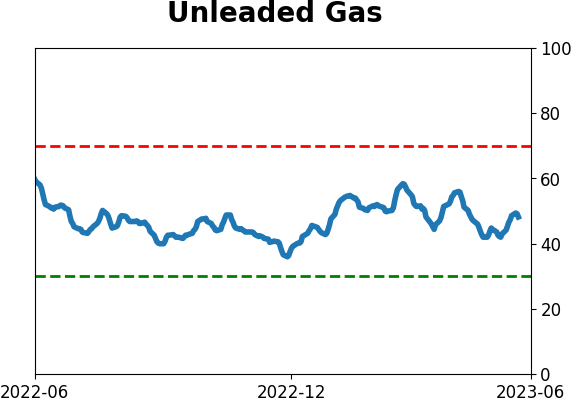
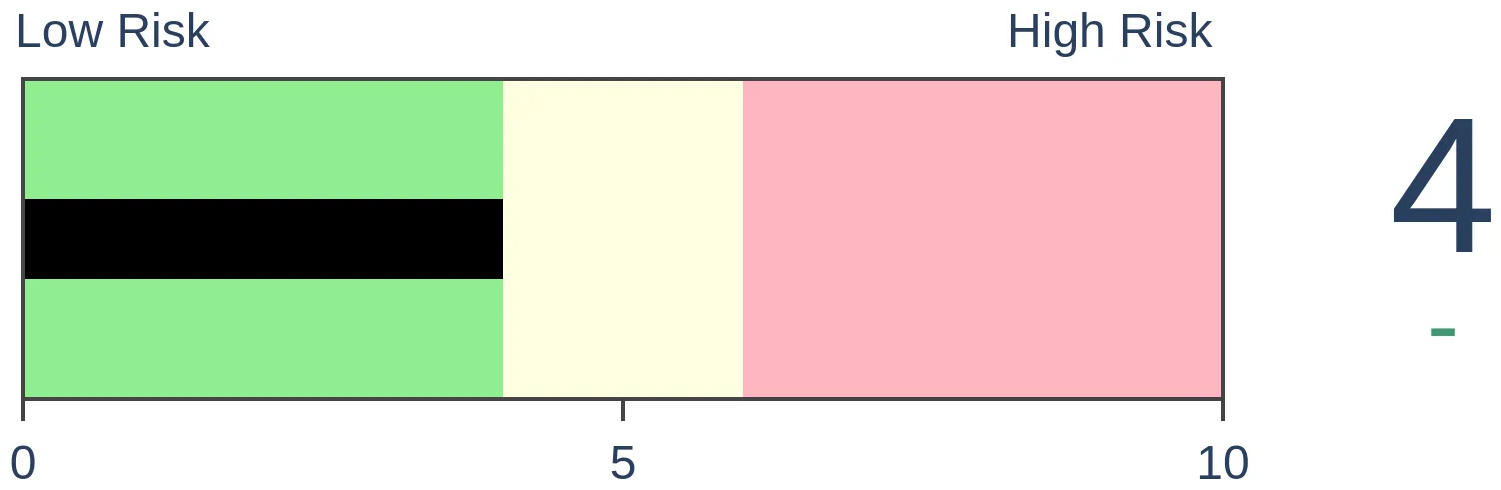
Crude Oil
|
|
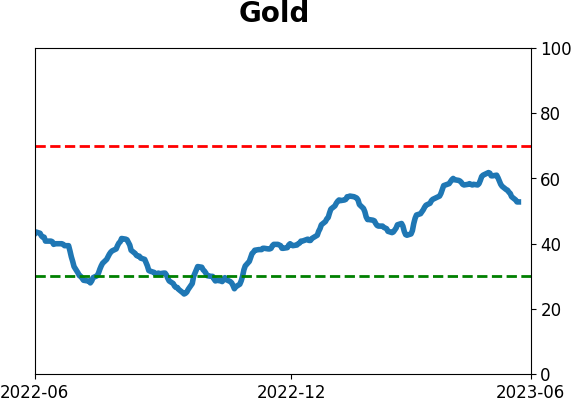
Gold
|
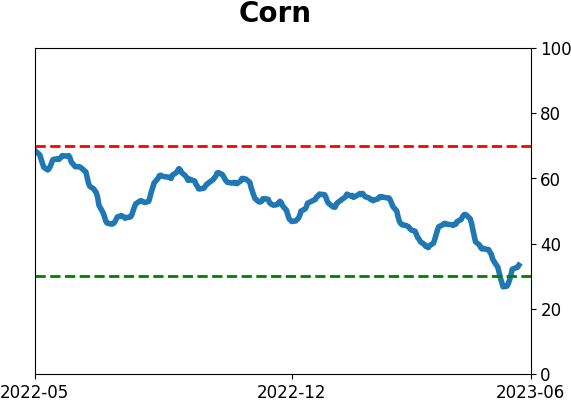
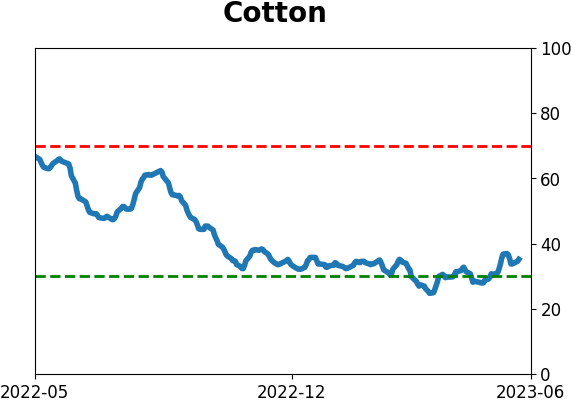
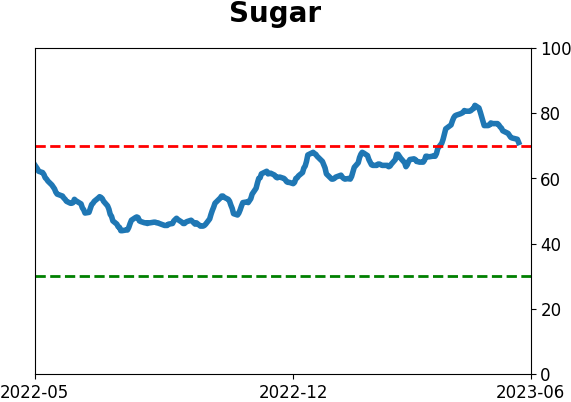
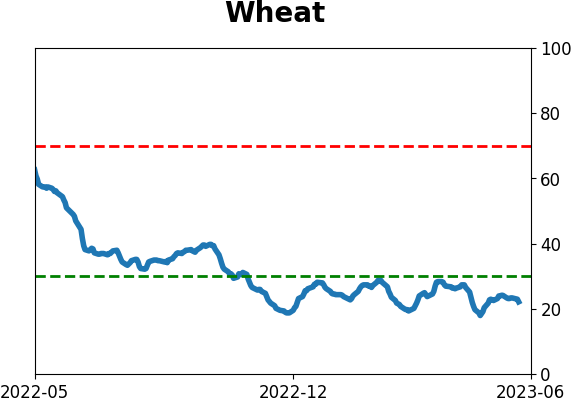
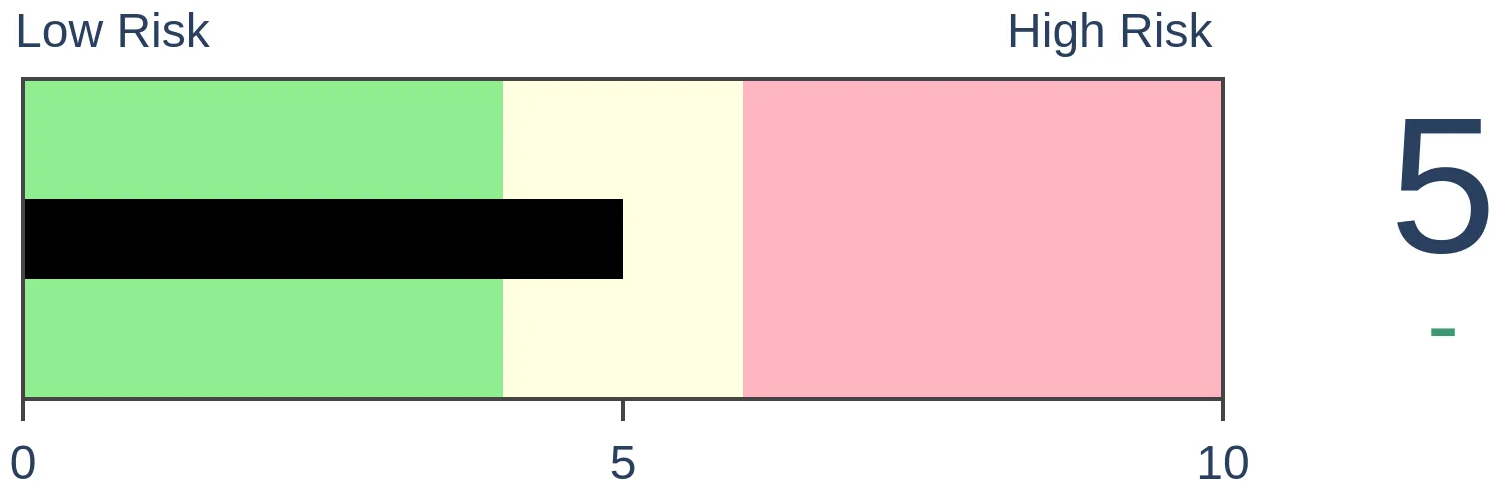
Agriculture

|
|
Research
By Jason Goepfert
BOTTOM LINE
Over a nearly two-week period, the S&P 500 rallied well, but models of investor behavior diverged from their typical pattern. Smart Money Confidence increased along with stocks, while Dumb Money Confidence receded. Similar behavior preceded mostly higher S&P returns, but the losses were significant.
FORECAST / TIMEFRAME
None
|
Key points:
- Stocks have rallied over the last couple of weeks, but investor behavior models are diverging
- Smart Money Confidence has risen while Dumb Money declined, opposite behavior from what usually happens
- Similar behavior preceded mostly higher returns for stocks but with caveats
As markets rally, investors fight their nature
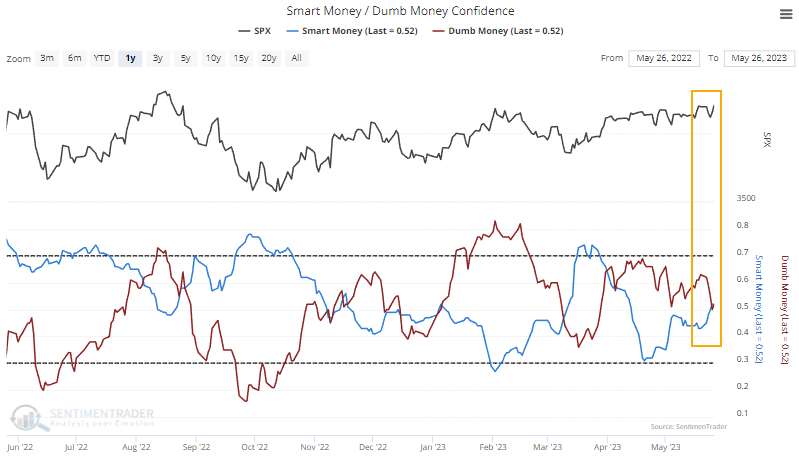
Even though the S&P 500 has ripped higher over nearly two weeks, investors don't seem to be buying it. In an unusual twist, Smart Money Confidence rose while Dumb Money Confidence declined.
Typically, Smart Money fades a trend. That's not very "smart," but that's not the point - these traders are typically the most confident in a rally after a prolonged decline, and stocks often soon trough. Dumb Money mainly reflects trend followers, and it's correct during the meat of a move. But they're also the most confident just as stocks tend to peak.
Even though stocks have rallied for nearly two weeks, these models have gone in the opposite direction of what they would typically do.
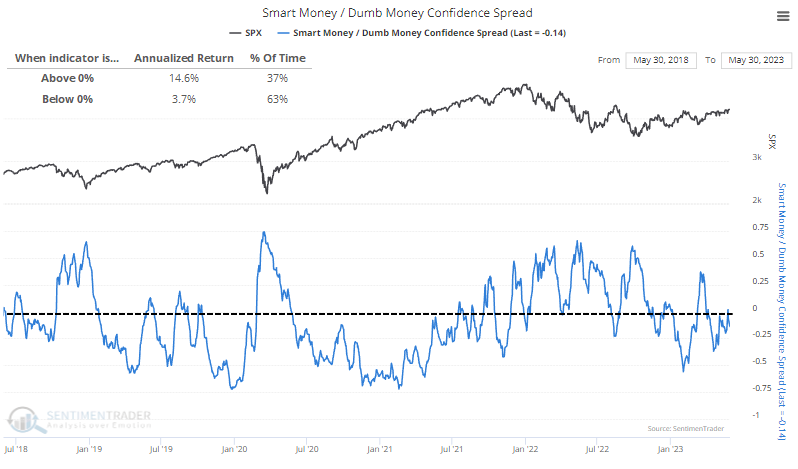
As a result, the spread between them briefly turned positive. This tends to be a good thing, as seen in the chart below. The S&P 500's annualized return is much better when the spread is positive. It has since dipped below zero, but it's hugging that threshold and could easily pop back above.
It seems odd that the S&P's annualized return would be better when the spread is above zero since this condition typically occurs when markets are declining. But the calculation uses next-day returns to better reflect the reality of trading (we can't trade in hindsight), and the index's best single-day returns tend to occur in the days immediately preceding a bottom when the spread is the highest.
Unusual behavior preceded mild gains or big losses
To see if the recent oddity between market performance and Smart/Dumb Confidence has meant anything consistent in the past, the table below shows the S&P's returns after similar behavior. These are times when the index rallied heartily over a nearly two-week stretch, yet Smart Money Confidence improved at the same time Dumb Money Confidence declined.

There doesn't seem to be a super compelling conclusion from similar instances. Returns up to a month later were a crapshoot, and while they improved after that, they were still about in line with random. While the S&P rose across most time frames, then exceptions were prominent. The index showed modest gains from two months and beyond, but the few times it showed losses, they were significant.
It's tough to make dramatic pronouncements from such a small sample, but it suggests that if the index is going to continue higher, we could expect modest gains at best over the next few months. But if it doesn't, the precedents aren't great, with double-digit drawdowns. There was a slight suggestion that if stocks rose over the next two weeks, they would also be higher six months later, but again the sample is too small to make that a blanket statement.
What the research tells us...
Unfortunately, not too much. While we prefer to focus on data that compels a firm conclusion, the behavior of these models over the last couple of weeks has generated quite a few questions about whether it's bull market behavior. There isn't enough here to suggest it is (or isn't), with the most we could uncomfortably suggest being that it was asymmetric because gains were relatively limited after similar behavior while losses were large.
Indicators at Extremes
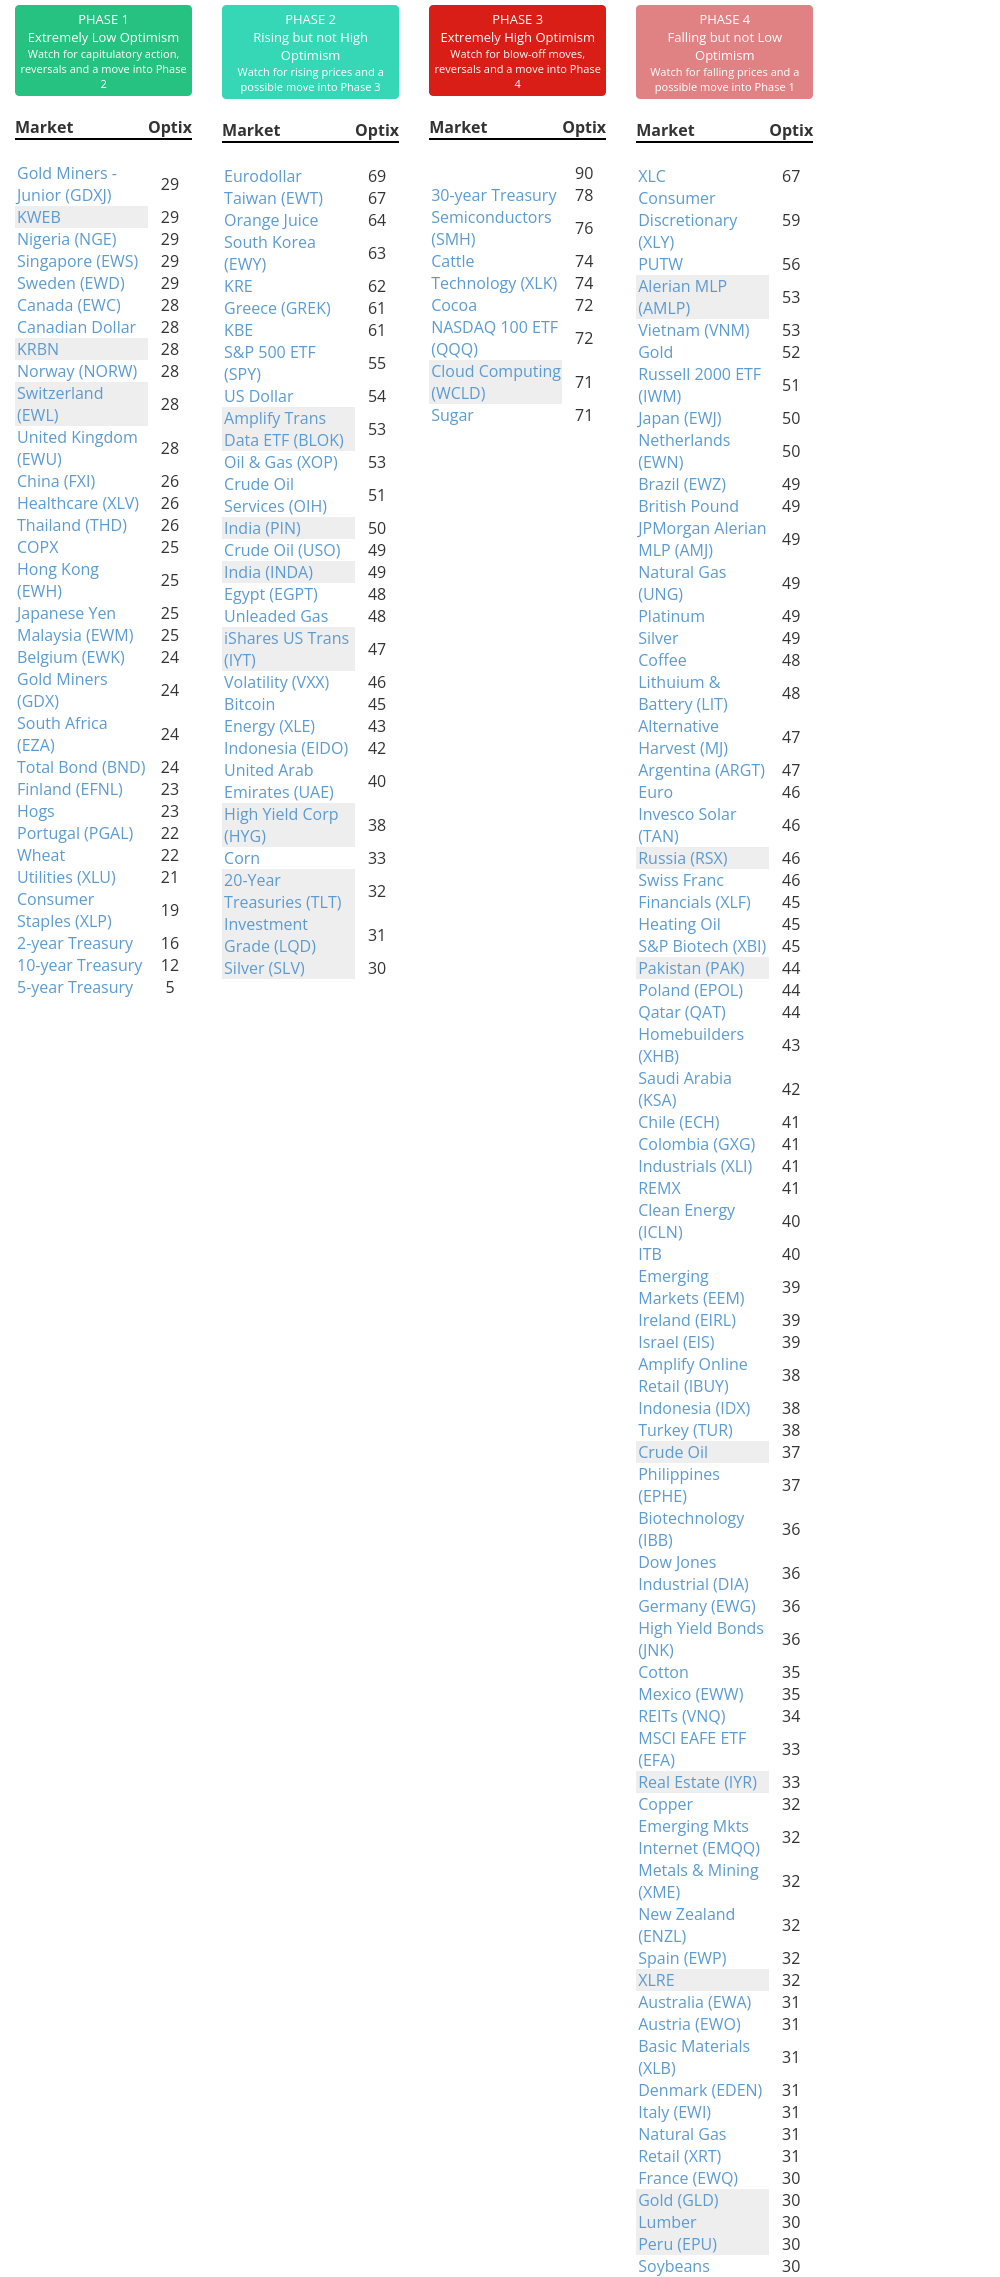
Phase Table
Ranks
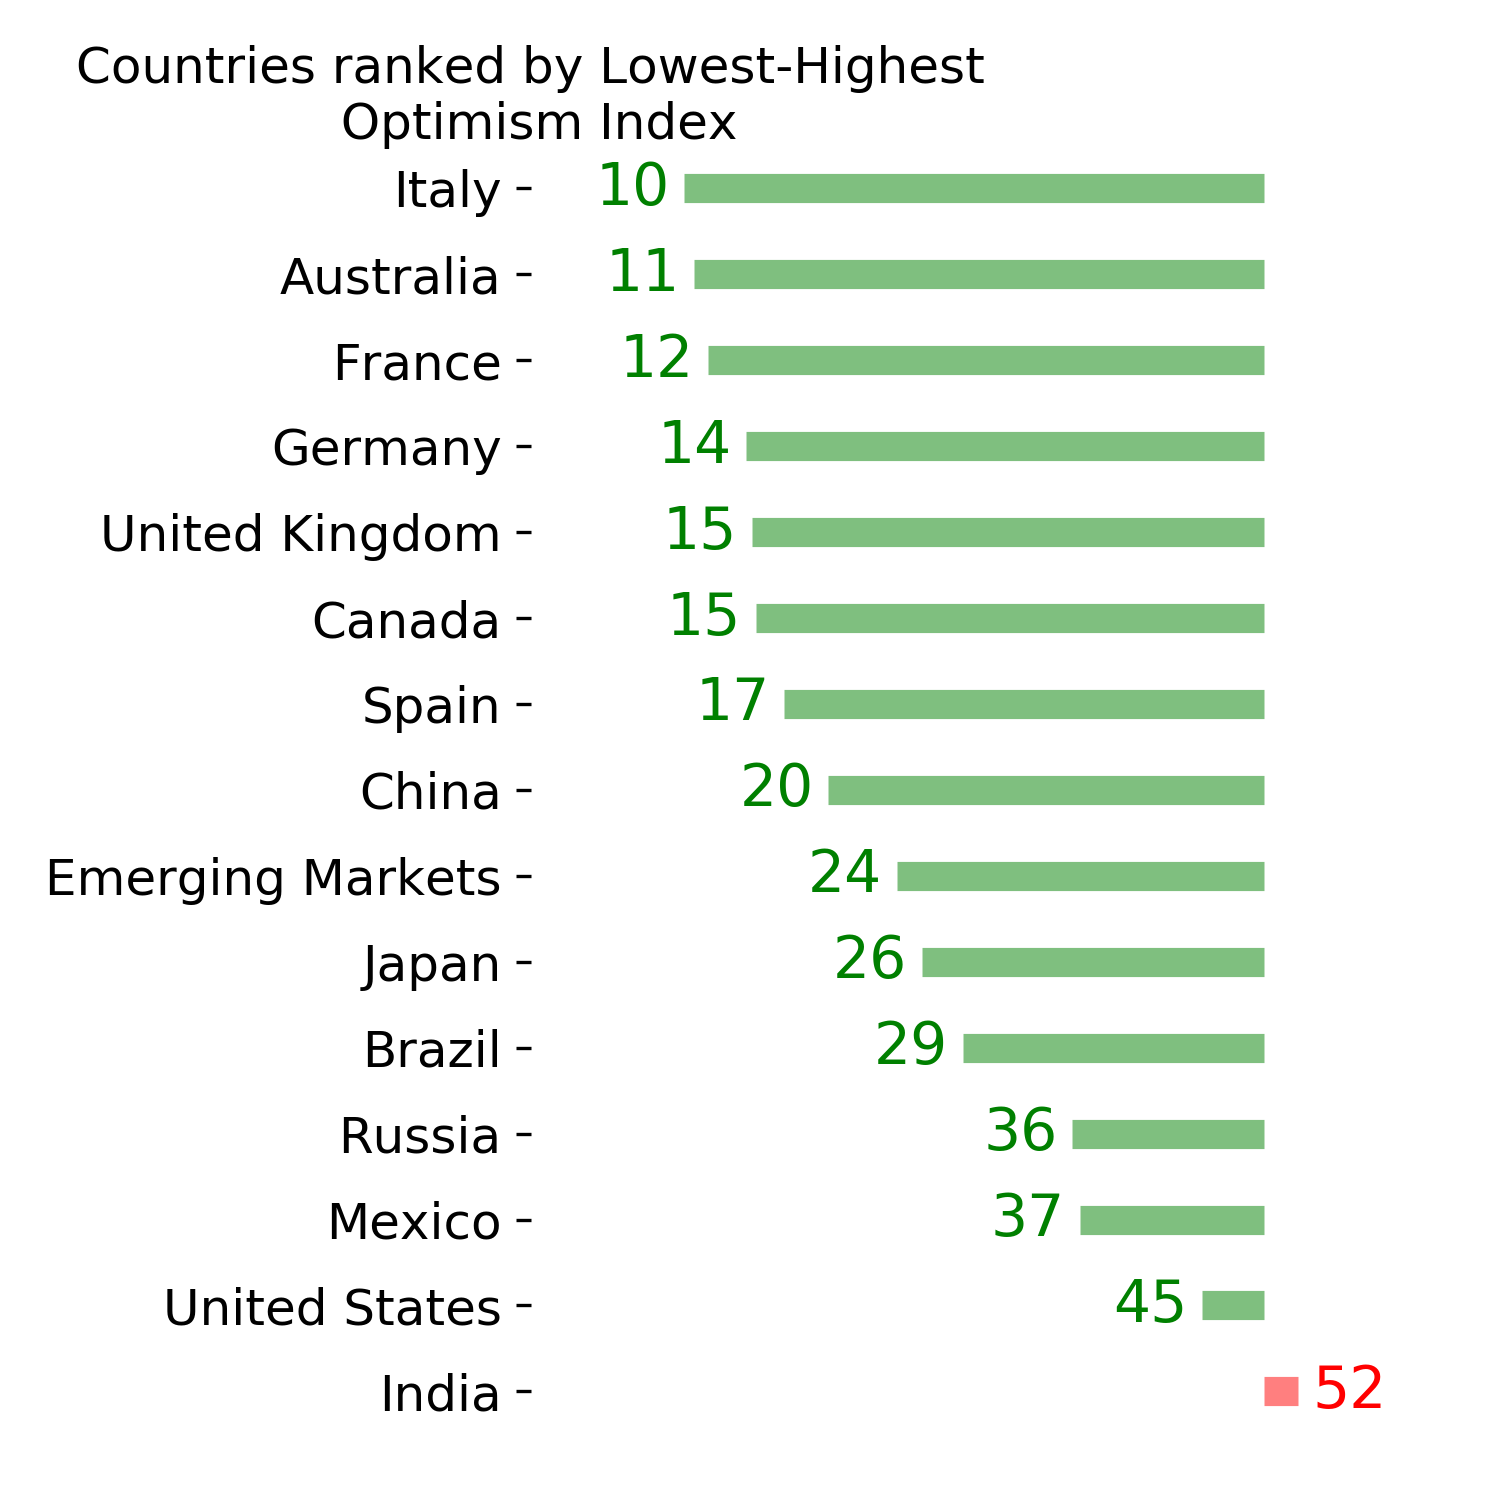
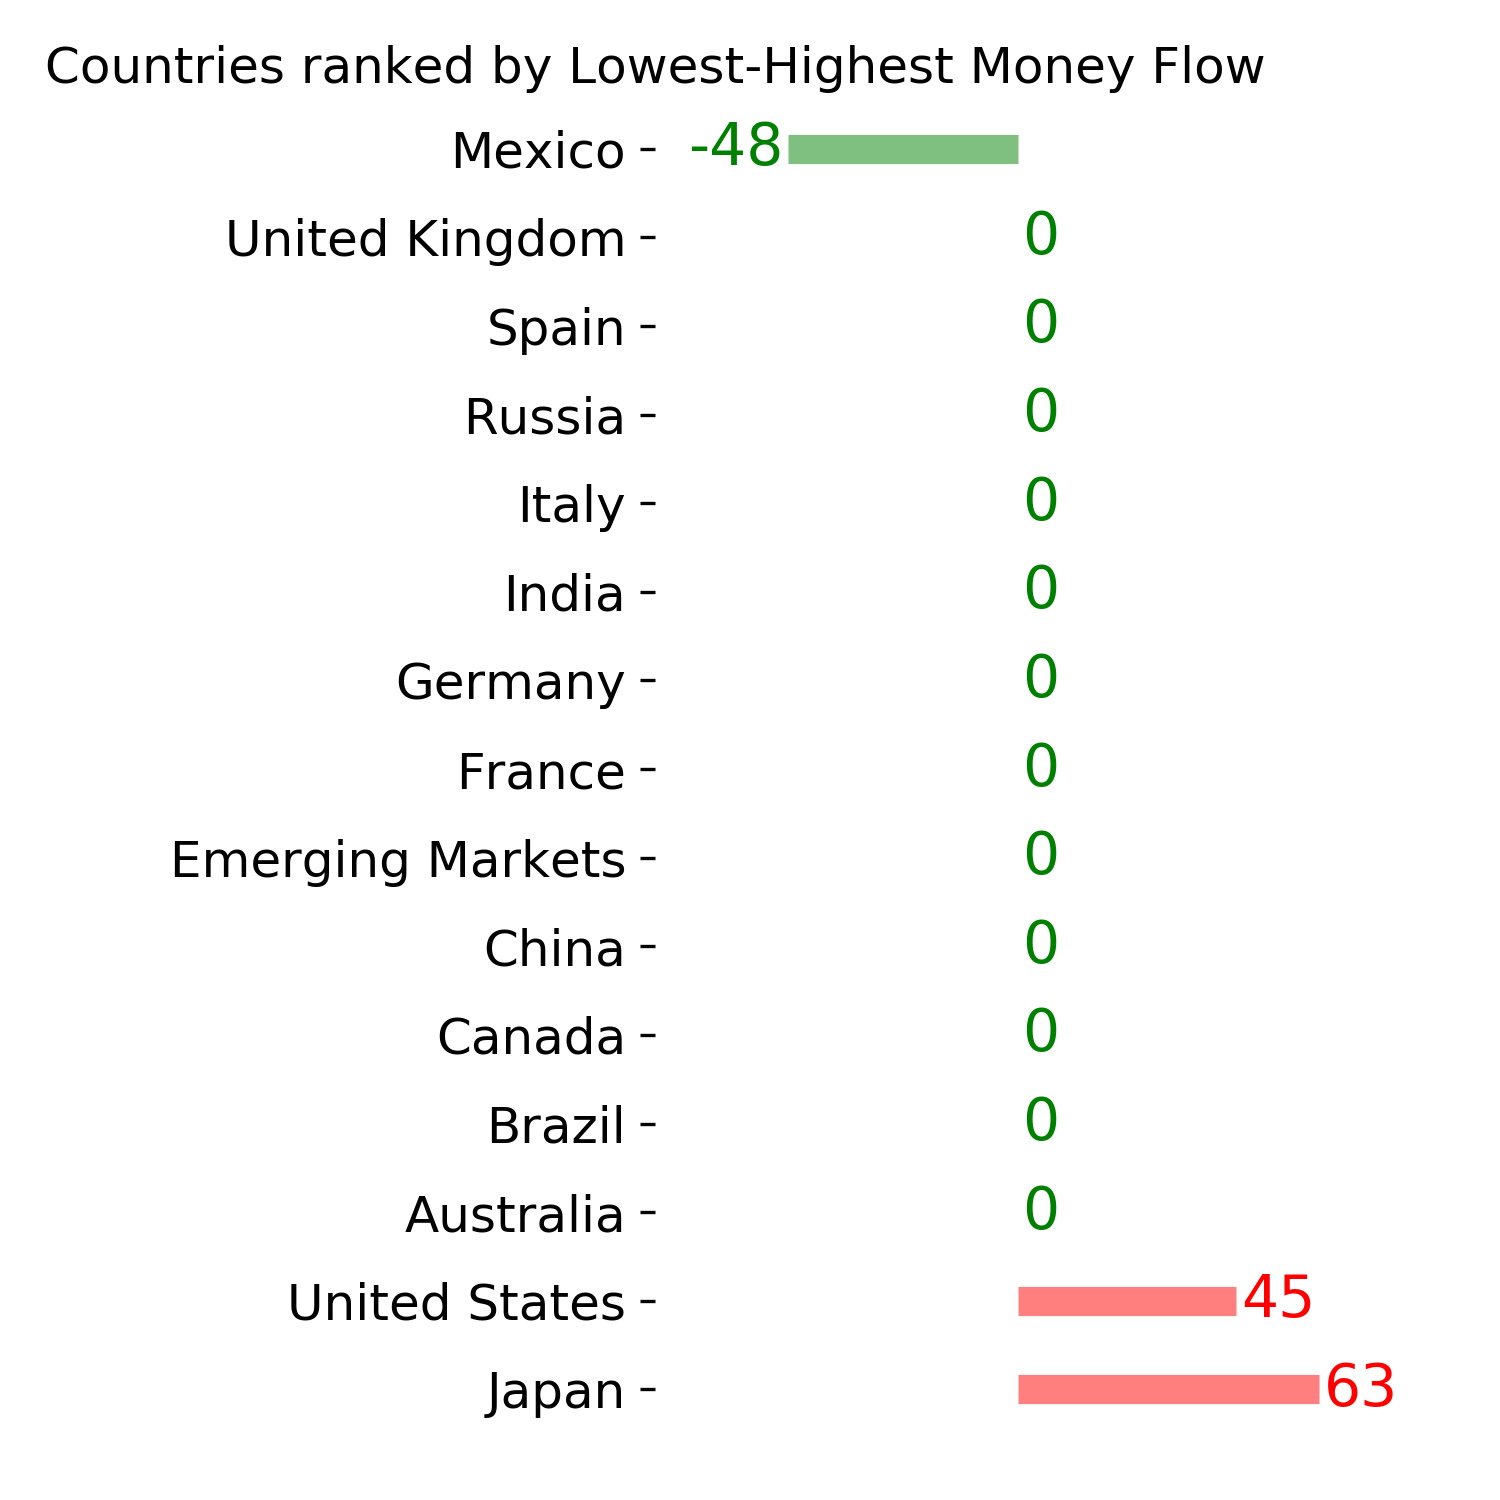
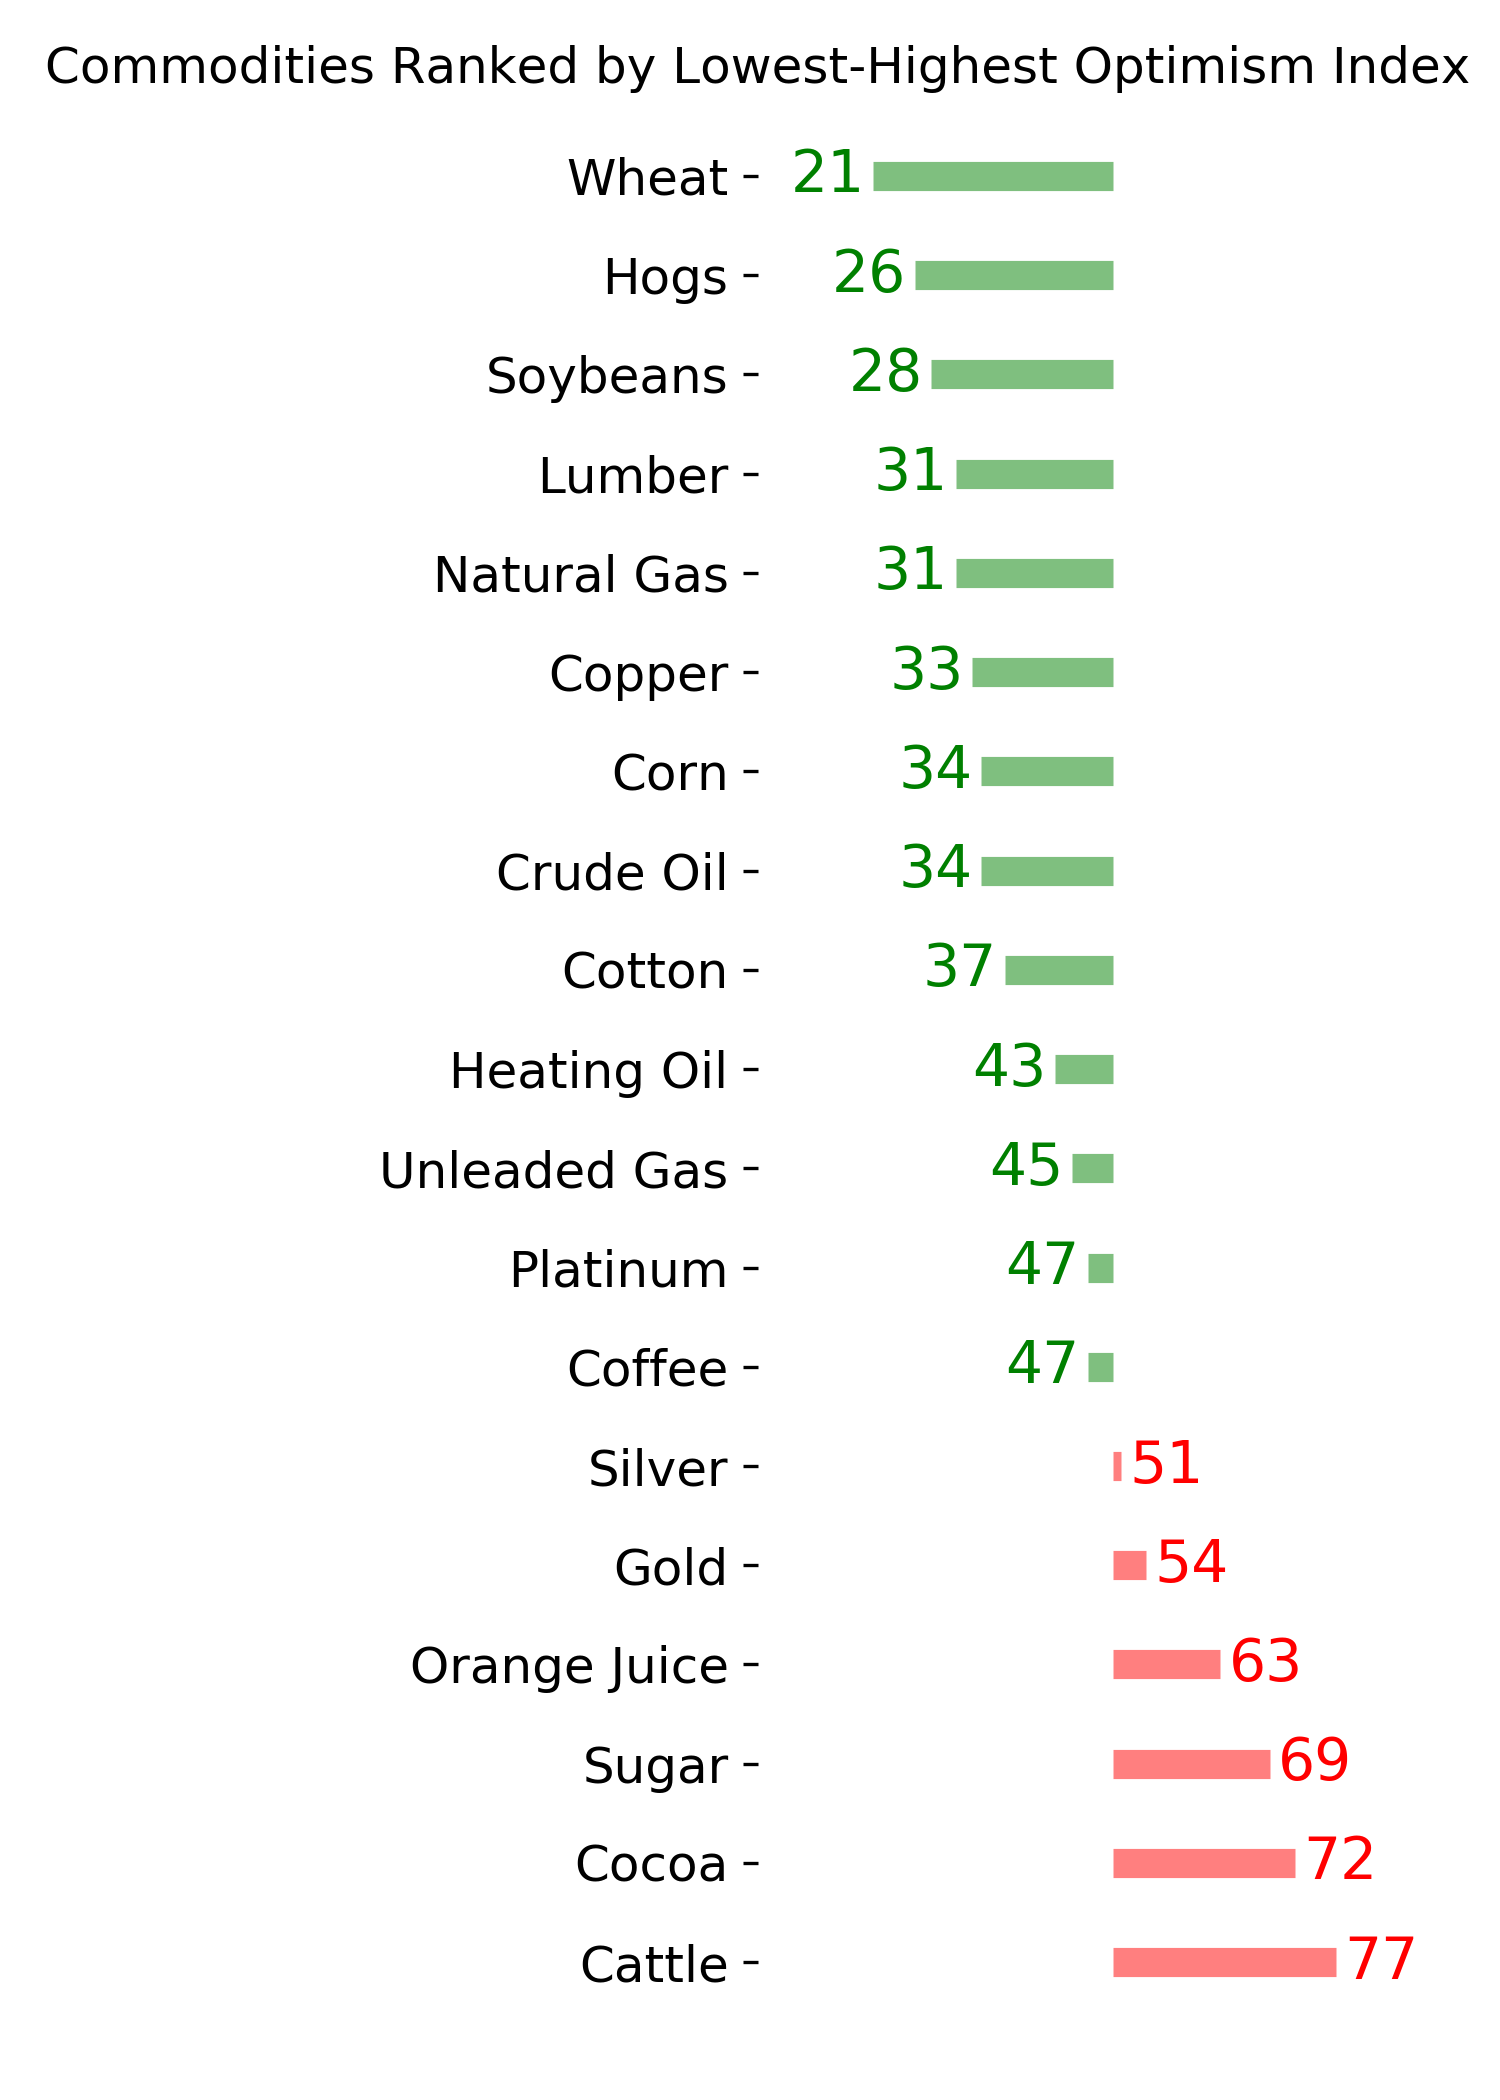
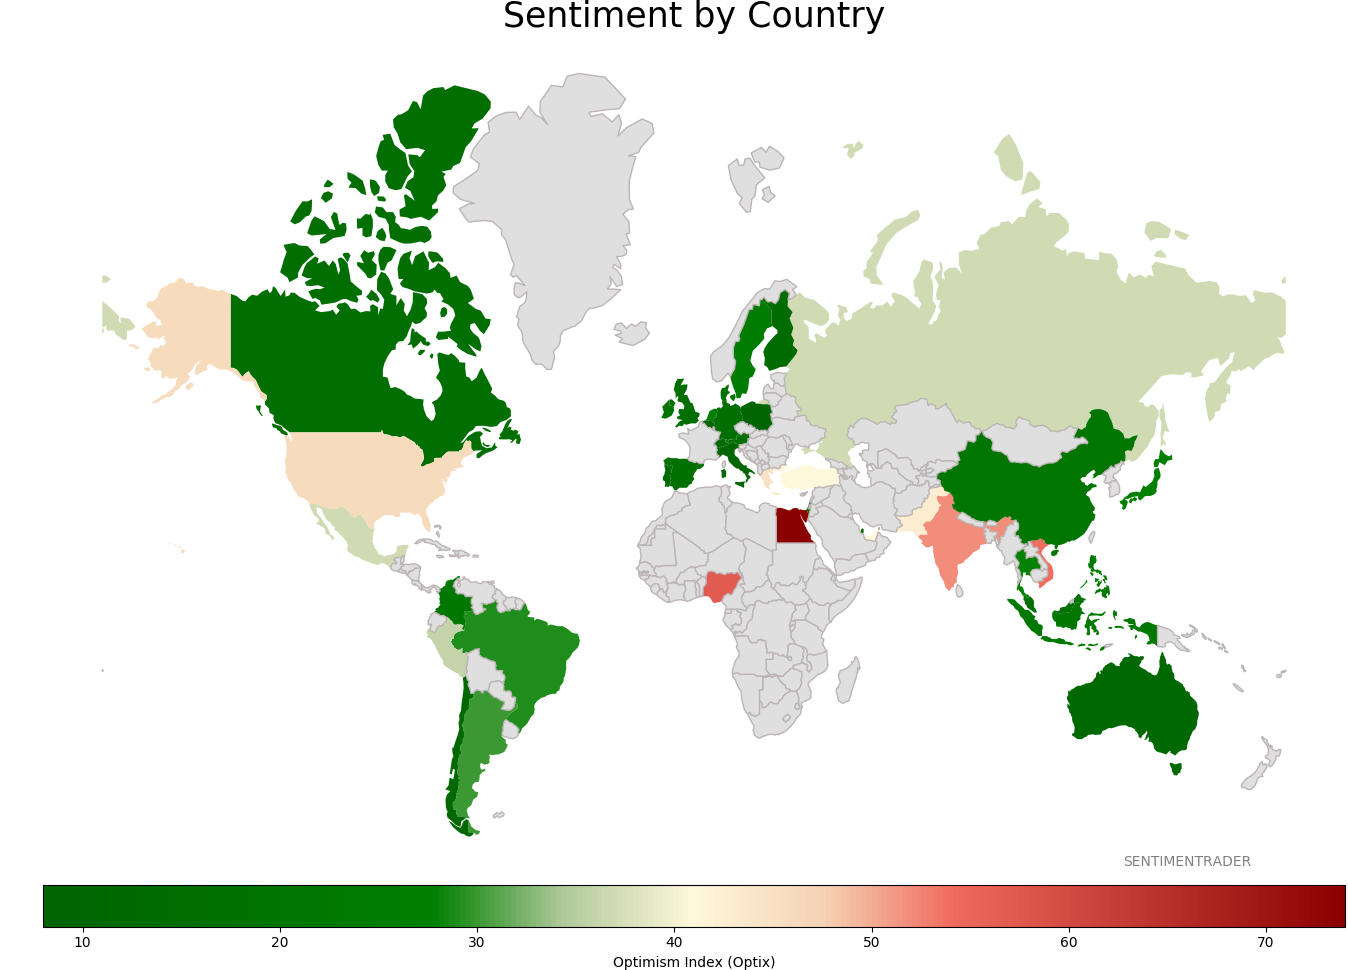
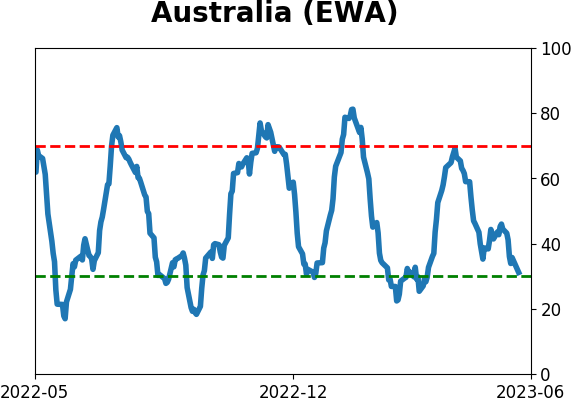
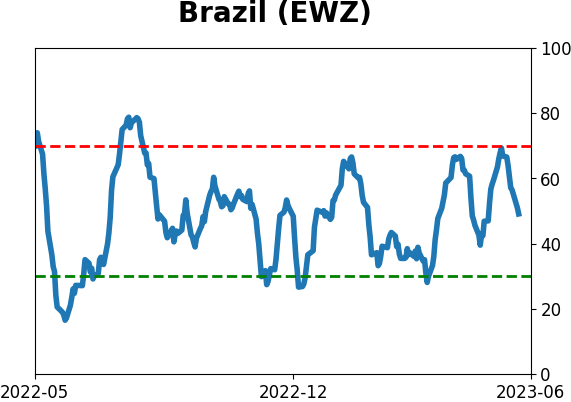
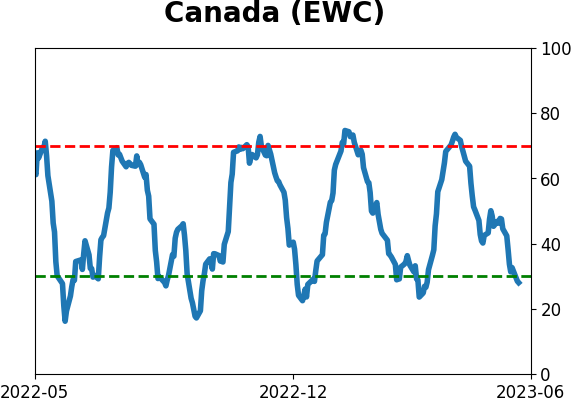
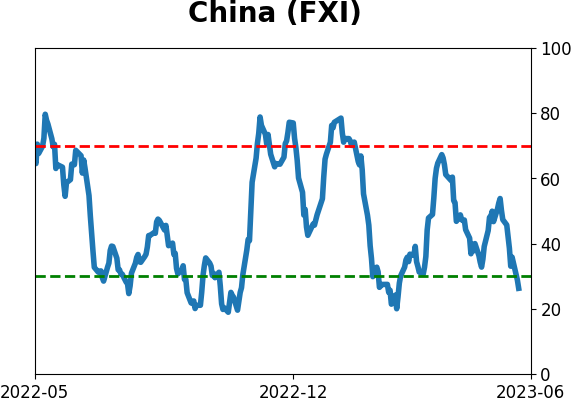
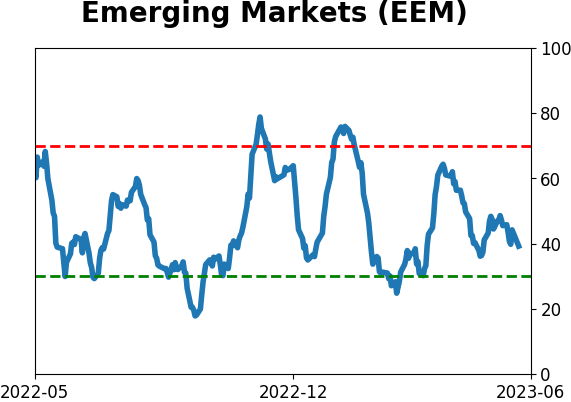
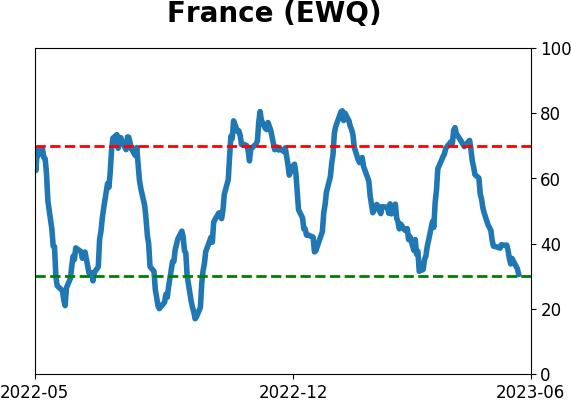
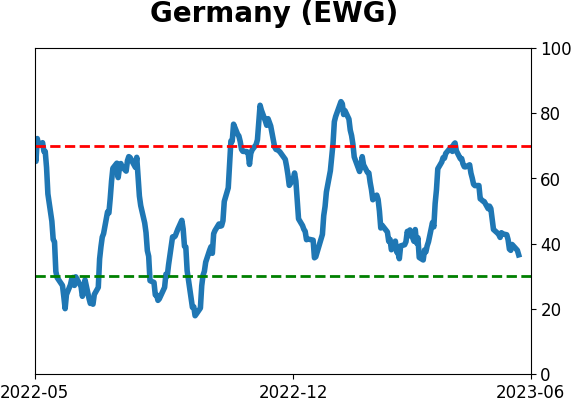
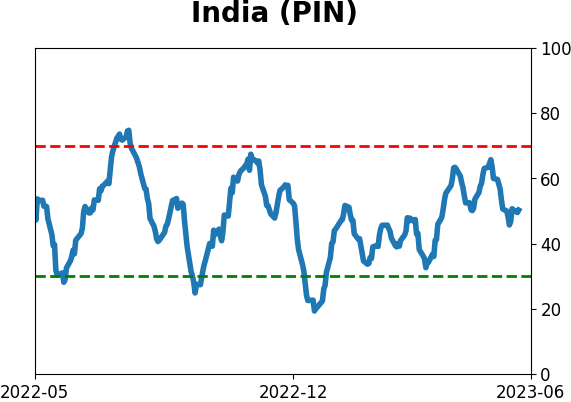
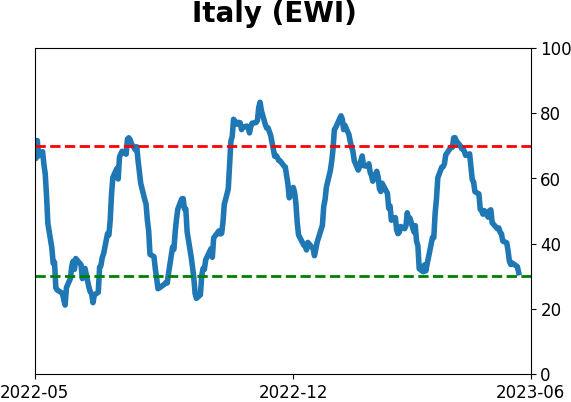
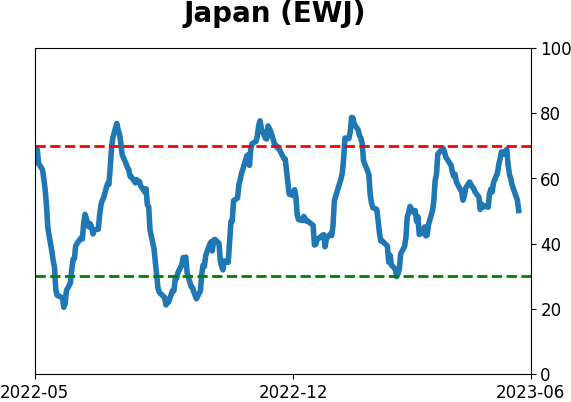
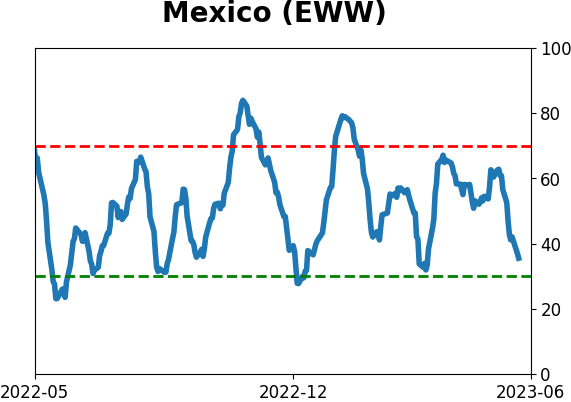
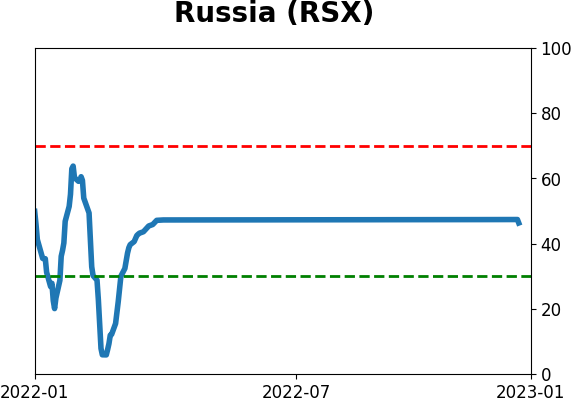
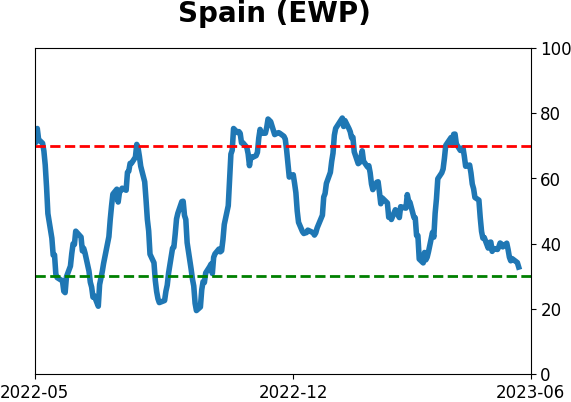
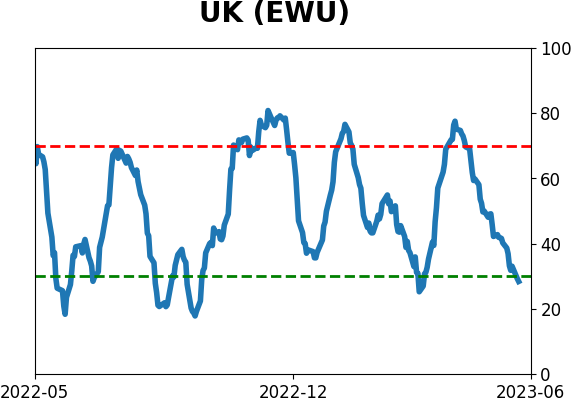
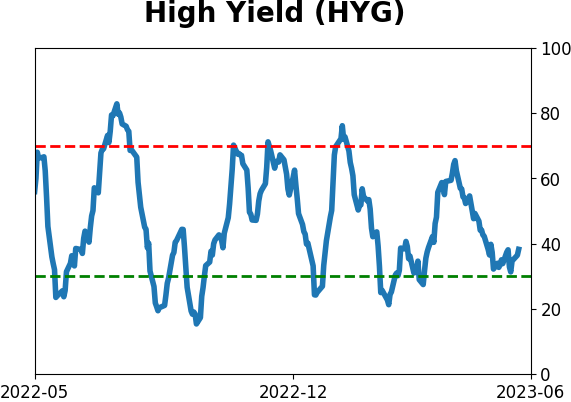
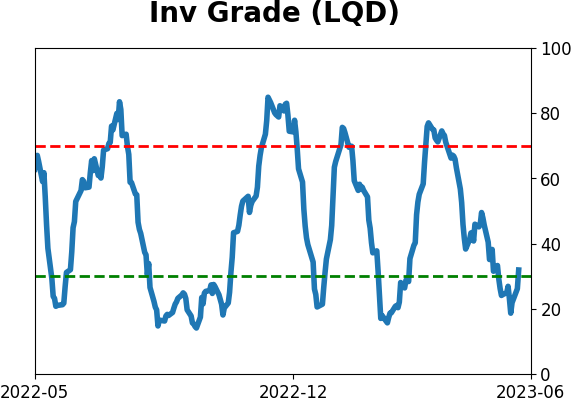
Sentiment Around The World
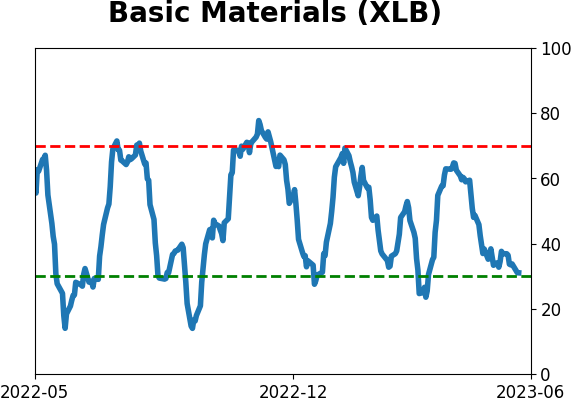
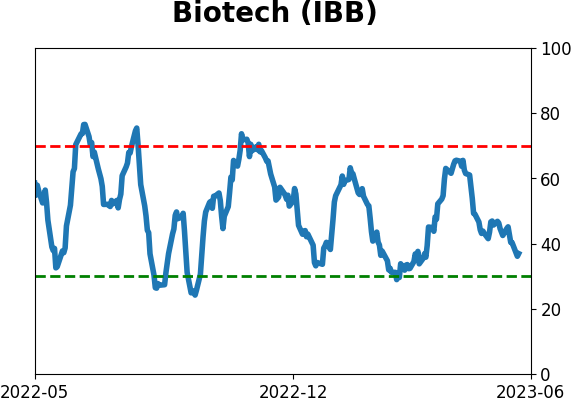
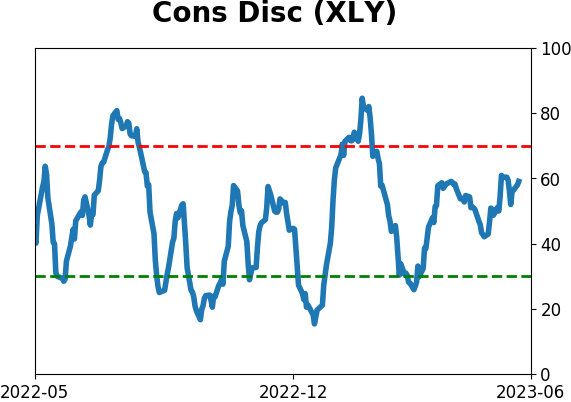
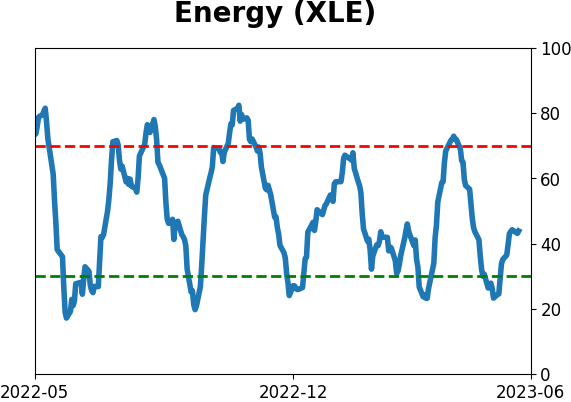
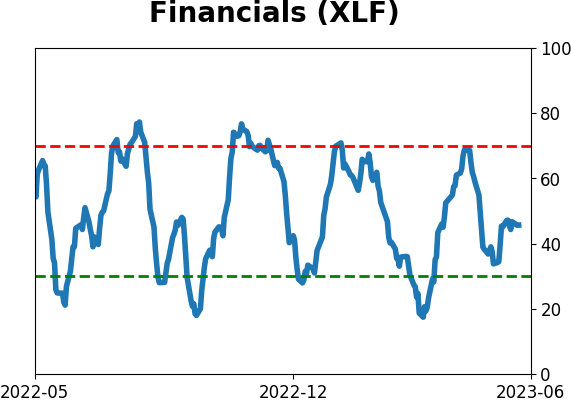
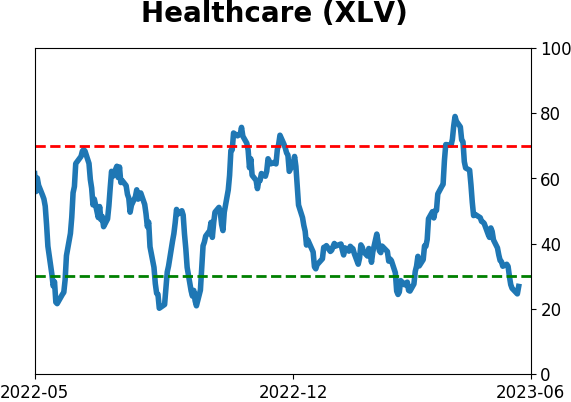
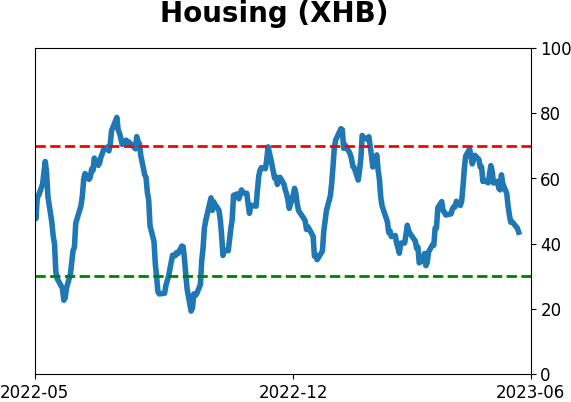
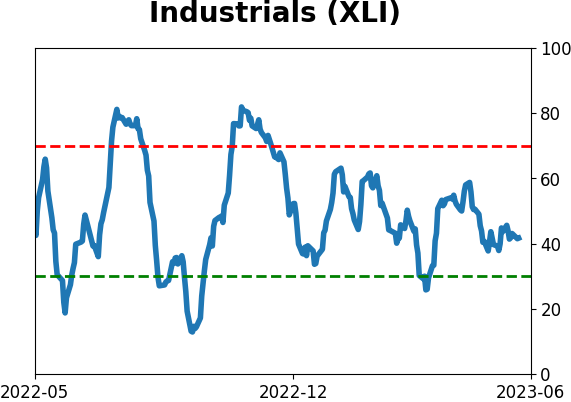
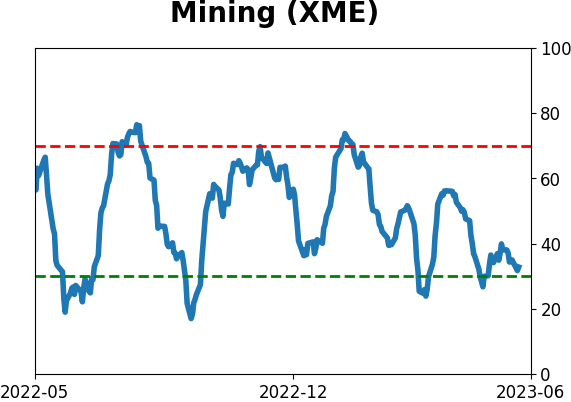
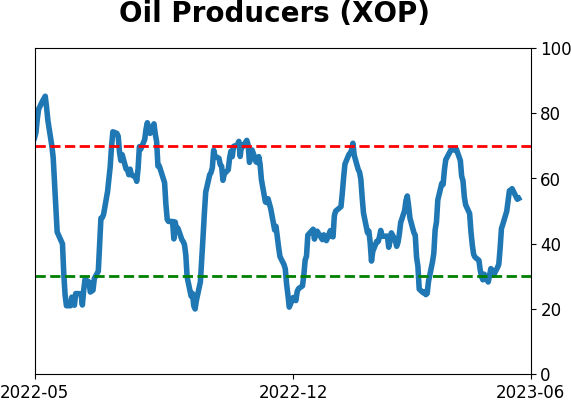
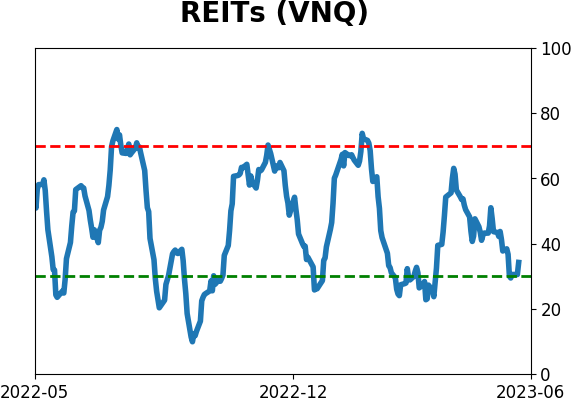
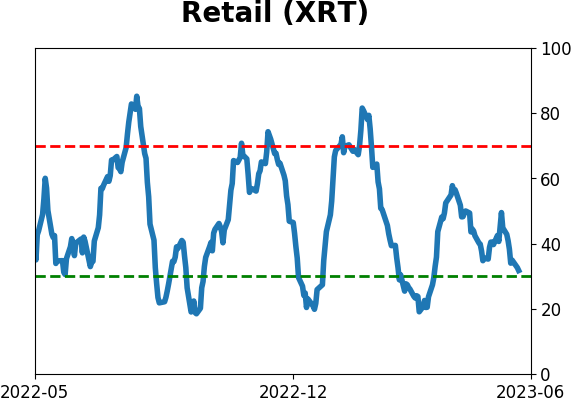
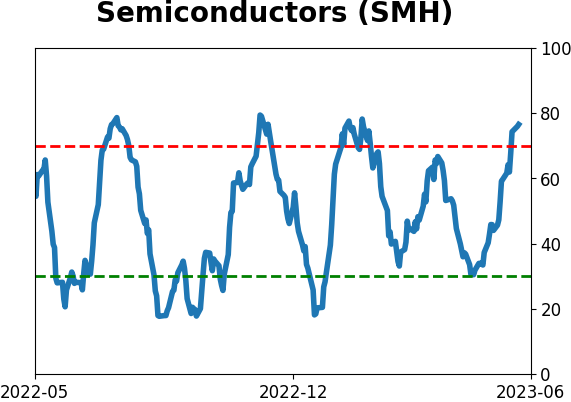
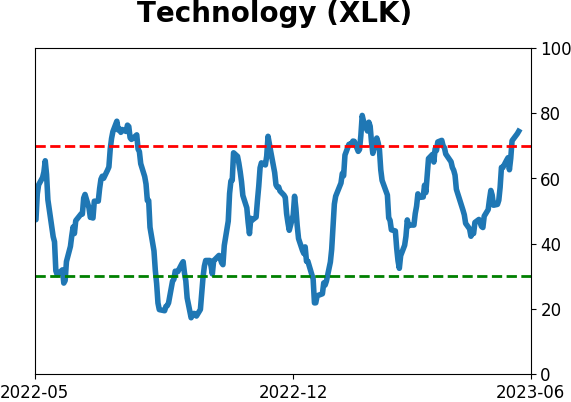
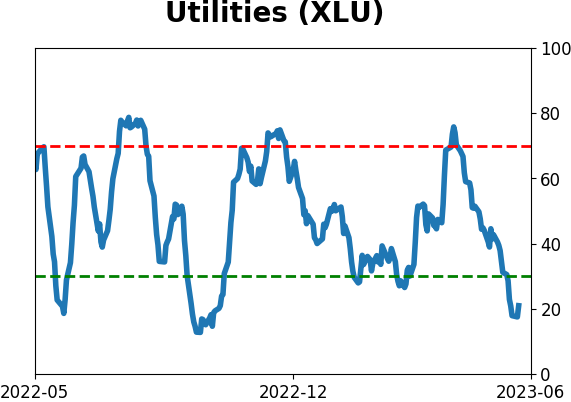
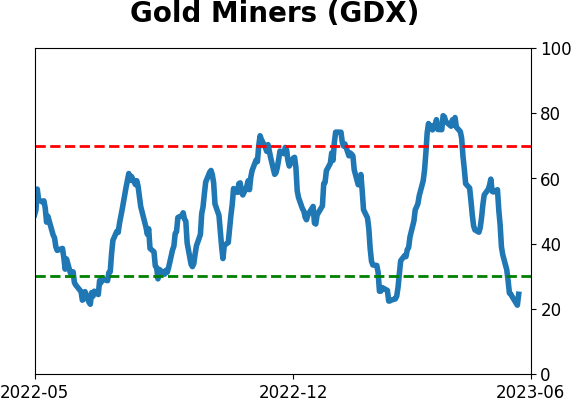
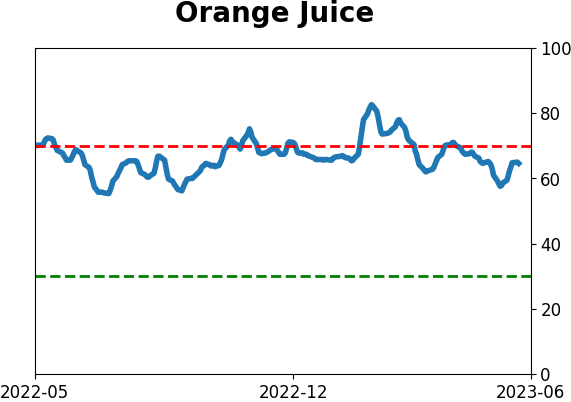
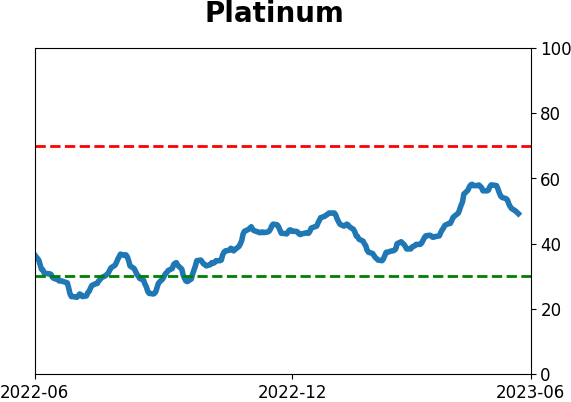
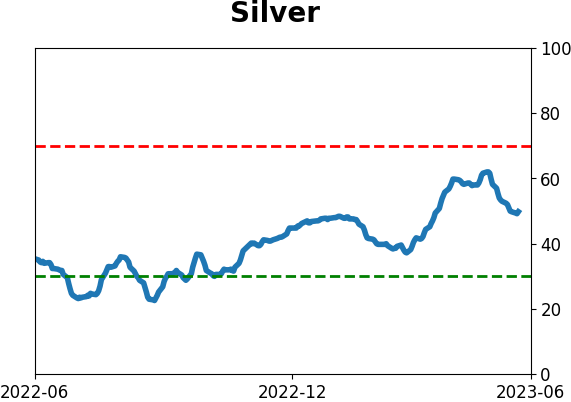
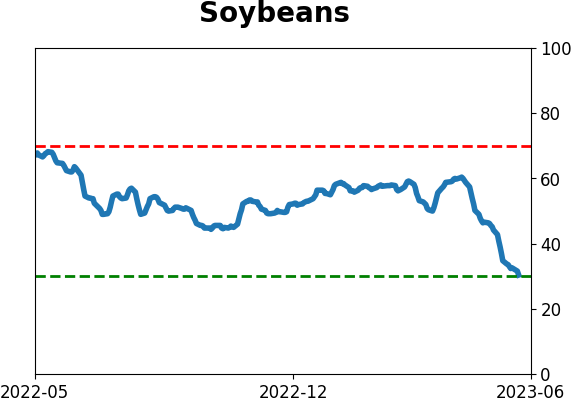
Optimism Index Thumbnails
|
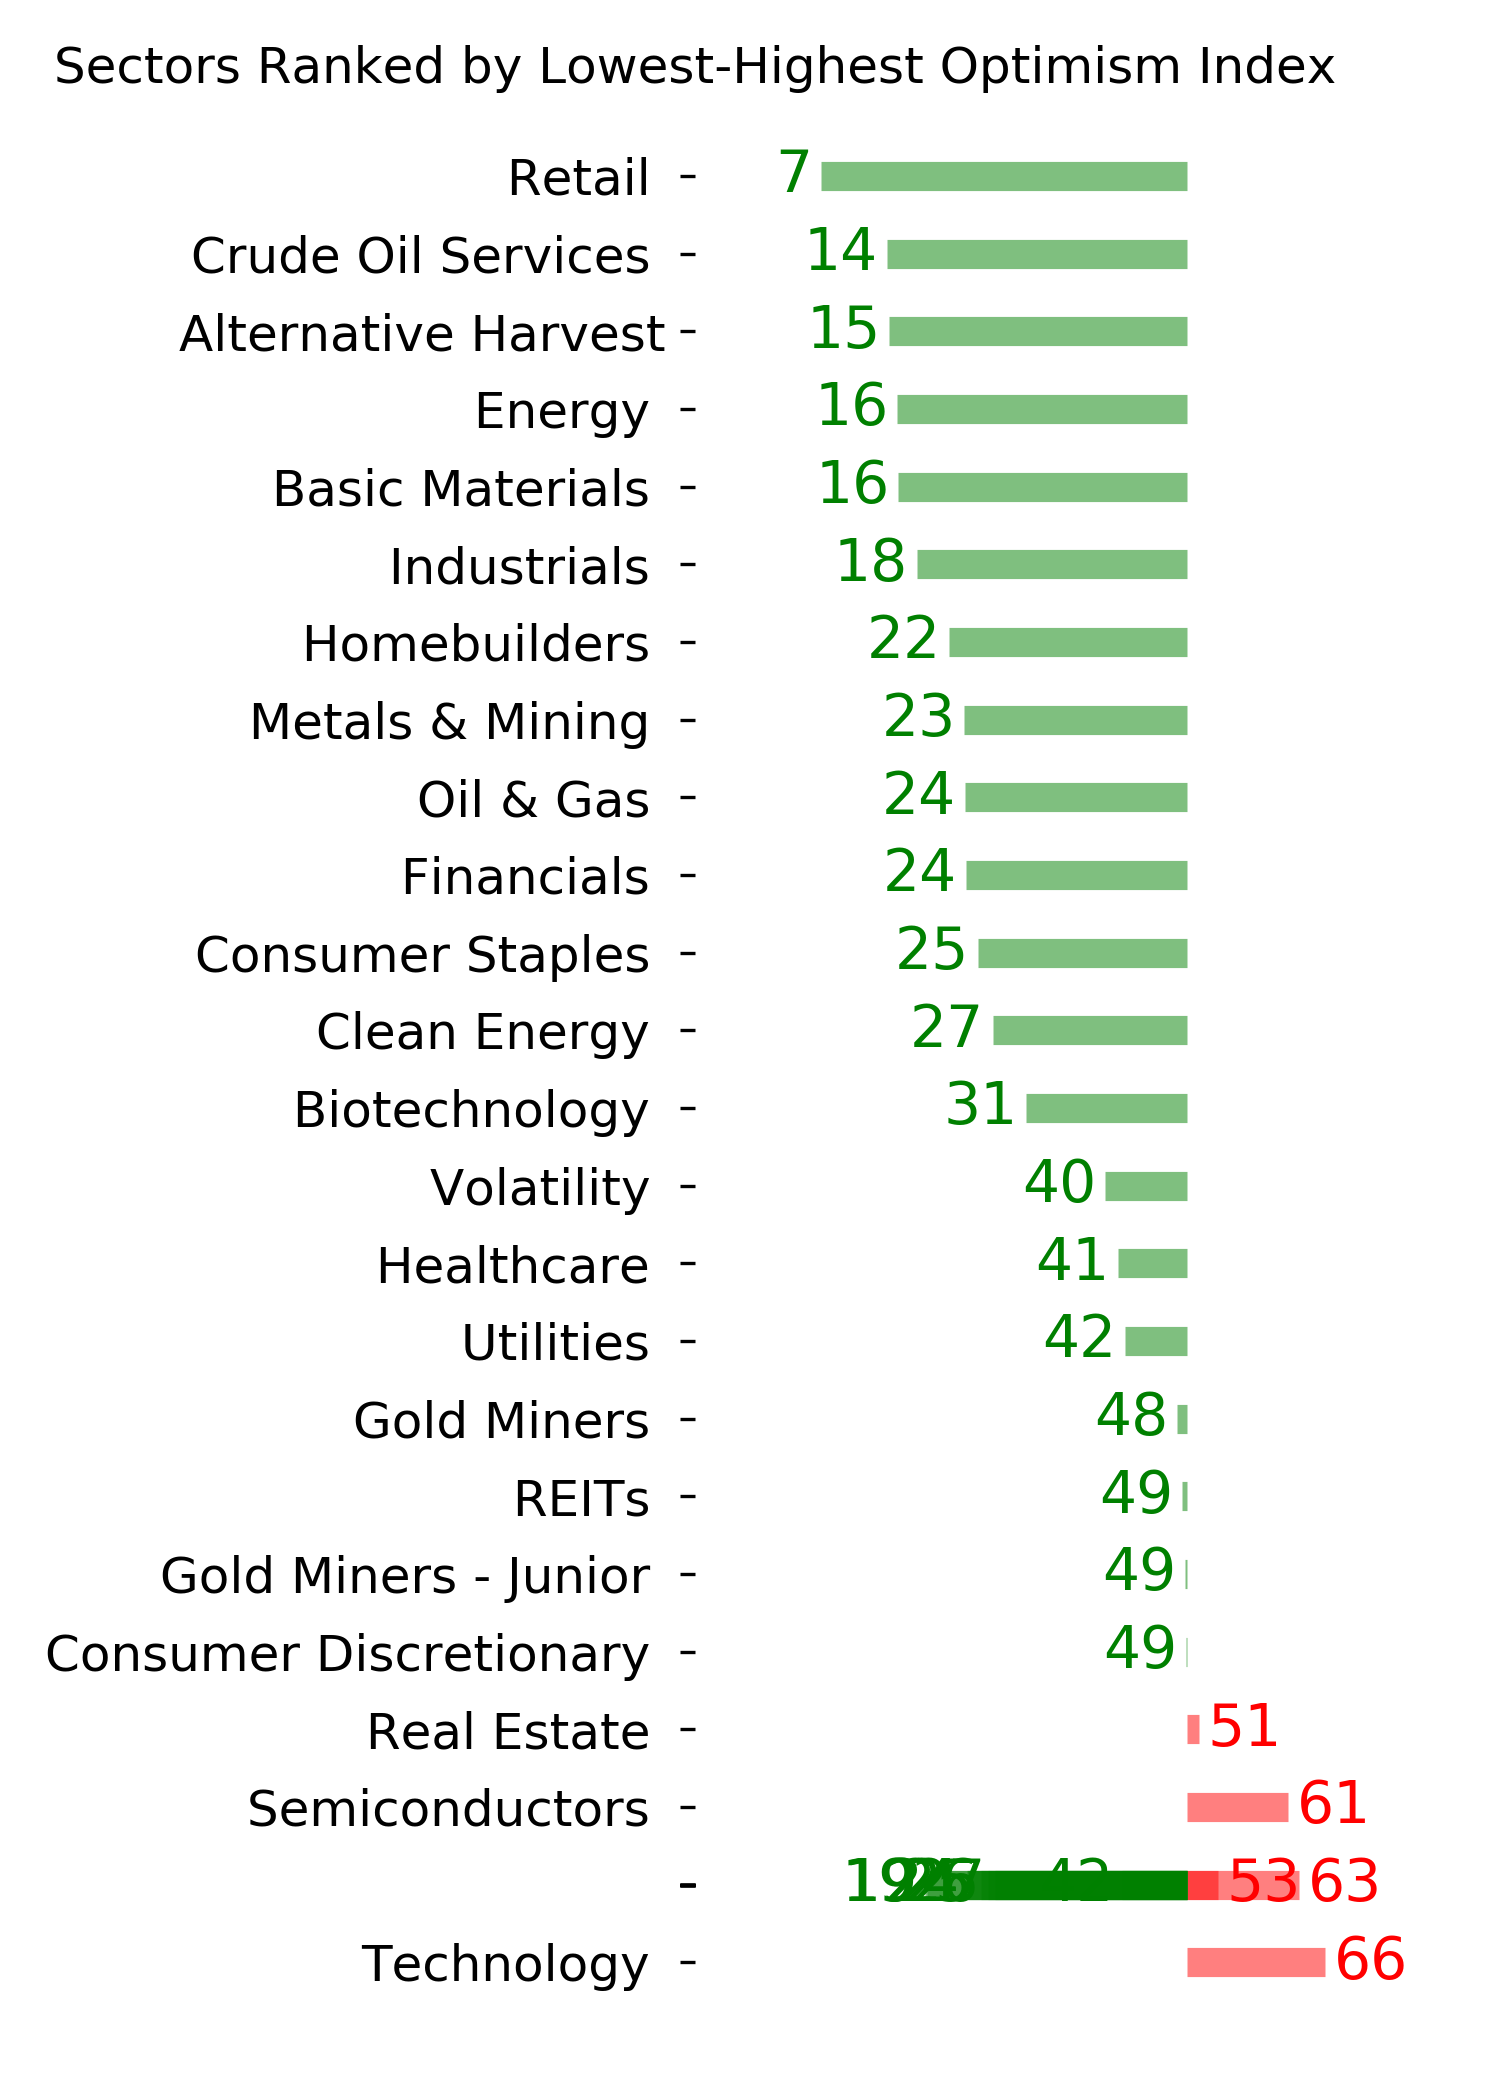
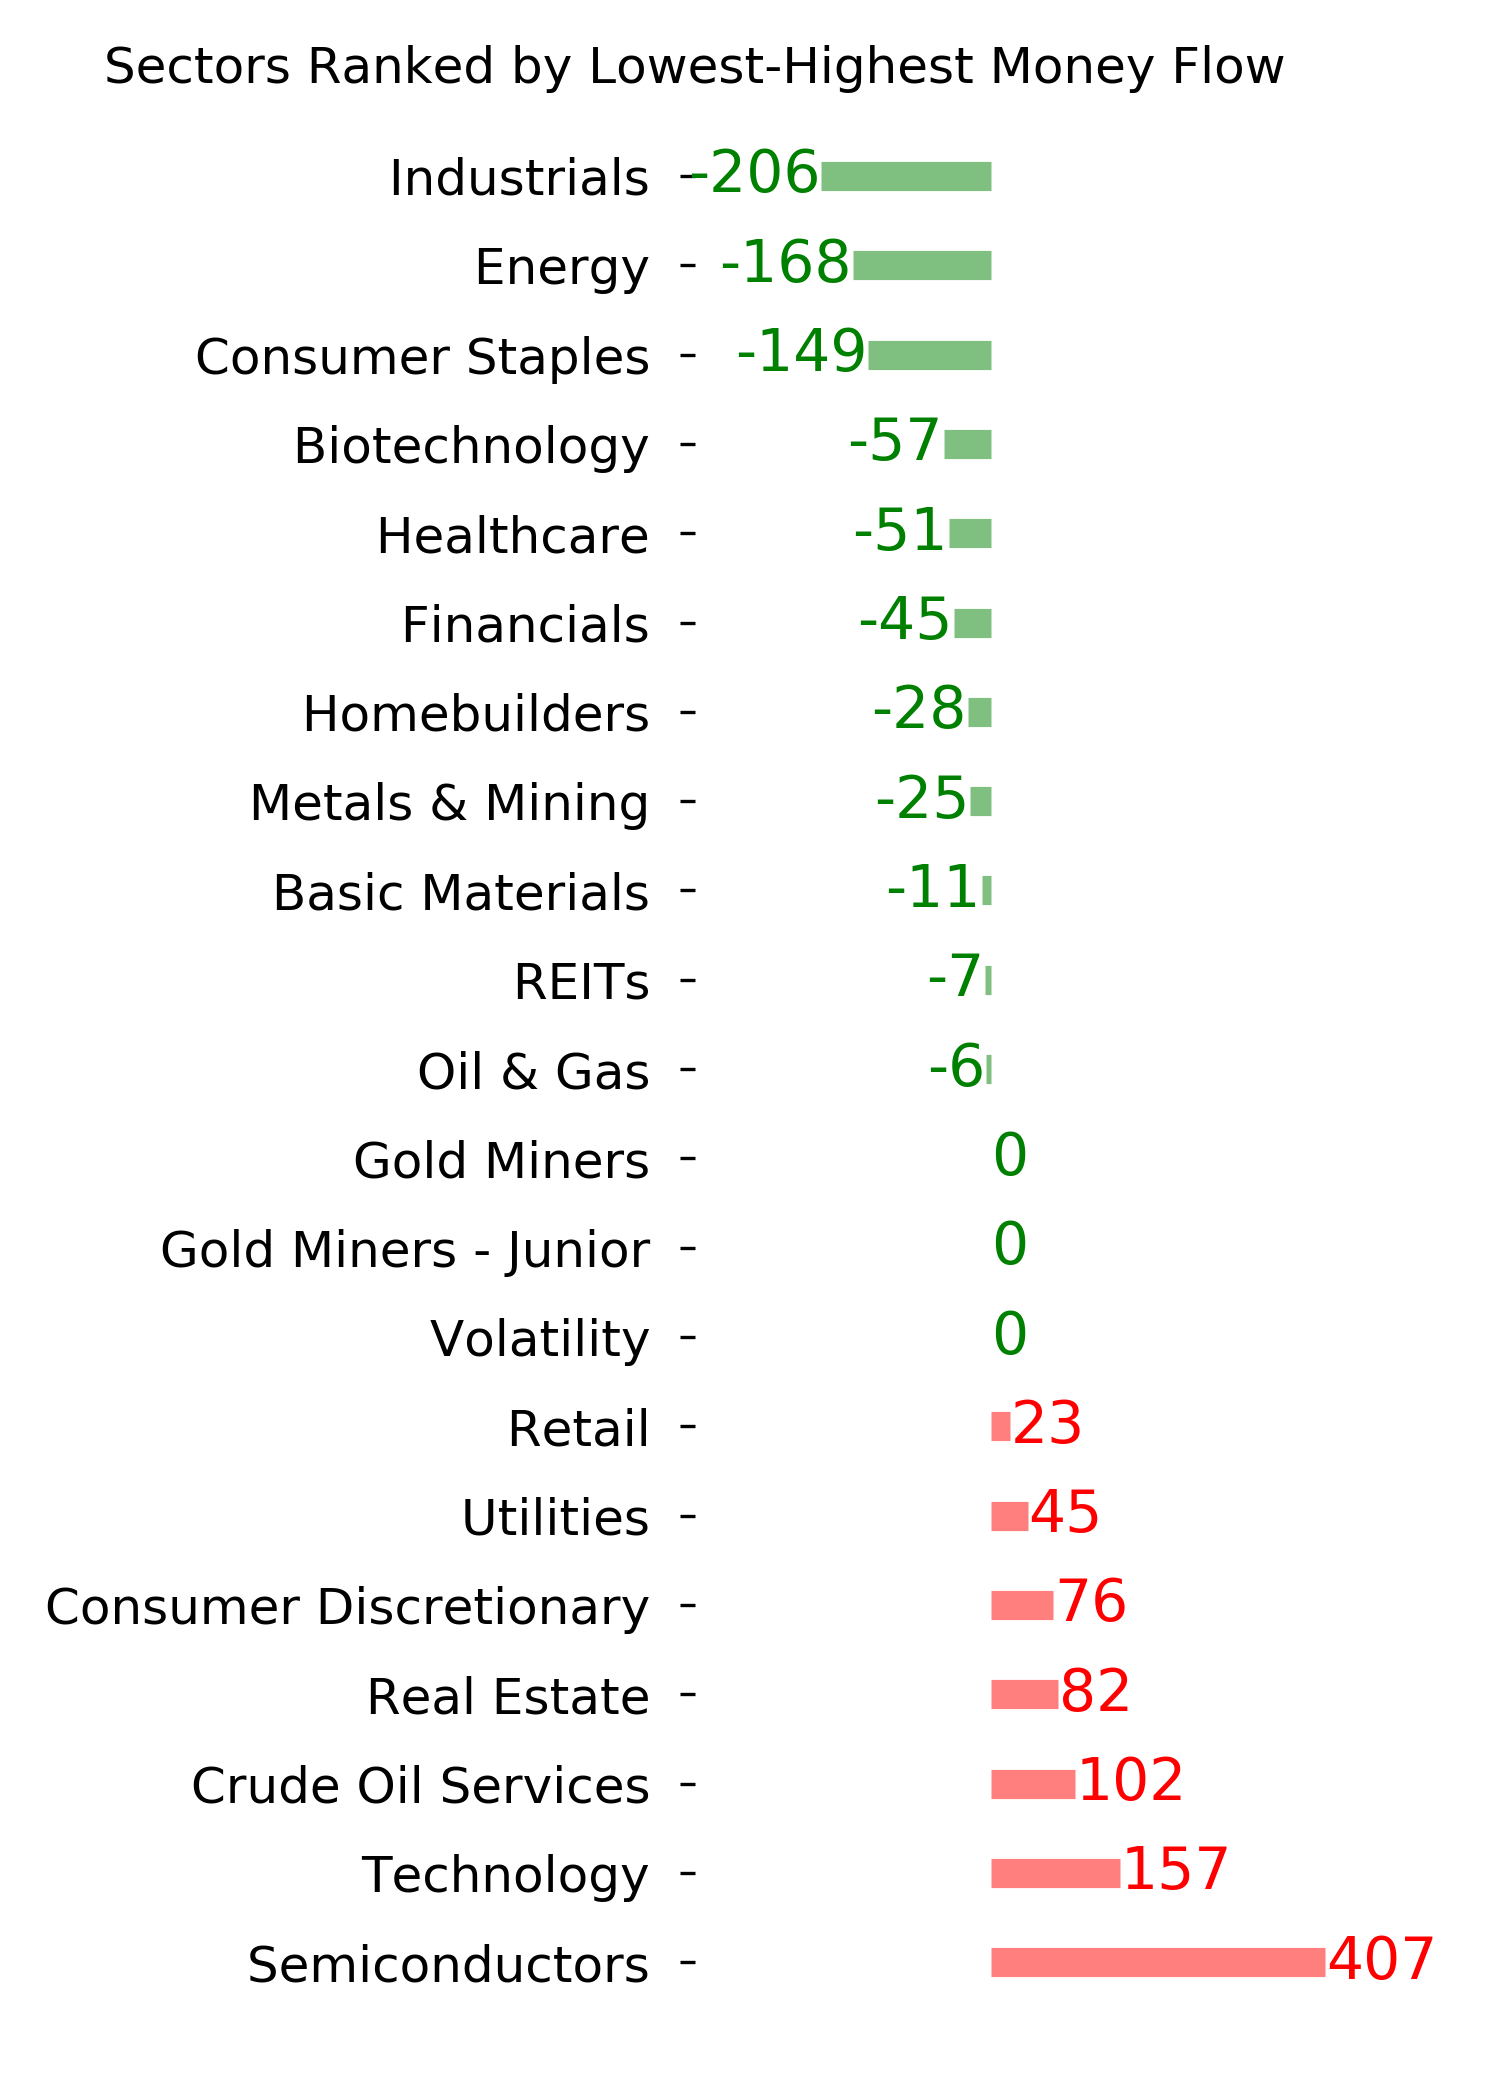
Sector ETF's - 10-Day Moving Average
|
|
|
Country ETF's - 10-Day Moving Average
|
|
|
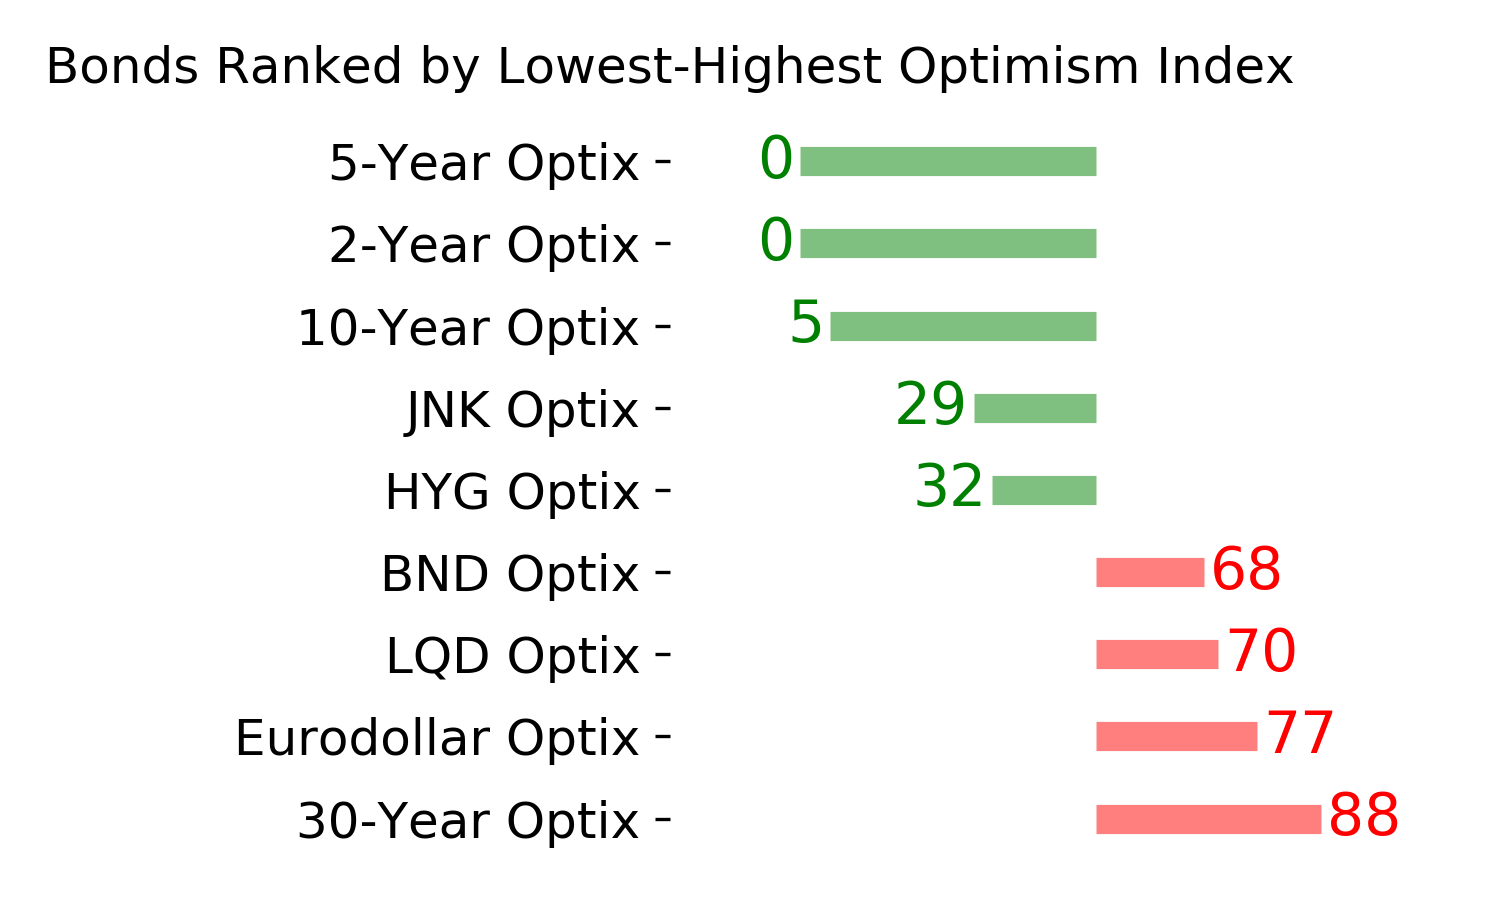
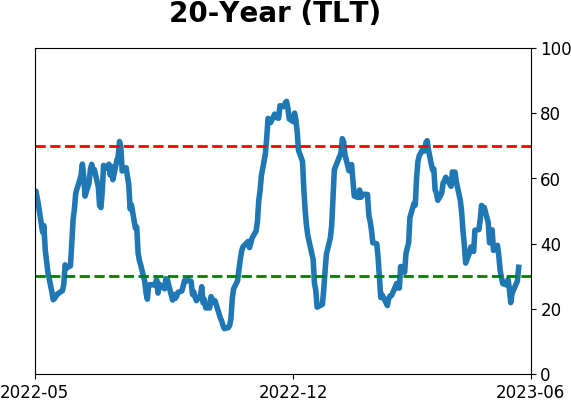
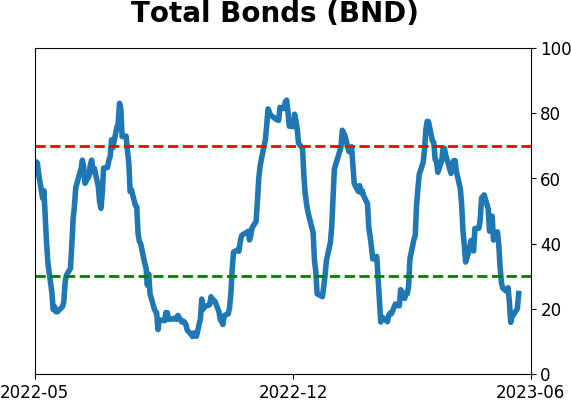
Bond ETF's - 10-Day Moving Average
|
|
|
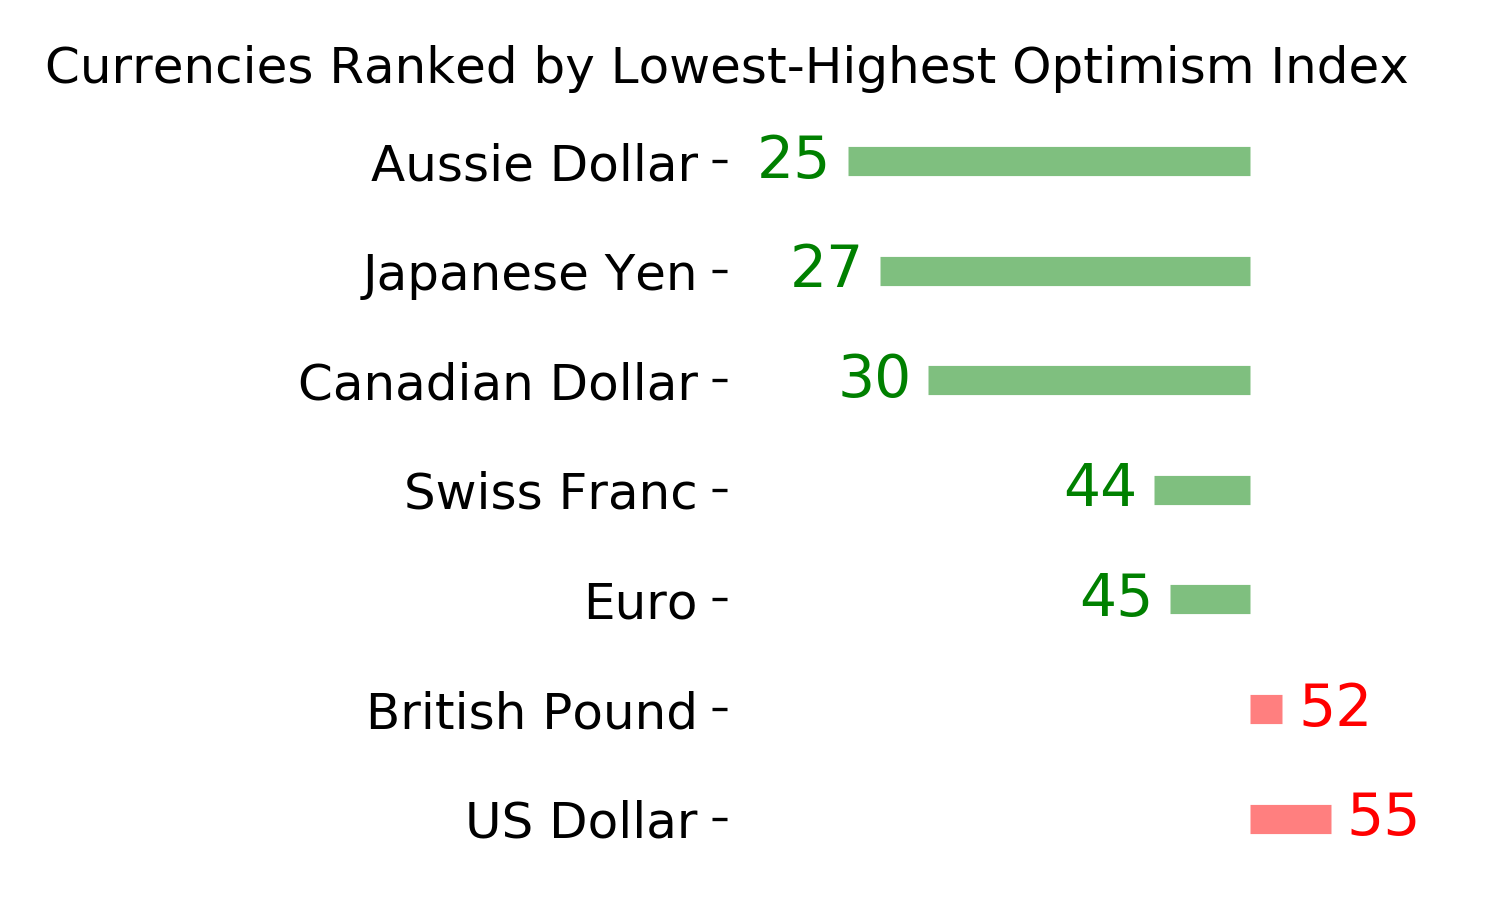
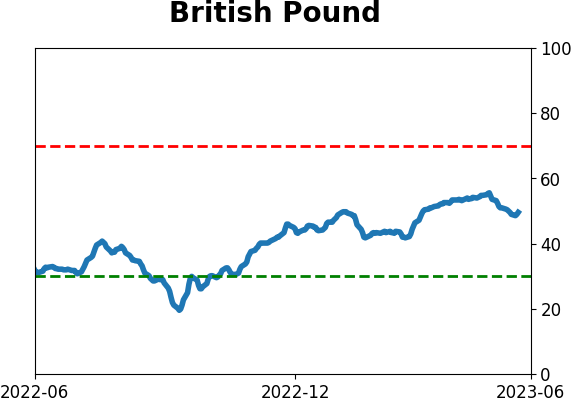
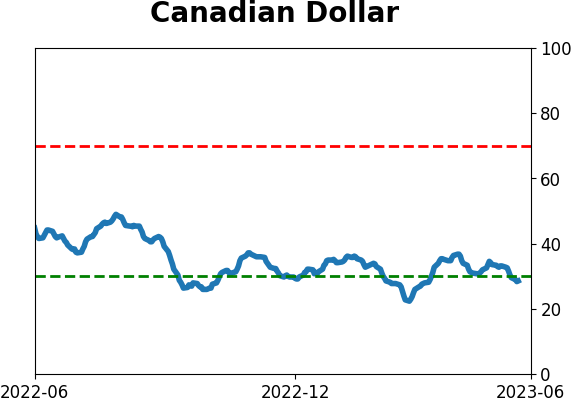
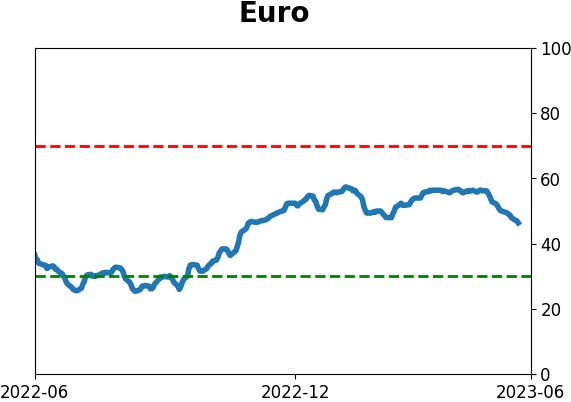
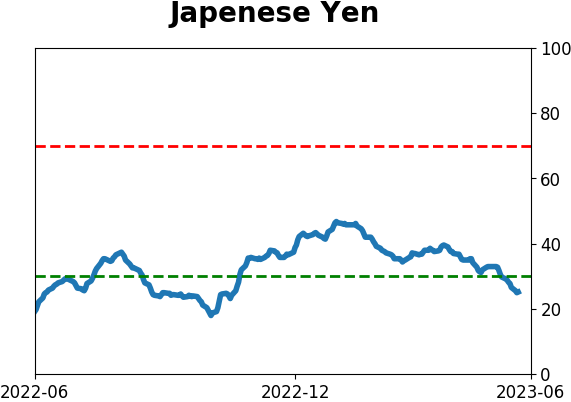
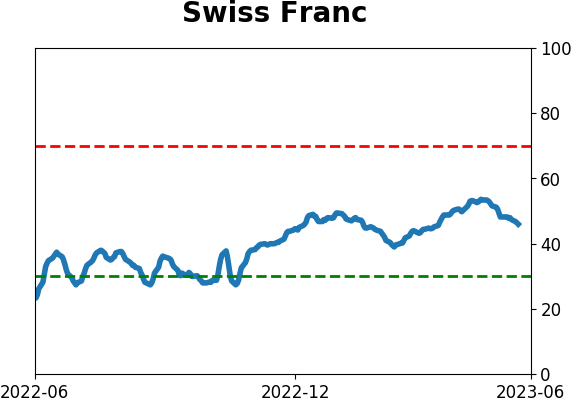
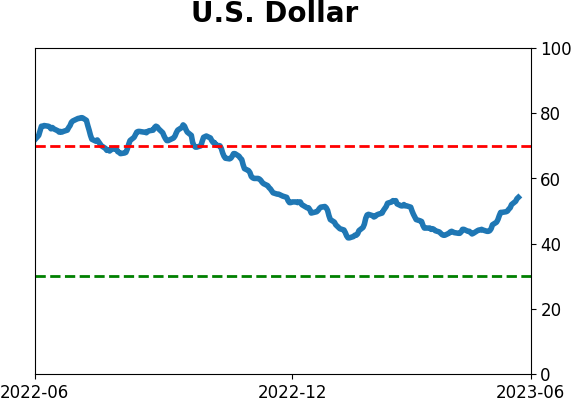
Currency ETF's - 5-Day Moving Average
|
|
|
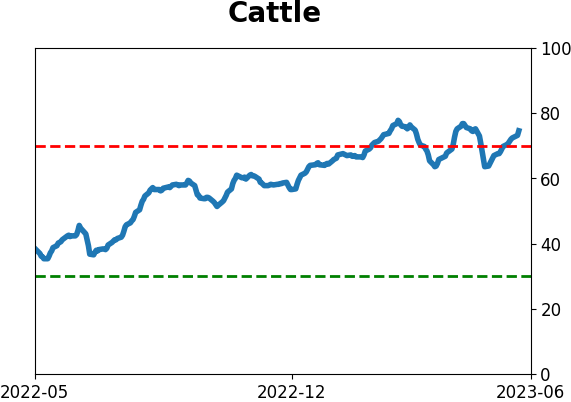
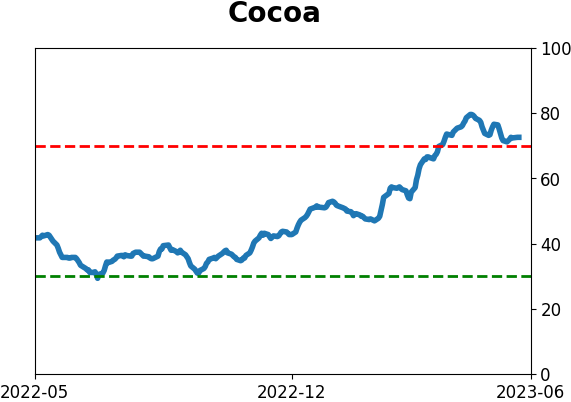
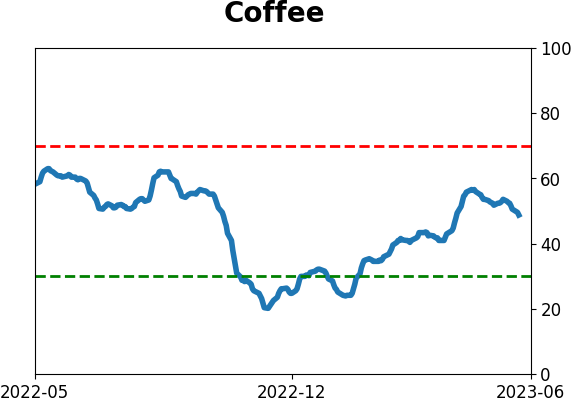
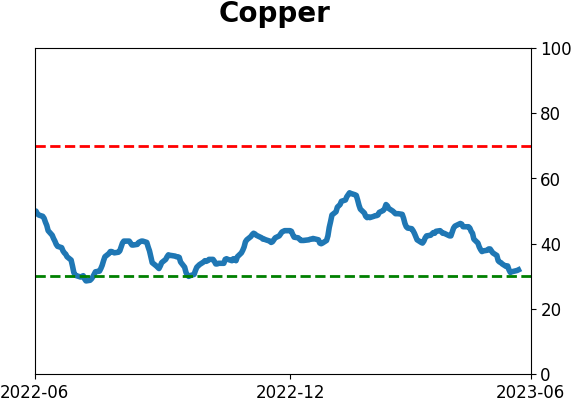
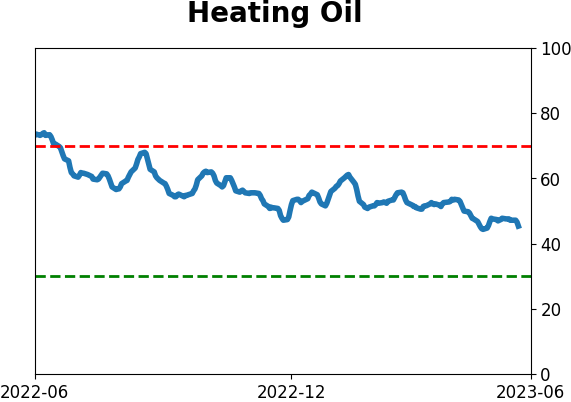
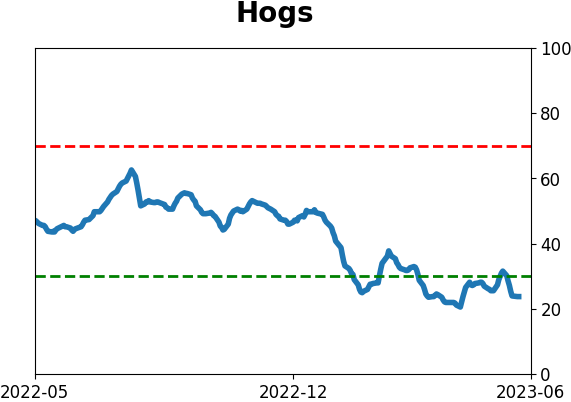
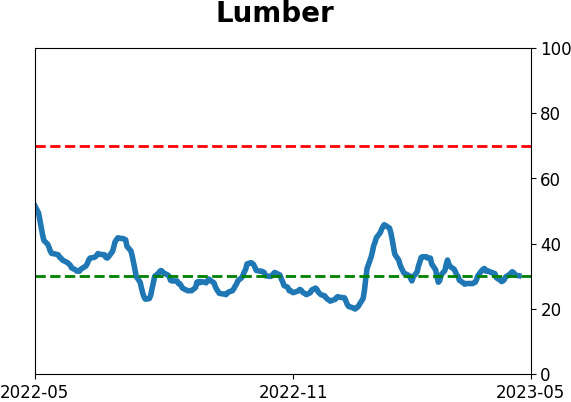
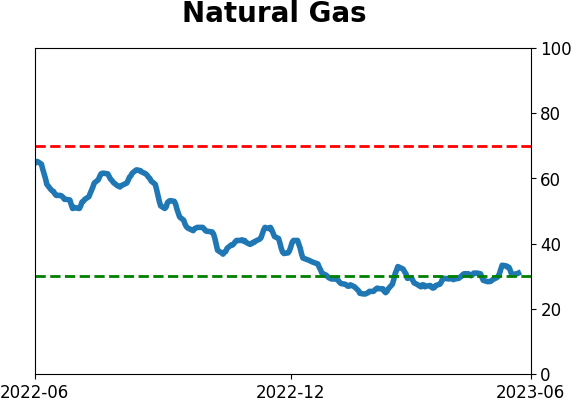
Commodity ETF's - 5-Day Moving Average
|
|