Headlines
|
|
The first seasonal trend I ever learned:
The stock market remains in the relatively early stages of a seasonal trend that - while easy to dismiss - has a surprisingly good track record.
A historic relative plunge in the average stock:
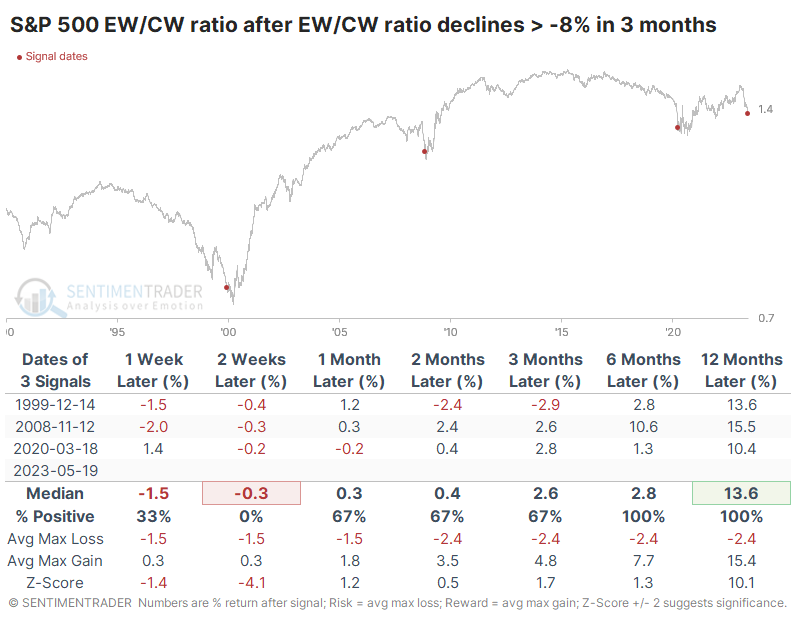
A surge in a handful of large stocks has pushed the capitalization-weighted version of the S&P 500 to good gains year-to-date. The equal-weight version of the index has languished, and the ratio between the two indexes has plunged 8% in just three months. Similar declines preceded outperformance by the average stock.
|
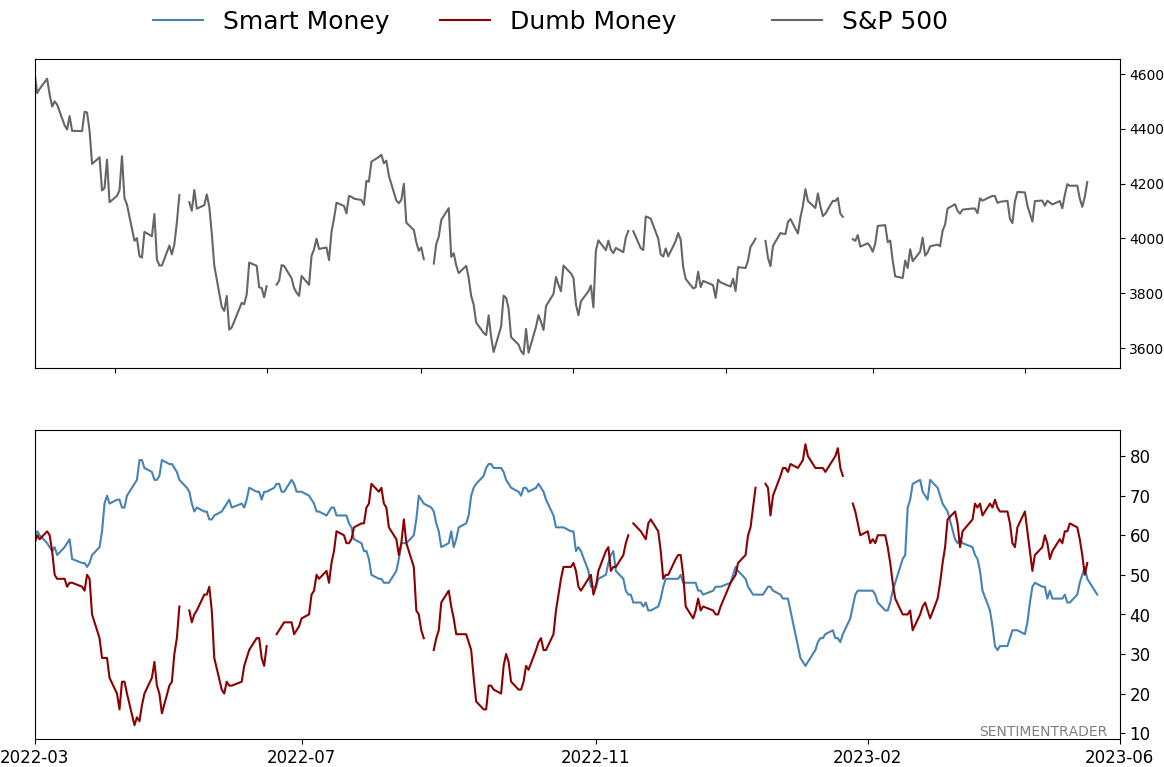
Smart / Dumb Money Confidence
|
Smart Money Confidence: 45%
Dumb Money Confidence: 53%
|
|
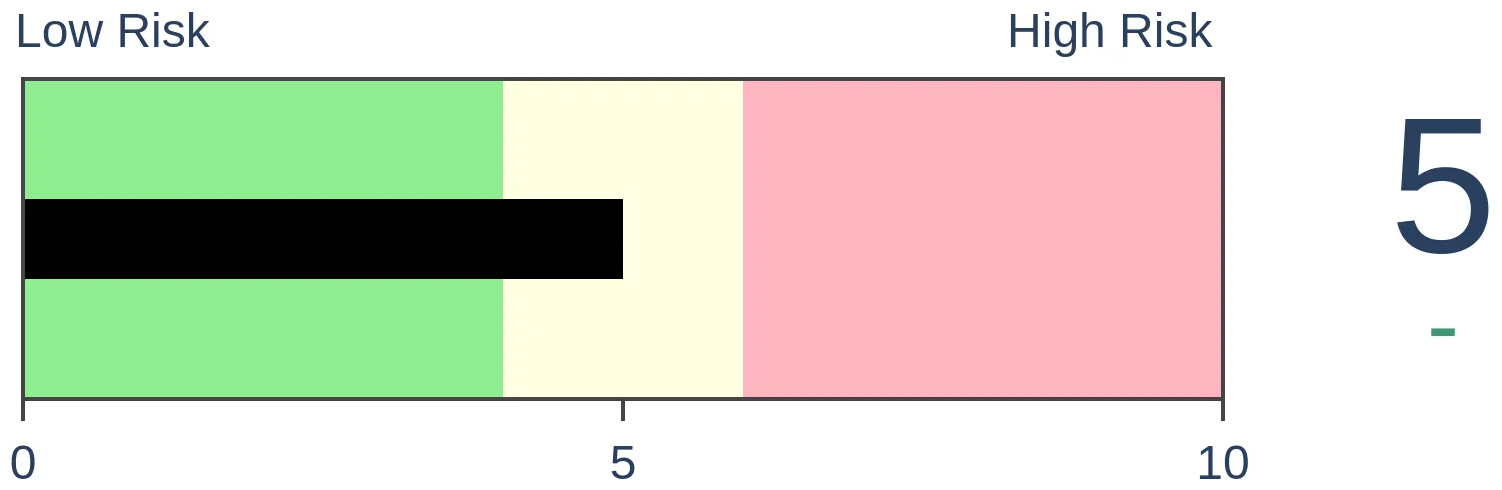
Risk Levels
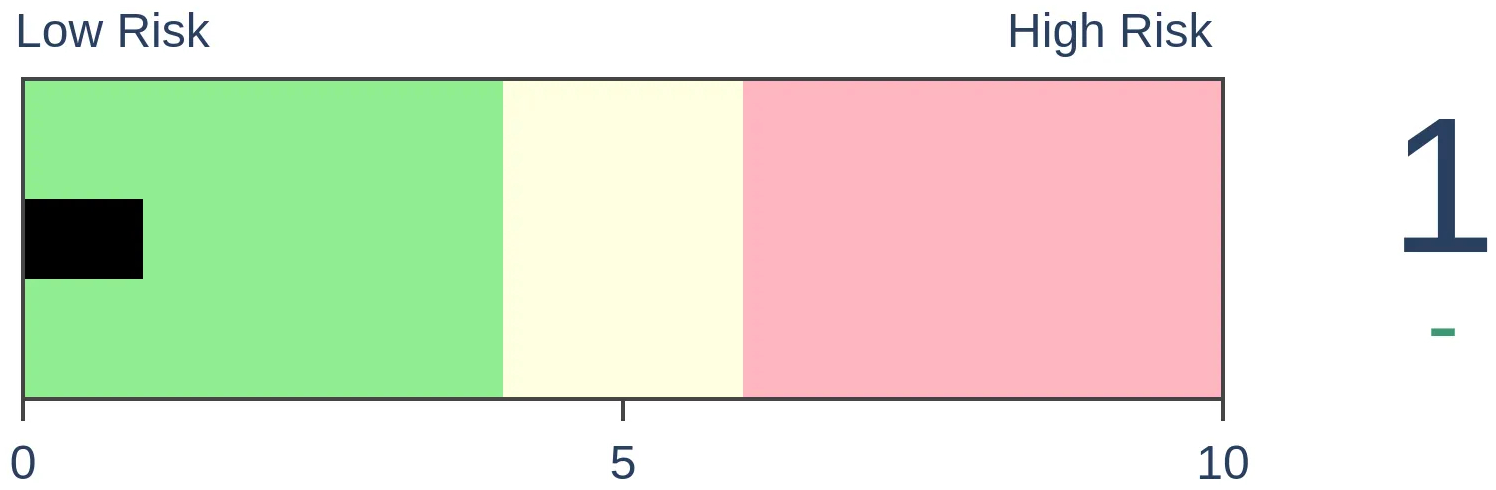
Stocks Short-Term

|
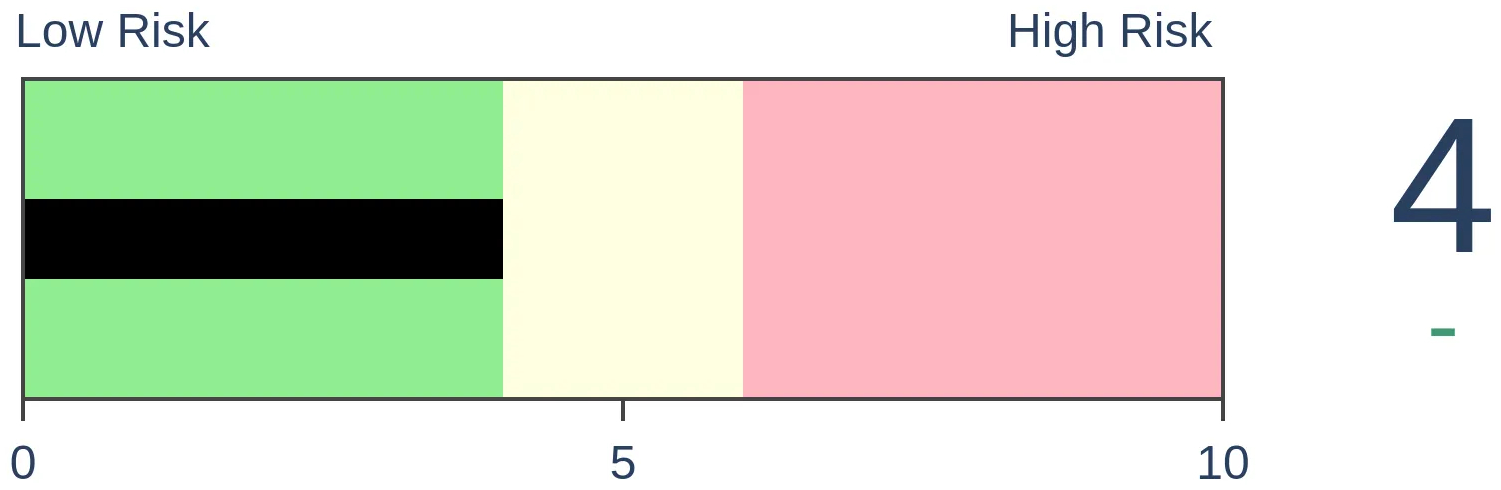
Stocks Medium-Term
|
|
Bonds
|
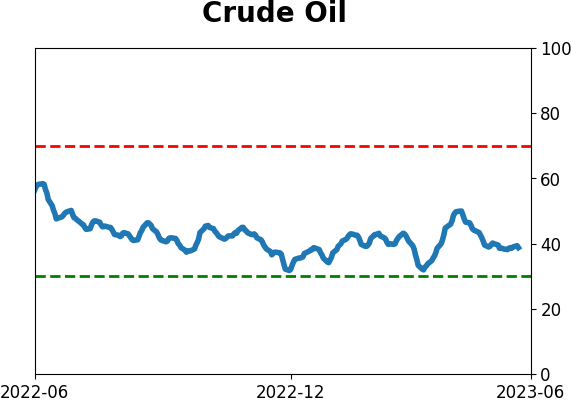
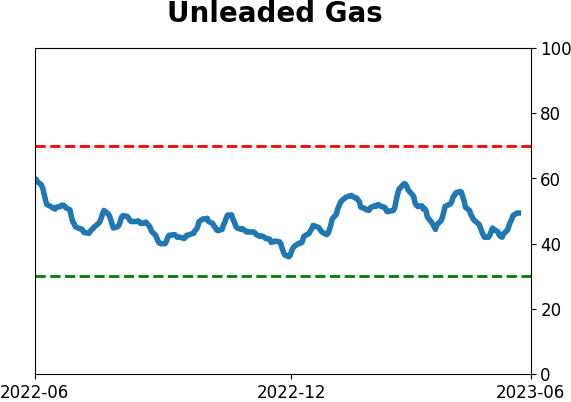
Crude Oil
|
|
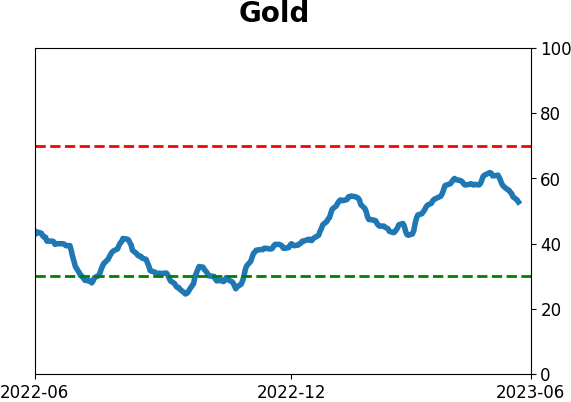
Gold

|
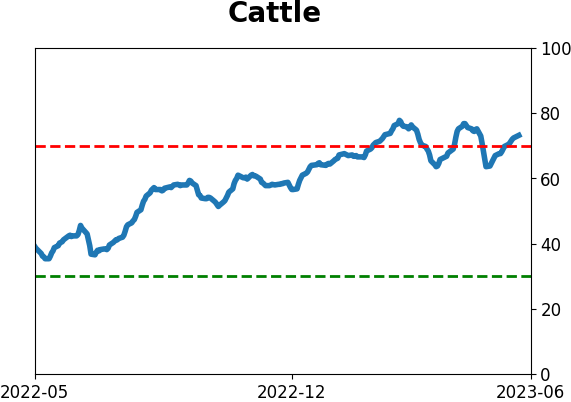
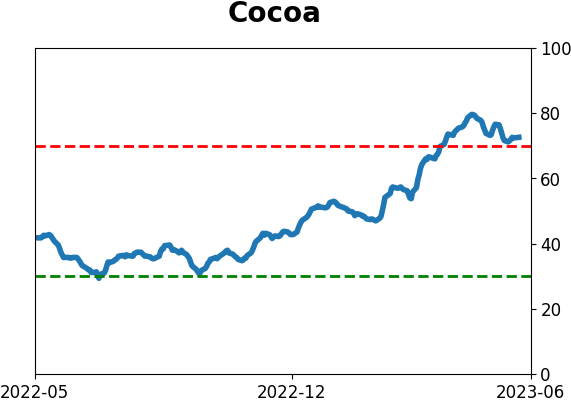
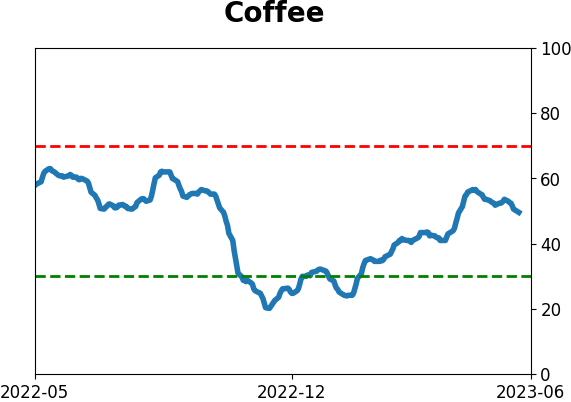
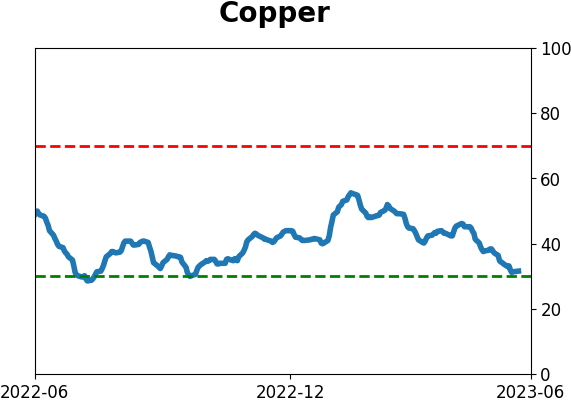
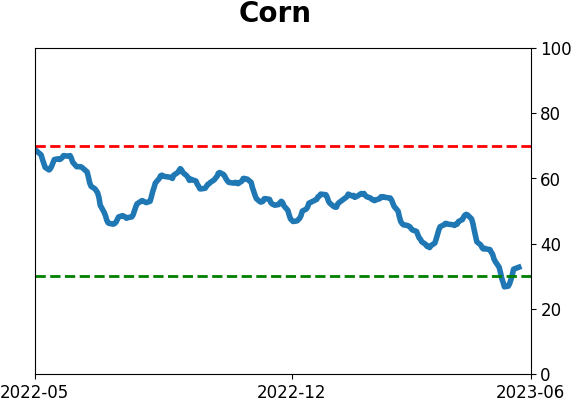
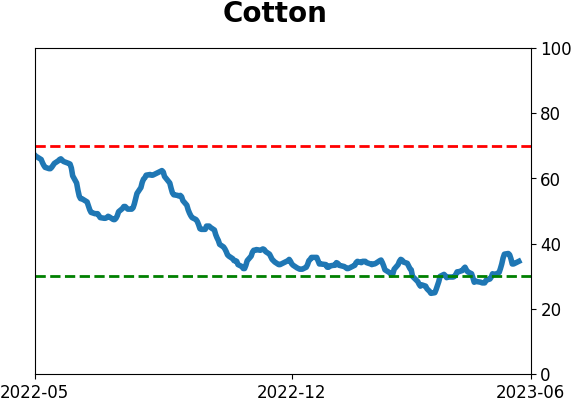
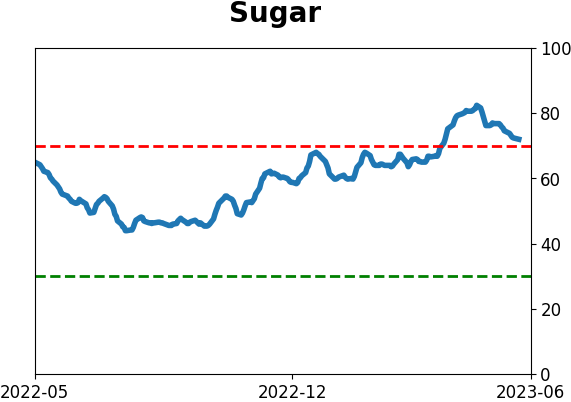
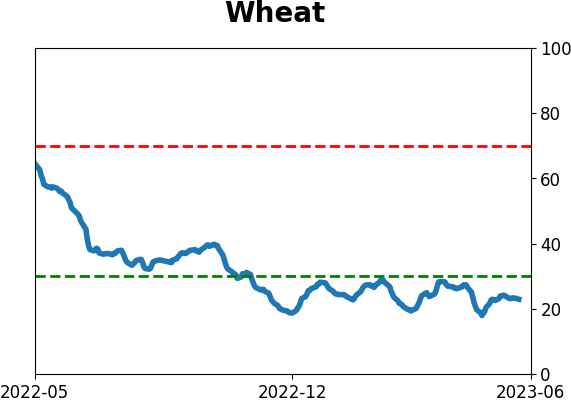
Agriculture

|
|
Research
By Jay Kaeppel
BOTTOM LINE
The stock market remains in the relatively early stages of a seasonal trend that - while easy to dismiss - has a surprisingly good track record.
FORECAST / TIMEFRAME
None
|
Key points
- Seasonal trends are best not used as a standalone indicator
- A reliable seasonal trend merely tells you "when to look where"
- One of the most ignored - and powerful - combinations is a bullish seasonal trend combined with bullish price action
- The first seasonal trend I ever read of - and dismissed and then re-embraced - remains in play
A little-known seasonal trend arguing for more
The rhetorical question is, "Can the rally that started in October 2022 continue through the end of 2025?" It sounds pretty ridiculous, I admit. And no, that is not a prediction.
Still, hear me out.
The truth is I don't remember where I first read about the seasonal trend I am about to discuss. Well, technically, I do. It was in the Des Plaines library in mid-1982, where I often spent my lunch hour digesting whatever stock market information I could find. But when I say I don't remember "where," I mean I don't remember the actual source I read about it from. That is probably partly because, at the time I read it, I thought it was the dumbest thing I'd ever read. But as a numbers geek - er, I mean, Student of the Market - I did what I always did a lot at the time - I jotted it down so I could come back later and see how it worked out.
It turns out, I'm glad I did.
The trend? (I hope you're sitting down):
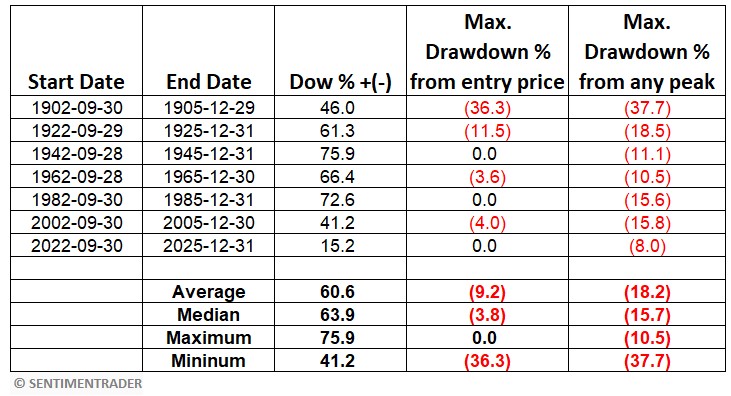
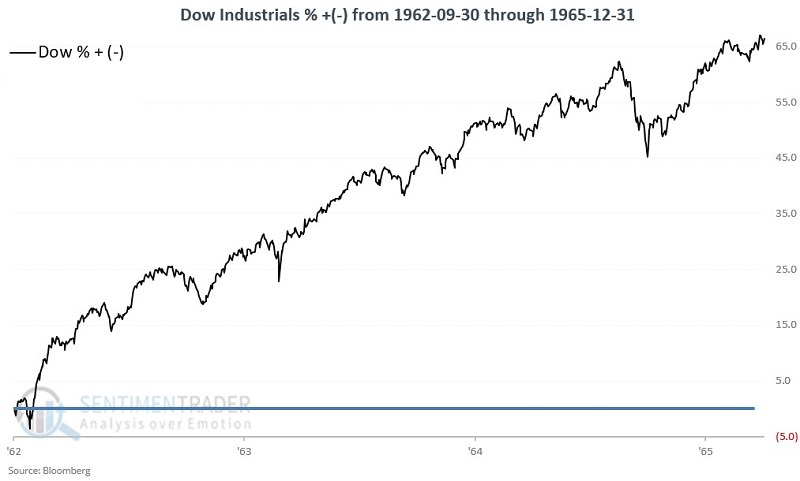
- Every 20 years, the 39-month period that extends from September 30th of the Year ending in 2 (1902, 1922, 1942, etc.) through December 31st of the Year ending in 5 (1905, 1925, 1945, etc.) has been bullish for the stock market.
I know, I know. It's the dumbest thing you've ever read, right? I know because I had the exact same reaction. It's ridiculous. When I read it in mid-1982, inflation and interest rates were above 10%, the economy was mired in recession, the Dow Jones Industrial Average had spent the prior 16 years bouncing between 600 and 1,000 and seemed locked in a permanent trading range, and the leading pundits of the day were forecasting another Depression. A lot of people believed them.
The bottom line: No way was the stock market going anywhere. But, as I said, I wrote it down to review later. Then something surprising happened.
The surprise
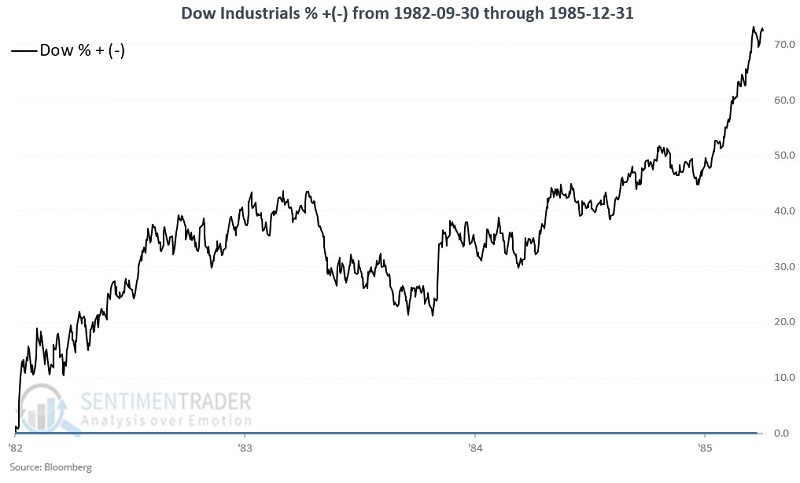
In August 1982, the stock market shot higher. At the close on 1982-09-30, the Dow was 17% off its low at 869.25. According to conventional wisdom, there were another 100 points for it to run before it hit the "inevitable" top at 1,000. Instead, over the next seven months, the Dow advanced another 37%. To make a long story short, by 1985-12-31, the Dow closed at 1,546.48, or +72.6% higher than its September 1982 close. And coincidentally, a "seasonal analyst" was born.
The history
First, the obvious implication based on this trend is that the stock market will continue to be in a bull market through 2025-12-31. For the record, this article is not me making that prediction. At Sentimentrader, our job is not to tell people what to think or do, and our personal opinions are entirely irrelevant. Our job is simply to report as objectively as possible what we see. In this case, I am merely reporting the history. Truth be told, based on the current "state of affairs" in the market and economy, even I am not willing to follow this notion blindly and remain fully invested based solely on one seasonal trend.
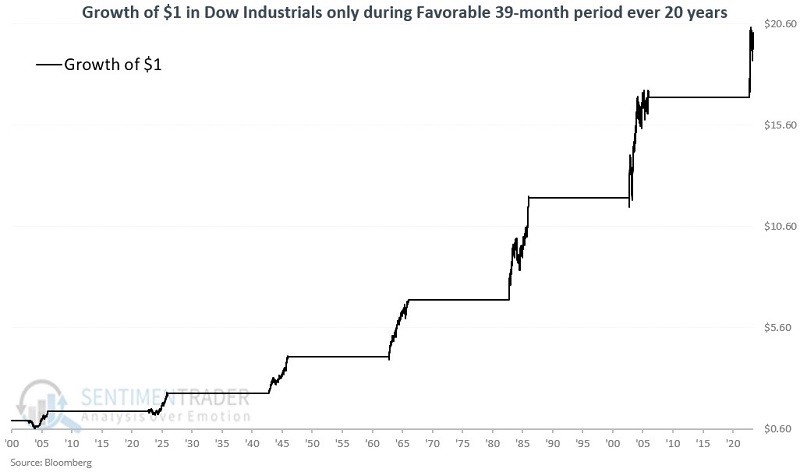
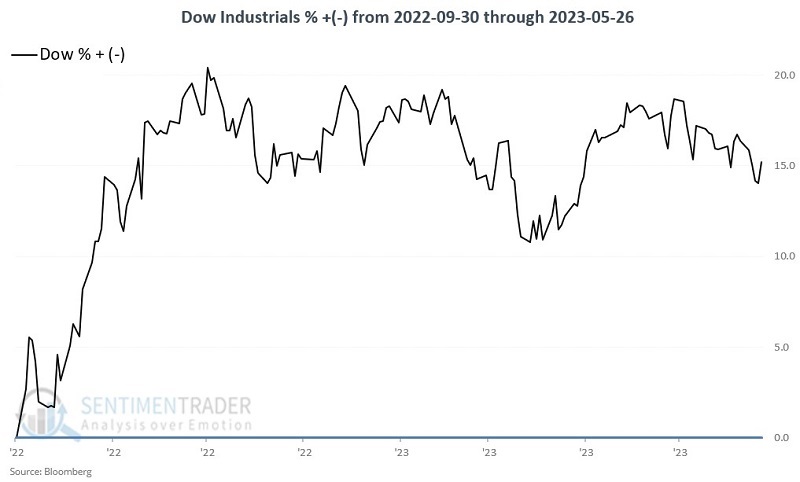
But I am willing to keep an open mind. Especially if the market is cooperating. The reason why I am willing to do so appears in the chart below displays an equity curve showing the growth of $1 invested in the Dow Jones Industrial Average only during the 39 months from the end of September of Year "2" through the end of Year "5" every 20 years starting in 1902, including the months since September 2022.
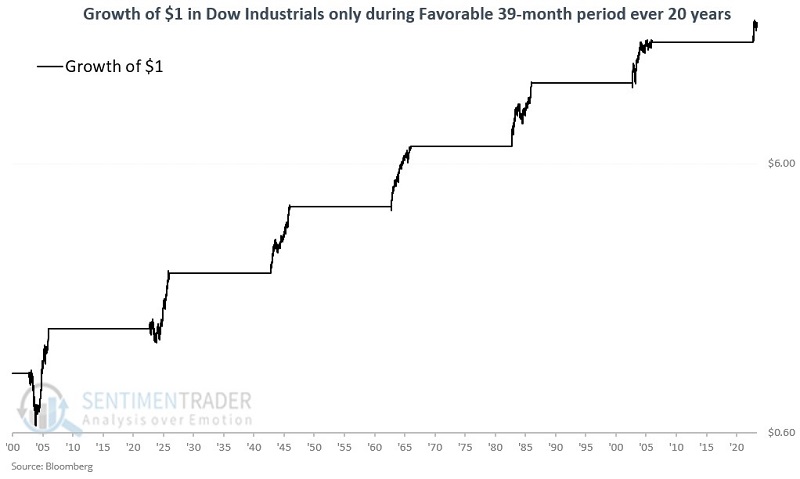
The chart below displays the same information on a logarithmic scale.
The table below summarizes the Dow's performance during this period, including results since the end of September 2022. The summary values at the bottom of the table do not include the latest period, which is only eight months old.
A closer look at history
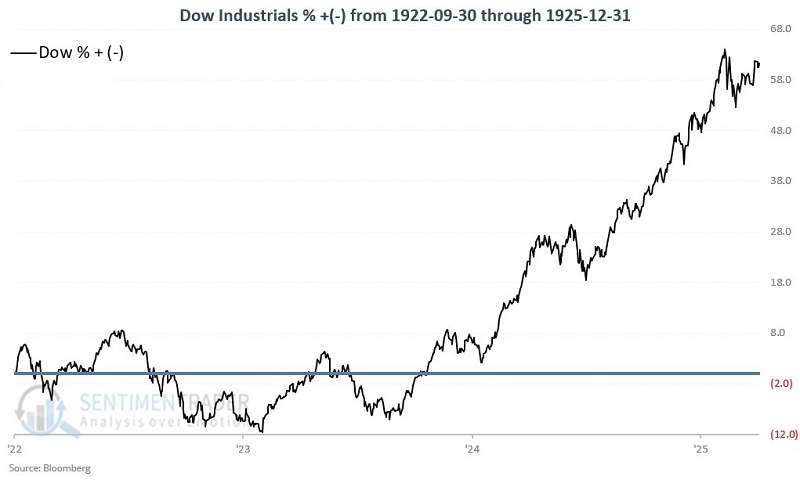
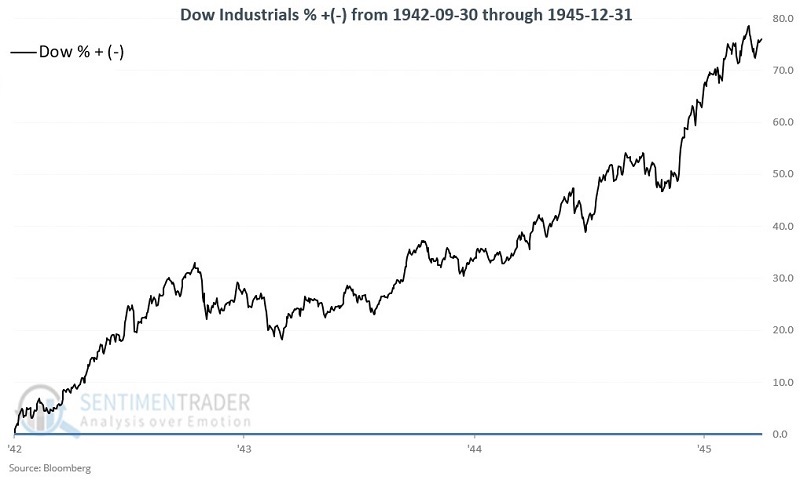
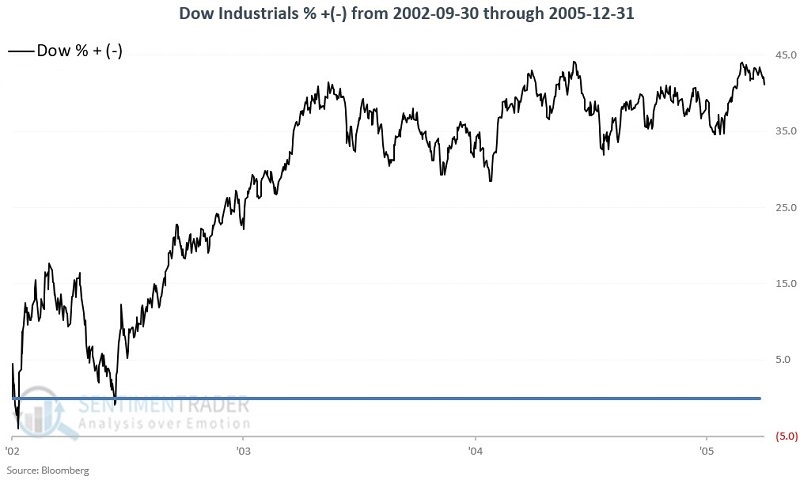
For illustrative purposes, the charts below display the growth of $1 invested in the Dow during each period listed in the table above.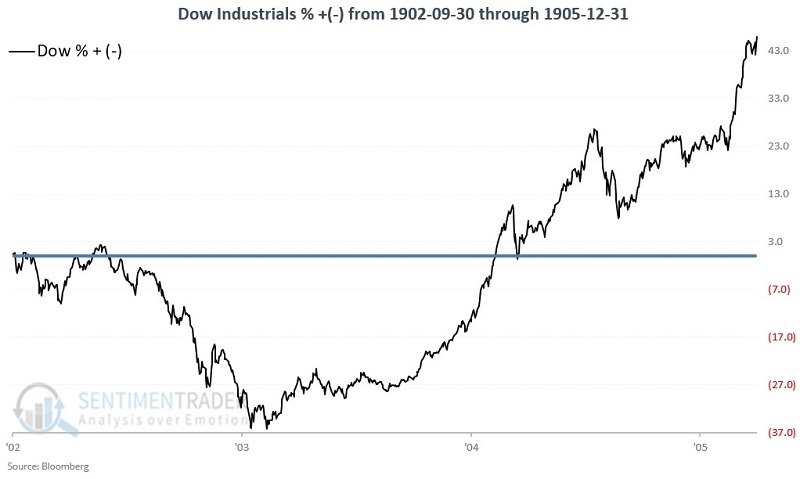
What the research tells us…
Given the macroeconomic and geopolitical uncertainties swirling about the market at this exact moment, it is easy to dismiss all that appears above. On the other hand, I remember having that exact sentiment in mid-1982.
In my opinion, seasonal trends should rarely, if ever, be used as a standalone trading method. Particularly one that lasts for 39 months - a lot can happen in 39 months. But I have found that as a tool for telling you "Where to look" and "which way to lean," seasonal trends can be extremely useful. For the record, I am not "pounding the table" and insisting that the rally that began in October 2022 will continue to run.
I am also not saying that it won't.
The real lesson from the information above is this - as long as the major indexes are acting well, it may be best to ignore gloom and doom predictions and give the bullish case the benefit of the doubt.
By Jason Goepfert
BOTTOM LINE
A surge in a handful of large stocks has pushed the capitalization-weighted version of the S&P 500 to good gains year-to-date. The equal-weight version of the index has languished, and the ratio between the two indexes has plunged 8% in just three months. Similar declines preceded outperformance by the average stock.
FORECAST / TIMEFRAME
None
|
Key points:
- A handful of big Technology stocks have driven the capitalization-weighted S&P 500 index to decent gains this year
- The equal-weight version of the index has languished and is down 8% relative to the other version since February
- Similar large declines in the ratio between the two indexes preceded outsized gains for the average stock
A few surging stocks haven't helped "average" investors
A couple of times in recent weeks, we've looked at the rally's primary drivers in the world's most benchmarked index. It's no secret that a handful of behemoth Technology stocks are a major driving force behind this year's gains.
So far in 2023, the S&P 500 index that everyone watches is showing a respectable gain. The equal-weighted version of the index, which weights each of the 500+ stocks equally, is struggling to hold any year-to-date gains at all.
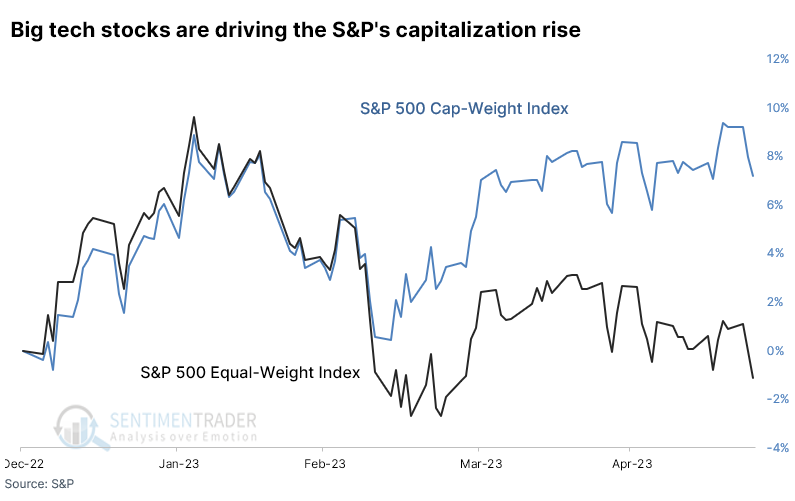
The indexes were tracking closely until the last few months. Since then, the surge in Tech stocks pushed the ratio between the two versions of the index out of whack. The 3-month rate of change in the ratio of the equal-weight to cap-weight versions plunged 8%, among the worst declines since the 1990 inception of the equal-weight index.
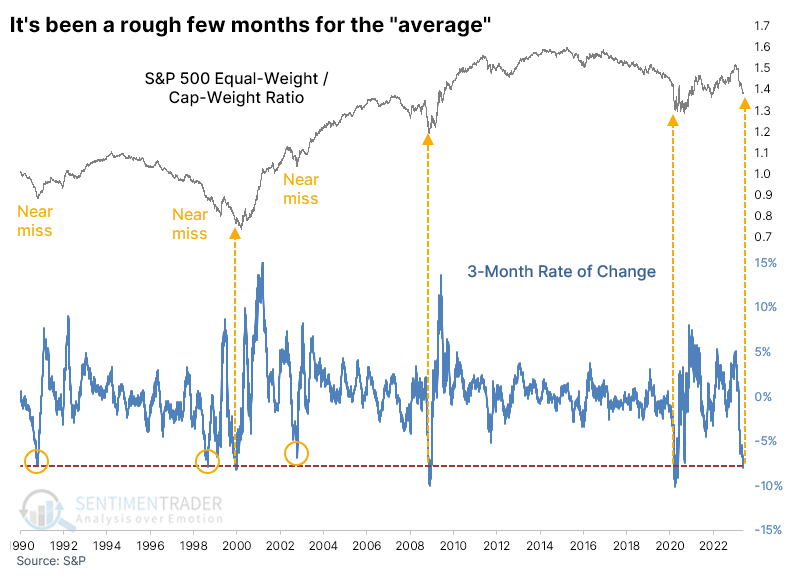 A few times, the decline didn't quite reach the -8% threshold. Two coincided with an imminent turn in the ratio, with the equal-weight version outperforming the cap-weight version for a couple of years afterward.
After big declines in the ratio, the average stock shined
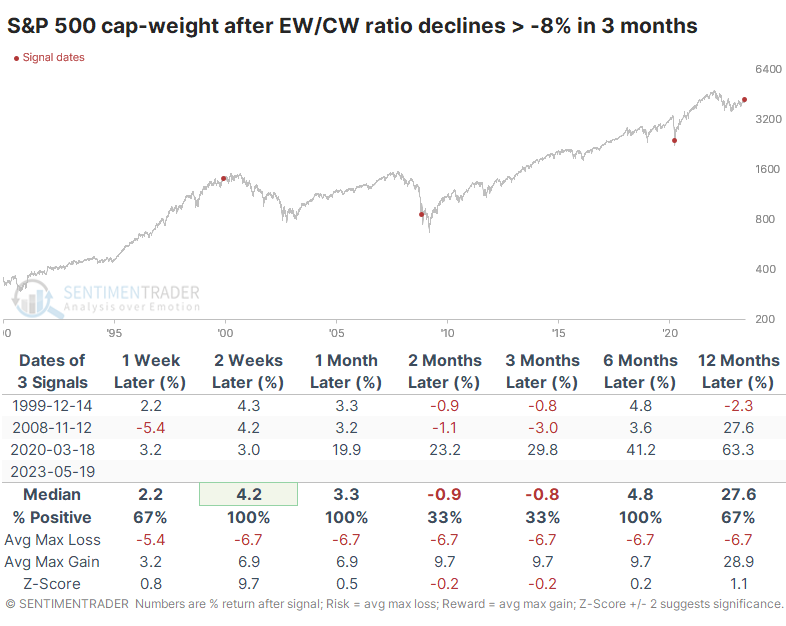
The table below shows returns in the cap-weight version (the standard one that everyone watches) after the few times the ratio declined at least 8% over three months. Two preceded mediocre returns over the next few months, and one was at the low during the pandemic.
The equal-weight version of the index performed better after these signals. The six- and twelve-month returns were excellent, with minimal drawdowns though the volatility in 2008 was uncomfortable.
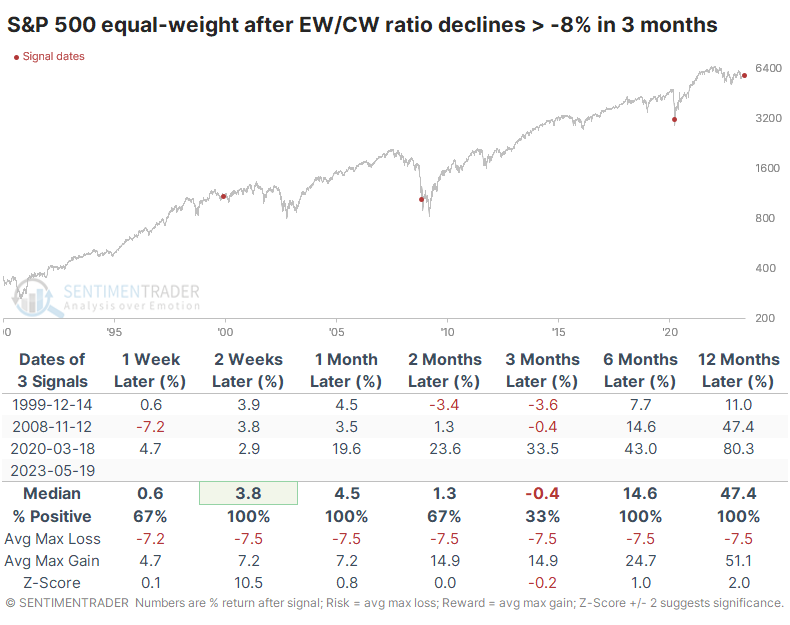
Because the equal-weight returns were mostly better than the cap-weight returns, the ratio between the indexes mostly showed gains after the first couple of weeks. Over the following year, the equal-weight version of the S&P 500 outperformed by more than 10% after each signal.
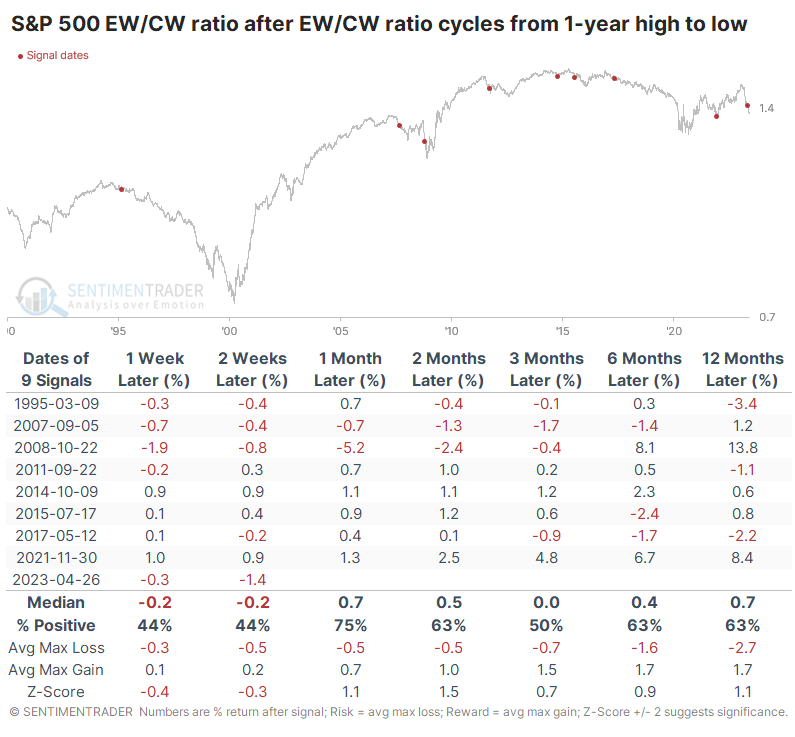
There are other ways to view the performance of the two indexes. One preferred way we look at data similar to this is cycles, like seeing what happens when it goes from one extreme to the other. The table below shows returns in the ratio when it cycles from at least a one-year high to a one-year low.
This triggered in late April, and the ratio has continued lower, which isn't unusual. There wasn't a strong bias in the returns, though there was a modest tendency to see the equal-weight version of the index resume its leadership after similar cycles.
What the research tells us...
The hand-wringing over a handful of stocks driving major indexes higher this year doesn't have a lot of empirical support. It's hard to find evidence that such behavior is necessarily bad for markets. What it has clearly done, however, is frustrate those who don't want to have outsized exposure to a handful of stocks. With a relatively short history and the necessary limitation of looking at extremes, it's hard to place much weight on extremes like we're seeing now. Still, the history we do have suggests that declines like this in the equal-weight S&P 500 should be reversed in the months ahead. Those betting on 500 stocks performing better than 5 have some support for their view.
Indicators at Extremes
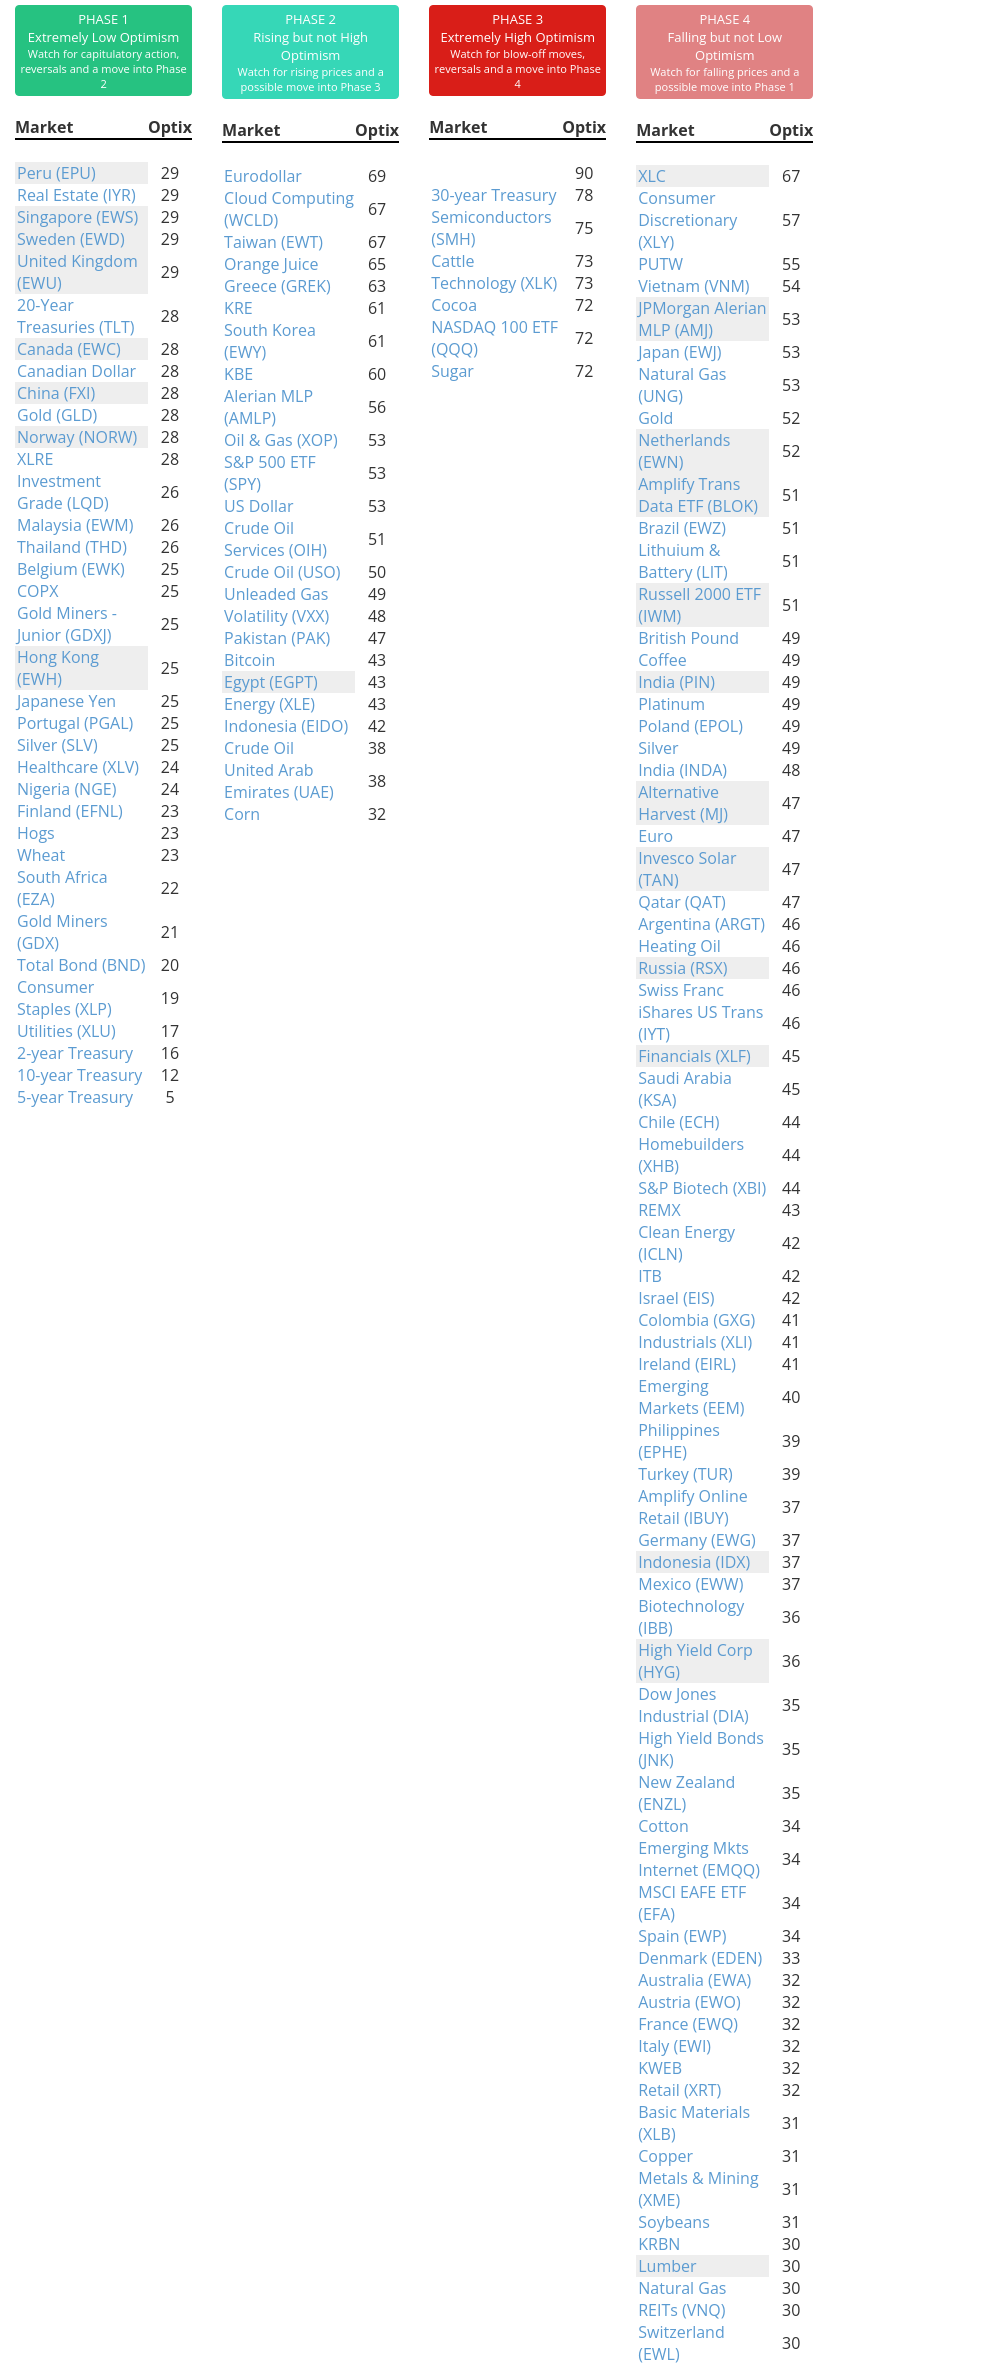
Phase Table
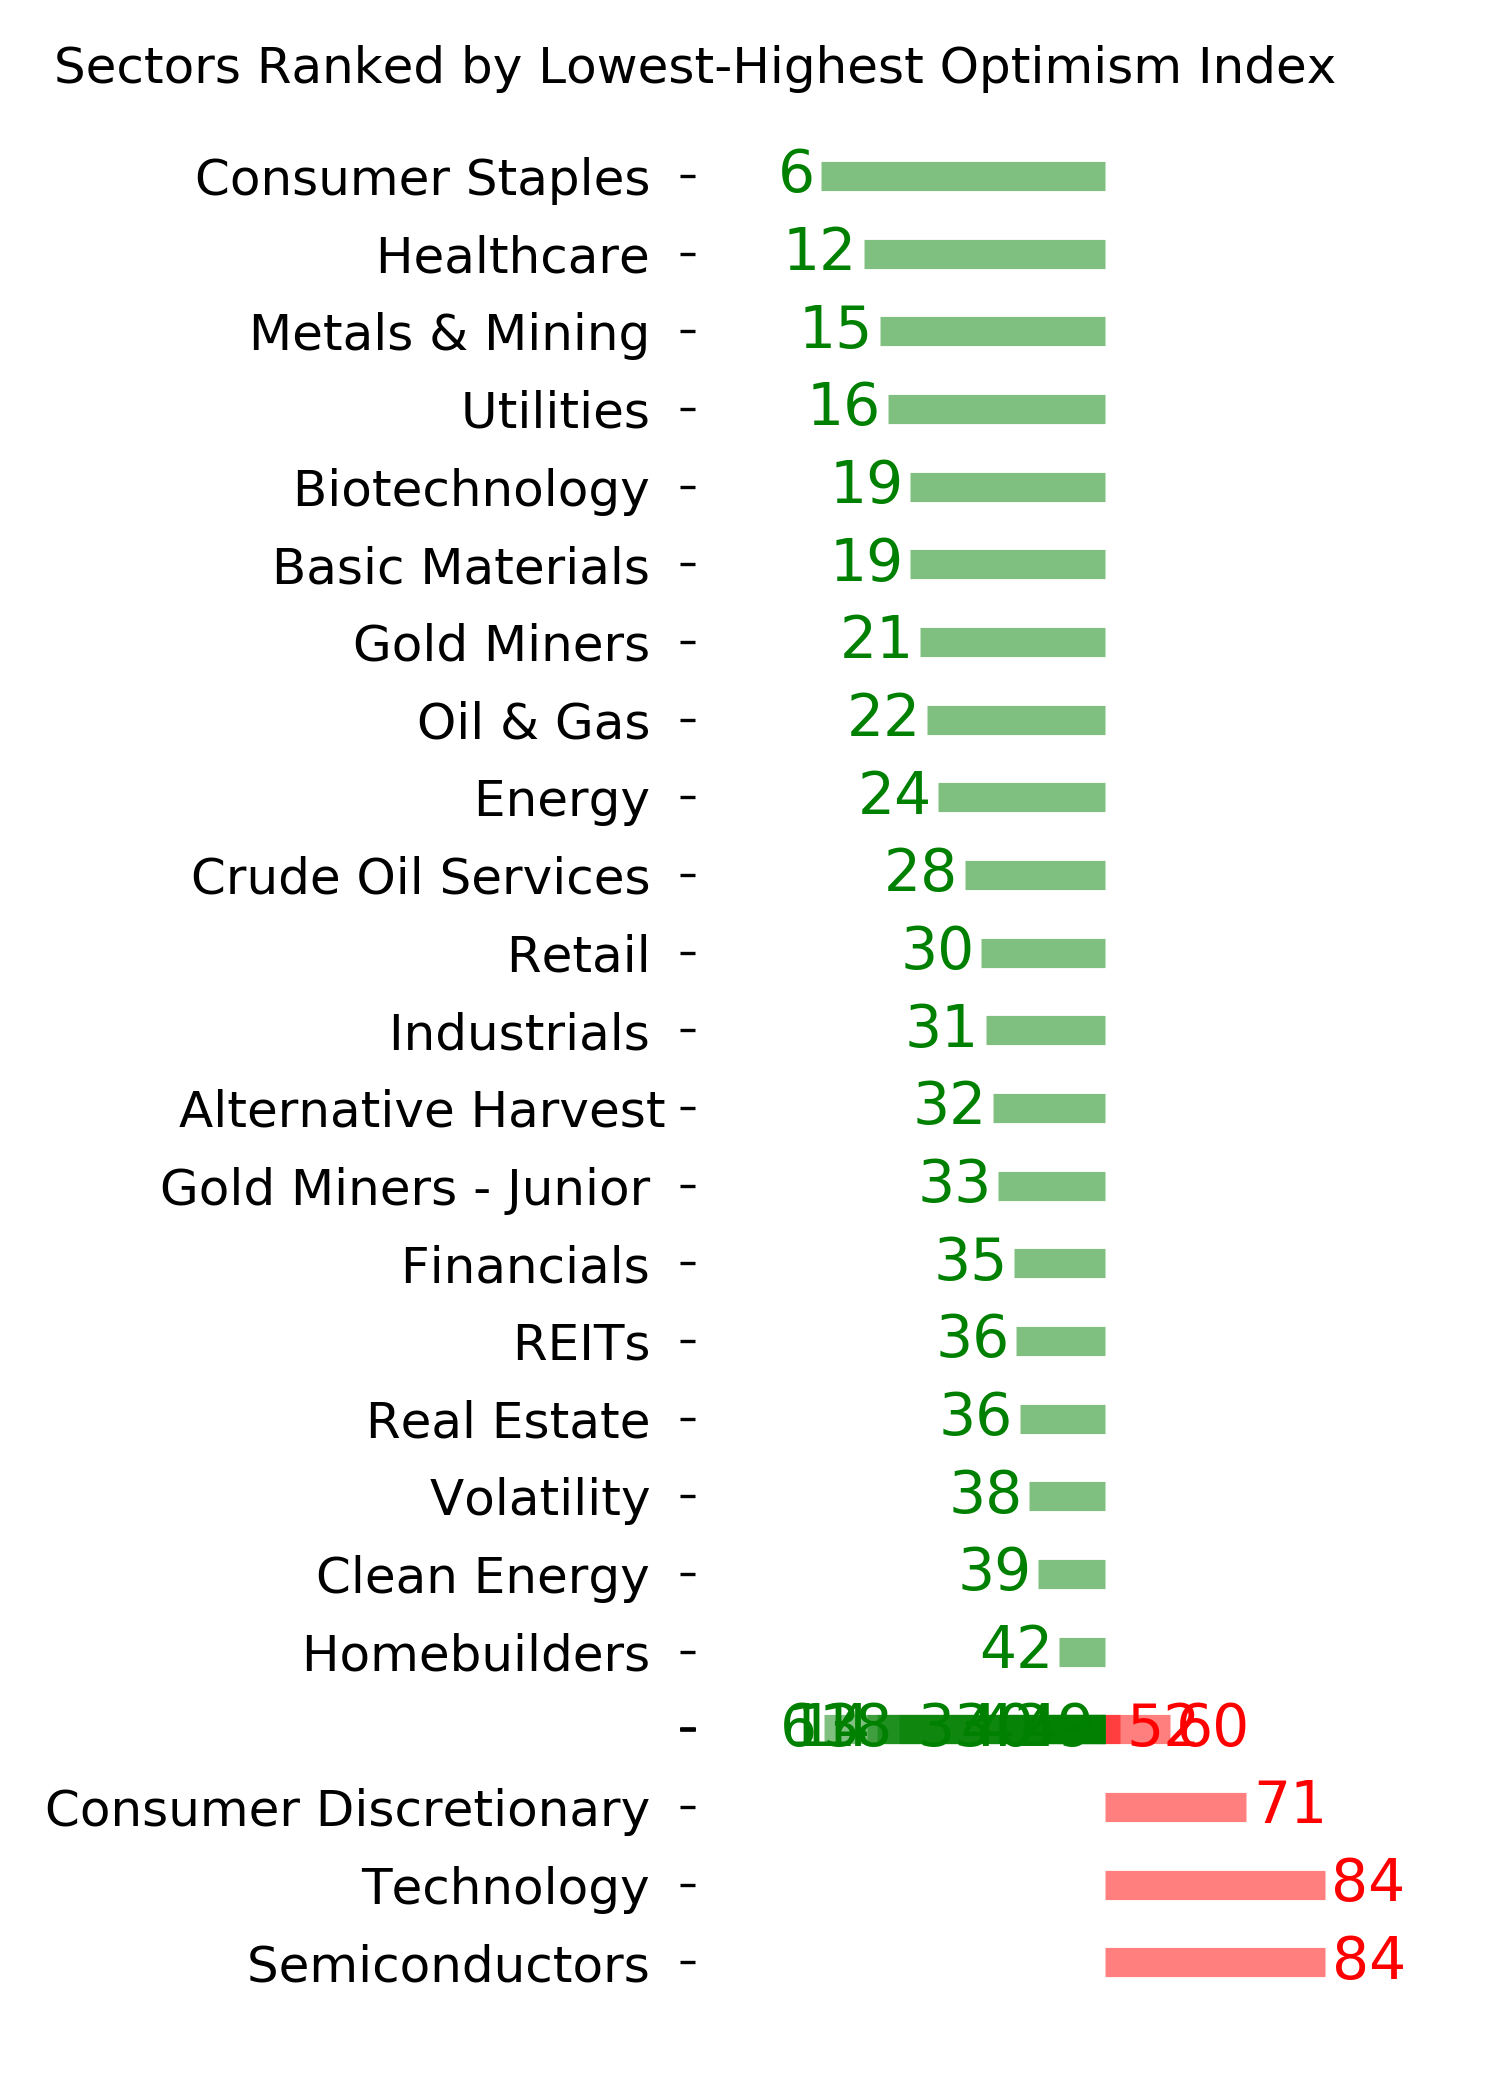
Ranks
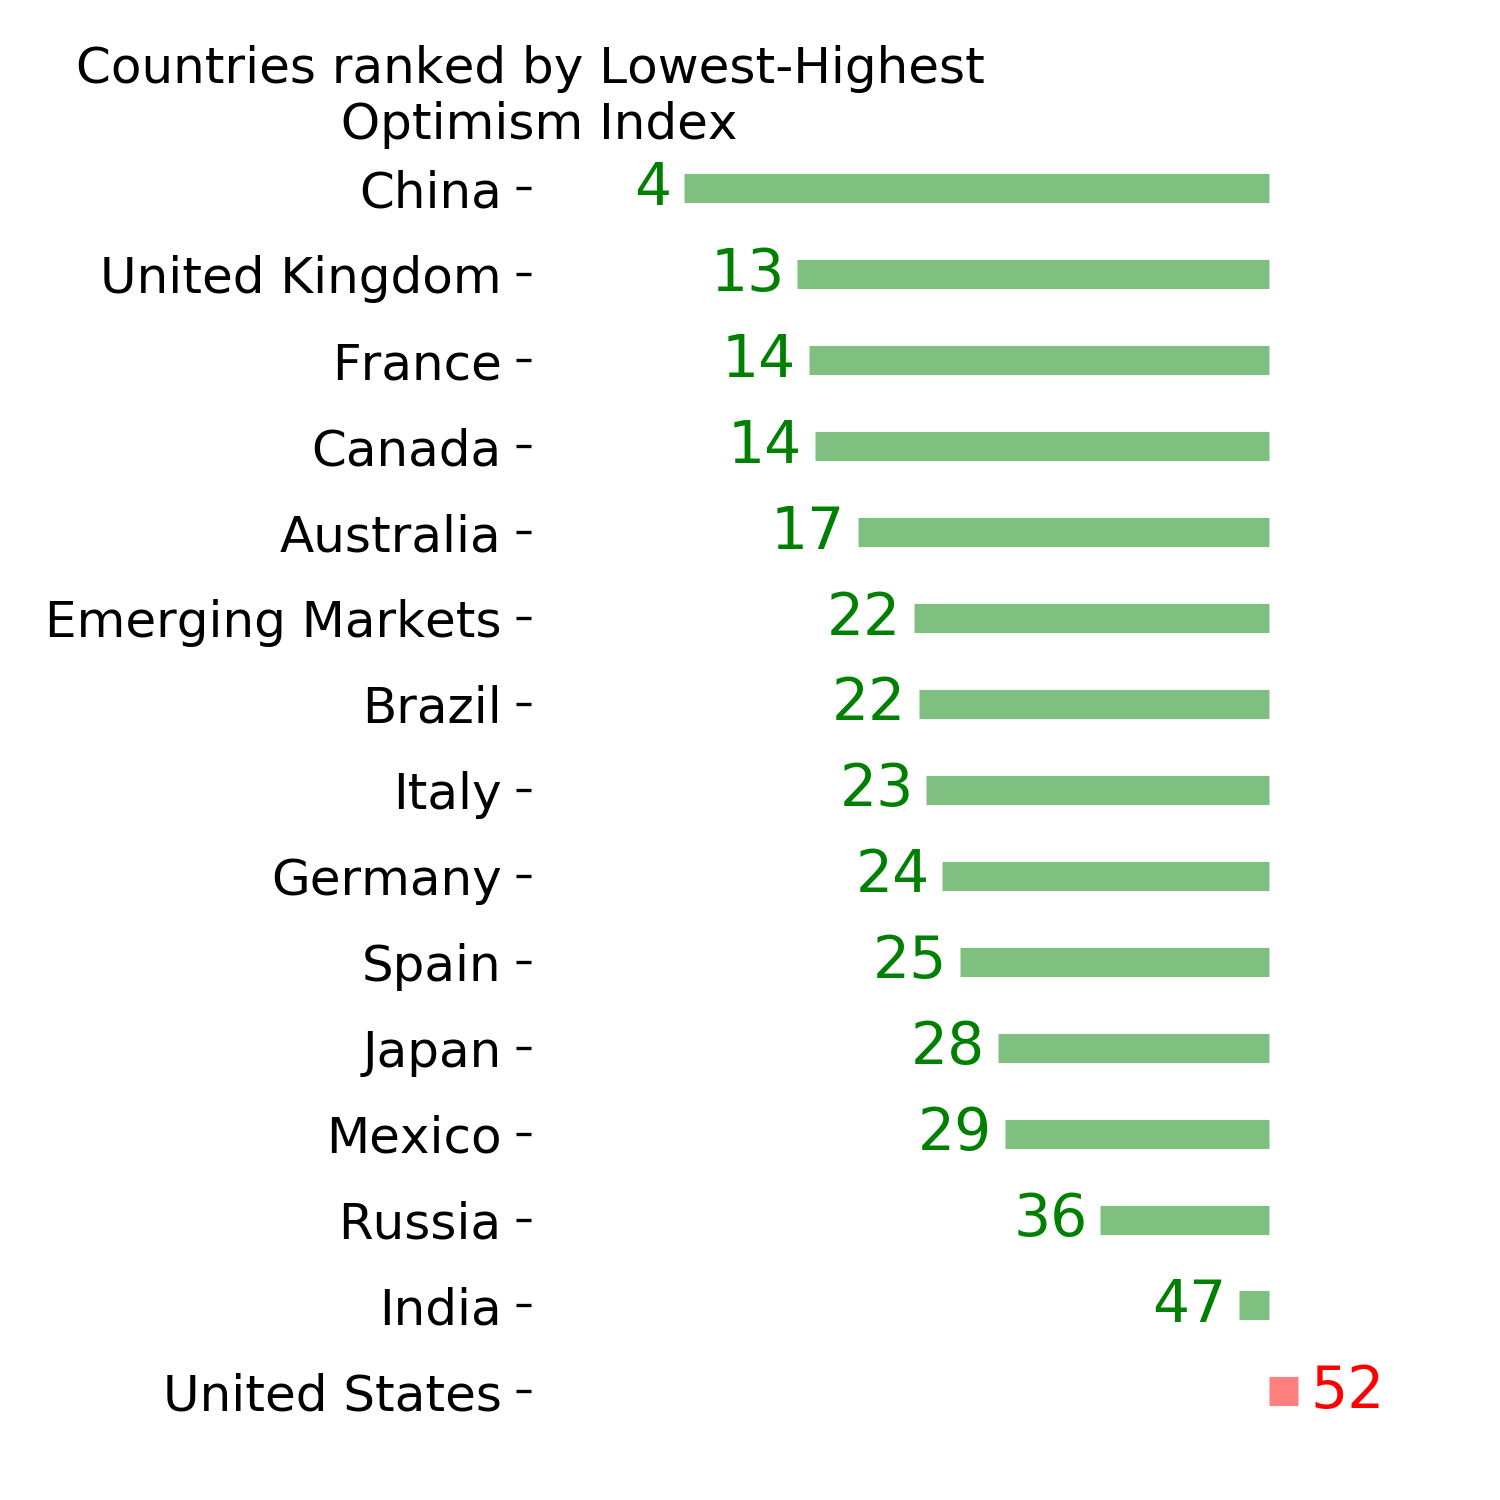
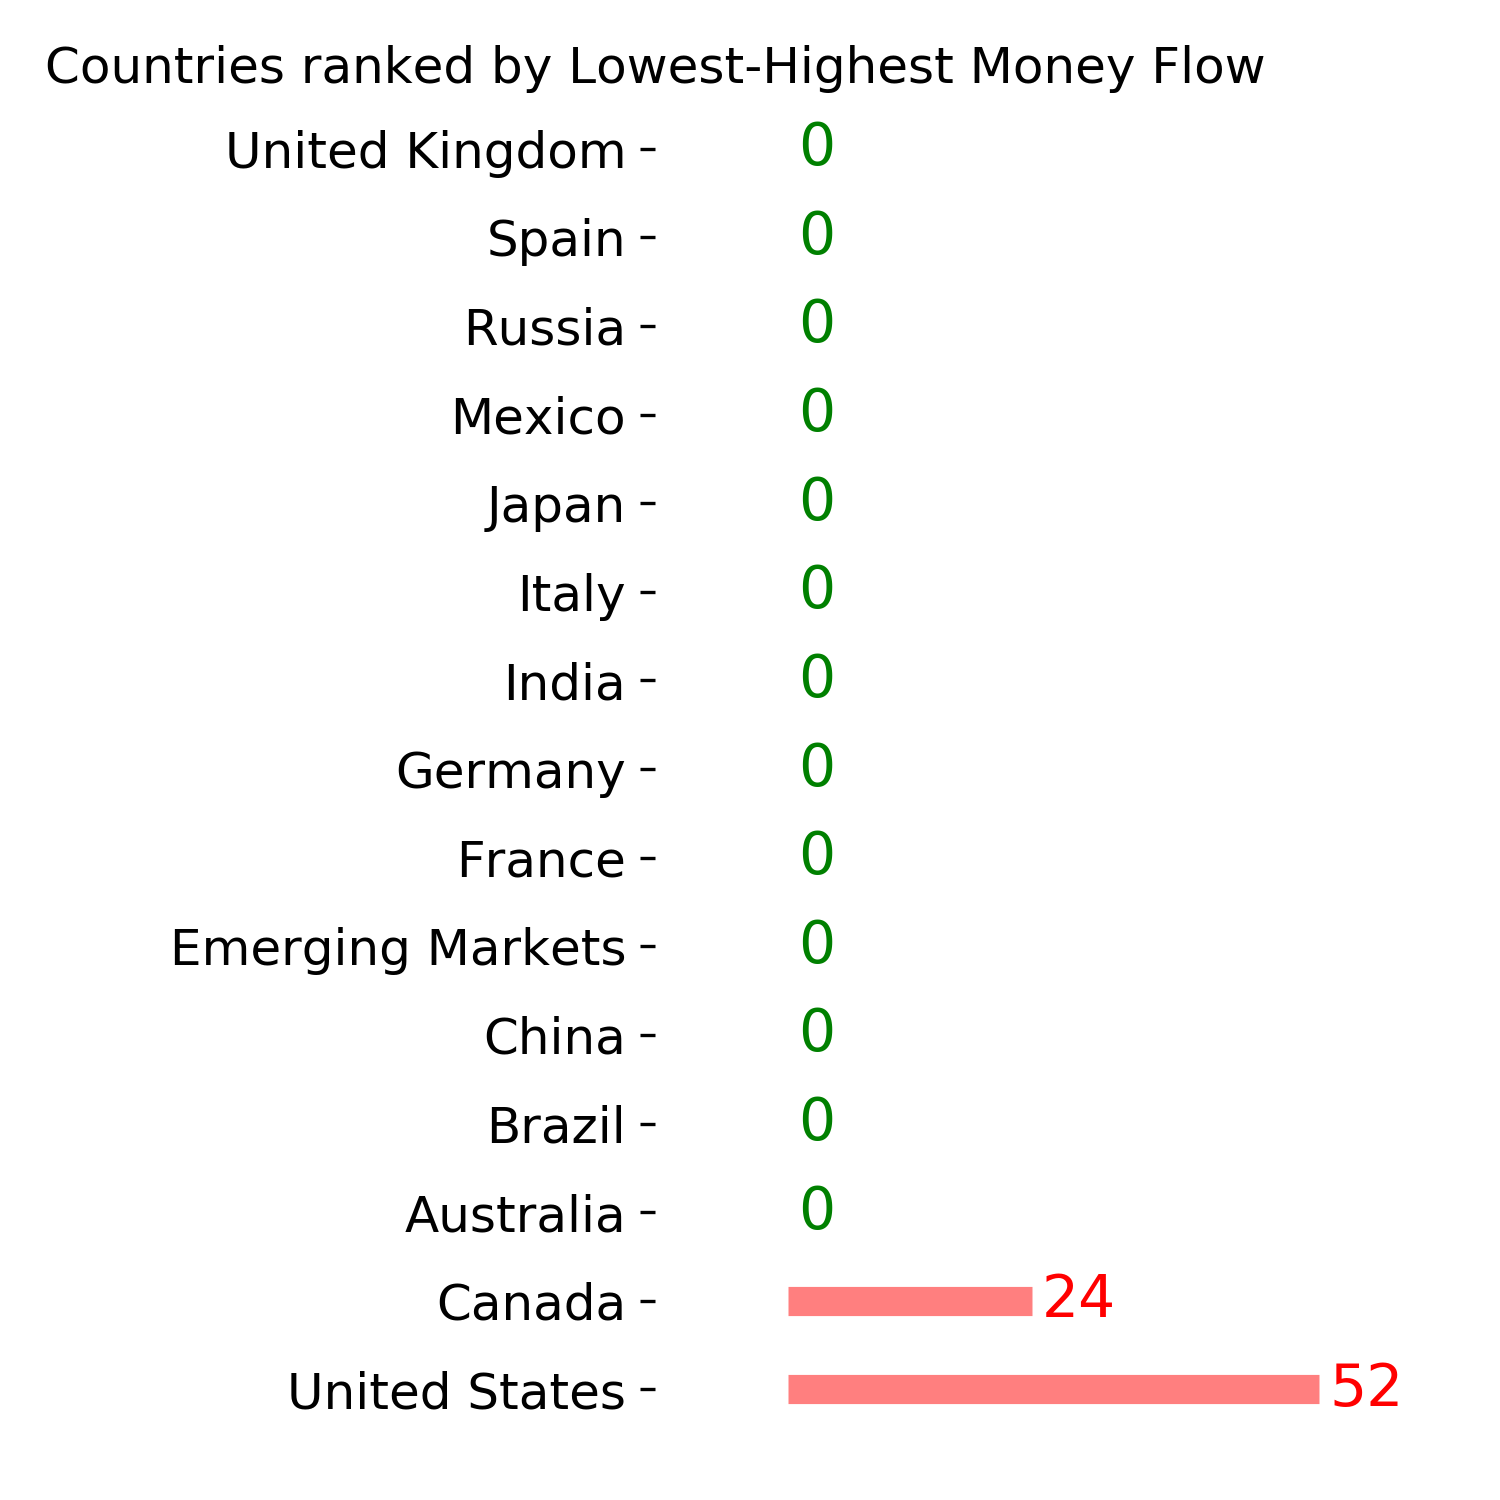
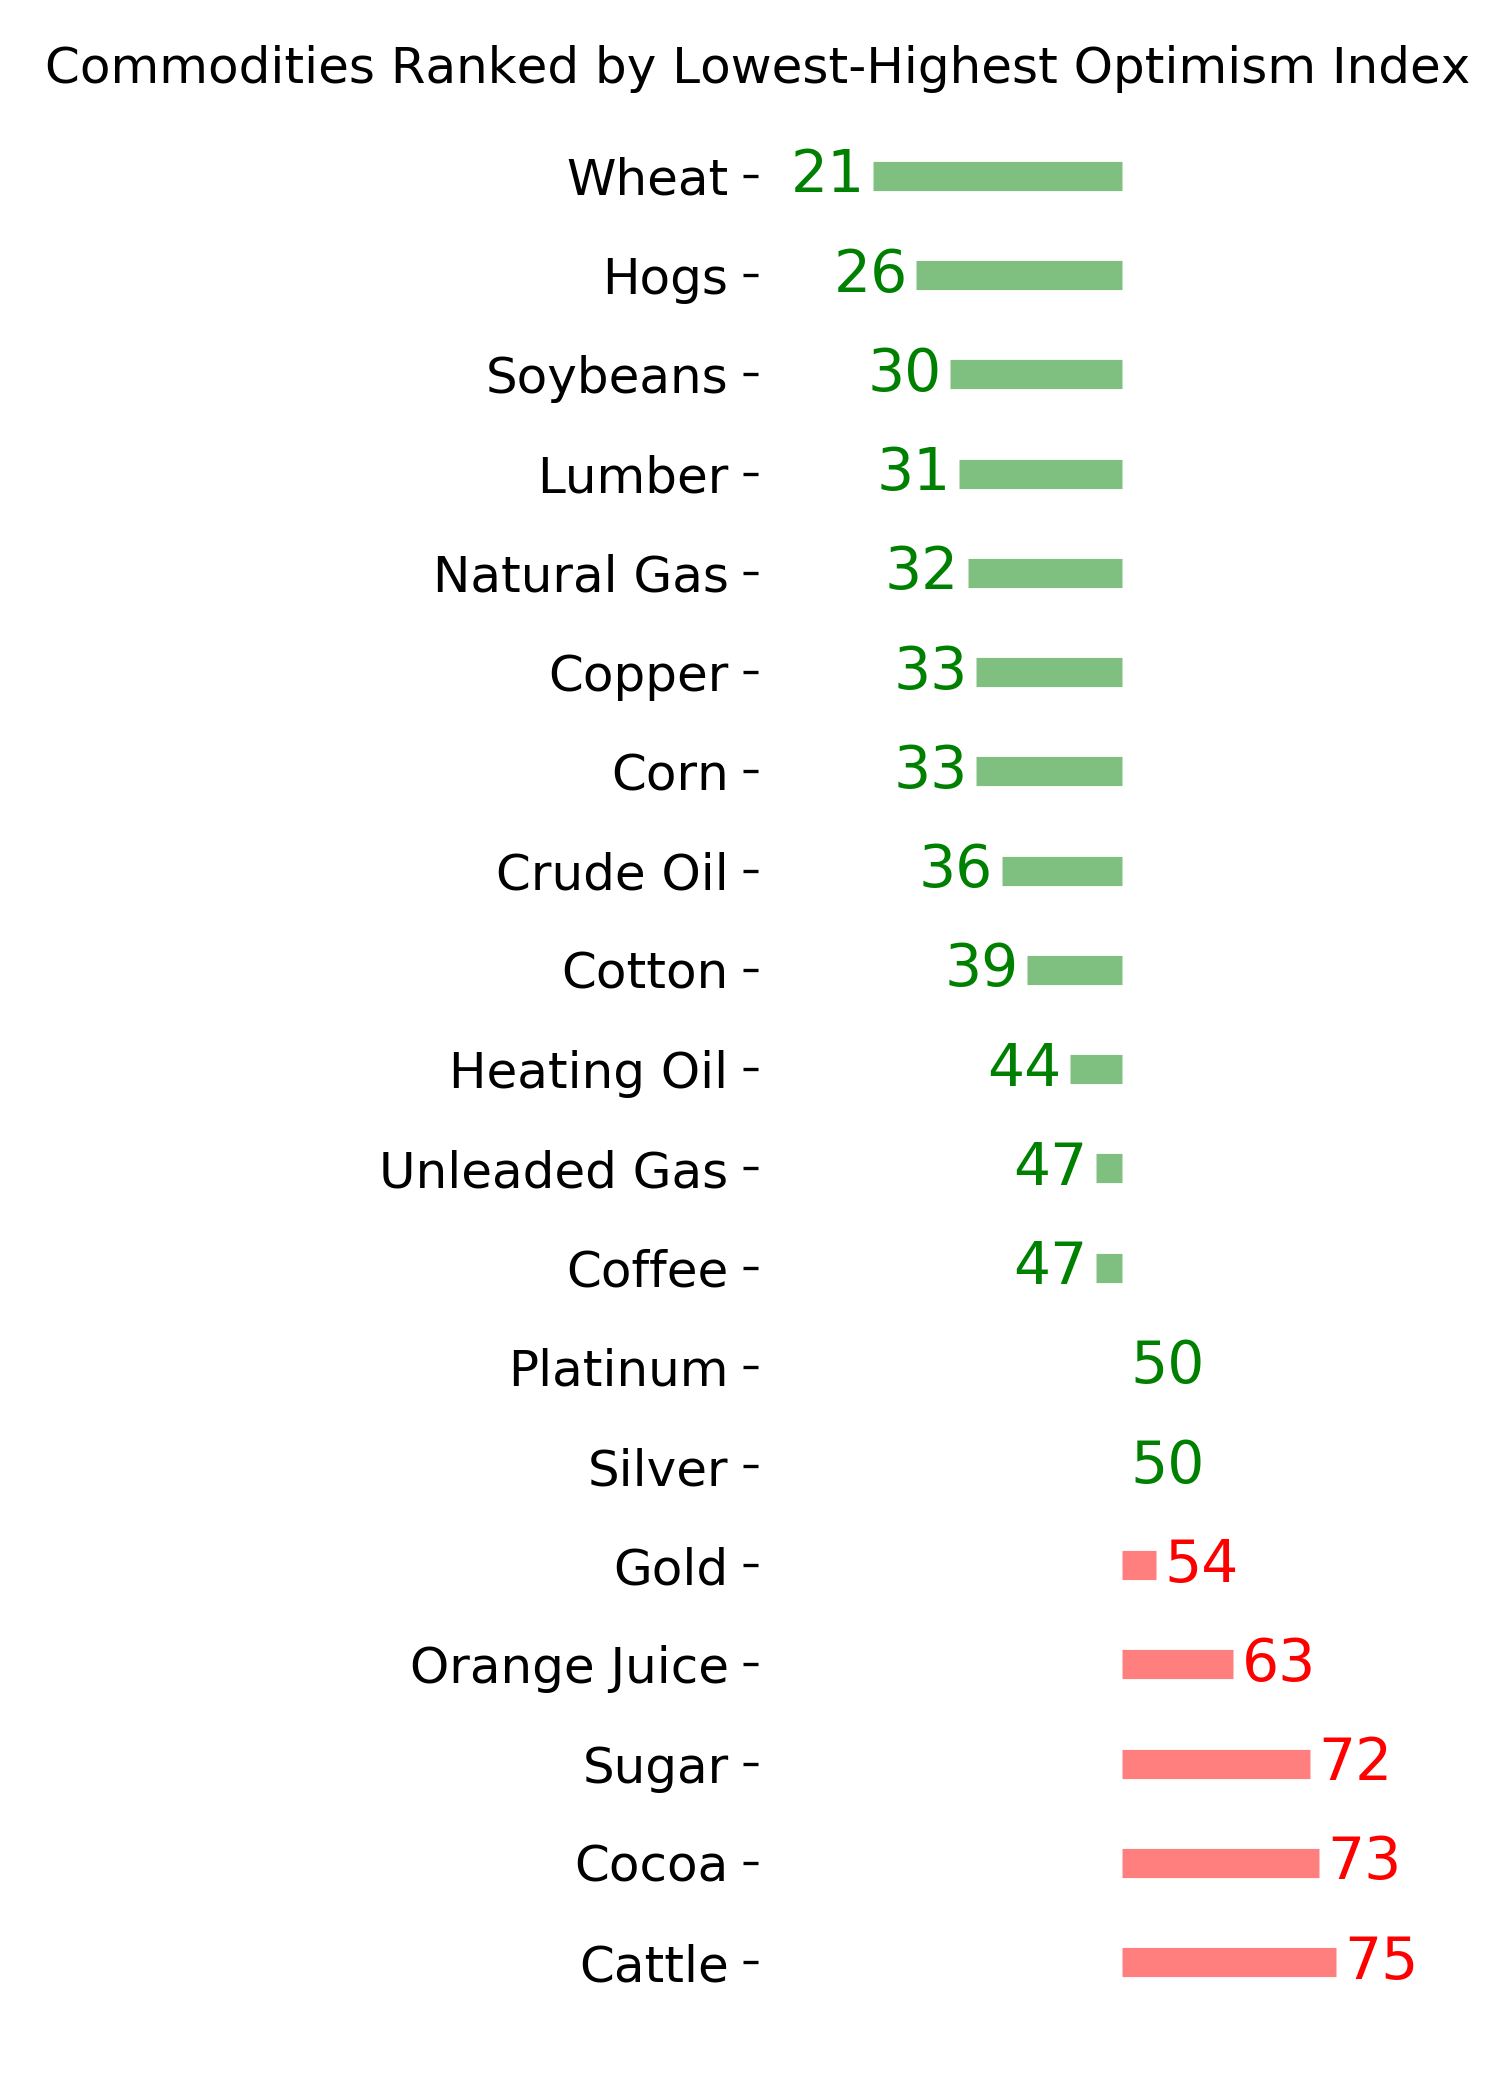
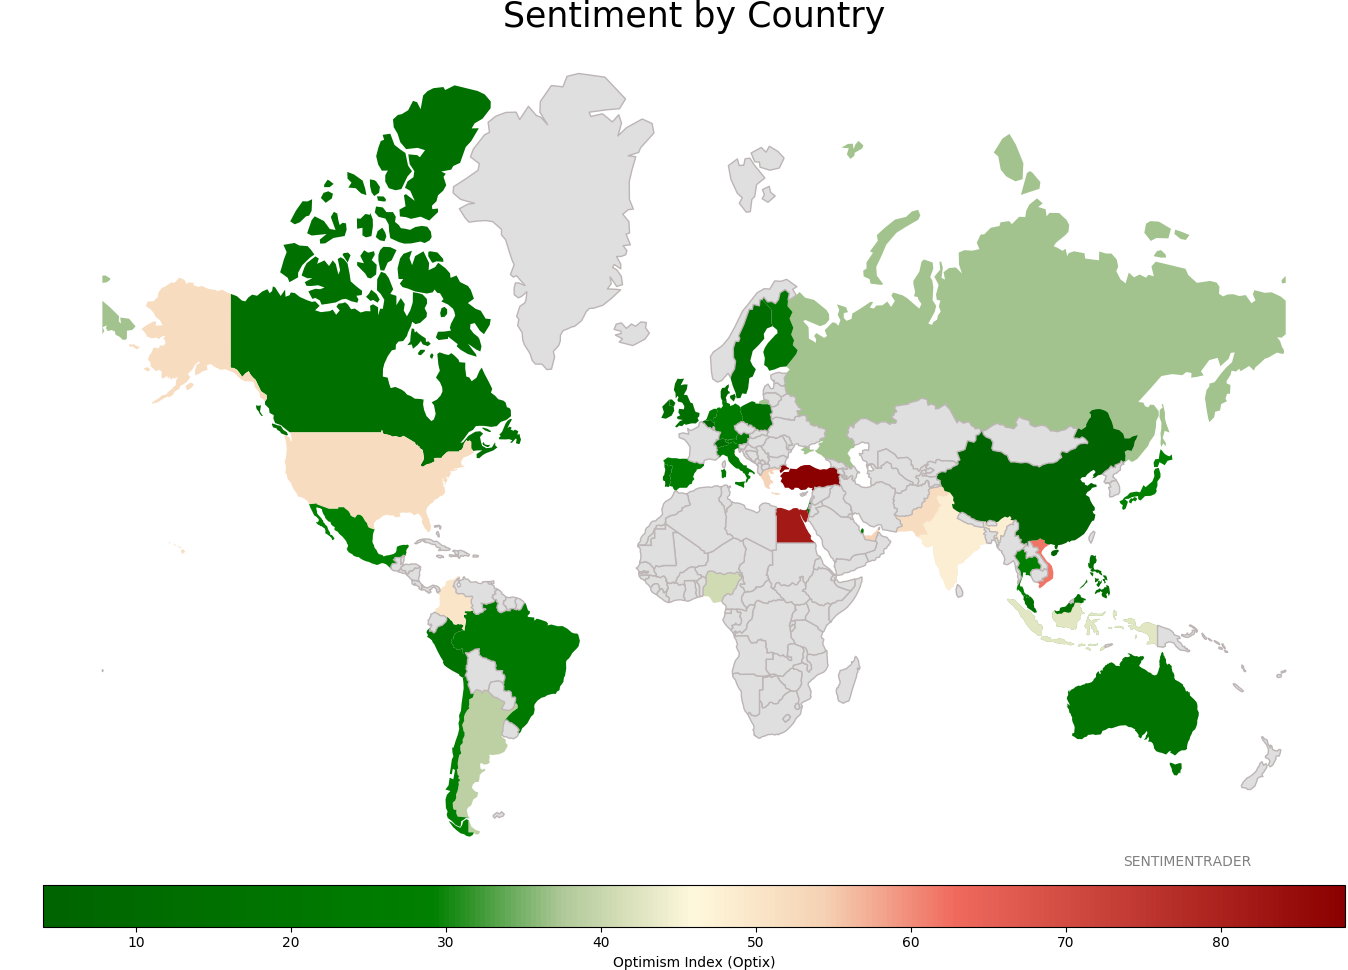
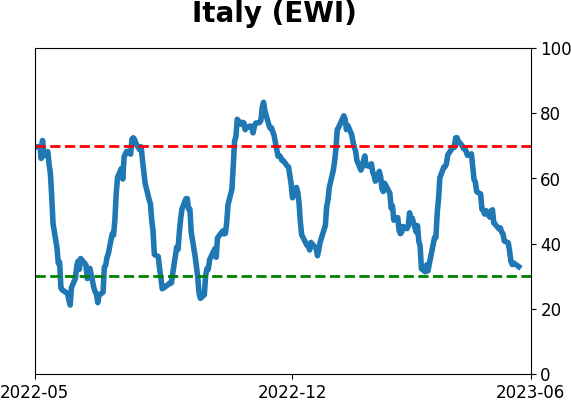
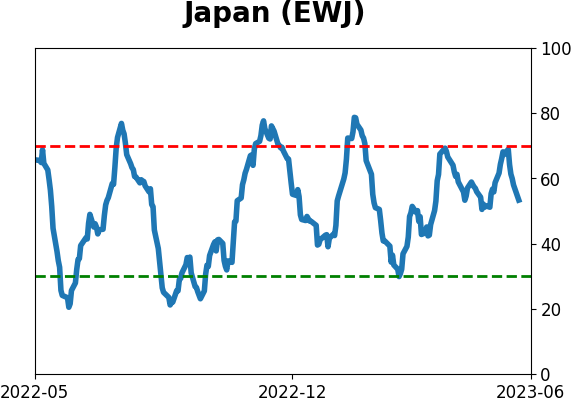
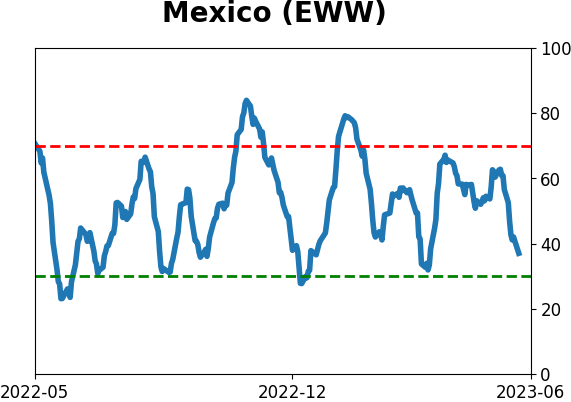
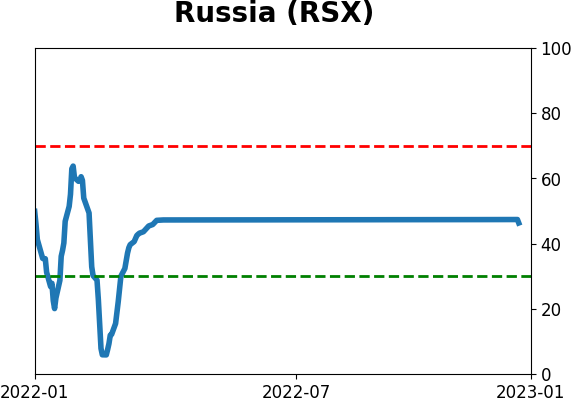
Sentiment Around The World
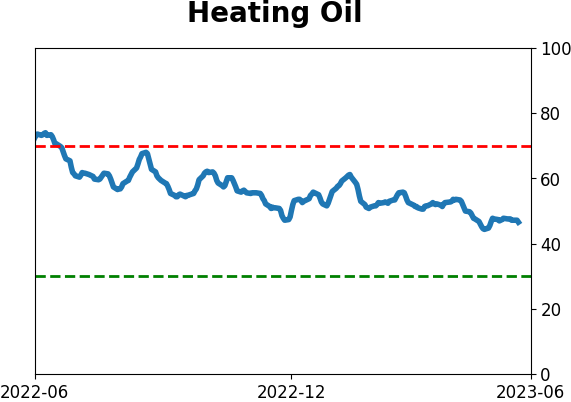
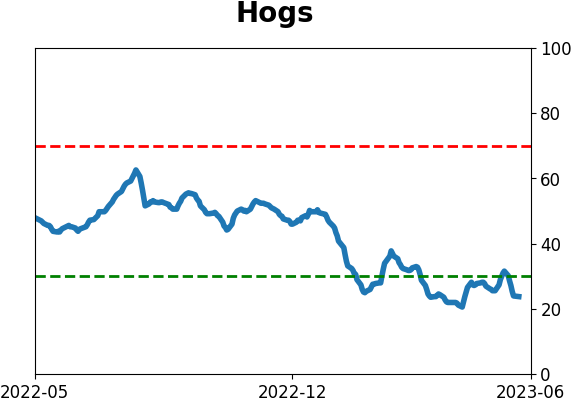
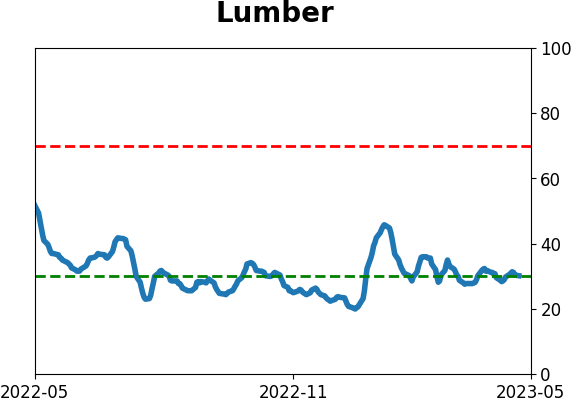
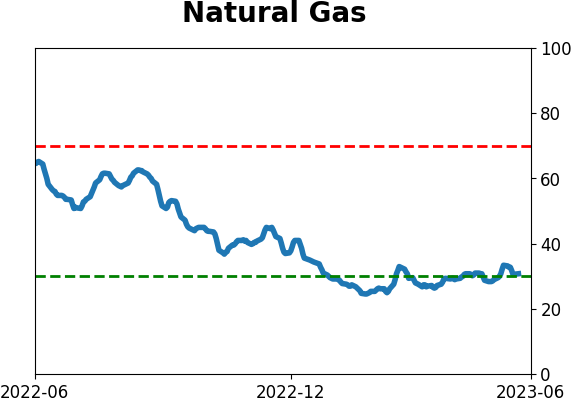
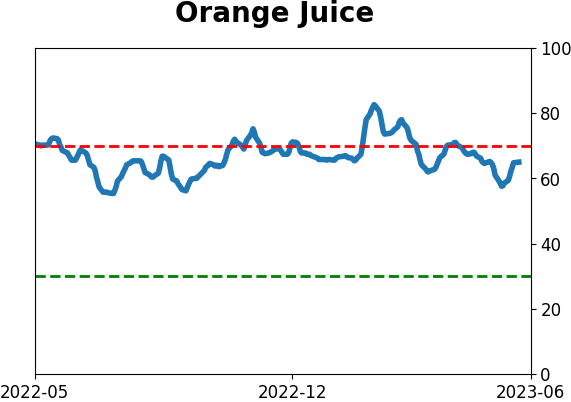
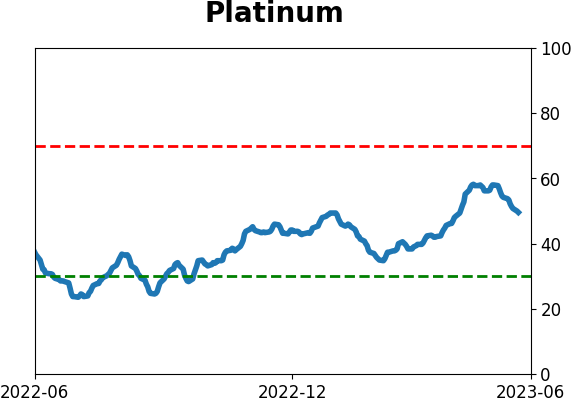
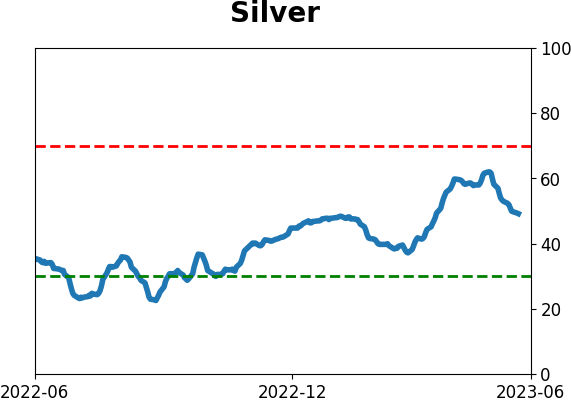
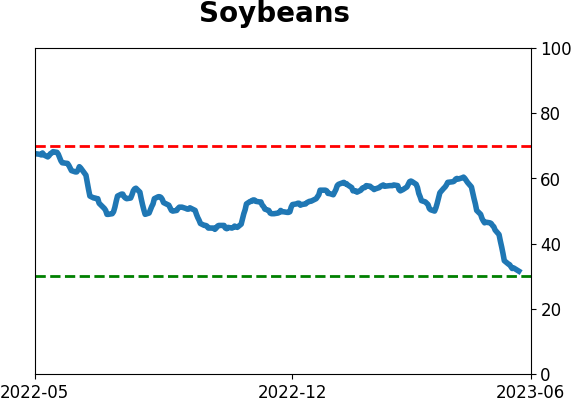
Optimism Index Thumbnails
|
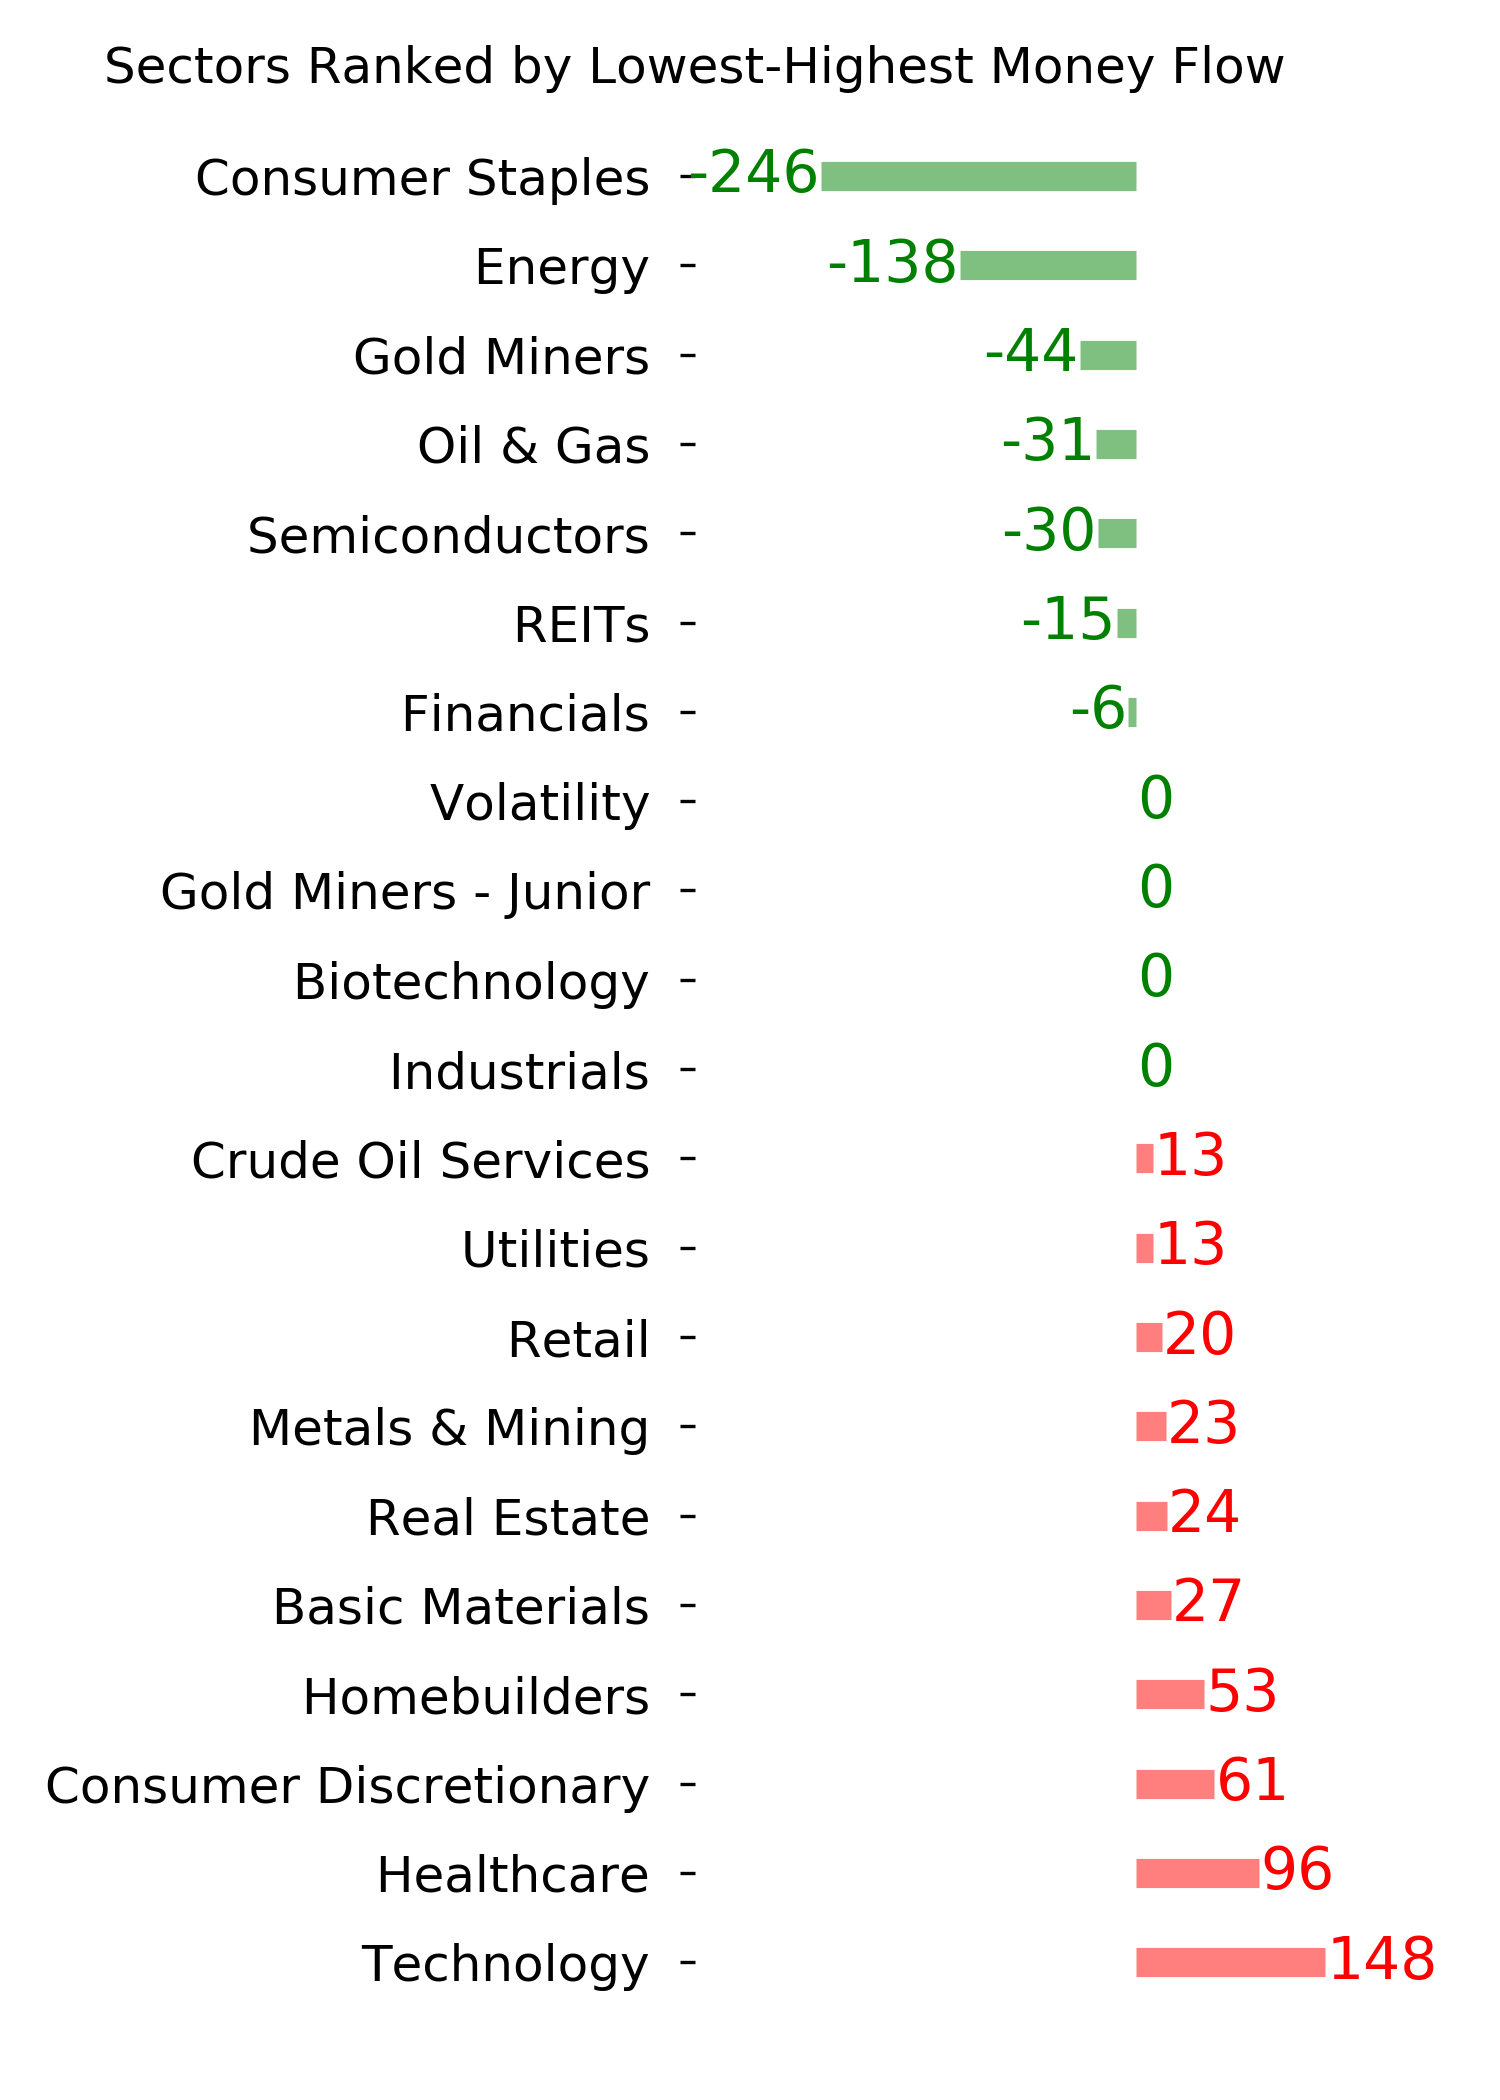
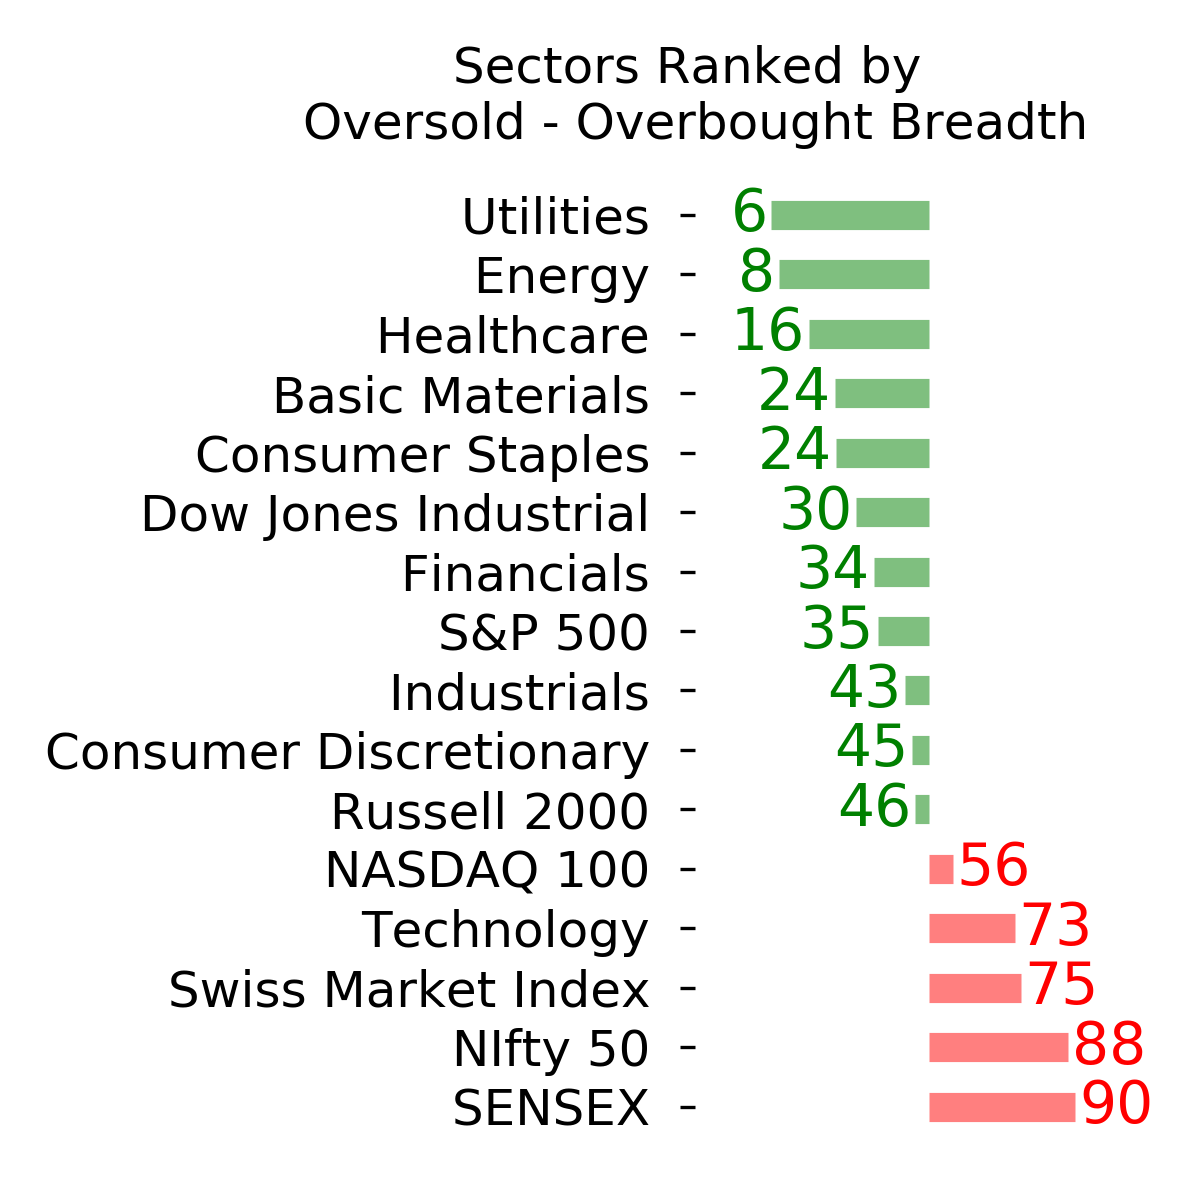
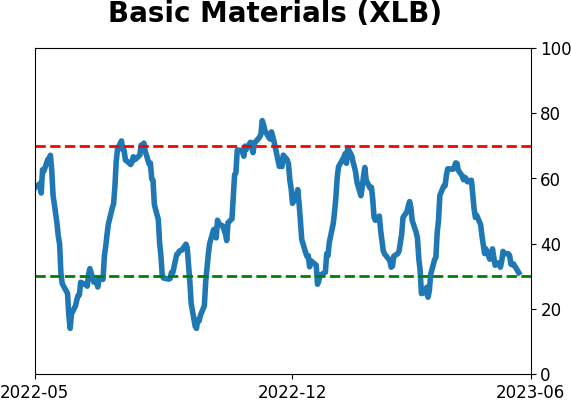
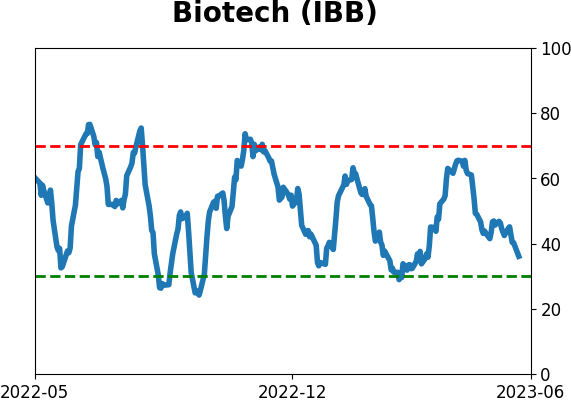
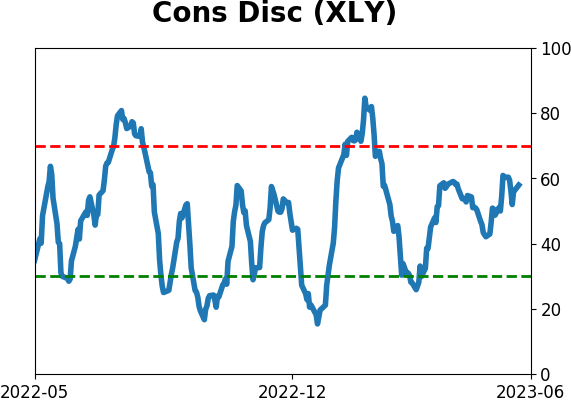
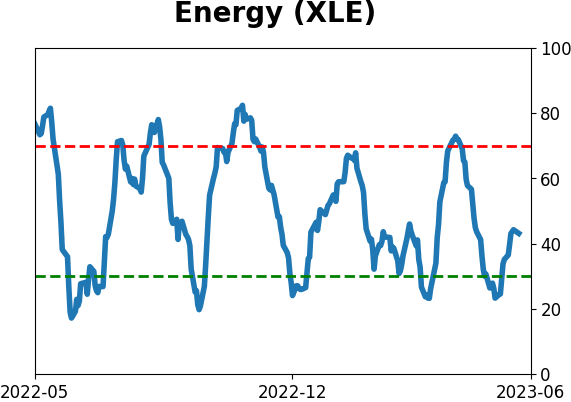
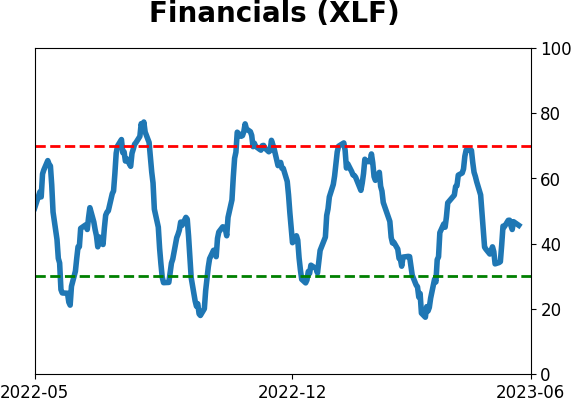
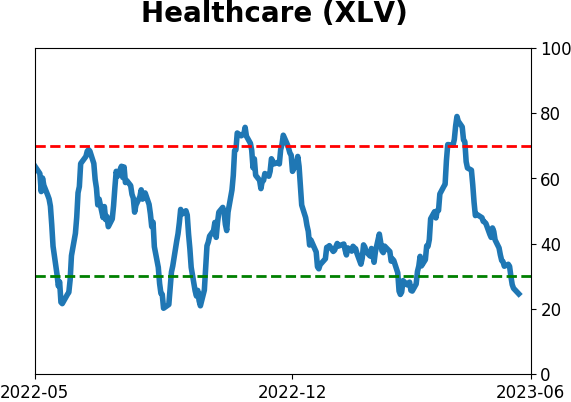
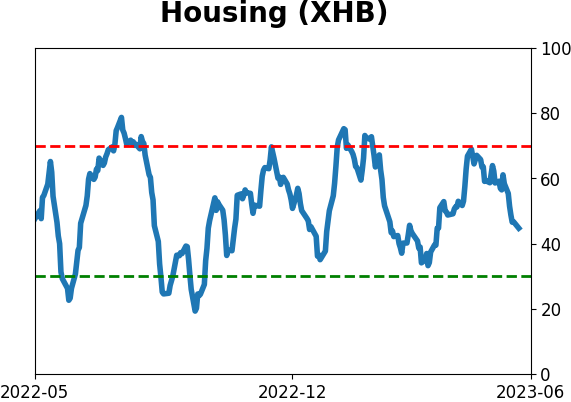
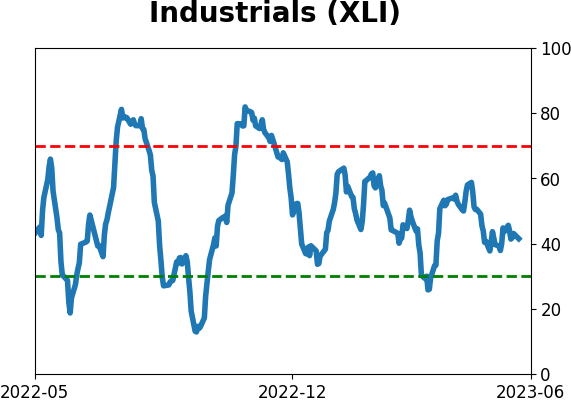
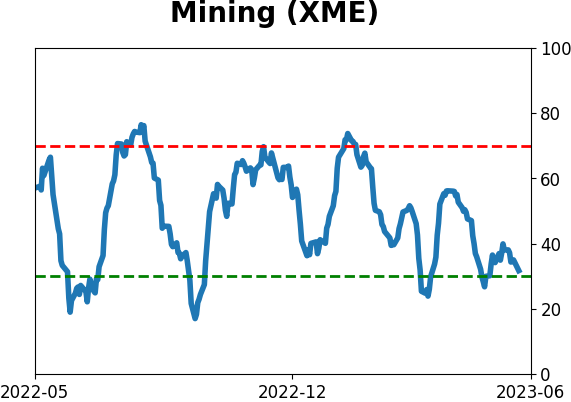
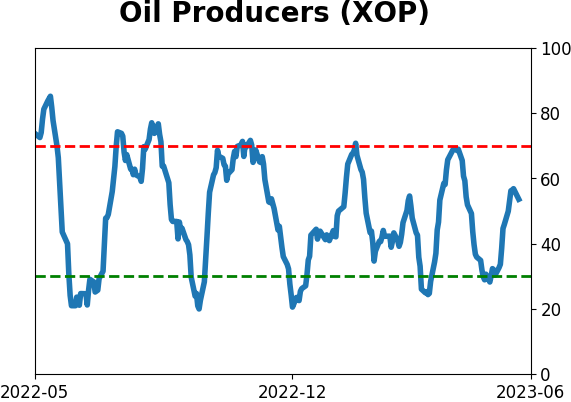
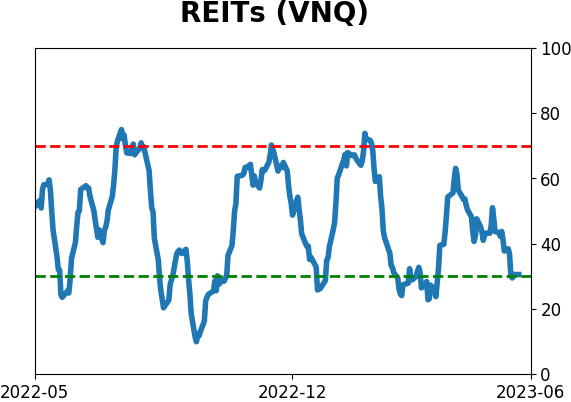
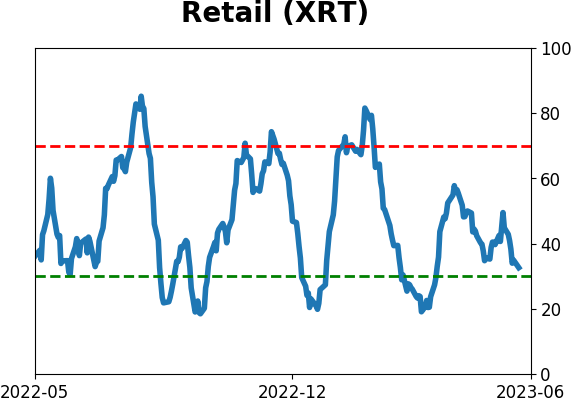
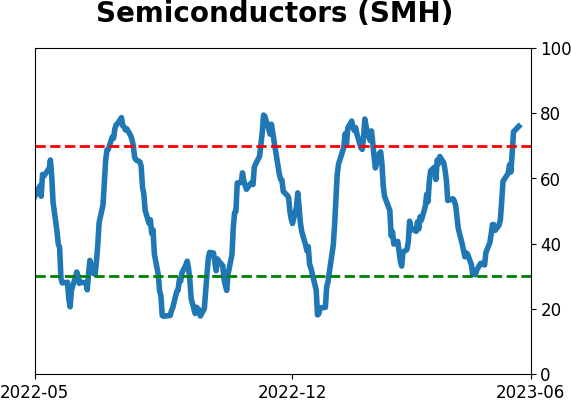
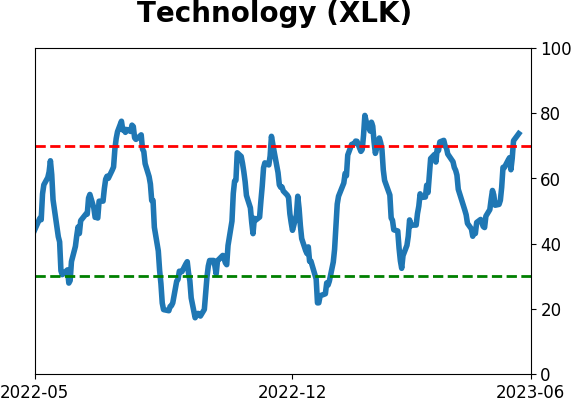
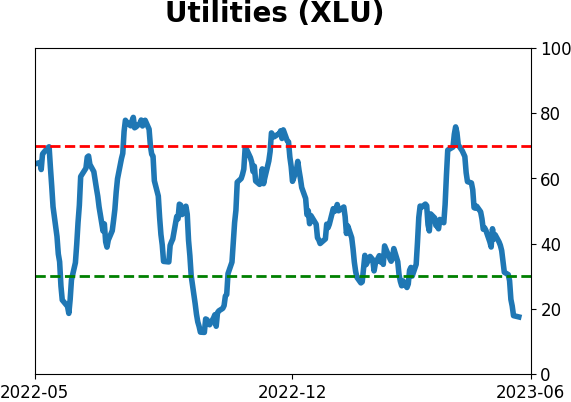
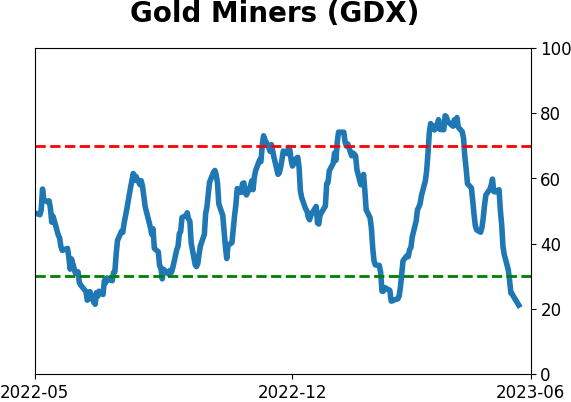
Sector ETF's - 10-Day Moving Average
|
|
|
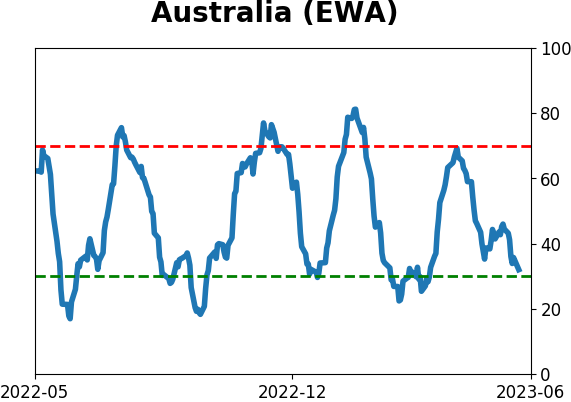
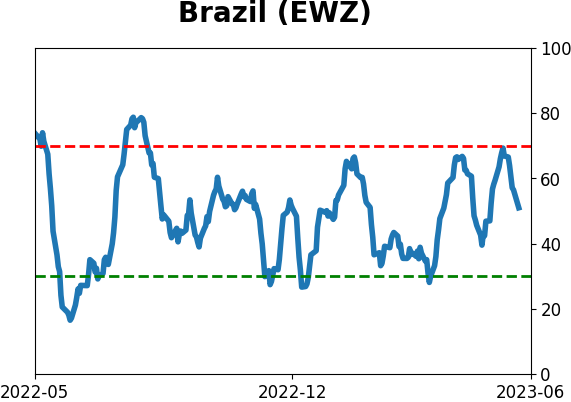
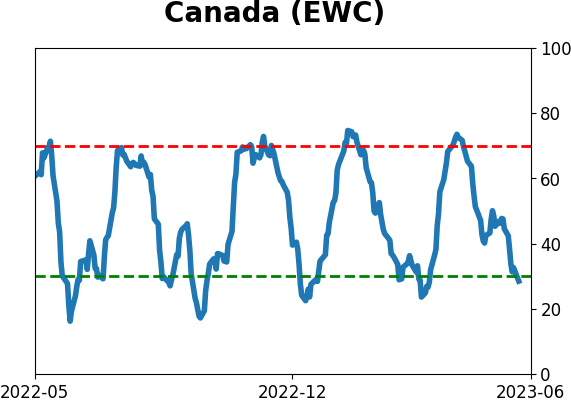
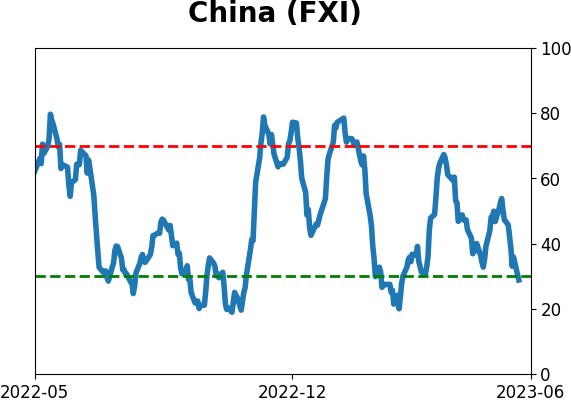
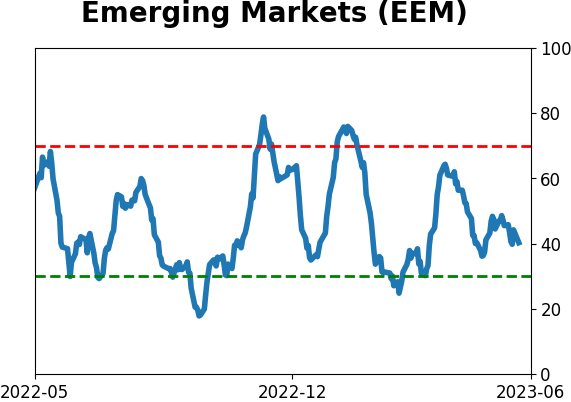
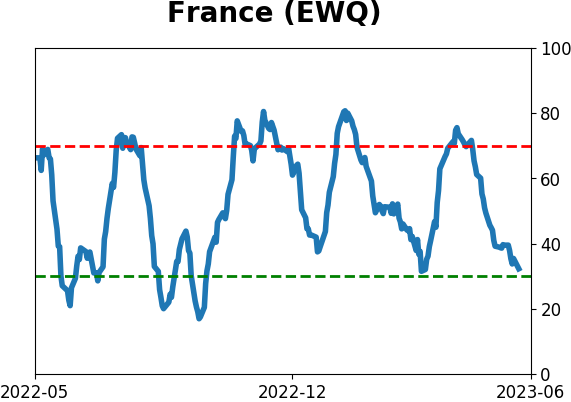
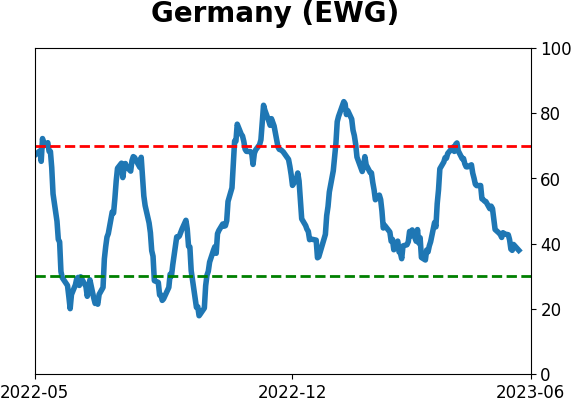
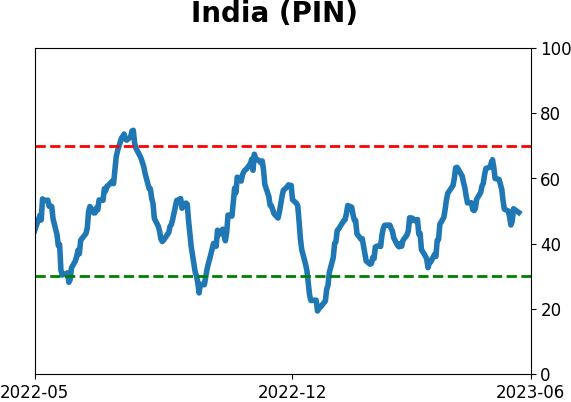
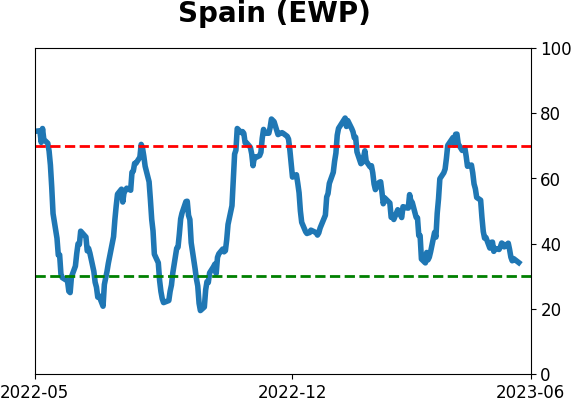
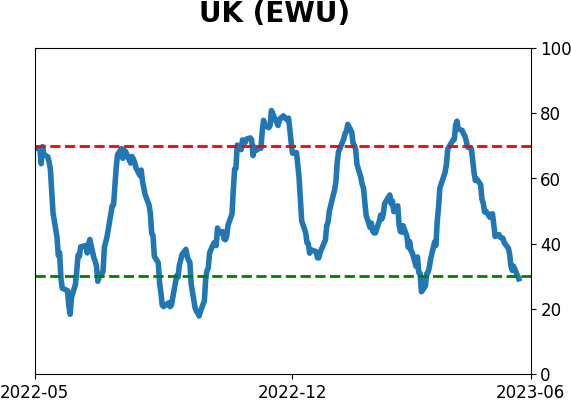
Country ETF's - 10-Day Moving Average
|
|
|
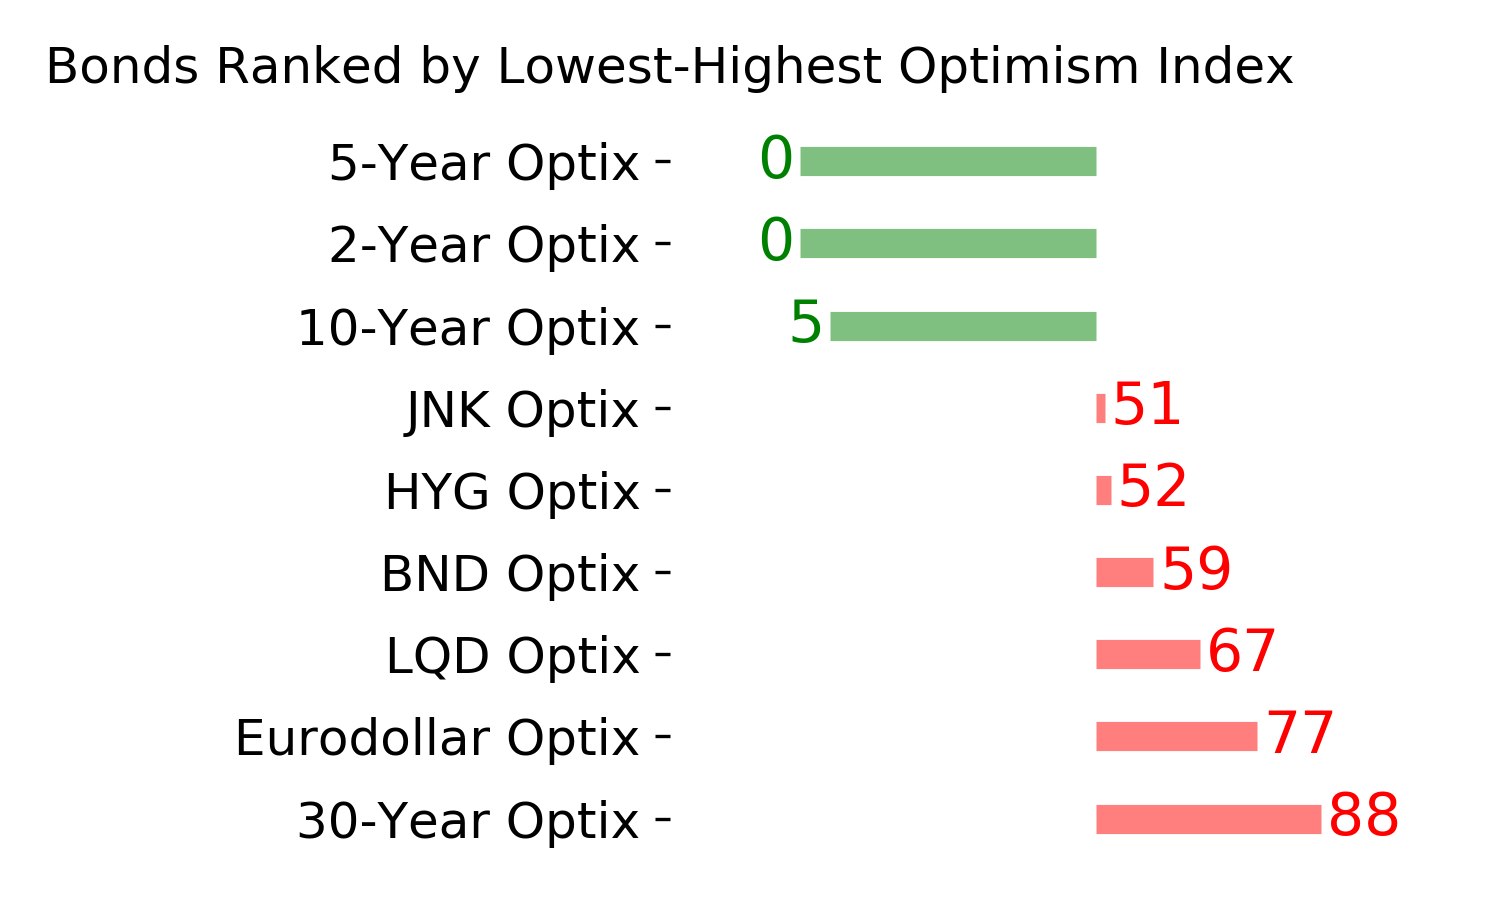
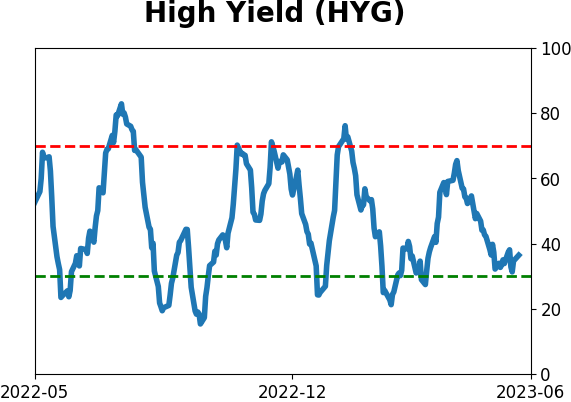
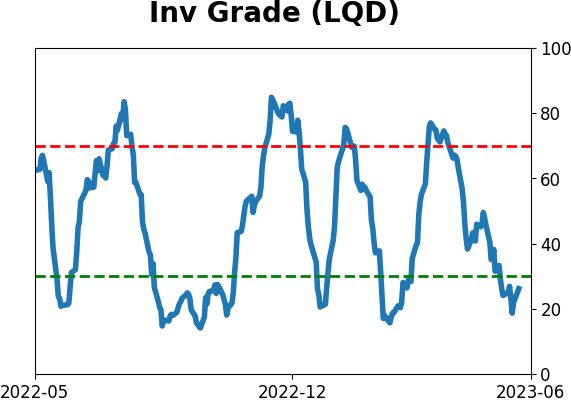
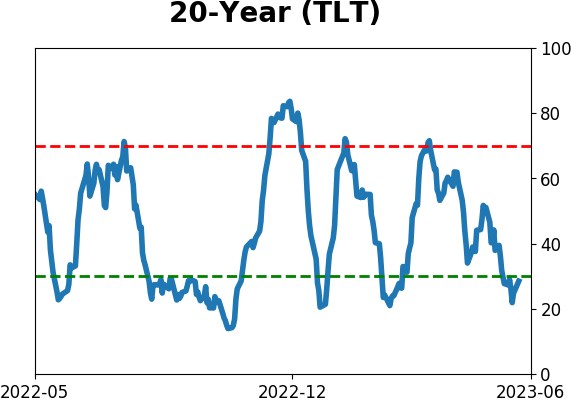
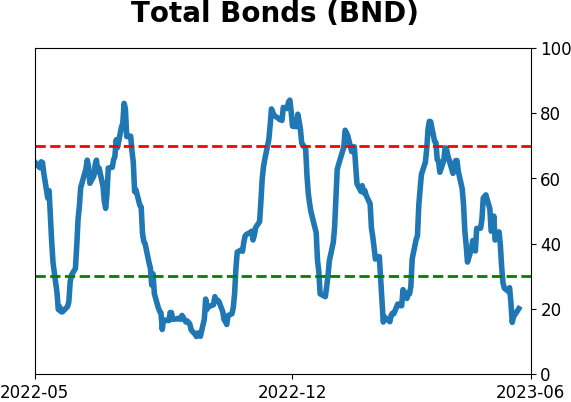
Bond ETF's - 10-Day Moving Average
|
|
|
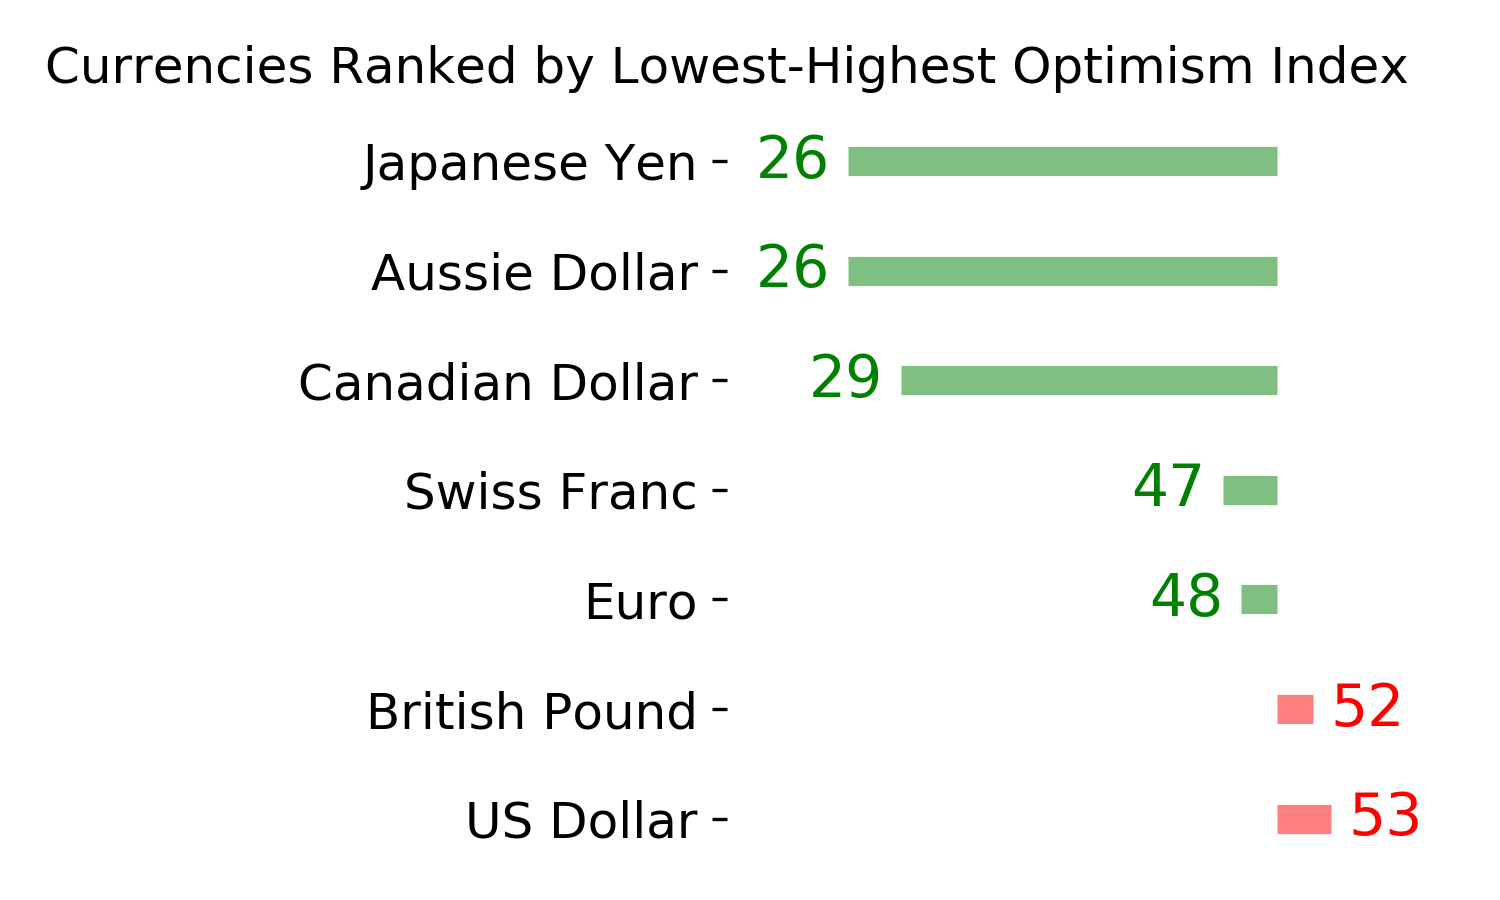
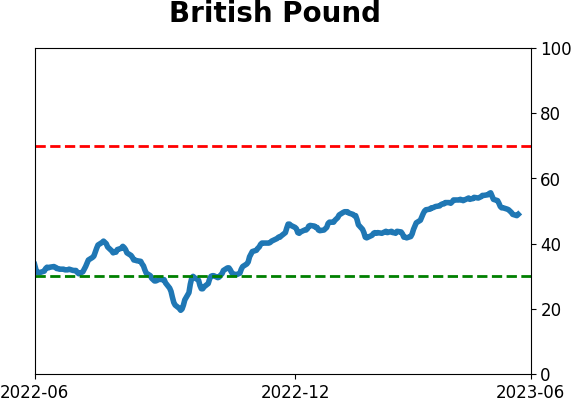
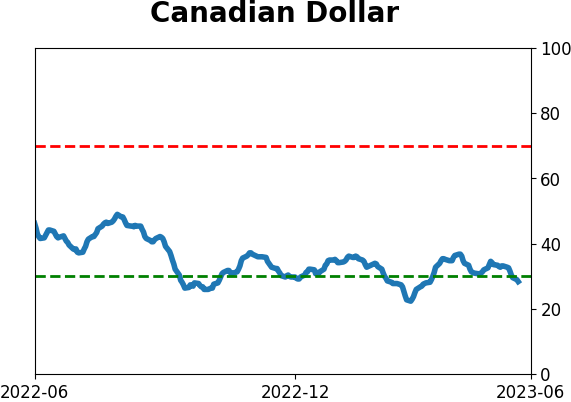
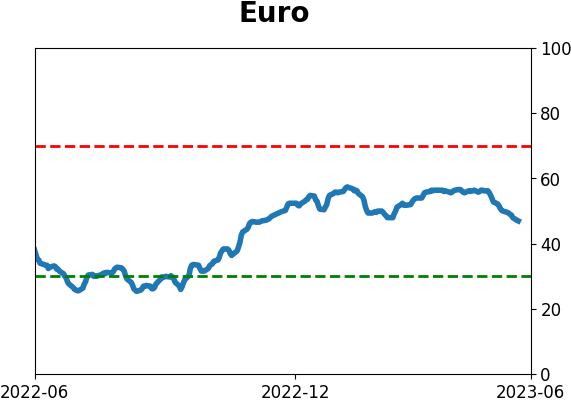
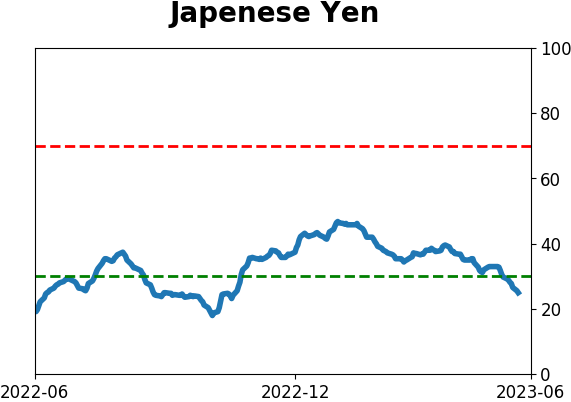
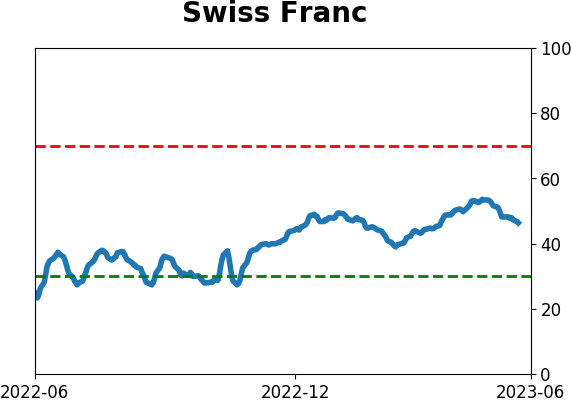
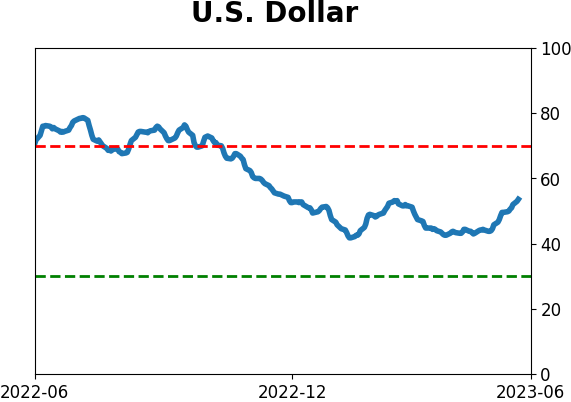
Currency ETF's - 5-Day Moving Average
|
|
|
Commodity ETF's - 5-Day Moving Average
|
|