Headlines
|
|
Technical warnings pile up on the Nasdaq:
While a handful of stocks have been getting most of the attention, there has been some deterioration under the surface on the Nasdaq exchange. More stocks have been seeing weakness, and signs of a split market are rising. The number of technical warning signs over the past year has spiked to an alarming degree.
|
Smart / Dumb Money Confidence
|
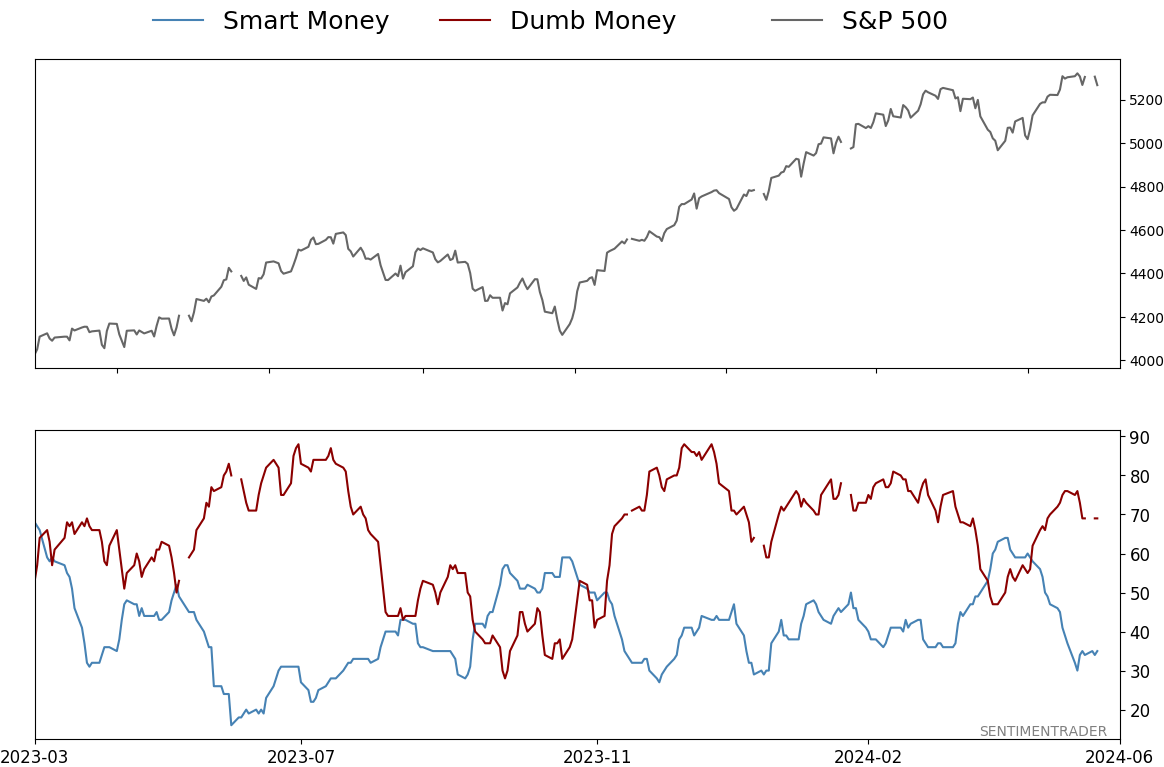
Smart Money Confidence: 35%
Dumb Money Confidence: 69%
|
|
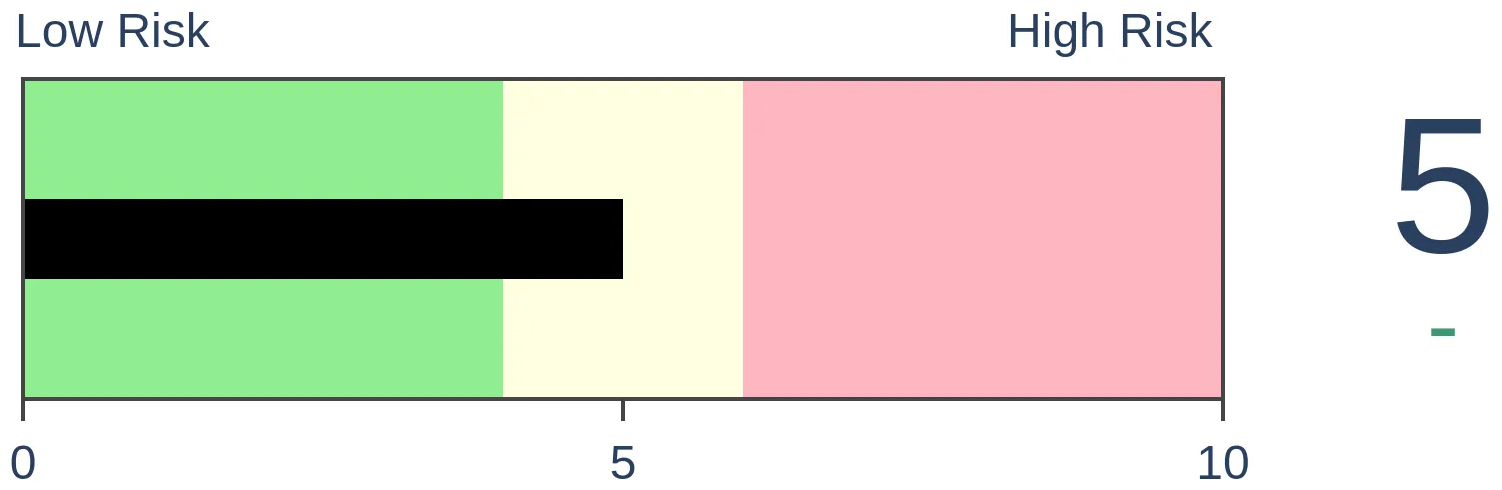
Risk Levels
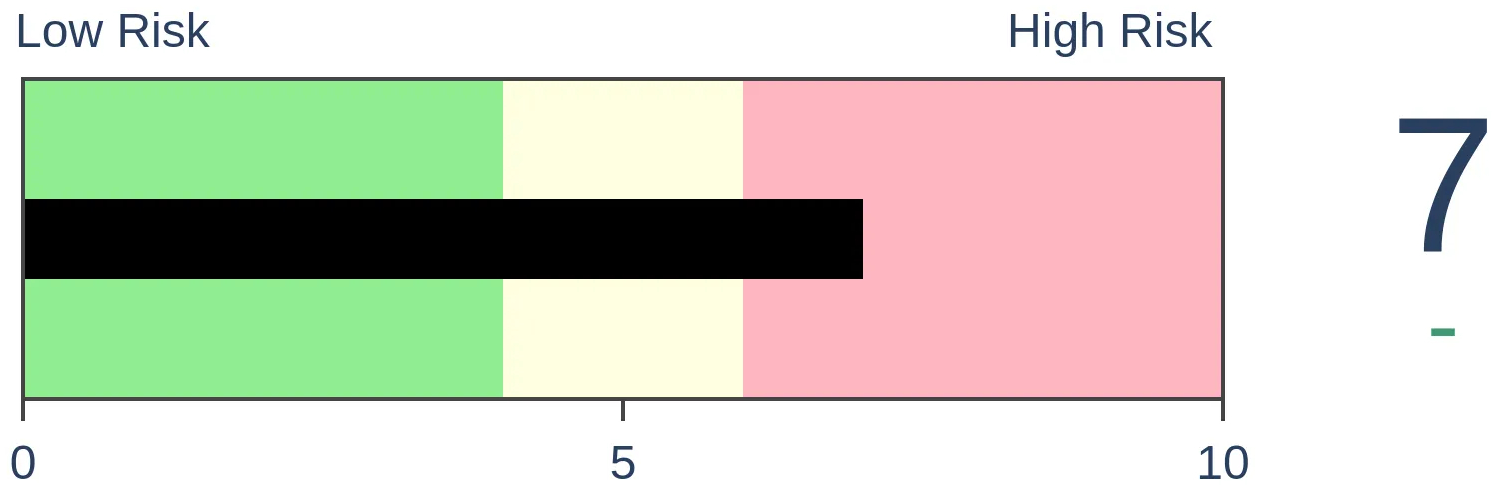
Stocks Short-Term
|
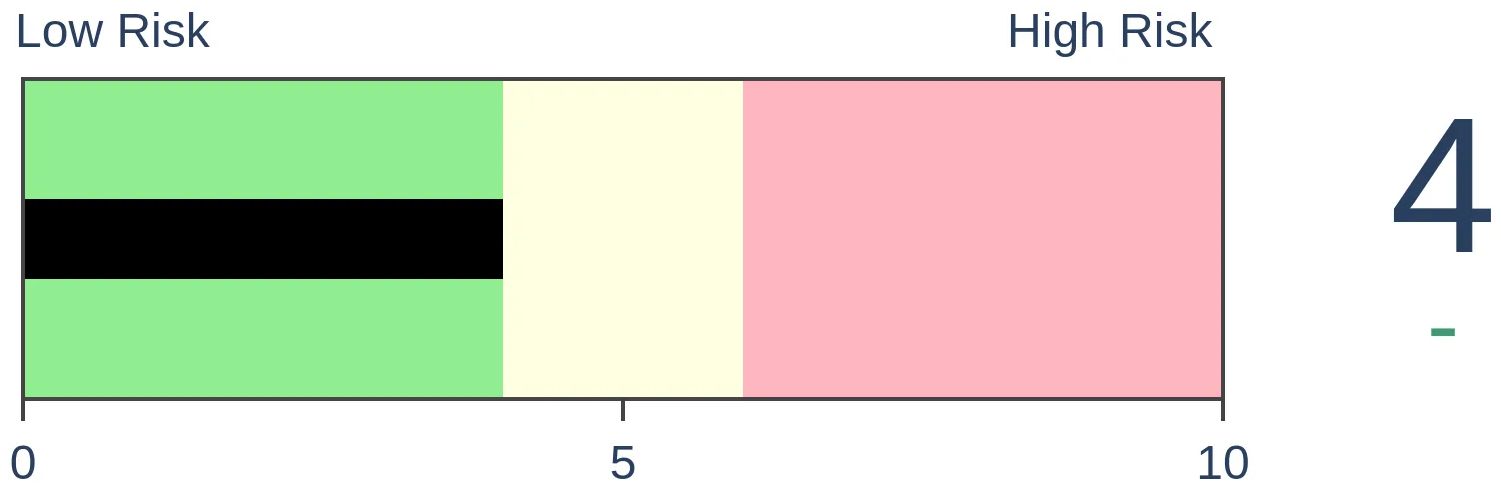
Stocks Medium-Term
|
|
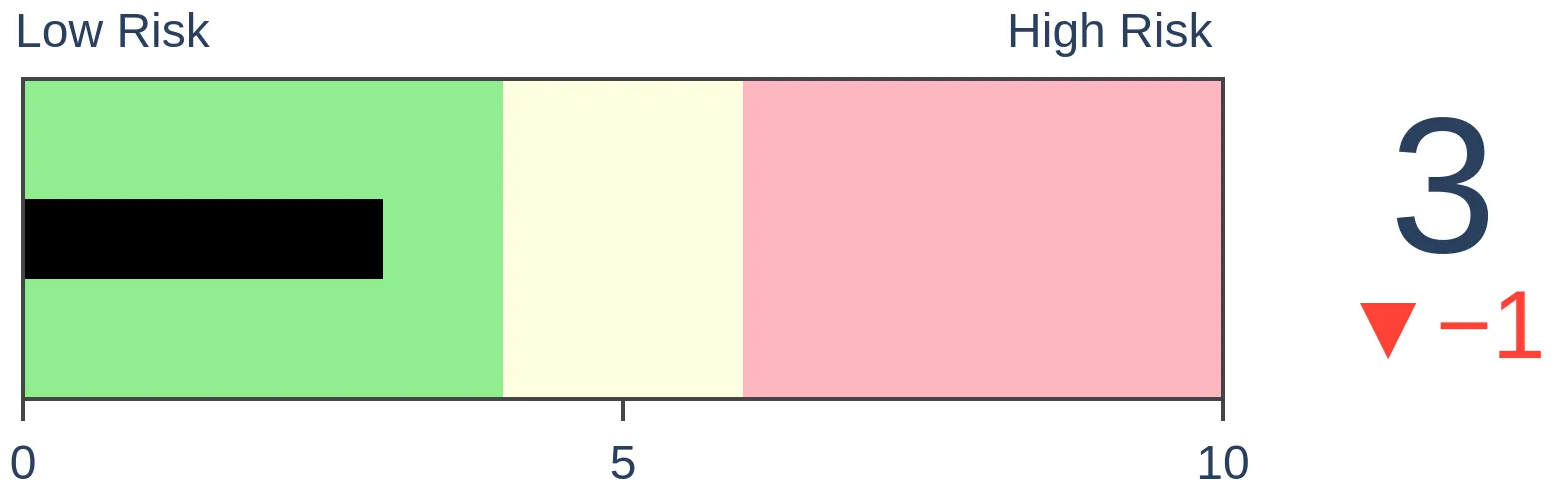
Bonds
|
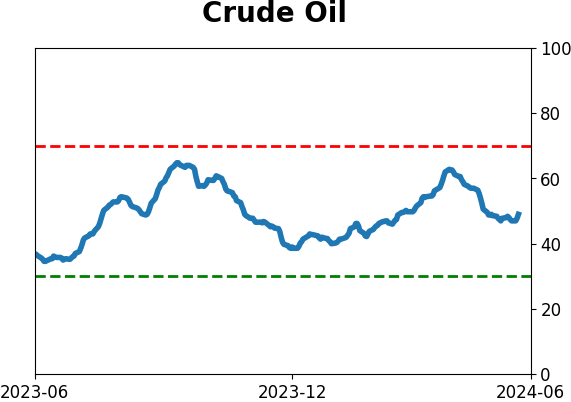
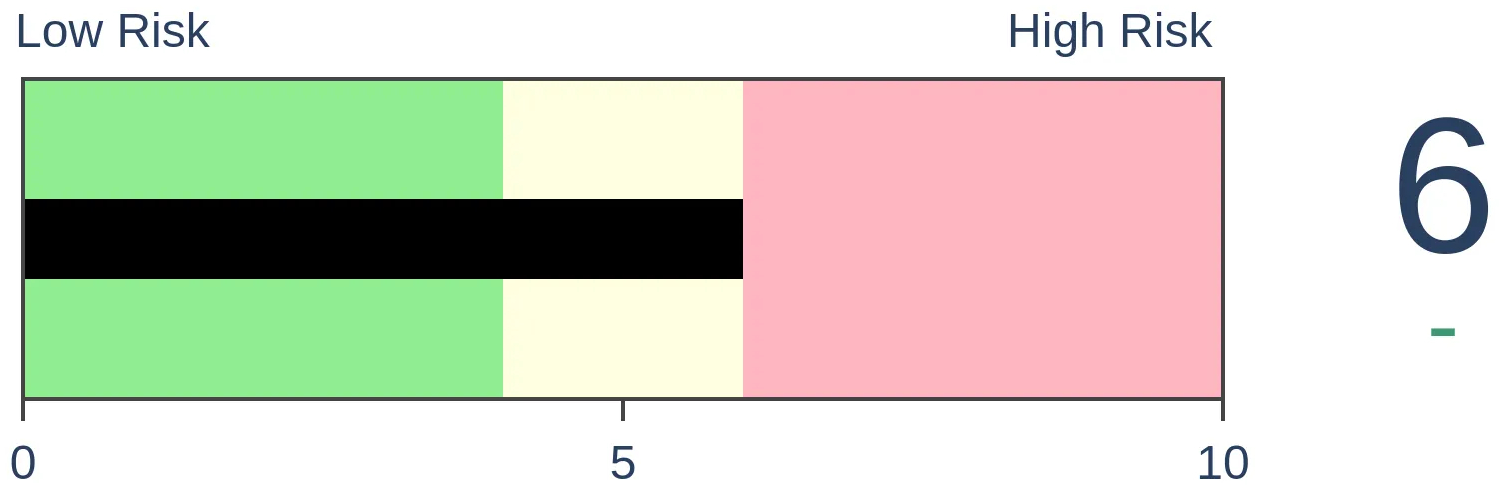
Crude Oil
|
|
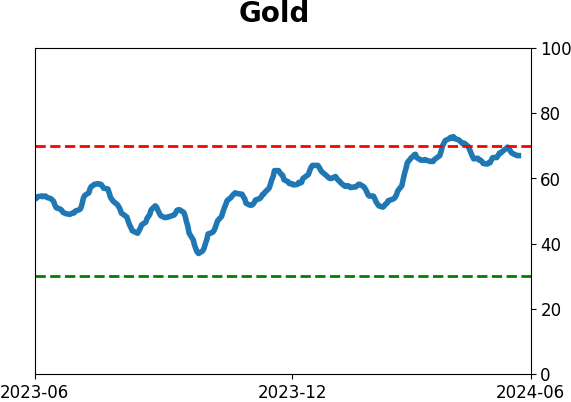
Gold
|
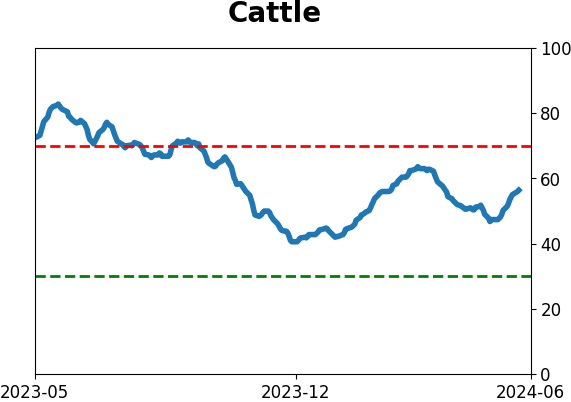
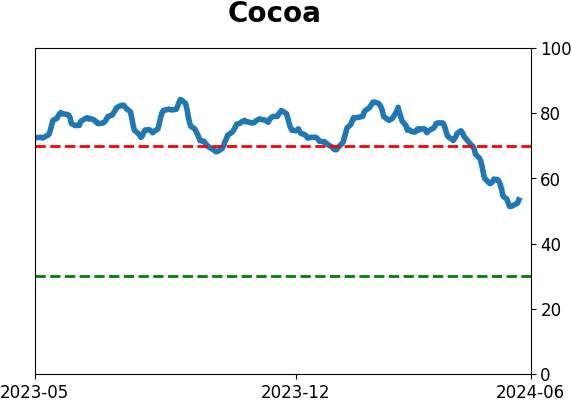
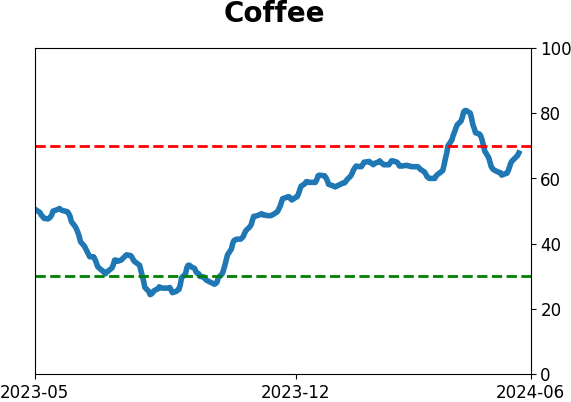
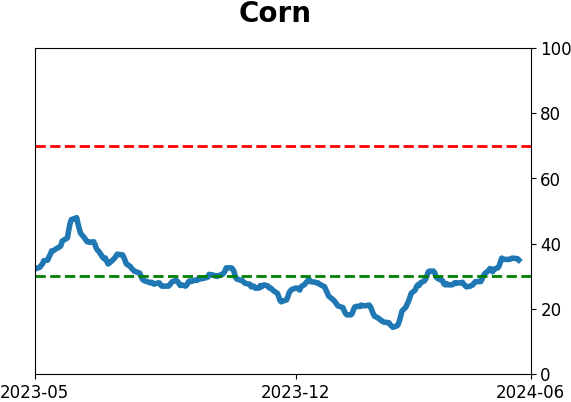
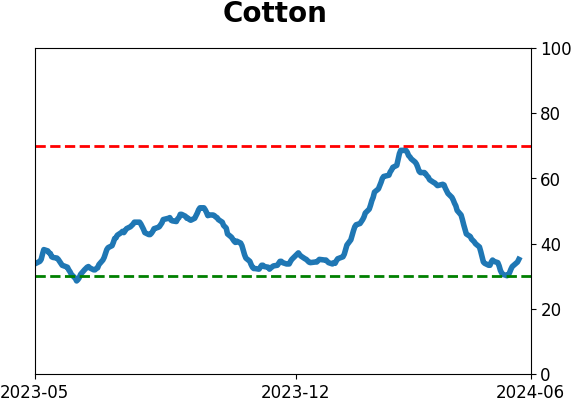
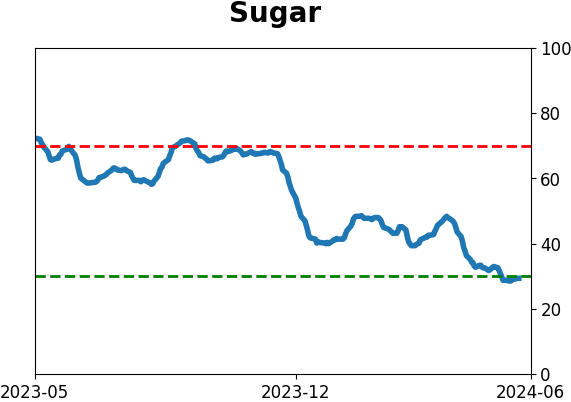
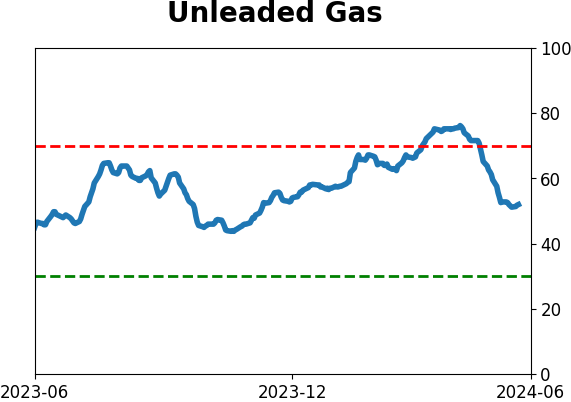
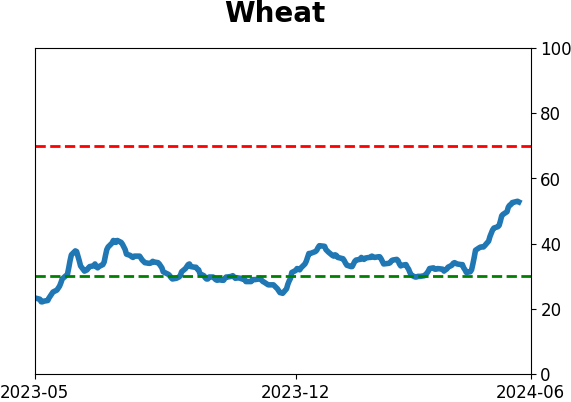
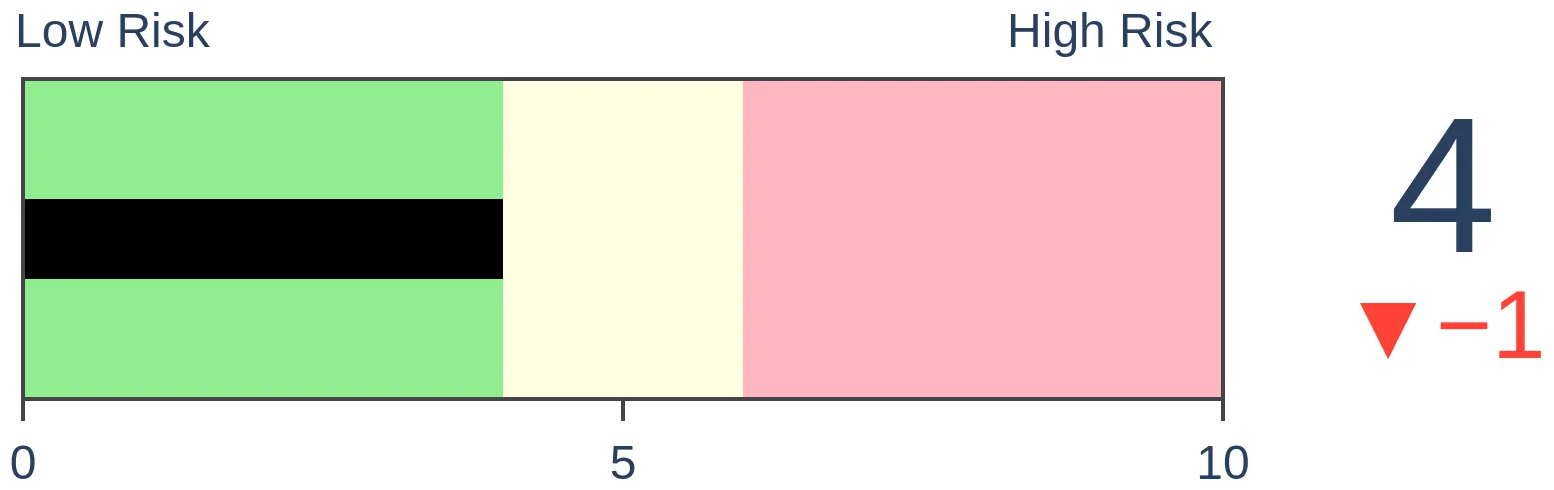
Agriculture
|
|
Research
By Jason Goepfert
BOTTOM LINE
While a handful of stocks have been getting most of the attention, there has been some deterioration under the surface on the Nasdaq exchange. More stocks have been seeing weakness, and signs of a split market are rising. The number of technical warning signs over the past year has spiked to an alarming degree.
FORECAST / TIMEFRAME
None
|
Key points:
- The number of technical warning signs on the Nasdaq exchange continues to increase
- On that exchange, there have been a large number of days with a split market over the past year
- The only other times there have been this many protracted warning signs were ahead of peaks in 1990, 2000, and 2007
Warnings continue to pile up
On Tuesday, we saw how more and more stocks are diverging from the Nasdaq 100 index. These performance divergences aren't just isolated to the large stocks in the NDX; they are endemic to the broader Nasdaq exchange.
We looked at some of the warnings on the Nasdaq in April. The trend has continued into this month and, in some cases, has gotten worse. The number of technical warnings keeps rising.
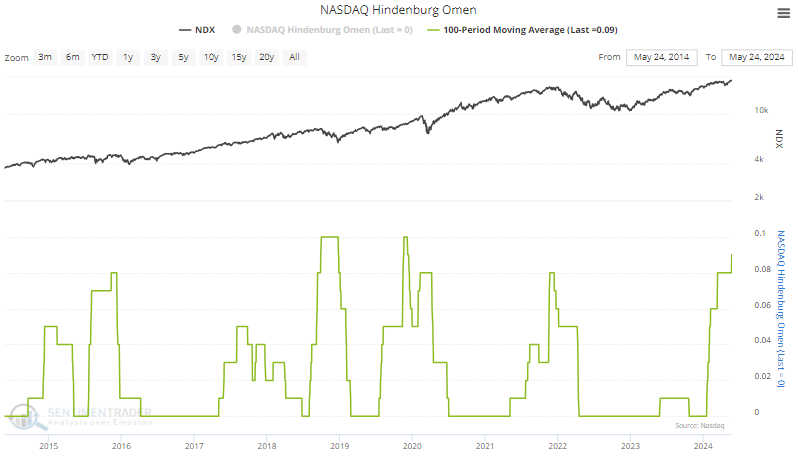
Over the past 100 days, the number of Hindenburg Omens has spiked to the highest level in four years. It monitors conditions analysts have interpreted throughout history as signifying potential market weaknesses.
We use three criteria:
- The Nasdaq 100 is above its 50-day moving average
- Both new 52-week lows and 52-week highs on the Nasdaq are greater than 2.8% of all advancing and declining issues
- The Nasdaq McClellan Oscillator is negative.
When the signal triggers, it highlights a "split" market, which is unhealthy. Multiple signals in a cluster is a worrying sign.
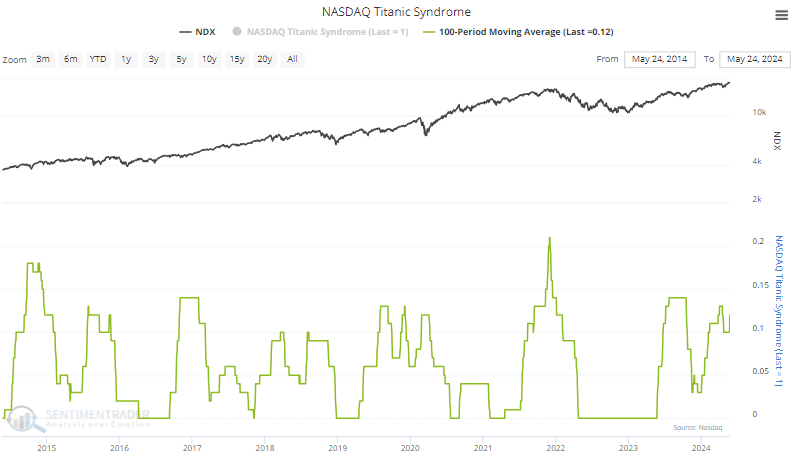
The same goes for the Titanic Syndrome, though it's not quite as severe. It highlights a technical market condition when stocks have recently been at a high, and then there is a sudden jump in new 52-week lows versus highs on the Nasdaq.
When we combine the two signals and add up the number of times they have triggered over the past year, the total just surpassed everything since July 2008.
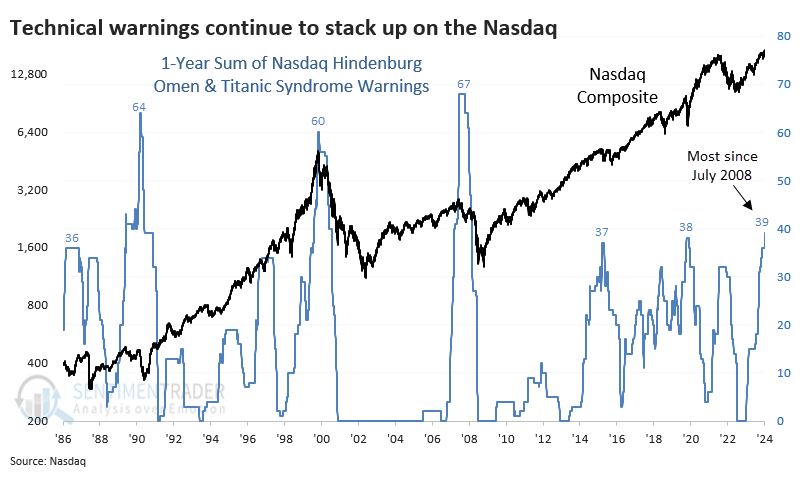
Many technical warnings = weak returns
The only times the 1-year sum of these two technical warnings has reached this level were ahead of the Nasdaq peaks in 1990, 2000, and 2007. Which isn't great.
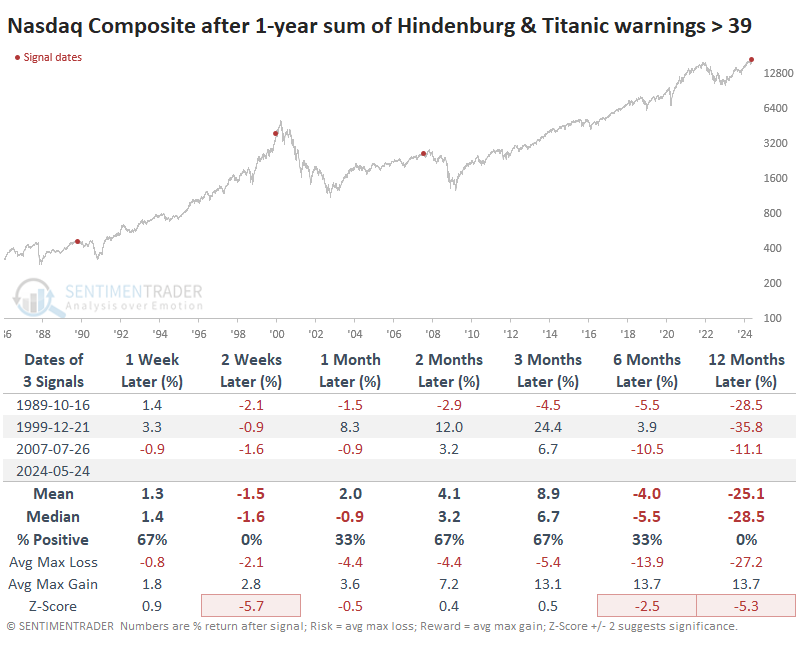
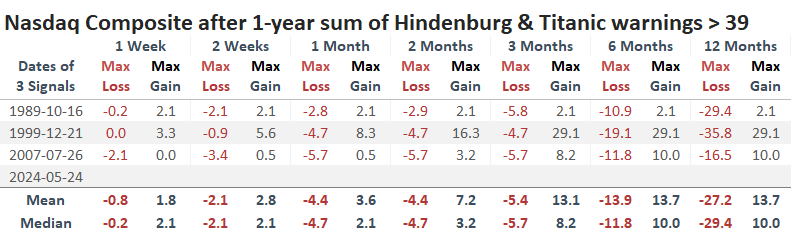
If we look at the maximum gains and losses across time frames, the Nasdaq did manage to spurt another +29% before peaking during the internet bubble, while the other two saw less than +10% upside.
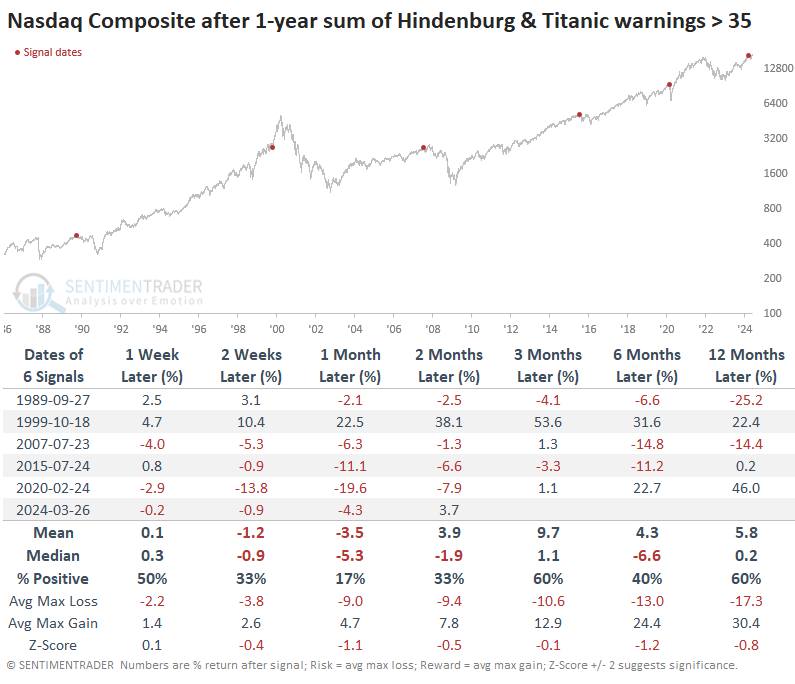
A sample size of three is hard to have much confidence in, so if we relax the parameters to 35 signals over a year, we double the sample. Overall, the results were still weak, with each preceding some kind of trouble. This total was exceeded in March of this year, so if the April weakness was "it" for this cycle, it would be among the most unscathed.
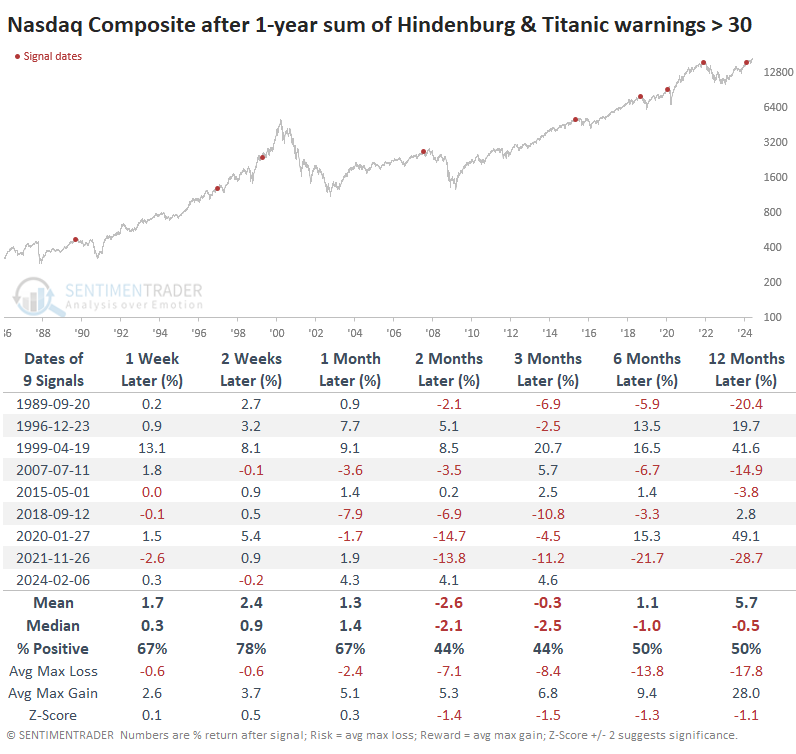
Relaxing the parameters to 30 or more signals over a year gives us a few more dates. Only one of those, in 1996, got by without much trouble, though the Nasdaq still sported a negative return three months later. All the others led to trouble, though again, the internet bubble delayed the pain by a long while, and anyone selling short would have suffered losses by being way too early.
What the research tells us...
Divergences are building across the market, but they're particularly egregious on the Nasdaq exchange and within some indexes like the Nasdaq 100. It is not pound-the-table obvious just yet, but one of the issues is that warnings have been piling up for months and months.
When these conditions have been this pervasive, there have been essentially no instances when the Nasdaq didn't escape a reckoning. It didn't necessarily happen immediately, and several times, the stocks were able to tack on substantial gains in the weeks (or even months) afterward. But it was rare to escape any damage whatsoever.
Indicators at Extremes
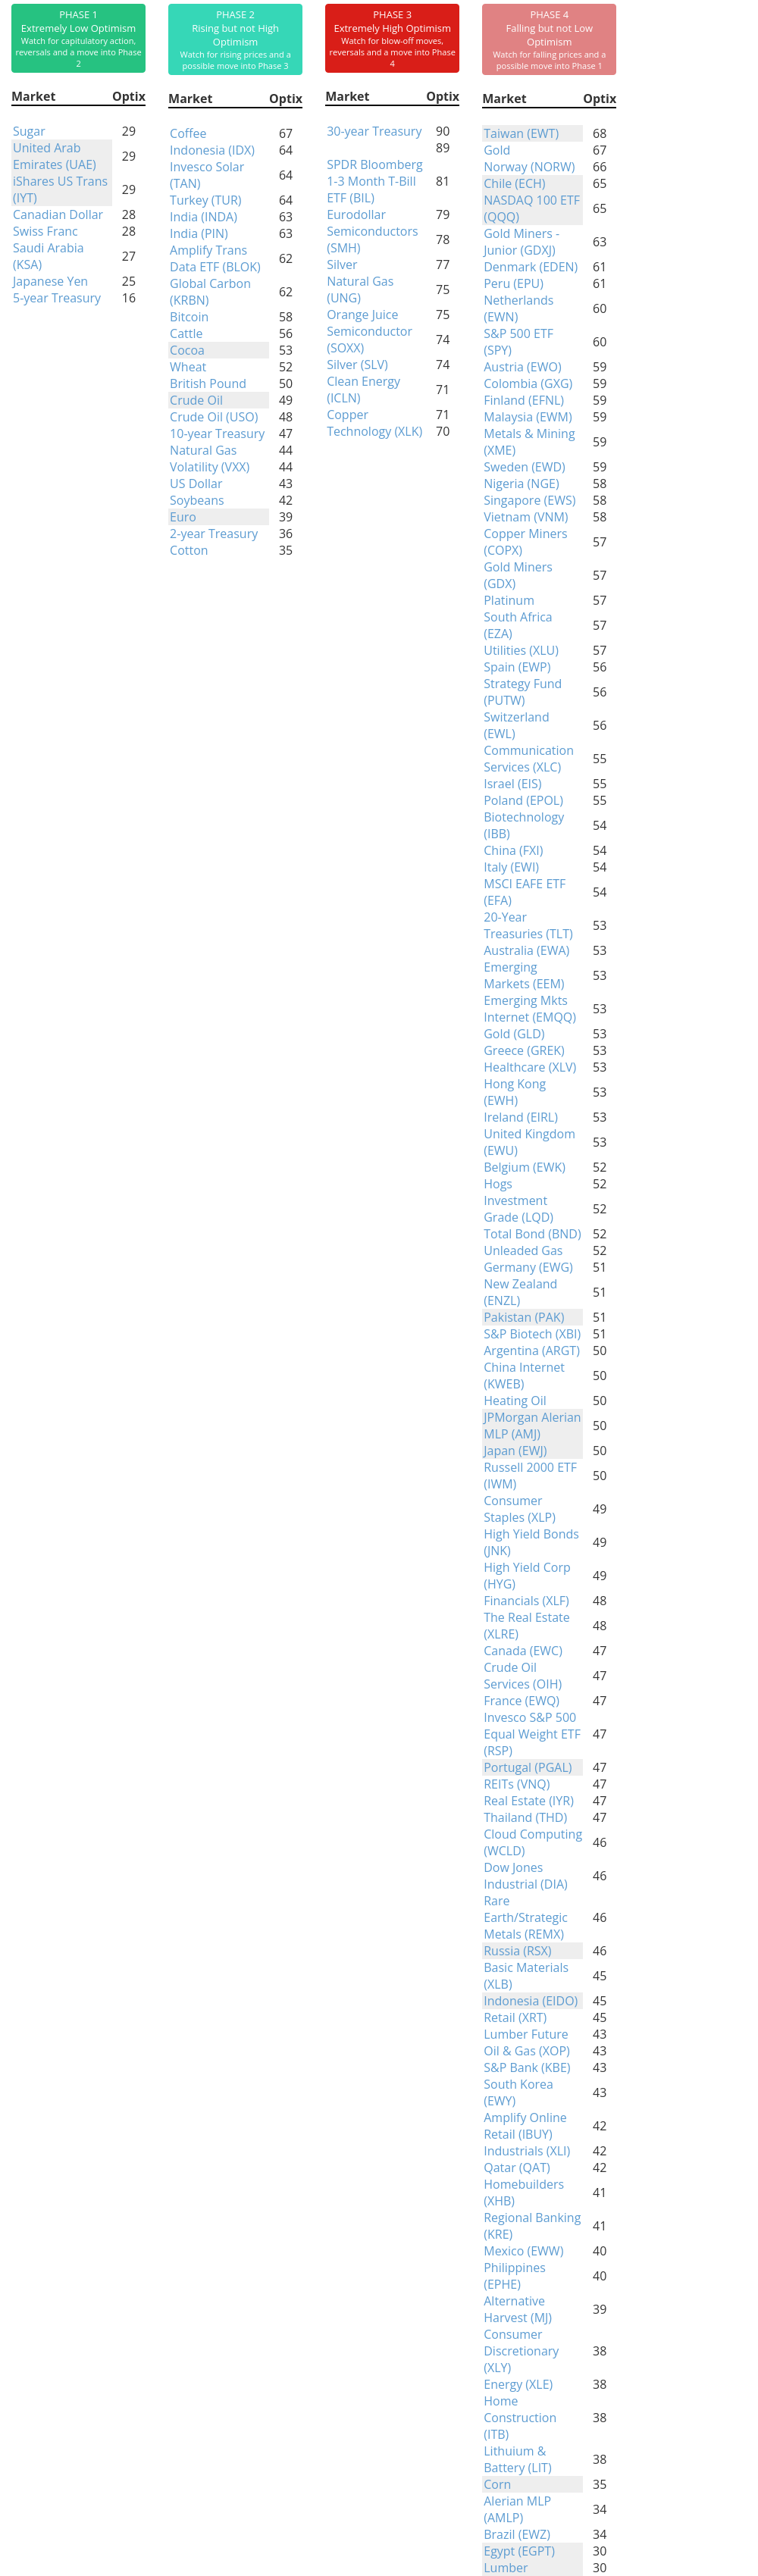
Phase Table
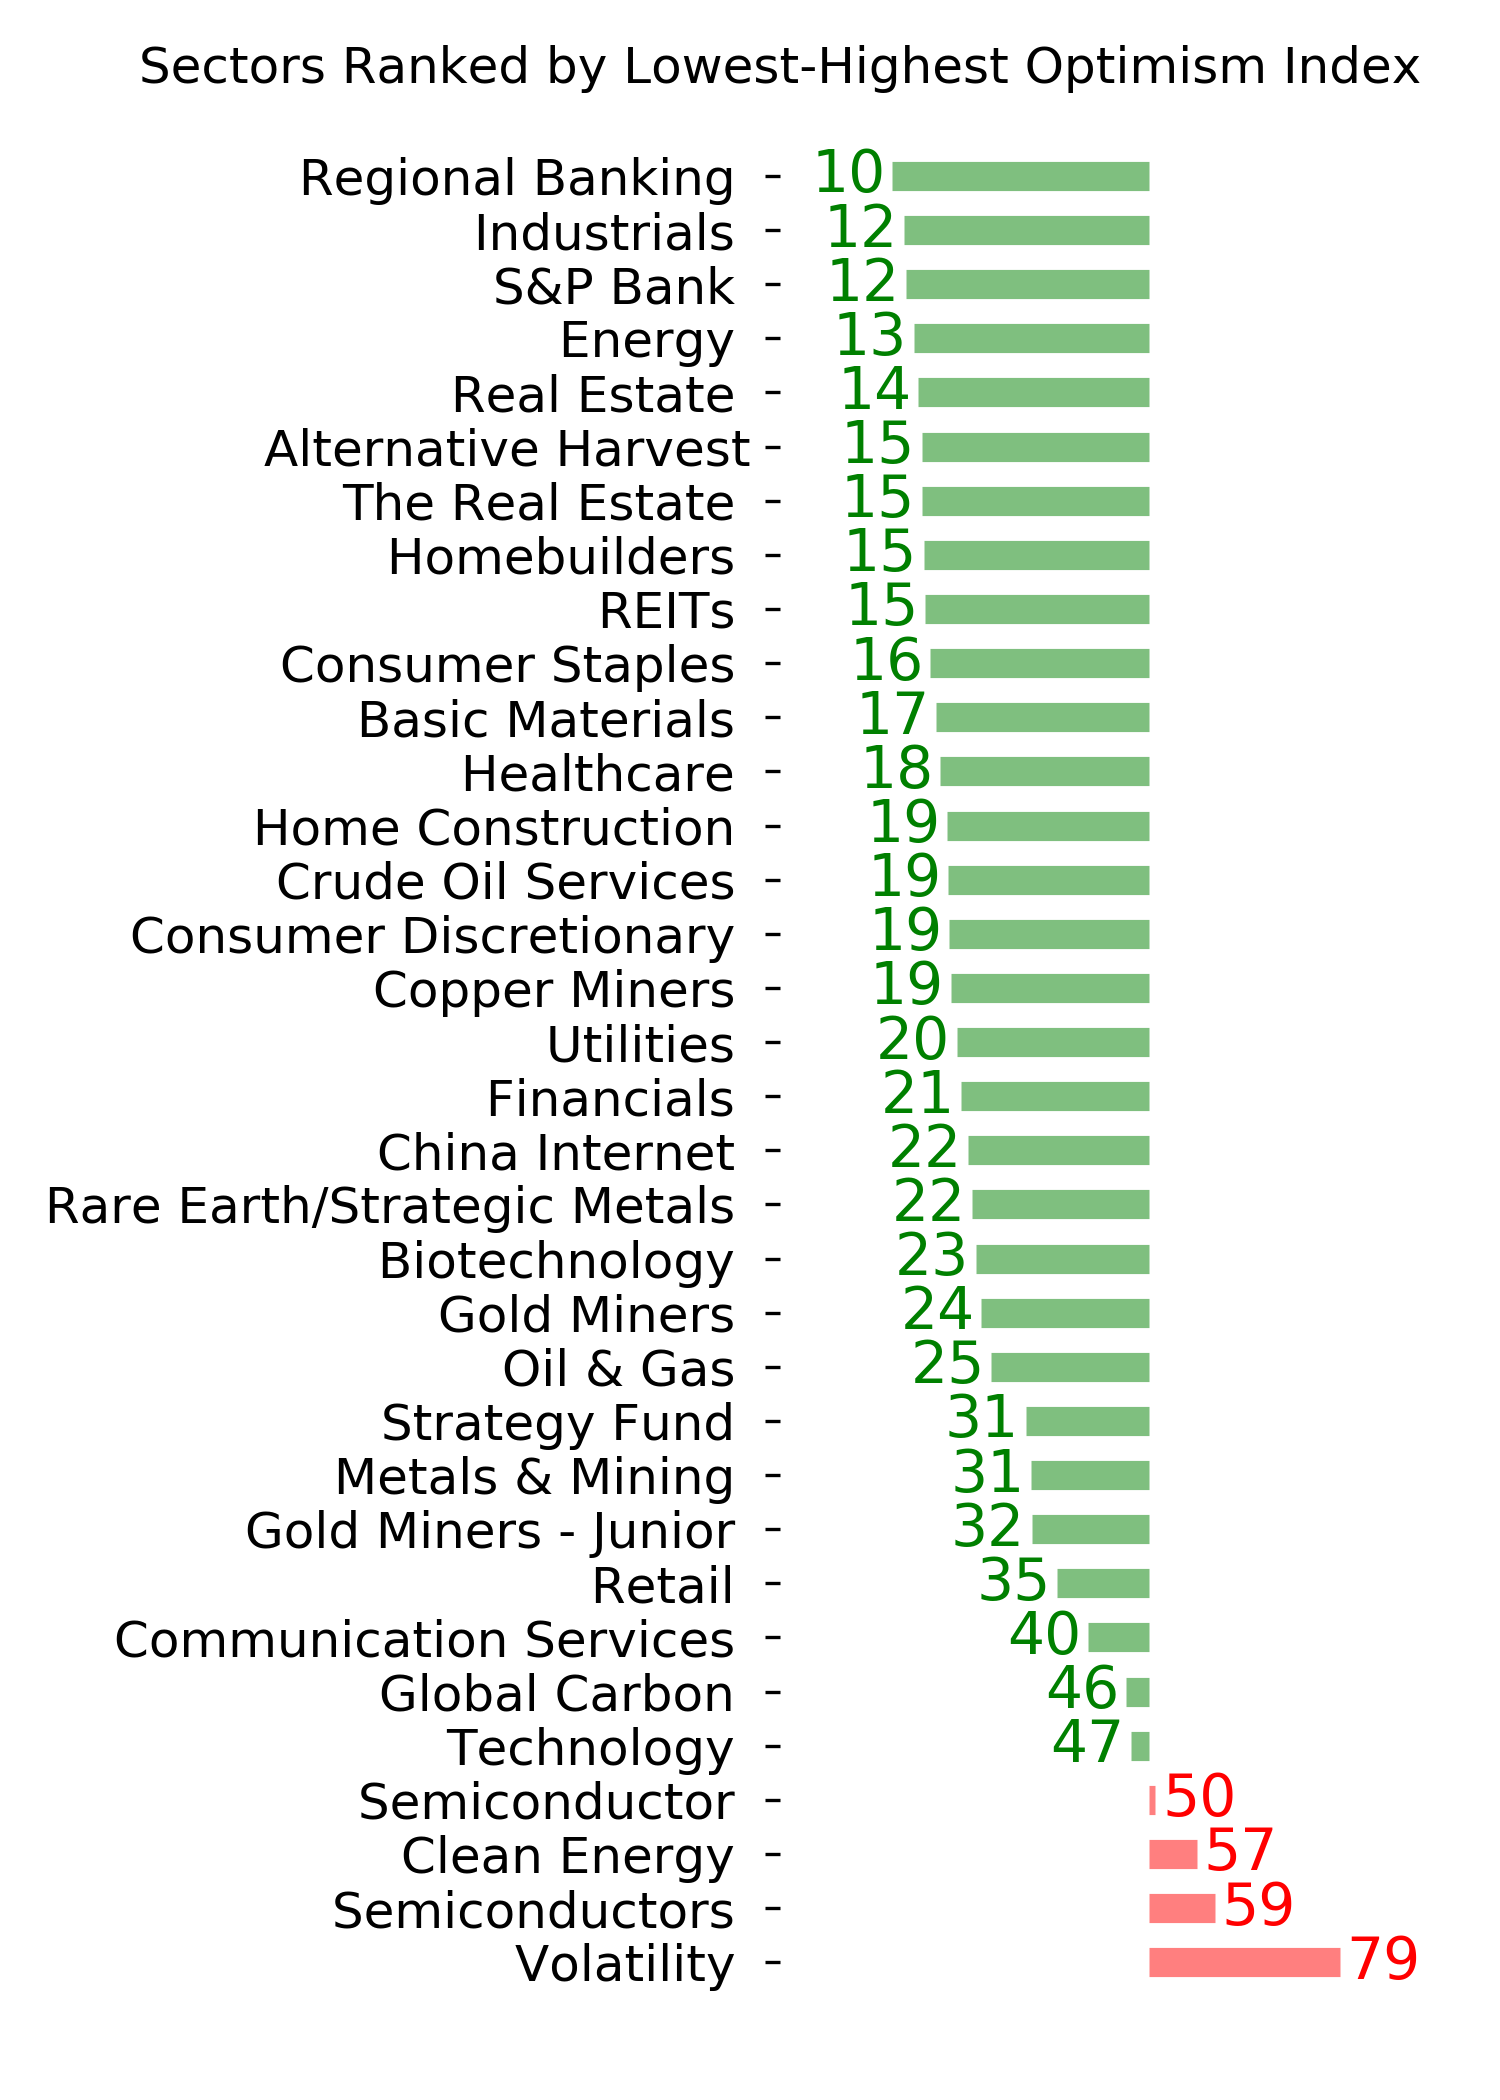
Ranks
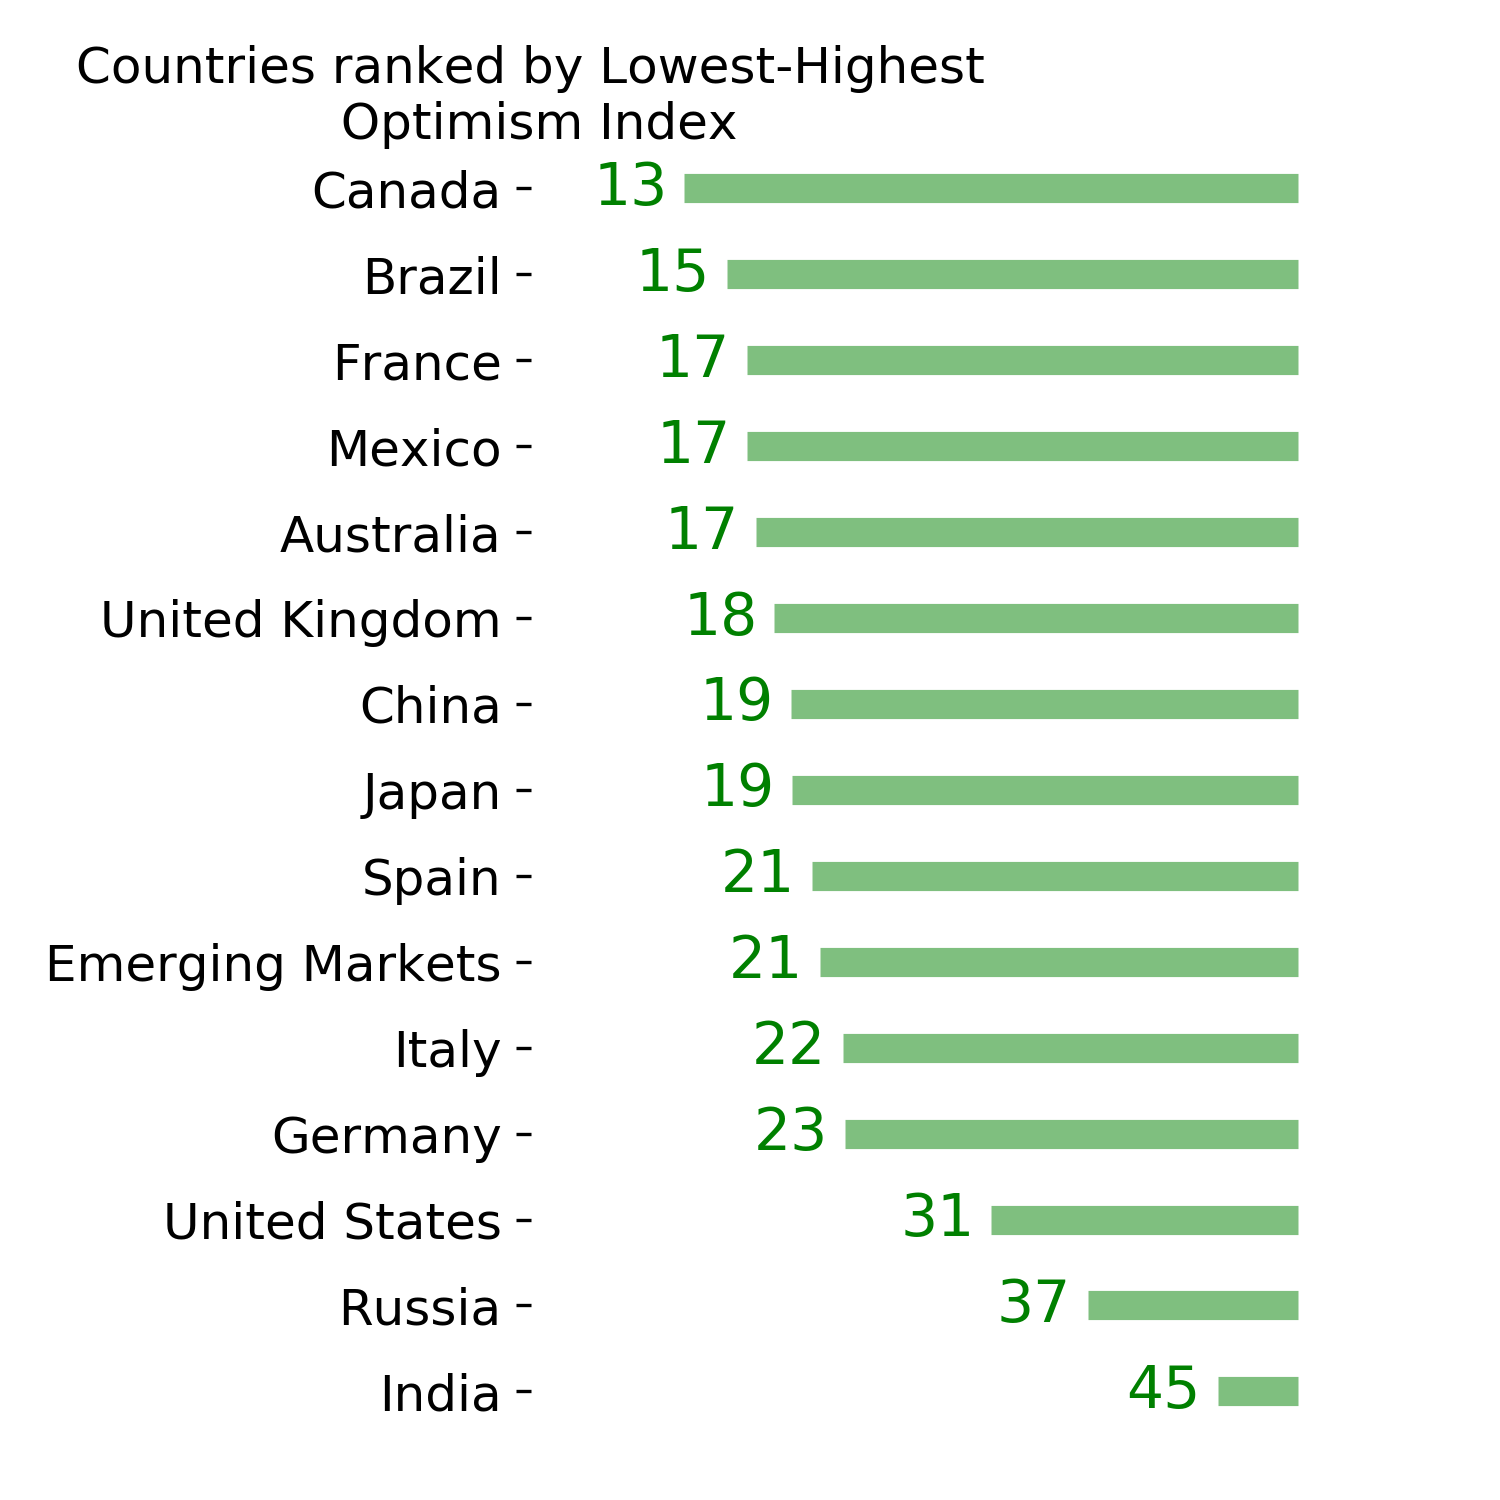
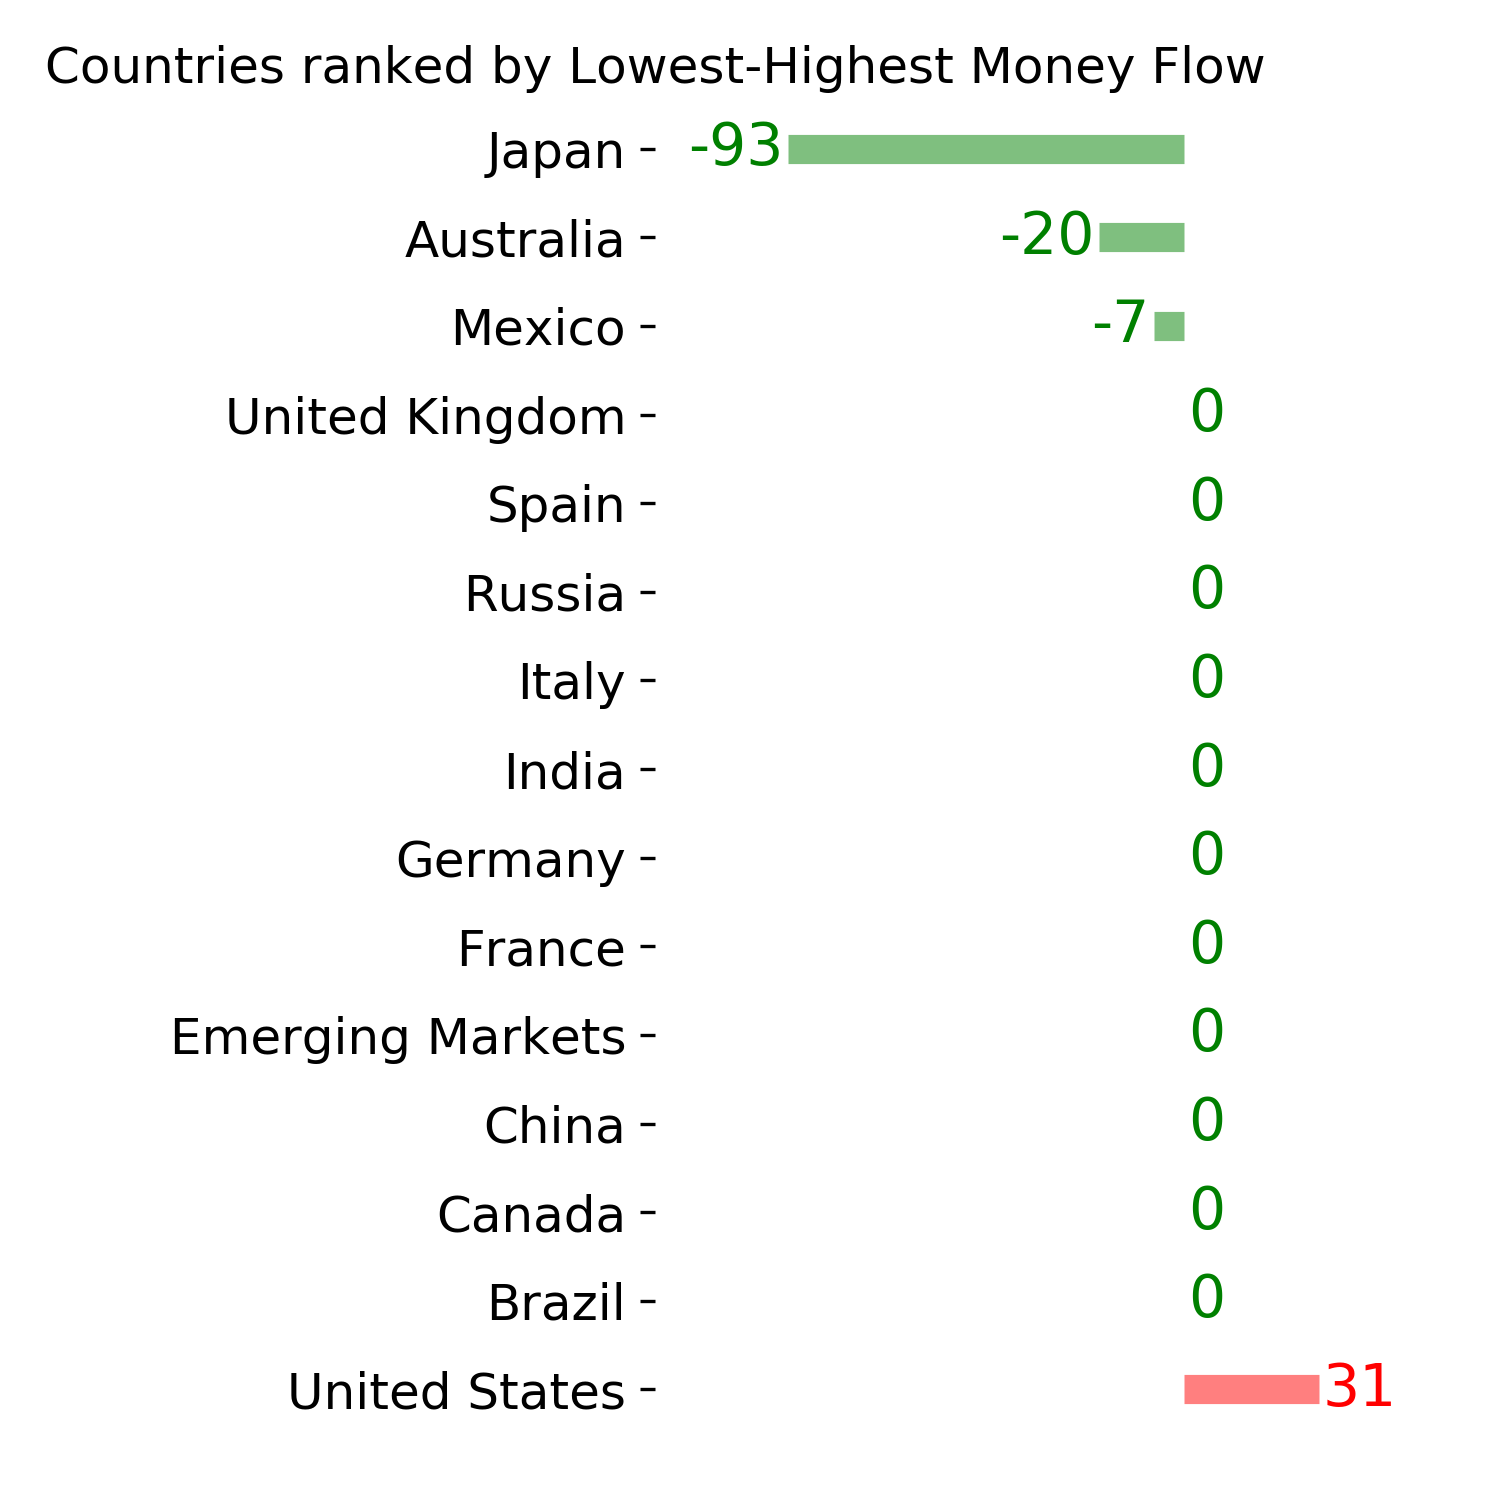
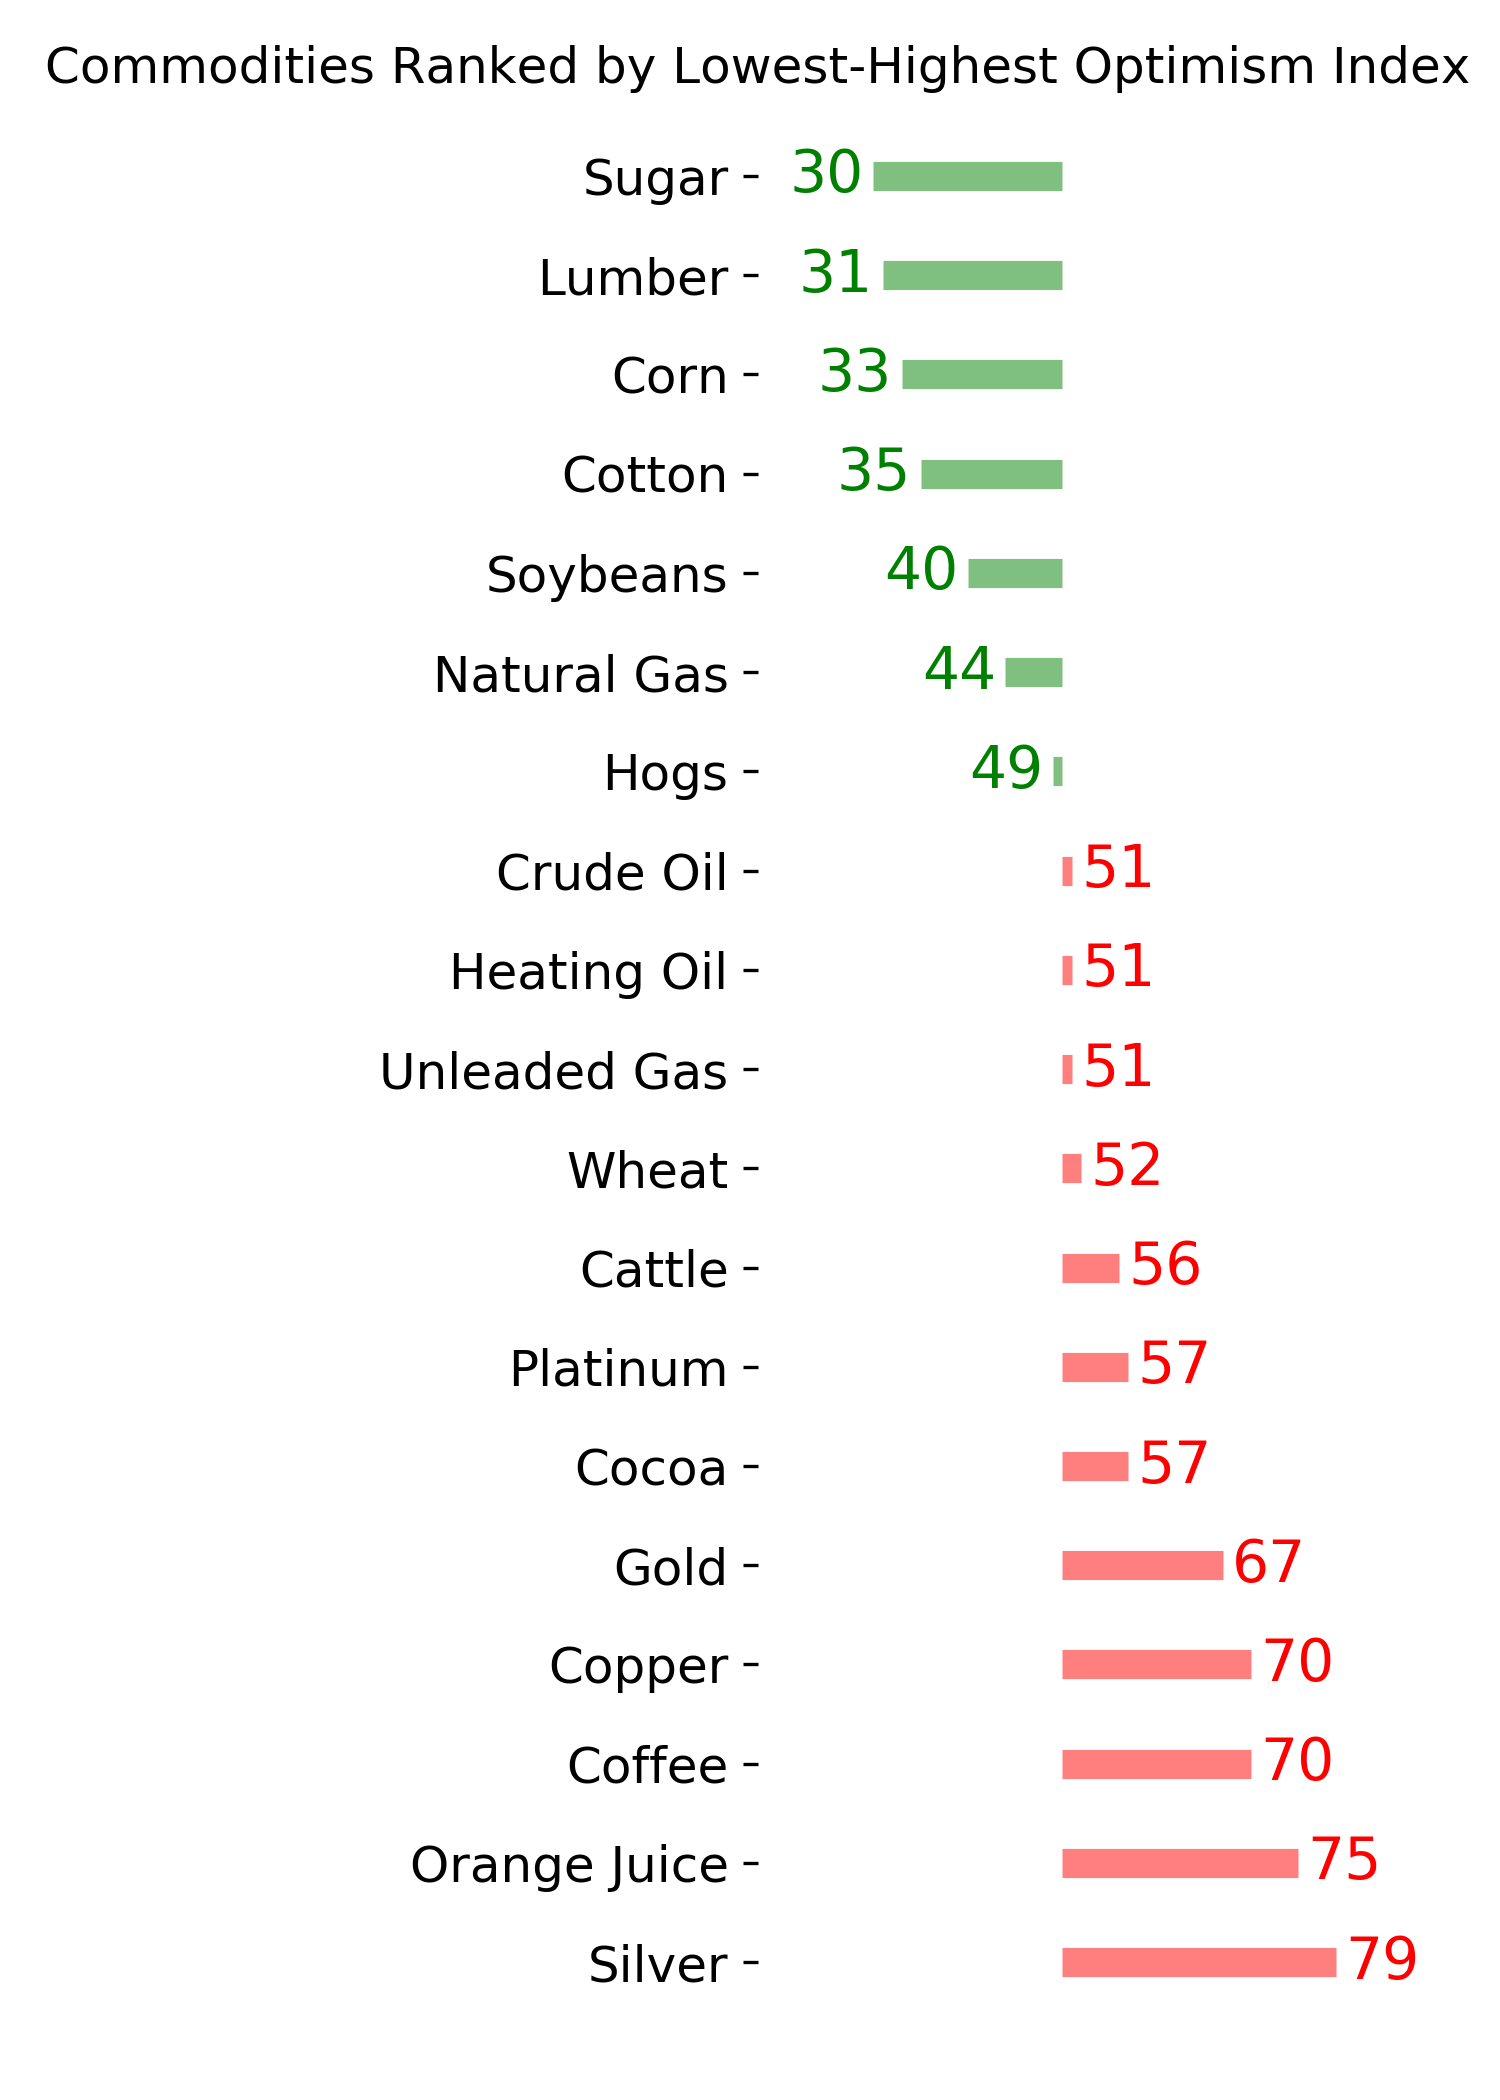
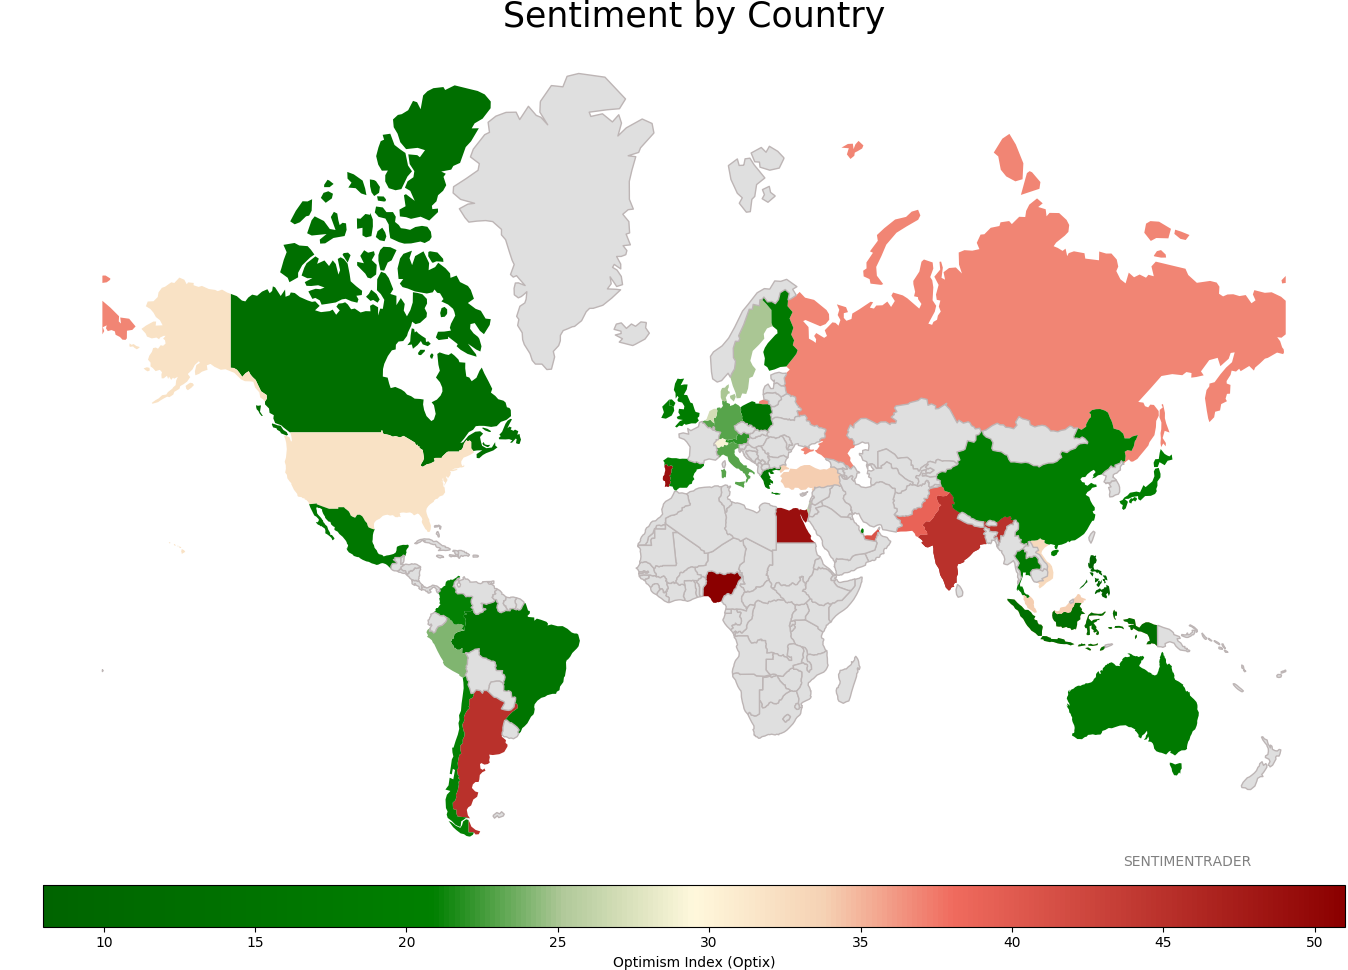
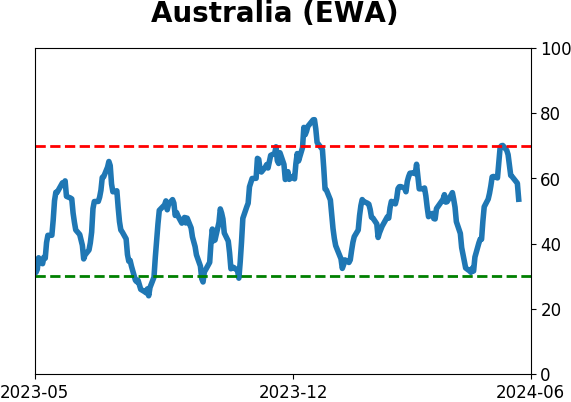
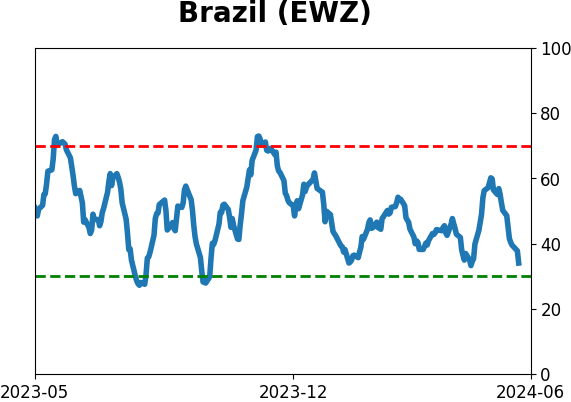
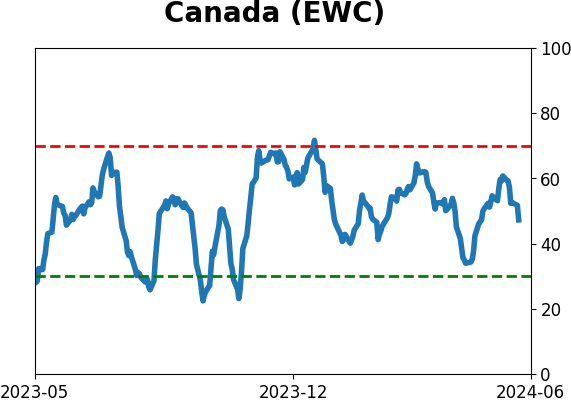
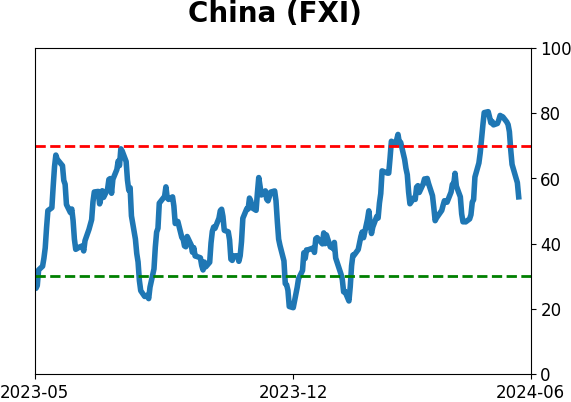
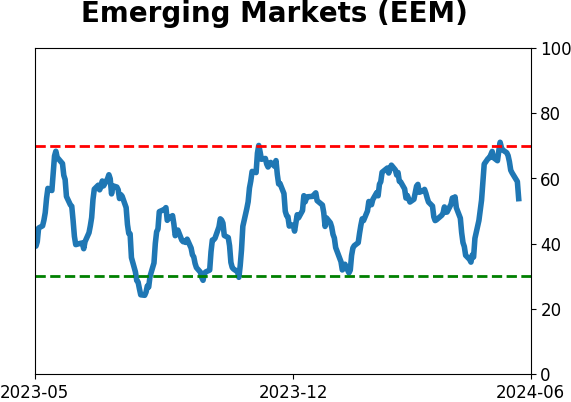
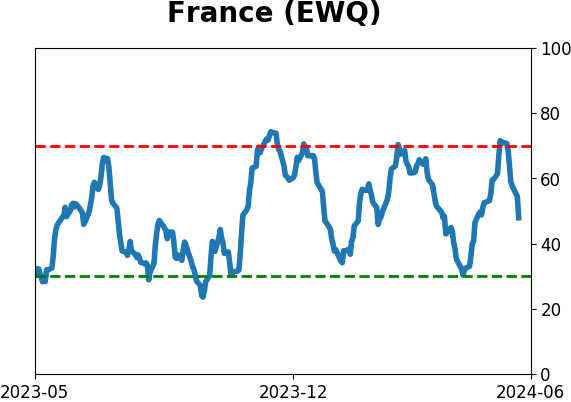
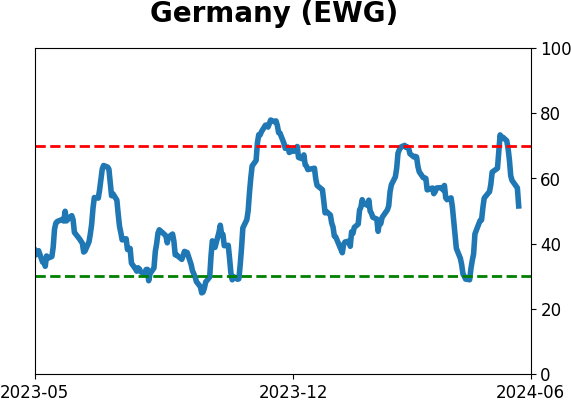
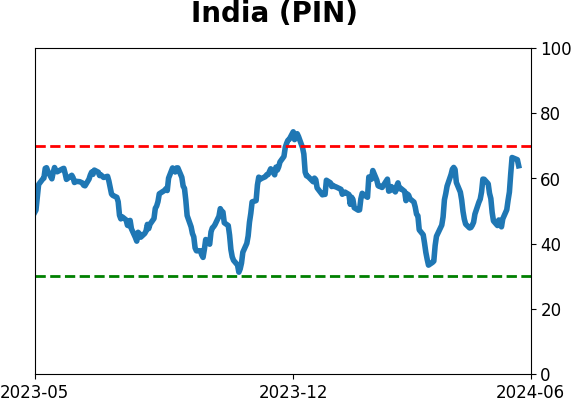
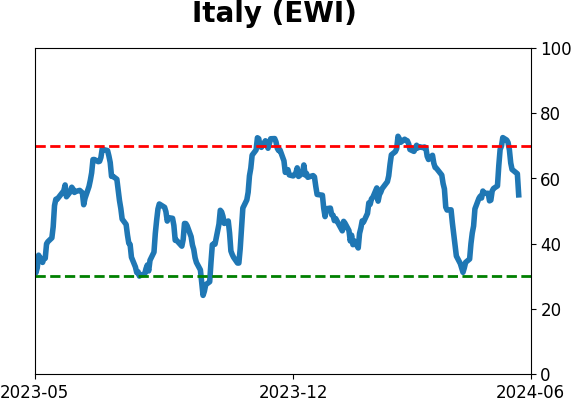
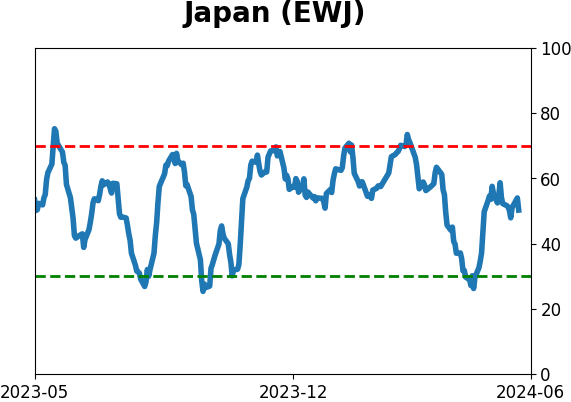
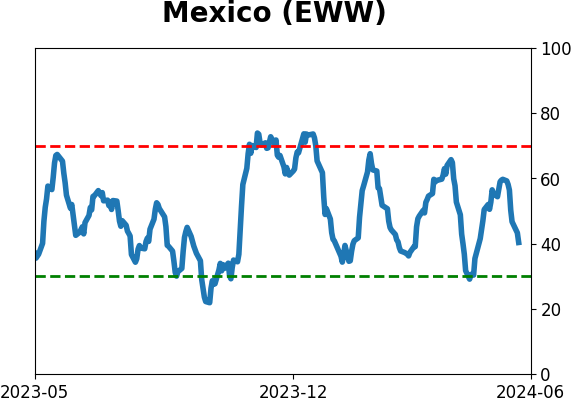
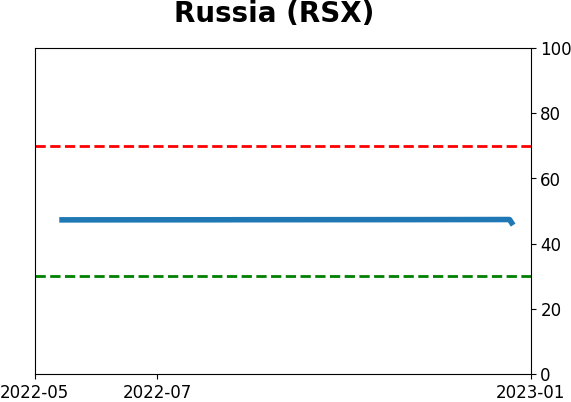
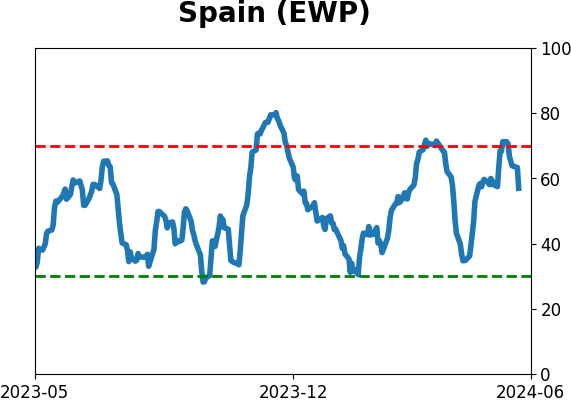
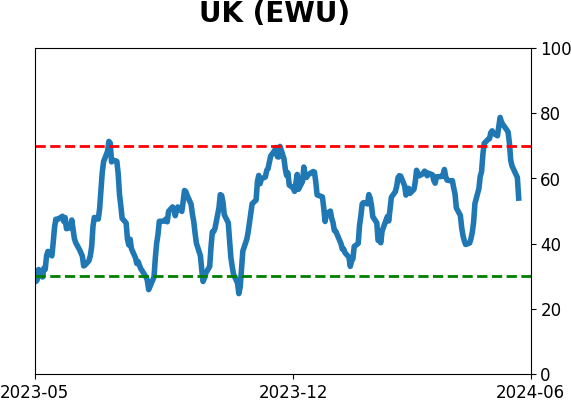
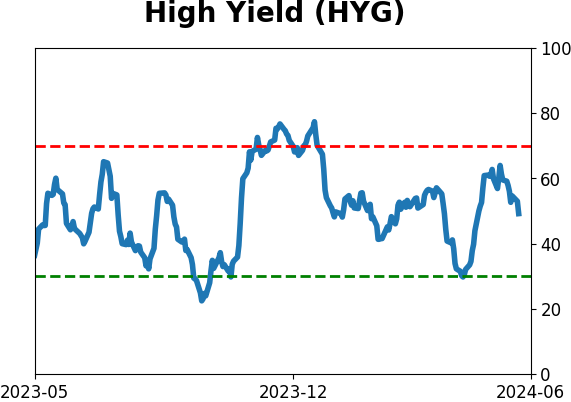
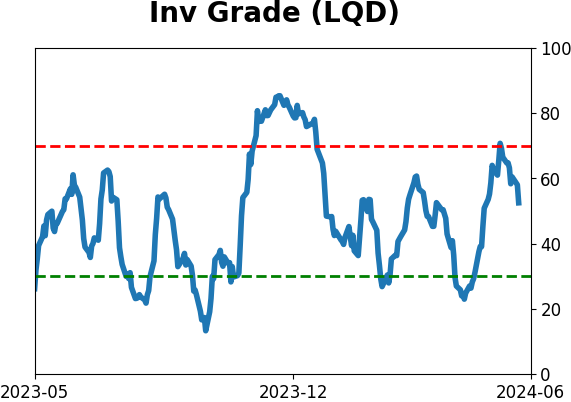
Sentiment Around The World
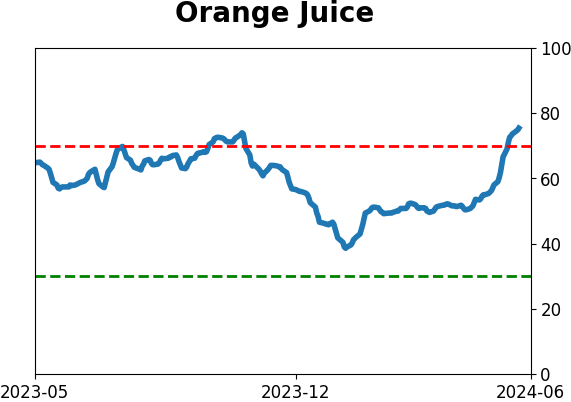
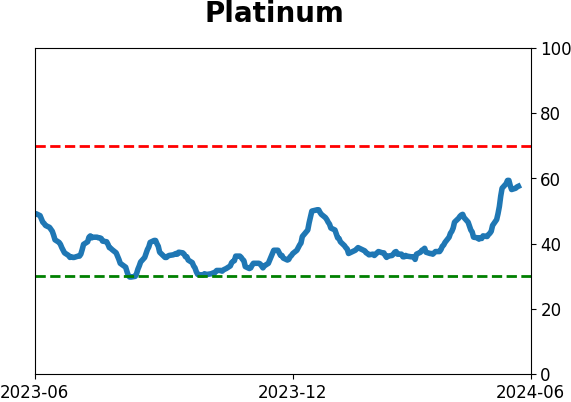
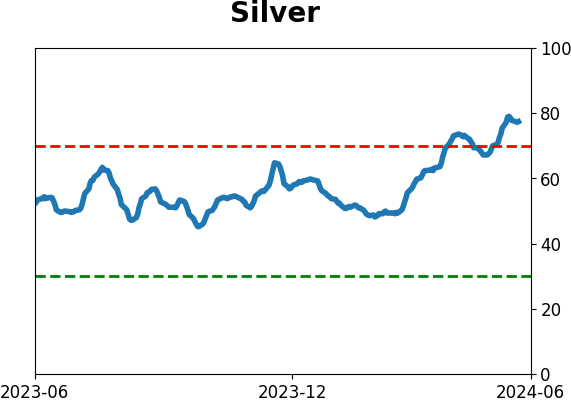
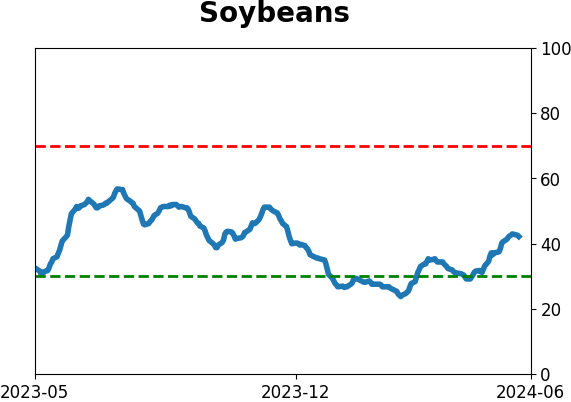
Optimism Index Thumbnails
|
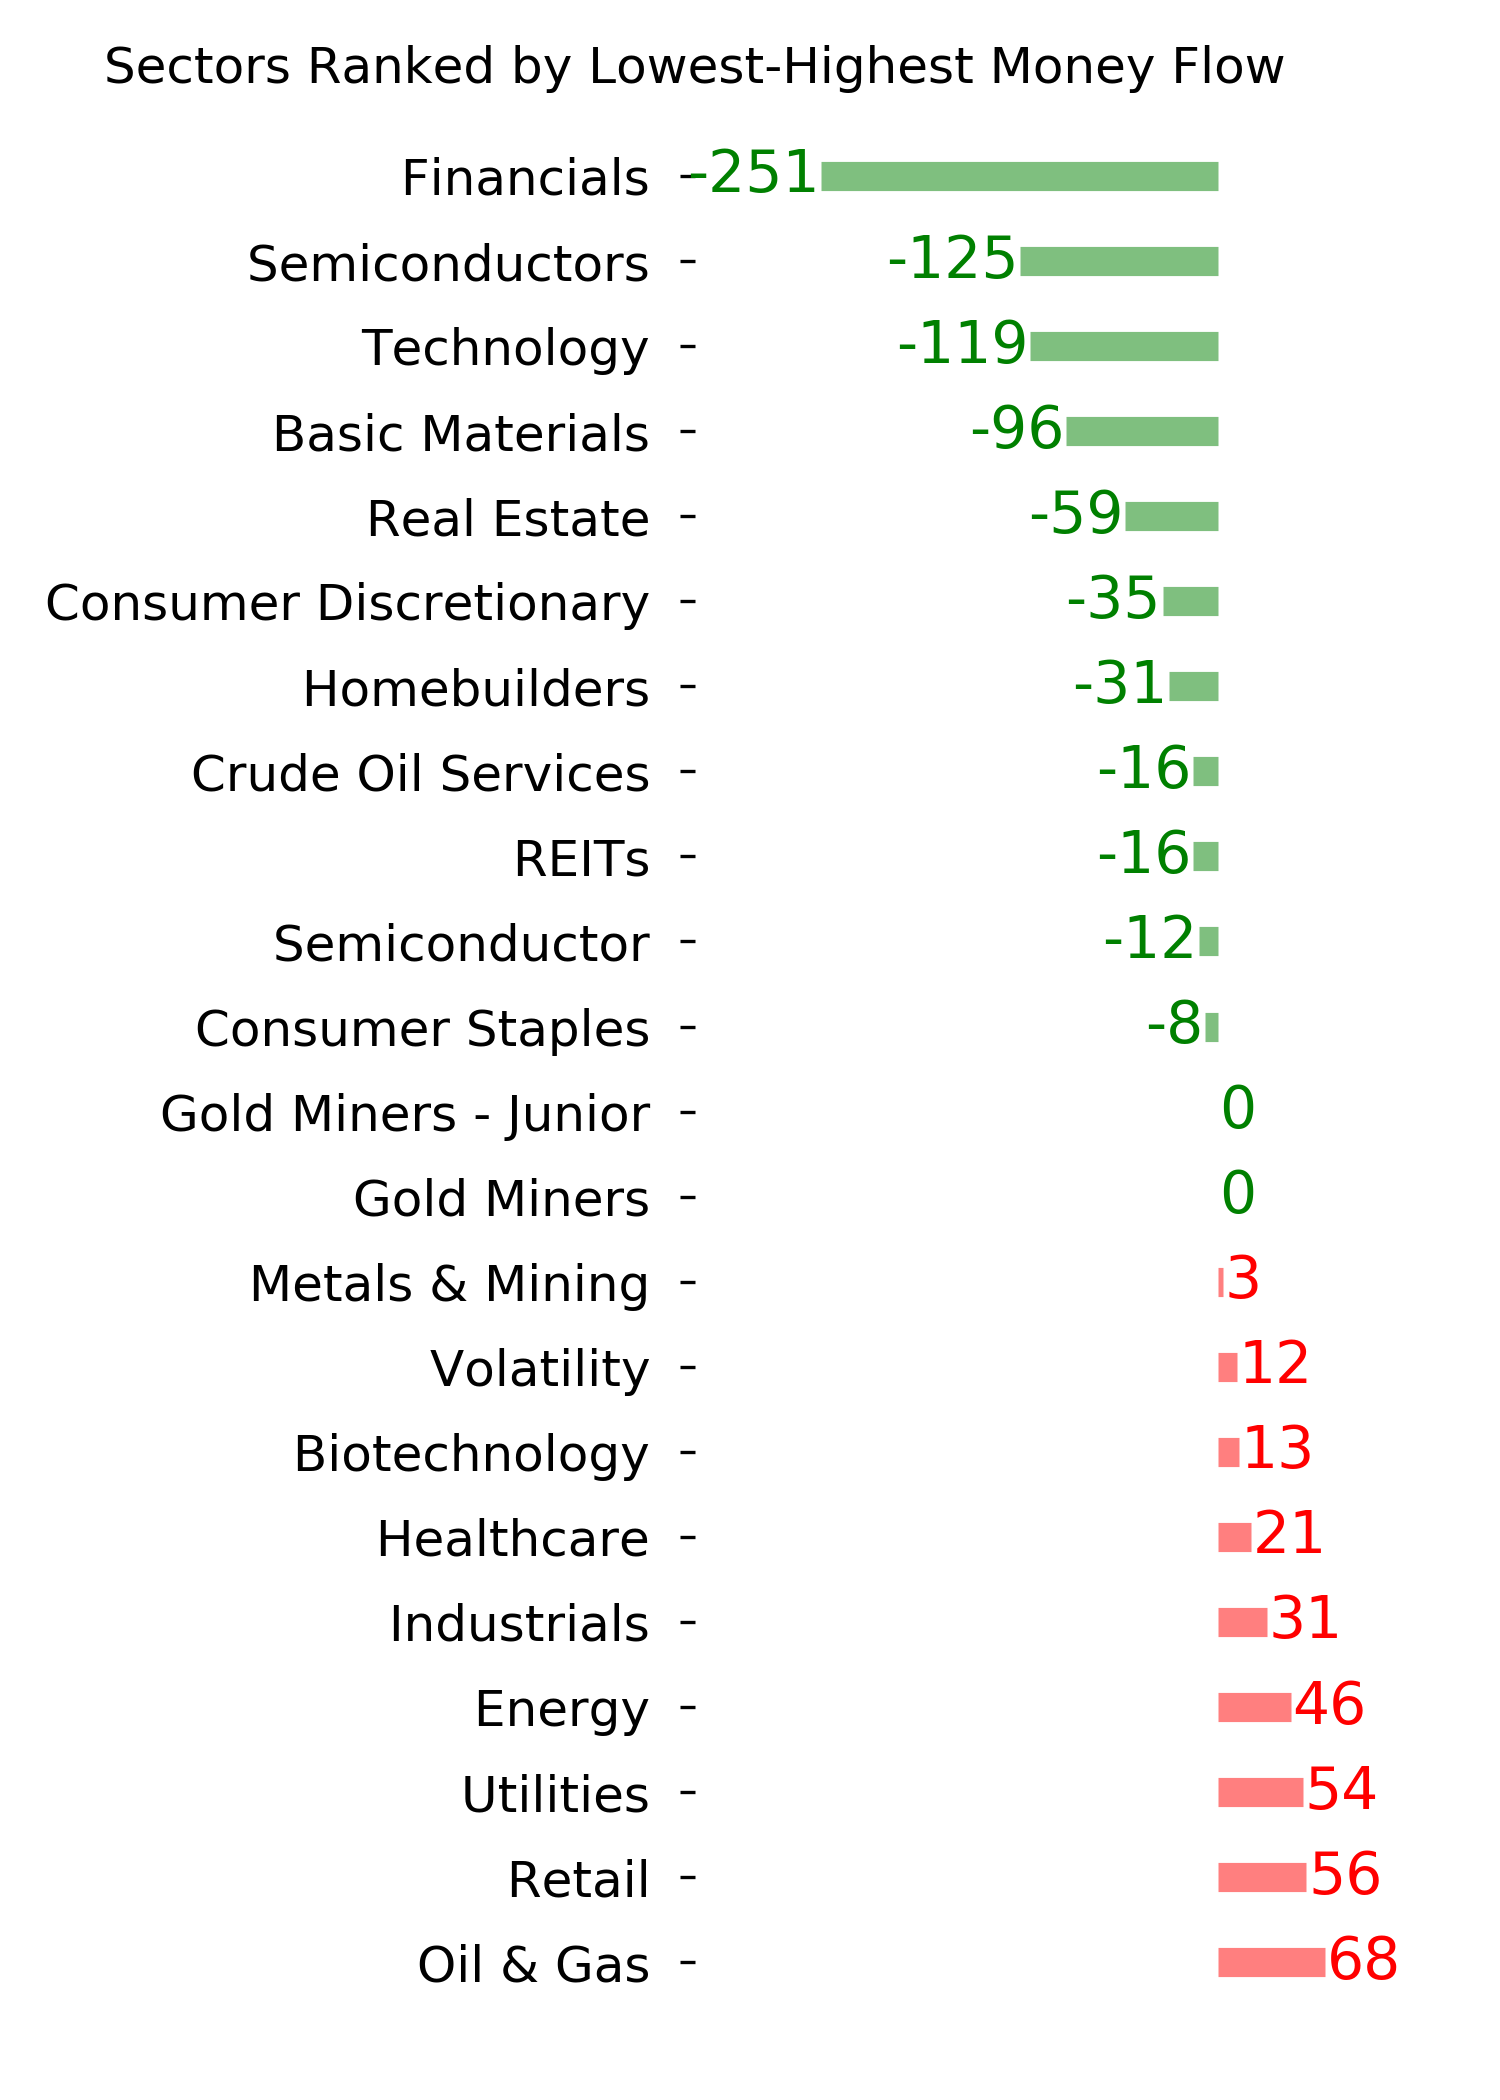
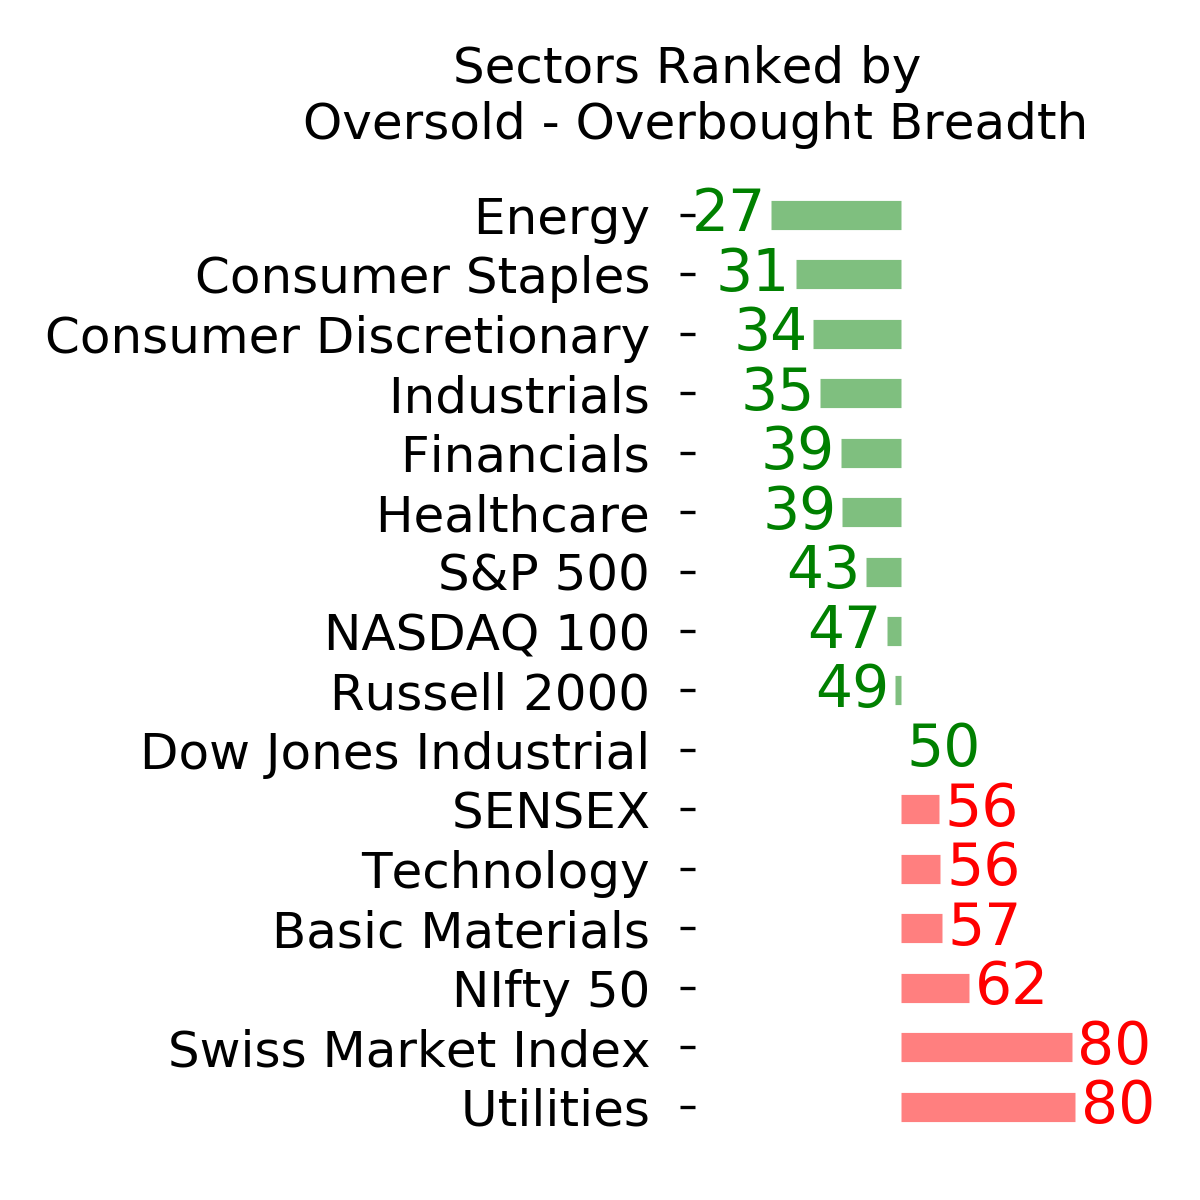
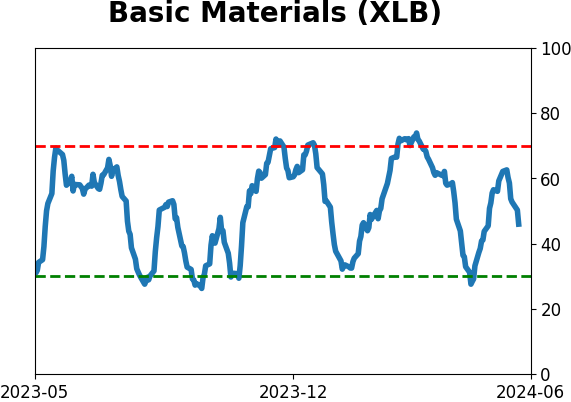
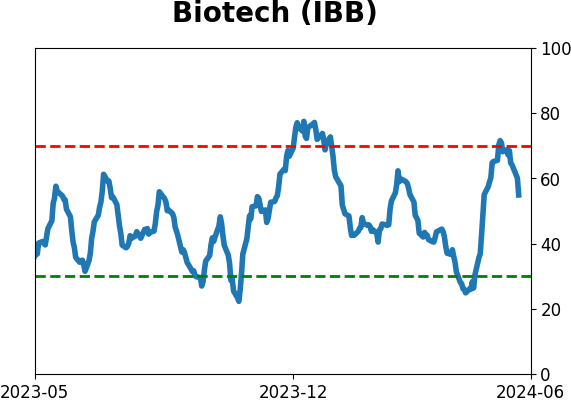
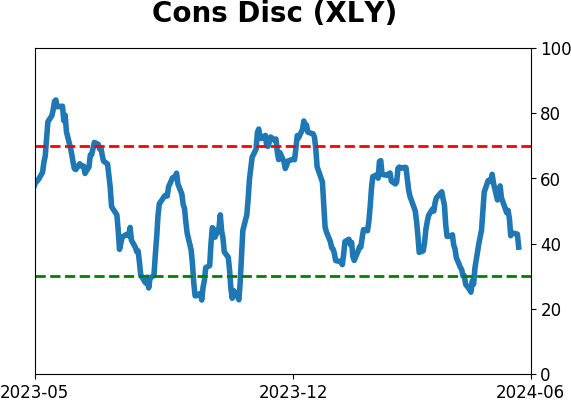
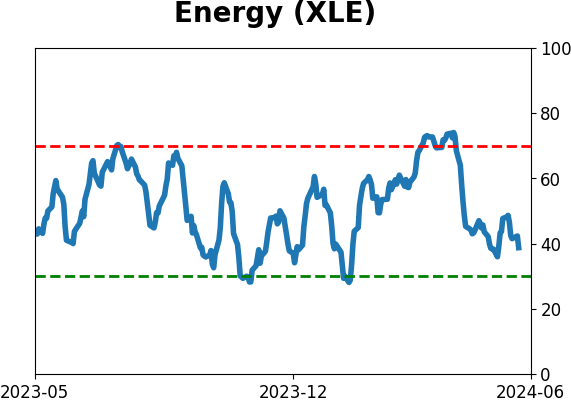
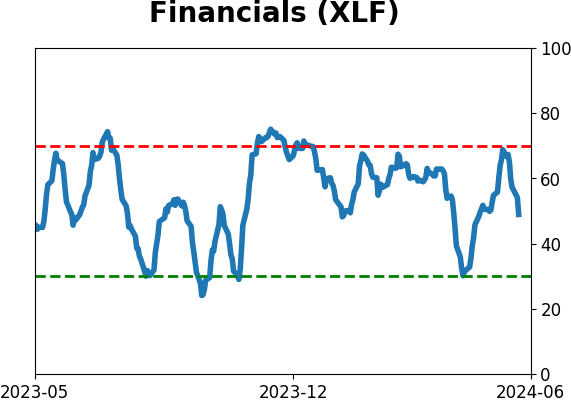
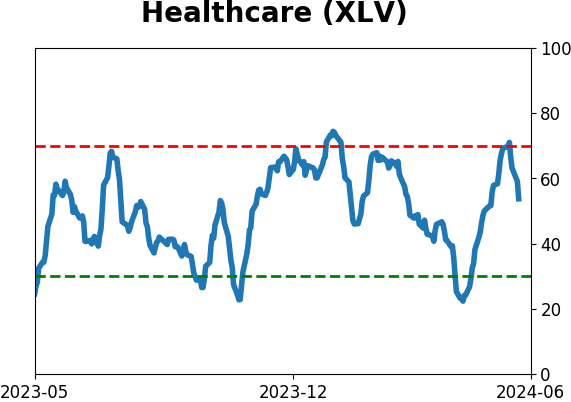
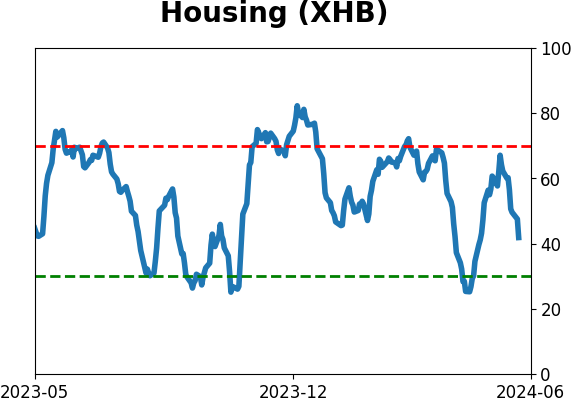
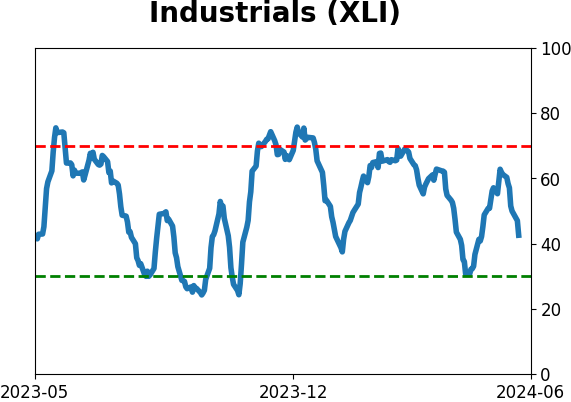
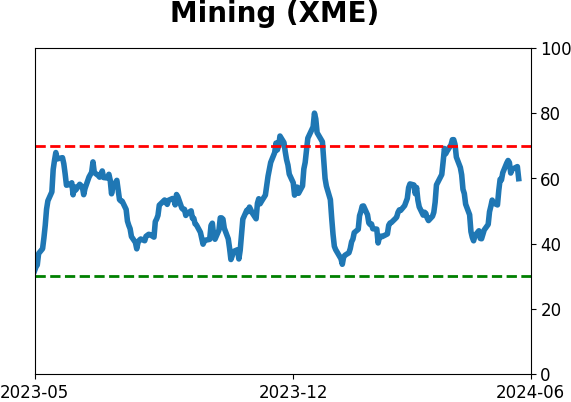
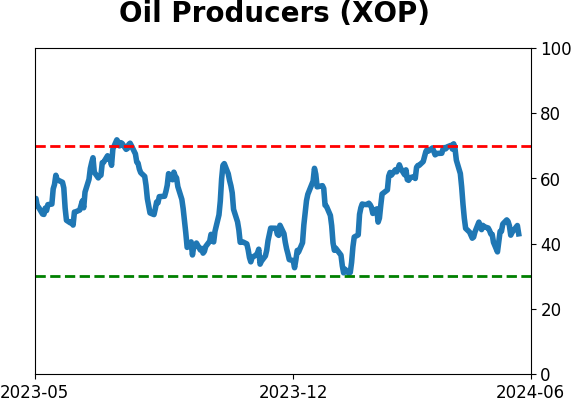
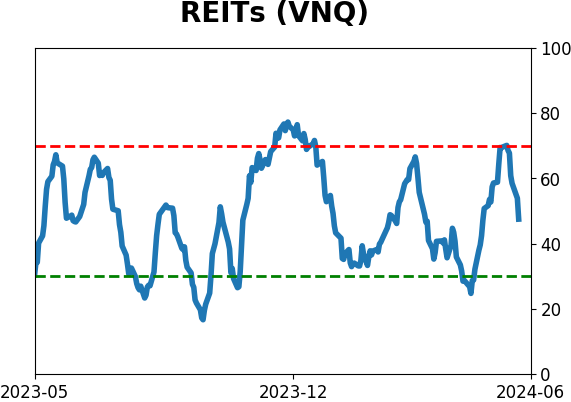
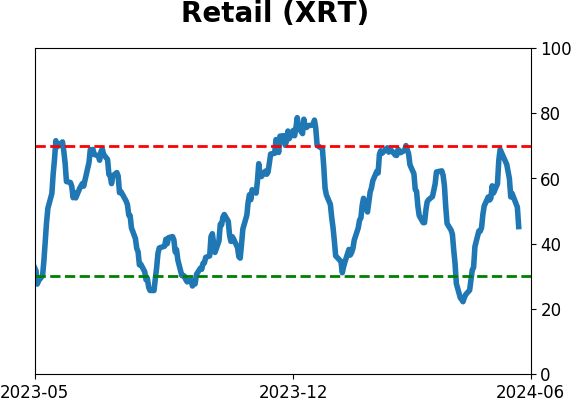
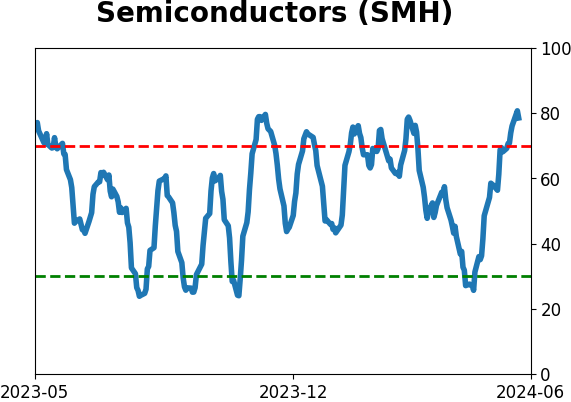
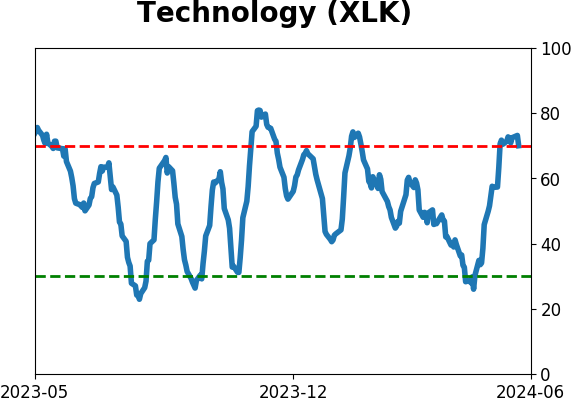
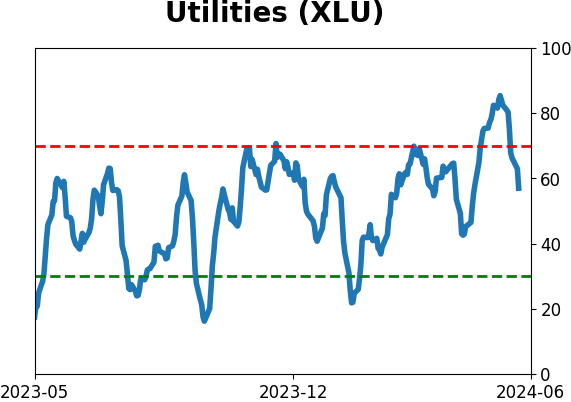
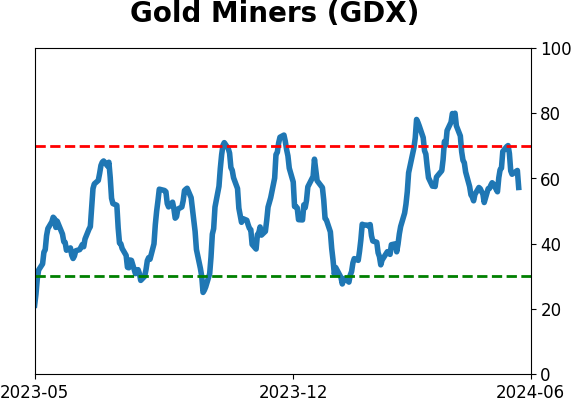
Sector ETF's - 10-Day Moving Average
|
|
|
Country ETF's - 10-Day Moving Average
|
|
|
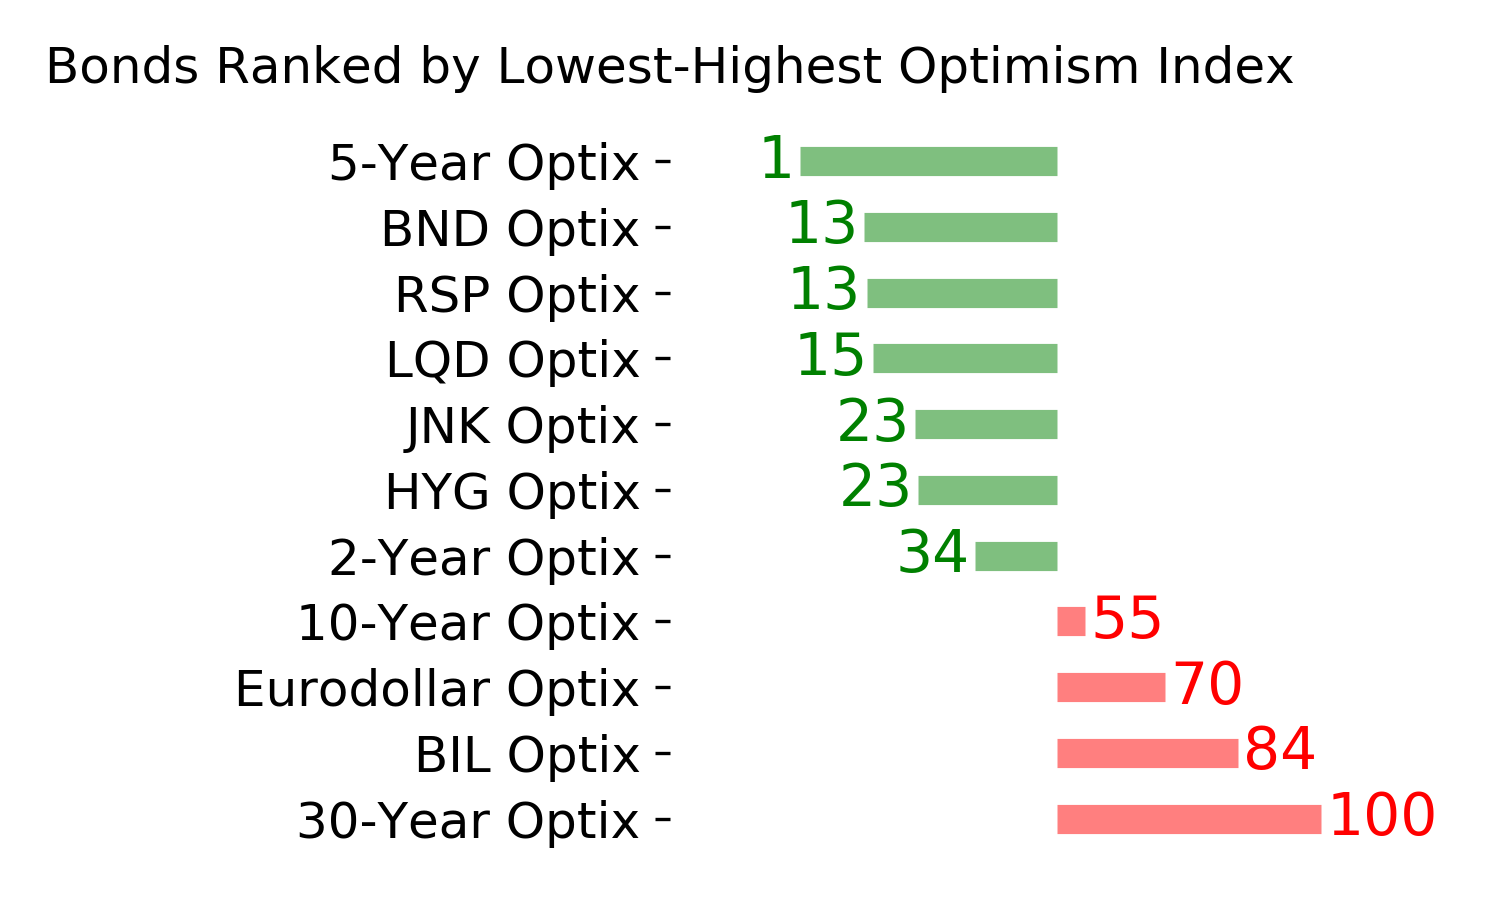
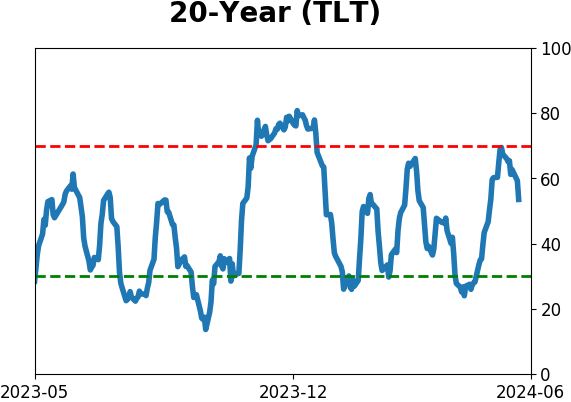
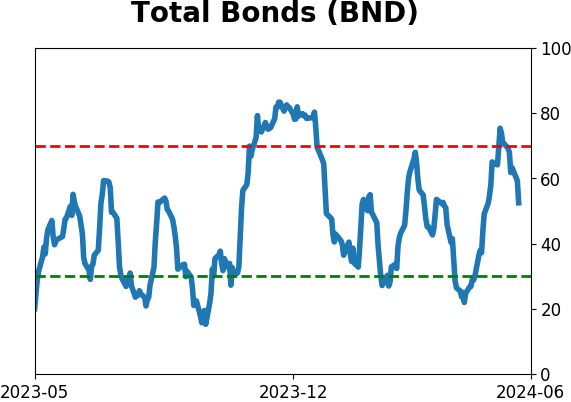
Bond ETF's - 10-Day Moving Average
|
|
|
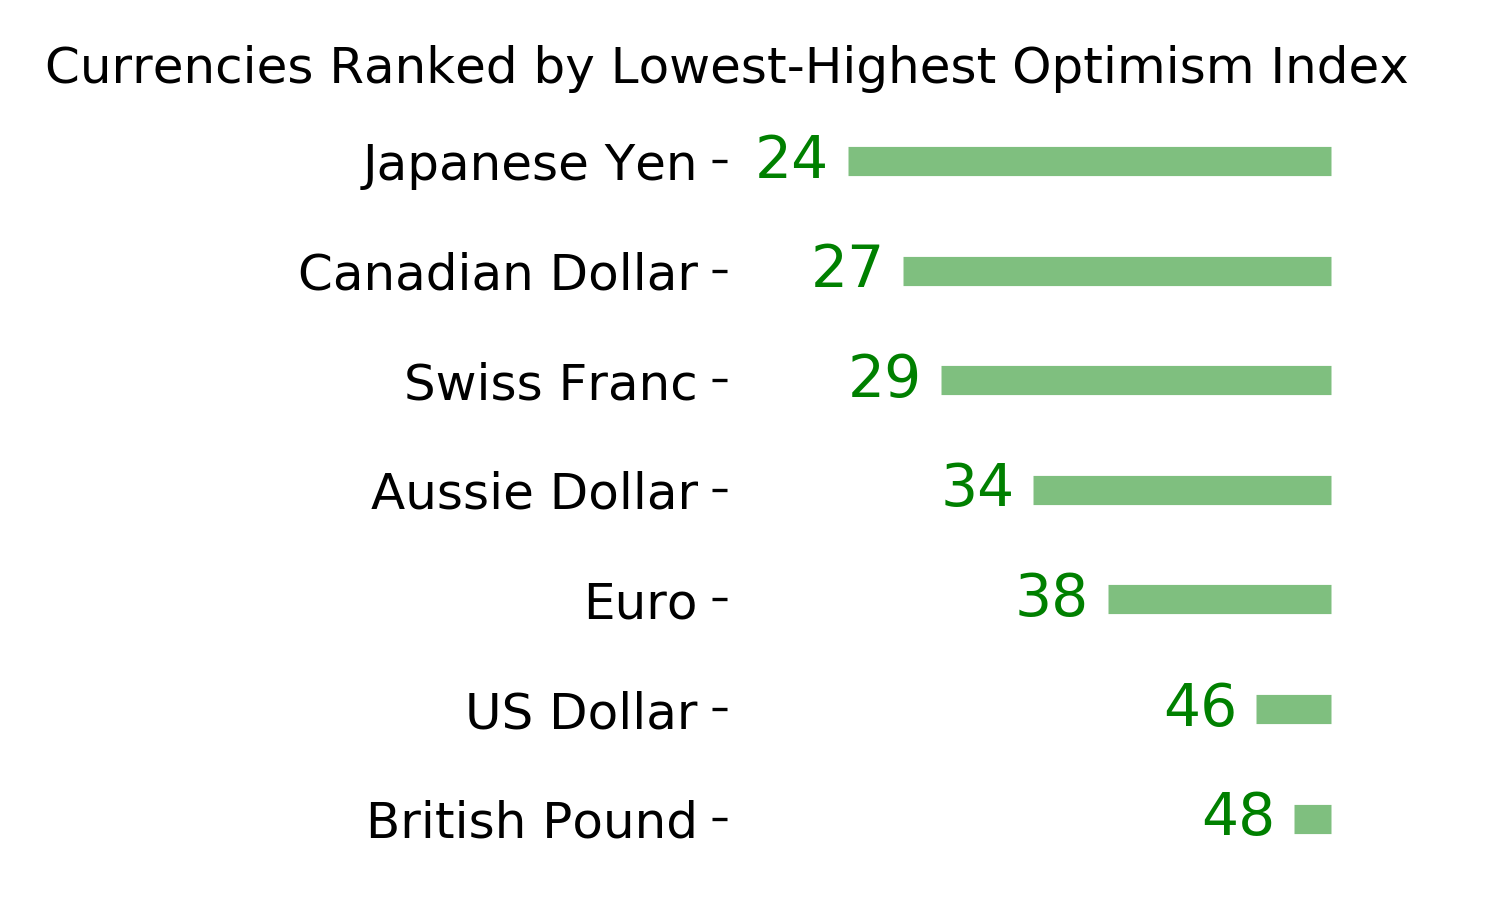
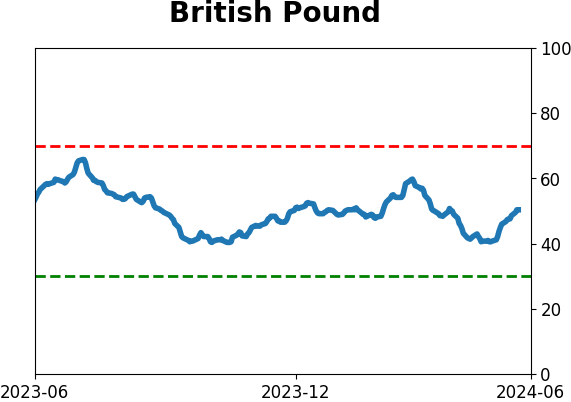
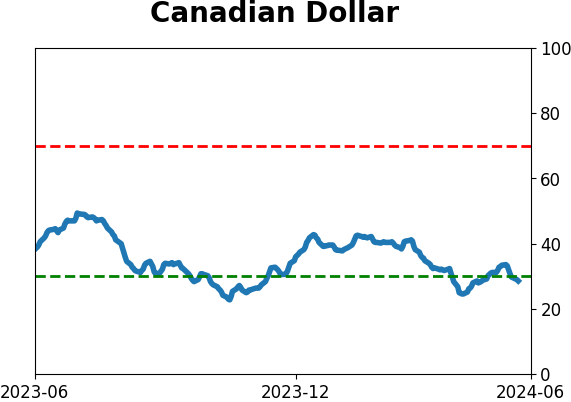
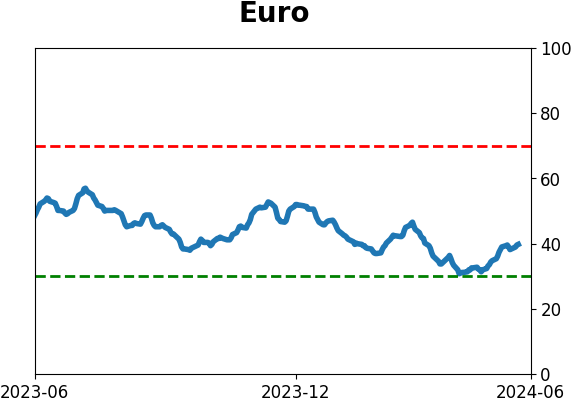
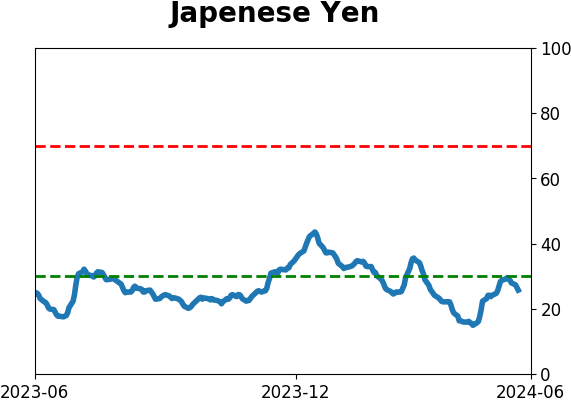
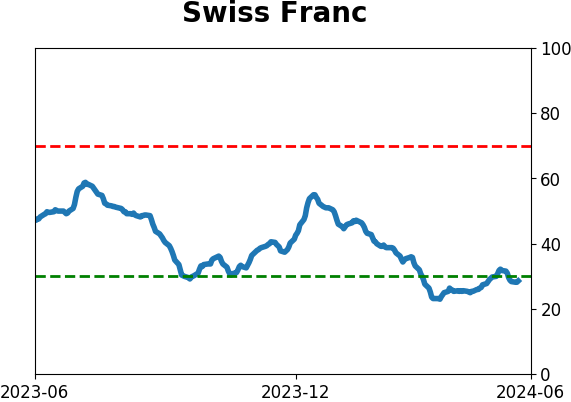
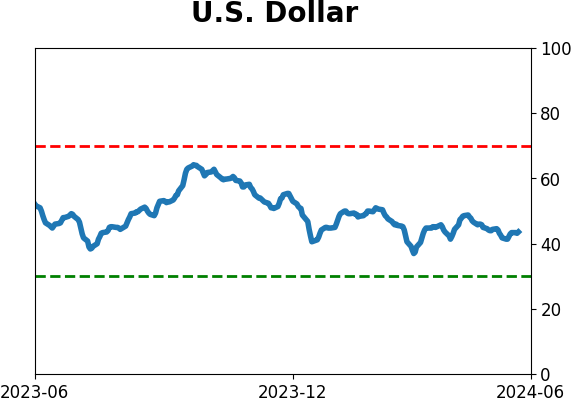
Currency ETF's - 5-Day Moving Average
|
|
|
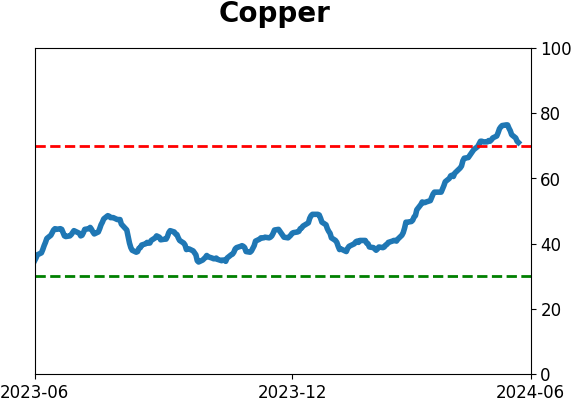
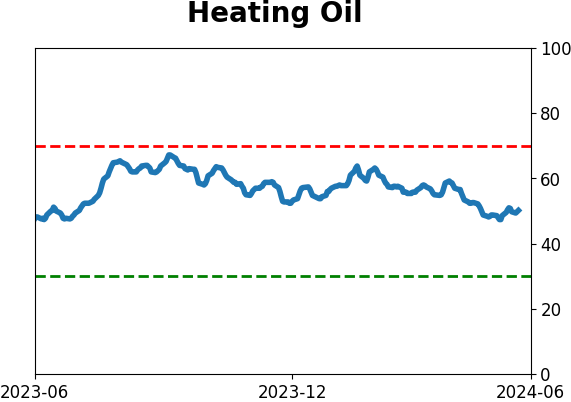
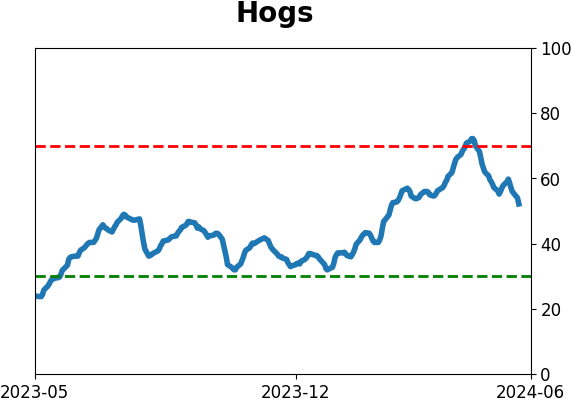
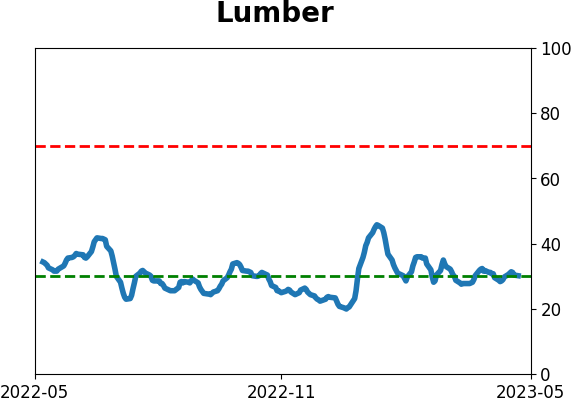
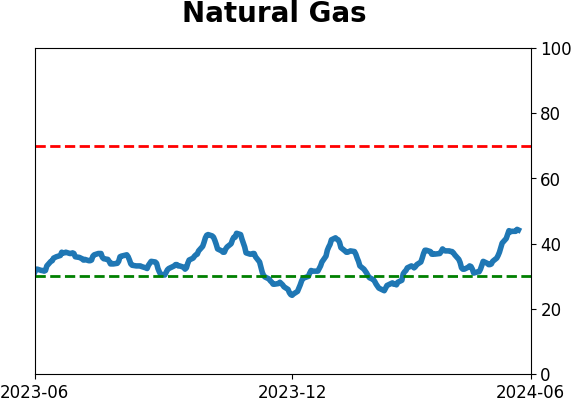
Commodity ETF's - 5-Day Moving Average
|
|