Headlines
|
|
Fewer stocks are going along for the Nasdaq 100's ride:
Even though the technology-heavy Nasdaq 100 has been hitting new highs, fewer and fewer stocks are going along for the ride. There is a stark divergence in the percentage of stocks holding above their 50- and 200-day moving averages. It looks ominous on a chart, but historically, most of the weakness in forward returns was confined to the next 1-3 months.
|
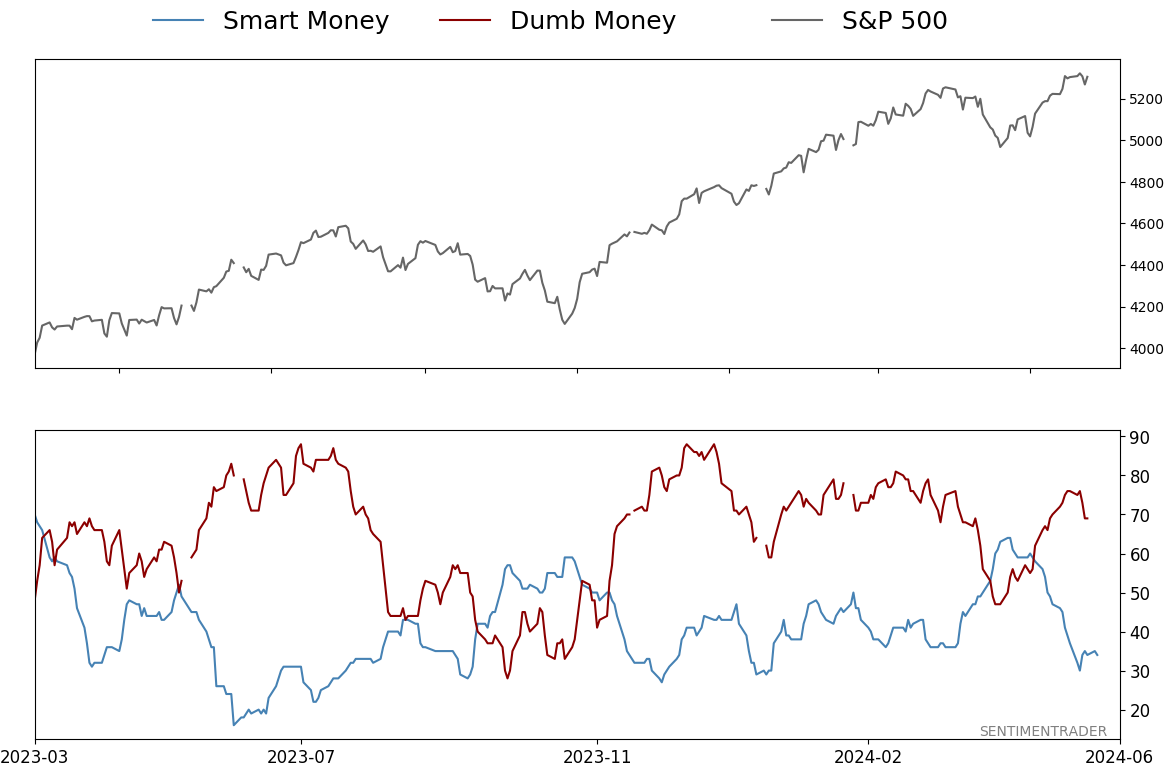
Smart / Dumb Money Confidence
|
Smart Money Confidence: 34%
Dumb Money Confidence: 69%
|
|
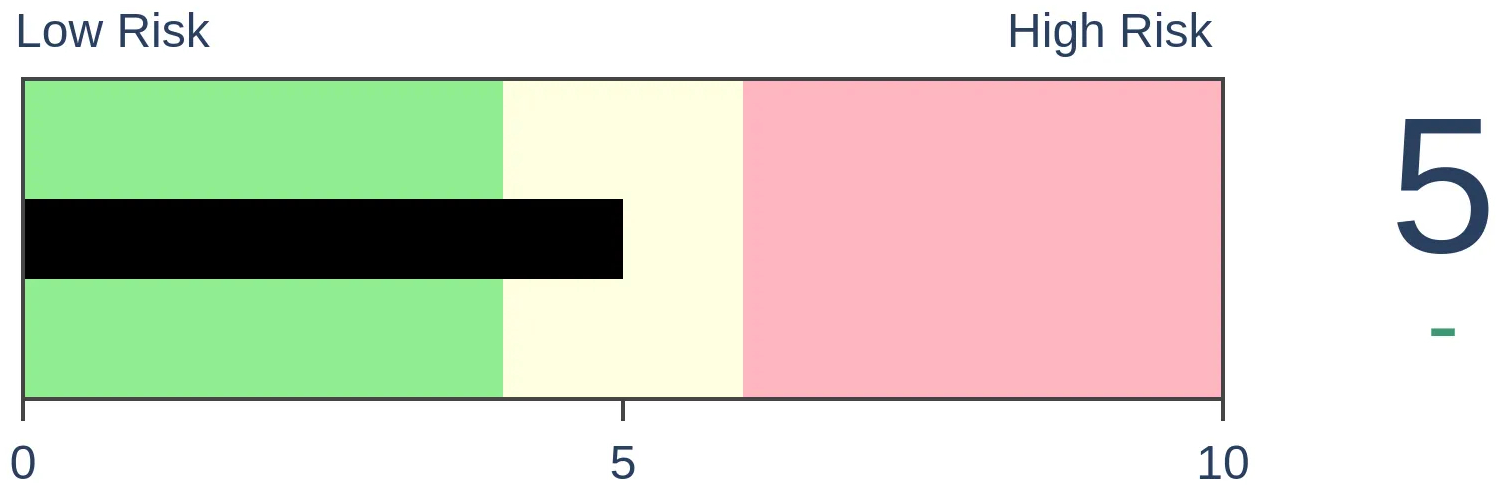
Risk Levels
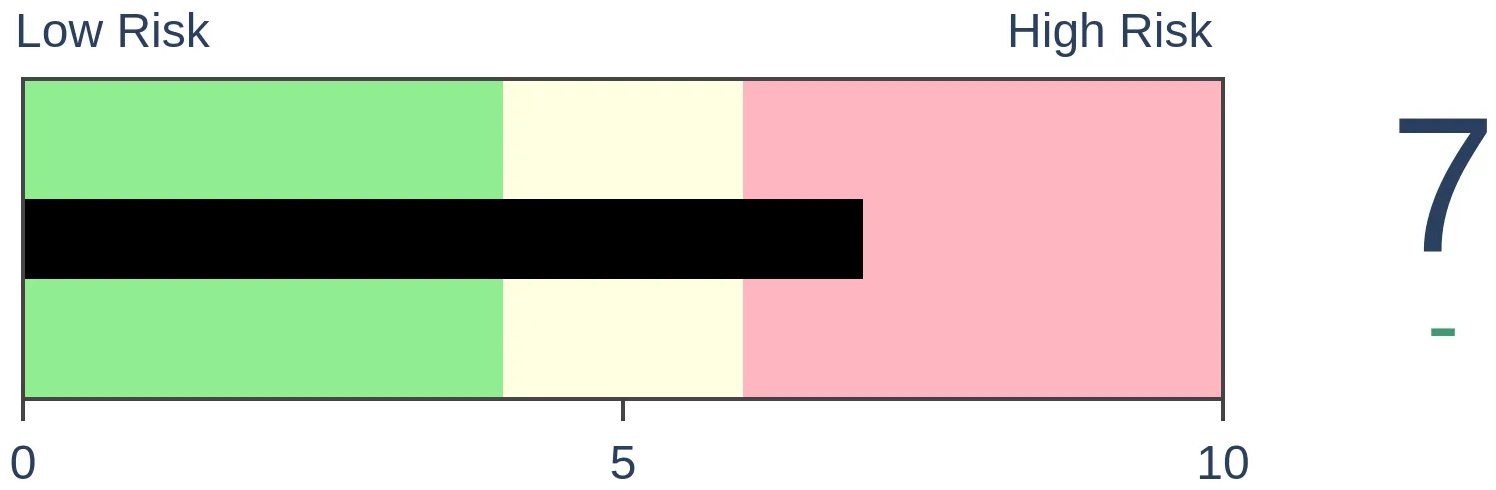
Stocks Short-Term
|
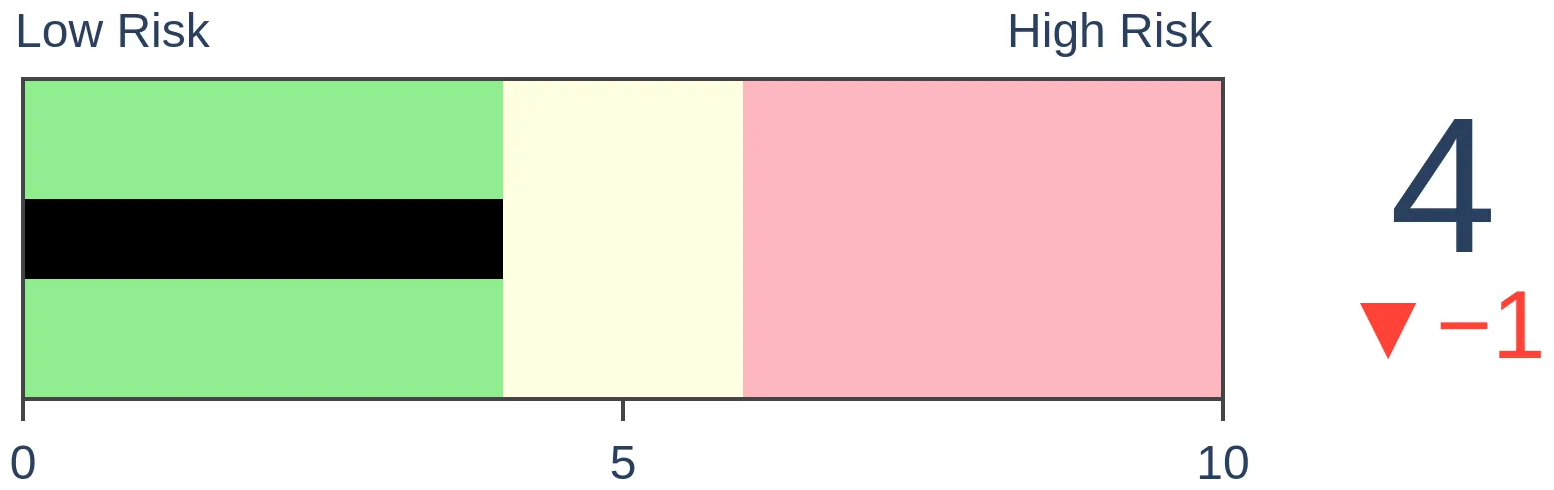
Stocks Medium-Term
|
|
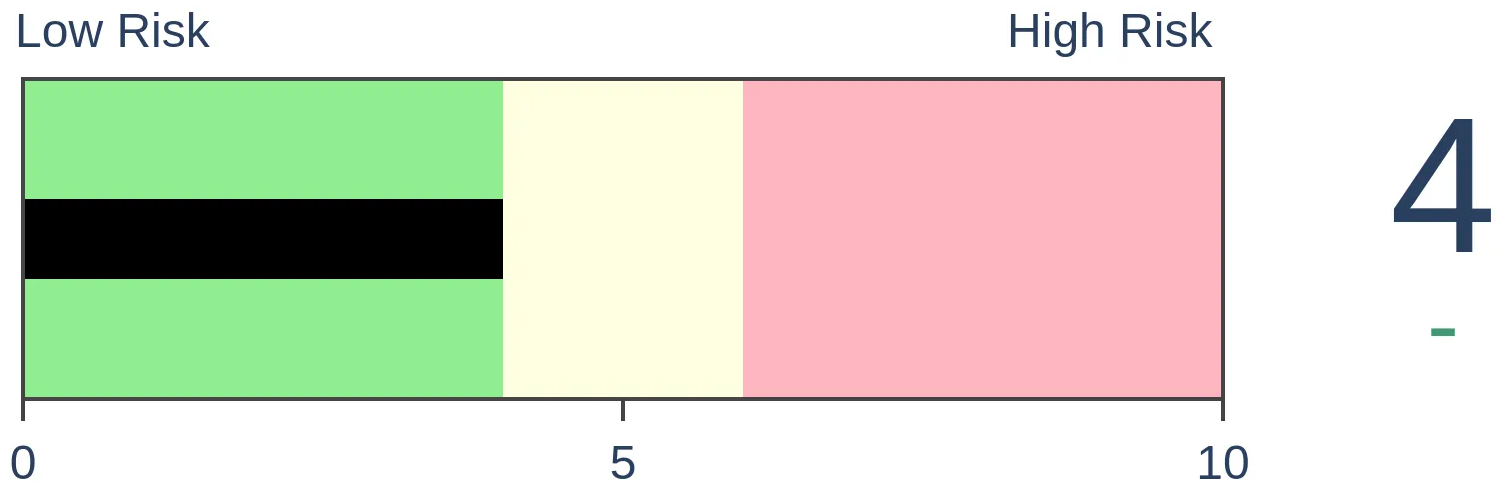
Bonds
|
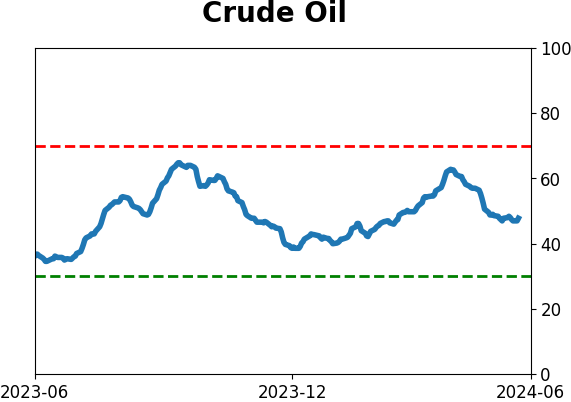
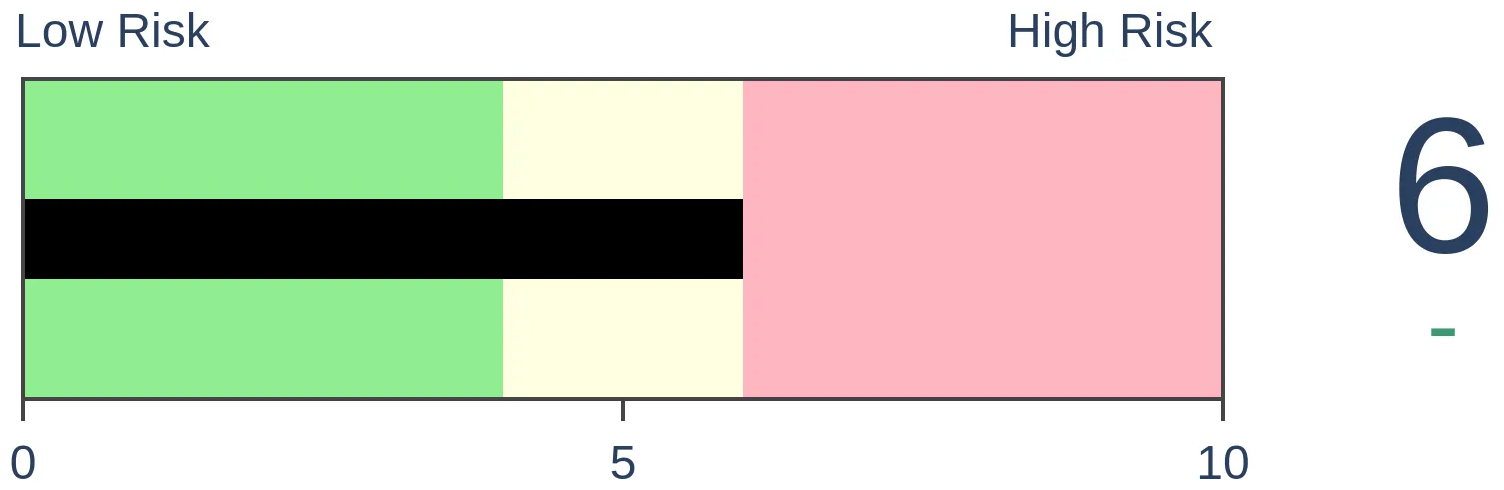
Crude Oil
|
|
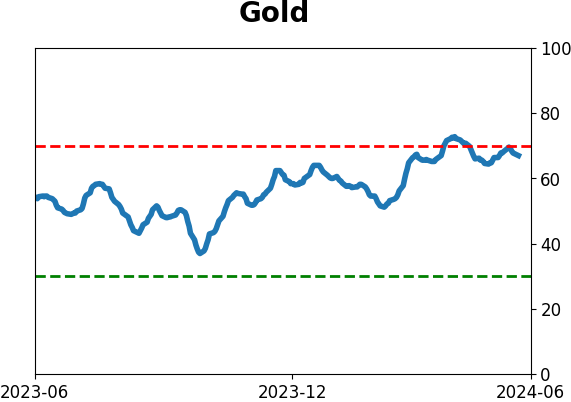
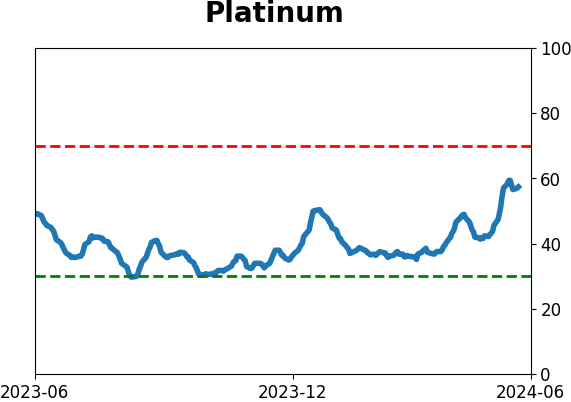
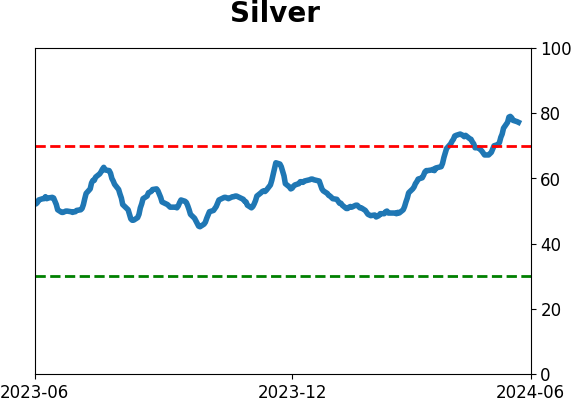
Gold
|
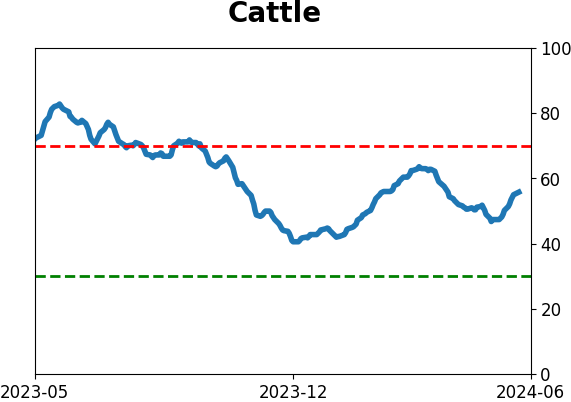
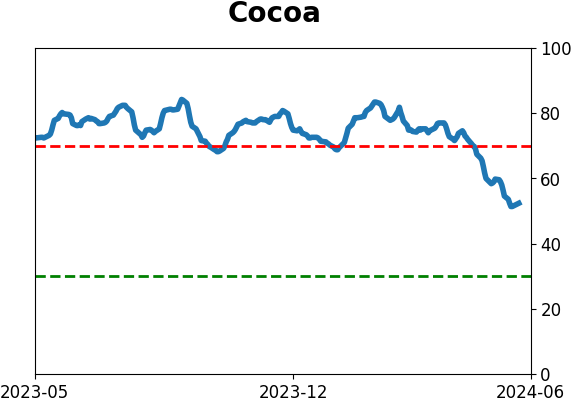
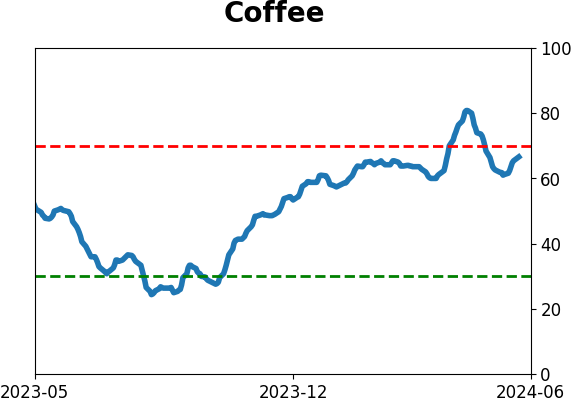
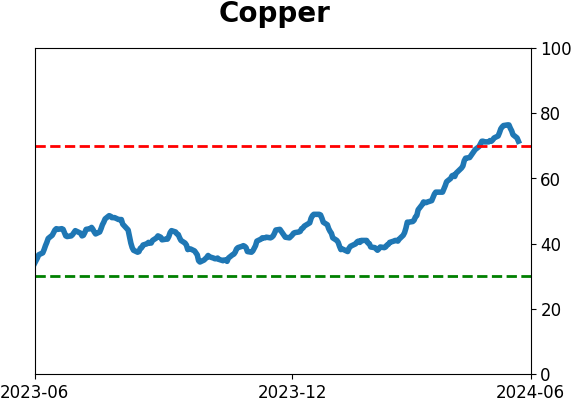
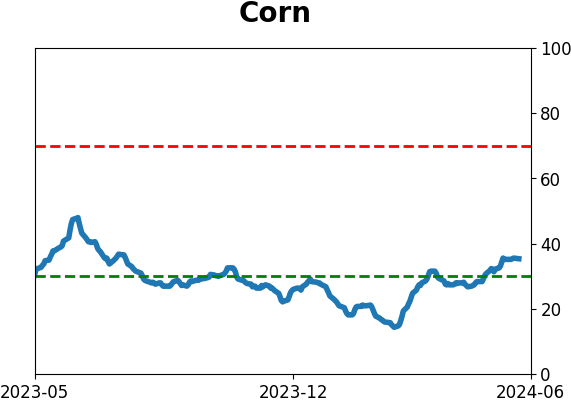
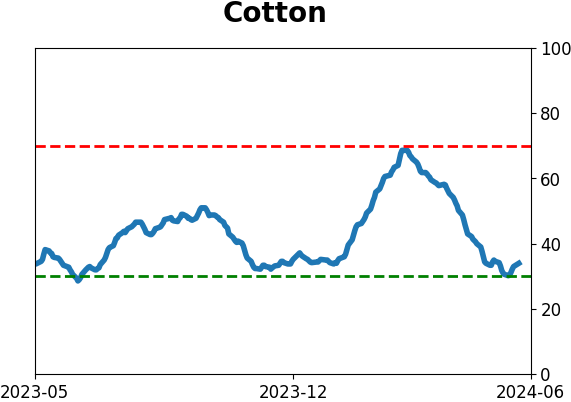
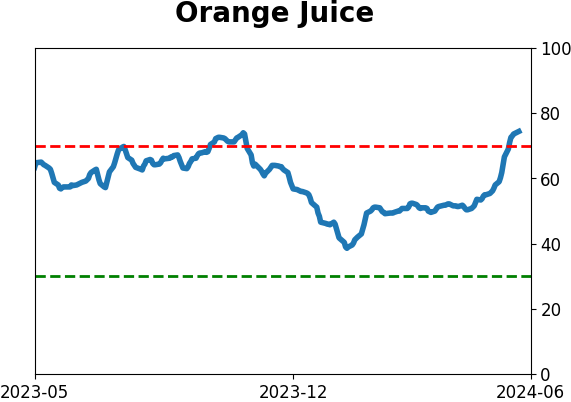
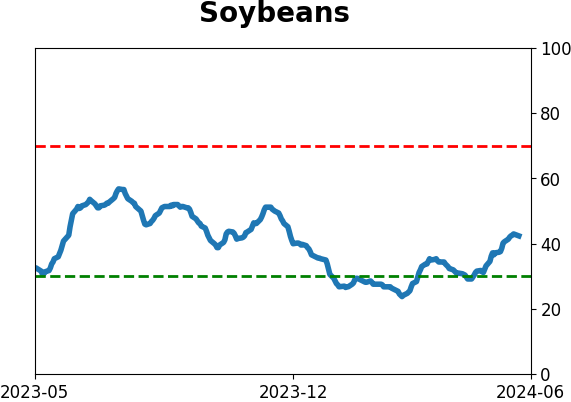
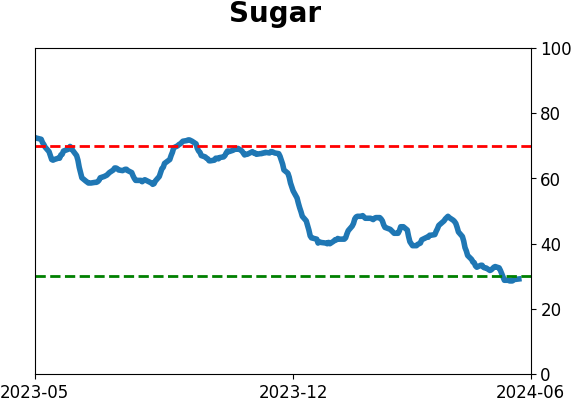
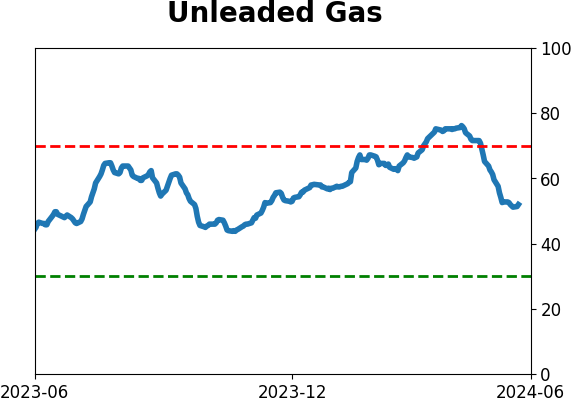
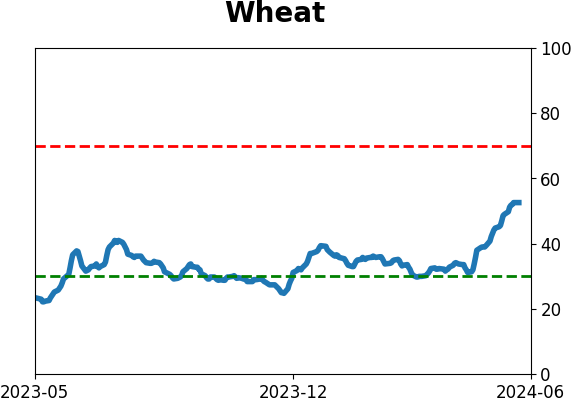
Agriculture

|
|
Research
By Jason Goepfert
BOTTOM LINE
Even though the technology-heavy Nasdaq 100 has been hitting new highs, fewer and fewer stocks are going along for the ride. There is a stark divergence in the percentage of stocks holding above their 50- and 200-day moving averages. It looks ominous on a chart, but historically, most of the weakness in forward returns was confined to the next 1-3 months.
FORECAST / TIMEFRAME
None
|
Key points:
- The Nasdaq 100 is hitting new highs, but drastically fewer stocks are holding above their 50-day moving averages
- Fewer and fewer stocks are holding above their long-term 200-day moving averages, too
- Similar divergences look bad on a (cherry-picked) chart, but historically, the only consistent weakness was over the next 1-3 months
Fewer stocks along for the ride
The major indices have been holding up well, and a major reason is the continued dominance of a handful of enormous technology stocks.
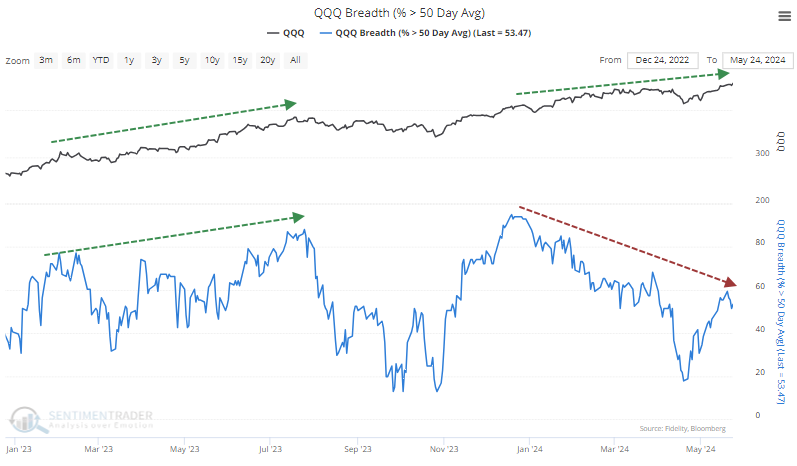
Even though the primary big-tech index, the Nasdaq 100 (NDX), has recovered to all-time highs, fewer and fewer members of that index have enjoyed the ride along with it. As of last week, fewer than 60% of stocks in the NDX were holding above their 50-day moving averages, a dramatic change from earlier in the year. This trend starkly differs from what we saw at this time last year.
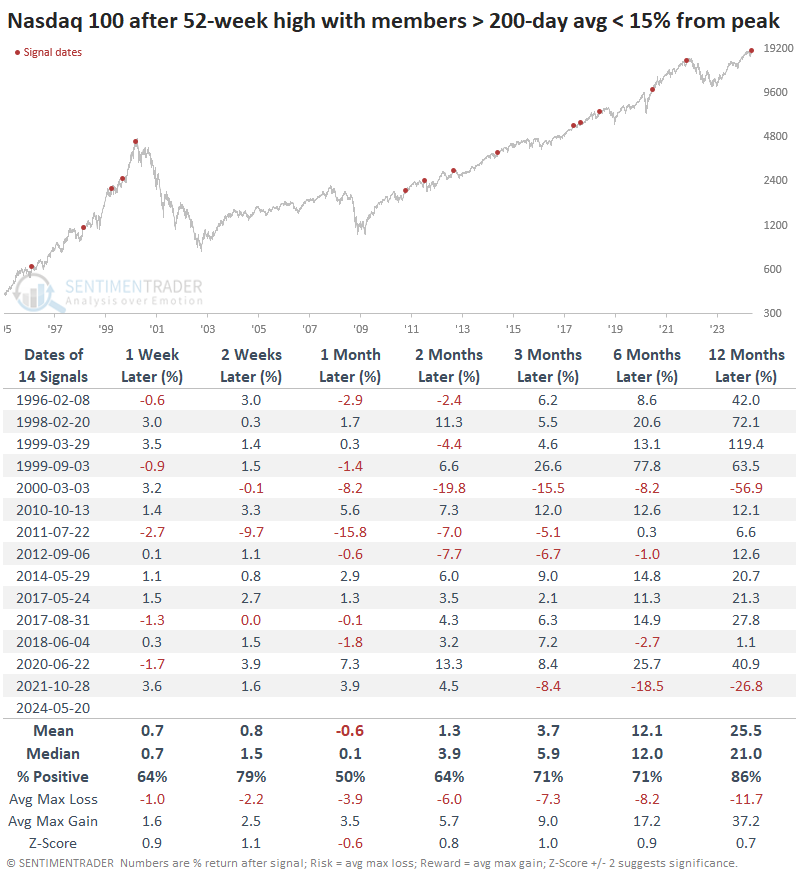
Over the past 30 years, there have been a handful of times when the NDX hit a 52-week high, and the percentage of its member stocks holding above their 50-day averages was at least 30% below the peak reading over the past six months. In other words, these are times when the index was hitting fresh highs, yet there was a drastic decline in the number of stocks maintaining their medium-term uptrends.
Similar divergences showed no ill effect on short-term returns. But over the next two to three months, the NDX did lose some steam. All but one instance suffered a negative return either two or three months later. However, a year later, they all showed gains; all but one were double-digits.
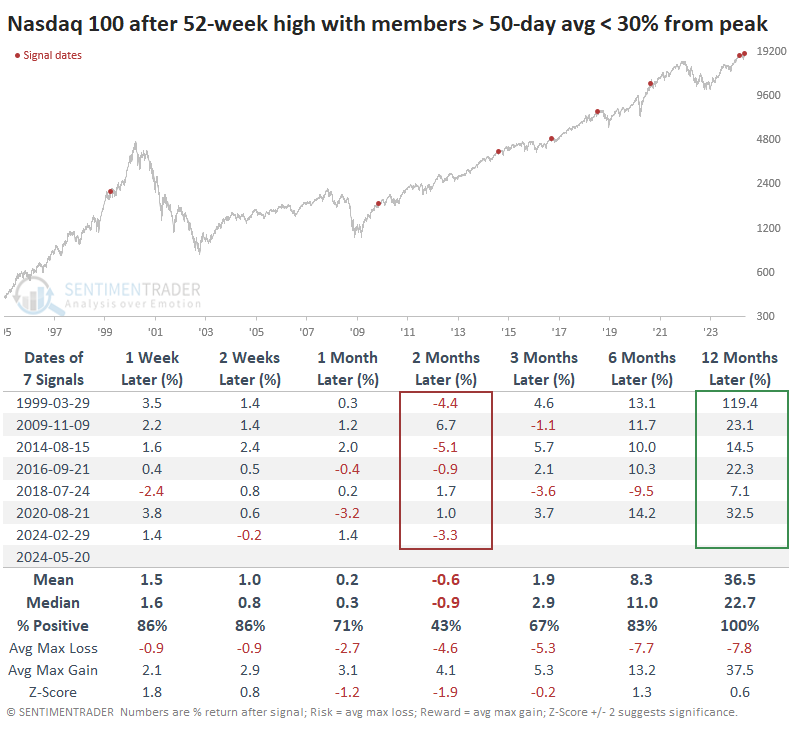
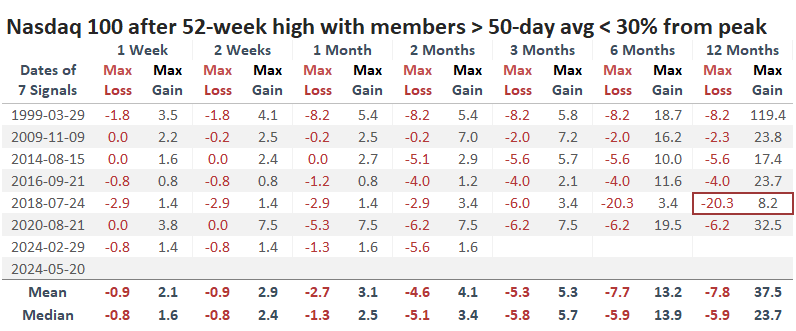
Perhaps most notably, maximum losses were constrained. Only the decline into the winter of 2018 showed more than a double-digit drawdown at any point within the following year.
Longer-term trends are flailing, too
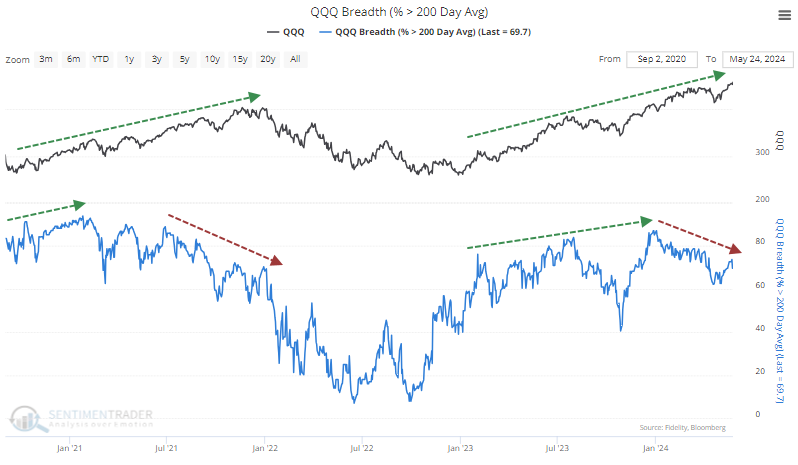
It's not just medium-term trends that are showing some weakness. Fewer and fewer stocks are also trading above their long-term 200-day moving averages. This is somewhat similar to the activity leading up to the 2021 peak.
During that bull market's beginning and middle stages, more and more stocks were in long-term uptrends. As the trend matured in late 2021, this dropped significantly - more so than we're seeing now, but it's a similar pattern.
Divergences like this can persist for many months before they have an impact (if they ever do). It's easy in hindsight to pick them out on a chart; it's much more difficult in real-time to determine if they're a legitimate cause for concern.
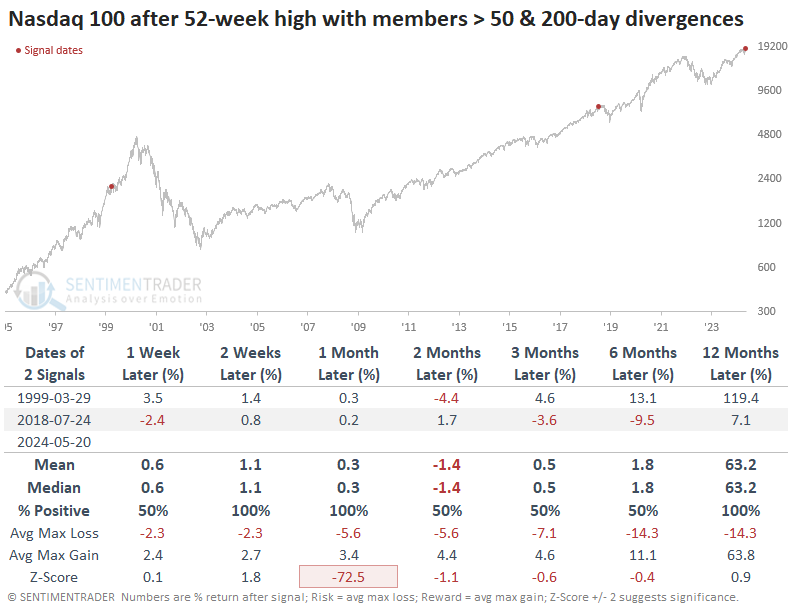
All we can do is go with what we know right now. The table below shows these scenarios when the NDX was hitting new highs, but its members holding above their long-term trendlines were diverging at least 15% from their peak level over the past six months. And the NDX's forward returns weren't too terrible - a bit weak over the next month, and a few double-digit losses sprinkled across various time frames. But nothing was consistently compelling enough here to suggest it's a reliable sell signal.
It's perhaps notable that this is one of the very few times in the past 30 years when both medium- and long-term divergences were in effect simultaneously. The others were in 1999 and 2018, which are inauspicious dates for anyone investing at either time.
But it's also worth noting that the 1999 divergences triggered well before the peak - and before a triple-digit rally ahead of that peak. In 2018, it also took a couple of months before the index peaked, and the decline was painful, but even so, the NDX sported a gain a year later and then kept going.
What the research tells us...
We've used divergences in various forms many times over the past 20+ years to highlight times of potential risk and reward. They can be effective, but not if we use perfect hindsight to draw lines on a chart. We have to use the information we have at the time and try to be objective about whether it's an effective measure to manage our exposure.
Most of the time, it's not. And it appears this time is no different. While the divergence between the Nasdaq 100 and its member stocks is stark, and seems obviously worrisome, history hasn't been too clear. The index often drags individual stocks higher instead of the stocks dragging the index lower. The medium-term time frame of 1-3 months has been the one most subject to consistent weakness, so for now, that's about the most damaging thing we could say about these divergences. There are other worries, however, as we'll discuss on Wednesday.
Indicators at Extremes
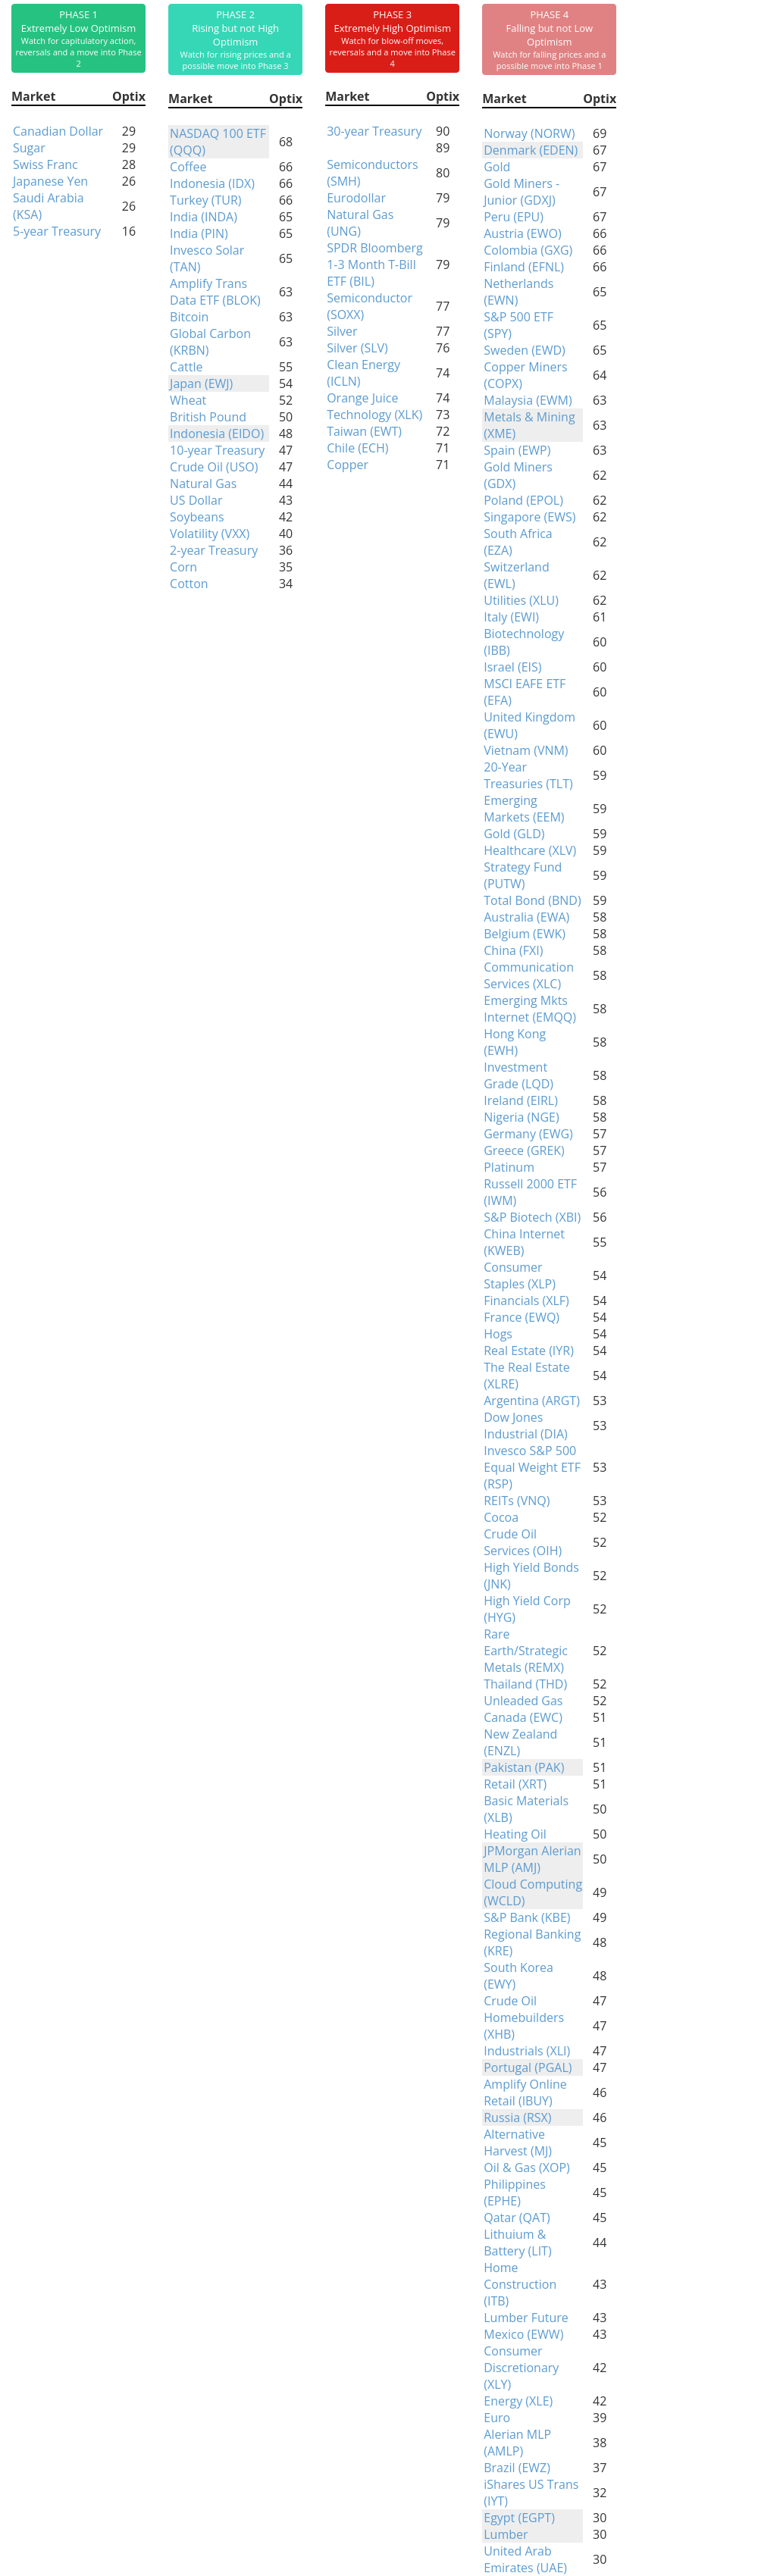
Phase Table
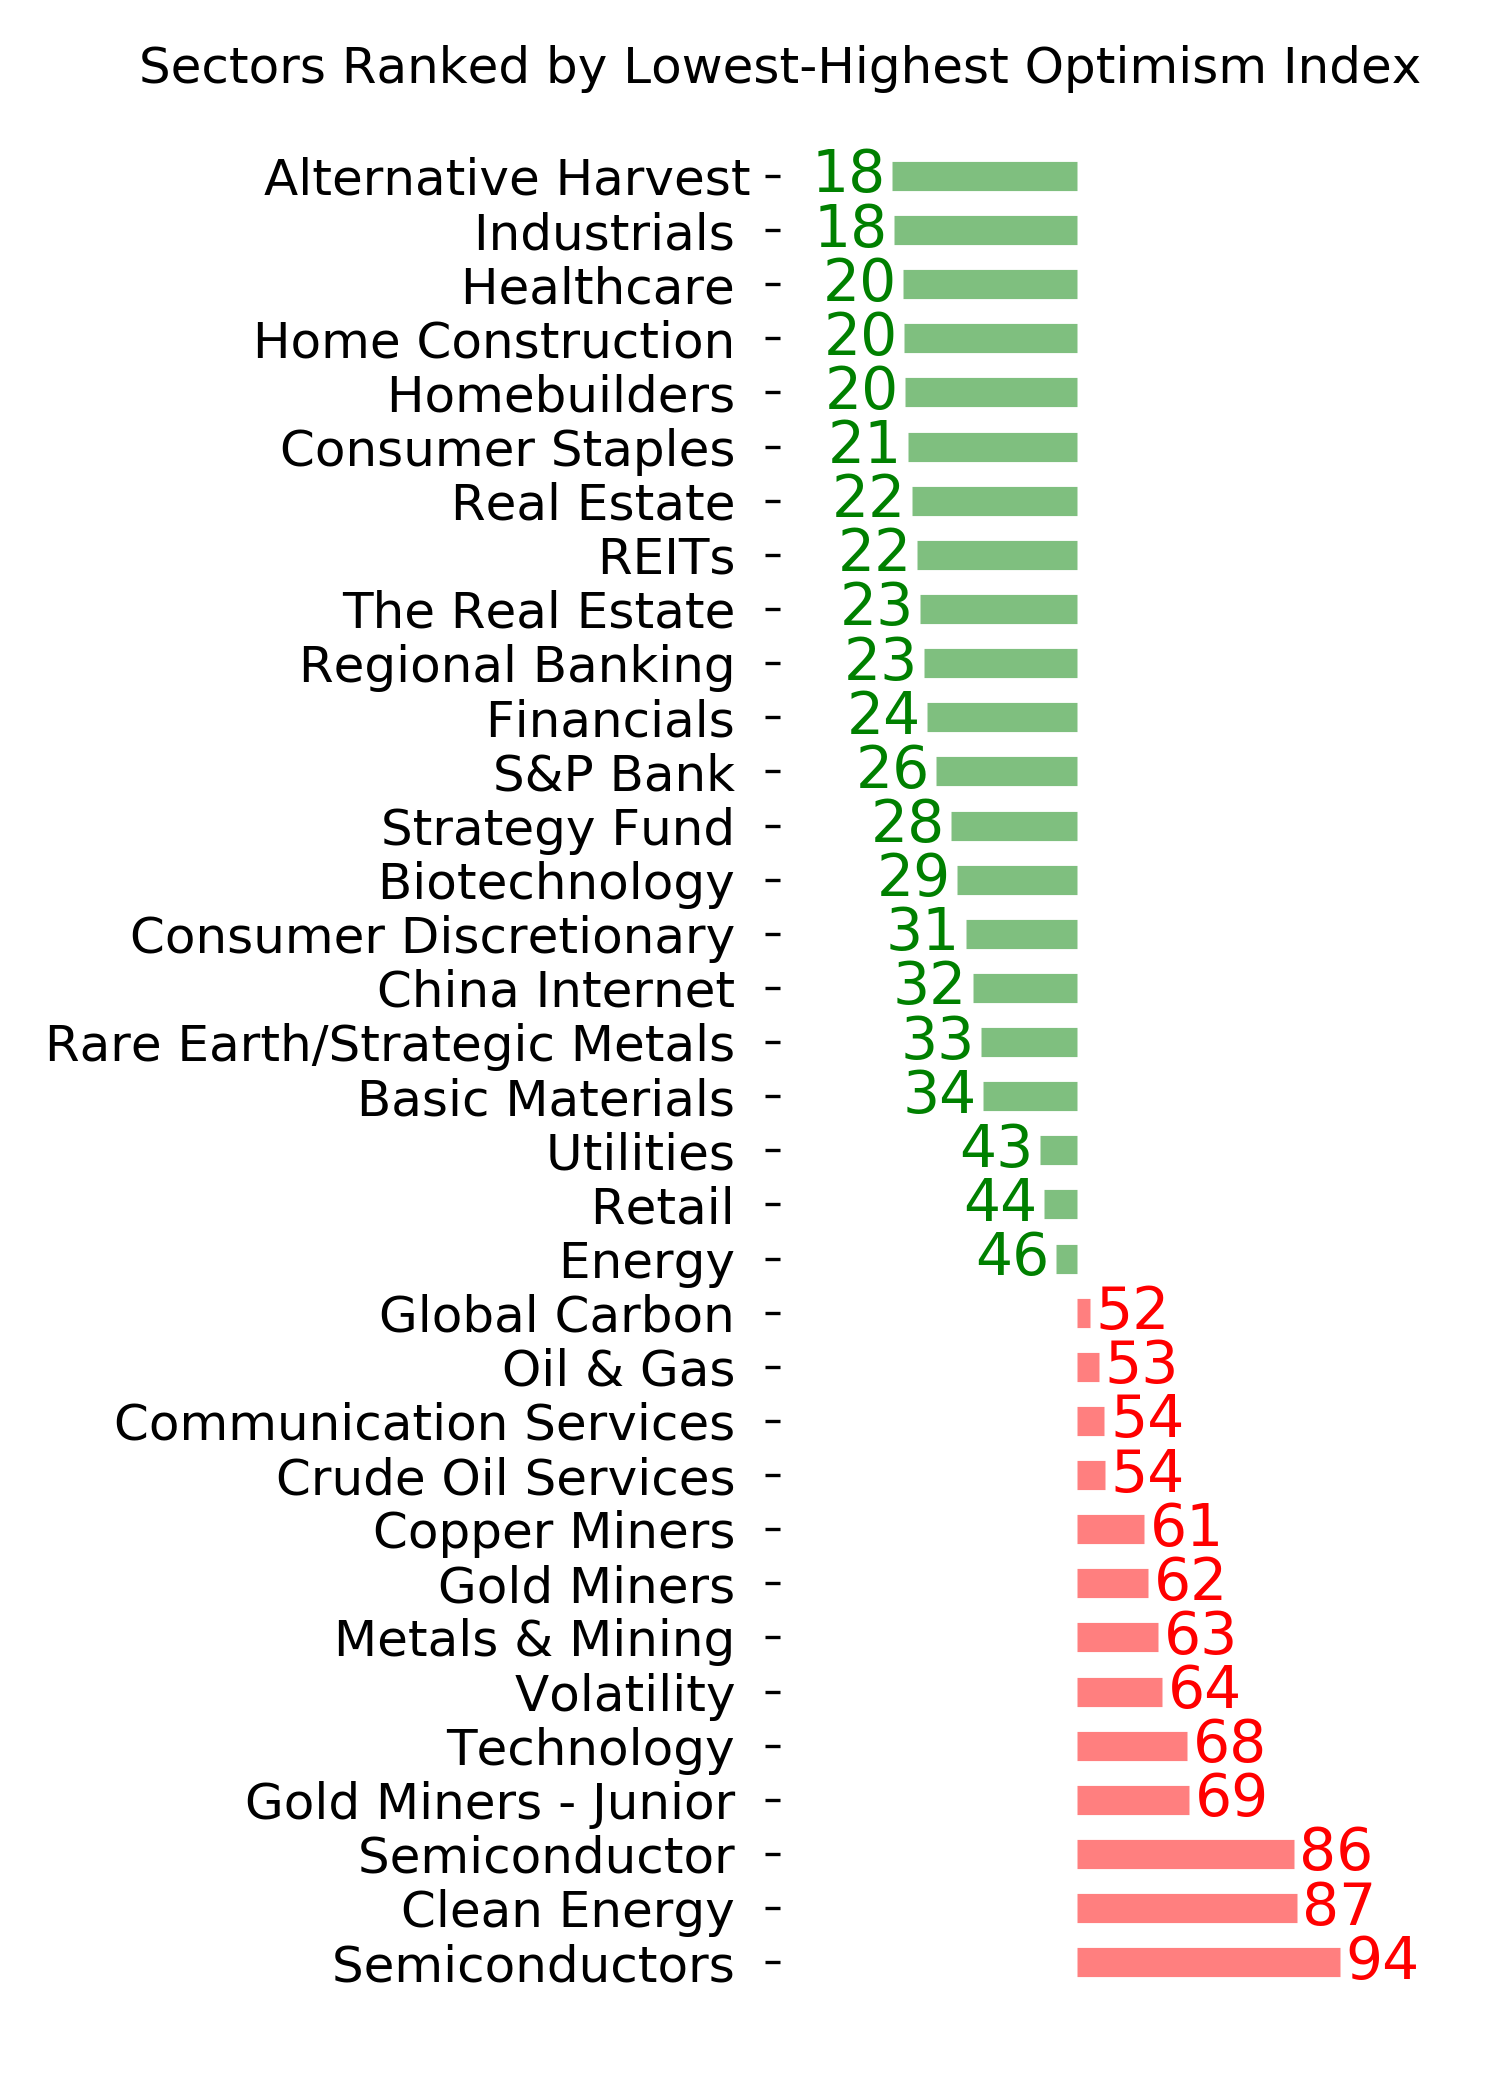
Ranks
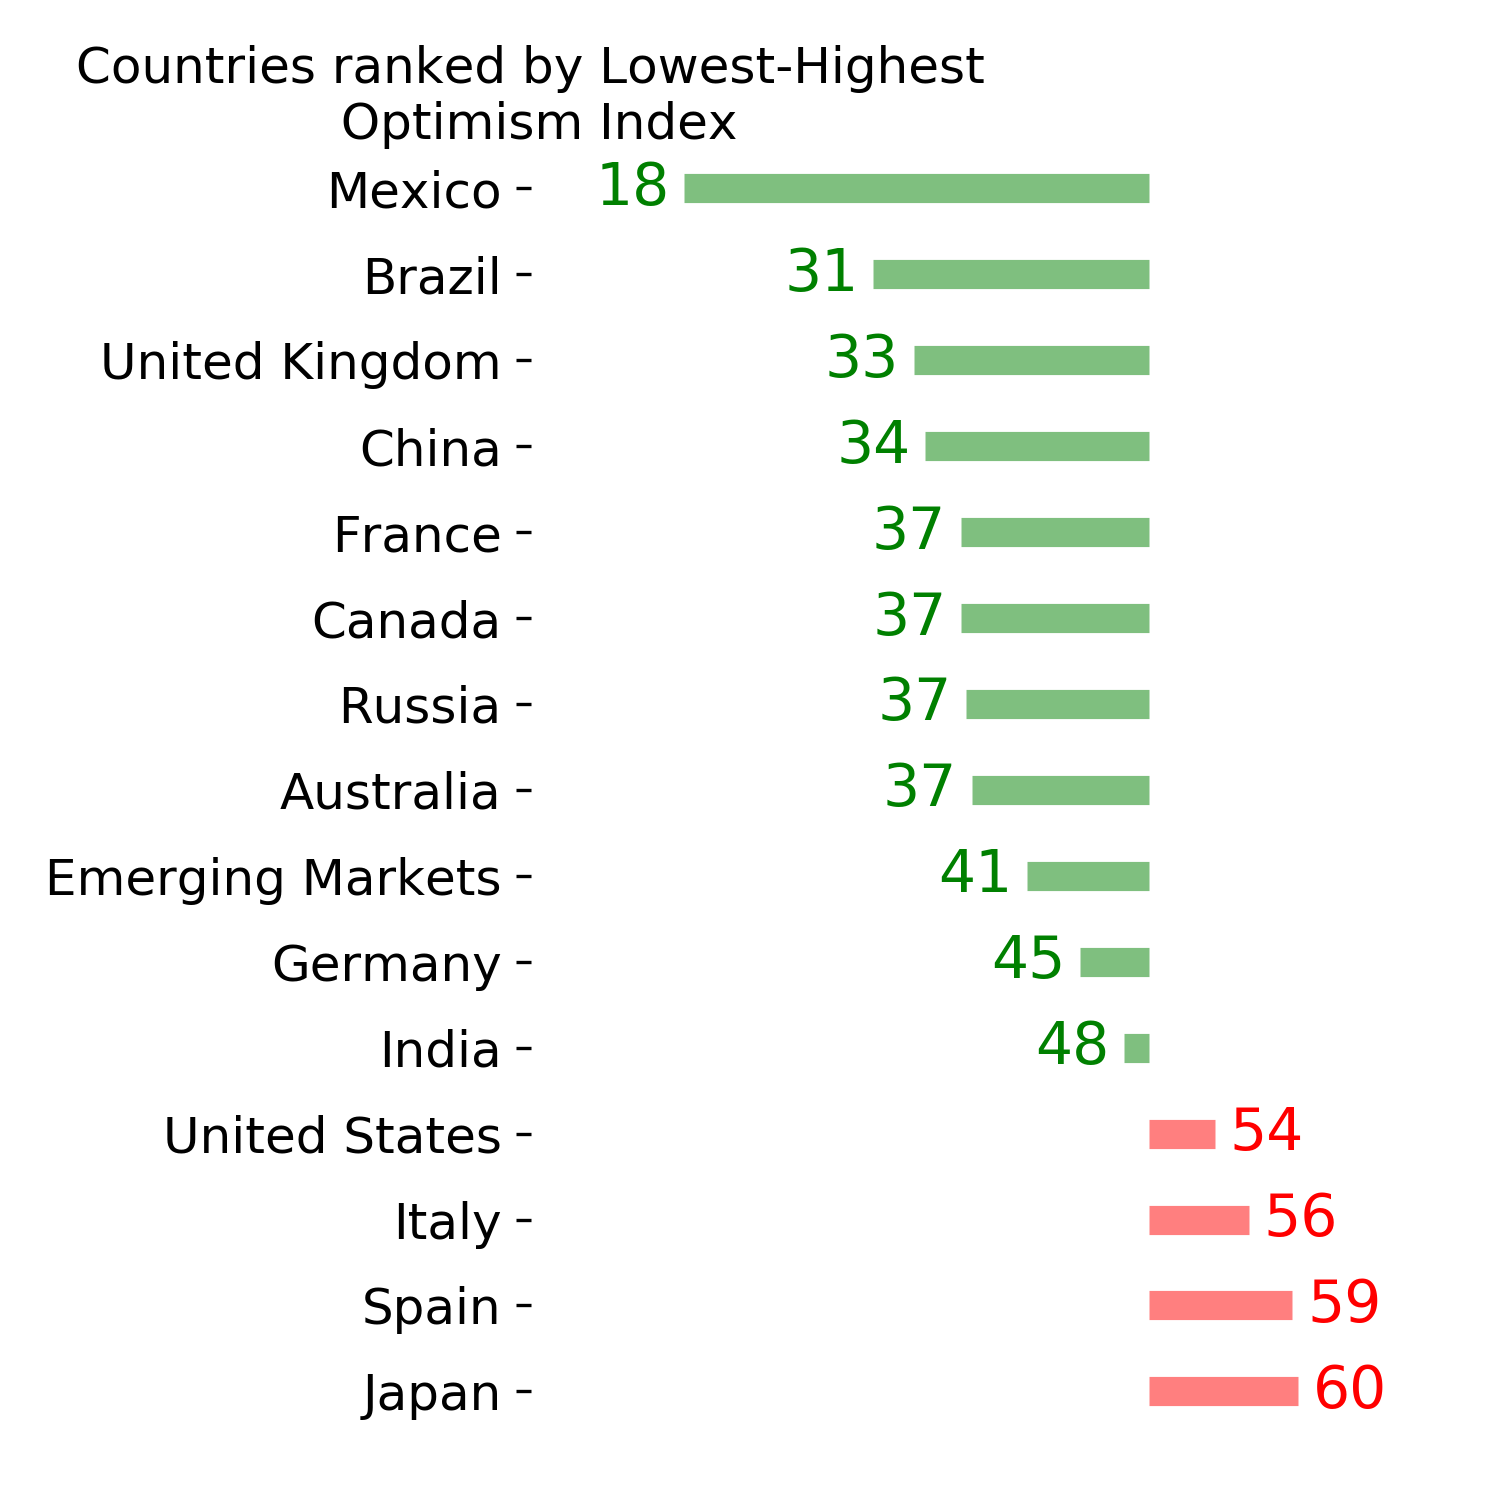
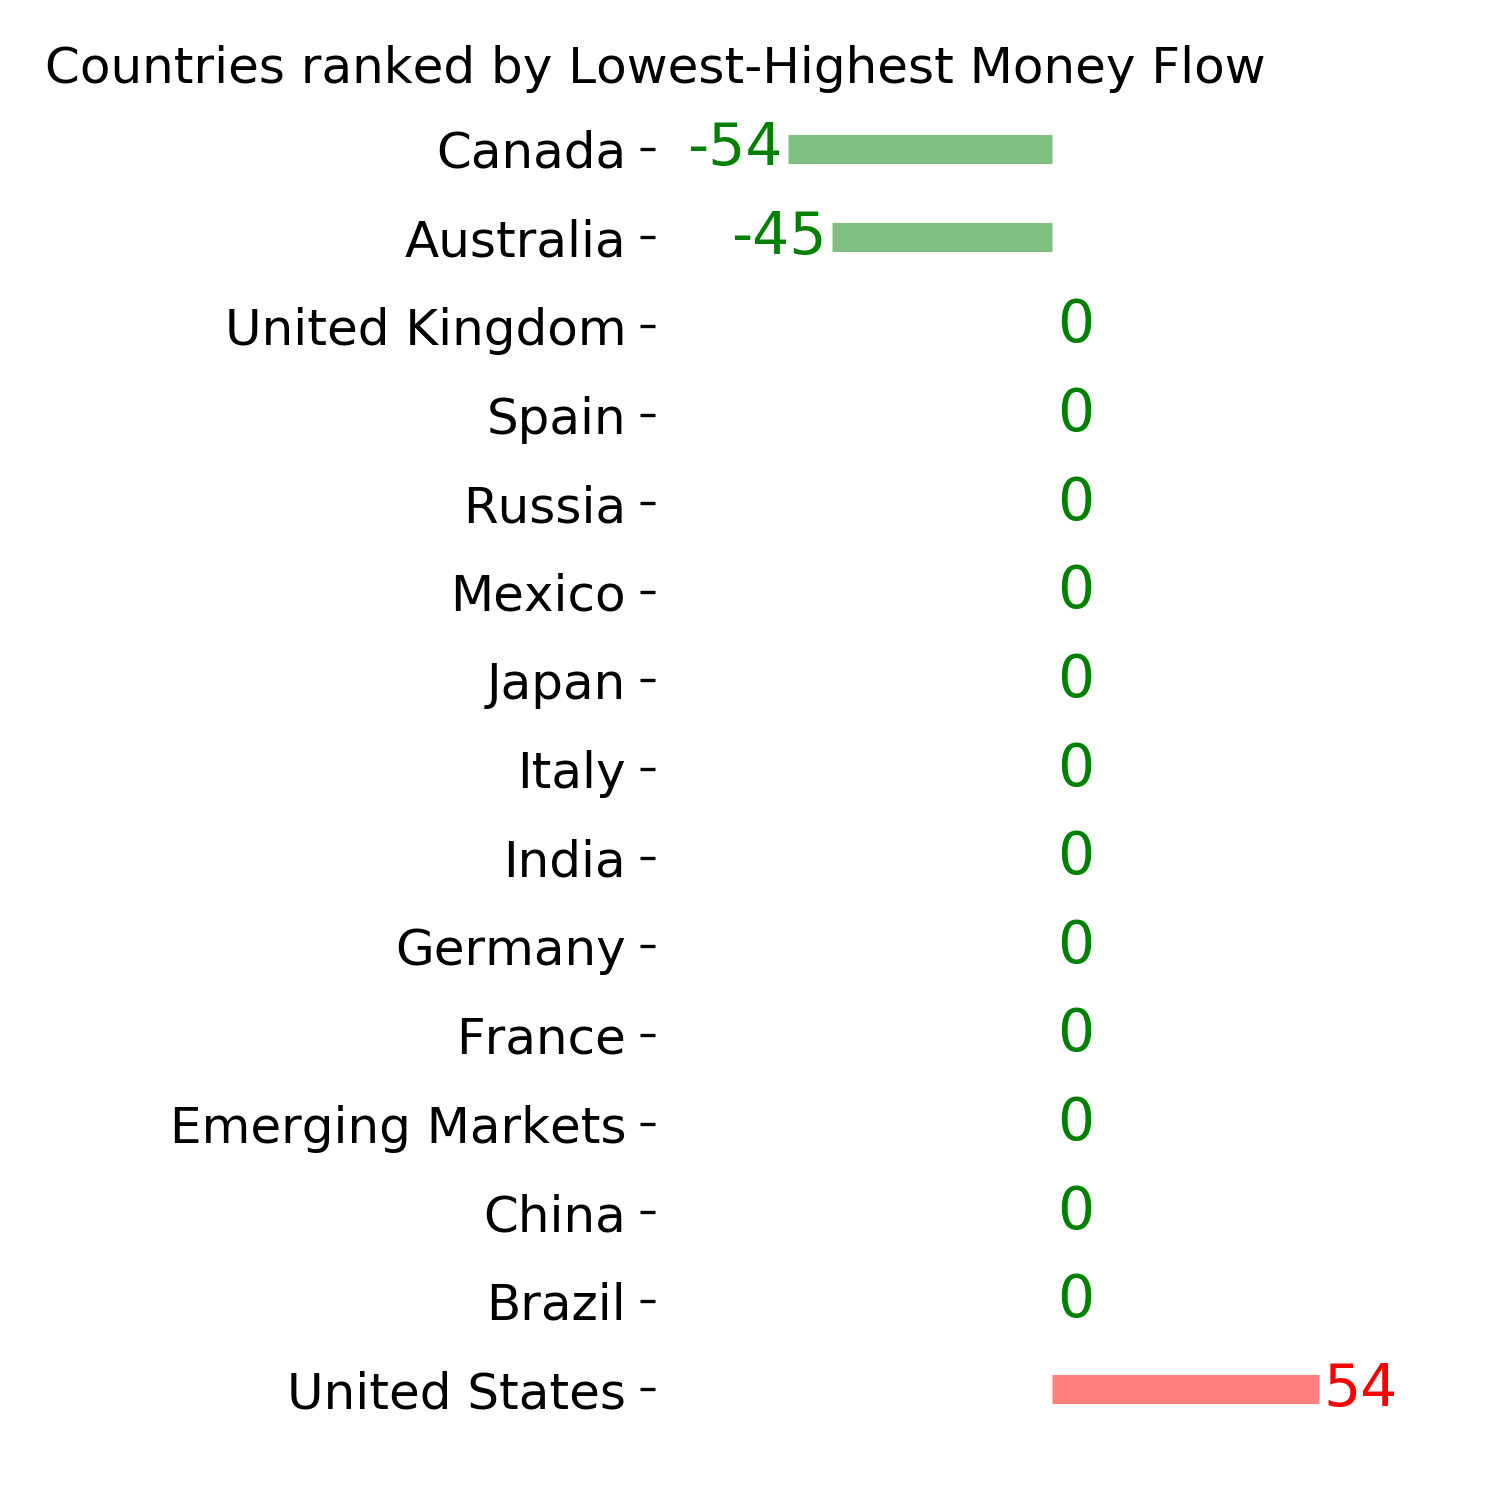
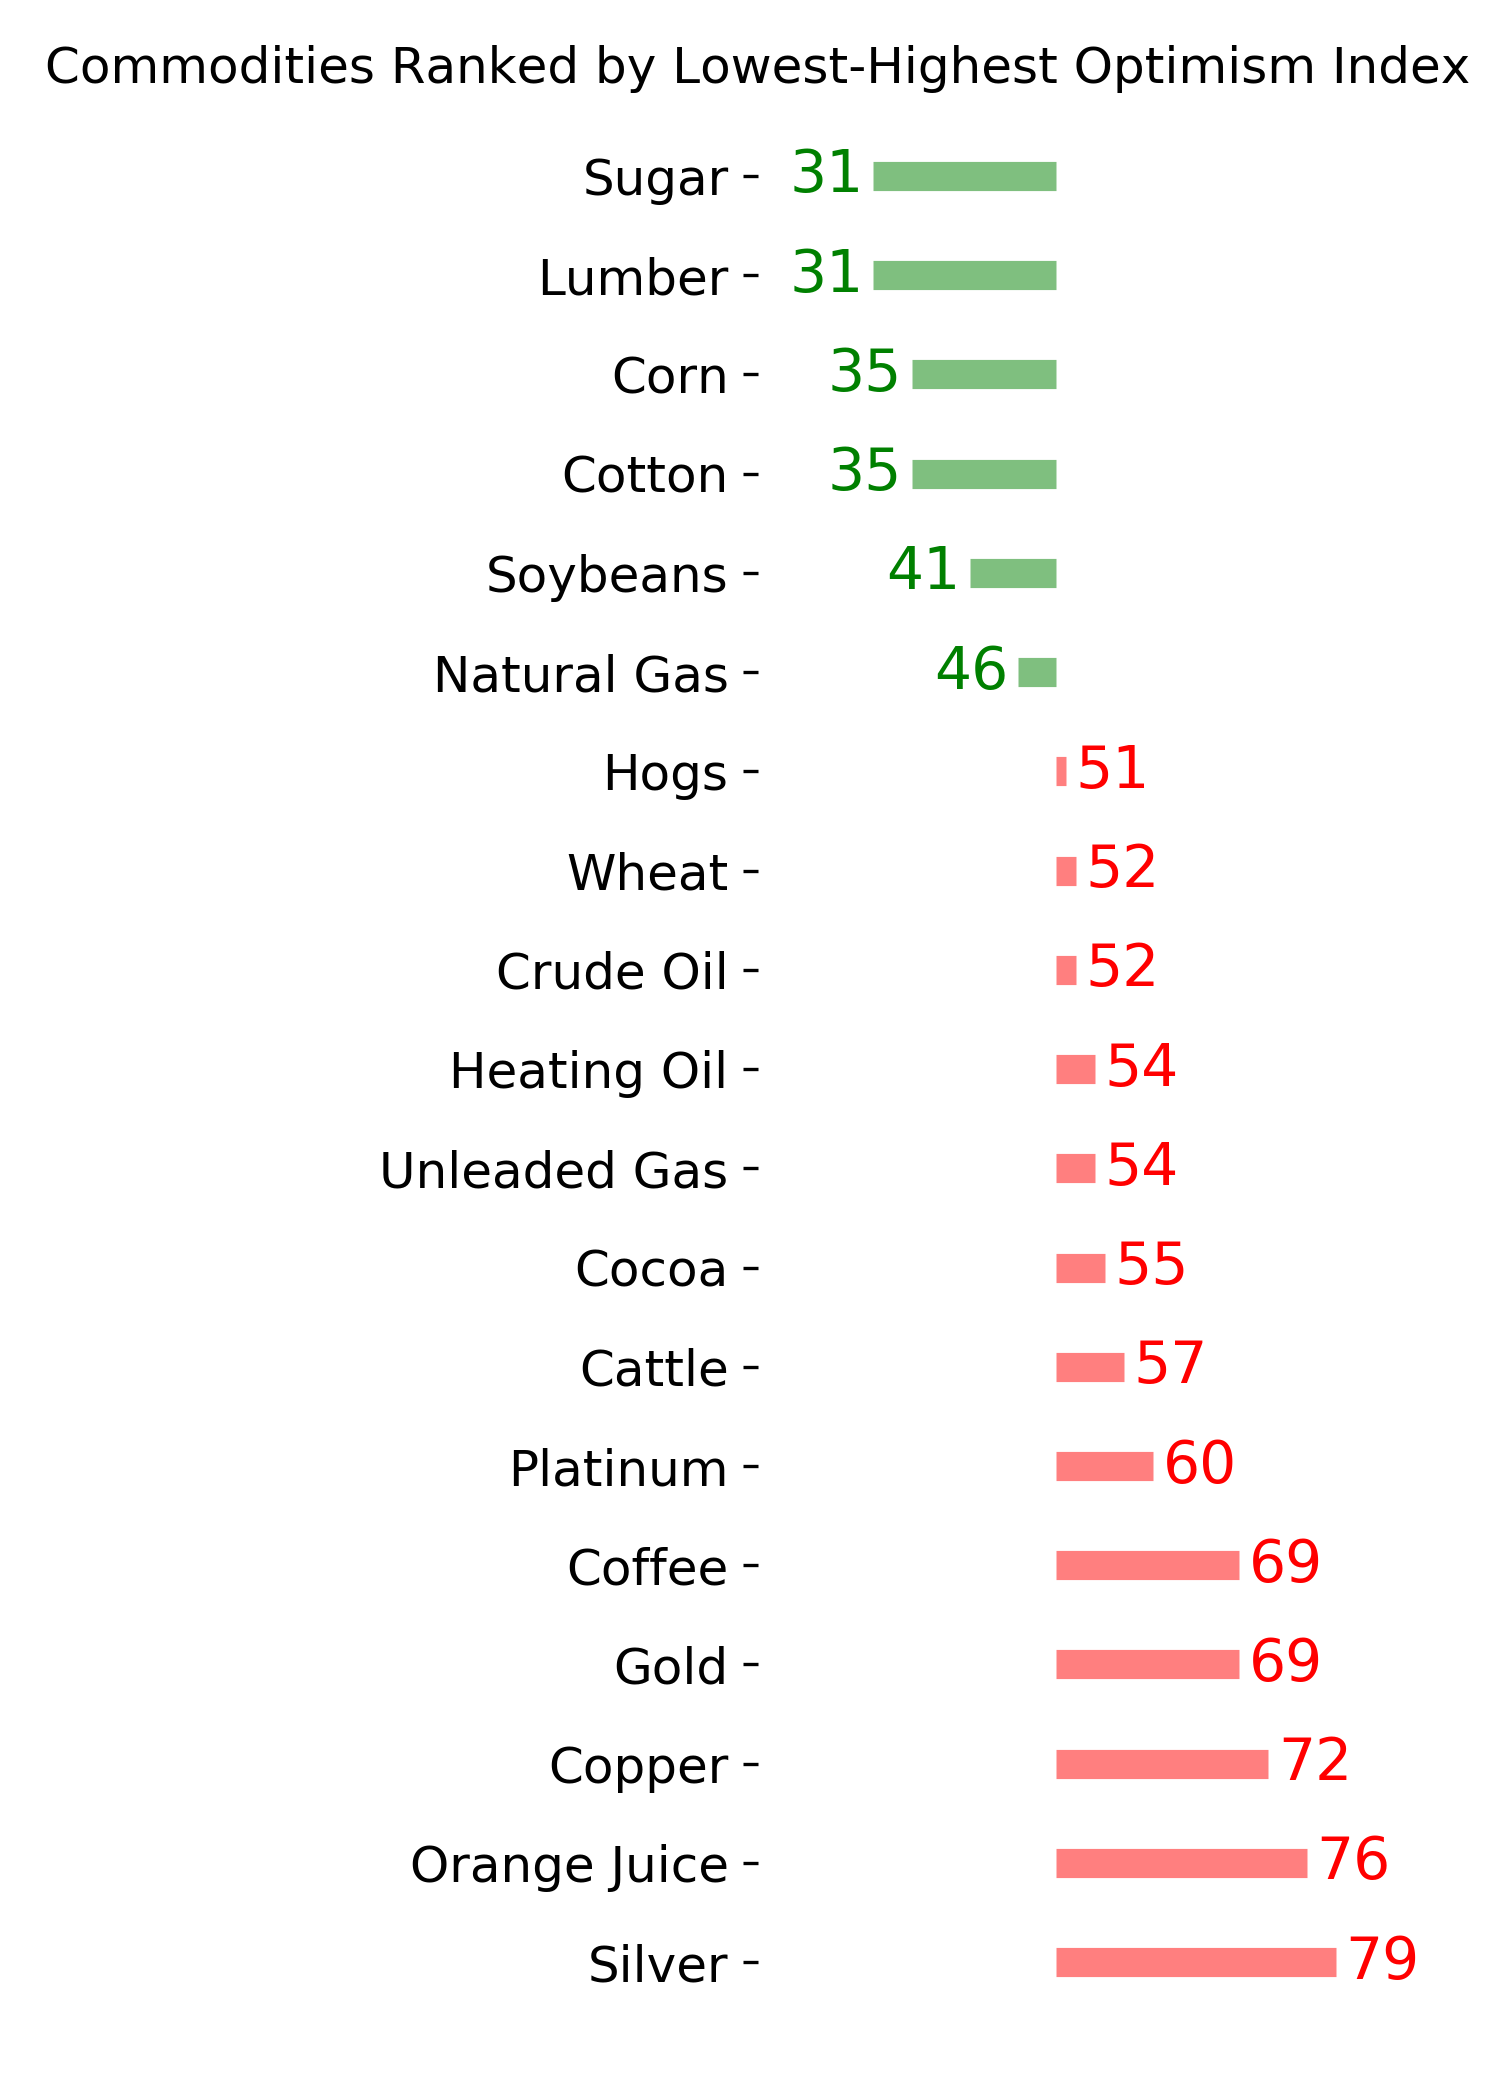
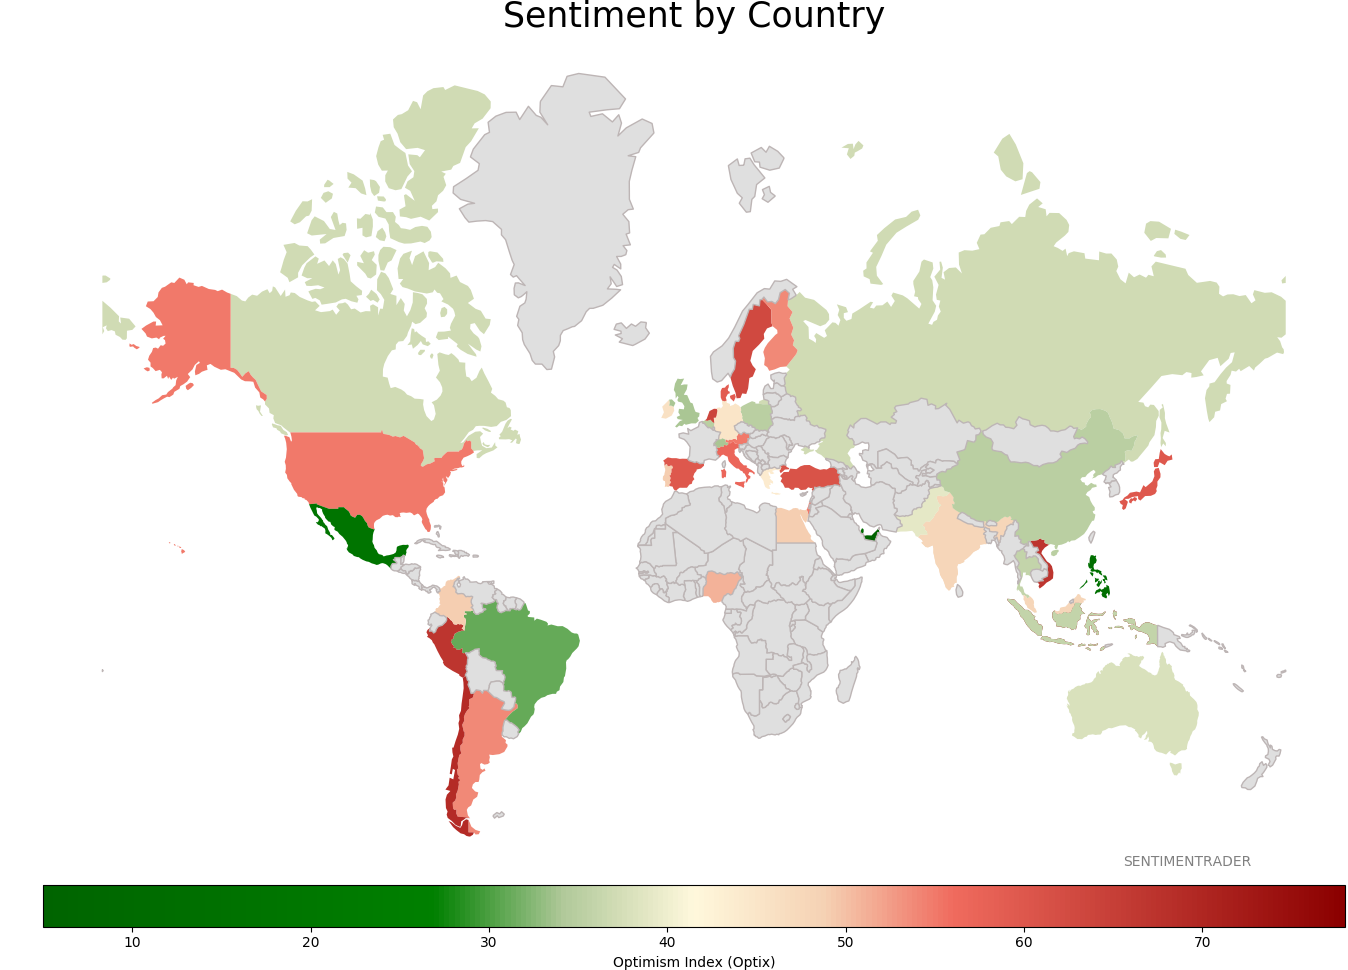
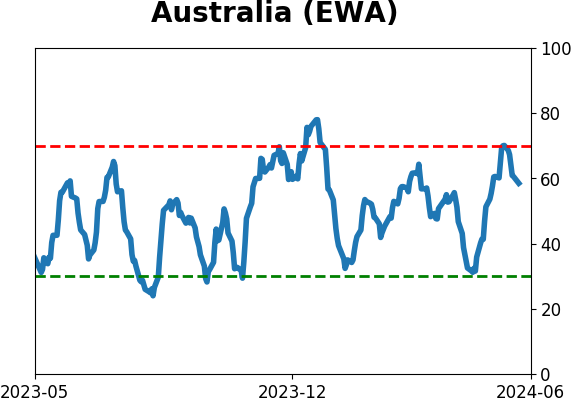
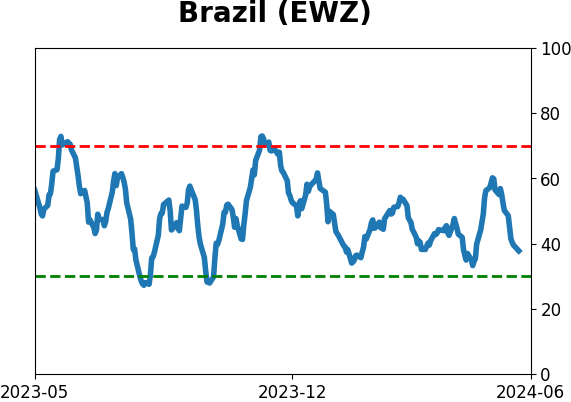
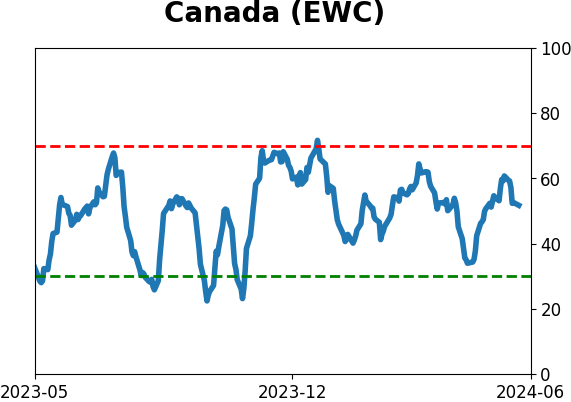
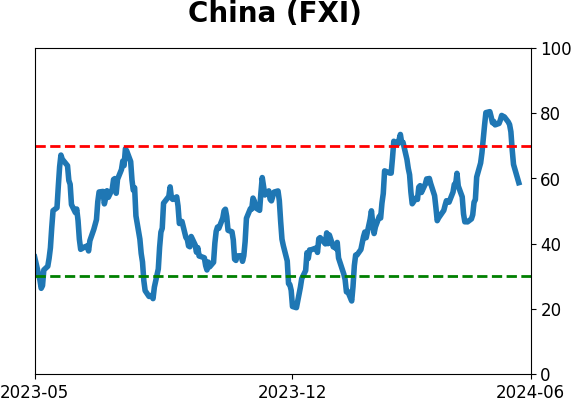
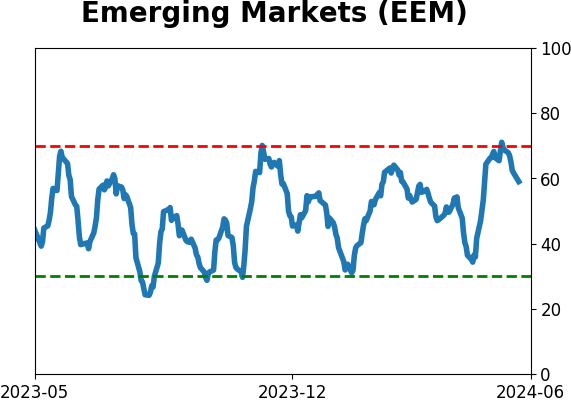
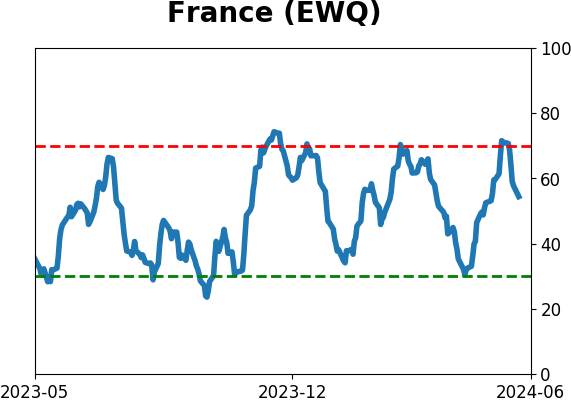
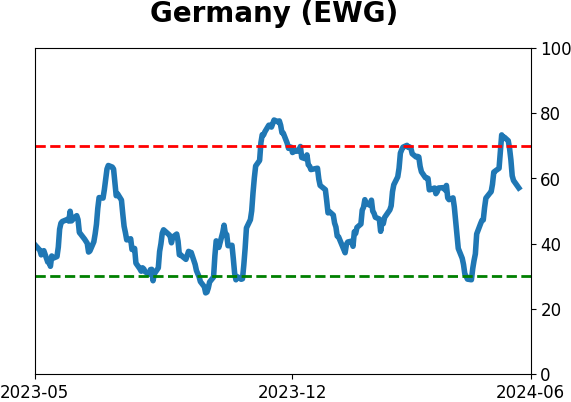
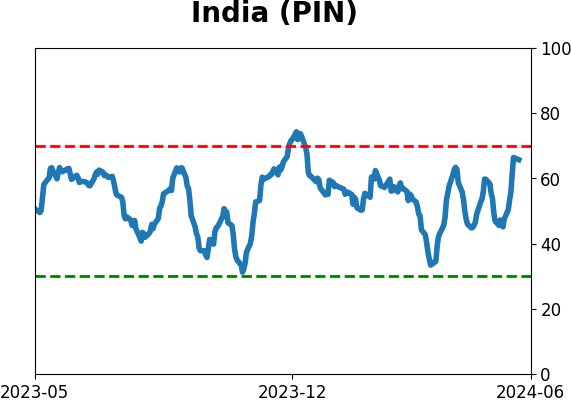
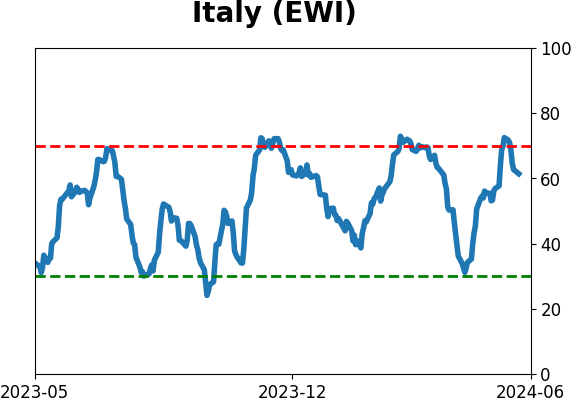
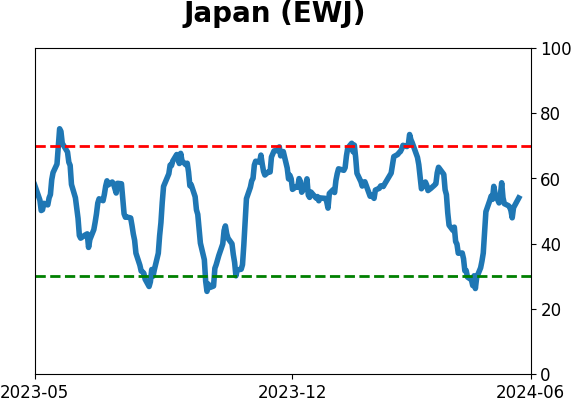
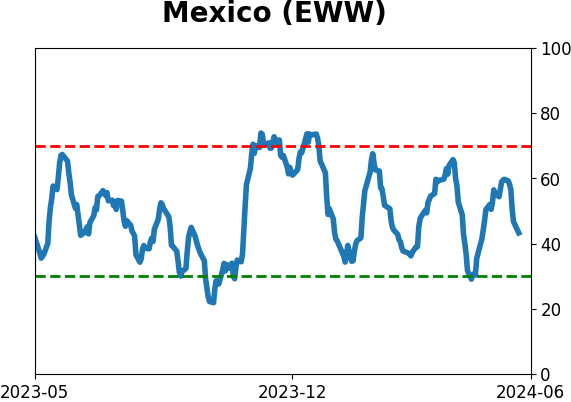
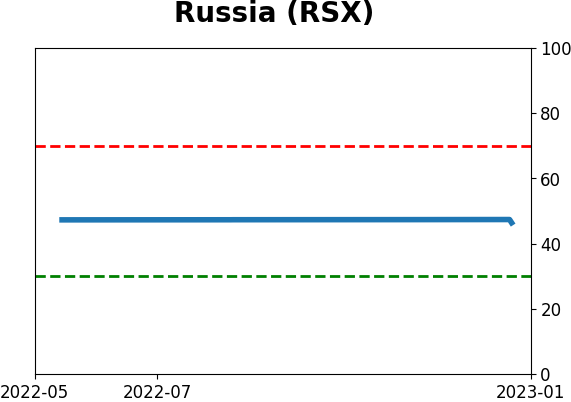
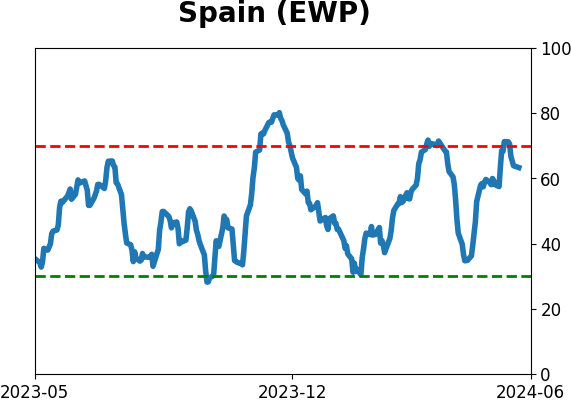
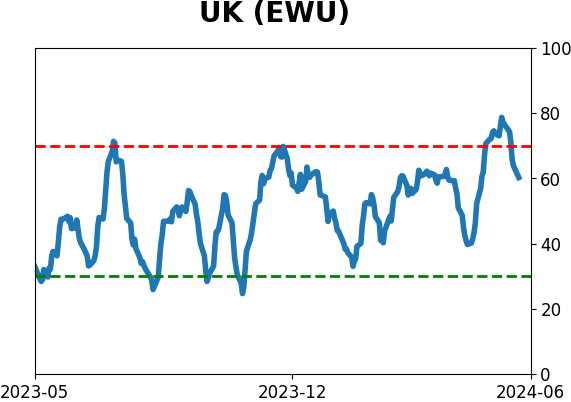
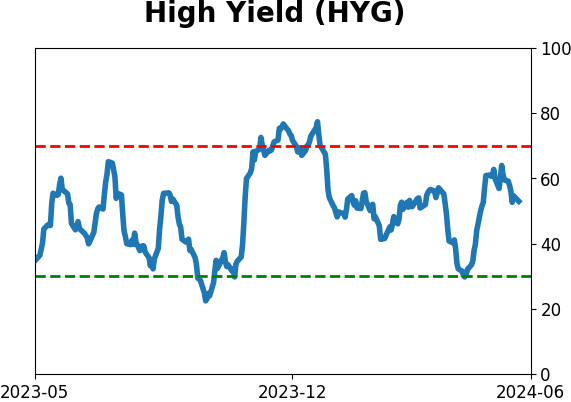
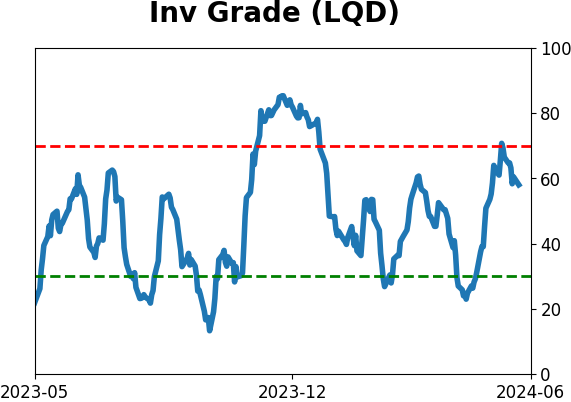
Sentiment Around The World
Optimism Index Thumbnails
|
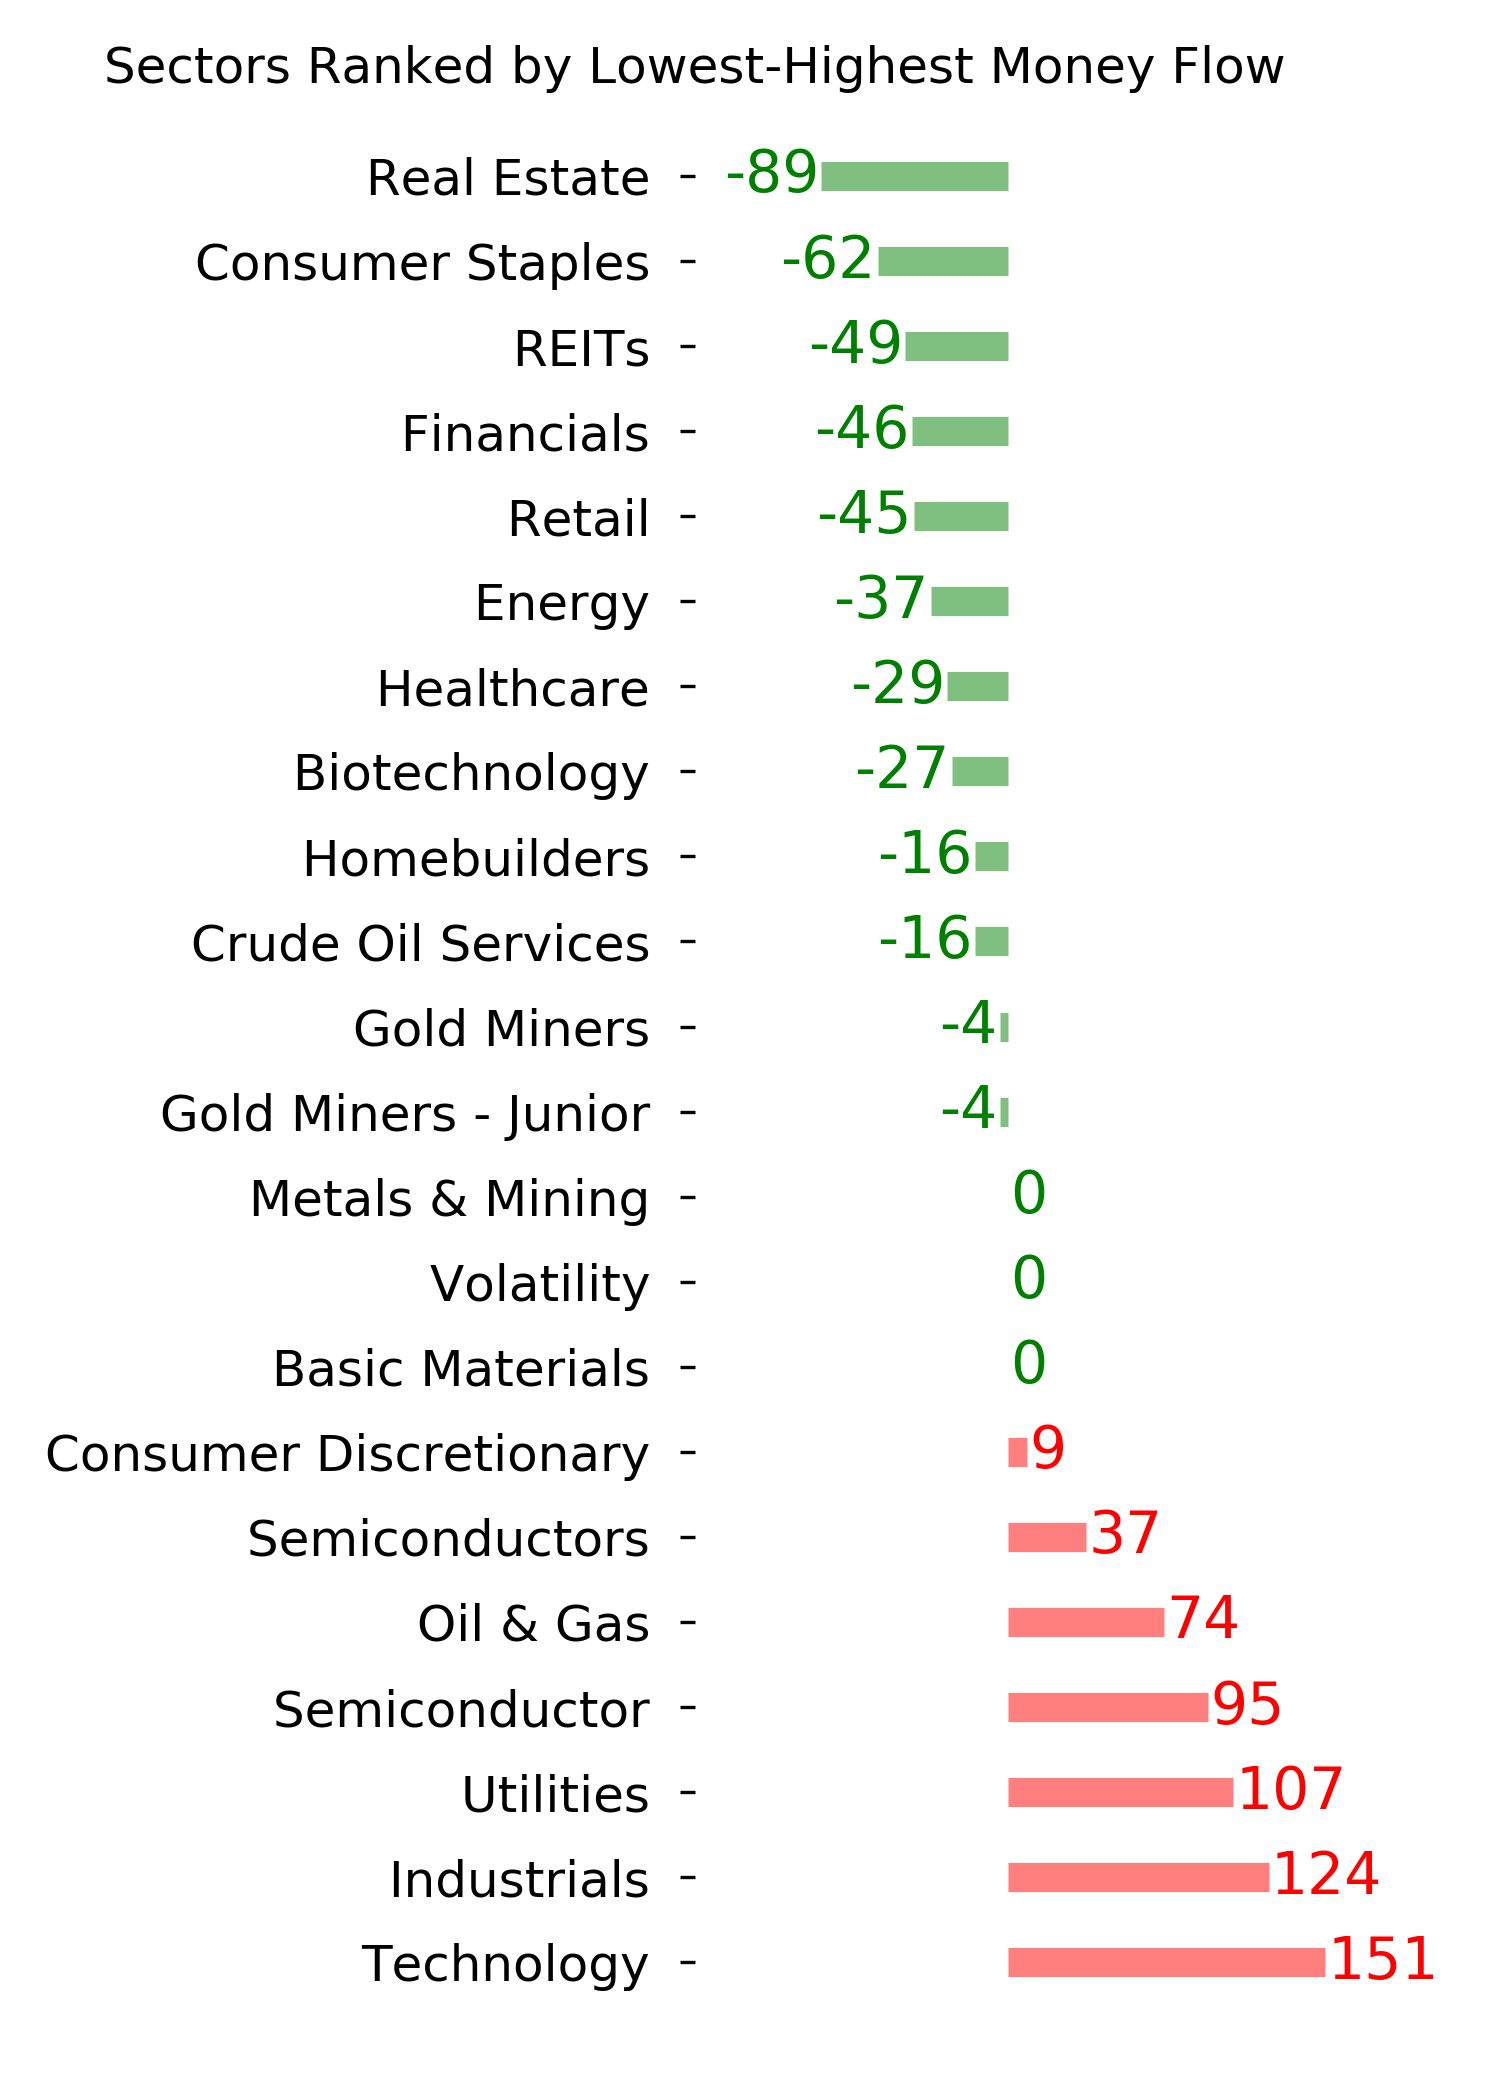
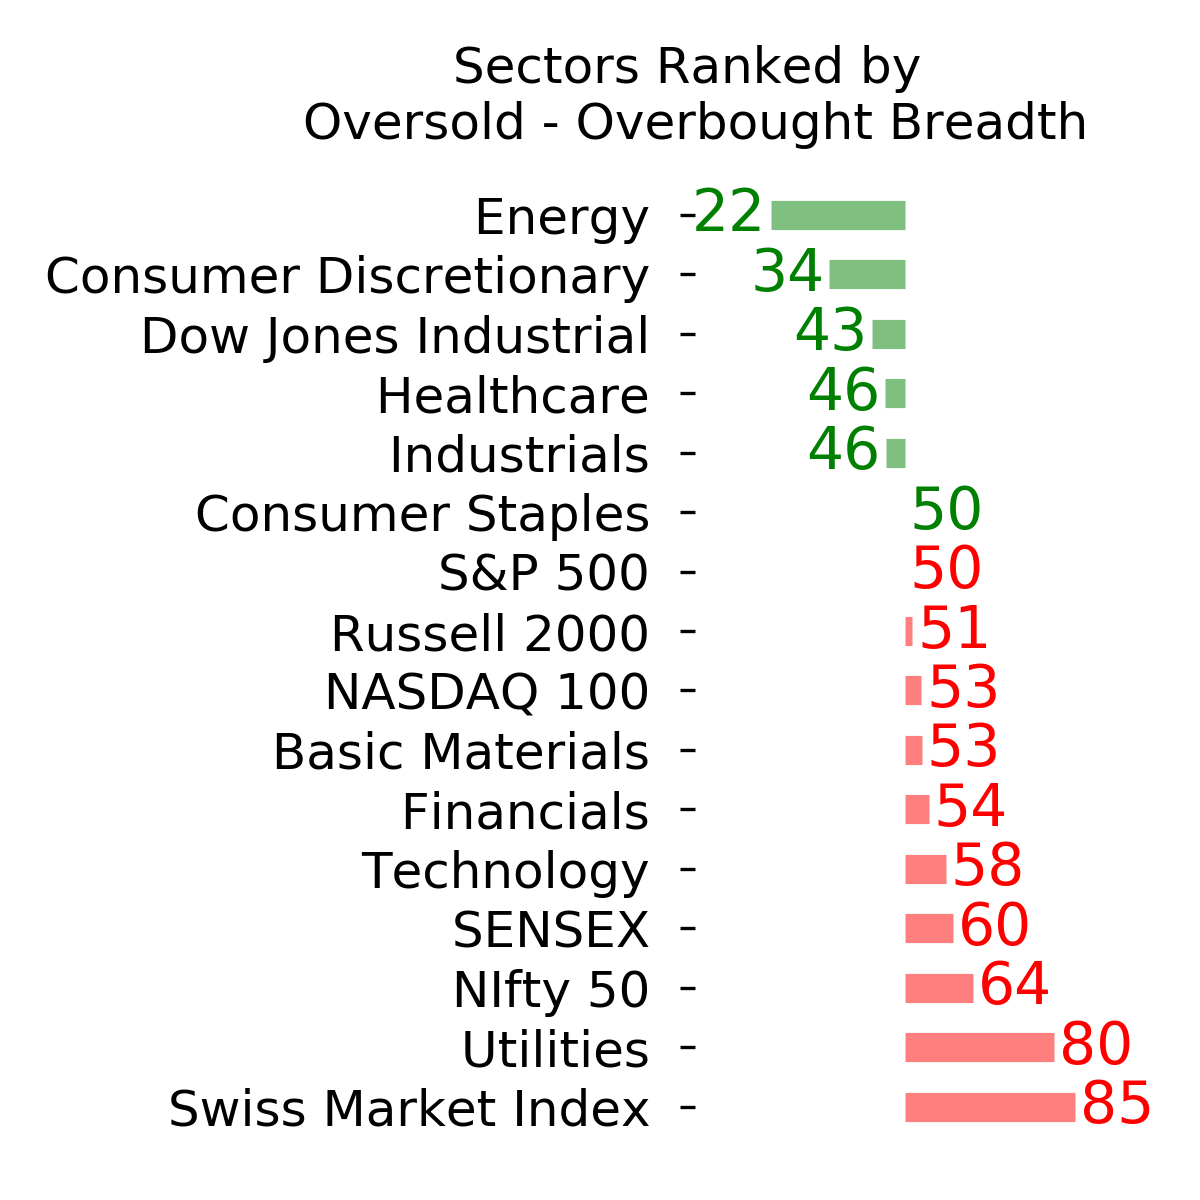
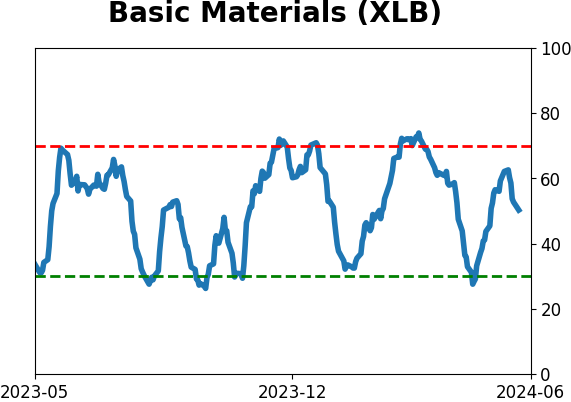
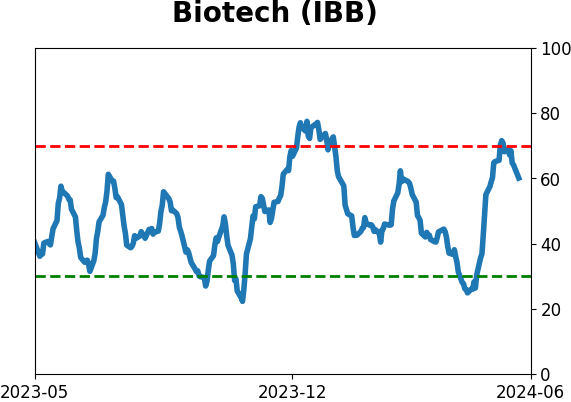
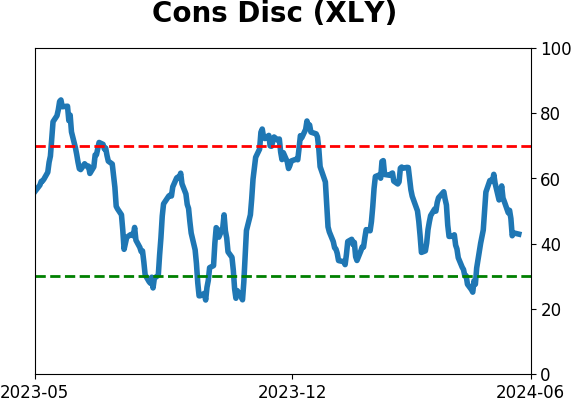
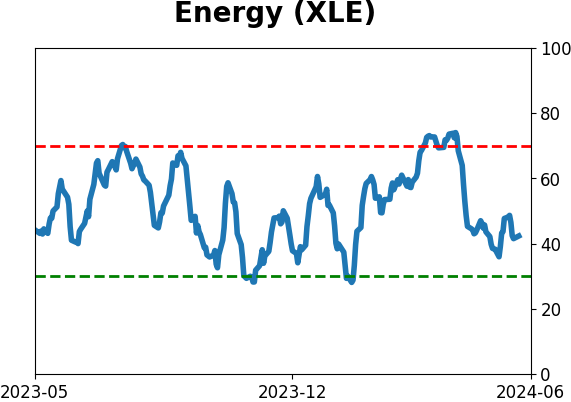
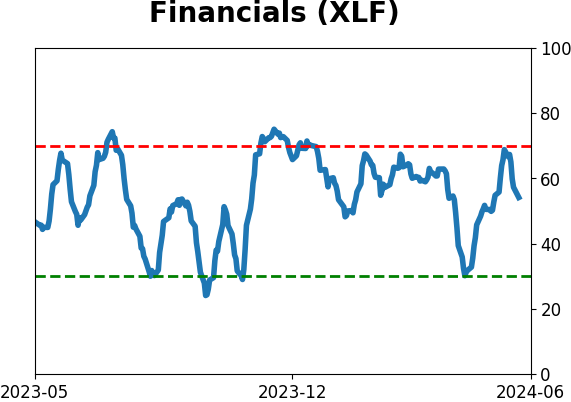
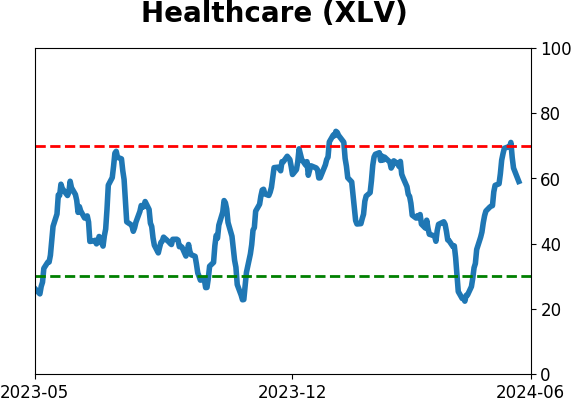
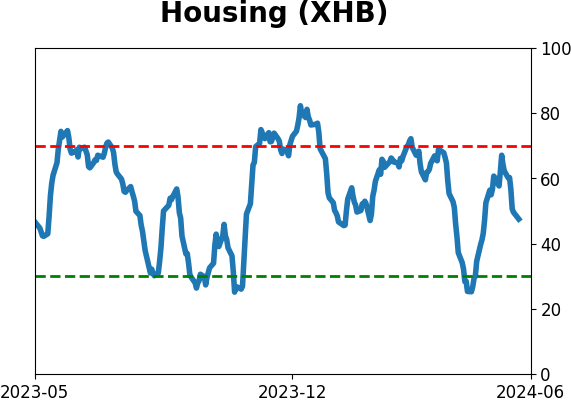
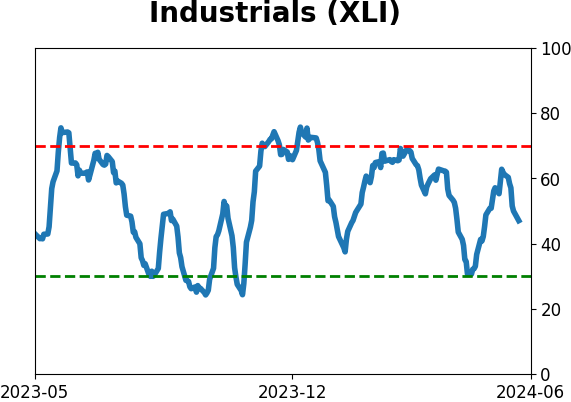
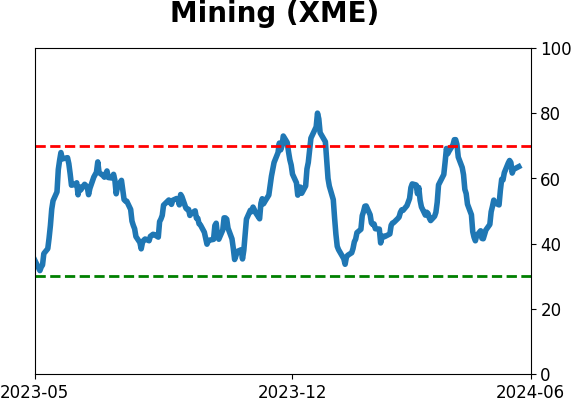
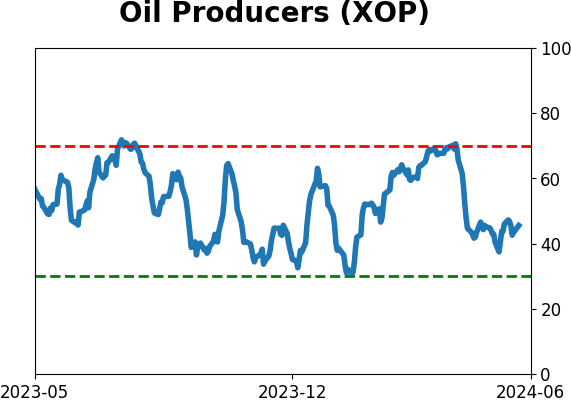
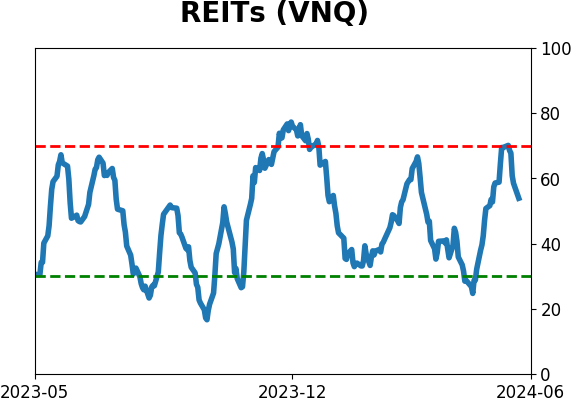
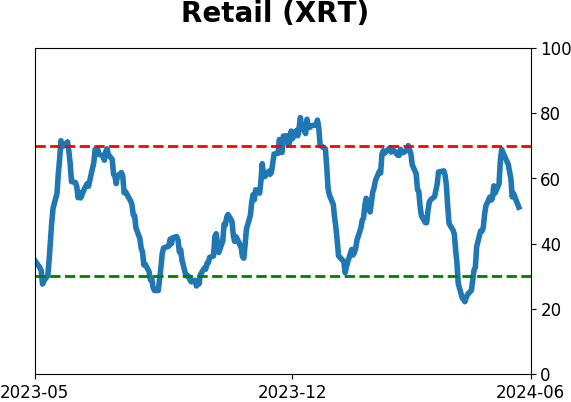
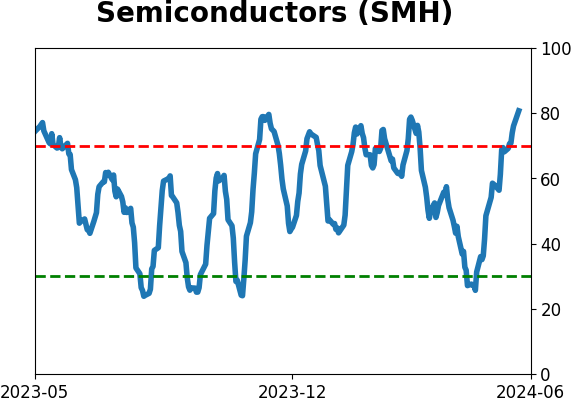
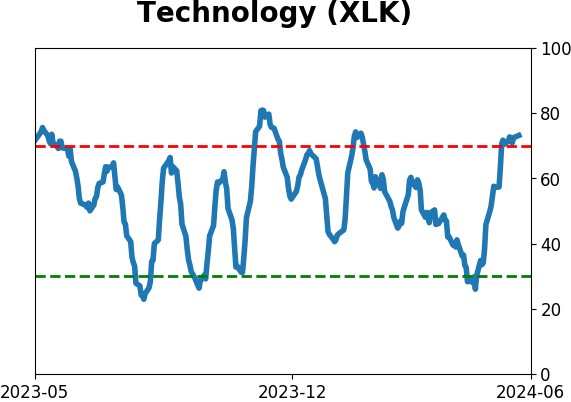
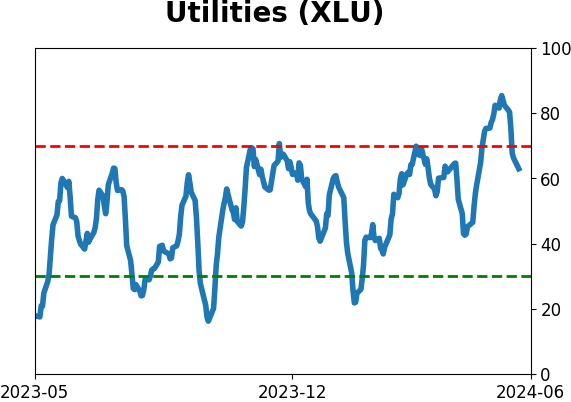
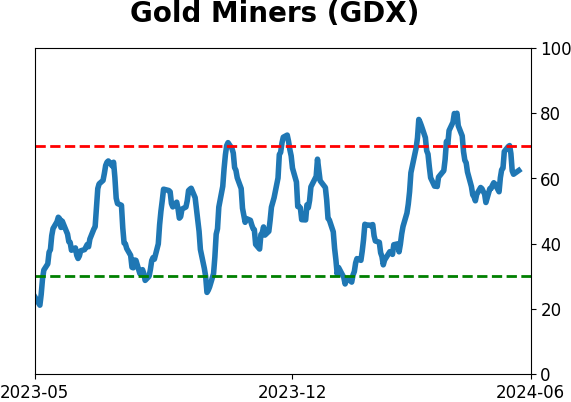
Sector ETF's - 10-Day Moving Average
|
|
|
Country ETF's - 10-Day Moving Average
|
|
|
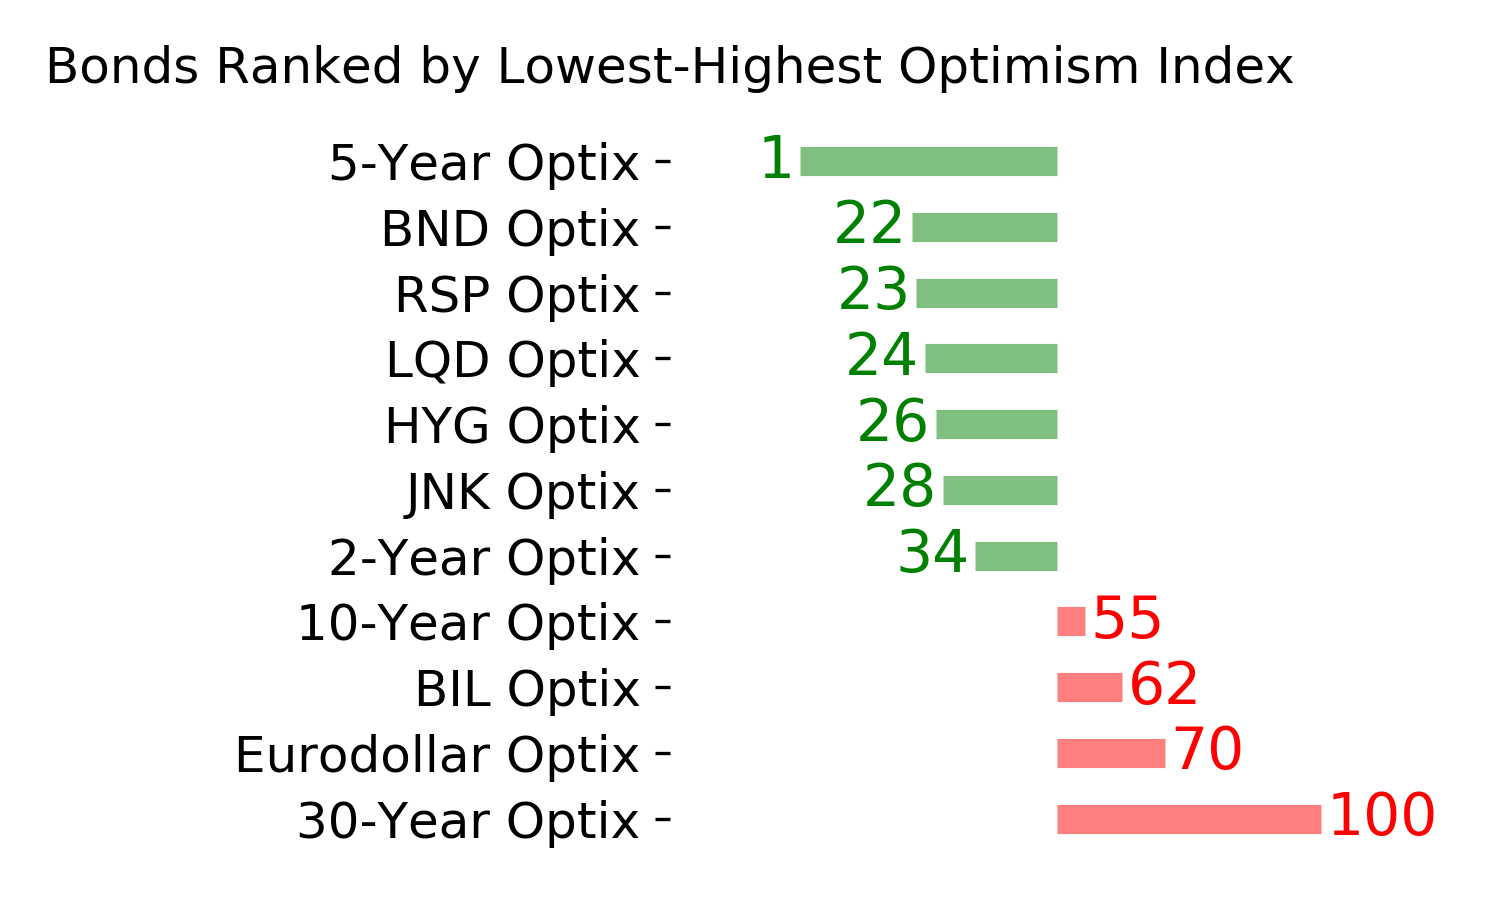
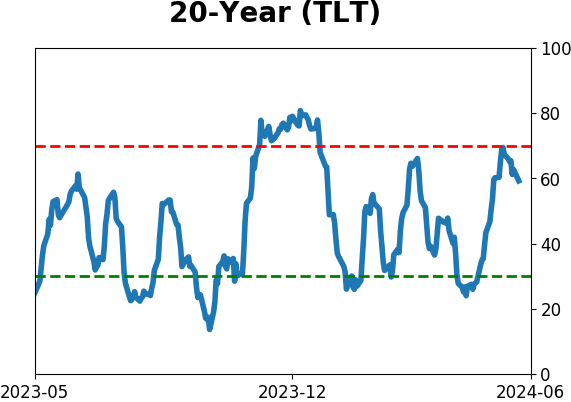
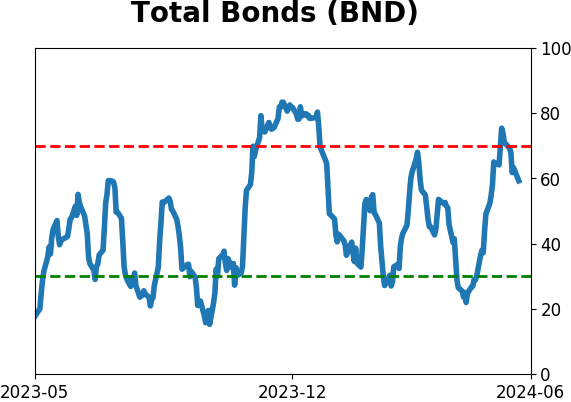
Bond ETF's - 10-Day Moving Average
|
|
|
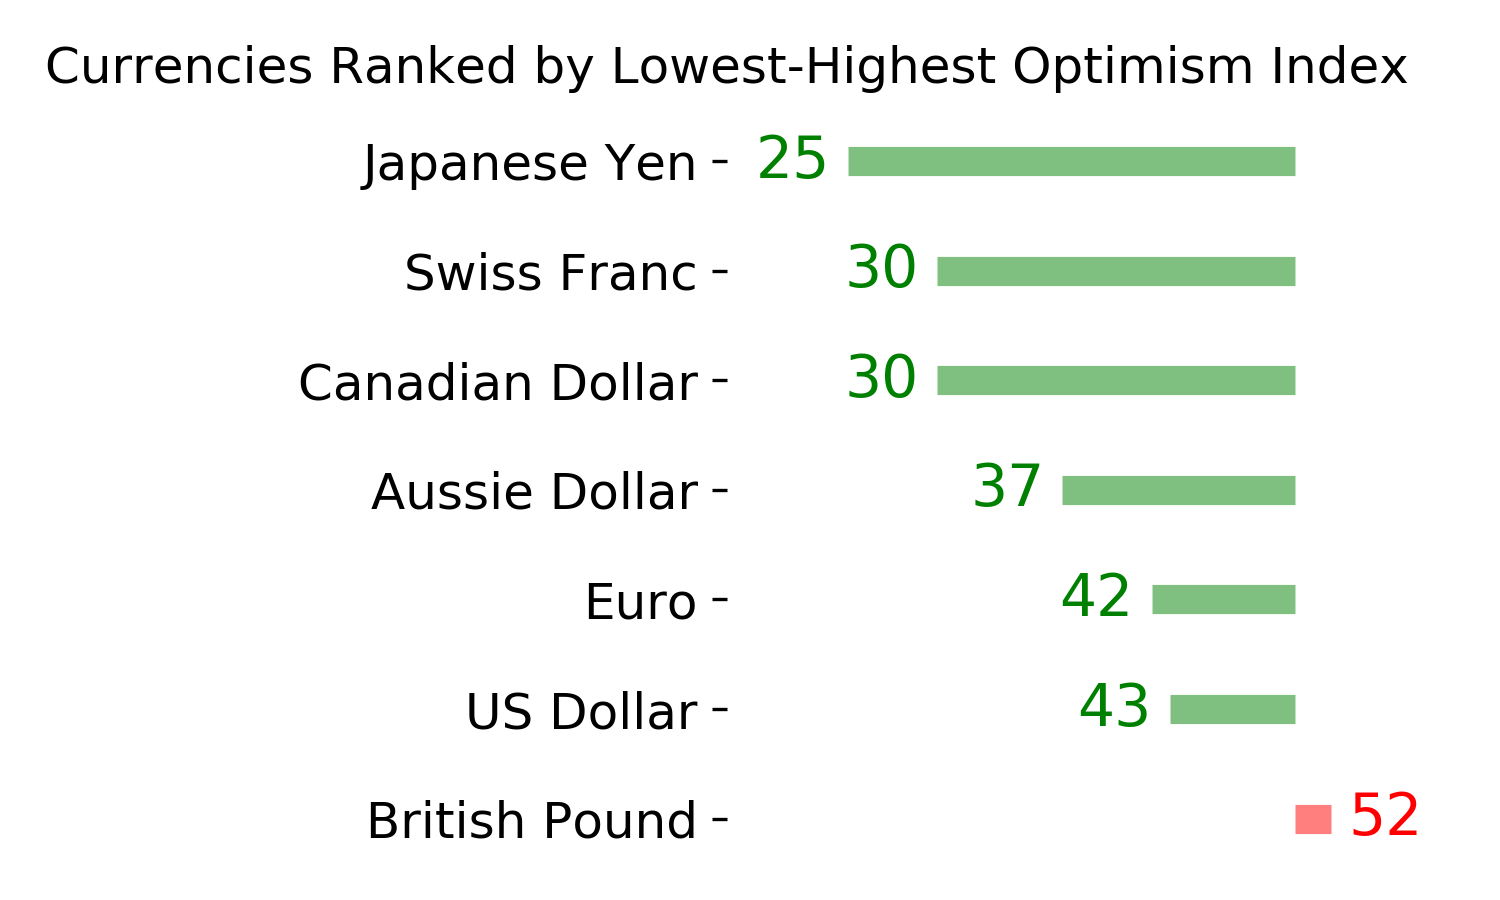
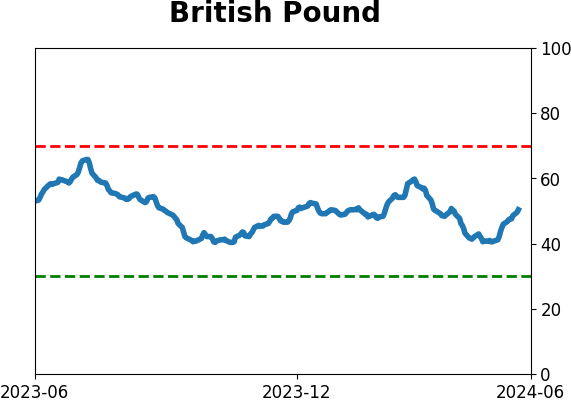
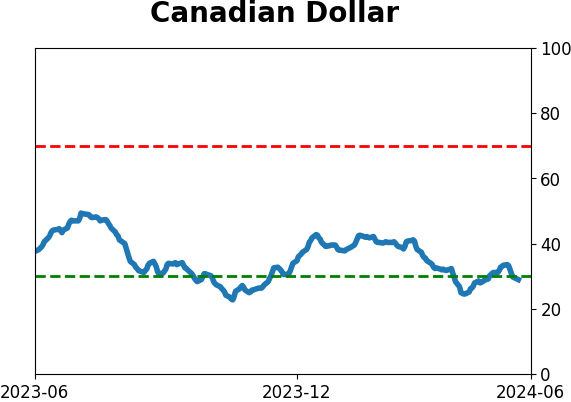
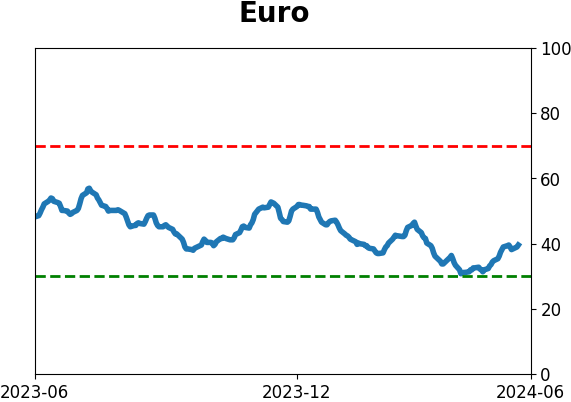
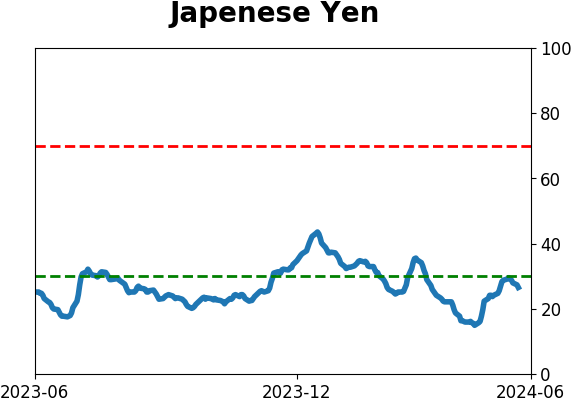
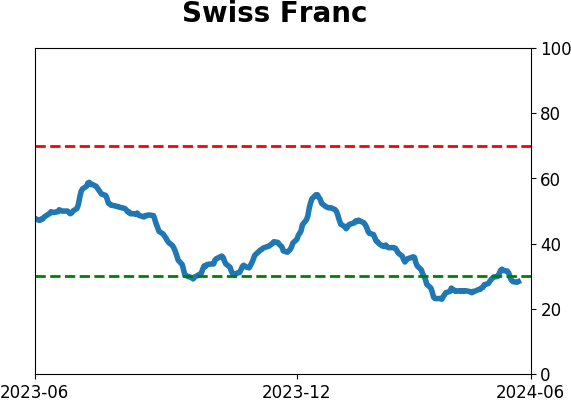
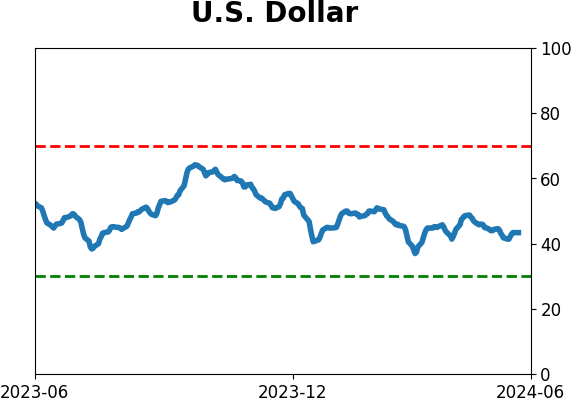
Currency ETF's - 5-Day Moving Average
|
|
|
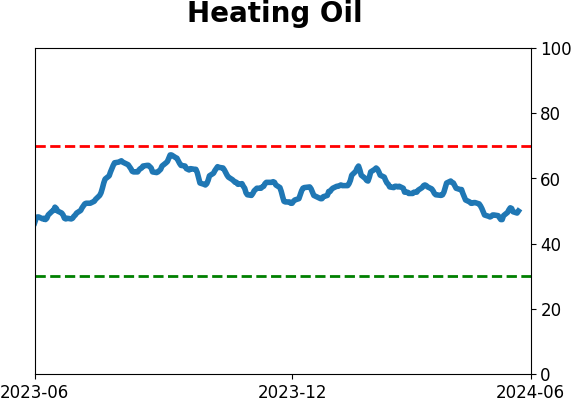
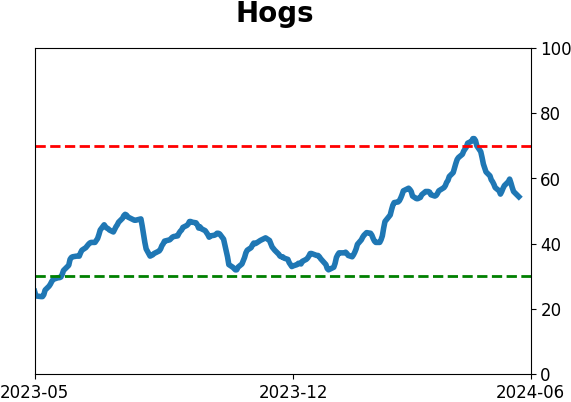
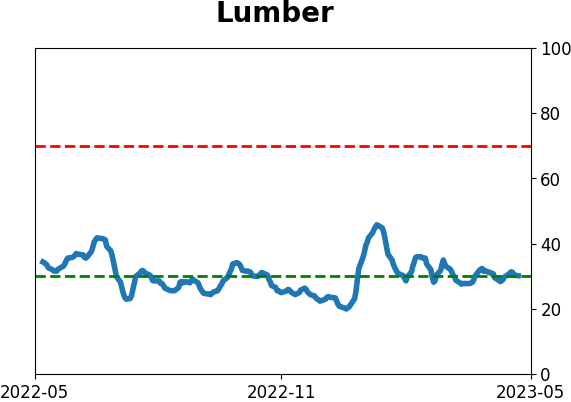
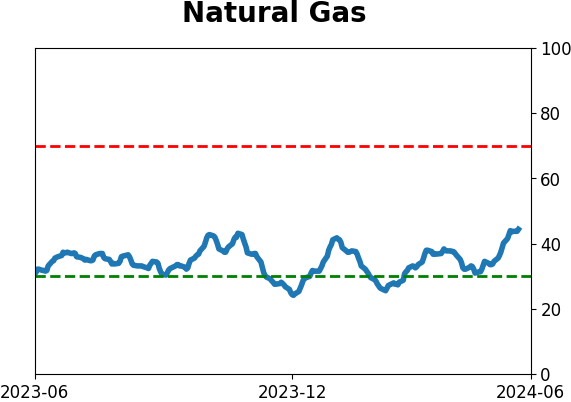
Commodity ETF's - 5-Day Moving Average
|
|