Daily Report : Weekly Wrap for May 28 - Inflation Fears Drive Stocks and Commodities Skyrocket

| View/Print a PDF version of this Report |
Headlines
|
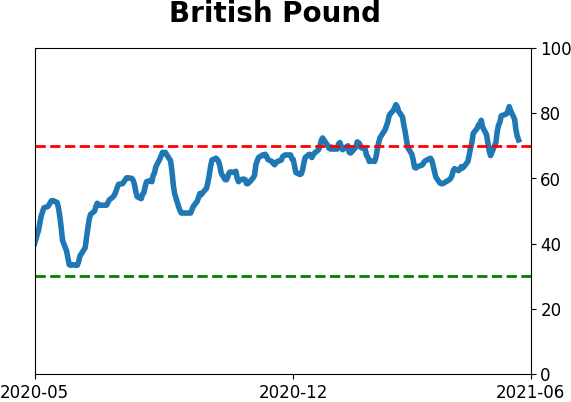
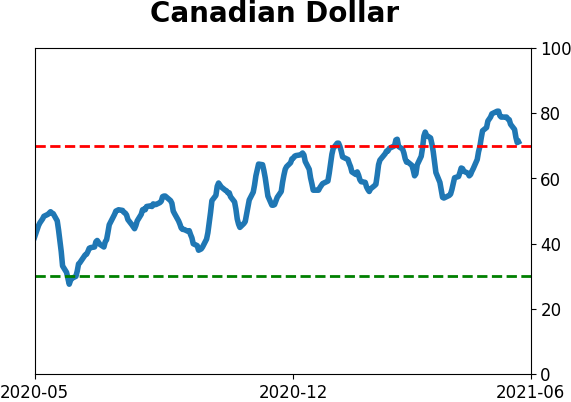
Weekly Wrap for May 28 - Inflation Fears Drive Stocks and Commodities Skyrocket: This week, we saw an ebb in positive economic surprises as inflation fears drove volatility expectations in stocks. That has been a bad signal for gold. Ag contracts have soared, another potential negative for stocks, helping to drive the S&P's earnings yield into negative territory. Bitcoin finally fell into a downtrend. The latest Commitments of Traders report was released, covering positions through Tuesday: The 3-Year Min/Max Screen shows that "smart money" commercial hedgers moved to new multi-year short exposure in the Canadian dollar and British pound, suggesting headwinds for both currencies in the months ahead. The Backtest Engine shows the pound rose over the next month 41% of the time, averaging -0.3%, when hedgers held more than 50,000 contracts net short. Position changes in other contracts were minimal during a quiet pre-holiday week. Bottom Line: See the Outlook & Allocations page for more details on these summaries STOCKS: Hold BONDS: Hold GOLD: Hold |
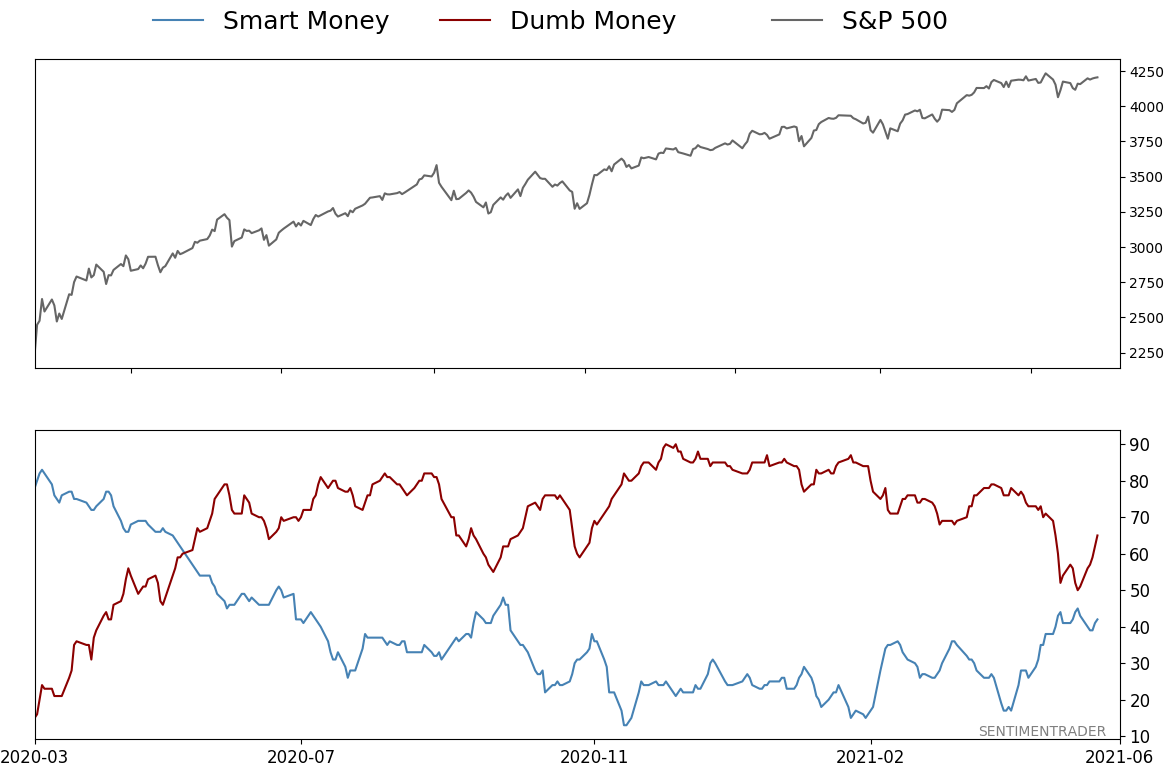
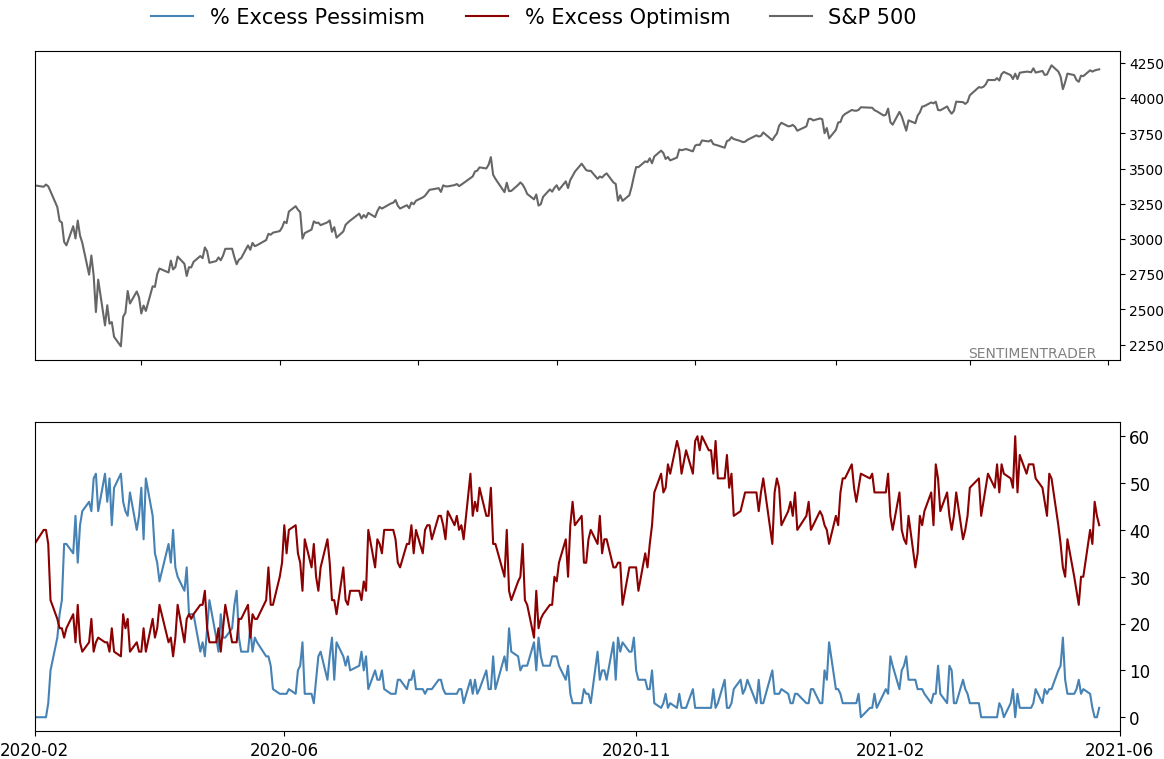
Smart / Dumb Money Confidence
|
|
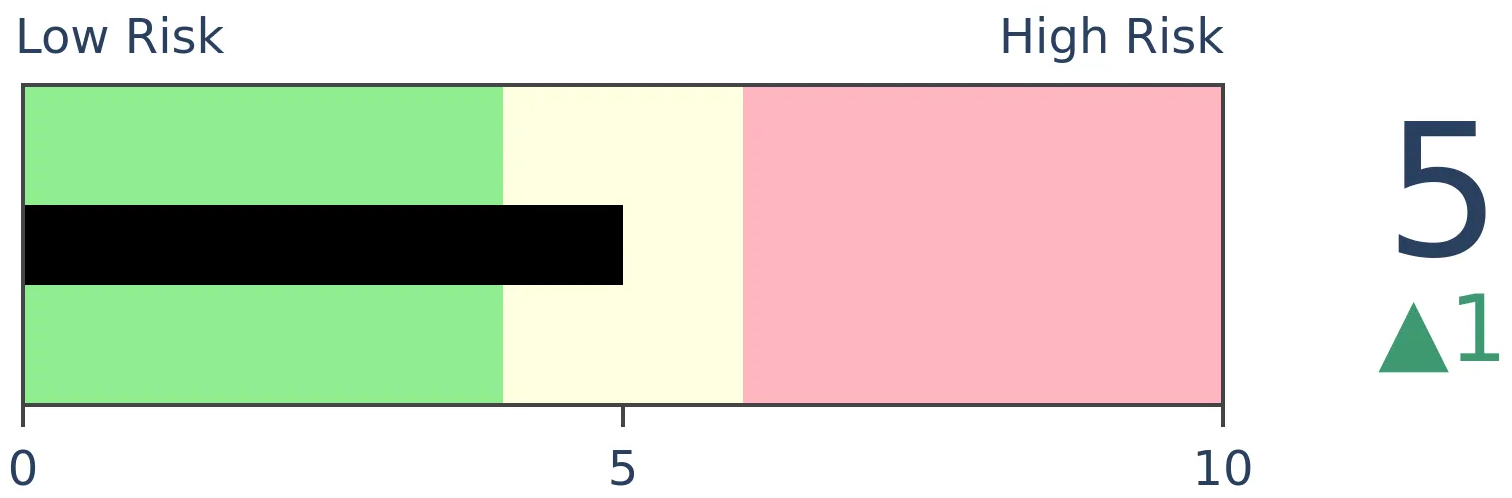
Risk Levels
|

|
|
Research
Weekly Wrap for May 28 - Inflation Fears Drive Stocks and Commodities SkyrocketBOTTOM LINEThis week, we saw an ebb in positive economic surprises as inflation fears drove volatility expectations in stocks. That has been a bad signal for gold. Ag contracts have soared, another potential negative for stocks, helping to drive the S&P's earnings yield into negative territory. Bitcoin finally fell into a downtrend. FORECAST / TIMEFRAME |
The goal of the Weekly Wrap is to summarize our recent research. Some of it includes premium content (underlined links), but we're highlighting the key focus of the research for all. Sometimes there is a lot to digest, with this summary meant to highlight the highest conviction ideas we discussed. Tags will show any symbols and time frames related to the research.
| STOCKS | ||
 |  | |
For the first time in a year, economic data is disappointing those who predict it.
The Citi Economic Surprise Index briefly turned negative near the end of last week. The index measures how much that economic data is beating or missing economists' forecasts, and consistently swings between extremes.
What may be notable is that this ended a record streak of days with positive surprises.
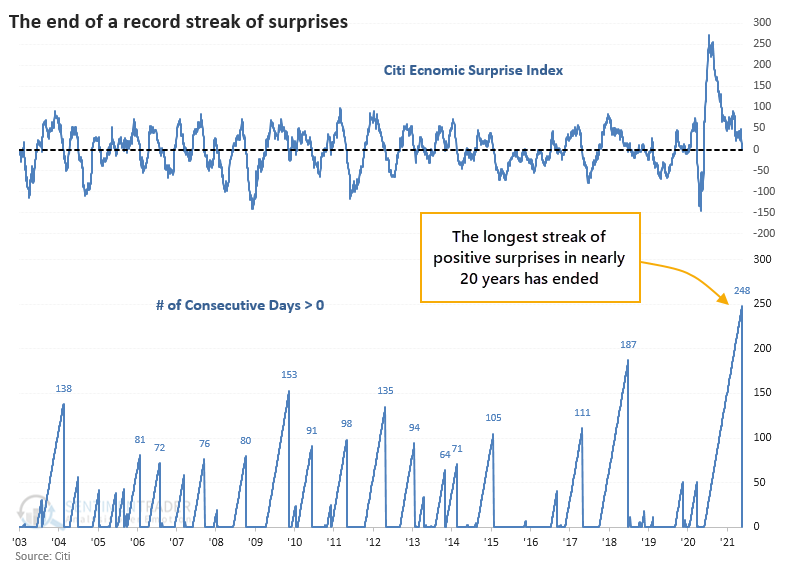
There were only four other times when Economic Surprises lasted six months or longer, and after the ends of those streaks, the S&P showed mixed returns. There were two times when it fell immediately, and the other two saw their short-term gains wiped out in the months ahead. All four showed a positive one-year return, though.
If we look at the ends of shorter streaks, we can generate a larger sample size.
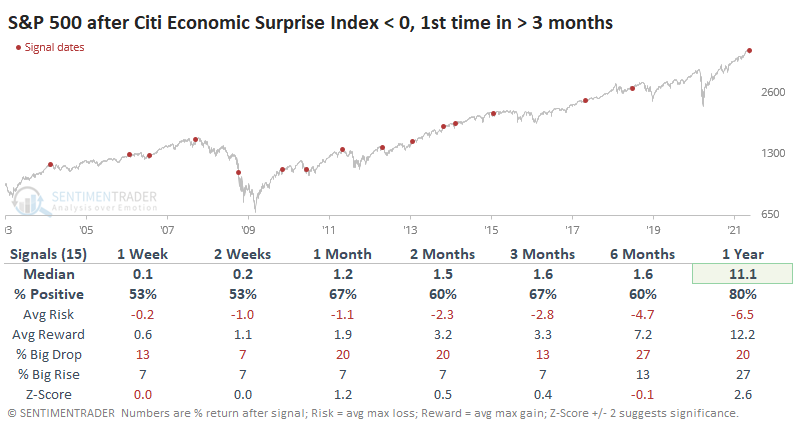
Even though stock indexes like the S&P 500 tended to show mixed returns, sectors like Industrials, Communications, and Utilities showed decent medium-term returns. Energy, Materials, and Tech were laggards.
INFLATION'S NEFARIOUS IMPACT ON RETURNS
Whatever one thinks about the inflation outlook, it's hard to debate the idea that it's already here using traditional measures.
Now that there has been a spike in inflation gauges, the earnings yield on the S&P 500 has turned negative. This is not a condition that investors have had to tackle much over the past 70 years.
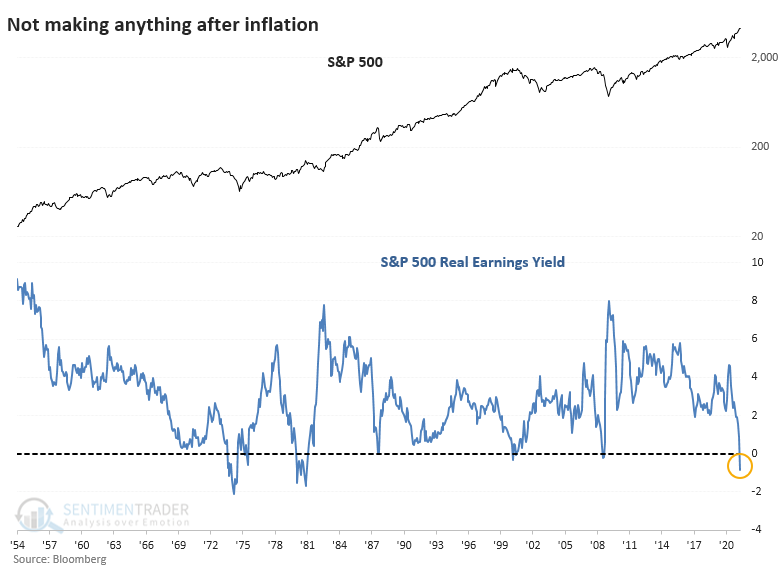
If we ignore dividends, there have been five other times when the S&P 500's inflation-adjusted earnings yield turned negative. The Risk/Reward table shows just how limited the upside was following these signals.
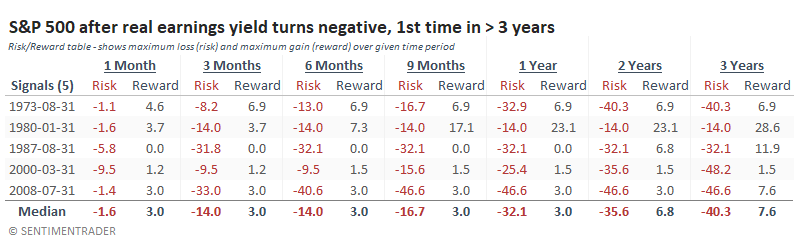
When we look at the average returns in sectors and factors following these same signals, the worst returns were in Tech, Discretionary, and Growth stocks. There weren't exactly any winners, but the "best losers" included Value, Staples, Energy, and Utilities.
The biggest risk with putting weight on data like this is the this-time-is-different argument due to unprecedented stimulus, an unusually active central bank, and problems with measuring inflation, especially a base rate that's being so influenced by a once-in-a-century pandemic.
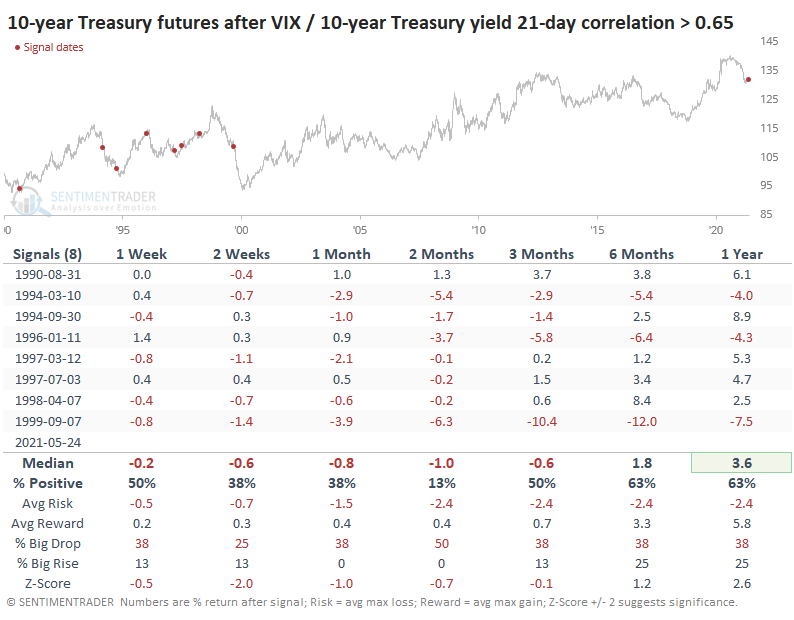
Traders seem to be fearing that this time is not different because over the past month, about when stocks started to go into a holding pattern, the correlation in daily changes between the VIX "fear gauge" and the yield on 10-year Treasury notes skyrocketed to the highest level since 1999.
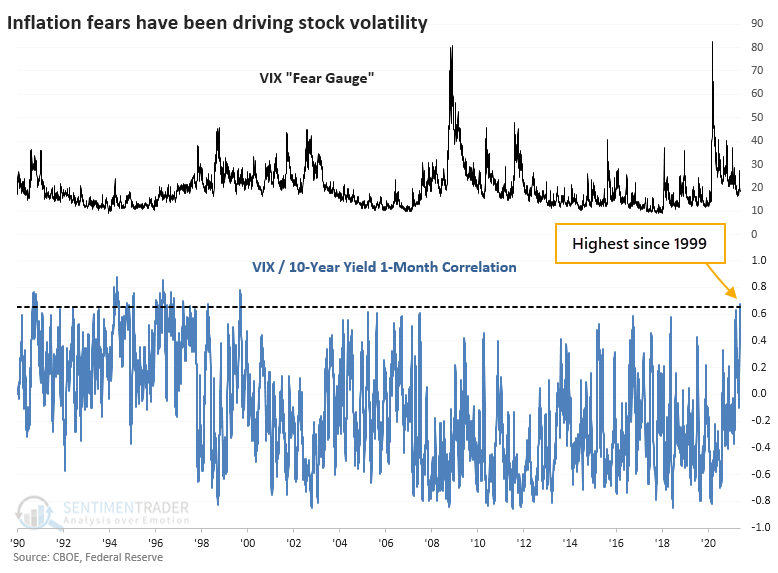
Yields drove investors' expectations for volatility throughout much of the 1990s. During that time, when the correlation got to as high a level as it's at now, the S&P showed weak short-term returns but good medium- to long-term ones.
The Institute for Supply Management releases its monthly survey on manufacturing on the first business day of each month. Dean mentioned that he will be monitoring the upcoming release closely as the April data was significant.
The spread between new orders and prices paid is an excellent measure for identifying a bullish or bearish macroeconomic backdrop for stock prices. In anticipation of the upcoming data to be released in early June, it's worth noting that the April data showed the new orders to prices paid spread at the lowest level since August 2008.
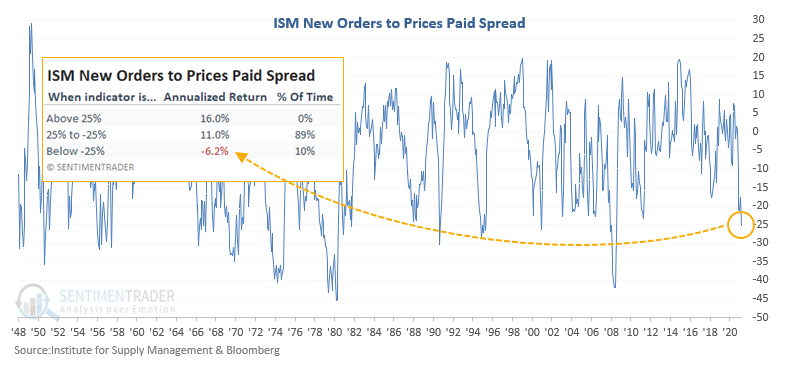
The S&P 500 index annualizes at a significantly higher rate when the new orders' versus prices paid spread is above zero. If we look at instances when the spread is below -25%, as is the case now, the S&P exhibits negative returns. The same goes for when the spread first drops below -25%.
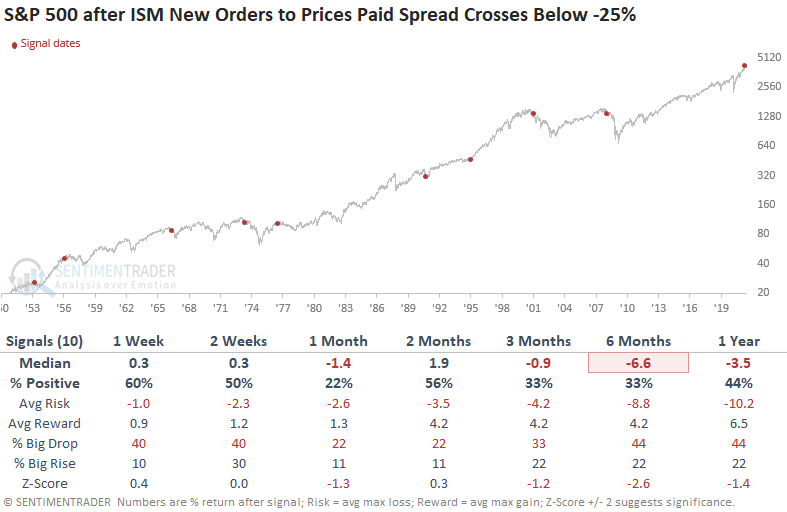
After these signals, annualized returns were challenging across all sectors and factors. Technology, Discretionary, and Growth stocks tended to take the brunt of the selling pressure.
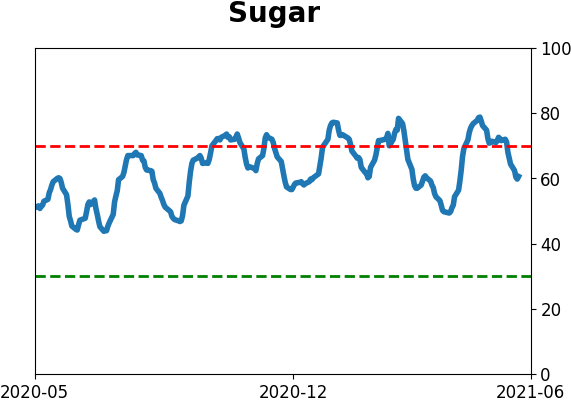
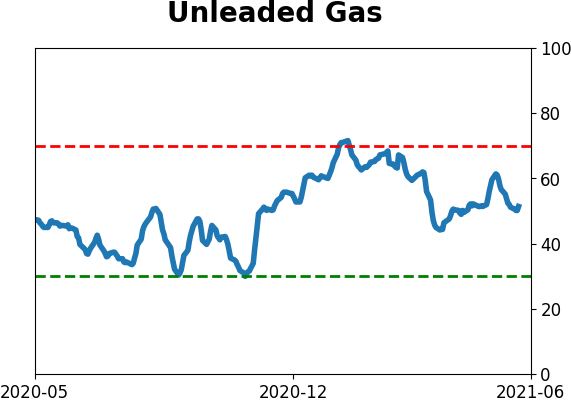
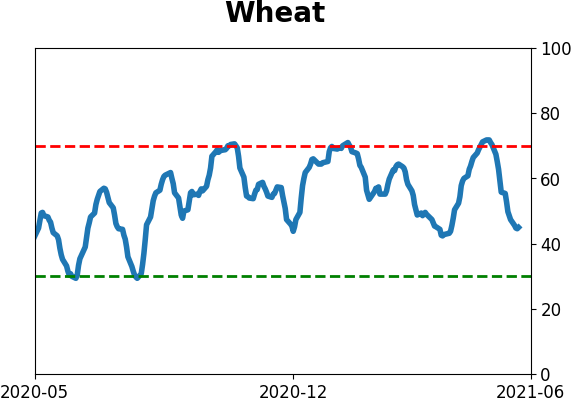
AGRICULTURE CONTRACTS HAVE SKYROCKETED
The parabolic rise in many commodities is stoking inflation fears. Dean noted that the year-over-year change in the UN Food and Agriculture World Food Price Index recently crossed above 30%, a level not seen since 2011.
The world food price index does not have a long history, so Dean created a proxy for food prices by combining corn, wheat, and soybeans and measuring the average 252-day rate of change for the group. The recent surge in momentum reached the 5th highest level since 1900 earlier this month.
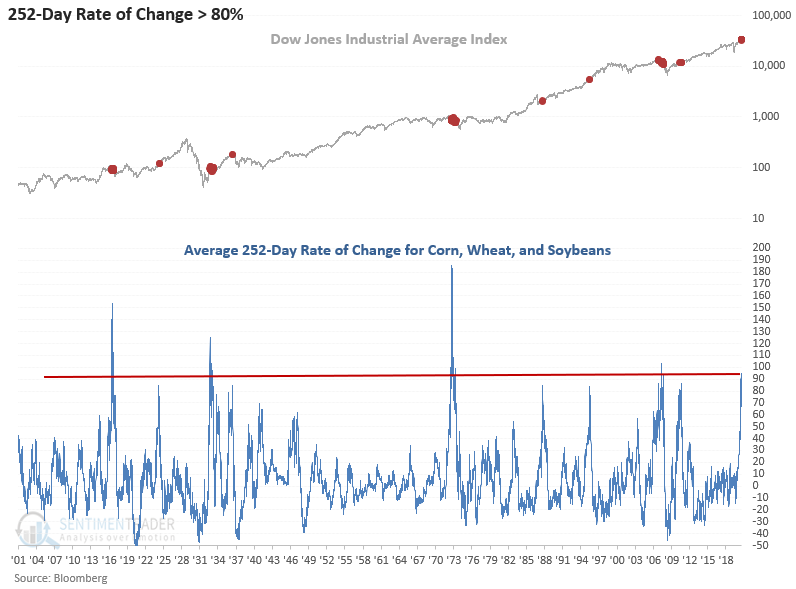
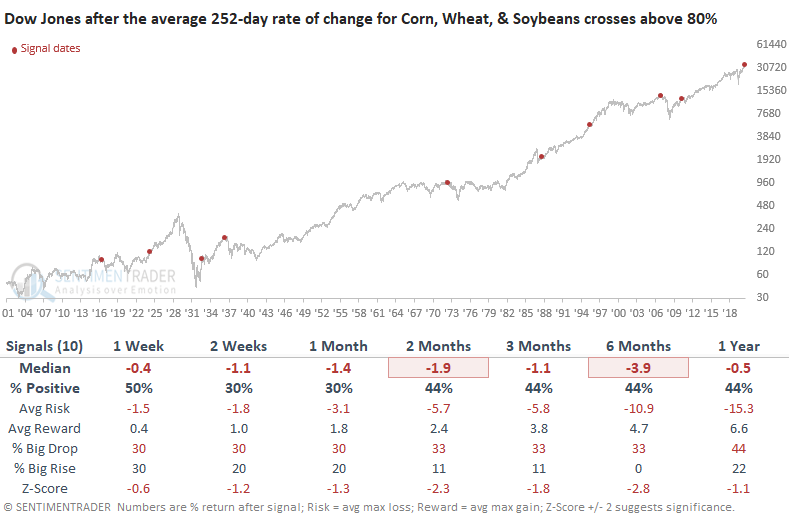
After other spikes, future returns in the S&P 500 were weak across all timeframes. If one is looking for a historical analog, the 1933 and 2011 signals might be best as they both occurred after the initial surge from a bear market/recession period.
Looking at sector and factor returns, there was a clear negative in most of them when ag prices were soaring and when they were plunging (investors don't like runaway inflation or deflation). When ag contracts showed moderate gains, that's when most sectors showed the best returns.
STOCKS AND SECTORS - NASDAQ 100
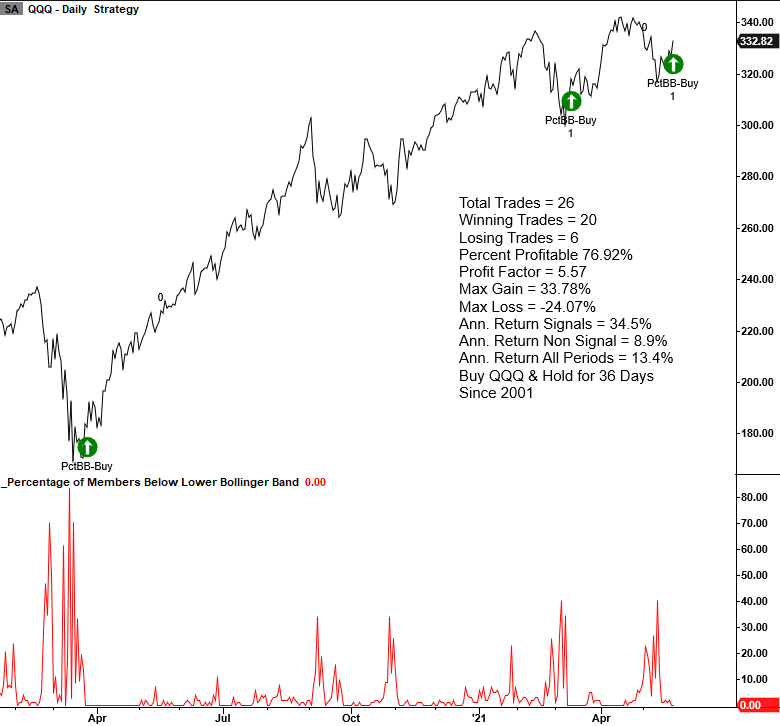
Dean noted that the percentage of QQQ members trading below their respective lower Bollinger Band registered a mean reversion buy signal on the close of trading on May 21.
The signal identifies when numerous Index members trading below their respective lower Bollinger Band cycles from high to low, and Index momentum turns positive.
This is the second buy signal in a little over two months. The 3/10/21 instance closed out the optimal days-in-trade holding period with an 8.72% gain versus a 7.47% gain for the SPY ETF.
Please note that the chart's trading statistics are based on buying and selling the next day open.
Jay outlined the idea that the most straightforward way to make a bullish play would be to buy 100 shares of QQQ at $332.51 a share. The cost to enter this trade was $33,251.
An alternative would be to buy two out-of-the-money call options. The chart below overlays the two risk curves shown above to allow you to view the difference in the risk/reward profiles. The gray line represents buying 100 shares of QQQ, while the black line represents the 2 calls.
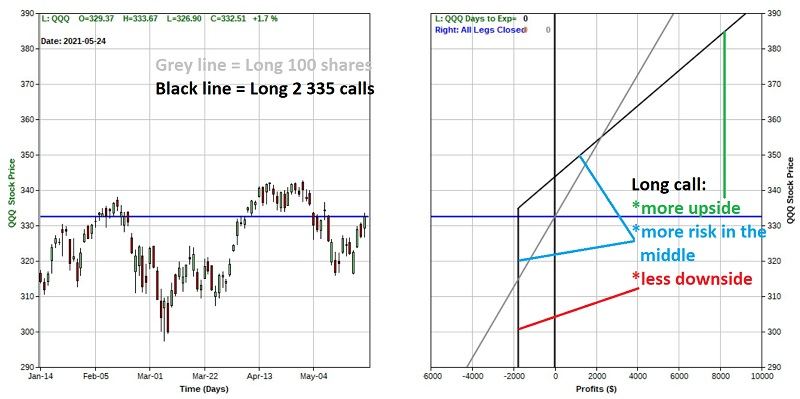
The potential risk in the middle range for the call option is time decay - the fact that options give up their time premium as expiration gets closer.
The good news is that the call option:
- Requires a commitment of only $1,760 instead of $33,521
- Enjoys greater profit potential if QQQ rallies significantly
- Enjoys limited risk if QQQ falls apart
The bad news is that because of time decay if the option position is held all the way through July options expiration AND QQQ is exactly unchanged in price:
- The 100 shares position will have no gain or loss
- The call option position will lose -$1,760
STOCKS AND SECTORS - REAL ESTATE
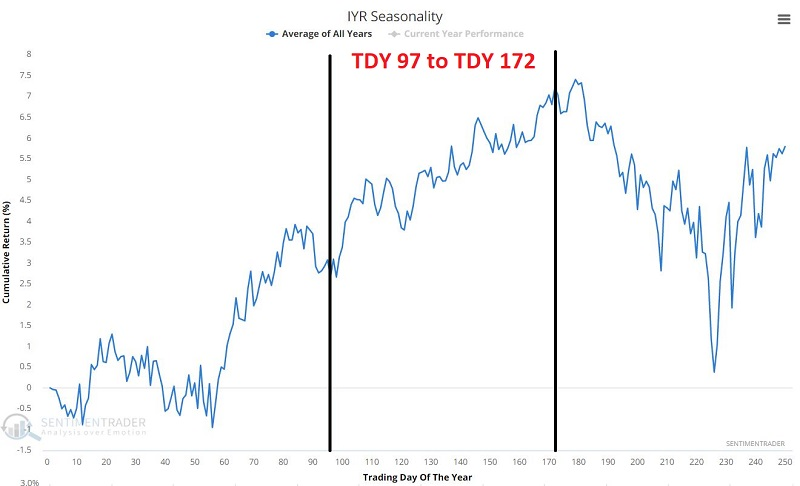
Jay looked at the seasonal tendencies of real estate stocks. An ETF that tracks the Dow Jones U.S. Real Estate Index, IYR, has attempted to break out to new all-time highs in recent months.
The annual seasonal trend for IYR suggests at least giving the bullish case the benefit of the doubt. The chart below displays the annual seasonal trend. As usual, it needs to be remembered that seasonality charts display previous "tendencies" and DO NOT serve as a "roadmap."
That said, IYR has shown a historical tendency to advance between Trading Day of Year (TDY) #97 and #172. In 2021, this equates to the close on 5/21/2021 and the close on 9/8/2021.
Historically, real estate-related stocks have shown a tendency to perform much better during certain "Trading Days of Month" (TDM).
- The first and second trading days of the month (TDM 1 and 2)
- Trading days #10, 11 and 12
- The last 4 trading day of the month (TDM -4, -3, -2, -1, with TDM -1 representing the last trading day of the month)
The table below shows returns when holding IYR only during those most favorable days of the month AND the most favorable part of the year.
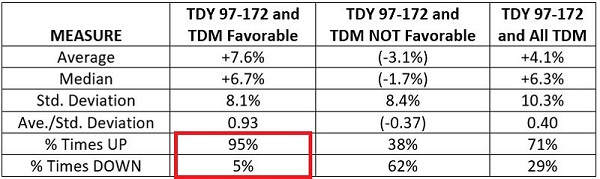
As always, it should be remembered that there are absolutely no "sure things" in trading and that past performance does not guarantee future results.
Speaking of real estate stocks, Jay highlighted the idea that June is often (though not always) unkind to the stock market. Even so, specific sectors have shown a definite tendency to outperform, while others have shown a definite tendency to underperform.
Out of the 11 S&P 500 Sector Indexes starting in 1950, the table below shows the Top 4 performing sectors for June.
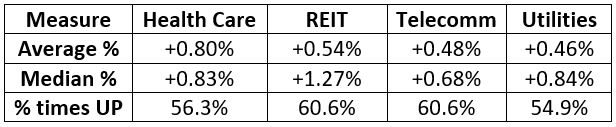
Not exactly barn-burners, but much better than the bottom 4 sectors. The chart below divides the growth of the Top 4 by the growth of the Bottom 4. When the line is rising, it means the Top 4 sectors are outperforming and vice versa.
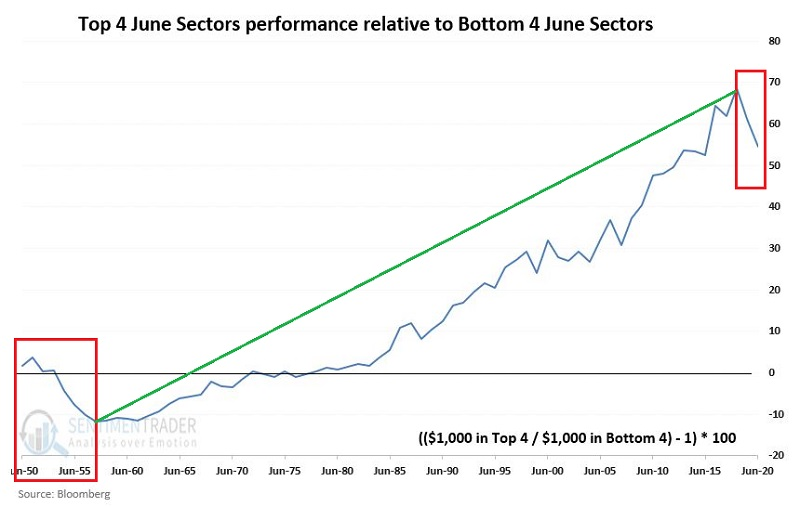
The Top 4 underperformed during the first seven years and last two years of the 1950-2020 test period, however, the Top 4 consistently outperformed the Bottom 4 for the intervening 61 years.
As always, seasonal trends come with the standard caveat that "there is no guarantee regarding what will happen this time around." But if a trader is looking for an "edge," certain sectors appear to be a better bet than others in the month ahead.
STOCKS AND SECTORS - DISNEY
Jay showed that despite excitement for re-opening theme parks and theaters, one of the primary beneficiaries is entering a seasonal headwind.
The chart below displays the cumulative % gain for DIS stock held ONLY from June 1st each year through the end of September that same year, every year since 1962.
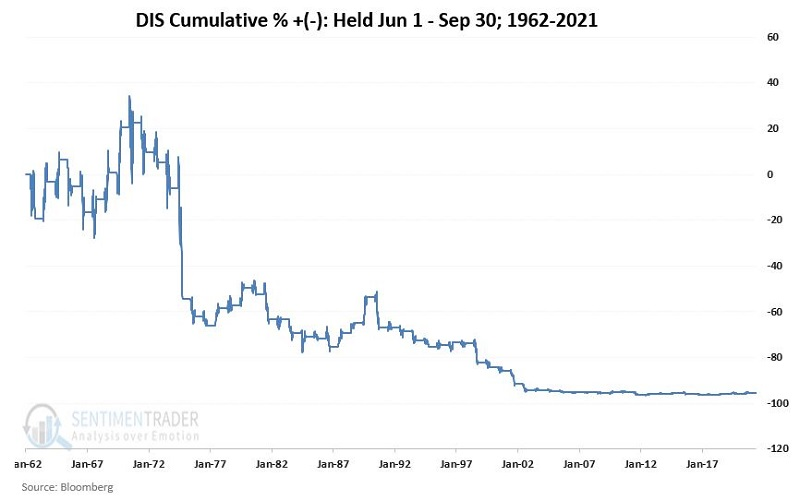
An initial $1,000 investment in DIS stock held only June through September starting in 1962 is worth $44.86 as of 5/21/2021, or a loss of -95.5%.
With June 1st just around the corner, it is worth noting that the June-September period has been pretty rough on DIS stock investors for a long time.
STOCKS AND SECTORS - TAIWAN
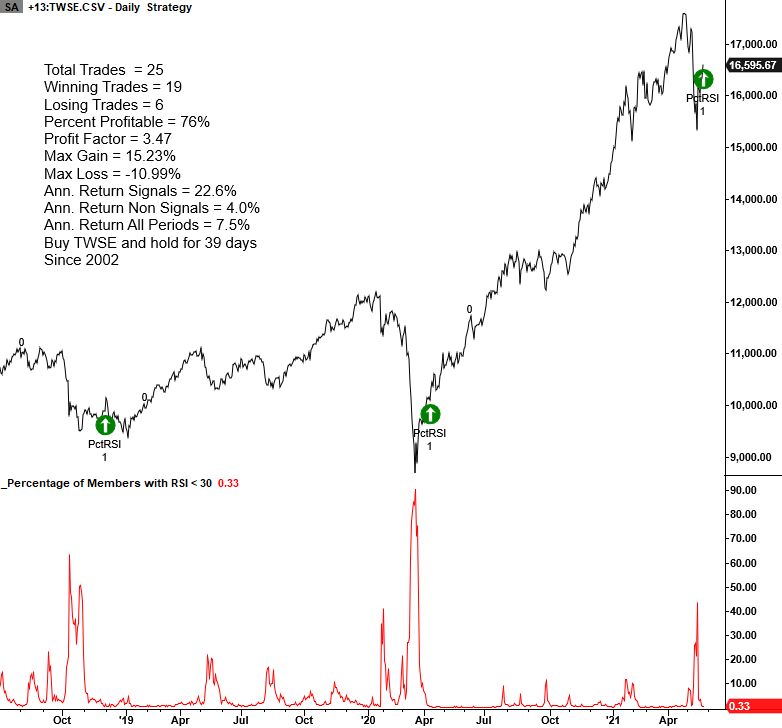
Dean noted another mean reversions signal for Taiwanese stocks.
The percentage of Taiwan (TWSE) members trading below a Relative Strength Index (RSI) level of 30 registered a mean reversion buy signal at the close of trading on May 25. The signal identifies times when the percentage of Index members that are oversold cycles from high to low, and Index momentum is positive.
Dean spotted another signal for these stocks using the percentage of Taiwan Index (TWSE) members trading above their respective 10-day moving average, which registered an oversold to overbought reversal buy signal on May 26.
The oversold to overbought reversal signal identifies instances when the percentage of members trading above their respective 10-day moving average reverses from oversold to overbought in 8 days or fewer.
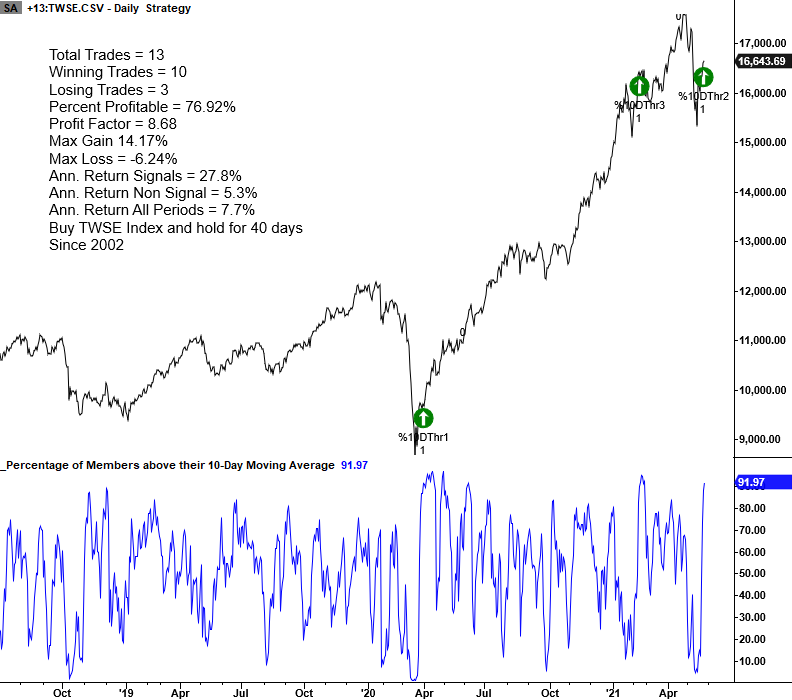
Results look good in the 2-13 week timeframe. However, the 1-week results suggest that the initial momentum takes a break in the short term.
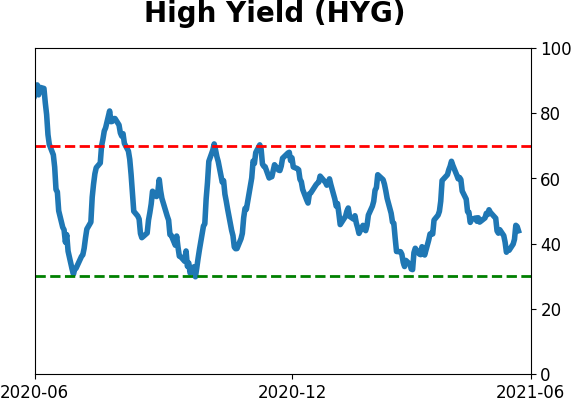
| BONDS | ||
 | ||
Over the past month, about when stocks started to go into a holding pattern, the correlation in daily changes between the VIX "fear gauge" and the yield on 10-year Treasury notes skyrocketed to the highest level since 1999.
10-year Treasury futures prices, which move opposite to its yield, had a strong tendency to decline over the short- t0 medium-term.
| COMMODITIES | ||
 |  | |
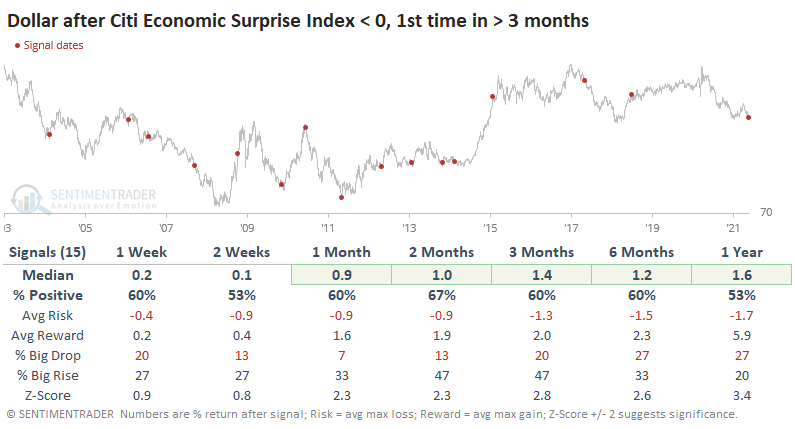
For the first time in a year, economic data is disappointing those who predict it, as noted above. Gold and the dollar showed such consistent behavior after these episodes that it pays to take a look.
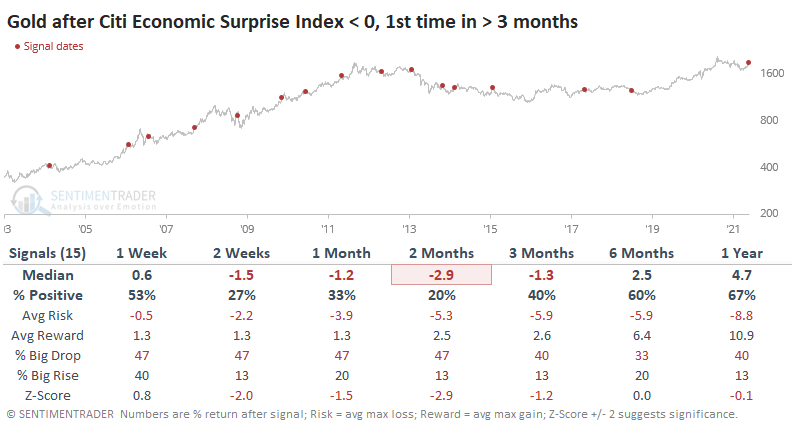
It was not a good sign for the yellow metal. Gold consistently tanked after surprises turned negative, with 14 out of the 15 signals showing a negative return sometime between 2-12 weeks later.
This is due in part to the U.S. dollar, which tended to rally after these signals.
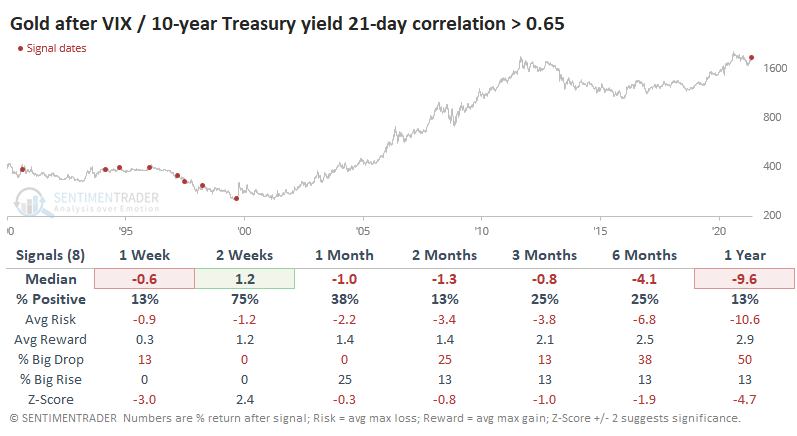
Lately, the narrative has been that stocks have stalled because of fears over inflation. We saw on Wednesday that those fears are valid - when an investor is losing money on earnings after inflation, stocks have often tanked.
Over the past month, about when stocks started to go into a holding pattern, the correlation in daily changes between the VIX "fear gauge" and the yield on 10-year Treasury notes skyrocketed to the highest level since 1999.
When investors had been this focused on yields, gold took it on the chin.
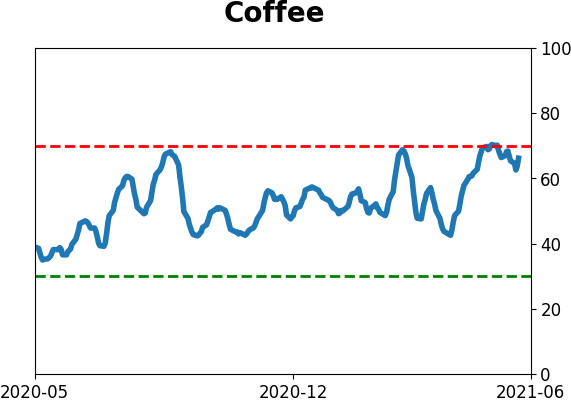
COFFEE HAS HIGH OPTIMISM AND POOR SEASONALITY
Jay pointed out that coffee has something to prove as optimism is high and declining.
The chart below displays those times in the last 10 years when The 5-day average for Coffee Optix dropped from above to below 68%.
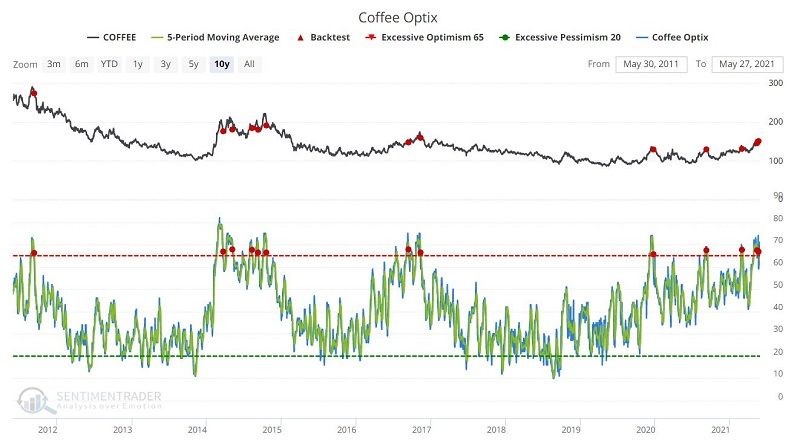
In the table below, you can see that the above has NOT been a favorable sign for Coffee during the last 10 years - particularly 3 and 12 months later. This DOES NOT mean that Coffee is doomed to decline. However, it does appear to argue for a more cautious approach.
Coffee is a volatile market. And when it decides it "wants to go," it "goes," and nothing seemingly can hold it back. If this happens to be one of those times, then a massive continuation of the recent advance is absolutely possible.
Repeating now, trading is a game of odds. And it appears that the odds may be stacked against Coffee, at least for the near future, especially as it enters what has traditionally been its weakest seasonal window.
BITCOIN FINALLY DROPS BELOW ITS 200-DAY
Cryptocurrencies have had one of the most explosive weeks in years.
After a plunge, recovery, plunge, and another recovery, traders became pessimistic enough to push the Crypto Fear & Greed model below 12%, the lowest in over a year.
More than any other factor, volatility drives sentiment, especially in this market. When we use 5 academic models to craft a synthetic VIX for bitcoin, it spits out a number that has been matched few times in bitcoin's history, at just over 200%.
There have been six other times when volatility exploded like this. Forward returns in bitcoin were do-or-die, and mostly the latter.
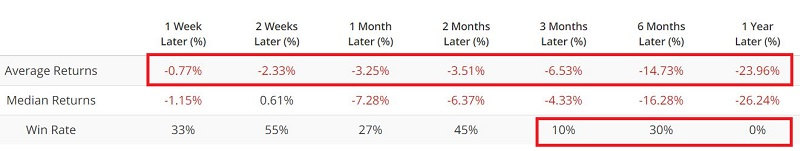
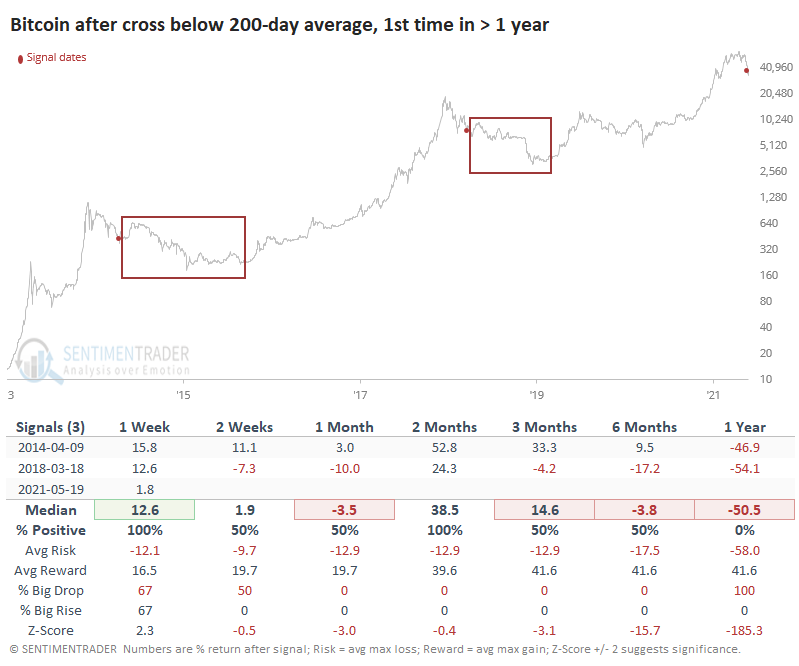
This volatility has pushed bitcoin below its 200-day average. Thus ends the coin's 3rd-longest streak above its 200-day average.
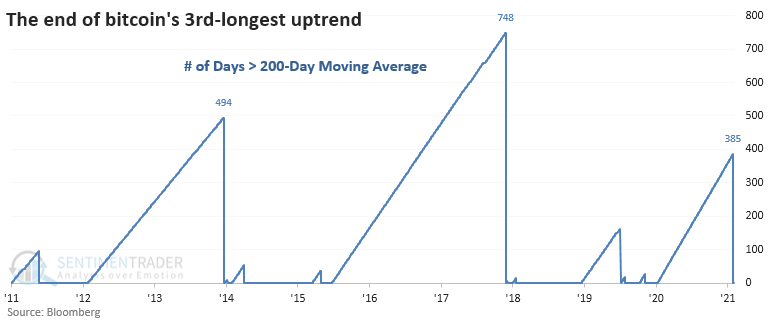
After the ends of the other two longest streaks, the next year or so was...uncomfortable. So much for diamond hands and laser eyes.
The spike in volatility due to the crash last week punctured the bubble of optimism surrounding crypto in general and pushed most measures, like our Bitcoin Optimism Index and others, to the lowest levels in years, or nearly so. Other times we've seen that bitcoin has typically rebounded.
The biggest "but" is that usually, we've seen that kind of pessimism after many months of declines. When we see it due to a sudden volatility event quickly following new highs in crypto, it's been during long-term topping events. The end of the streak above the 200-day average, and the gigantic spike in volatility, are not good signs if history is any kind of a guide at all here. We'd put more weight on that than the shorter-term signs of fear.
Active Studies
|
|
|
|
|
|
Indicators at Extremes
|
|
|
Portfolio
|
|
|
|
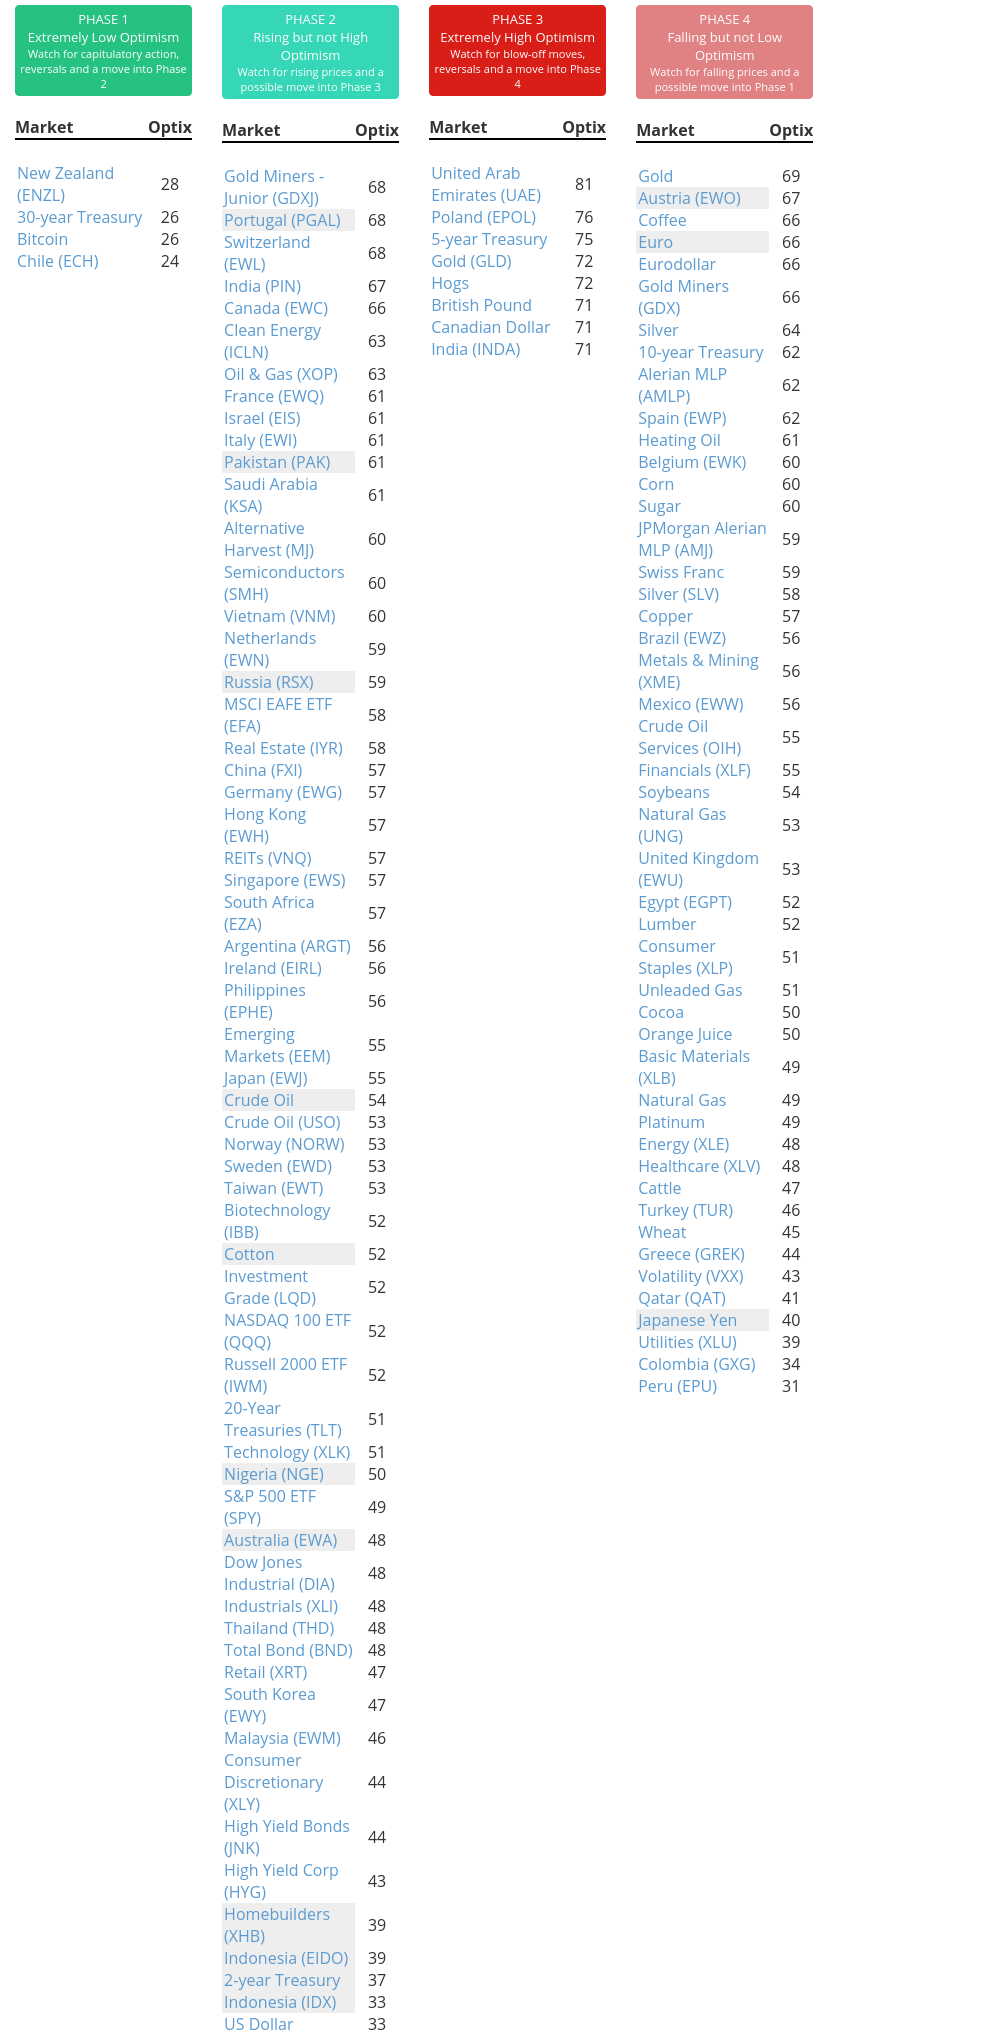
Phase Table
|
|
|
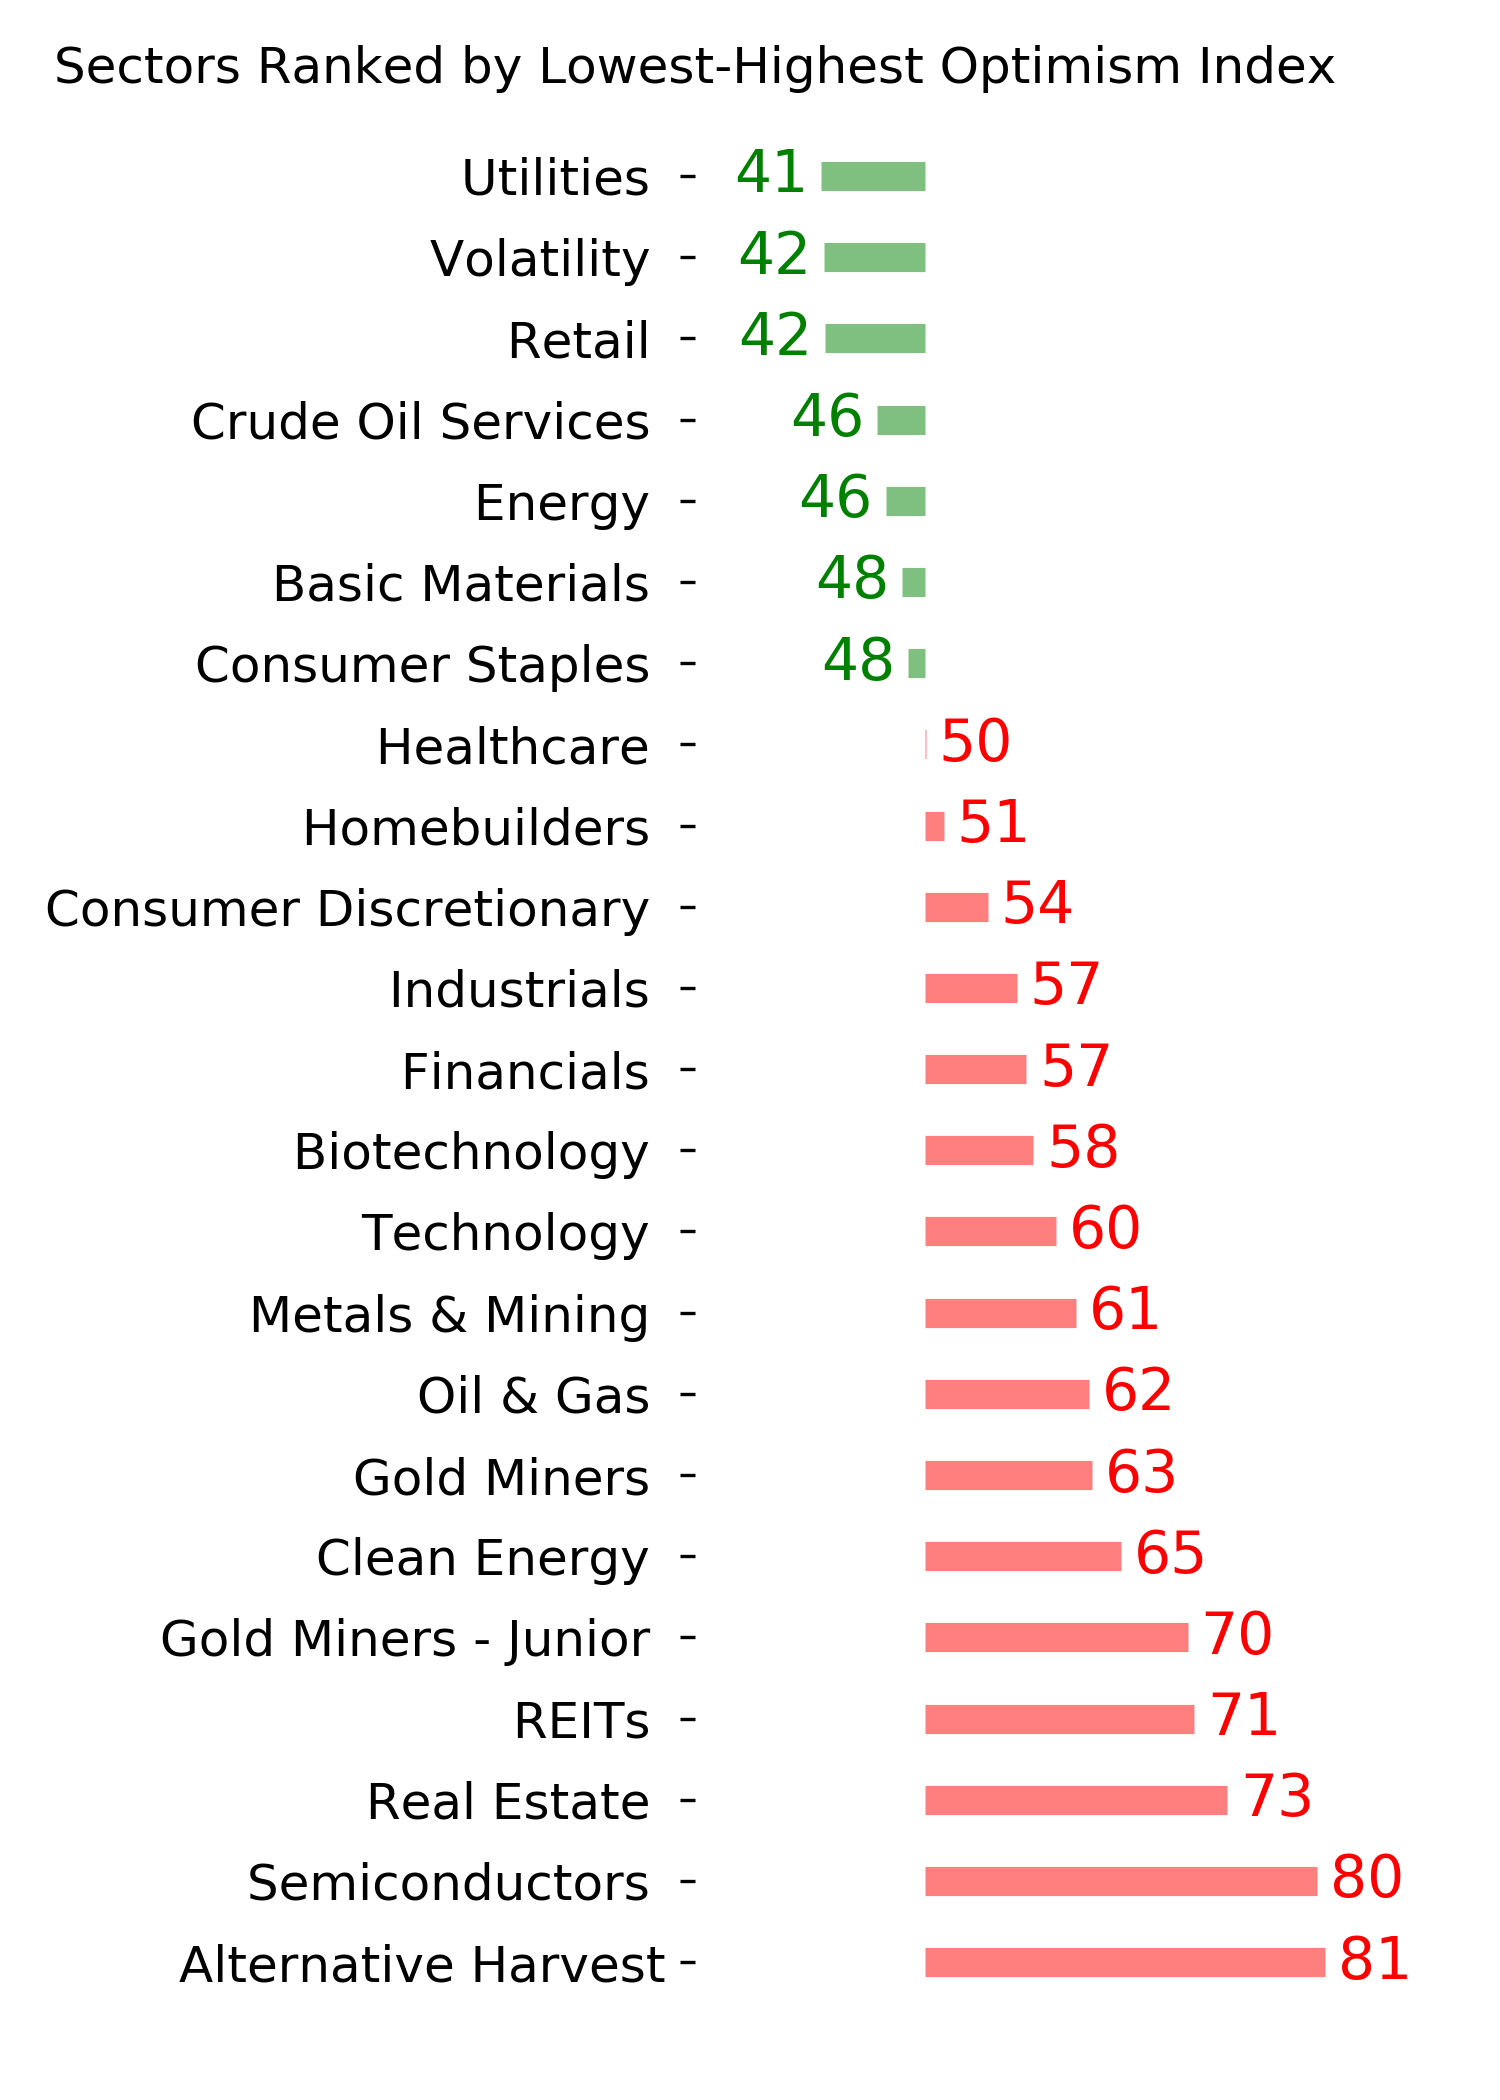
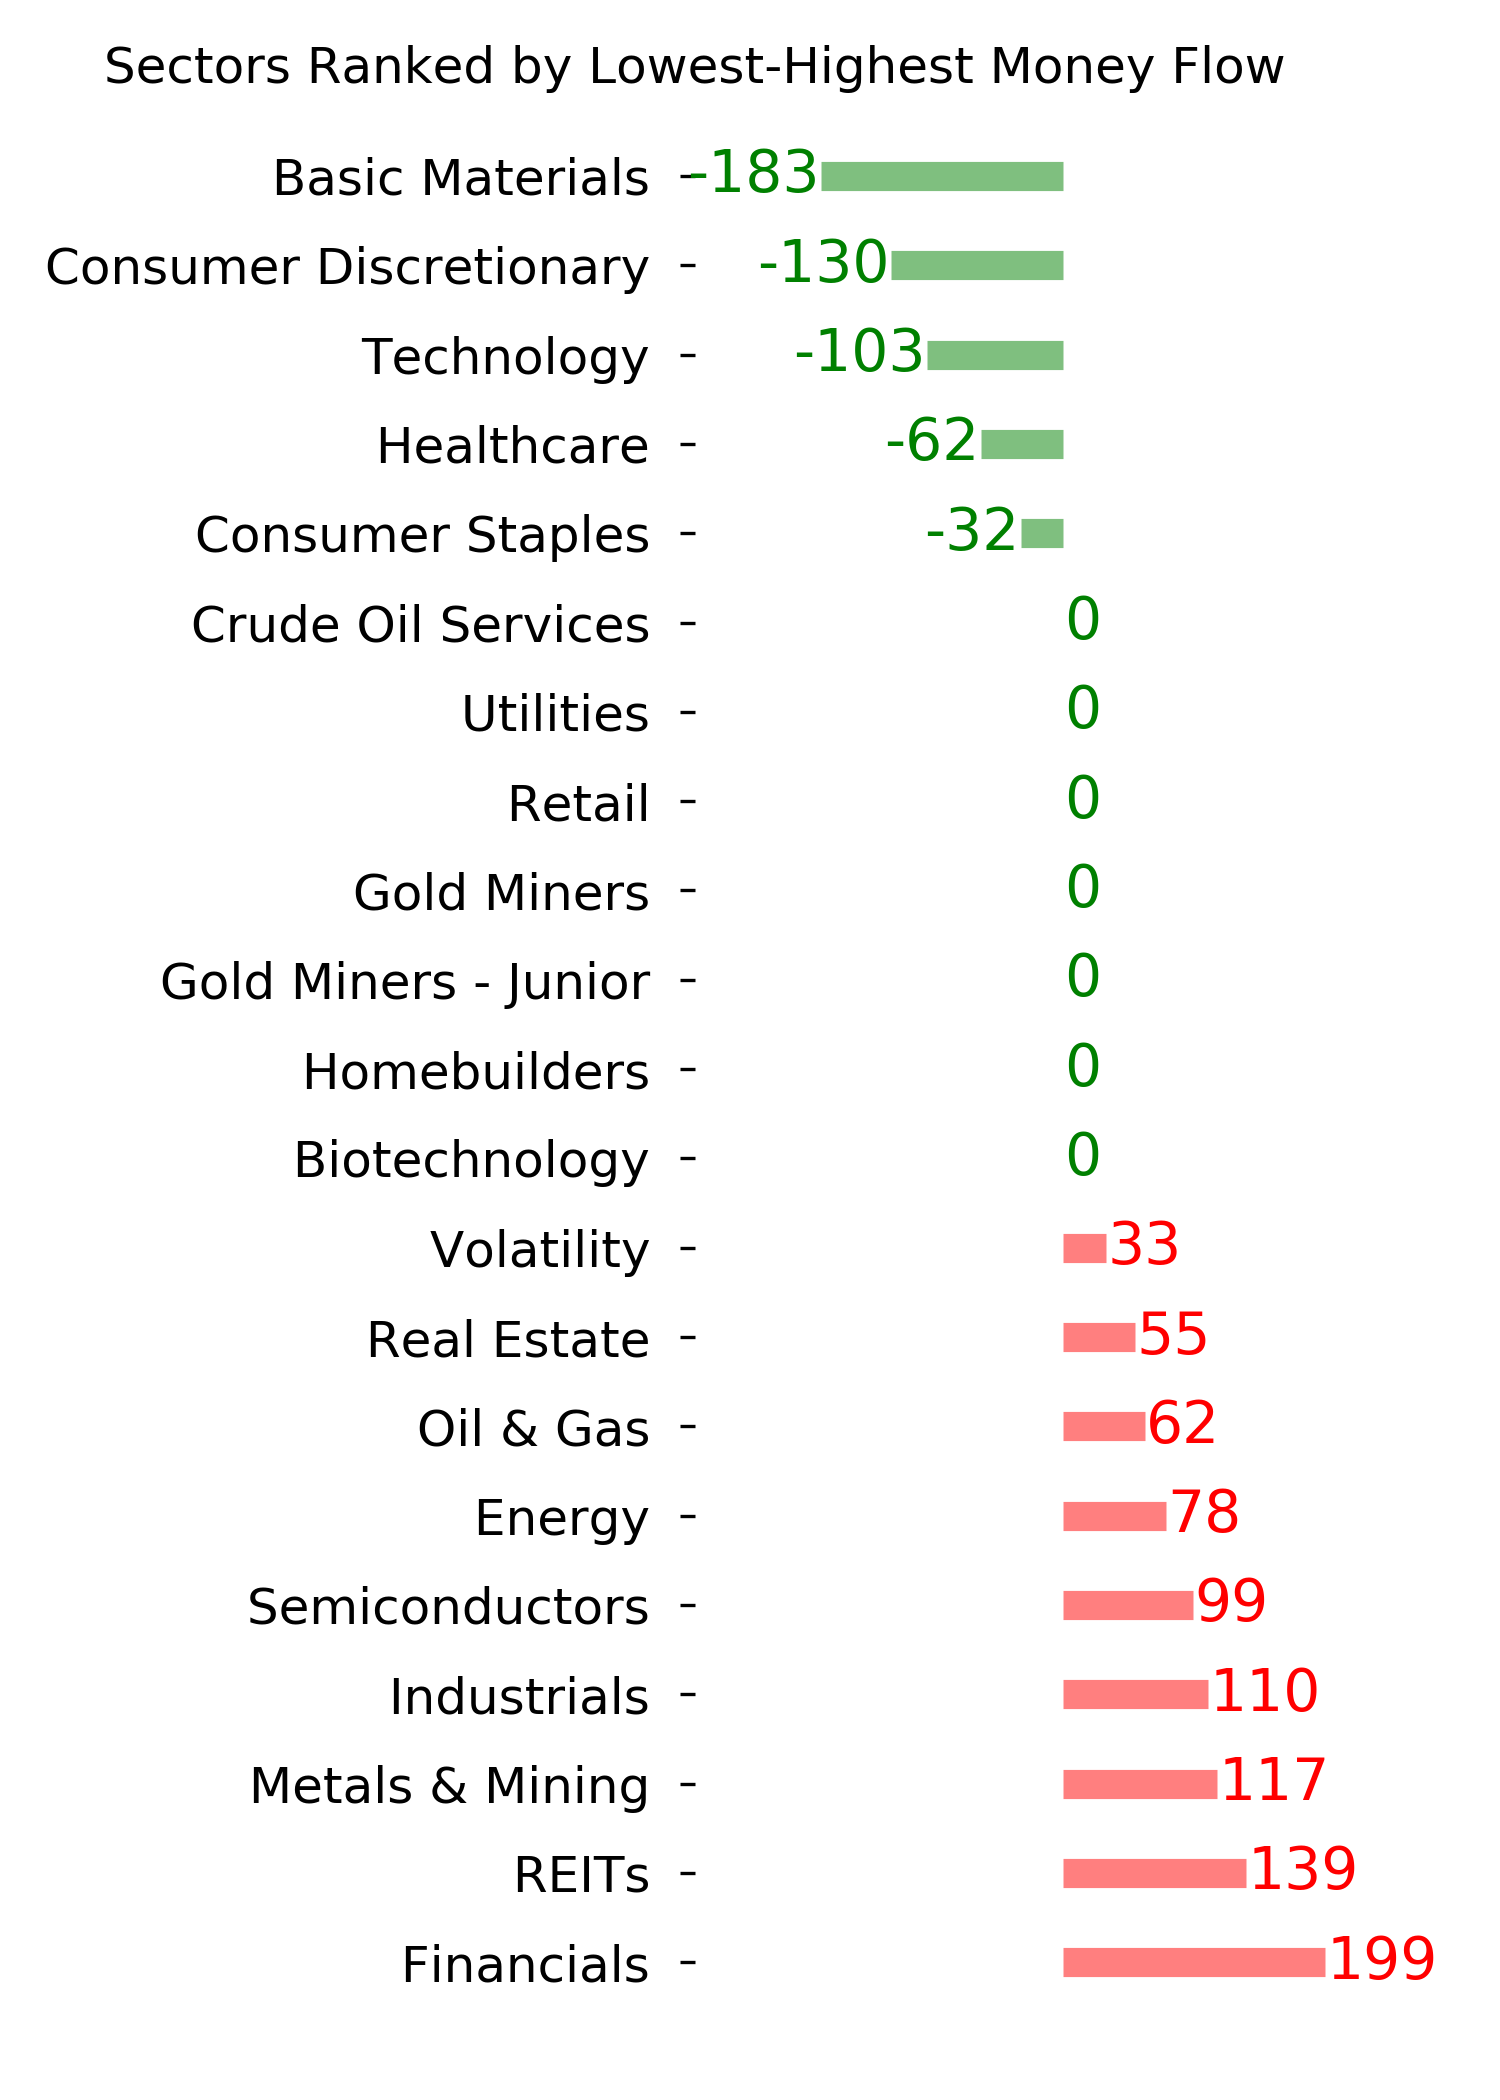
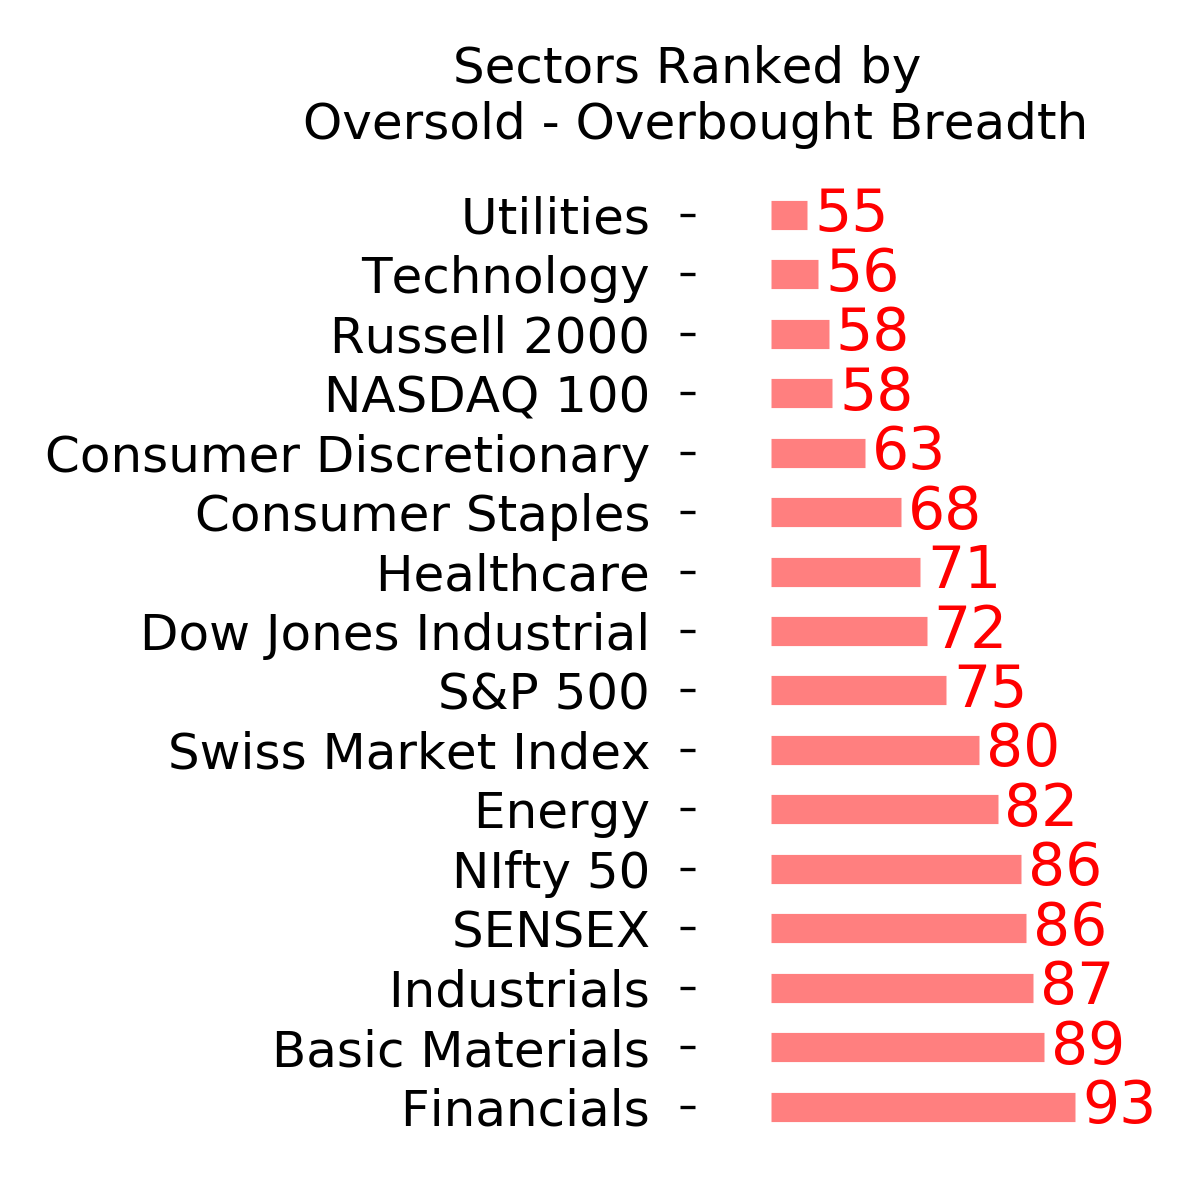
Ranks
|
|
|
|
|
|
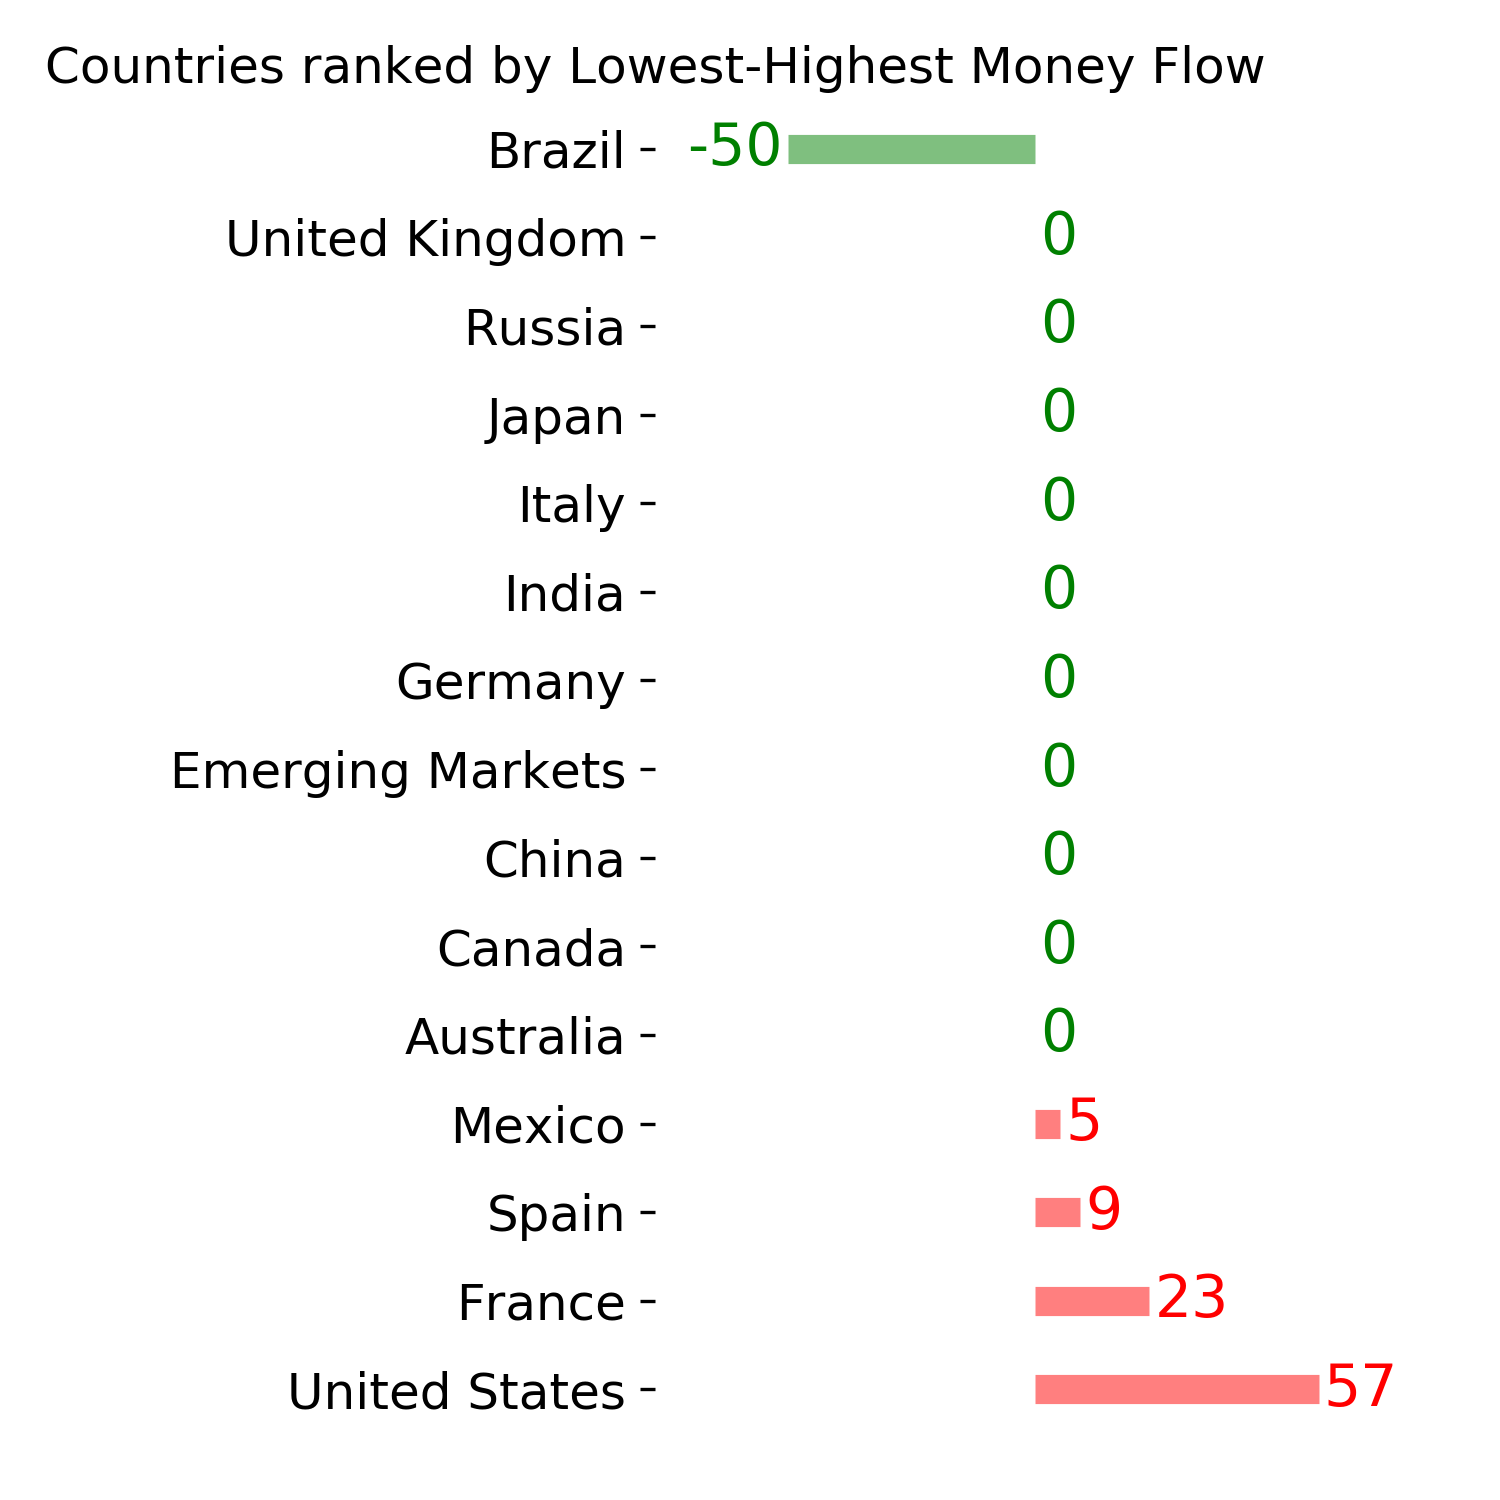
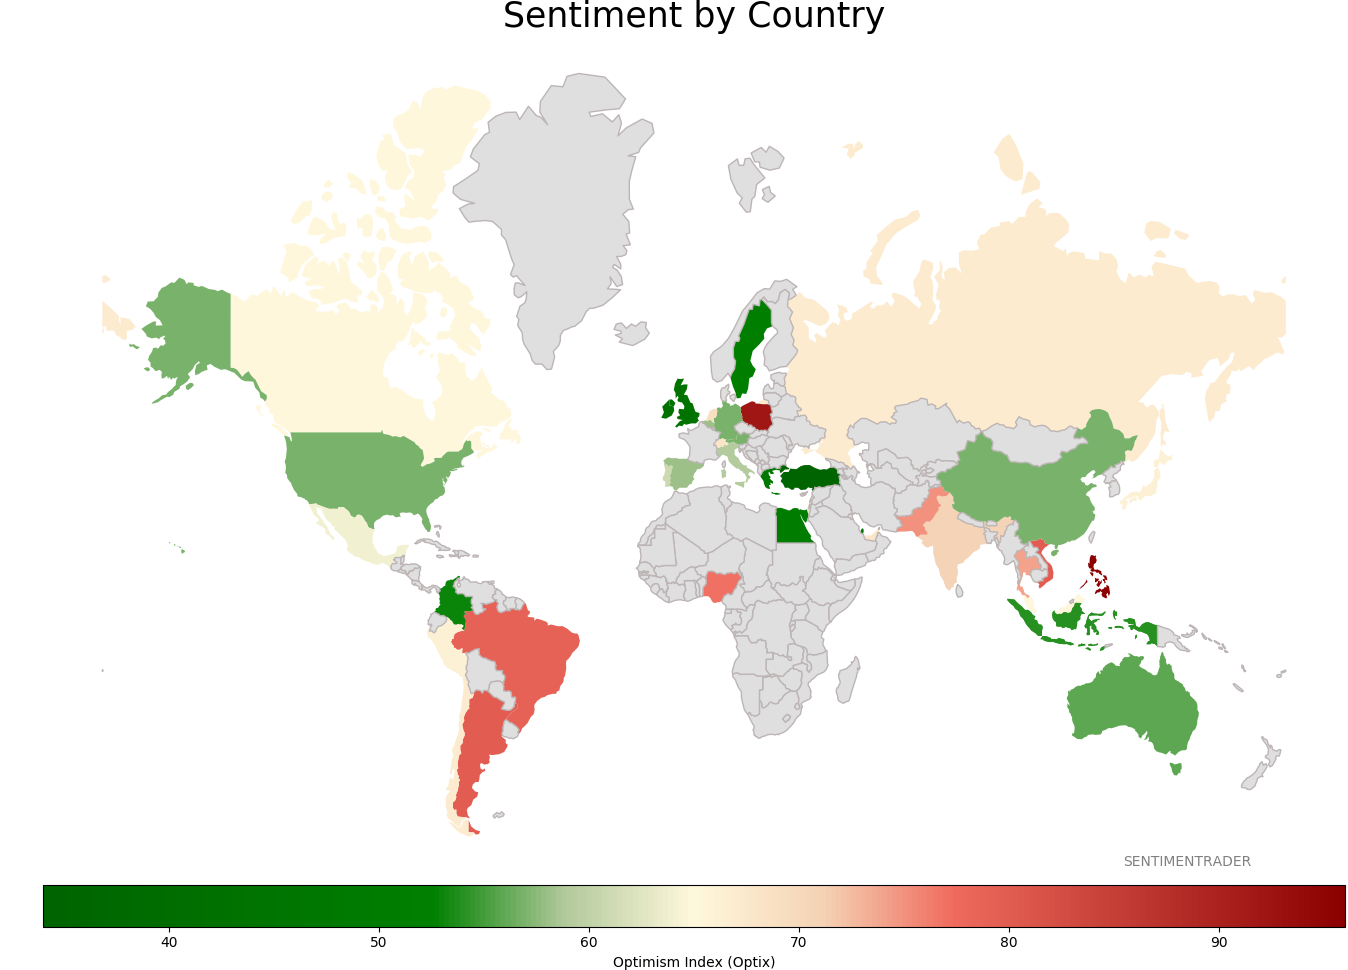
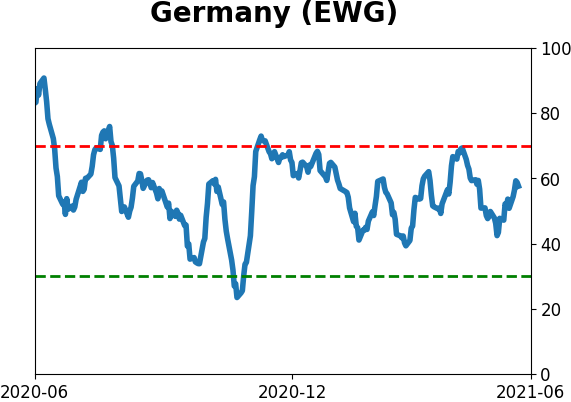
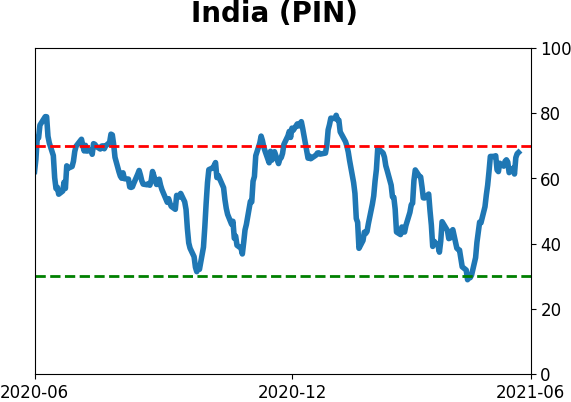
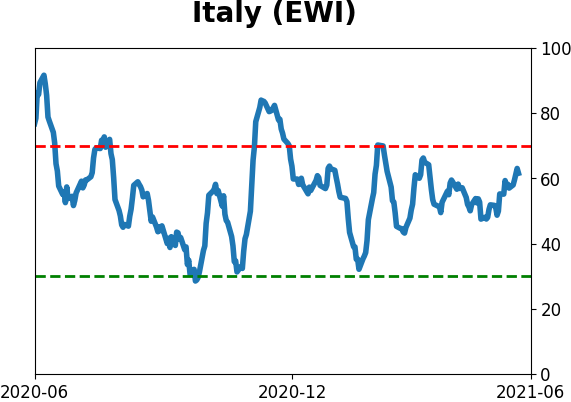
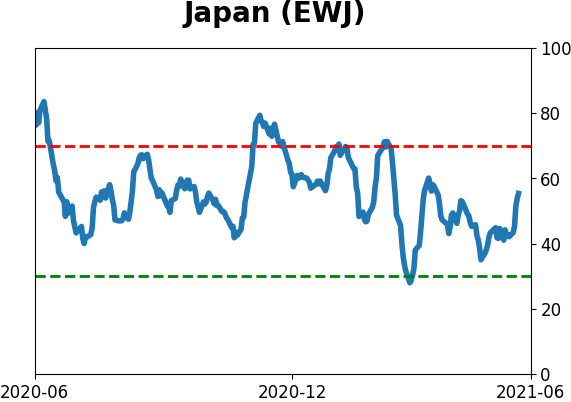
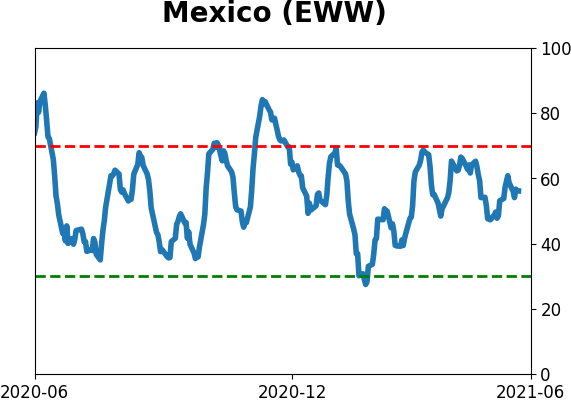
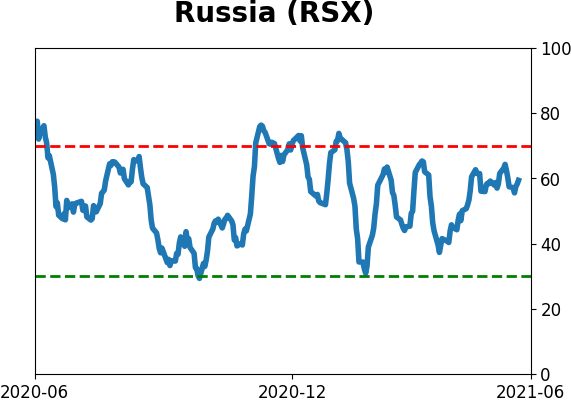
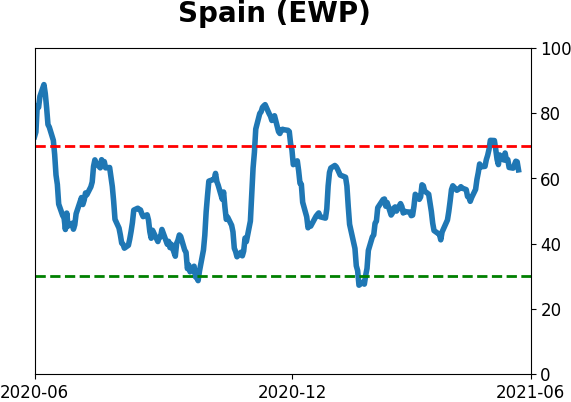
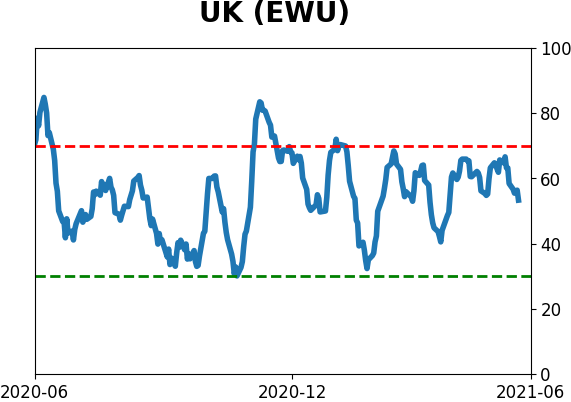
Sentiment Around The World
|
|
|
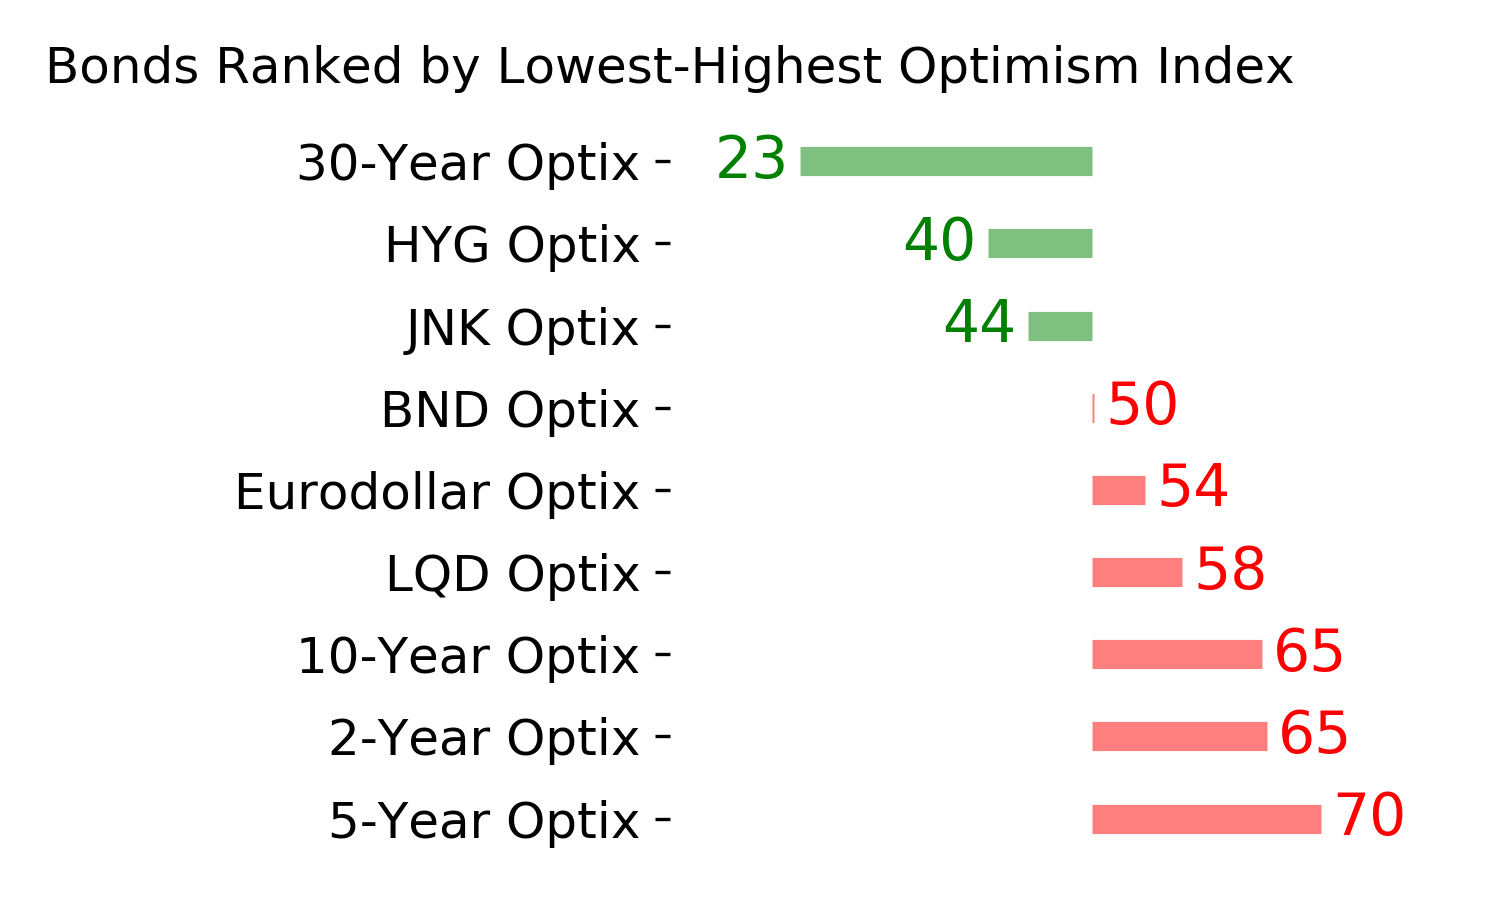
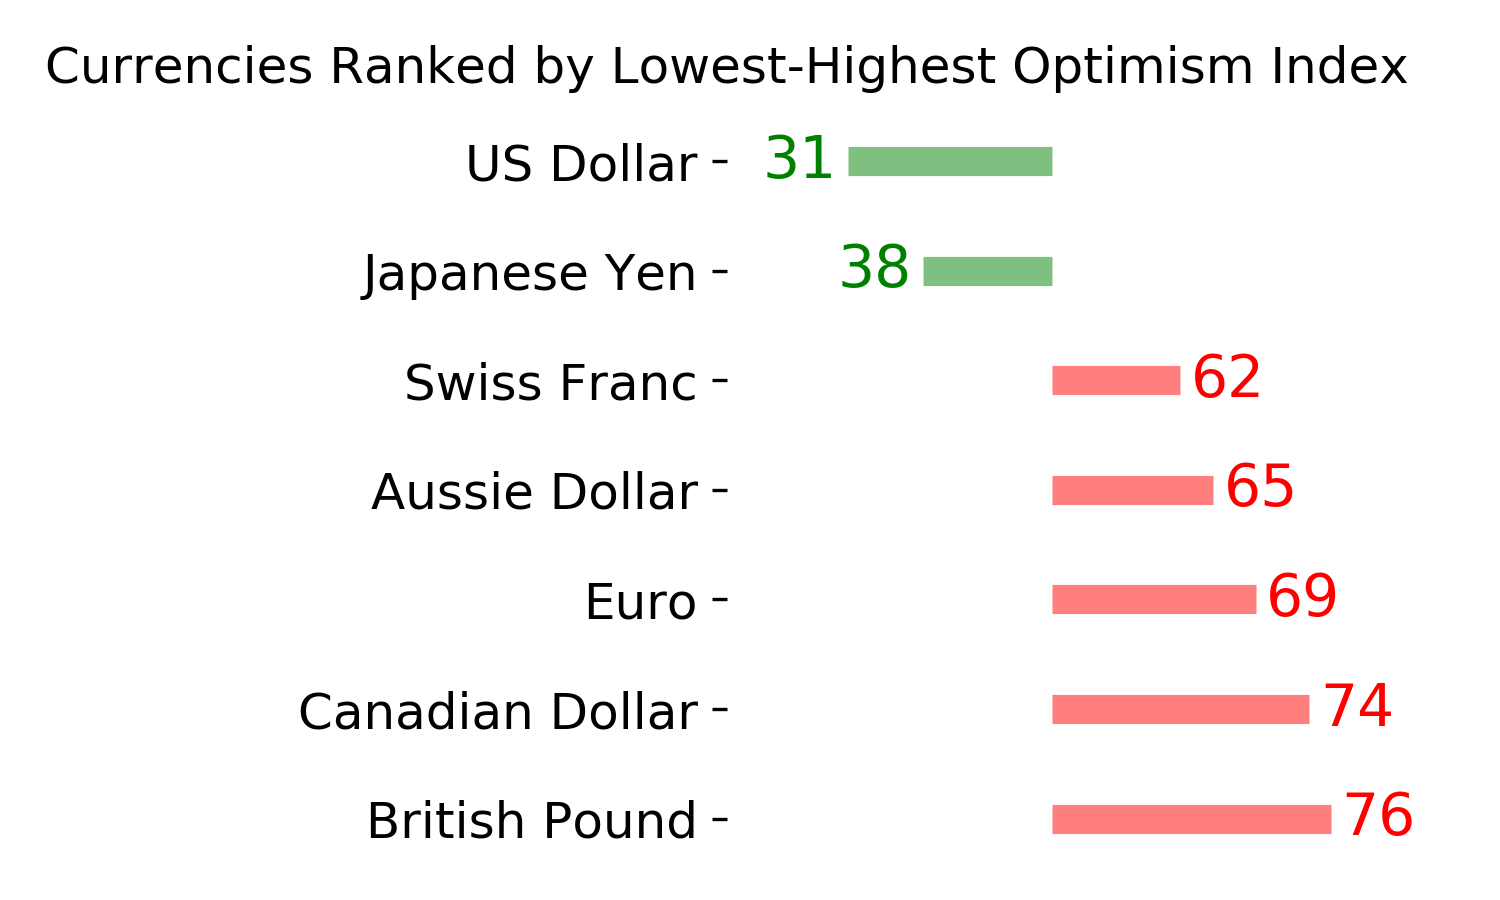
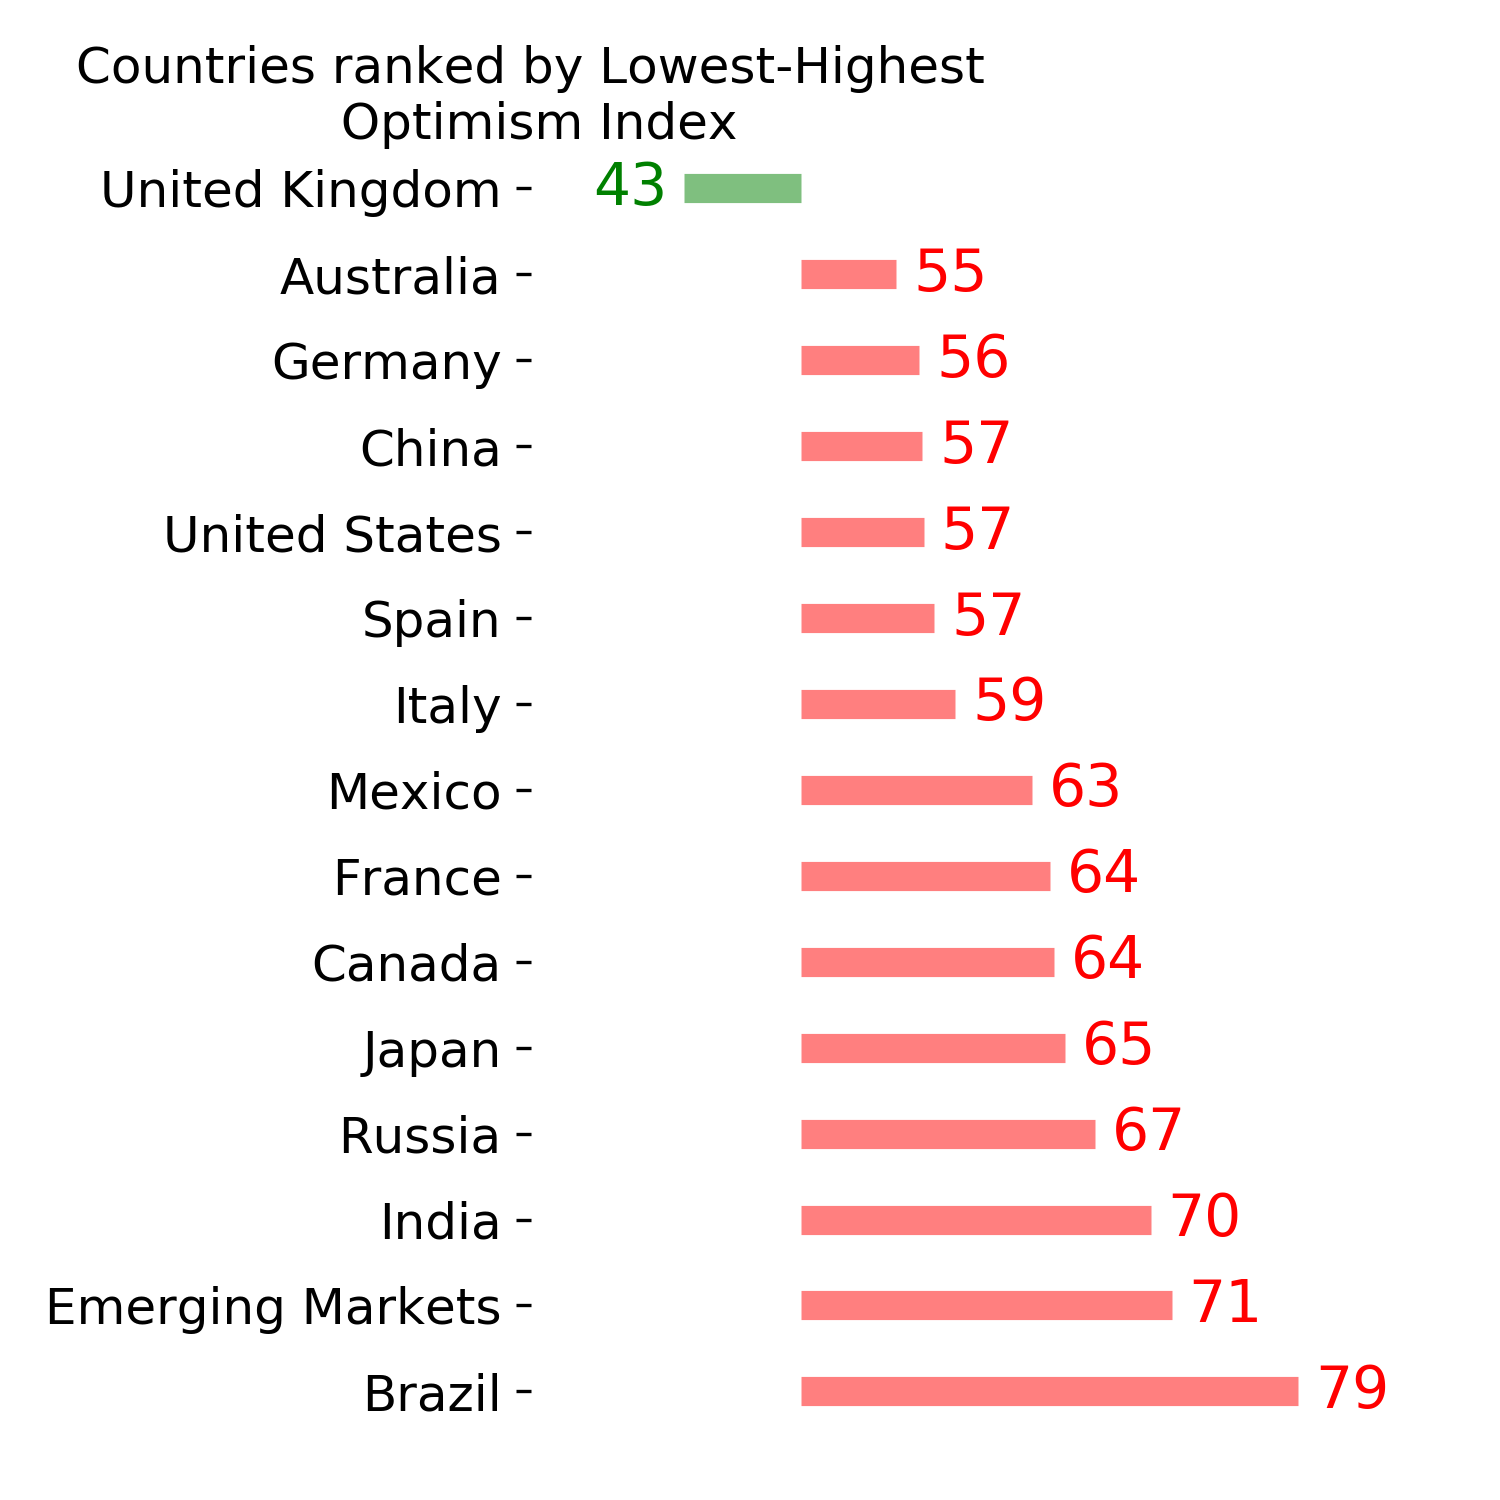
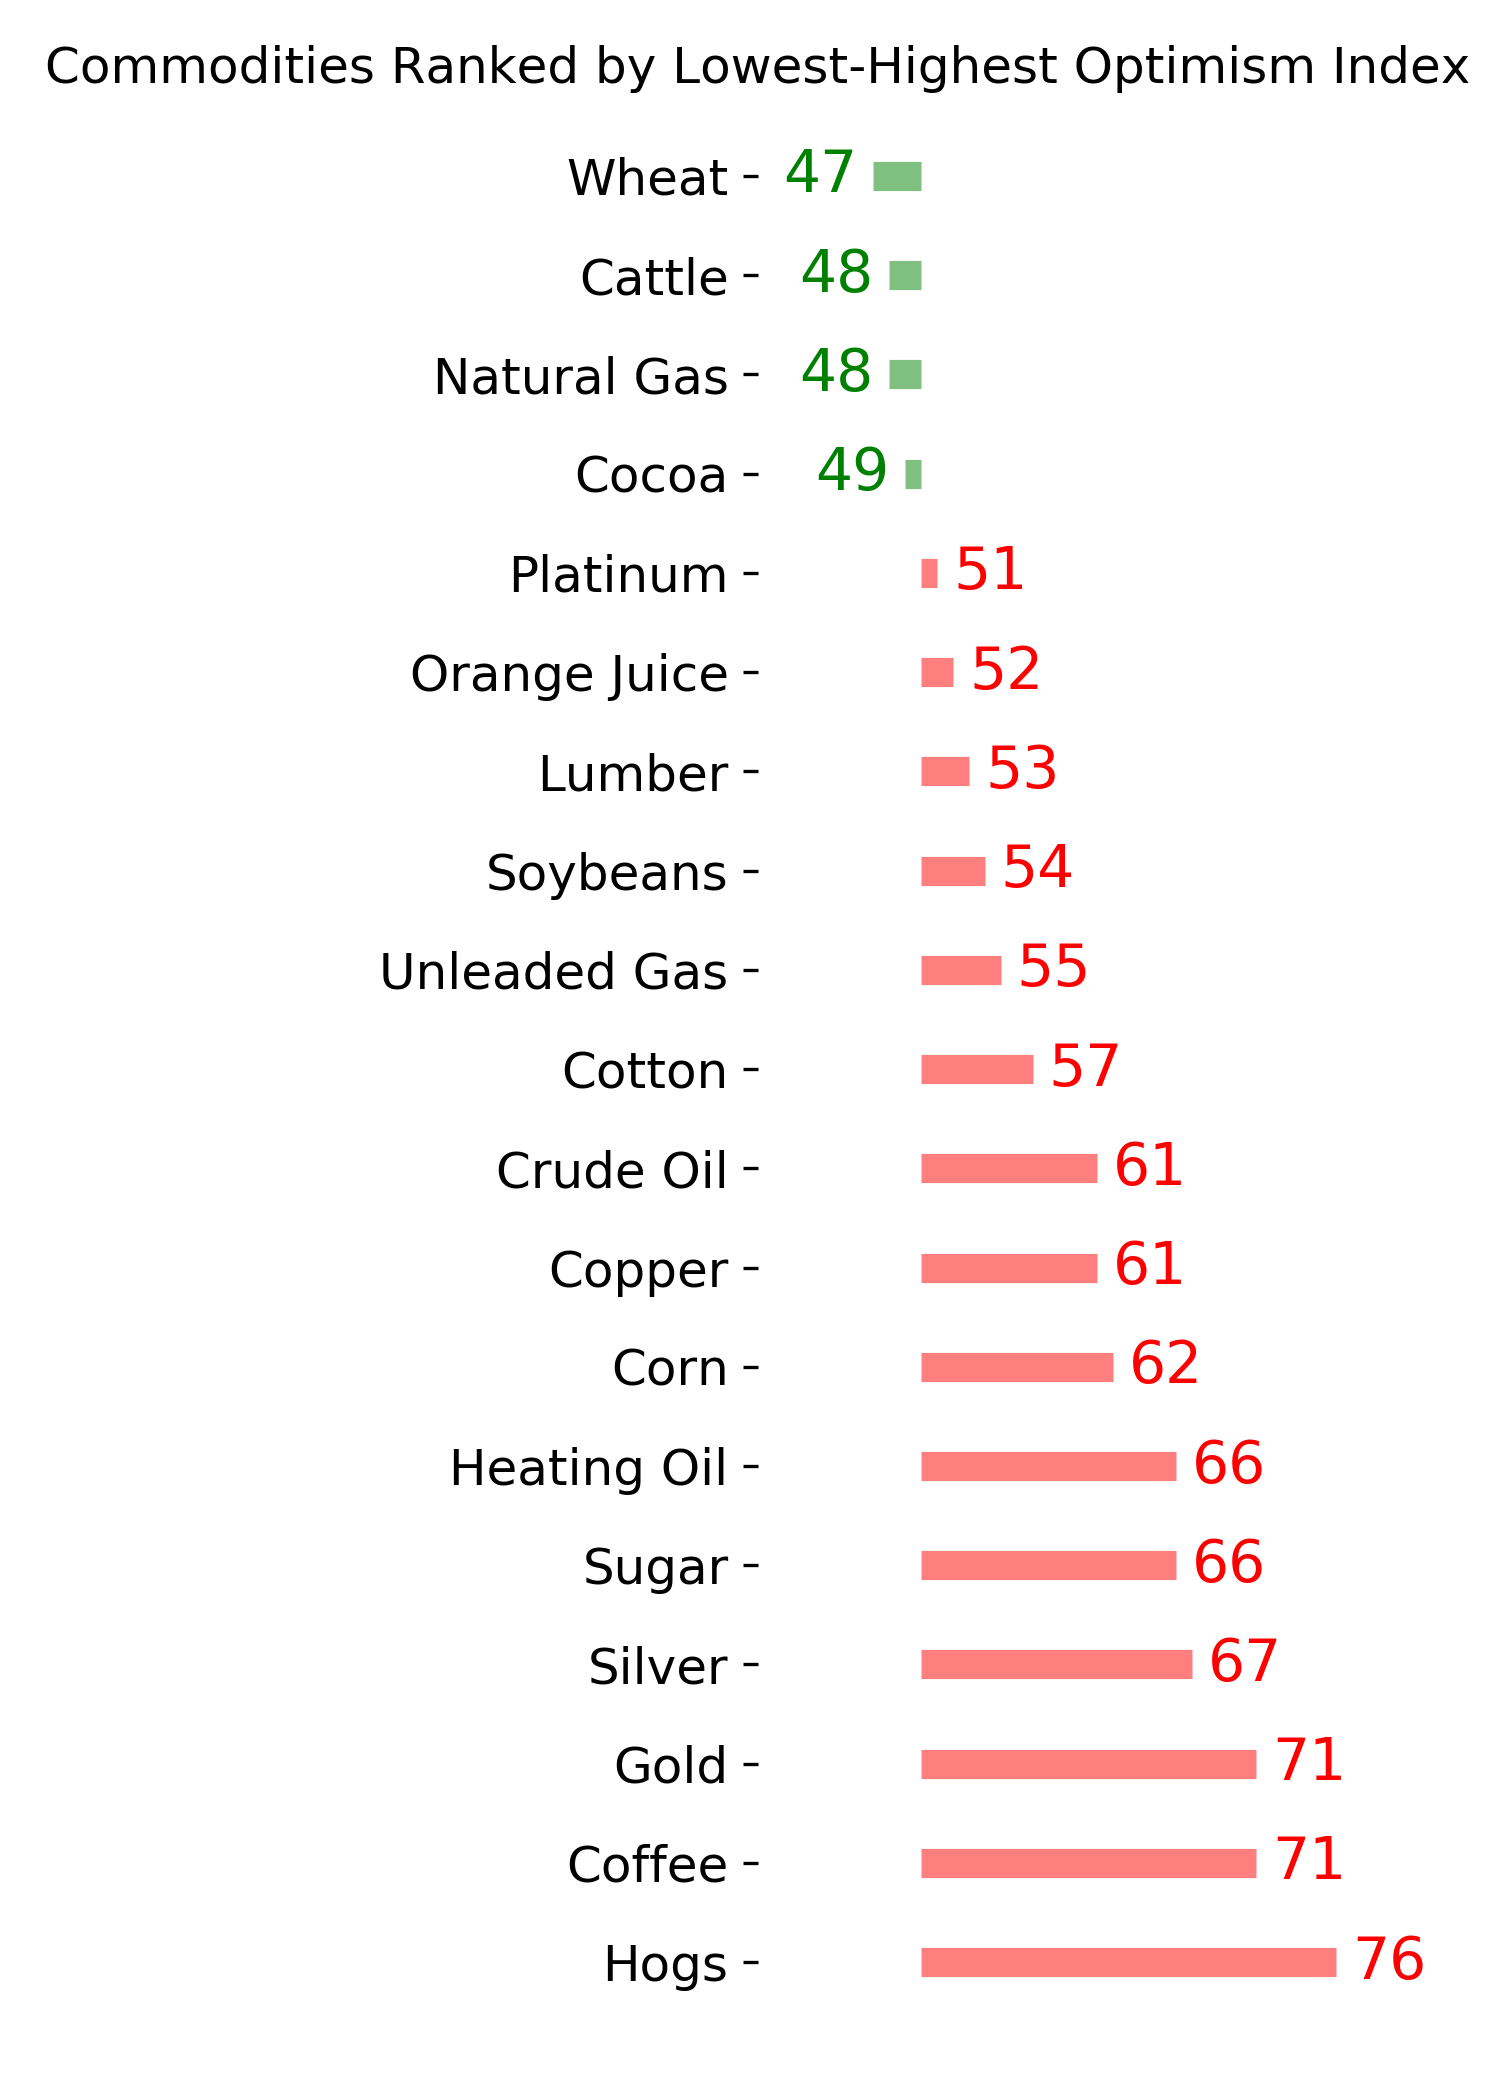
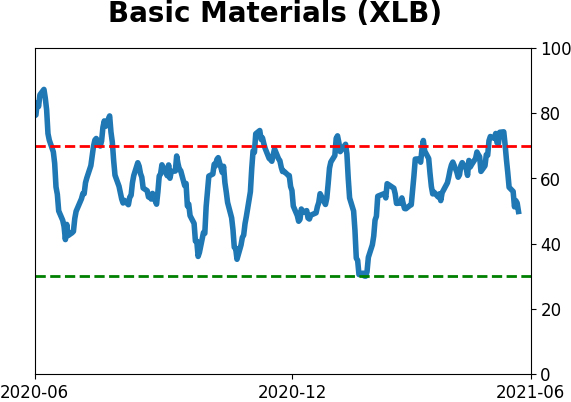
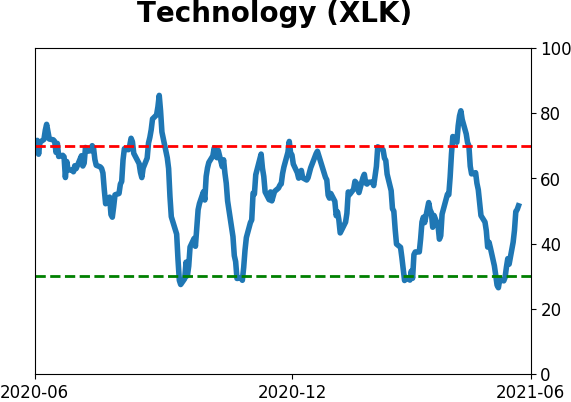
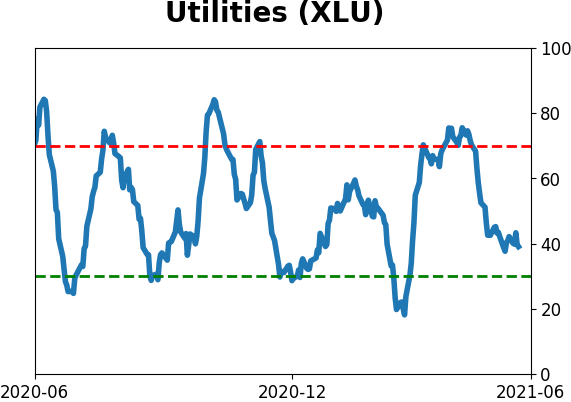
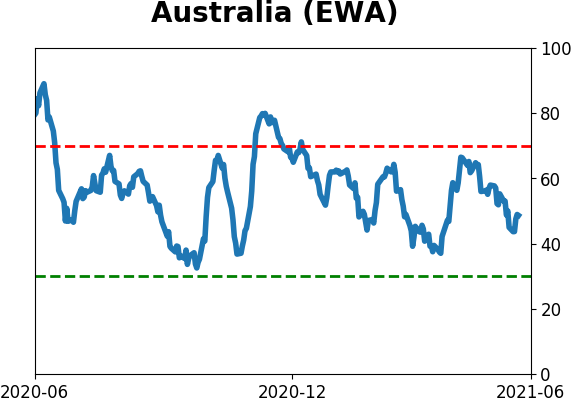
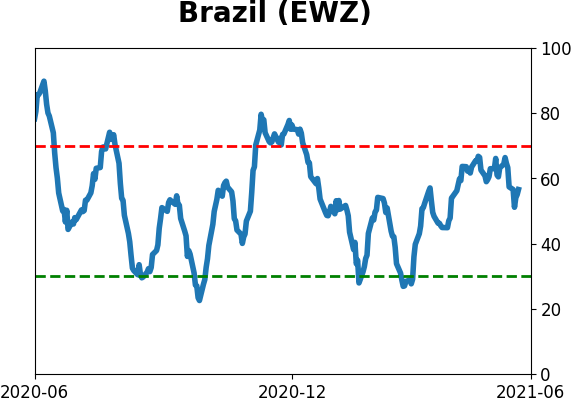
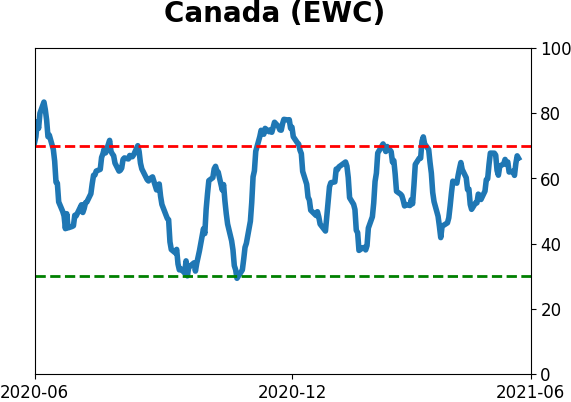
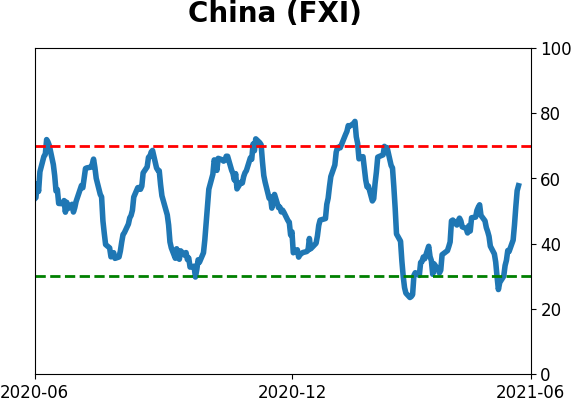
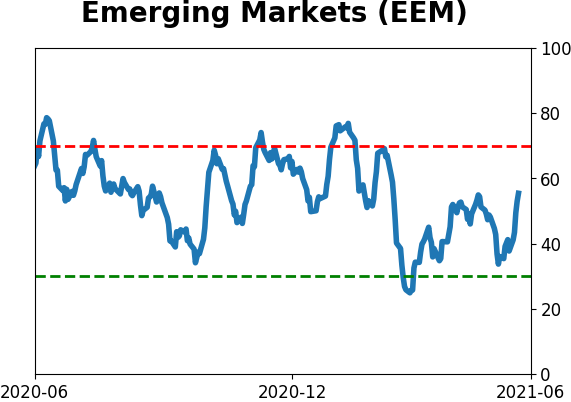
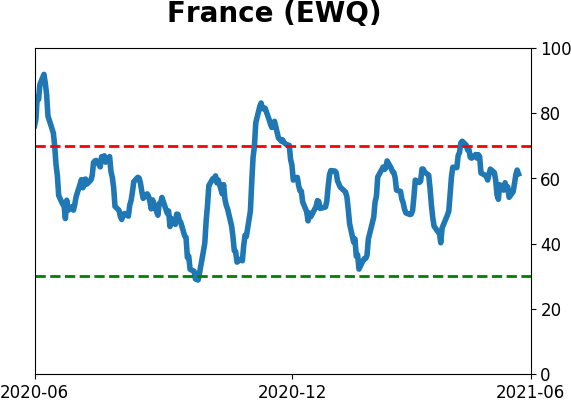
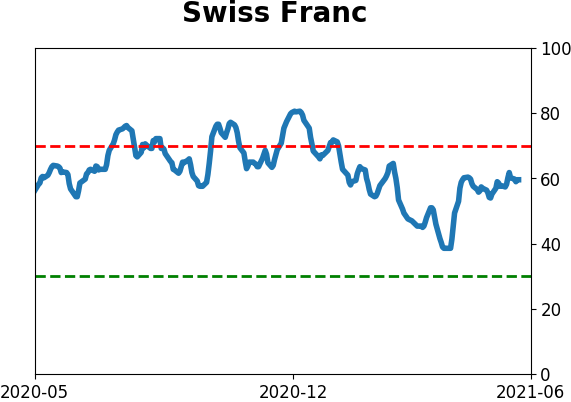
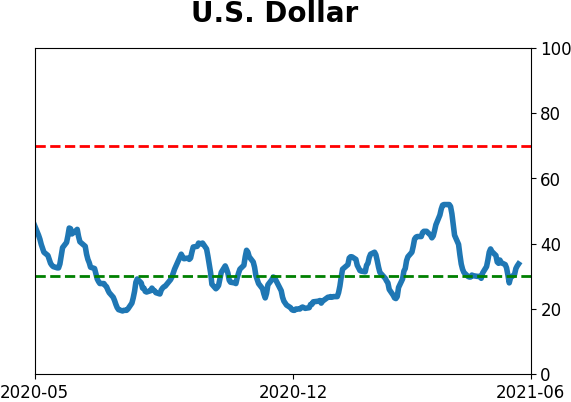
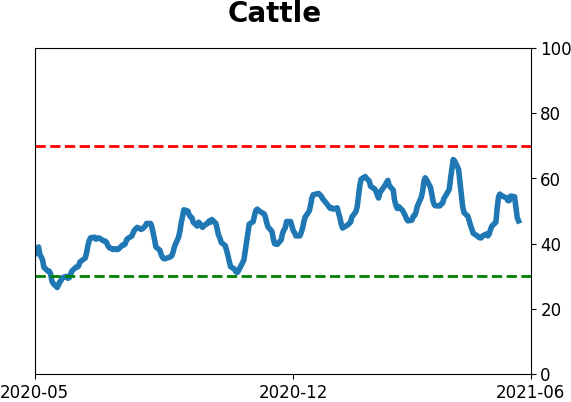
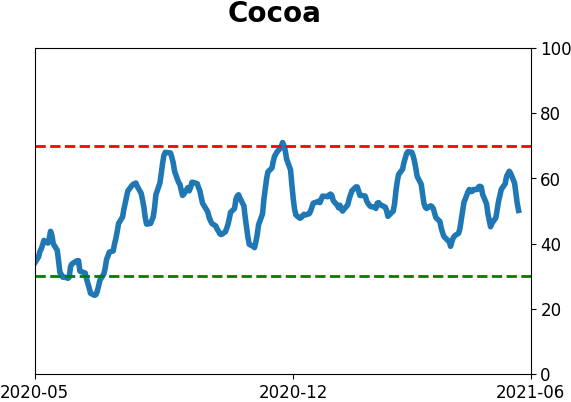
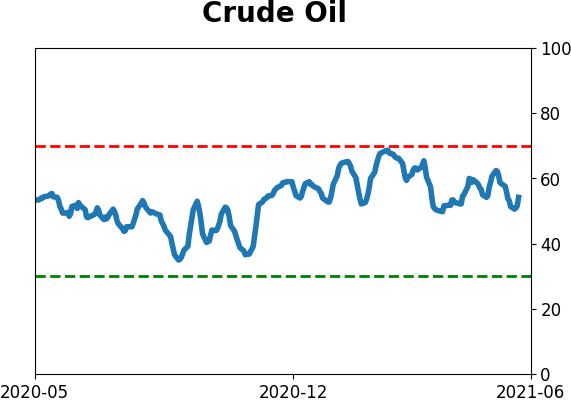
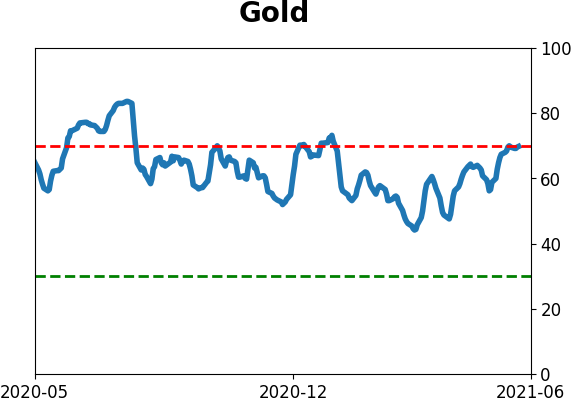
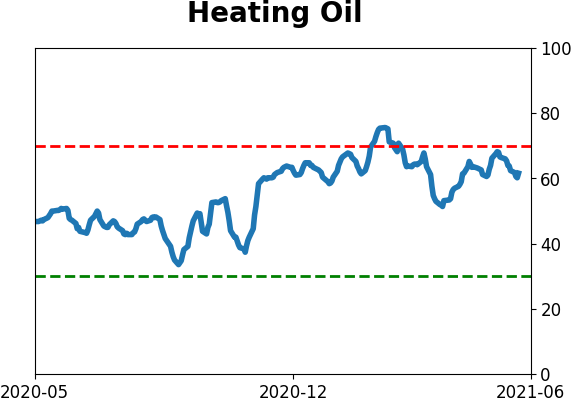
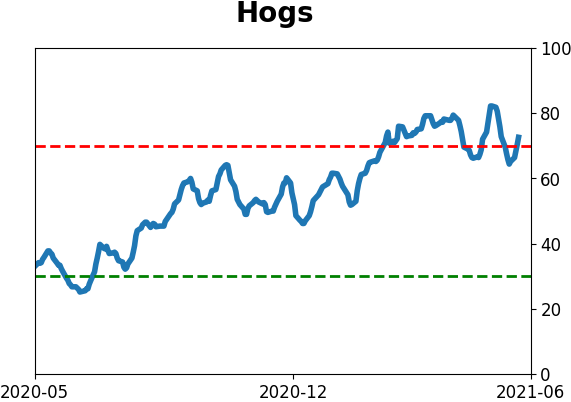
Optimism Index Thumbnails
|
|
|
|
|
|
|
|
|
|
|
|
|
|
|
|
|
|
|
|
|