Daily Report : TradingEdge Weekly for May 27 - Severe selling led to extreme pessimism, insiders are buying, bond rebound

| View/Print a PDF version of this Report |
Headlines
|
TradingEdge Weekly for May 27 - Severe selling led to extreme pessimism, insiders are buying, bond rebound: This week, we saw stocks trying to rebound from near-record losing streaks. That has weighed on sentiment, which is extremely pessimistic and at a level that has preceded relief rallies. Bond sentiment was almost as pessimistic but is starting to turn as investors' fears turn toward growth instead of inflation. The dollar is facing some headwinds. If it declines, it would help gold and miners, which have been hit hard. |
Smart / Dumb Money Confidence
|
|
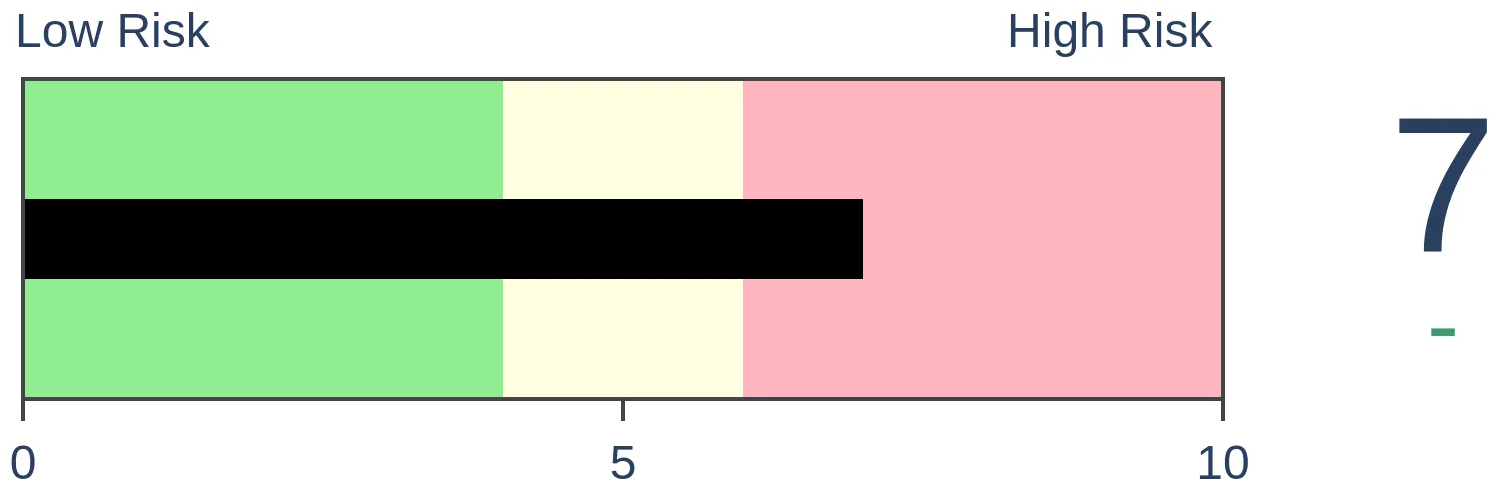
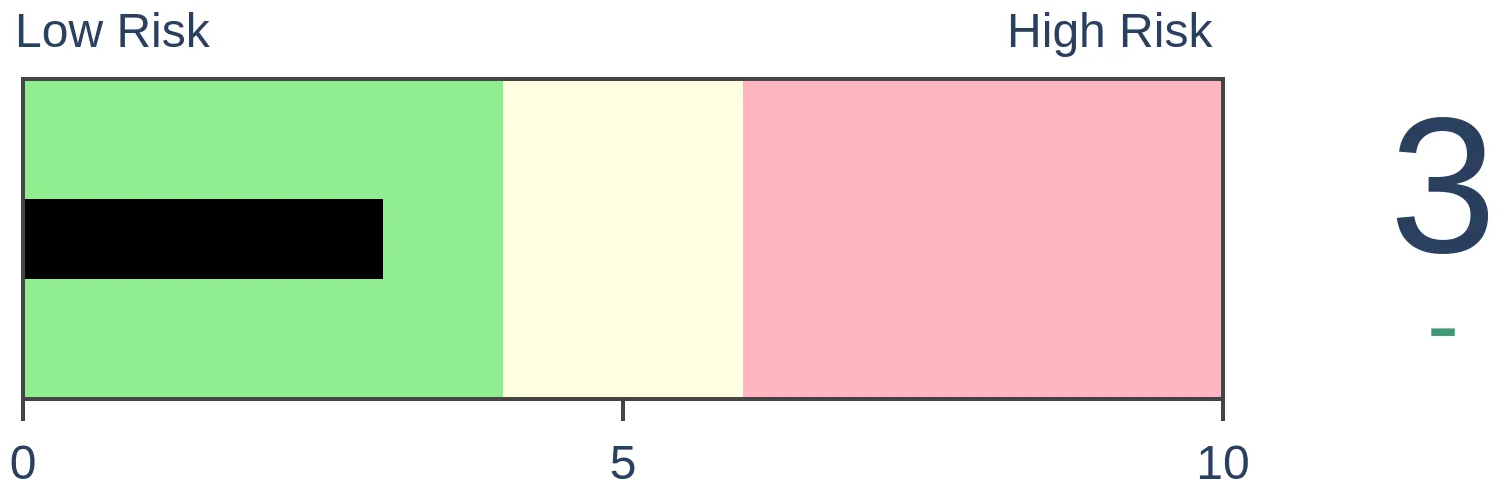
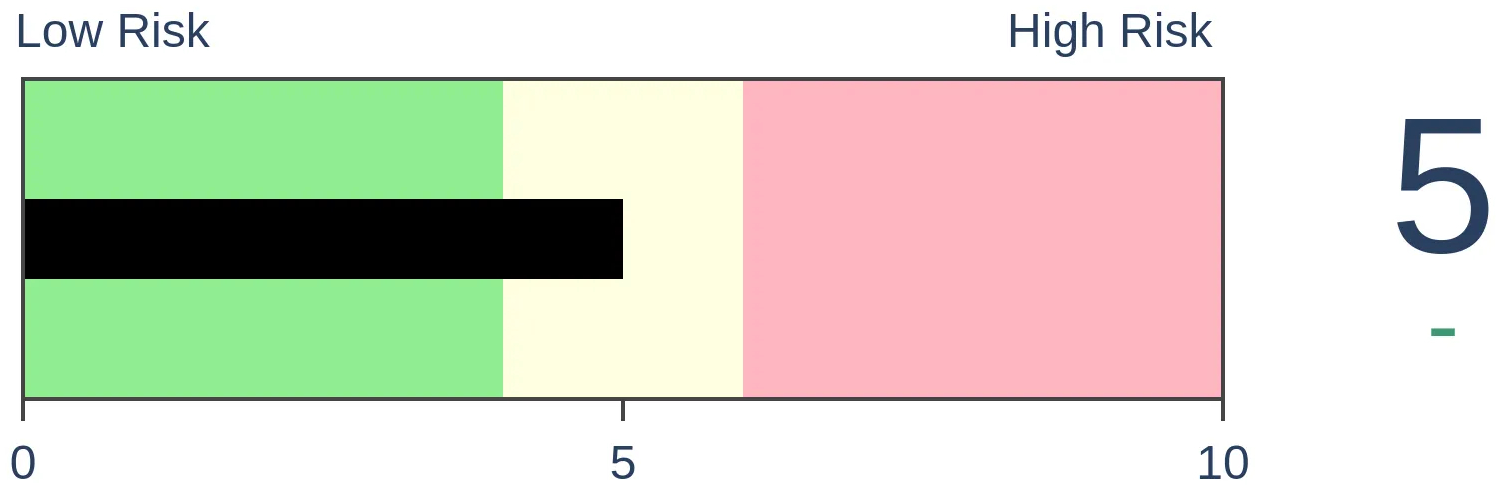
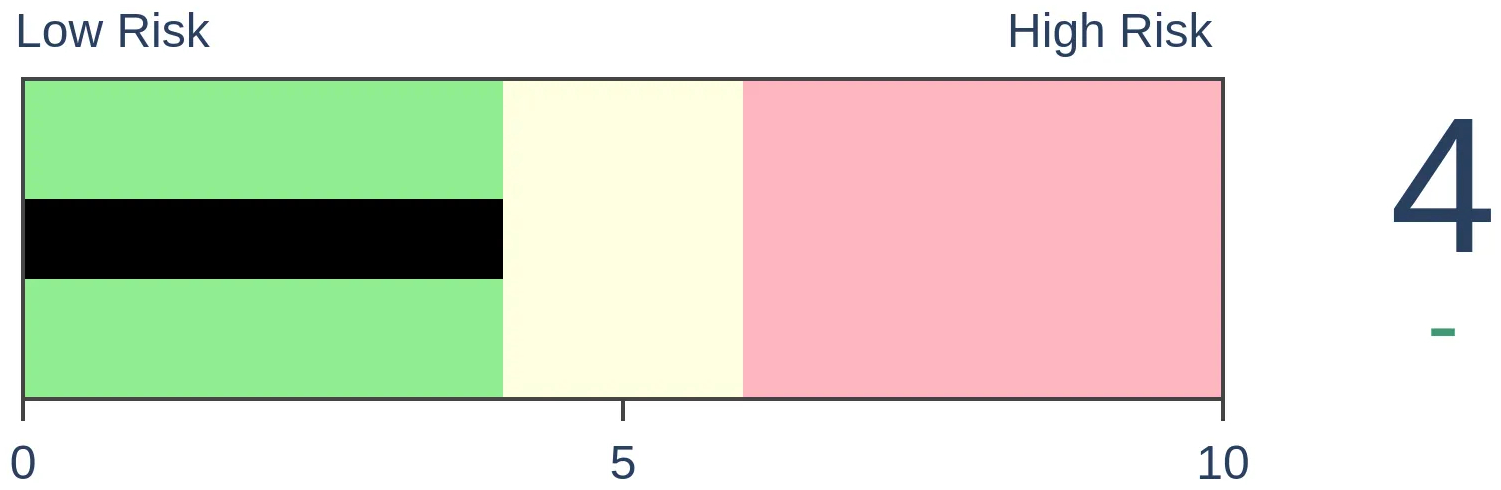
Risk Levels
|
|
|


Research
TradingEdge Weekly for May 27 - Severe selling led to extreme pessimism, insiders are buying, bond reboundBy Jason GoepfertBOTTOM LINEThis week, we saw stocks trying to rebound from near-record losing streaks. That has weighed on sentiment, which is extremely pessimistic and at a level that has preceded relief rallies. Bond sentiment was almost as pessimistic but is starting to turn as investors' fears turn toward growth instead of inflation. The dollar is facing some headwinds. If it declines, it would help gold and miners, which have been hit hard. FORECAST / TIMEFRAME |
Key points:
- We entered this week with major equity indexes suffering record (or near record losing streaks)
- That triggered a number of extremes in our indicators and models, with a good record of preceding relief rallies
- Breadth among big tech stocks has been historically bad, suggesting washed-out conditions
- New home sales have been cratering, which has been a consistently bad sign for homebuilders and discretionary stocks
- Bond sentiment is starting to rebound
- That's in part to investors' fears shifting from inflation to growth
- A couple of resource-heavy countries have been doing very well
- The dollar is entering a negative seasonal window amid high optimism
- A declining dollar would help gold and gold miners, which have been struggling
Record selling pressure triggers fear
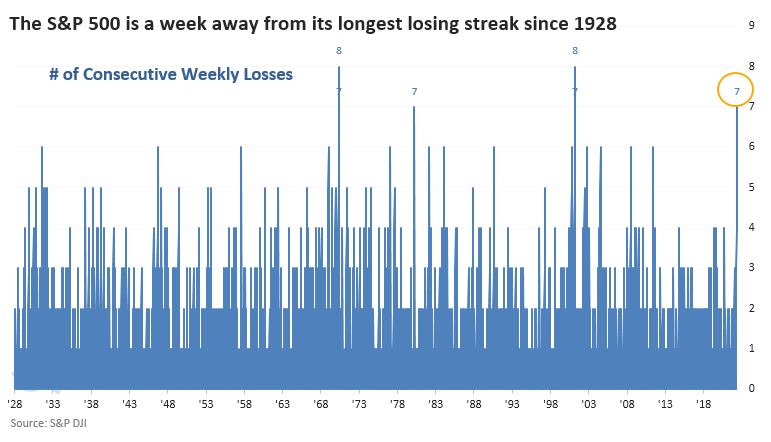
We might as well get this out of the way because it's already cited just about everywhere: the most venerable equity indexes in the world are on the cusp of setting all-time losing streaks.
With another loss last week, the Dow Industrials Average tied its record for the longest stretch of consecutive losing streaks since 1900. The most benchmarked index in the world, the S&P 500, is just a week away from also tying its record losing streak.
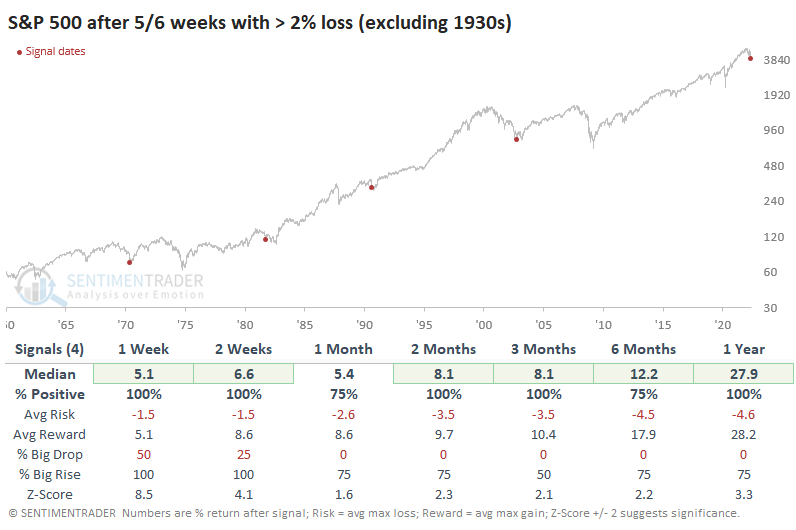
The three other times it went 7 in a row, its future returns were pretty good, at least through the next few months. What's especially notable about the S&P's losing streak is how heavy the losses have been. Out of the past six weeks, five of them saw losses greater than 2%.
Outside of the 1930s, however, it proved to be a sign of exhaustive selling pressure. Over the next year, the S&P 500 returned more than +26% after three of the four precedents.
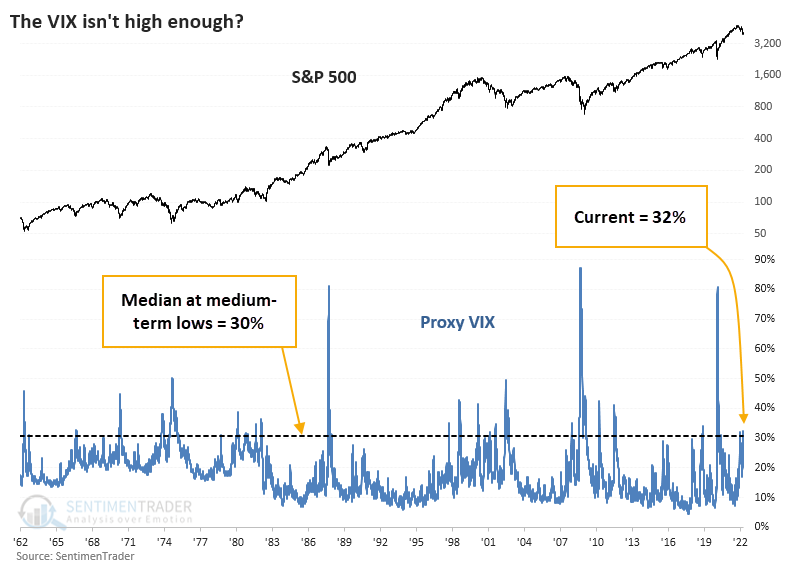
One of the tropes being trotted out is that stocks can't bottom because the VIX "fear gauge," which reflects the implied volatility that options traders expect in the S&P 500 over the next 30 days or so, has not yet spiked above arbitrary levels that suggest fear.
The chart below shows the Proxy VIX that we've discussed many times over the decades. It approximates the actual VIX calculation using five different mathematical models. Since the inception of the actual VIX, this Proxy has a correlation of +0.89 out of a scale from -1.0 to +1.0, so it's a decent substitution.
The Proxy VIX recently rose above 32%. If we go back to 1962 and look at every date when the S&P 500 fell to a one-year low, and that was the lowest price for at least the next three months, the median Proxy VIX was 30%. So, according to this version, fear is higher than it has been at most medium-term troughs.
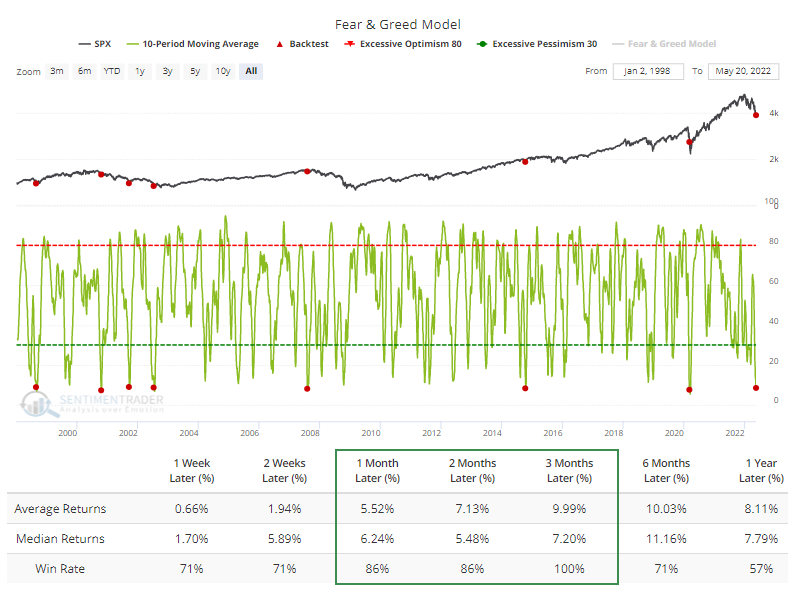
If we look at a model that literally has "fear" in the name, Fear & Greed, then the 10-day moving average dropped below 9% last week. Each of the other times it has done this - even during bear markets - the S&P 500 rebounded over the next few months according to the Backtest Engine.
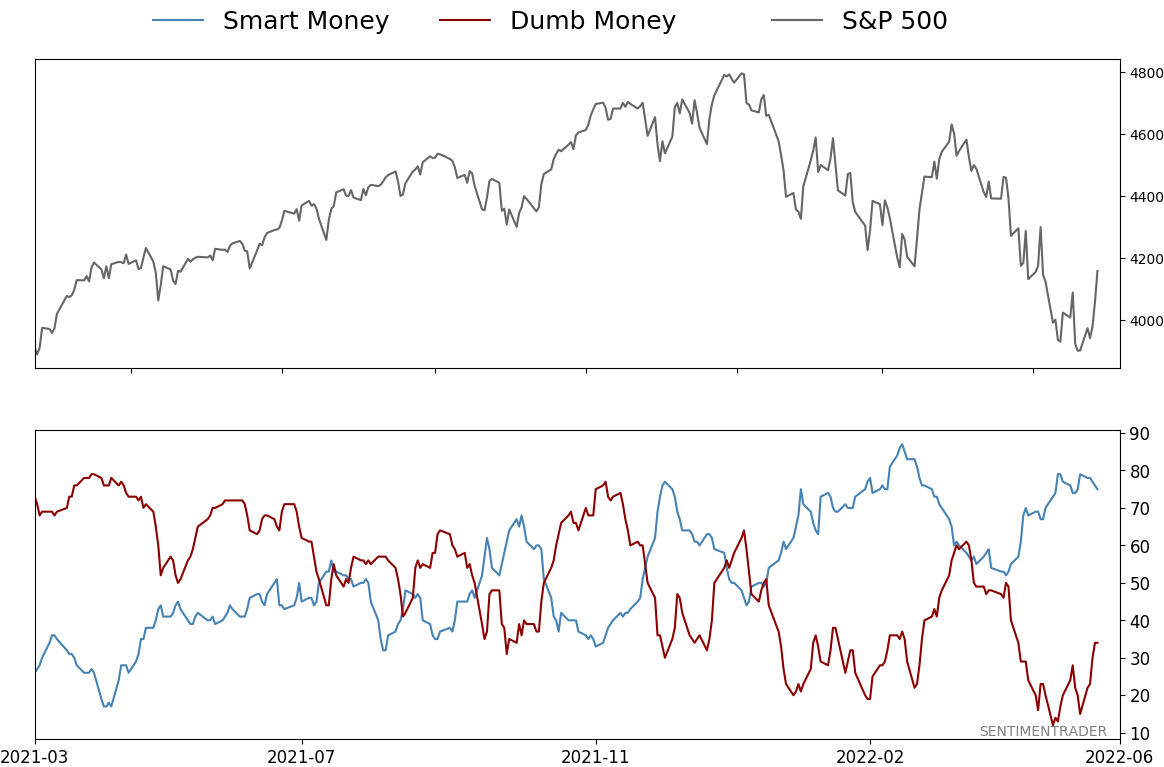
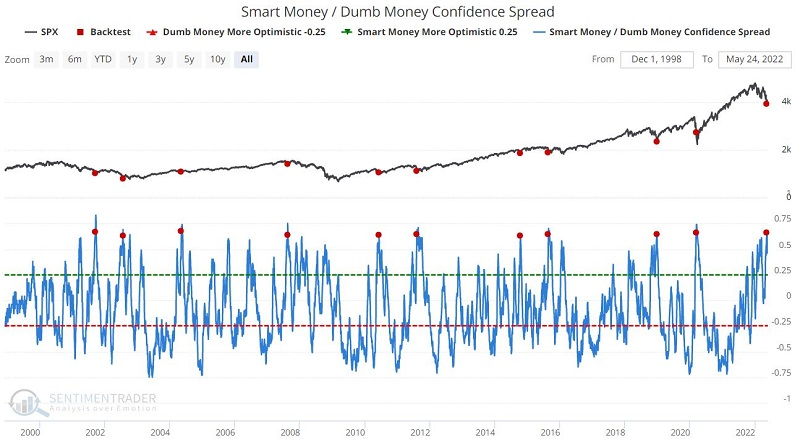
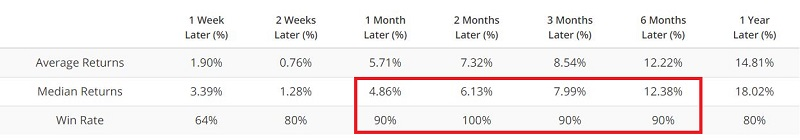
Jay also reiterated that our Smart Money / Dumb Money Confidence Spread (SMDM) recently reached the upper decile of historical readings by crossing above 0.63. The chart below displays when SMDM crossed above 0.63 for the first time in three months. A reading of this level can only occur when Smart Money is quite confident and Dumb Money is extremely pessimistic.
Other reasons for optimism
Jay noted there are a handful of other potential reasons to be bullish.
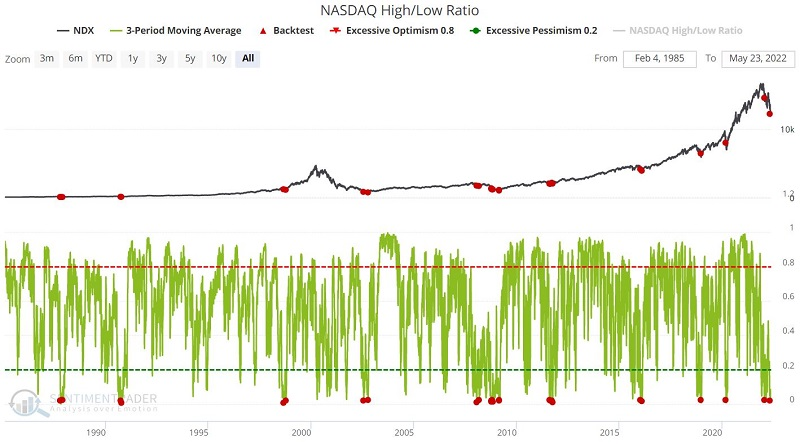
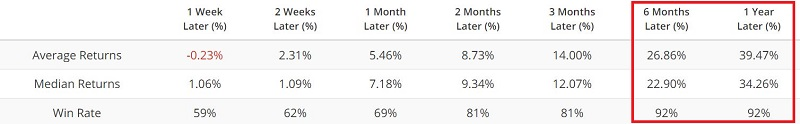
The chart below shows all days when the 3-day moving average of the Nasdaq High/Low Ratio was below 0.02. This means that an average session over the past few days averaged fewer than 2% of stocks at 52-week highs out of all stocks hitting a 52-week extreme.
After similar signals, the Nasdaq 100 showed a positive return 92% of the time over the next 6-12 months.
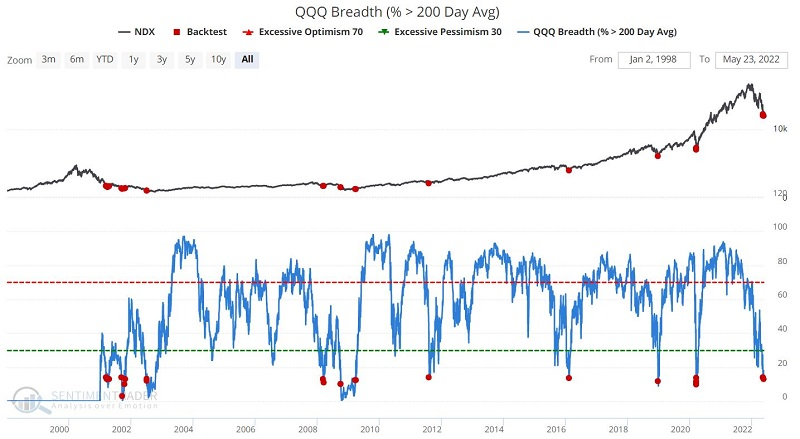
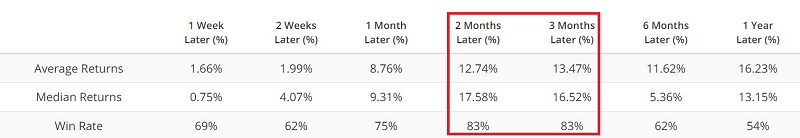
Few of the big tech stocks in that index are in long-term uptrends. The chart below shows all days when fewer than 14% of Nasdaq 100 stocks were trading above their 200-day moving averages. The index tended to enjoy a relief rally over the next 2-3 months.
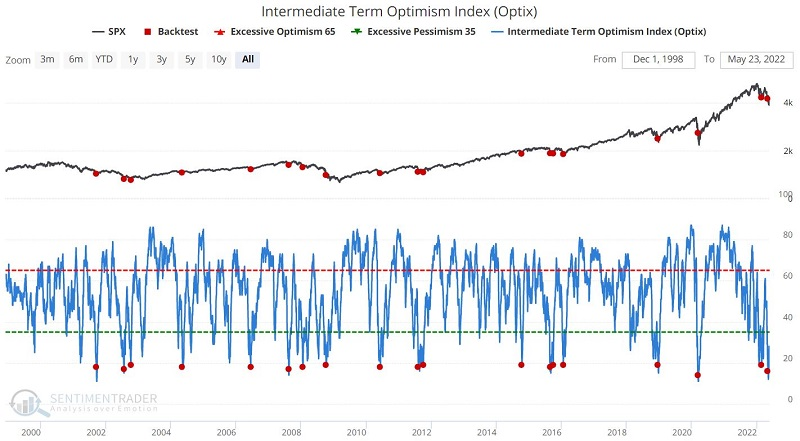
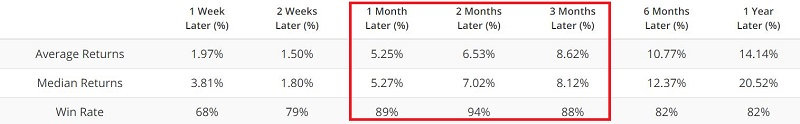
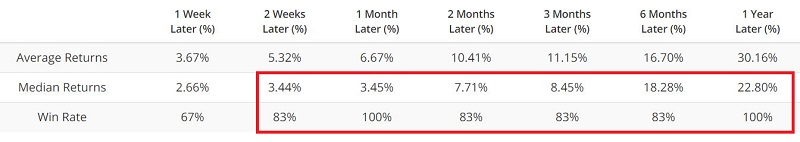
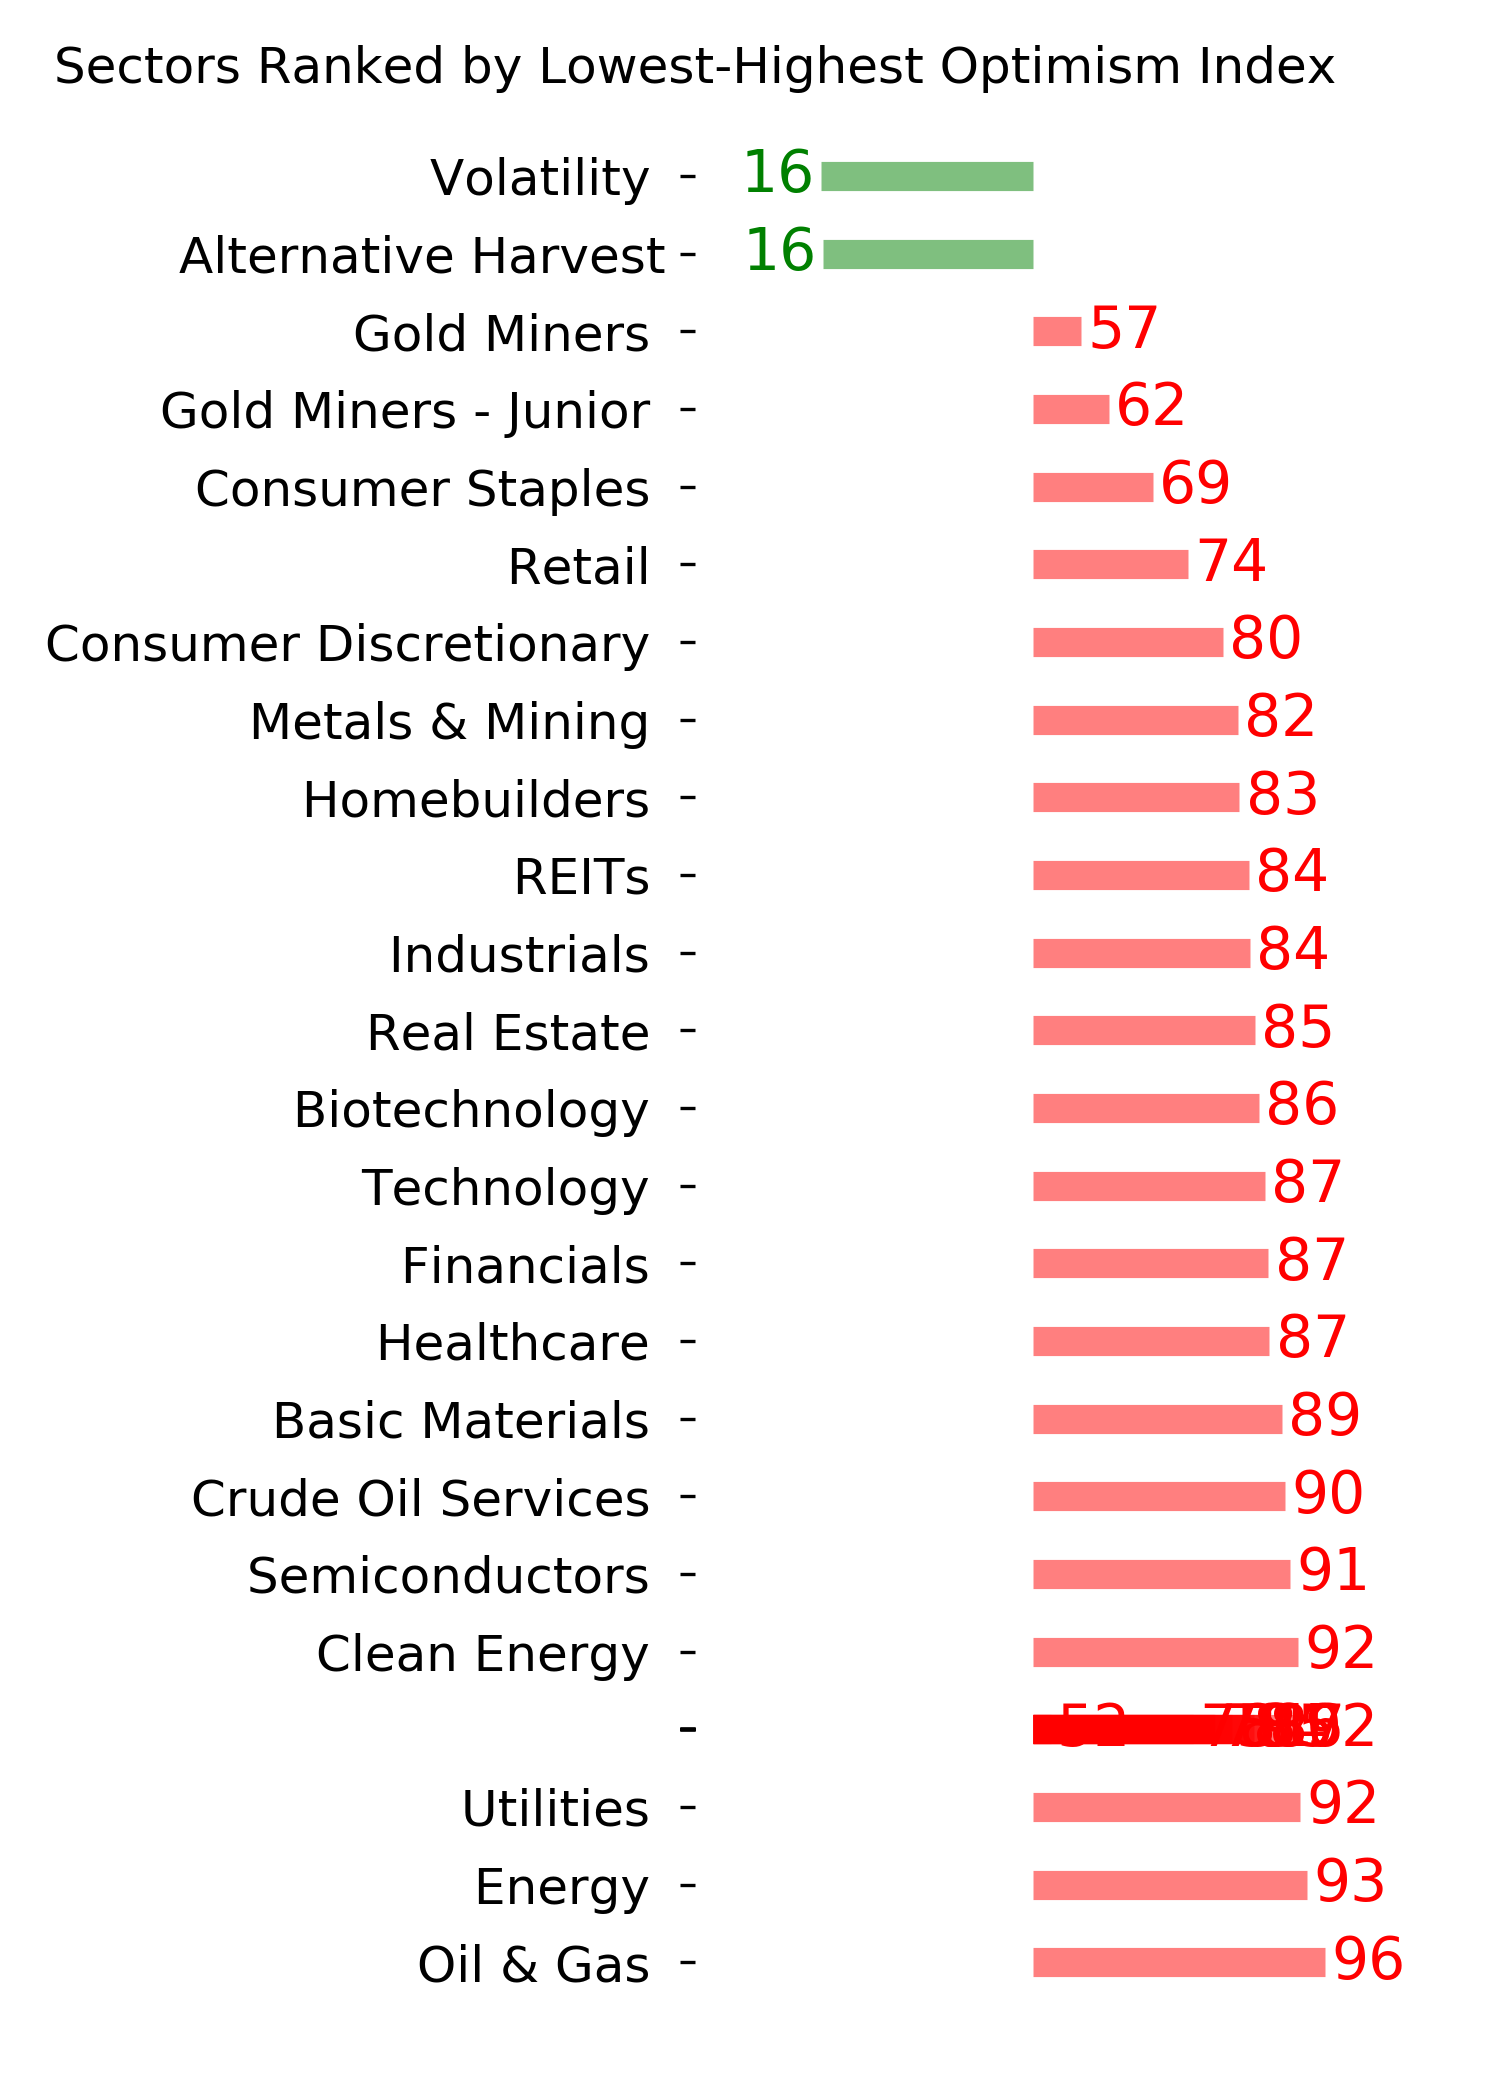
Our Risk On/Risk Off indicator crossed below 4.9 for the first time in three months, which preceded 2-3 months rallies 100% of the time. And the Intermediate-Term Optimism Index fell below 20 for the first time in 21 days. The table below that displays a summary of the results.
Later in the week, Jay cited even more evidence that has preceded positive returns, such as a quick rise in buying interest among corporate insiders in S&P 500 companies.
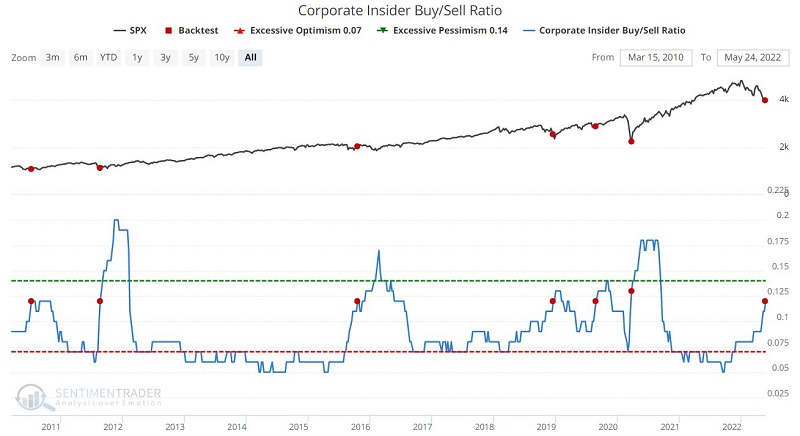
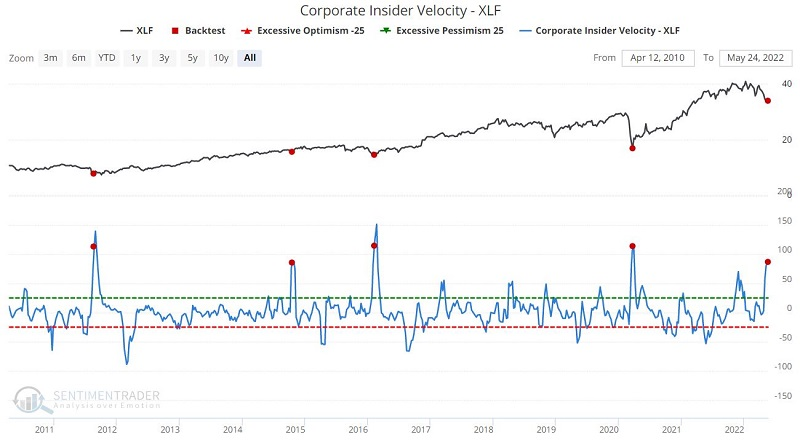
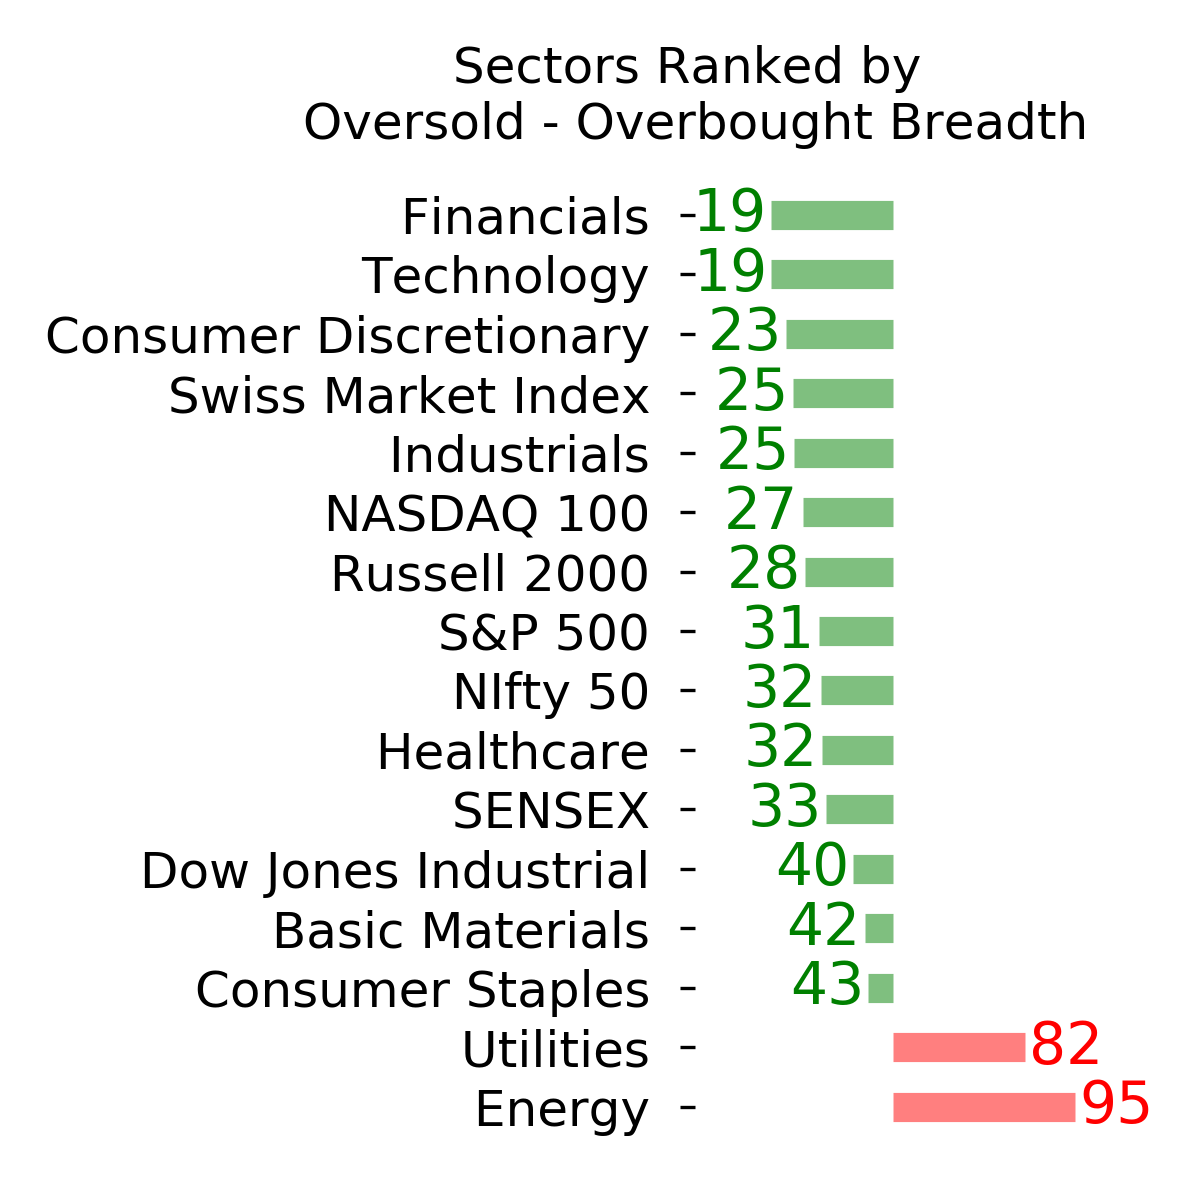
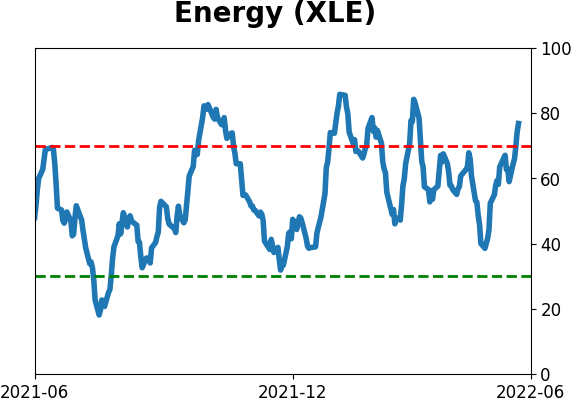
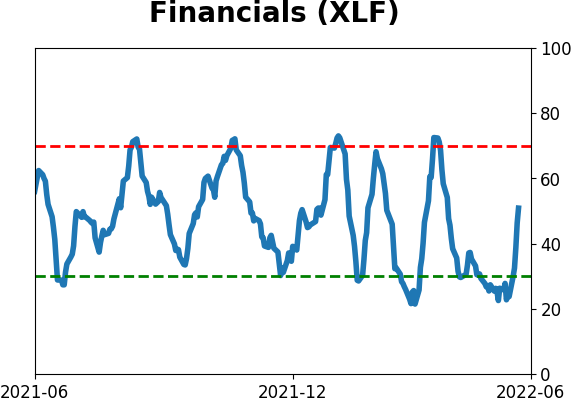
There is currently an interesting setup in Financials, as the sector just saw five consecutive days with every member trading below their 50-day moving averages, at the time time our Corporate Insider Velocity spiked to an extremely high level.
Fundamentals remain a troubling - and worsening - headwind
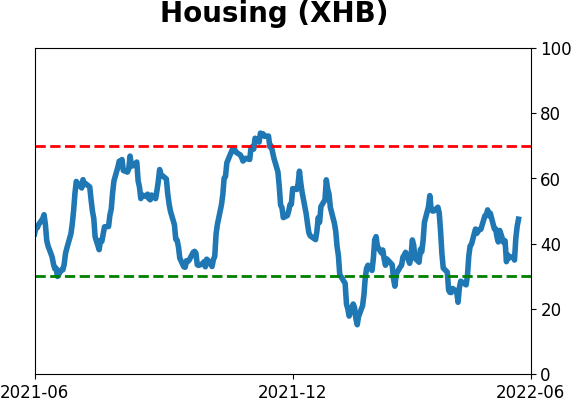
Dean showed that for the first time since 2010, new home sales have fallen for 4 consecutive months.
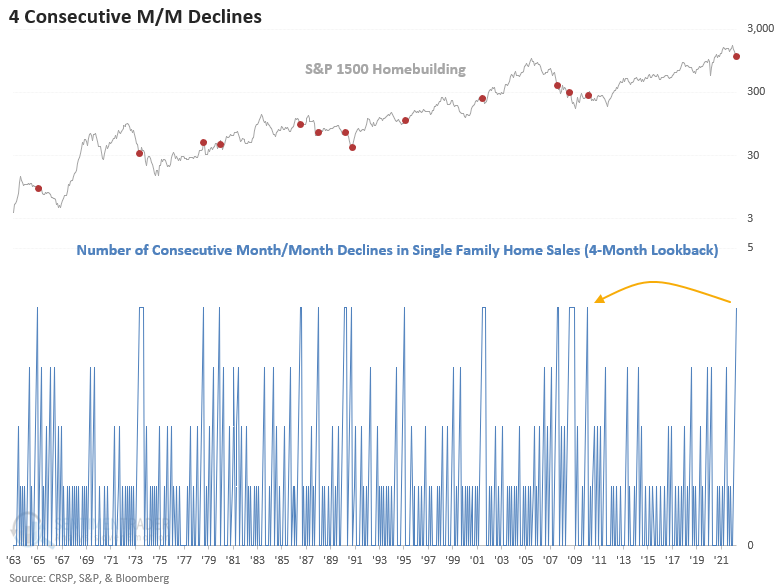
This study generated a signal 13 other times over the past 58 years. After the others, homebuilding stocks look unfavorable on a medium-term basis, especially in the 2 & 3-month windows.
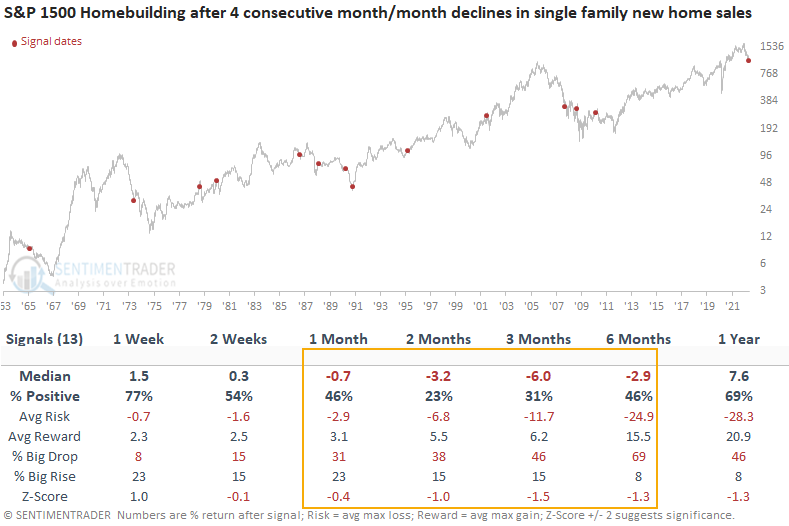
Not surprisingly, groups within the housing ecosystem show some of the weakest performance trends when new home sales deteriorate similarly to the current environment.
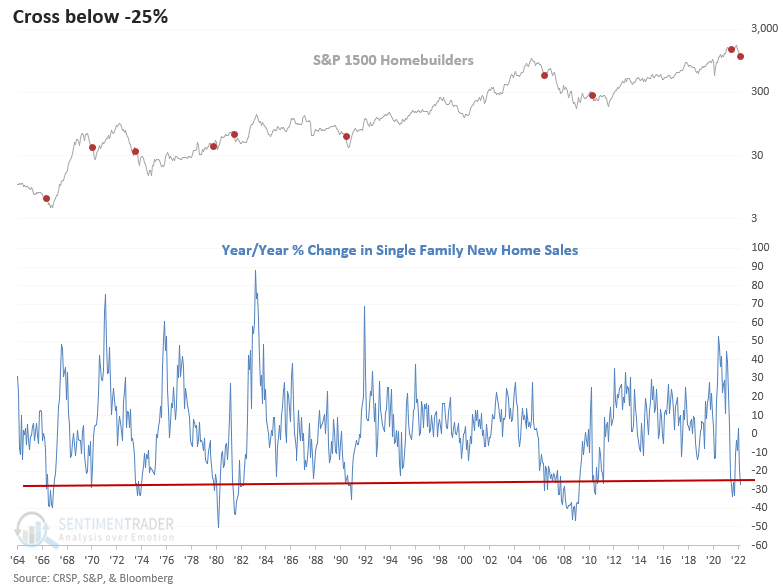
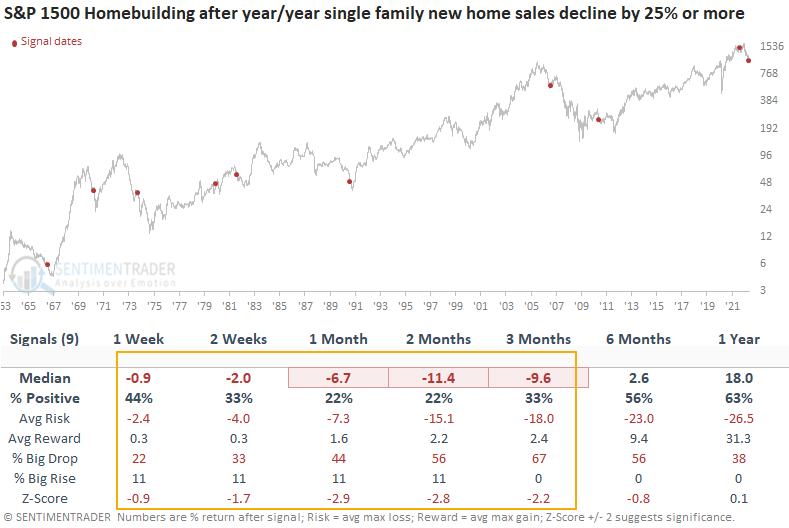
In addition, the year-over-year change in single-family new home sales crossed below -25% for only the 10th time in the last 56 years.
This study generated a signal 9 other times over the past 56 years. After the others, homebuilding stocks future returns, win rates, and z-scores look unfavorable on a short and medium-term basis, especially in the 1-3-month time frames.
Treasury sentiment is starting to turn
Thanks in part to deteriorating economic conditions, large speculators are starting to cover their shorts in earnest and are on the cusp of going net long. While this is somewhat subjective, when they'd been heavily short and then started to cover in earnest, it was mostly a good sign for 10-year Treasury prices (meaning lower yields).
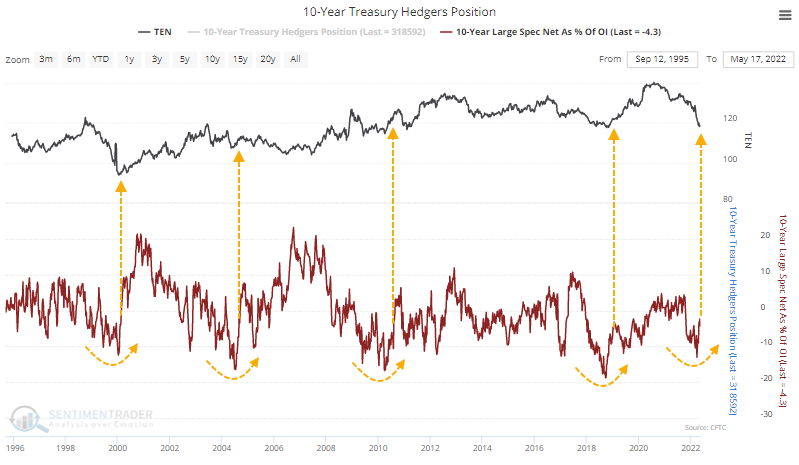
It's right on time as the seasonal window has turned positive. Professional investors seem to be even less inclined to be exposed to bonds, but that's starting to change. According to client positioning surveys from JP Morgan and BofA, client allocations to bonds are just picking up from at least 15-year lows.
The persistently poor sentiment has resulted in persistent outflows from bond funds over the past 20 weeks, closing in on the records from October 2013 and April 2020.
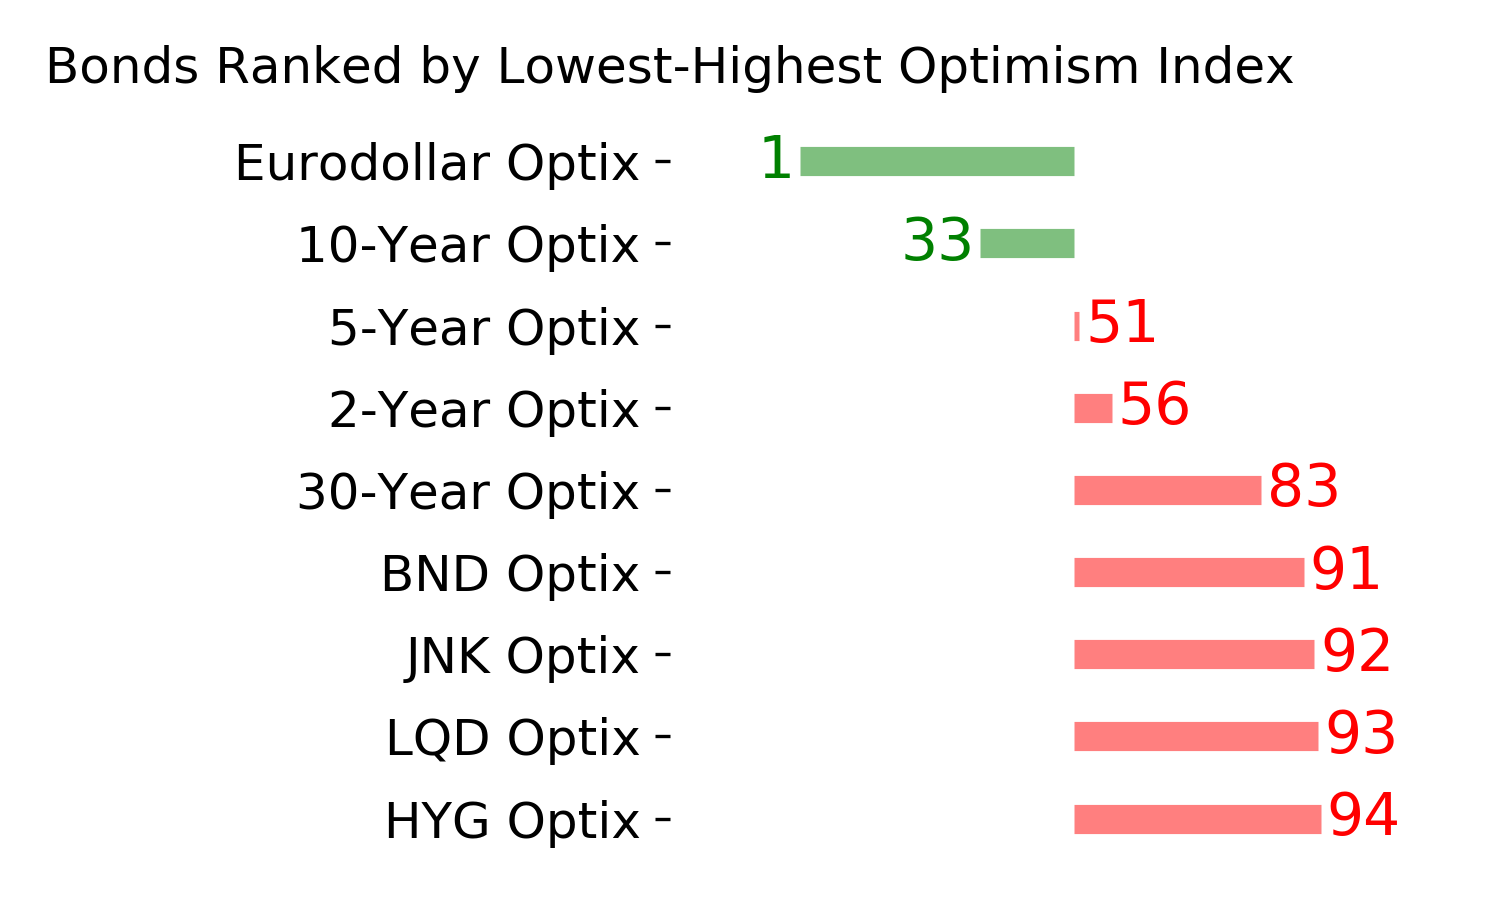
Taken altogether, our Bond Optix is finally starting to trough from near-record pessimism. As noted in April, this has tended to curl up ahead of the ultimate price low, at least from what we can see from a sample size of two and during what could be a completely new environment.
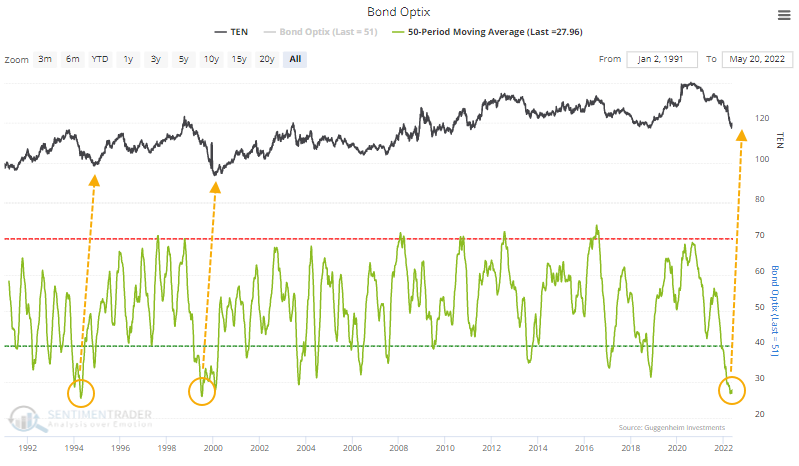
Over the past 30 years, when the Bond Optix finally exceeded 50% for the first time in months, it has mostly been a good sign, but the 1994 and 1999 signals were too early to capitalize on medium-term rallies.
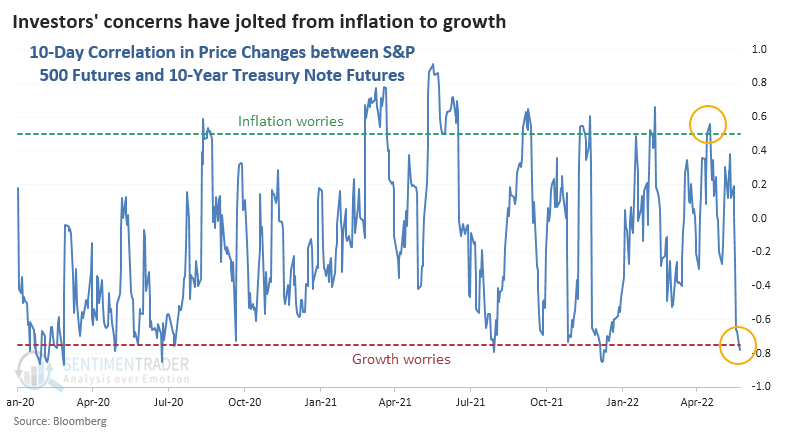
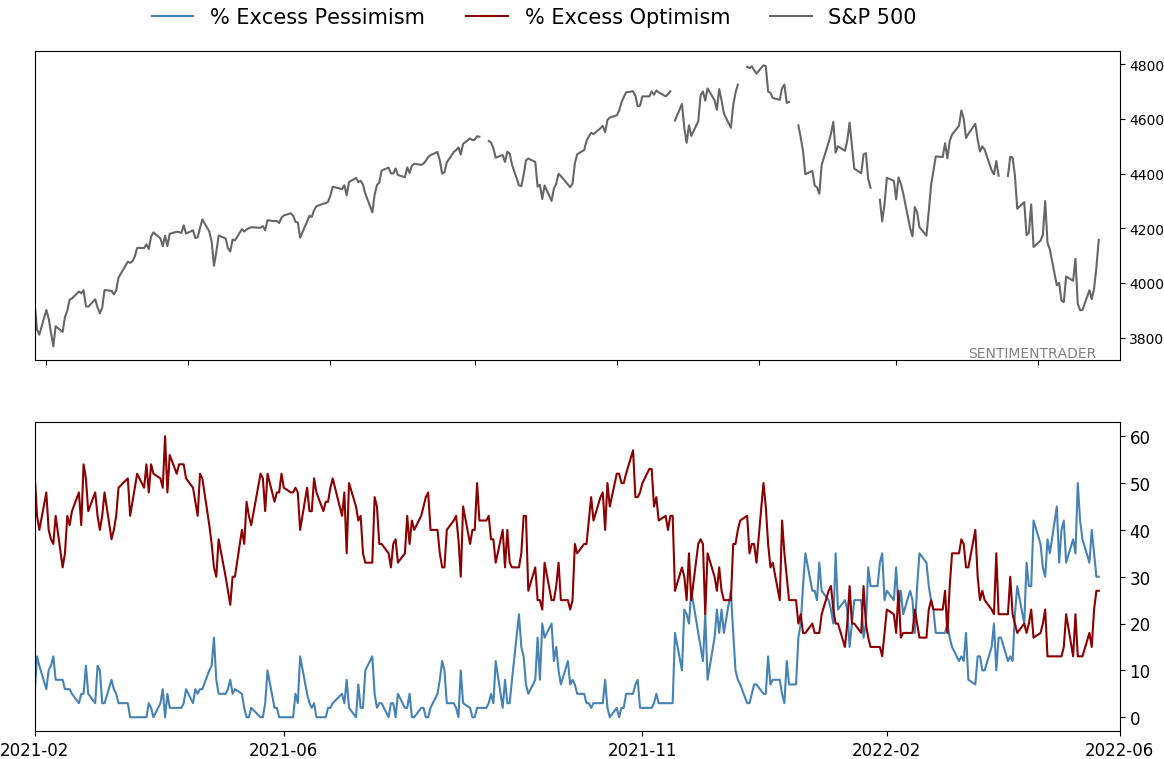
Investors' are now worrying about growth more than inflation
A month ago, the narrative was that investors were worried about inflation. Now, they're worried about growth.
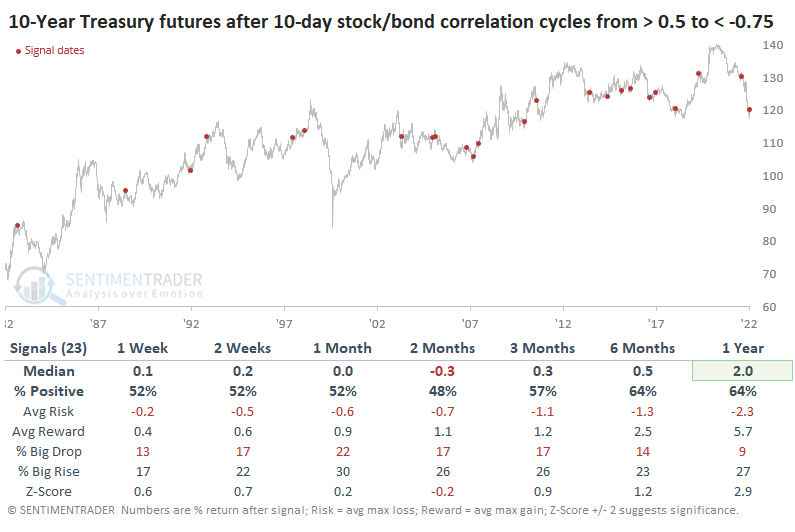
We can see that clearly in the shift of the relationship between stocks and bonds. The daily price changes in the S&P 500 futures and 10-year Treasury note futures have cycled from positive to strongly negative. On down days in stocks, investors are moving into Treasuries for safety.
For Treasuries, it was a mixed sign.
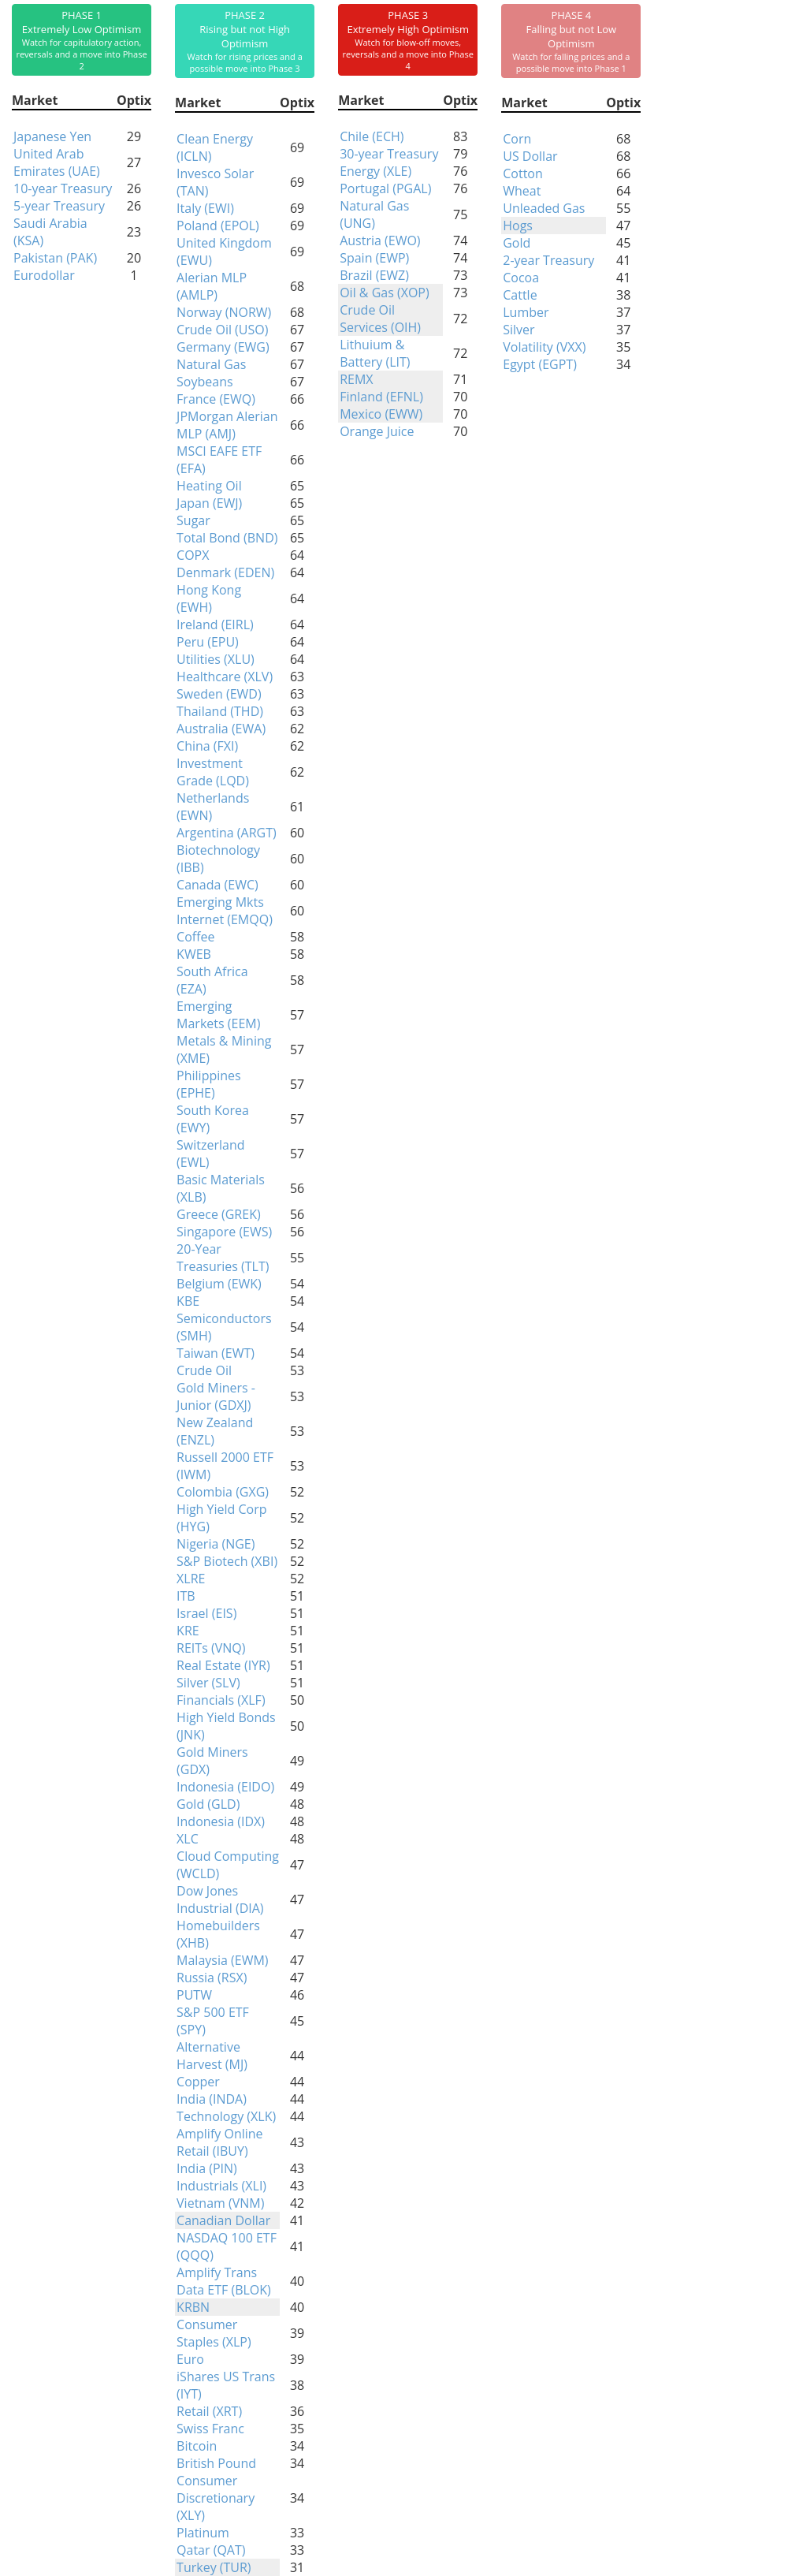
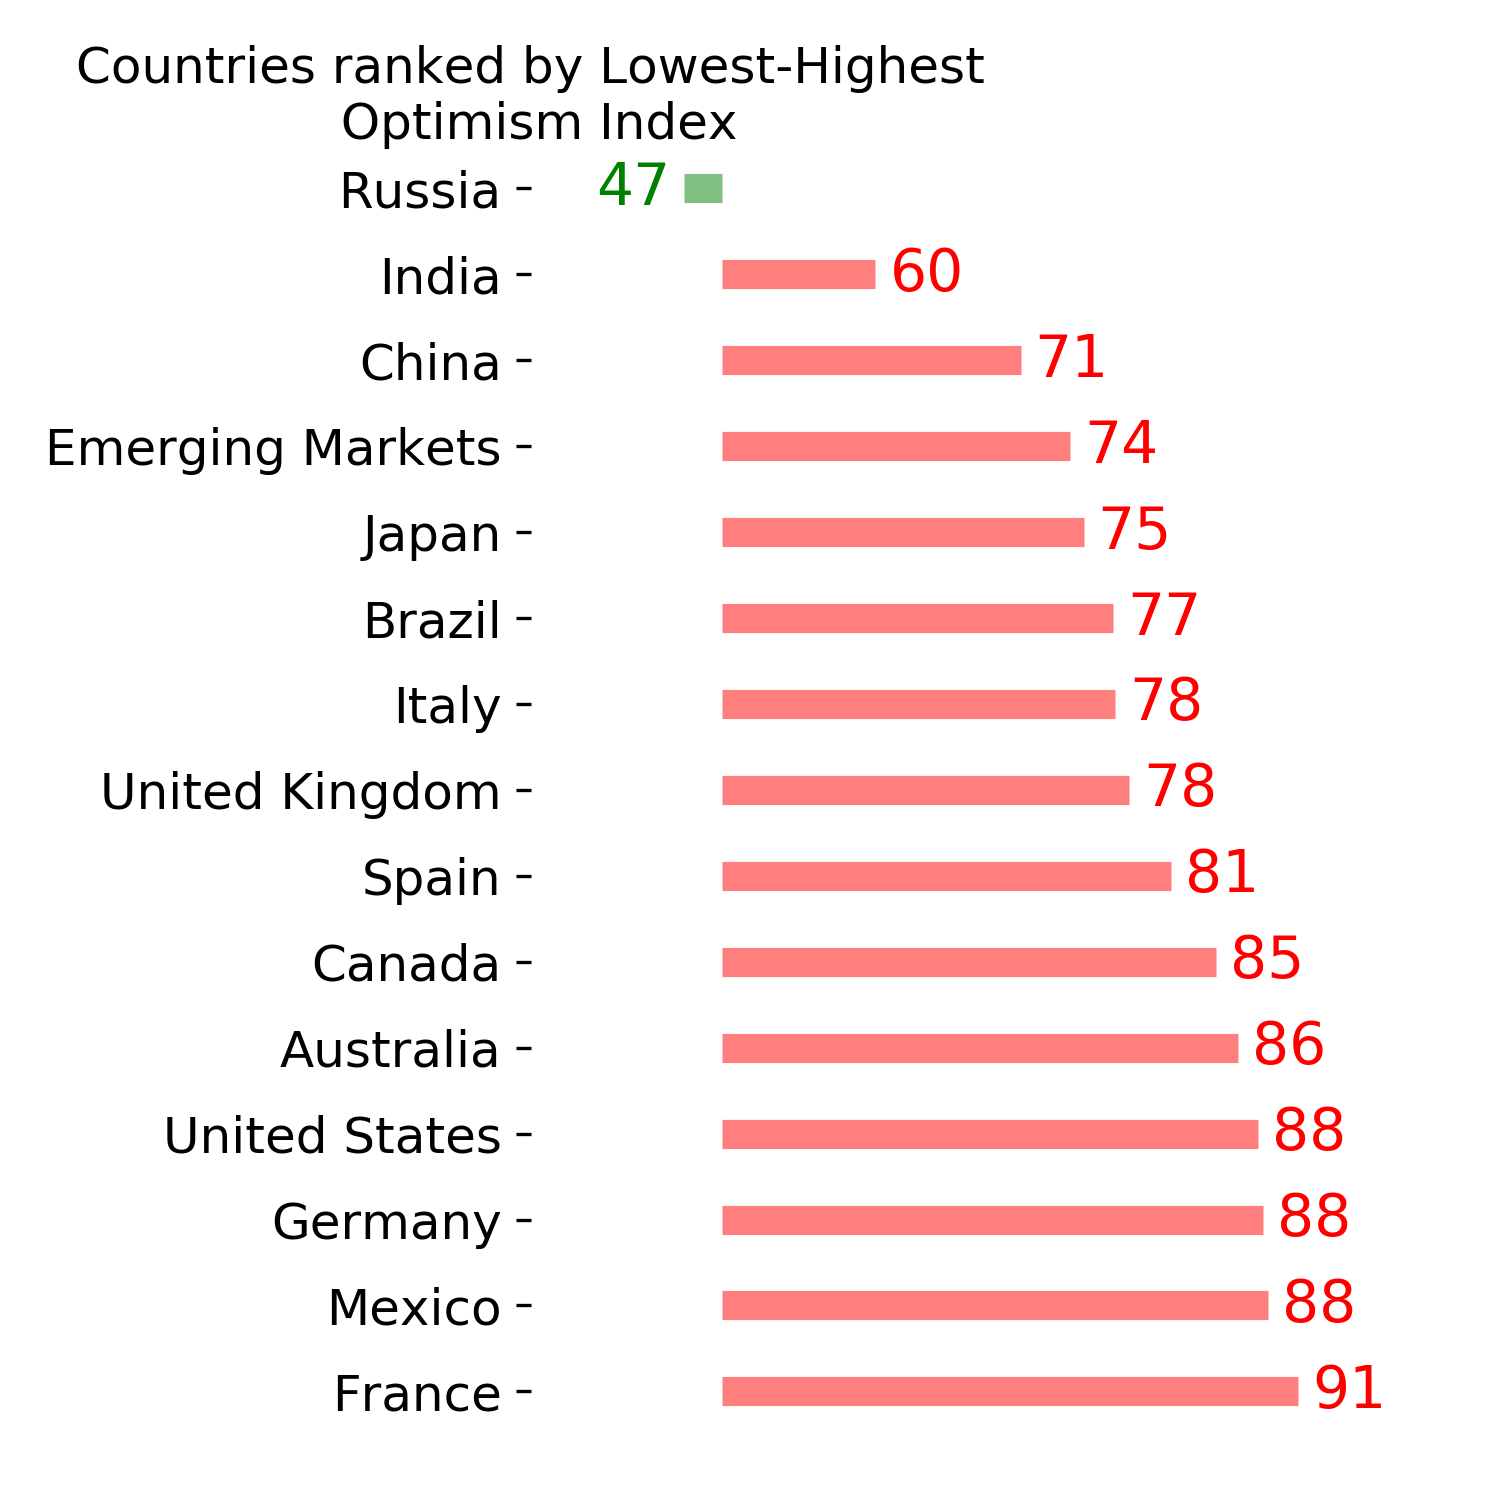
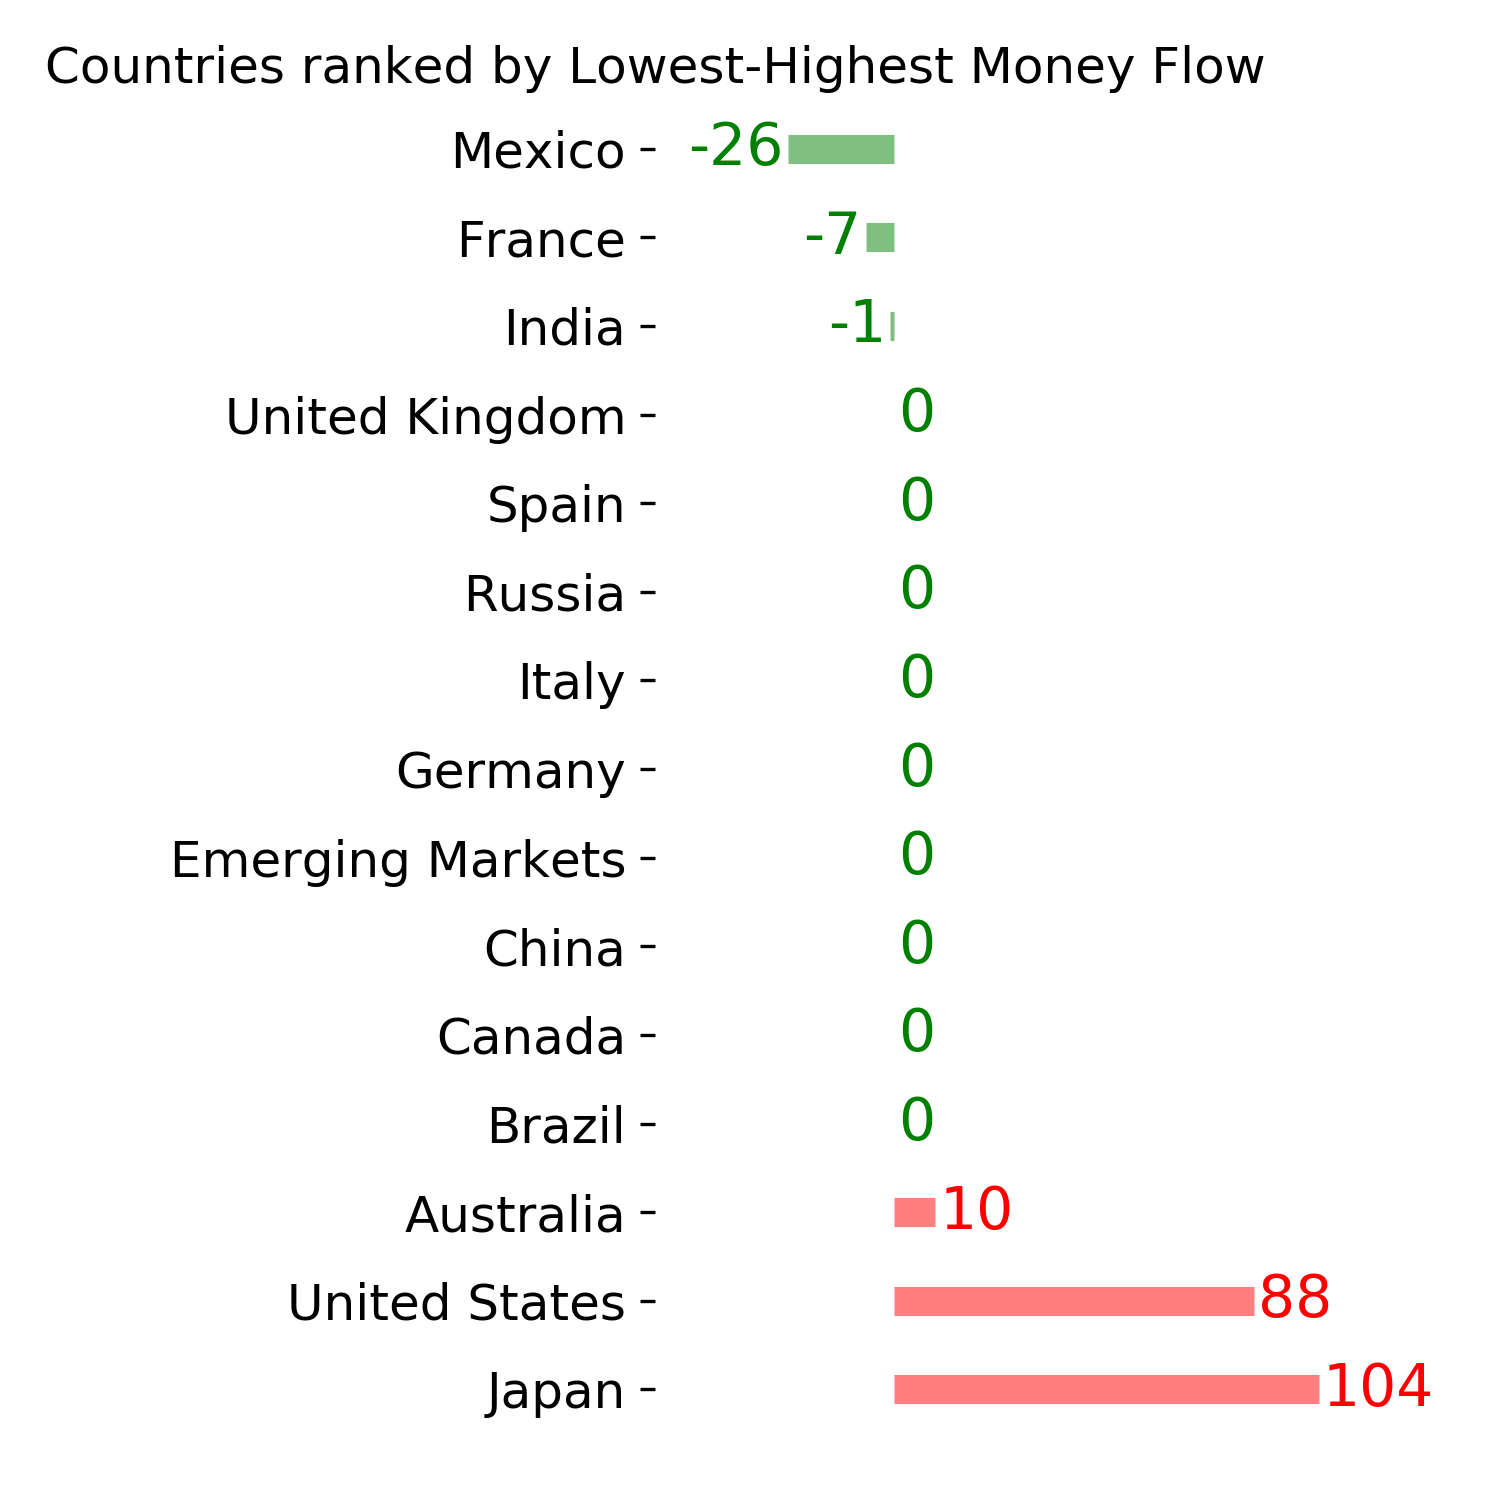
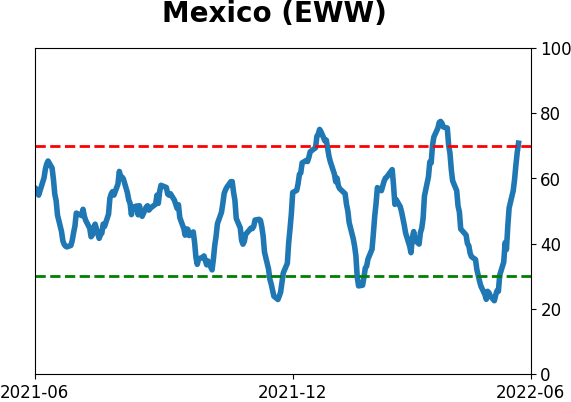
Resource-heavy countries have been doing well
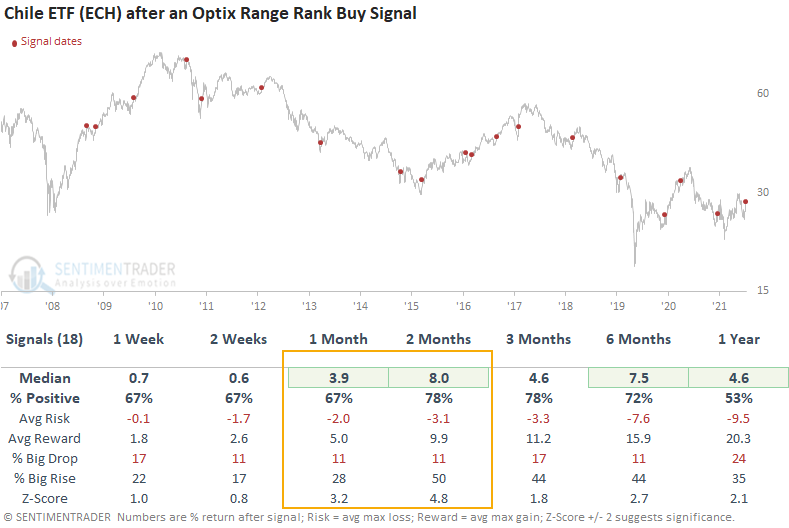
Dean showed that the Optimism Index for the Chile ETF (ECH) reversed higher relative to its recent range.
A trading model that uses the optimism index (Optix) to pinpoint when sentiment reverses from a period of pessimism issued a buy signal for the Chile ETF (ECH) this week.
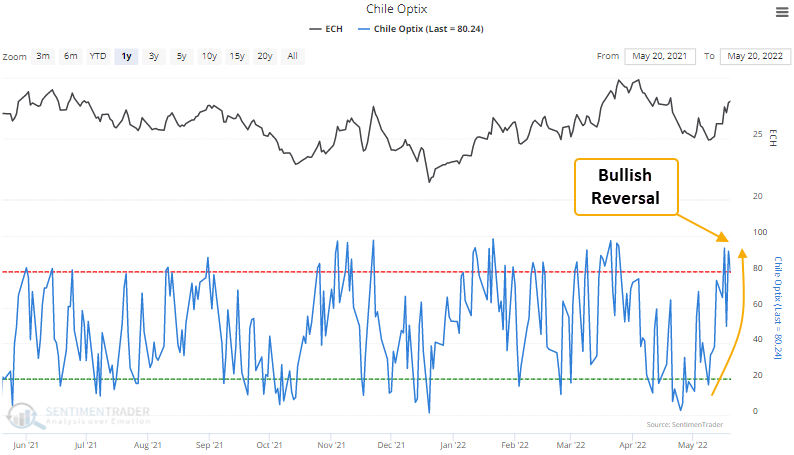
This model generated a signal 18 other times over the past decade. After the others, the ECH ETF future returns, win rates, and z-scores were solid across all time frames, especially the 2-month window. We need to keep in mind that one stock, Sociedad Quimica y Minera de Chile (SQM), accounts for a significant portion of the overall ETF weighting.
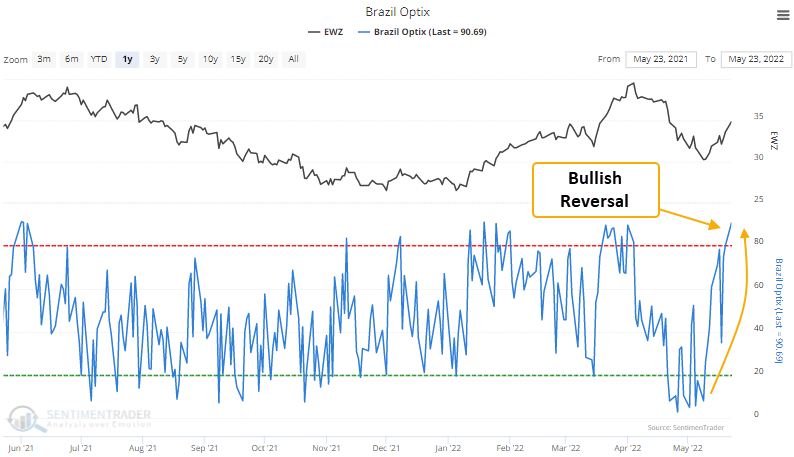
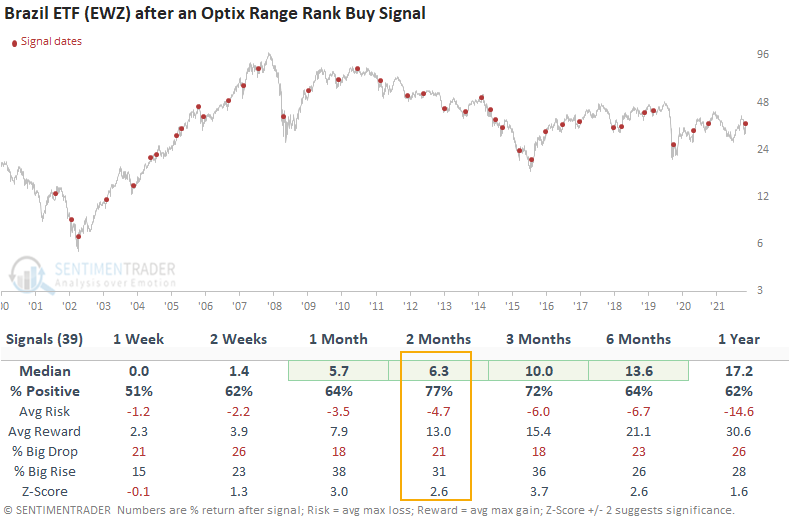
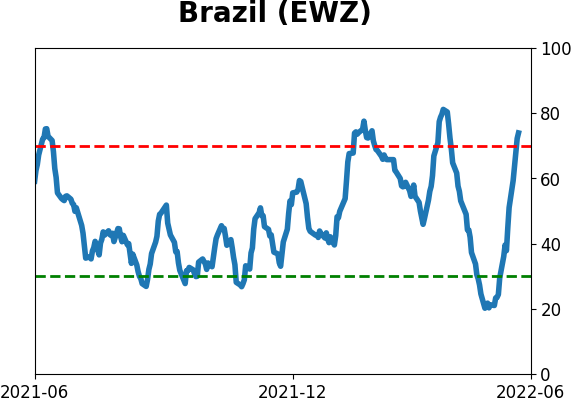
The Optimism Index for the Brazil ETF (EWZ) also triggered a new buy signal this past week using the same methodology.
This model generated a signal 39 other times over the last 21 years. After the others, the EWZ ETF future returns, win rates, and z-scores were solid across almost all time frames, especially the 2-month window. Recent signals showed a positive return in 20 out of 24 instances at some point in the first 2 months.
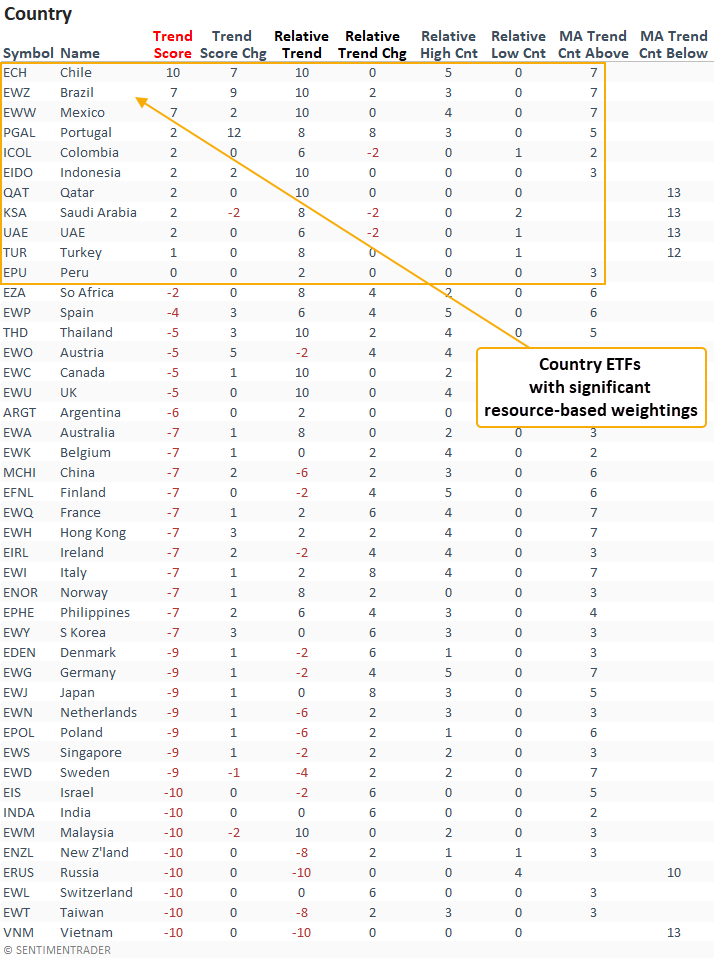
South American country ETFs dominate the trend rankings, with Chile, Brazil, and Mexico showing the highest absolute and relative scores.
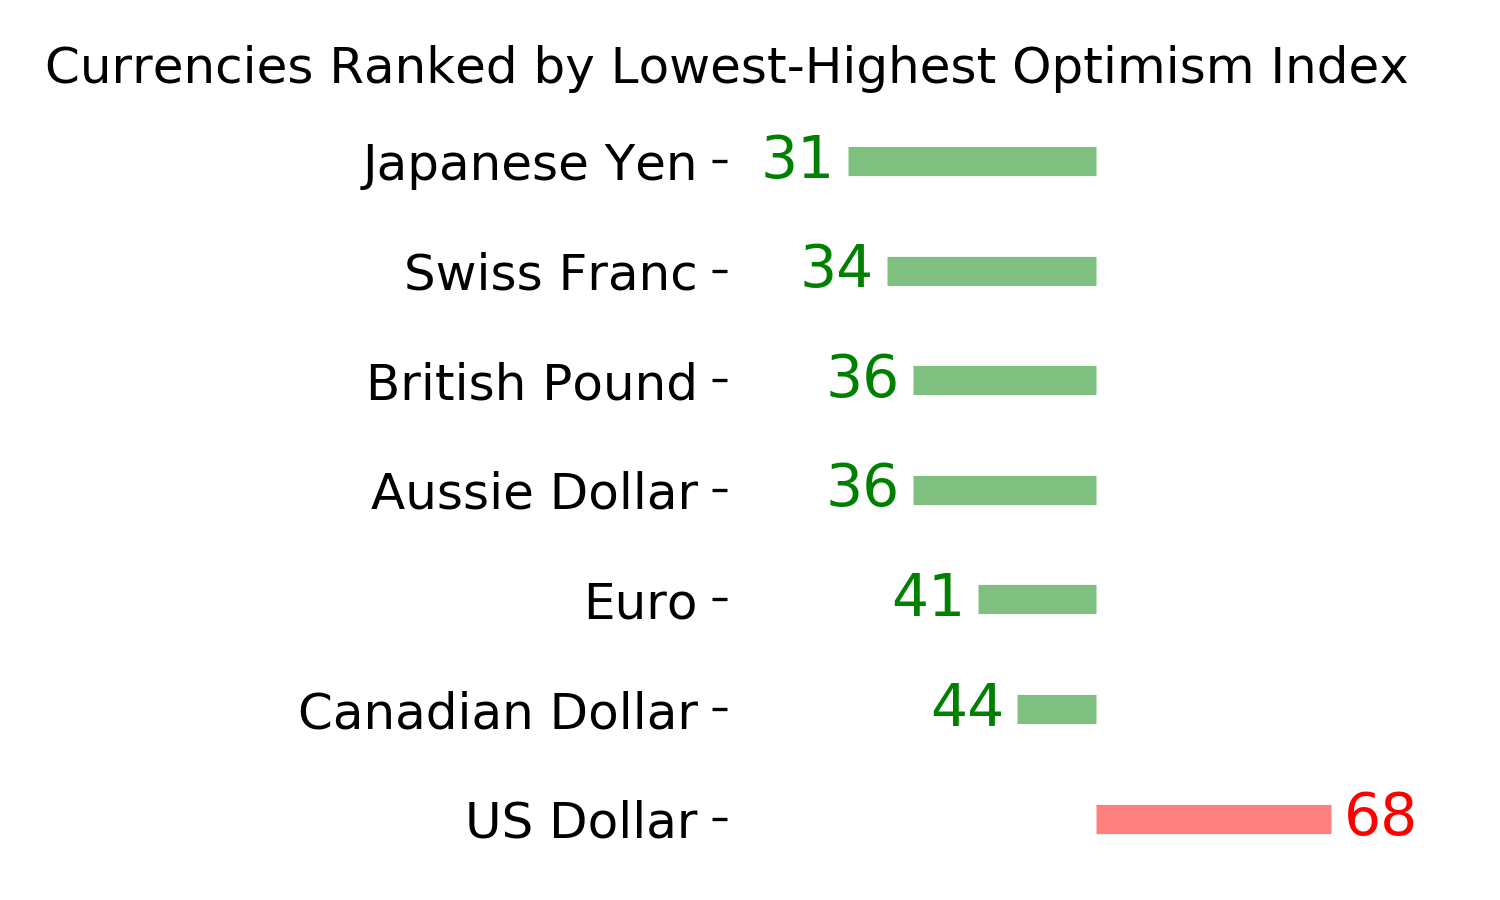
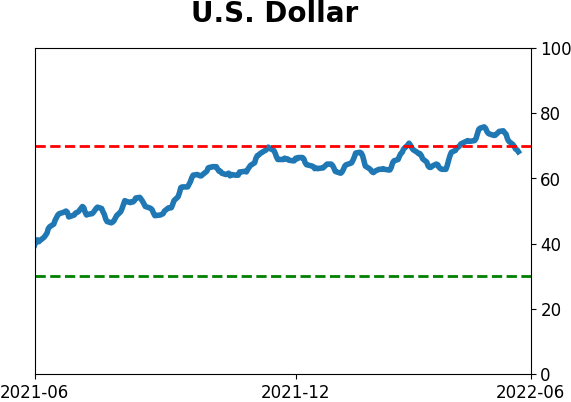
A declining dollar may help
Jay suggested that it's decision time for the dollar.
The dollar has been on a tear this year, and there is no guarantee that it will slow down. Still - the weakest part of the year for the dollar is the late May to late September period. So, if we are going to see weakness, we should expect to see some signs very soon. The chart below displays the annual seasonal trend for the U.S. dollar.
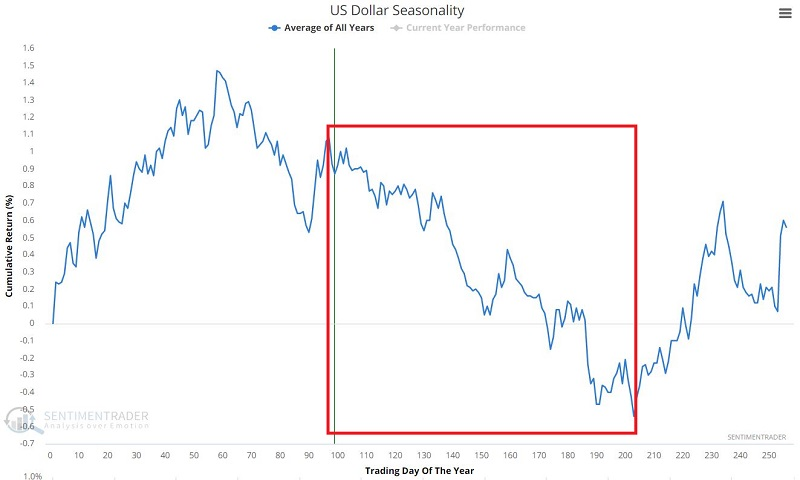
Relying solely on seasonality to identify an opportunity is typically not the best idea. However, when seasonality is combined with other factors - support/resistance, price trend, sentiment, etc. - it can be a potent combination in terms of spotting good opportunities.
We already have a clear "line in the sand" type of resistance and an impending period of seasonal weakness for the dollar. In addition, sentiment has gotten significantly bullish for the dollar. The chart below displays those times when the 100-day moving average of Dollar Optix crossed above 65.
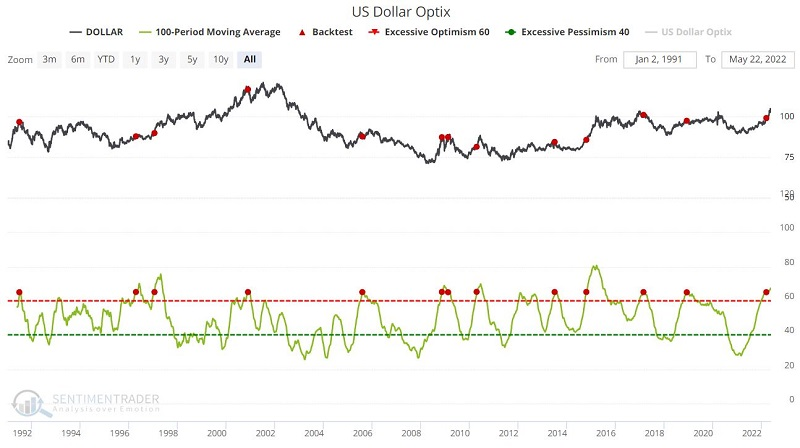
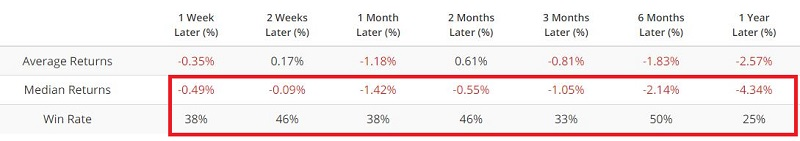
Note that the Median Return was negative for each time frame, and the Win Rate was 50% or below. Like seasonality, this argues for potential weakness in the months ahead.
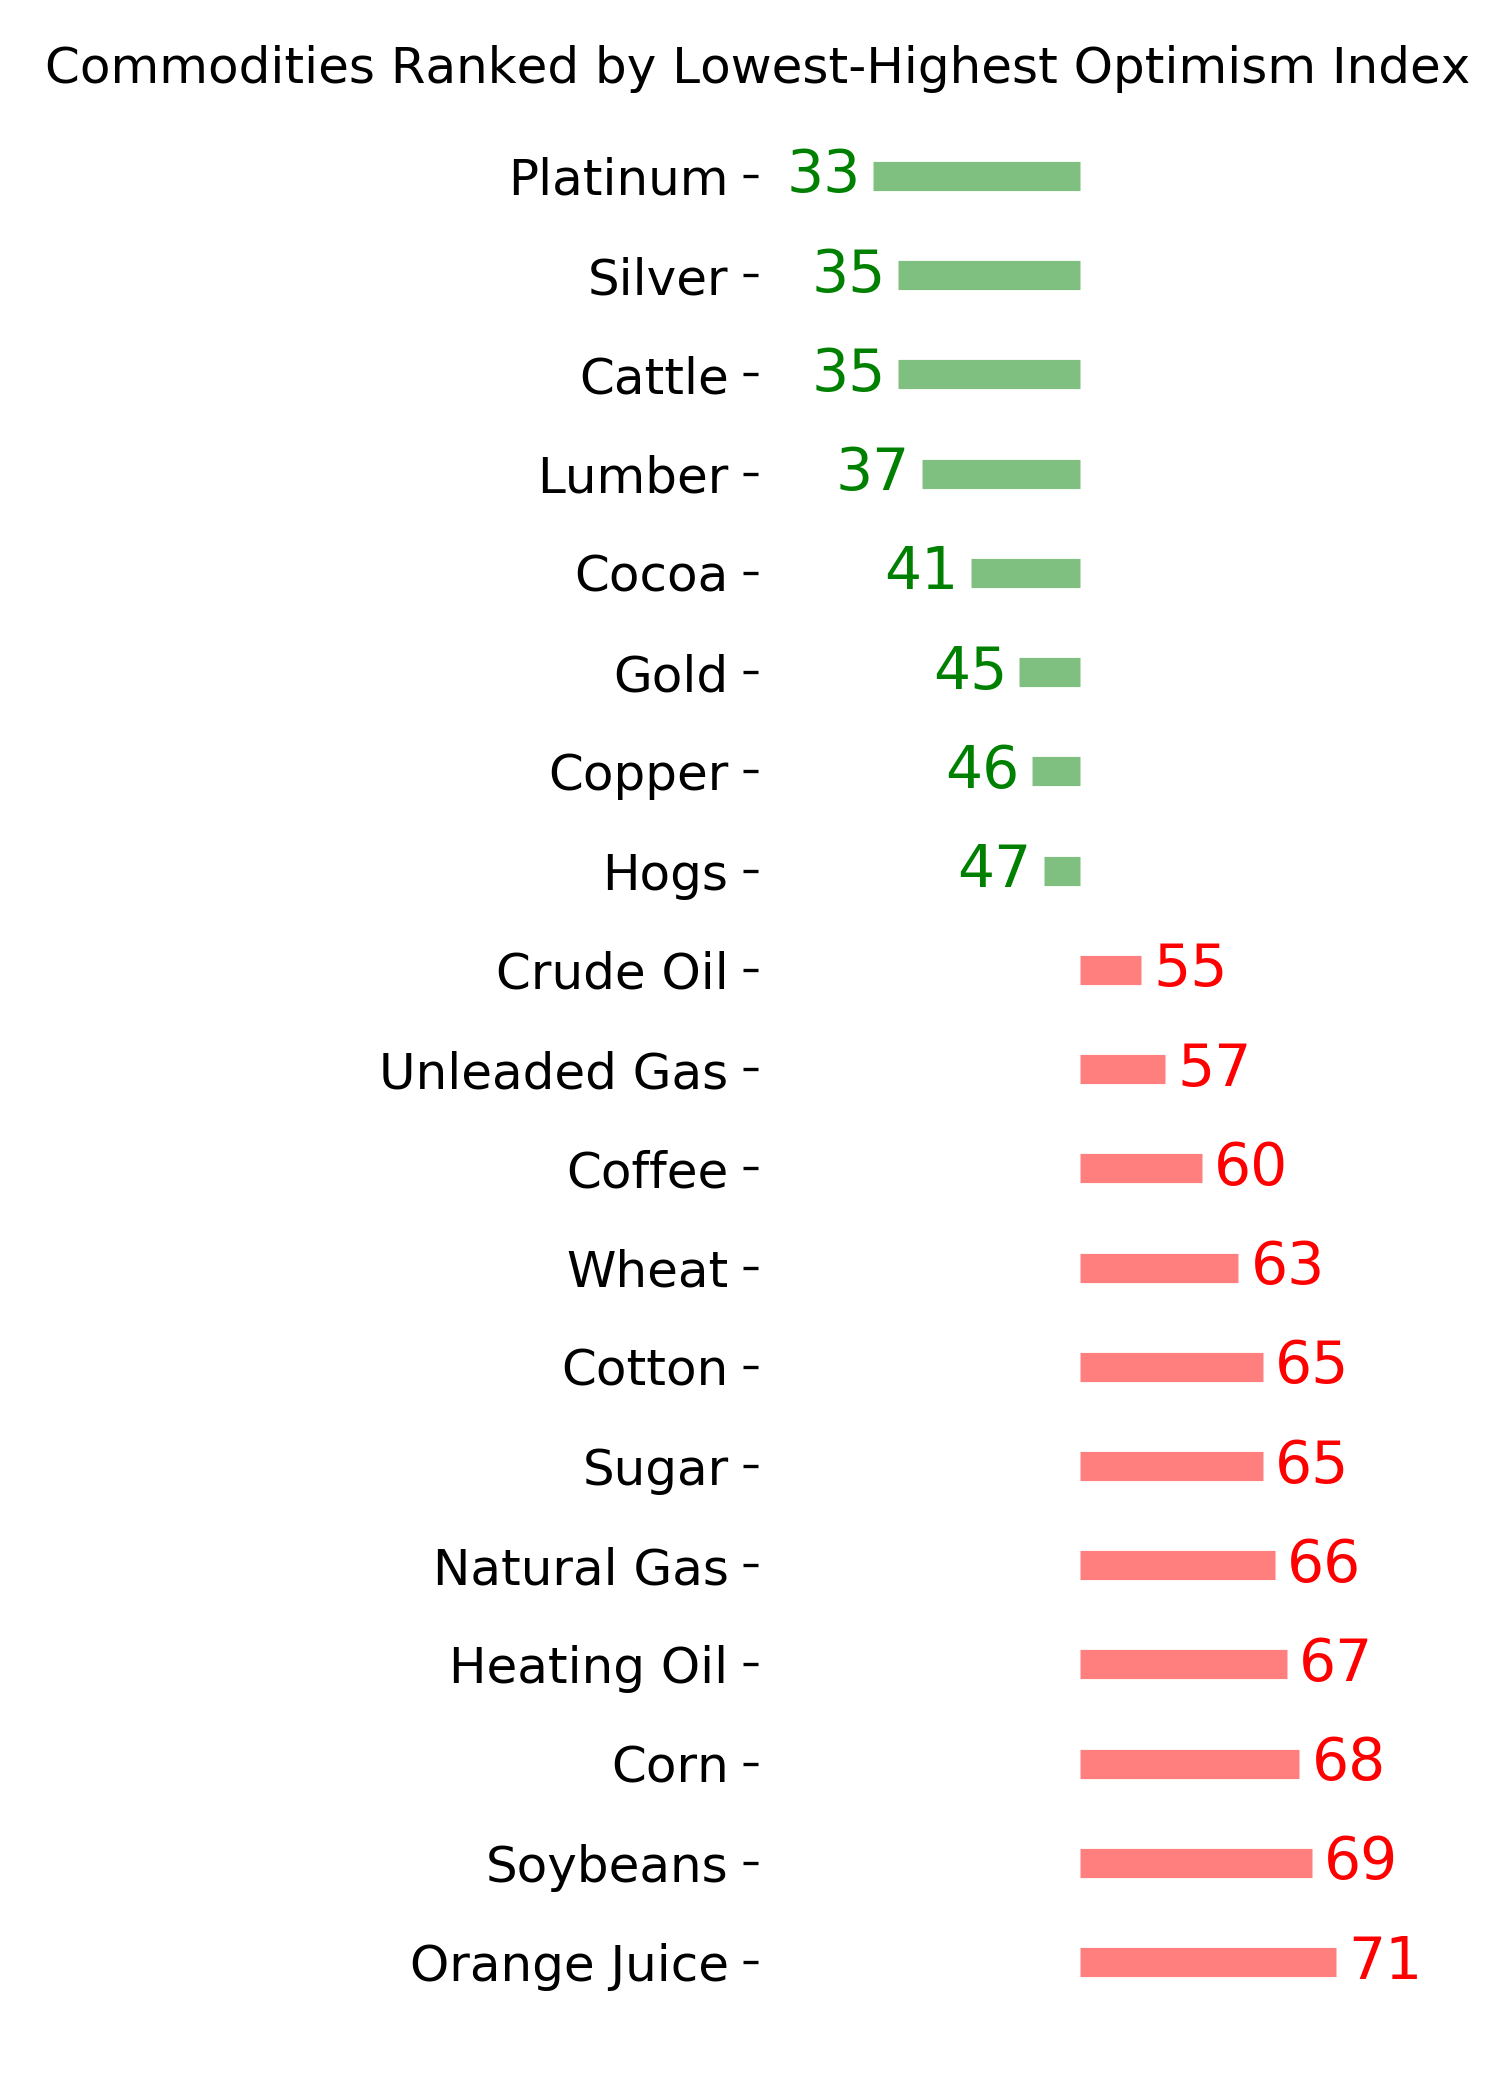
That would help gold and gold miners
Being a gold bug is a trying endeavor, especially lately.
At the worst point during the latest round of selling pressure, more than a quarter of gold mining stocks fell to a 52-week low at the same time. Over the past five years, that has meant a bottom.
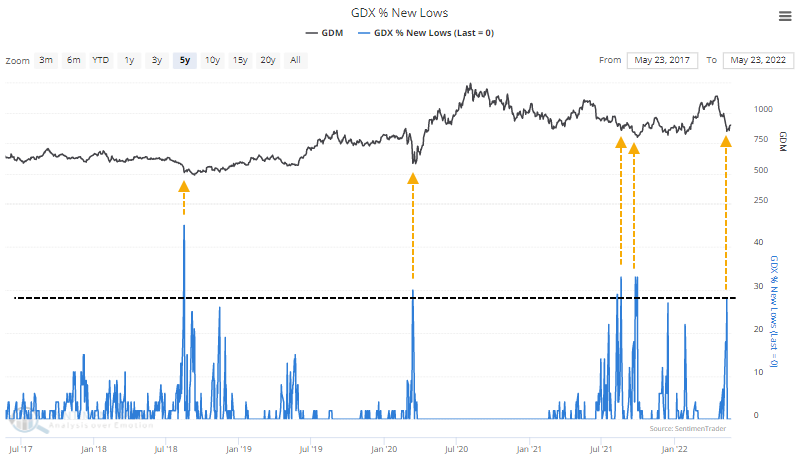
Remarkably, almost every gold miner has been trading below its 50-day average for most of the past two weeks. The only comparable bout of depressing trends over the past five years was triggered during the pandemic crash in March 2020.
As we've done with other sectors or indexes like the Shanghai Composite in April, we can calculate a Panic Breadth Composite that considers a half-dozen different breadth metrics. The 5-day average of this Composite just climbed above 75%, in the top 5% of all days since 1983.
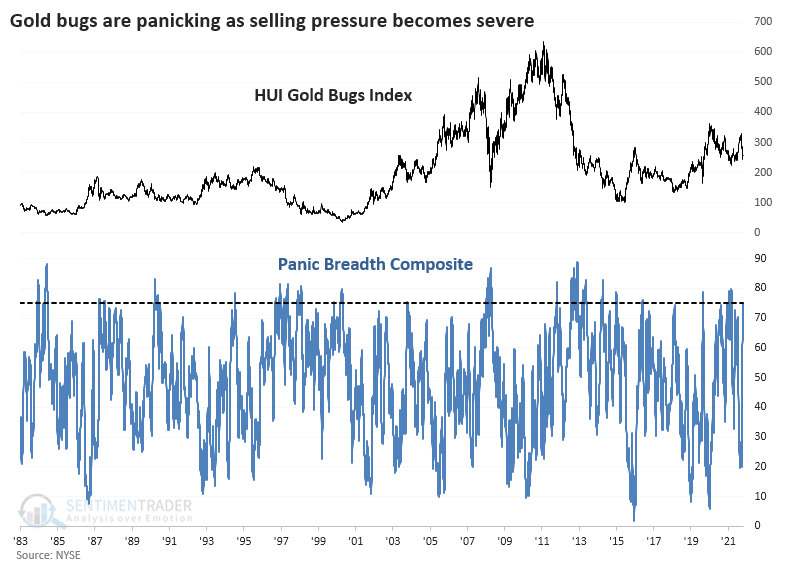
This was not a clear buy signal. Returns in the Gold Bugs index showed some fantastic gains and some terrible losses.
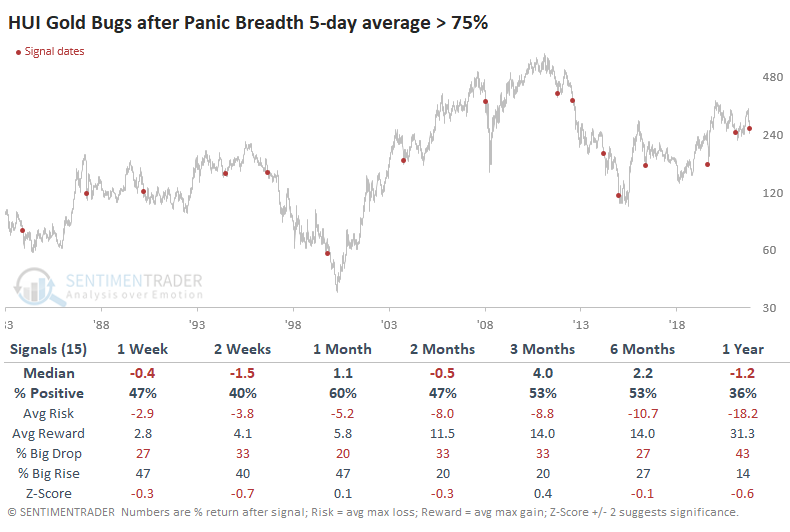
Looking at the Risk/Reward Table shows that there isn't a single rule that dictates whether the signal would lead to sustained gains. But when investors stepped in right away and the HUI Gold Bugs Index enjoyed larger gains than losses over the next 1-2 weeks, those tended to lead to successful and persistent longer-term rallies.
Contrast that to the unsuccessful signals, with the worst risk/reward skews. After most of these, sellers dominated in the short (and long) term.
About TradingEdge Weekly...
The goal of TradingEdge Weekly is to summarize the research published to SentimenTrader over the past week. Sometimes there is a lot to digest and this summary is meant to highlight the highest conviction or most compelling ideas we discussed. This is NOT the full research that's published, rather it pulls out some of the most relevant parts. It includes links to the published research for convenience; if you don't subscribe to those products it will present the options for access.
Indicators at Extremes
|
|
|
Phase Table
|
|
|
Ranks
|
|
|
|
|
|
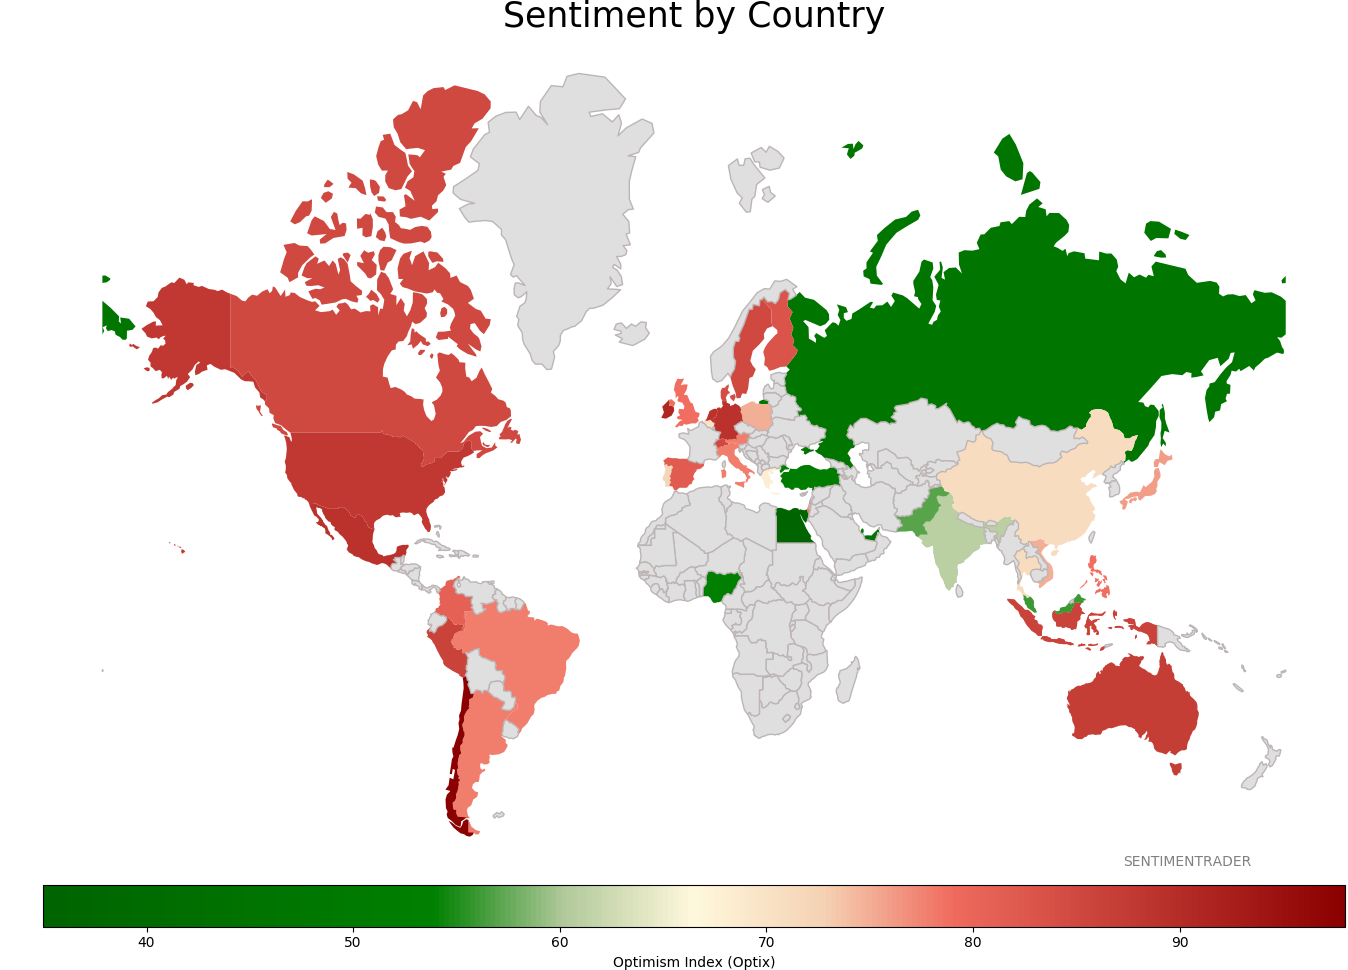
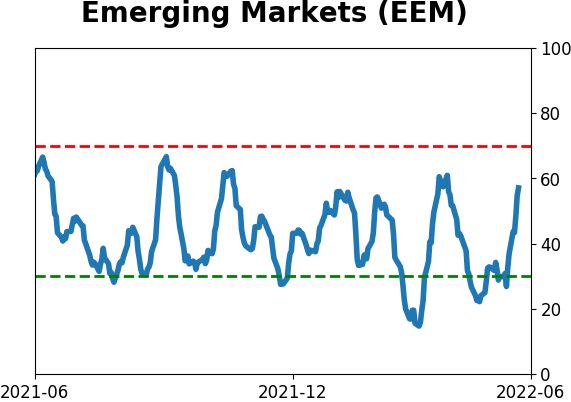
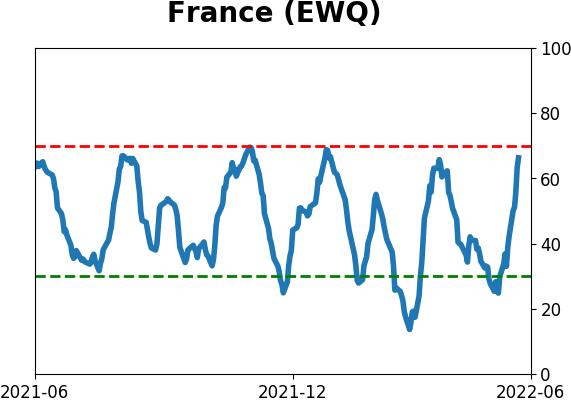
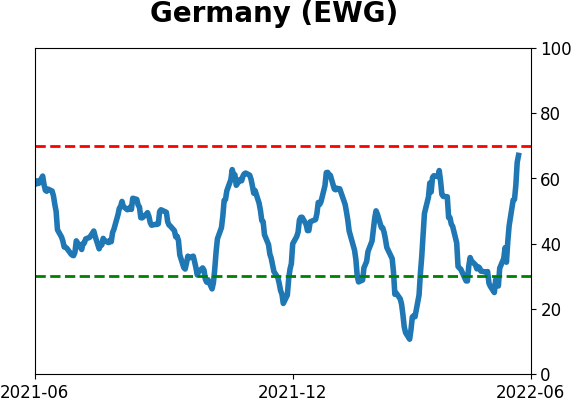
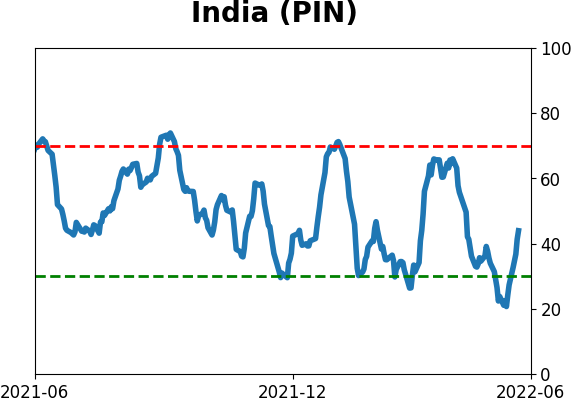
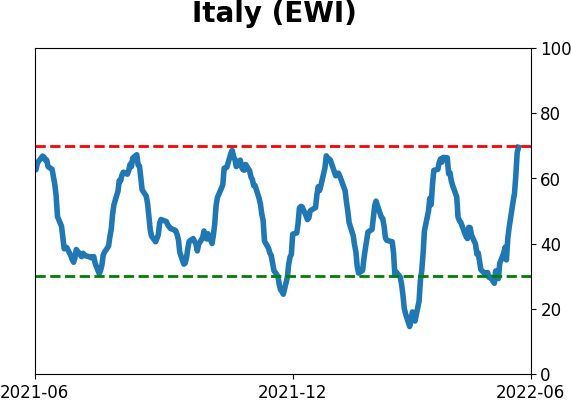
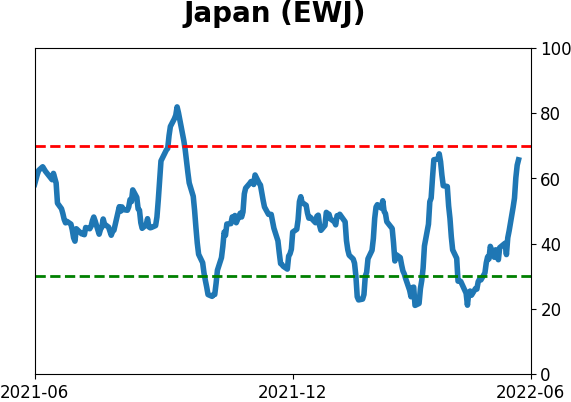
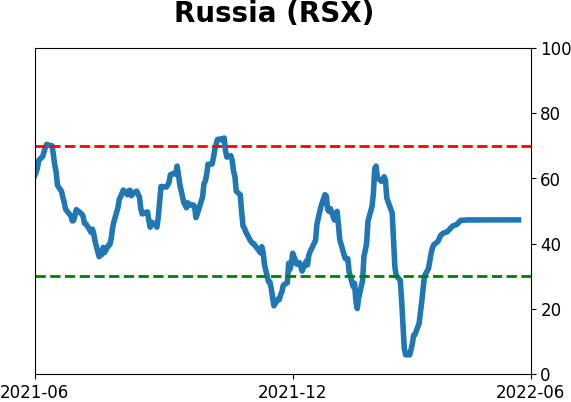
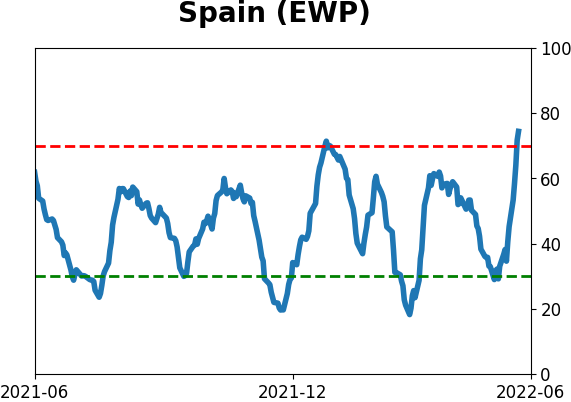
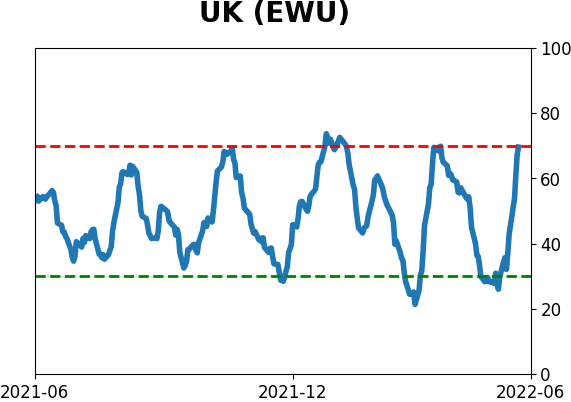
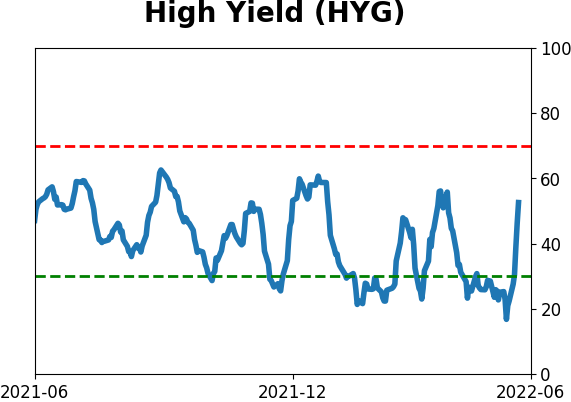
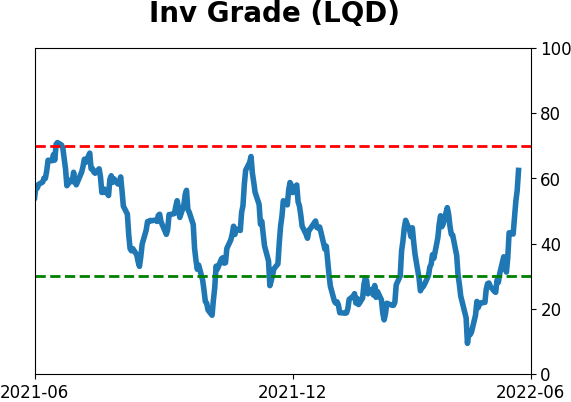
Sentiment Around The World
|
|
|
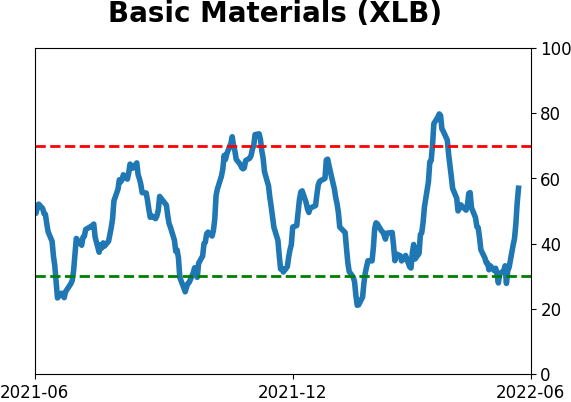
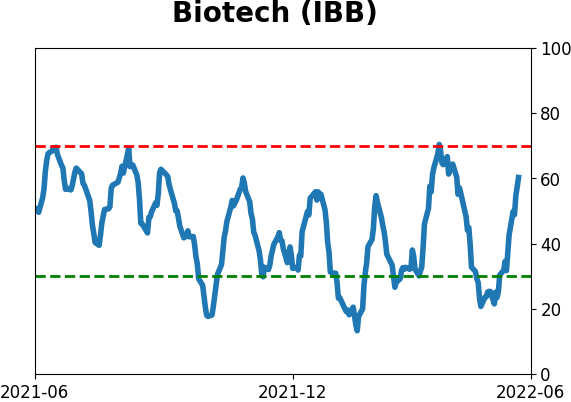
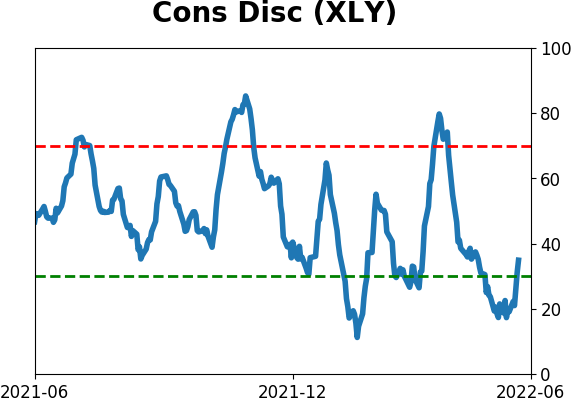
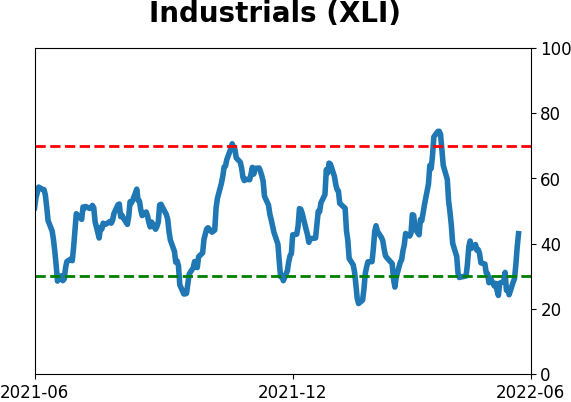
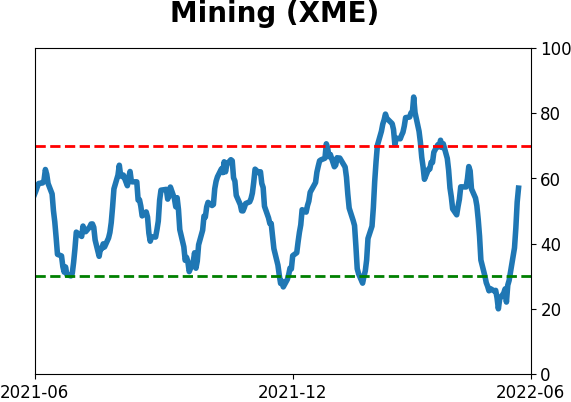
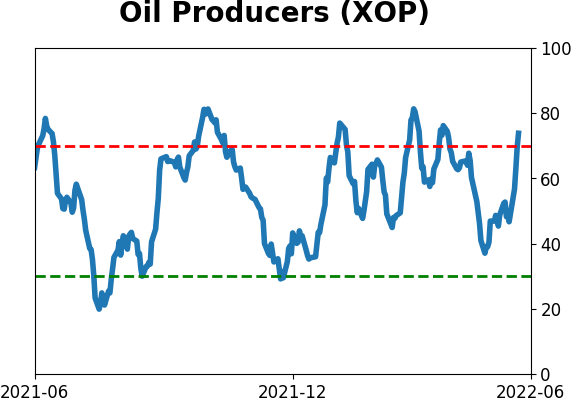
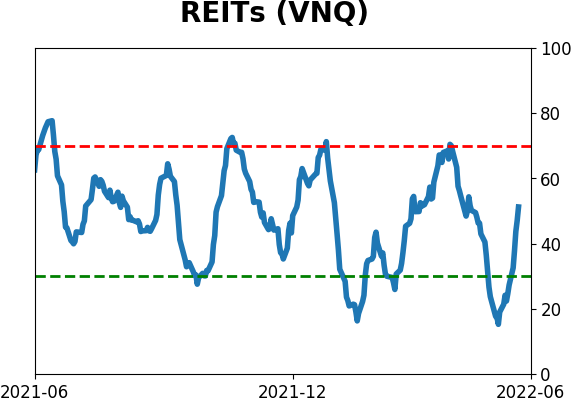
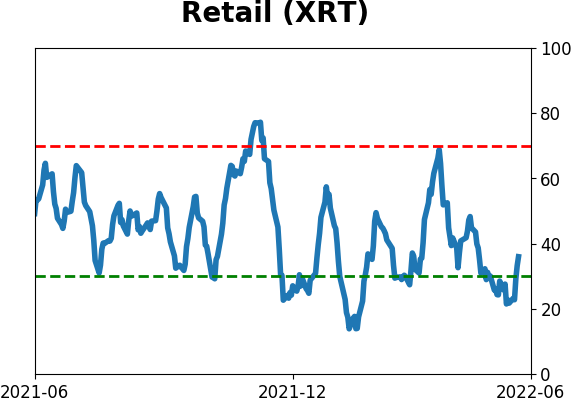
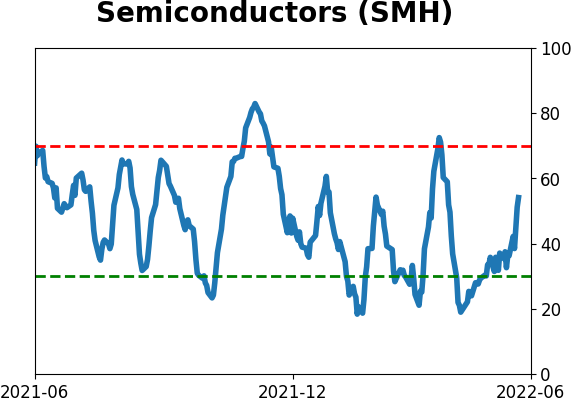
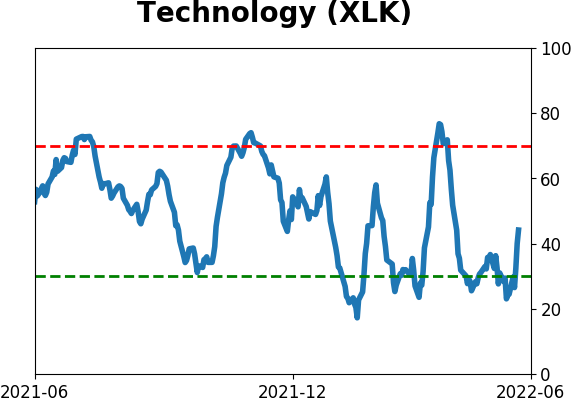
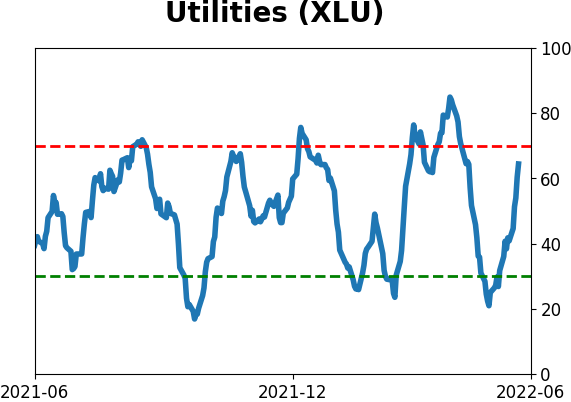
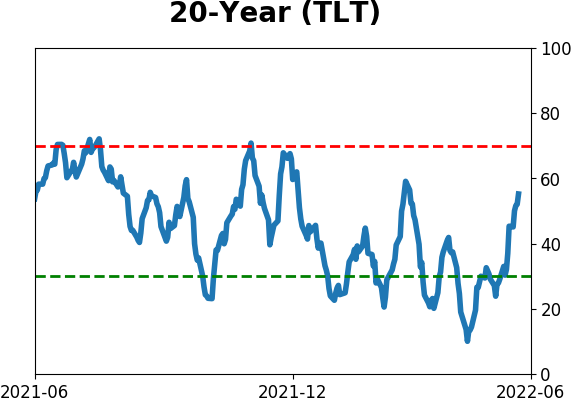
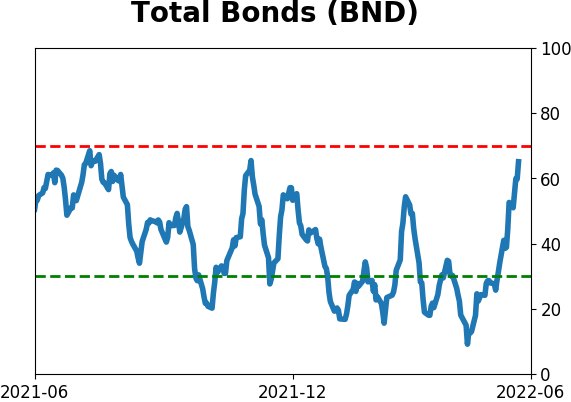
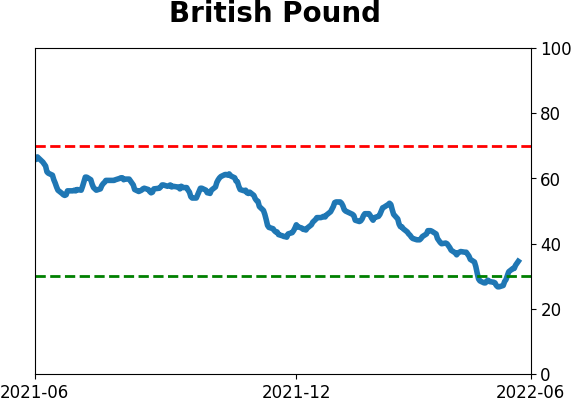
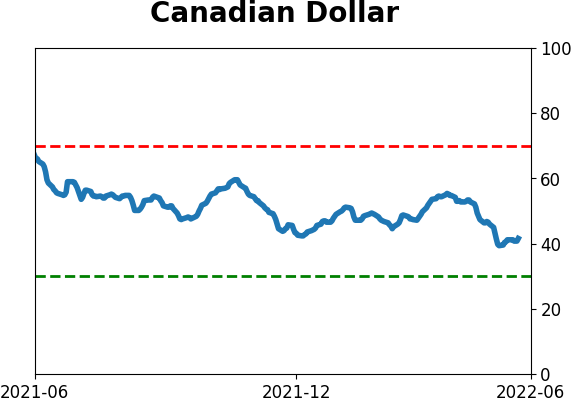
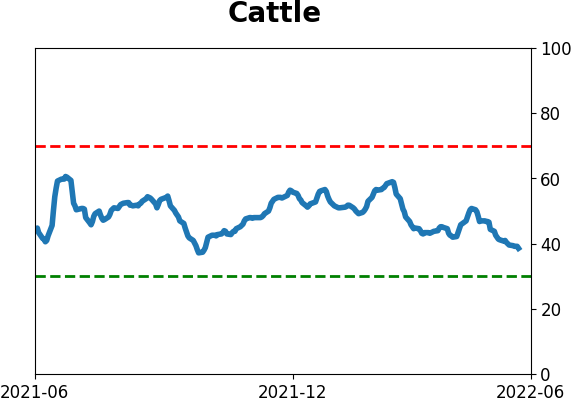
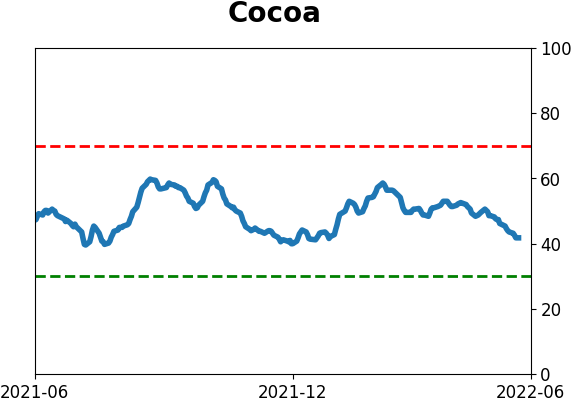
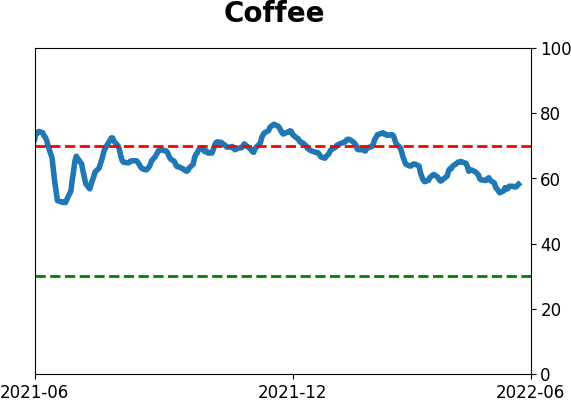
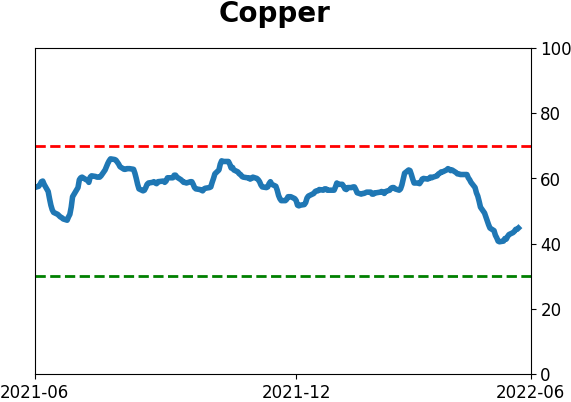
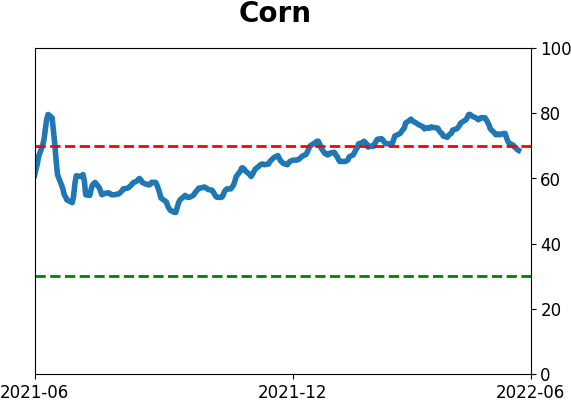
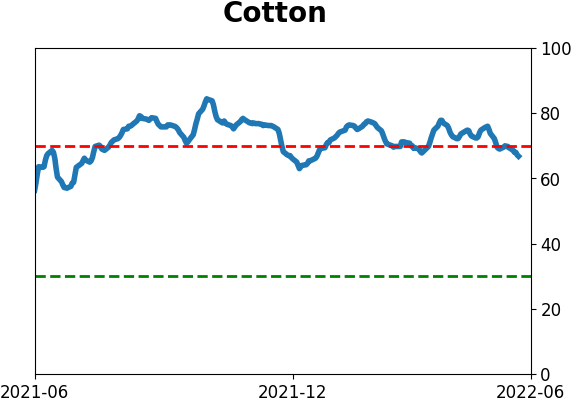
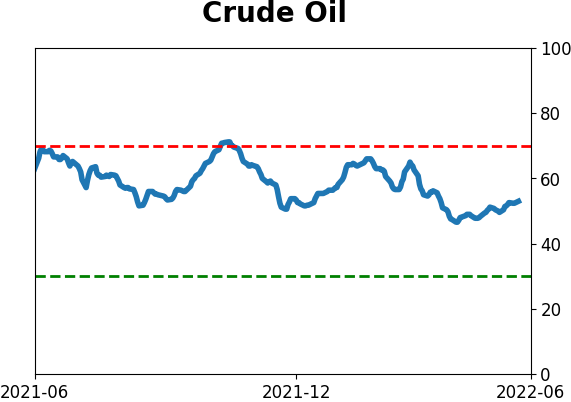
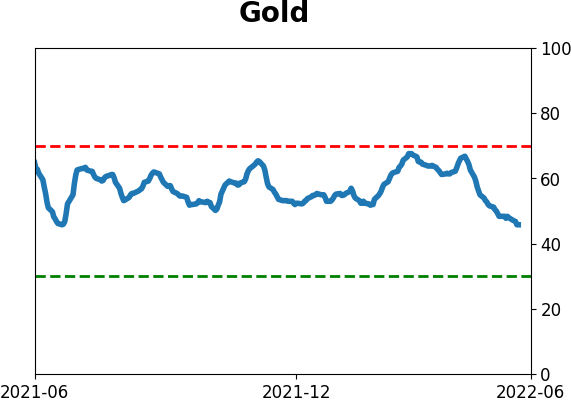
Optimism Index Thumbnails
|
|
|
|
|
|
|
|
|
|
|
|
|
|
|
|
|
|
|

|
|